
Photofragment translation spectroscopy of ClN3 at 248 nm
11
Photofragment translation spectroscopy of ClN 3 at 248 nm: Determination of the primary and secondary dissociation pathways N. Hansen a,b Department of Chemistry and Biochemistry, University of California, Santa Barbara, California 93106 and Combustion Research Facility, Sandia National Laboratories, Livermore, California 94551 A. M. Wodtke a,c Department of Chemistry and Biochemistry, University of California, Santa Barbara, California 93106 S. J. Goncher, J. C. Robinson, d N. E. Sveum, and D. M. Neumark Department of Chemistry, University of California, Berkeley, California 94720 and Chemical Sciences Division, Lawrence Berkeley National Laboratory, Berkeley, California 94720 Received 20 April 2005; accepted 17 May 2005; published online 12 September 2005 Photofragmentation translational spectroscopy was used to identify the primary and secondary reaction pathways in the KrF laser 248 nm photodissociation of chlorine azide ClN 3 under collision-free conditions. Both the molecular channel producing NCl X 3 , a 1 +N 2 and the radical channel producing Cl 2 P J +N 3 were analyzed in detail. Consistent with previously reported velocity map ion imaging experiments N. Hansen and A. M. Wodtke, J. Phys. Chem. A 107, 10608 2003 a bimodal translational energy distribution is seen when Cl atoms are monitored at m / z =35Cl + . Momentum-matched N 3 counterfragments can be seen at m / z =42N 3 + . The characteristics of the observed radical-channel data reflect the formation of linear azide radical and another high-energy form of N 3 HEF-N 3 that exhibits many of the characteristics one would expect from cyclic N 3 . HEF-N 3 can be directly detected by electron-impact ionization more than 100 s after its formation. Products of the unimolecular dissociation of HEF-N 3 are observed in the m / z =14N + and m / z =28N 2 + data. Anisotropy parameters were determined for the primary channels to be = -0.3 for the NCl forming channel and =1.7 and =0.4 for the linear N 3 and HEF-N 3 forming channels, respectively. There is additional evidence for secondary photodissociation of N 3 and of NCl. © 2005 American Institute of Physics. DOI: 10.1063/1.1948381 INTRODUCTION This paper springs from our continuing interest in the rich UV photodissociation dynamics of chlorine azide ClN 3 . 1–5 Primary photoproducts are formed in a molecular elimination channel, ClN 3 + h → NCla 1 +N 2 X 1 g + , 1a ClN 3 + h → NClX 3 +N 2 X 1 g + , 1b or in a radical-forming bond-rupture channel ClN 3 + h → Cl 2 P J +N 3 X 2 . 2a Historically, interest in the photochemistry of ClN 3 Refs. 6–13 derived from the utility of one of its photoproducts, NCla 1 , as an effective energy carrier in an all gas-phase chemical iodine laser AGIL. 14–18 More recently, the ClN 3 photochemistry has received considerable attention due to its potential use as a possible photolytic precursor of cyclic N 3 . Hansen and Wodtke re- ported velocity map ion imaging experiments of ClN 3 pho- todissociation at 235 nm under collision-free conditions and showed that the translational energy distribution of the Cl fragment is bimodal. 1 This observation indicates that, in ad- dition to the formation of the well-known linear N 3 azide radical, the radical channel also leads to the formation of a high-energy form of the N 3 molecule hereafter referred to as HEF-N 3 . It was pointed out that the maximum translational energy release of reaction, ClN 3 + h → Cl 2 P J + HEF-N 3 , 2b could be used to extract a heat of formation that was in excellent agreement with theoretical predictions of the heat of formation of the cyclic-N 3 isomer. Although it is yet to be definitively proven that cyclic N 3 is a primary product of ClN 3 photochemistry, its predicted properties are quite interesting and represent a significant motivation for the present study. Briefly, cyclic N 3 is a Jahn- Teller molecule that exhibits a conical intersection at the D 3h equilateral triangle configuration. This conical intersection must distort to form one of the three equivalent C 2v minima. The barrier to interconversion between equivalent C 2v minima pseudorotation is comparable to the zero-point vi- brational energy. The vibrationless state of N 3 is doubly de- generate, delocalized between minima, and lies 9 kcal/mol below the conical intersection. 19 A recent paper 20 has shown that cyclic N 3 is ideal for the study of the geometric phase effect 21,22 Berry’s phase in molecules. The geometric phase a Authors to whom correspondence should be addressed. b Electronic mail: [email protected] c Electronic mail: [email protected] d Present address: Intel Corporation, Hillsboro, OR 97124. THE JOURNAL OF CHEMICAL PHYSICS 123, 104305 2005 0021-9606/2005/12310/104305/11/$22.50 © 2005 American Institute of Physics 123, 104305-1 Downloaded 07 Oct 2005 to 128.32.144.113. Redistribution subject to AIP license or copyright, see http://jcp.aip.org/jcp/copyright.jsp
Transcript of Photofragment translation spectroscopy of ClN3 at 248 nm

THE JOURNAL OF CHEMICAL PHYSICS 123, 104305 �2005�
Photofragment translation spectroscopy of ClN3 at 248 nm: Determinationof the primary and secondary dissociation pathways
N. Hansena�,b�
Department of Chemistry and Biochemistry, University of California, Santa Barbara, California 93106and Combustion Research Facility, Sandia National Laboratories, Livermore, California 94551
A. M. Wodtkea�,c�
Department of Chemistry and Biochemistry, University of California, Santa Barbara, California 93106
S. J. Goncher, J. C. Robinson,d� N. E. Sveum, and D. M. NeumarkDepartment of Chemistry, University of California, Berkeley, California 94720 and Chemical SciencesDivision, Lawrence Berkeley National Laboratory, Berkeley, California 94720
�Received 20 April 2005; accepted 17 May 2005; published online 12 September 2005�
Photofragmentation translational spectroscopy was used to identify the primary and secondaryreaction pathways in the KrF laser �248 nm� photodissociation of chlorine azide �ClN3� undercollision-free conditions. Both the molecular channel producing NCl �X 3� ,a 1��+N2 and theradical channel producing Cl �2PJ�+N3 were analyzed in detail. Consistent with previously reportedvelocity map ion imaging experiments �N. Hansen and A. M. Wodtke, J. Phys. Chem. A 107, 10608�2003�� a bimodal translational energy distribution is seen when Cl atoms are monitored at m /z=35�Cl+�. Momentum-matched N3 counterfragments can be seen at m /z=42�N3
+�. Thecharacteristics of the observed radical-channel data reflect the formation of linear azide radical andanother high-energy form of N3 �HEF-N3� that exhibits many of the characteristics one would expectfrom cyclic N3. HEF-N3 can be directly detected by electron-impact ionization more than 100 �safter its formation. Products of the unimolecular dissociation of HEF-N3 are observed in the m /z=14�N+� and m /z=28�N2
+� data. Anisotropy parameters were determined for the primary channelsto be �=−0.3 for the NCl forming channel and �=1.7 and �=0.4 for the linear N3 and HEF-N3
forming channels, respectively. There is additional evidence for secondary photodissociation of N3
and of NCl. © 2005 American Institute of Physics. �DOI: 10.1063/1.1948381�
INTRODUCTION
This paper springs from our continuing interest in therich UV photodissociation dynamics of chlorine azide�ClN3�.1–5 Primary photoproducts are formed in a molecularelimination channel,
ClN3 + h� → NCl�a 1�� + N2�X 1�g+� , �1a�
ClN3 + h� → NCl�X 3�� + N2�X 1�g+� , �1b�
or in a radical-forming bond-rupture channel
ClN3 + h� → Cl�2PJ� + N3�X 2�� . �2a�
Historically, interest in the photochemistry of ClN3 �Refs.6–13� derived from the utility of one of its photoproducts,NCl�a 1��, as an effective energy carrier in an all gas-phasechemical iodine laser �AGIL�.14–18
More recently, the ClN3 photochemistry has receivedconsiderable attention due to its potential use as a possiblephotolytic precursor of cyclic N3. Hansen and Wodtke re-ported velocity map ion imaging experiments of ClN3 pho-todissociation at 235 nm under collision-free conditions and
a�Authors to whom correspondence should be addressed.b�Electronic mail: [email protected]�Electronic mail: [email protected]�
Present address: Intel Corporation, Hillsboro, OR 97124.0021-9606/2005/123�10�/104305/11/$22.50 123, 1043
Downloaded 07 Oct 2005 to 128.32.144.113. Redistribution subject to
showed that the translational energy distribution of the Clfragment is bimodal.1 This observation indicates that, in ad-dition to the formation of the well-known linear N3 �azideradical�, the radical channel also leads to the formation of ahigh-energy form of the N3 molecule hereafter referred to asHEF-N3. It was pointed out that the maximum translationalenergy release of reaction,
ClN3 + h� → Cl�2PJ� + HEF-N3, �2b�
could be used to extract a heat of formation that was inexcellent agreement with theoretical predictions of the heatof formation of the cyclic-N3 isomer.
Although it is yet to be definitively proven that cyclic N3
is a primary product of ClN3 photochemistry, its predictedproperties are quite interesting and represent a significantmotivation for the present study. Briefly, cyclic N3 is a Jahn-Teller molecule that exhibits a conical intersection at the D3h
�equilateral triangle� configuration. This conical intersectionmust distort to form one of the three equivalent C2v minima.The barrier to interconversion between equivalent C2vminima �pseudorotation� is comparable to the zero-point vi-brational energy. The vibrationless state of N3 is doubly de-generate, delocalized between minima, and lies �9 kcal/molbelow the conical intersection.19 A recent paper20 has shownthat cyclic N3 is ideal for the study of the geometric phase
21,22
effect �Berry’s phase� in molecules. The geometric phase© 2005 American Institute of Physics05-1
AIP license or copyright, see http://jcp.aip.org/jcp/copyright.jsp

104305-2 Hansen et al. J. Chem. Phys. 123, 104305 �2005�
effect introduces “correction” factors in determining the en-ergies of the vibrational states in this molecule, which arepredicted to be on the order of 102 cm−1. Furthermore, with-out correct consideration of the geometric phase effect, onecannot obtain accurate vibrational wave functions. Even thecorrect symmetry of the ground vibrational state �E� is incor-rectly predicted to be A1 if Berry’s phase is neglected.20 Ex-perimental studies on the spectroscopy of cyclic N3 would bevery useful in extending our understanding of these phenom-ena in molecular systems.
What we know about HEF-N3 has been learned from afew experiments and comparisons to theoretical work on cy-clic N3.1,4,5,19,20,23–25 The experimentally observed excitationenergy �E=31±2 kcal/mol is in very good agreement withrecent ab initio calculations, which predicted the existence ofa stable cyclic-N3 isomer at an energy of 30.0 kcal/molabove the energy of the linear-N3 isomer.1,23 Recently, Sa-martzis et al. observed distinct ionization thresholds for thetwo forms of N3.5 Their experimental value IP �HEF-N3�=10.7±0.2 eV agrees well with the theoretically predictedvalue for cyclic N3 of 10.58 eV.24
Babikov et al. presented a sophisticated adiabatic groundelectronic state potential-energy surface which is constructedbased on extensive high-level ab initio calculations.19 Theoryshows that cyclic N3 is metastable with respect to the spin-forbidden dissociation,19,25
cyclic N3�2B1� → N�4S� + N2�X 1�g+�
�E � − 32.3 kcal/mol. �3�
In addition, it is known that the doublet-quartet surfacecrossings that, when traversed, lead to dissociation lie about28 kcal/mol above the cyclic-N3 minimum.25 Thus, whilecyclic N3 is metastable, it is thought to be long lived and, asit carries a great deal of chemical energy, it is an excellentnew candidate for technological applications in energy stor-age, high nitrogen explosives, and clean propellants.
Other experiments have provided essential informationneeded to evaluate the photochemistry of ClN3. Velocity mapion imaging of ClN3 photoproducts was used to investigatethe dissociative photoionization of ClN3 under collision-freeconditions,
ClN3 + 2h� → ClN3+ + e− → NCl+ + N2�X 1�g
+� + e−,
�4�
which was observed by recording velocity map images ofNCl+ as well as state-selected N2.3 In another experiment,the molecular channel �1� was observed via velocity mapimages of state-selected N2.2 These two pieces of work pro-vided accurate thermochemistry for reaction �1�: �E=+4.8±1.8 and −21.4±2.1 kcal/mol for the decomposition ofClN3 into N2�X 1�g
+�+NCl�a 1�� and NCl�X 3��, respec-tively. A comprehensive reevaluation of the thermochemistryof all molecules containing a single Cl atom and three Natoms including all new data from velocity map imaging hasbeen reported.1 All of the above experiments agree well withliterature values for the 0 K heats of formation of N3�X 2��and ClN3.26–28 The known dissociation energies of Cl–N3
1 3
and of NCl �a � ,X �� are also in agreement with the newDownloaded 07 Oct 2005 to 128.32.144.113. Redistribution subject to
experiments.29,30 All derived thermodynamic results werepresented in Ref. 1 and will be helpful in the analysis of thiswork. Figure 1 summarizes the derived energy levels of theCl–N–N–N system and shows the calculated barriers for dis-sociation of linear and cyclic N3 into N2+N�4S , 2D�.
Recently, molecular-beam photofragment translationalspectroscopy �PTS� was applied to investigate the ClN3 pho-todissociation dynamics at 248 nm under collision-free con-ditions. Using electron-impact �EI� ionization with quadru-pole mass spectrometry enabled us to observe all channelssimultaneously. In a previous letter we reported that the mo-lecular dissociation channel, that is reaction �1�, convertsavailable energy predominantly into product internal excita-tion and that the branching ratio between the molecularelimination �1� and radical bond-rupture �2� channels wasfound to be NCl+N2/Cl+N3=0.05±0.03/0.95±0.03,4 con-trary to previous results that assumed NCl+N2 to be thedominant channel.11 As in the earlier imaging experiments,1
a bimodal translational energy distribution was reported forthe Cl atom in the PTS experiment.
In this paper, we describe a thorough analysis of the PTSexperiments. In addition to the Cl and NCl data which werepartially discussed in the previous letter, we now includedata from N3 photofragments as well as from N2 and N frag-ments formed in secondary dissociation reactions. We showthat HEF-N3 can be detected by EI more than 100 �s afterits formation. Specifically, we see that the N3 photofragmentsexhibit a bimodal translational energy distribution that isconsistent with momentum-matched Cl photofragments andthe results from velocity map imaging. In addition, the an-gular distribution of the fast N3 �linear azide� matches that ofthe fast Cl. Likewise, the angular distribution of the HEF-N3
FIG. 1. Energy-level diagram for the Cl–N–N–N system relative to ClN3.The energies of the N3+Cl, the N2+NCl, and the N2+N+Cl levels are takenfrom Ref. 1. Also shown are the calculated lowest-energy barriers for dis-sociation of linear and cyclic N3 into N2+N�2D , 4S�—for details see Ref. 25.The observed threshold for unimolecular dissociation of HEF-N3 is shownas a gray bar.
matches that of the slow Cl. A complete analysis of second-
AIP license or copyright, see http://jcp.aip.org/jcp/copyright.jsp

104305-3 Spectroscopy of ClN3 J. Chem. Phys. 123, 104305 �2005�
ary dissociation pathways was carried out. This analysisshows that HEF-N3 undergoes unimolecular dissociationforming both N�2D�+N2 and N�4S�+N2. In addition, second-ary photodissociation of N3 is seen, as is secondary photo-dissociation of NCl. We also conclude that unimolecular de-composition of energized NCl can be ruled out as a source ofthe slow Cl fragments.
Overall, these experiments now reveal the full set ofmicroscopic collision-free decomposition pathways of ClN3
resulting from photodissociation at 248 nm. The results pro-vide a much firmer footing for the analysis of ClN3 photoly-sis and add weight to previous conclusions concerning thepossible photolytic production of cyclic N3.
EXPERIMENT
The molecular-beam photodissociation instrument onwhich these experiments were performed has been describedin detail previously.31,32 A mixture of ClN3 seeded in Hecarrier gas was prepared by passing a mixture of 10% Cl2 inHe over moist sodium azide �NaN3�. The NaN3 was sus-pended in cotton wool and excess water was removed bypassing the mixture through a drying agent �Drierite�. Undernormal operating conditions, mass spectral analysis of thebeam showed NCl+, an ionizer-induced fragment of ClN3
+,and little or no Cl2
+. When Cl2+ signal could be detected, the
NaN3 sample was replaced.Using a backing pressure of �0.5 bar, a pulsed molecu-
lar beam was formed by expanding the ClN3/He mixtureinto vacuum through a piezoelectrically actuated pulsedvalve.33 After passing through two collimating skimmers, themolecular beam intersected a 28 ns pulsed beam of unpolar-ized 248 nm laser light produced by a Lambda Physik KrFexcimer laser. Both the valve and the laser were operating at100 Hz. The laser output ��72 mJ energy/pulse� was fo-cused to a �10 mm2 spot at the region of intersection.
Photofragments scattered in the plane of the molecularlaser beam were detected as a function of laboratory scatter-ing angle, � with a rotatable, triply differentially pumpedmass spectrometer. After passing through three collimatingapertures, the photofragments were ionized by electron im-pact, mass selected with a quadrupole mass filter, and de-tected with a Daly-style detector. At various scatteringangles, �=10°–60° in 10° steps, photofragment time-of-flight �TOF� distributions were taken for ions at selectedmass-to-charge ratios, m /z=35�Cl+� ,49�NCl+� ,42�N3
+�,28�N2
+�, and 14�N+�, using a multichannel scaler interfacedto a personal computer. The velocity distribution of the par-ent ClN3 molecular beam was characterized by TOF at �=0° using a retractable slotted chopper wheel to modulatethe molecular beam.
TOF spectra obtained in this fashion were fitted by eitherthe PHOTRAN �Ref. 34� or ANALMAX �Ref. 35� forward-convolution program. Both programs simulate the TOF spec-trum based on “guessed” center-of-mass translational energy�P�ET�� distributions that are iteratively improved until a sat-isfactory fit to the data is obtained. Beam velocity, laboratoryangle, dissociation and ionization volumes, finite angular ac-
ceptance angle of the detector, laser power, and polarizationDownloaded 07 Oct 2005 to 128.32.144.113. Redistribution subject to
are additional program parameters used in the forwardconvolution.
RESULTS AND ANALYSIS
This section of the paper is organized as follows. First,the results from primary photodissociation processes are dis-cussed. In particular, the analysis of the m /z=49�NCl+� TOFspectra is presented first, showing the energy release of re-action �1�. Because the energy distribution of the N2 coun-terfragments is complicated by secondary unimolecular dis-sociation and photodissociation processes of N3, its analysisis presented later. In the second stage of presentation, weanalyze the radical channel—in particular, the observedtranslational energy distribution of the Cl fragments. We thenmove on to an analysis of the m /z=42�N3
+� TOF, whichexhibits the N3 counterfragments to Cl in the radical channel.Finally the secondary processes are presented. Analysis ofm /z=28�N2
+� and m /z=14�N+� leads to information on theunimolecular decomposition of N3 and to evidence that theHEF-N3 can be photodissociated at 248 nm. As part of them /z=35�Cl+� TOF analysis, secondary NCl photodissocia-tion is seen.
Molecular channel NCl+N2
Observed TOF spectra of the NCl fragments �m /z=49�originating from reaction �1� are shown in Fig. 2 at severalscattering angles, �. The data are represented by the opencircles, while the solid lines are the results of forward-convolution simulations of the experiment using an opti-mized center-of-mass translational energy distribution shownin Fig. 3.
The best fit to the experimental data shown in Fig. 2 wasobtained using the translational energy distribution shown inFig. 3 and an anisotropy parameters of �=−0.3. The derivedtranslational energy distribution shown in Fig. 3 is in goodagreement with the previously reported distribution.4 Owingto the non-state-selective detection scheme used in this ex-periment, identification of the electronic state of the NClproduct, i.e., evaluating the relative importance of reactions�1a� and �1b�, is not possible, although previous studies pro-vided evidence that the spin-allowed reaction �1a� is moreprobable than reaction �1b�.11
Besides reaction �1�, other pathways, including the pro-duction of NCl �X 3�� via a spin-allowed channel,
ClN3 + h� → NCl�X 3�� + N2�A 3�g+� �5�
come into consideration. While this channel is not energeti-cally accessible for 248-nm photolysis, when the photolysiswavelength is 193 nm, N2�A 3�g
+�, presumably from channel5, has been detected,6,12 along with NCl �b 1�+� which canbe produced by a second spin-allowed channel,6,36
ClN3 + h� → NCl�b 1�+� + N2�X 1�g+� . �6�
Coombe et al. reported that channels �5� and �6� amount toonly �1% of the 193 nm photolysis products.12 Komissarovet al. estimated that �1% of NCl is formed in the b 1�+ stateafter ClN3 photolysis at �=248 nm.11 N2�A 3�g
+� lies1 +
�6.2 eV above the ground-state N2�X �g � and therefore isAIP license or copyright, see http://jcp.aip.org/jcp/copyright.jsp

104305-4 Hansen et al. J. Chem. Phys. 123, 104305 �2005�
not accessible by photolysis at �=248 nm. Consequently, re-actions �5� and �6� are not considered likely candidates toexplain the data of Fig. 2.
According to recent experimental and theoretical work,the maximum available translational energy release isEmax,NCl�a�=108 kcal/mol and Emax,NCl�X�=135 kcal/mol forchannels �1a� and �1b�, respectively.1,4 These values are sub-stantially larger than the observed maximum translational en-ergy release of �48 kcal/mol �see Fig. 3�. This means thatthe primary products, N2 and NCl, are formed with a consid-erable amount of internal energy. This strong tendency tochannel available energy into internal energy of the frag-ments has been postulated before on the basis of indirectkinetic evidence4,8 and it is the most important feature ofreaction �1�. Indeed more than 70 kcal/mol goes to excitethe internal degrees of freedom of the two diatomic products.
Radical-channel Cl+N3
Cl photofragments
The observed TOF spectra of the Cl fragments at m /z=35 are shown at several scattering angles, �, in Figs.4�a�–4�c�. The data are represented by the open circles, while
FIG. 2. Time-of-flight �TOF� spectra of m /z=49�NCl+� at detection angles�=10°, 30°, and 60°. For all spectra the open circles represent the data. Thesolid line represents the forward-convolution fit to the data using the P�ET�distribution shown in Fig. 3.
the solid and dashed lines are the results of forward-
Downloaded 07 Oct 2005 to 128.32.144.113. Redistribution subject to
convolution simulations of the experiment using optimizedcenter-of-mass translational energy distributions shown inFig. 5.
As has been briefly discussed in the previous letter,4 wenote that a bimodal P�ET� distribution for the Cl+N3 channelis needed to fit the two dominant peaks in the TOF spectra ofFigs. 4�a�–4�c�. The individual contributions are shown asdashed �fast channel� and solid lines �slow channel�, respec-tively. The P�ET� distribution for the Cl data in Fig. 5 isexperimentally indistinguishable from that obtained byHansen and Wodtke in a recent velocity map imaging experi-ment, in which the faster feature was assigned to the forma-tion of linear N3 and the slower feature was interpreted aspossible evidence for the photolytic production of cyclic N3.1
Thus, the photofragment translational spectroscopy experi-ment confirms the existence of a bimodal Cl-atom transla-tional energy distribution in the radical channel. The aniso-tropy parameters are determined to be �=1.75�10� and �=0.35�5� for the fast and slow channels, respectively. Thosevalues compare well with those determined by velocity mapimaging ��=1.70�5� and �=0.39�1��.1 The branching ratiobetween the two channels is fast Cl/ slow Cl �0.75/0.25.Using the velocity map imaging technique a similar branch-ing ratio of 0.8/0.2 was found.1 The P�ET� distributionshown in Ref. 4 exhibiting more of the slow channel is in-correct.
A closer look at the TOF spectra of the Cl product in Fig.4 indicates a small contribution from very fast photofrag-ments. This feature is most obvious at larger scatteringangles and it is shown as dotted curve enlarged in the inset ofFig. 4�c� for the �=50° data. This feature results from sec-ondary photodissociation of NCl at 248 nm:
NCl�X 3�,a 1�� + h� → N�4S, 2D� + Cl�2P� . �7�
The derived P�ET� for the secondary photodissociation ofNCl peaks at 80 kcal/mol and exhibits a half-width of�10 kcal/mol. In principle, we can use this information toevaluate the internal energy content of the NCl photodisso-
FIG. 3. Center-of-mass translational energy distribution P�ET� for the mo-lecular channel forming NCl in the ClN3 photodissociation. This energy
distribution is used to reproduce the observed spectra in Fig. 2.AIP license or copyright, see http://jcp.aip.org/jcp/copyright.jsp

104305-5 Spectroscopy of ClN3 J. Chem. Phys. 123, 104305 �2005�
ciated in this work. In practice, this analysis is ambiguous, asthe identities of the reactant and product electronic states in�7� are not known.
N3 photofragments
The observed TOF spectra of the N3 counterfragment forradical channel �2� are shown in Figs. 4�d�–4�f�. Again, thedata are represented by the open circles, the simulations bythe dashed �fast channel� and solid �slow channel� lines. Aswill be discussed below, the strongest peak in the N3 TOFspectra corresponds to the formation of linear azide. How-ever, a second peak which is much more obvious in the Cl+
data is—in part—also present.The N3 TOF spectra shown in Figs. 4�d�–4�f� were used
to derive a center-of-mass translational energy distributionfor the radical channel, similar to what was done for the ClTOF data. The results of this analysis are shown in Fig. 5 andare compared to the P�ET� obtained from the analysis of theCl data. The derived translational energy distributions matchclosely above about 26±2 kcal/mol. This suggests thatwhile low-translational energy Cl atoms formed togetherwith HEF-N3 can easily be detected at the ionizer after about
100 �s, not all of the corresponding HEF-N3 can. Compar-Downloaded 07 Oct 2005 to 128.32.144.113. Redistribution subject to
ing the intensities of the slow channels in Fig. 5 we concludethat 10% of the HEF-N3 fragments are actually detected.This could be due to the preferential ion fragmentation pos-sible for highly energized neutrals or to the onset of unimo-lecular dissociation of the neutral N3 on a time scale fasterthan 100 �s. It could also be due to secondary photodisso-ciation of N3, if the internal energy of the N3 were to have astrong influence on the photodissociation cross section of themolecule at 248 nm.
In addition to yielding a P�ET� distribution, the m /z=42�N3
+� TOF data allowed us to determine the anisotropyparameters for the reactions �2a� and �2b� by way of an in-dependent set of data. The derived values of �=1.7�1� and�=0.39�5� for reactions �2a� and �2b�, respectively, agreewith results obtained by analyzing angular distribution of theCl fragments by both photofragment translational spectros-copy and velocity map imaging. The correspondence be-tween � parameters and translational energy distributions in-dicates that both the fast and the slow channel in the Cl dataare indeed correlated to the formation of momentum-matched N3 counterfragments. This shows clearly that be-sides the linear N3, HEF-N3 is formed and can be detected by
FIG. 4. �a�–�c� TOF spectra of m /z=35�Cl+� and �d�–�f� TOF spectra ofm /z=42�N3
+� at detection angles �=10°, 30°, and 50°. For all spectra theopen circles represent the data. Thedashed lines represent the forward-convolution fit to the data using theP�ET� distribution shown in Fig. 5 ofthe “fast” linear-N3�X 2�� formingchannel. The solid lines represent the“slow” N3 forming channel. In �a�–�c�an additional contribution from sec-ondary photodissociation of NCl pho-tofragments can be seen, especially inthe inlet in �c� as dotted line.
EI mass spectrometry.
AIP license or copyright, see http://jcp.aip.org/jcp/copyright.jsp

104305-6 Hansen et al. J. Chem. Phys. 123, 104305 �2005�
The observed translational energy distributions are quan-titatively consistent with the formation of linear N3. The dis-sociation energy of ClN3 to form Cl and linear N3 isD0�Cl–N3�=49.1 kcal/mol.1,29 If all the available energy ischanneled into translational energy, i.e., the products areformed in their ground states, the maximum translational en-ergy release would be 66.1 kcal/mol, using a photon energyof 115 kcal/mol ��=248 nm�. The observed maximumtranslational energy release �ET
max�linear N3+Cl�=66.9±1 kcal/mol� is marked in Fig. 5 and agrees well withthe predicted value. We therefore assign the fast Cl and N3
fragments to the formation of linear N3 in reaction �2a�. Thisassignment is supported by another experiment by Samartziset al. who determined the ionization potential of the fast N3
fragments to IP=11.1 eV which can be identified with thewell-known IP of linear N3.5,37
For the slow Cl+N3 channel, the maximum observedtranslational energy release is ET
max�HEF-N3+Cl�=36.8±2 kcal/mol �see Fig. 5�, a value which is derivedfrom the Cl as well as the N3 data. The difference betweenthe maximum translational energy release of the fast andslow channels represents the excitation energy of HEF-N3
with respect to ground-state linear N3. This value�30.1±3 kcal/mol� agrees well with a previous experimen-tally determined excitation energy �31±2 kcal/mol� ob-tained from velocity maps of the Cl fragments.1
Secondary dissociation processes: N2+ and N+ data
As mentioned above, comparison of the TOF spectra inFig. 4 and the translational energy distributions in Fig. 5leads to the conclusion that only 10% of the slow N3 photo-fragments are detected. Consequently we looked at the TOFspectra for m /z=14�N+� and m /z=28�N2
+� for evidence ofunimolecular and/or photoinduced dissociation of N3.
The data are shown in Figs. 6 and 7 for different scat-
FIG. 5. Center-of-mass translational energy distributions P�ET� for the radi-cal channel forming N3+Cl in the ClN3 photodissociation. One P�ET� isderived from the analysis of the Cl TOF spectra measured at six differentscattering angles �, partially shown in Figs. 4�a�–4�c�. A similar P�ET� isderived from the N3 TOF data set which are partially shown in Figs.4�d�–4�f�. The shown energy distributions are able to produce the fit to all ofthe TOF data shown in Fig. 4.
tering angles, �. The data are represented by the open circles
Downloaded 07 Oct 2005 to 128.32.144.113. Redistribution subject to
and the simulations which will be discussed in this sectionare represented by the colored lines. Because of the molecu-lar channel forming N2 being just a minor channel4 �5±3% �and because of the high background and low S/N experi-enced �due to background CO in the detector�, for m /z=28we were limited to obtaining data at �=10° and 30°.
Dissociative ionization of N3 photofragments
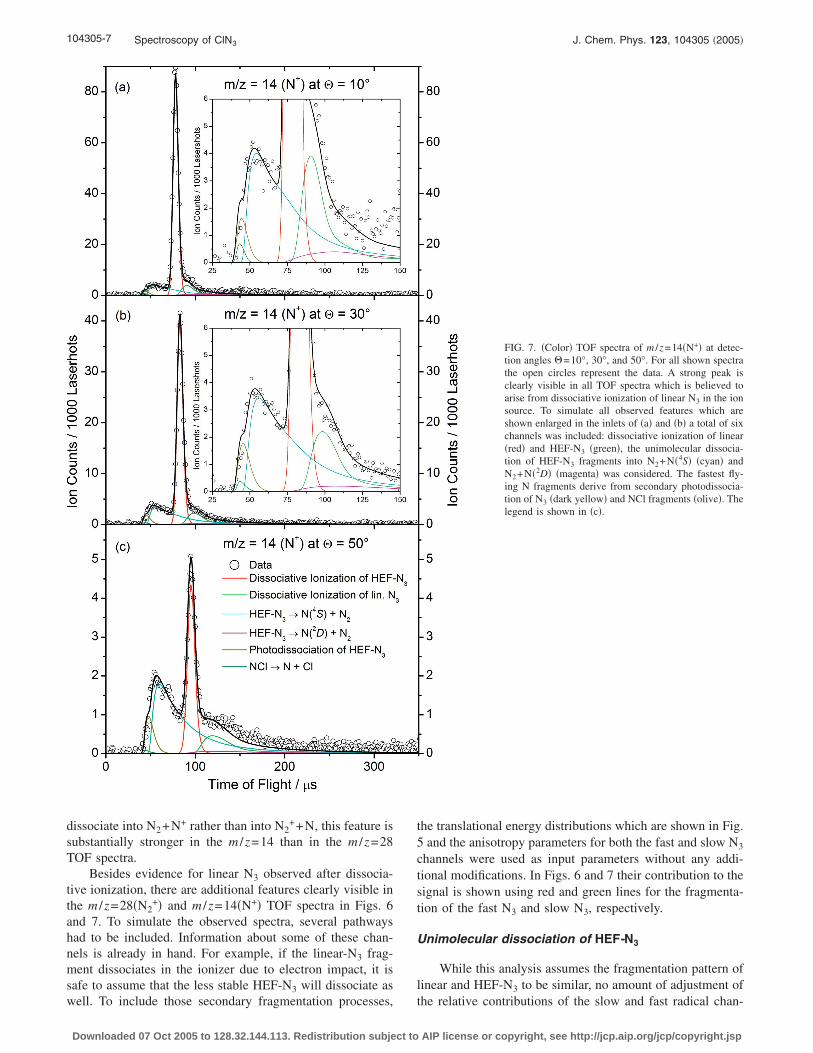
Figures 6 and 7 show that both the m /z=14 and them /z=28 TOF spectra are dominated by a strong peak which,when corrected for differences in ion flight through the quad-rupole mass spectrometer, appears at the same TOF as thedominant peak in the m /z=42 TOF data, now assigned to theformation of the linear N3�X 2��. It is therefore clear that themajor peaks in the m /z=14�N+� and 28�N2
+� data result fromdissociative ionization of linear N3 in the ionizer and provideredundant information on reaction �2a�. Since EI with elec-tron energies of �160 eV was used, observing ionizer-induced fragmentation is not surprising. Because it is ener-getically more favorable and therefore, on the basis of
+
FIG. 6. �Color� TOF spectra of m /z=28�N2+� at detection angles �=10°
and 30°. For both spectra the open circles represent the data. A strong peakis clearly visible in all TOF spectra which is believed to arise from disso-ciative ionization of linear N3 in the ion source �red line�. All minor featureswhich are shown enlarged in the embedded window in �b� are simulated bytaking the dissociative ionization of HEF-N3 �green�, the unimolecular dis-sociation �cyan and magenta�, and the photodissociation �dark yellow� ofHEF-N3 into N2+N�4S , 2D�, and of course the primary molecular N2+NClchannel �blue� into account.
statistical theories of ion dissociation more likely for N3 to
AIP license or copyright, see http://jcp.aip.org/jcp/copyright.jsp
104305-7 Spectroscopy of ClN3 J. Chem. Phys. 123, 104305 �2005�
dissociate into N2+N+ rather than into N2++N, this feature is
substantially stronger in the m /z=14 than in the m /z=28TOF spectra.
Besides evidence for linear N3 observed after dissocia-tive ionization, there are additional features clearly visible inthe m /z=28�N2
+� and m /z=14�N+� TOF spectra in Figs. 6and 7. To simulate the observed spectra, several pathwayshad to be included. Information about some of these chan-nels is already in hand. For example, if the linear-N3 frag-ment dissociates in the ionizer due to electron impact, it issafe to assume that the less stable HEF-N3 will dissociate as
well. To include those secondary fragmentation processes,Downloaded 07 Oct 2005 to 128.32.144.113. Redistribution subject to
the translational energy distributions which are shown in Fig.5 and the anisotropy parameters for both the fast and slow N3
channels were used as input parameters without any addi-tional modifications. In Figs. 6 and 7 their contribution to thesignal is shown using red and green lines for the fragmenta-tion of the fast N3 and slow N3, respectively.
Unimolecular dissociation of HEF-N3
While this analysis assumes the fragmentation pattern oflinear and HEF-N3 to be similar, no amount of adjustment of
FIG. 7. �Color� TOF spectra of m /z=14�N+� at detec-tion angles �=10°, 30°, and 50°. For all shown spectrathe open circles represent the data. A strong peak isclearly visible in all TOF spectra which is believed toarise from dissociative ionization of linear N3 in the ionsource. To simulate all observed features which areshown enlarged in the inlets of �a� and �b� a total of sixchannels was included: dissociative ionization of linear�red� and HEF-N3 �green�, the unimolecular dissocia-tion of HEF-N3 fragments into N2+N�4S� �cyan� andN2+N�2D� �magenta� was considered. The fastest fly-ing N fragments derive from secondary photodissocia-tion of N3 �dark yellow� and NCl fragments �olive�. Thelegend is shown in �c�.
the relative contributions of the slow and fast radical chan-
AIP license or copyright, see http://jcp.aip.org/jcp/copyright.jsp

104305-8 Hansen et al. J. Chem. Phys. 123, 104305 �2005�
nels can reproduce the m /z=28 and m /z=14 data. In particu-lar, the fastest appearing signal is far too translationally ex-cited to be accounted for by either of these reactions. Thereis also signal in these TOF spectra that appears somewhatslower than would be expected. In the m /z=28�N2
+� TOFdata, some of this is due to the molecular channel �blue�, butthis cannot explain the TOF quantitatively.
As pointed out earlier, the comparison of the observedm /z=35�Cl+� and the m /z=42�N3
+� TOF spectra and thecorresponding translational energy distributions suggests thatHEF-N3 fragments with Eint11±2 kcal/mol �above theground state of the HEF-N3 isomer� undergo unimoleculardissociation, for example,
N3* → N2�X 1�g
+� + N�4S� . �8�
For N3 molecules with enough internal energy, reaction �8�can provide a substantial translational energy release. Thecontribution from this channel is shown �cyan� in Figs. 6 and7.
Photodissociating ClN3 at �=248 nm �h�=115 kcal/mol� may form N3 with enough internal energiesto dissociate by the spin-allowed reaction,
N3* → N2�X 1�g
+� + N�2D� . �9�
Product flux through this channel releases much less transla-tional energy, as a great deal of the available energy is con-verted to N-atom electronic excitation. The contribution ofthis channel to the m /z=28�N2
+� and the m /z=14�N+� TOFspectra can be seen as magenta lines in Figs. 6 and 7, respec-tively.
To simulate these secondary processes, the translationalenergy distribution of the N3 molecules dissociating throughreaction �8� was found by taking the difference between thetwo P�ET�’s shown in Fig. 5. This calculated translationalenergy distribution is used to model the laboratory flux of N3
molecules that go on to dissociate. The previously describedforward-convolution program35 then uses a “secondary”P�ET� characterizing the translational energy release of reac-tion �8� to calculate the laboratory flux and the TOF spectrafor N and N2. The secondary P�ET� was iteratively adjustedto obtain the best fit. The same strategy was used to accountfor the N3 molecules that undergo reaction �9�. However,here the translation energy distribution of the dissociating N3
molecules was assumed to be the product of the P�ET� dis-tribution for the Cl atom and a heavy-side step function atET=12 kcal/mol, scaled to best fit the data.
Photodissociation of N3
Including the unimolecular dissociation of HEF-N3 isclearly necessary to fit the m /z=14 and 28 data. However, ascan be seen in Fig. 6, especially in the inset in Fig. 6�b�, noneof the channels mentioned so far accounts for the fastest N2
fragments. The fastest fragments can only be formed by atwo-photon process, i.e., by secondary photodissociation ofprimary N3 fragments. Consequently, an additional channelwas included in the analysis simulating the photodissociation
of N3 fragments:Downloaded 07 Oct 2005 to 128.32.144.113. Redistribution subject to
N3 + h� → N2�X 1�g+� + N�2D� . �10�
A thorough analysis, summarized in Figs. 8 and 9, was un-dertaken which attempted to model the data using photodis-sociation of either HEF- or linear N3. Figure 8 shows them /z=28 and m /z=14 TOF spectra for �=30°. The first rowshows the best fits obtained to the data if one neglects sec-ondary photodissociation of N3 altogether. Although it ispossible to fit the N+ data, due the presence of the fast mov-ing N atoms from NCl photodissociation, it is clear that thefastest N2 fragments are not accounted for in this model.
This fast signal can be fitted assuming secondary photo-dissociation of N3, as shown in the second row of spectra inFig. 8. The data were fitted equally well using either of thetwo secondary P�ET� distributions in Fig. 9 and an aniso-tropy parameter �=0.7. The slower distribution in Fig. 8assumes that the primary products are fast Cl+N3, i.e., linearN3 is dissociated by a second photon, while the faster distri-bution assumes the primary products to be slow Cl+N3, withHEF-N3 undergoing secondary dissociation. The fits to thedata alone cannot distinguish these two possibilities. How-ever, the vertical arrows in Fig. 9 show the maximum ET
values, ETmax, thermodynamically allowed from secondary
photodissociation of linear and HEF-N3, using the averagevalue of the fast and slow Cl fragments �30 and 9 kcal/mol,respectively� to specify the N3 internal energy. We find thatET
max for HEF-N3 matches the maximum in the secondaryP�ET� distribution assuming photodissociation of HEF-N3,whereas ET
max for linear N3 lies considerably beyond themaximum of the corresponding secondary P�ET� distribu-tion. Figure 9 thus offers indirect evidence that most of thesecondary photodissociation signal is from HEF-N3.
Overall fits to the N2+ and N+ data
In addition to the already described processes �dissocia-tive ionization, unimolecular dissociation, and secondaryphotodissociation of N3 photofragments� the primary mo-lecular channel �1� had to be included in a complete analysisof the m /z=28�N2
+� TOF spectra. Because of the branchingratios of 95%/5% in favor of the radical channel, the contri-bution of the molecular channel forming N2 and NCl islimited.4 The primary translational energy distribution shownin Fig. 3 was used without any changes and the respectivecontribution is shown as blue line in Fig. 6 and it is clearlyvisible that all six individual contributions add up nicely tofit the observed data.
The secondary photodissociation of NCl photoproductswas observed in the m /z=35 TOF spectra and therefore re-action �7� had to be included in the analysis of the m /z=14�N+� data. NCl photodissociation was modeled using thesecondary P�ET� used to simulate the m /z=35 data and ananisotropy parameter �=1.1, indicating a parallel transition.The contributions from all described channels to the overallobserved m /z=14 signal are shown in Fig. 7.
DISCUSSION
The results presented above show that the fast and slow
Cl fragments are correlated to the formation of linear N3 andAIP license or copyright, see http://jcp.aip.org/jcp/copyright.jsp

104305-9 Spectroscopy of ClN3 J. Chem. Phys. 123, 104305 �2005�
HEF-N3, respectively. The observed excitation energy ofHEF-N3 �E=30.1±3 kcal/mol agrees well with a previ-ously determined excitation energy 31±2 kcal/mol obtainedfrom velocity maps of the Cl fragments at a somewhat dif-ferent photolysis wavelength ��=235 nm�.1 We now havetwo experiments with different product detection methods attwo different wavelengths that both lead to a quantitativelyindistinguishable heat of formation for the HEF-N3. Thisadds further weight to the interpretation of the bimodal en-ergy distribution as two isomers as opposed to a bimodalvibrational energy distribution of linear N3. These experi-mental determinations are consistent with theoretical predic-
FIG. 8. �Color� Time-of-flight spectra taken at �=30° for m /z=28�N2+� �
excluding any secondary photodissociation processes of N3 fragments. TheHEF-N3 isomers, respectively. Each contribution is shown in the same colo
tions of the heat of formation of the cyclic-N3 isomer. Bit-
Downloaded 07 Oct 2005 to 128.32.144.113. Redistribution subject to
tererova et al. calculated the excitation energy of cyclic N3 tobe 30.0 kcal/mol, in excellent agreement with these results23
and with results from Zhang et al. who calculated an energydifference of 30.3 kcal/mol.25 Although other explanationsof the observed bimodal translational energy distributionsstill cannot be ruled out, this simple energy considerationshows that all experiments carried out so far on ClN3 photo-dissociation under collision-free conditions are consistentwith photolytic formation of cyclic N3.
However, the data also indicate that N3 isomers withinternal energies of Eint11±2 kcal/mol �with respect to thecyclic-N3 minimum� undergo rapid unimolecular dissocia-
olumn� and m /z=14�N+� �right column�. The first row shows the best fitsd and third rows show the best fit including photodissociation of linear andn Figs. 6 and 7.
left cseconr as i
tion and therefore cannot be detected by our present experi-
AIP license or copyright, see http://jcp.aip.org/jcp/copyright.jsp

104305-10 Hansen et al. J. Chem. Phys. 123, 104305 �2005�
mental setup. Recently, Babikov et al. published a compre-hensive study of the unimolecular dissociation of the N3
radical on the ground doublet and excited quartet potential-energy surfaces based on multireference single and doubleexcitation configuration interaction and second-order multi-reference perturbation methods. The calculations, which donot include the influence of the geometric phase effect, sug-gest that the doublet-quartet surface crossings that lead todissociation lie between 17 and 30 kcal/mol above thecyclic-N3 minimum.19 In Fig. 1 the observed threshold fordissociation �gray bar� is compared with the calculatedthresholds and doublet-quartet seam crossings. Presenttheory does not allow us to understand the apparent dissocia-tion threshold at 11 kcal/mol. Further theoretical work incor-porating the geometric phase effect’s influence into doublet-quartet seam crossings may be necessary to resolve thisdiscrepancy. It should be pointed out that some HEF-N3 isdetected even when containing internal energies that exceedthe doublet-quartet seam crossing calculated by theory.
The fact that the secondary dissociation products, N andN2, were detected and the corresponding TOF spectra couldbe analyzed successfully taking into account the unimolecu-lar dissociation and secondary photodissociation of HEF-N3
provides further support for the photochemical mechanismderived from this work.
The possibility that the observed slow Cl channel arisesfrom unimolecular dissociation of excited NCl fragments canbe ruled out for several reasons. In a previous letter, it wasshown that N2+NCl is a minor channel �5±3% � comparedto the radical-forming N3+Cl channel �95±3% �.4 Even ifwe would assume that N2+NCl is the main product and thatit is because of the unimolecular dissociation of excited NClprimary photoproducts that not all of the NCl is detected, westill would miss the N2 and N counterfragments in the m /z=28 and m /z=14 TOF spectra. The dominant peak in them /z=28�N2
+� data appears at the same time as the strongestpeak in the m /z=42�N3
+� and the m /z=14�N+� data. The
FIG. 9. Secondary translational energy distributions for the N3 photodisso-ciation process which fits best the data shown in Fig. 8. The secondaryP�ET� after dissociating linear N3 is shown to the left. The cutoff at72 kcal/mol does not match the predictions of �91 kcal/mol. The second-ary P�ET� after dissociating the HEF-N3 isomer is shown on the right. Thecutoff at 116 kcal/mol matches well with the prediction of 118 kcal/mol.
only reasonable explanation is dissociative ionization of the
Downloaded 07 Oct 2005 to 128.32.144.113. Redistribution subject to
linear-N3 fragment in the ionizing region of the mass spec-trometer. Therefore we confirm the previous analysis of N2
+NCl being a minor channel and that slow Cl fragments areactually formed by reaction �2a� and �2b�.
CONCLUSIONS
We performed photofragment translational spectroscopyexperiments to reveal the primary and secondary decompo-sition pathways of chlorine azide, ClN3, when photolyzed at�=248 nm. Special attention is paid to the radical channel�2a� and �2b� forming Cl+N3 and the following secondaryunimolecular dissociation and photodissociation processes ofhighly excited N3 fragments.
Bimodal translational energy distributions for both theCl and the N3 fragments clearly show that two distinct formsof the N3 radical are produced. Besides the formation of theground-state �linear azide� N3 radical a high-energy form�HEF� of N3 �possible cyclic N3� is formed.
The observed energy difference between the linear N3
and the HEF-N3 isomer of �E=30.1±3 kcal/mol agreeswell with calculations performed by Bittererova et al.23 andprevious velocity map imaging experiments at a differentphotolysis wavelength.1
Both forms of N3 were detected by electron-impact ion-ization. A lower limit of the lifetime of the HEF-N3 wasdetermined to be 100 �s.
N3 fragments with more than 11±2 kcal/mol of internalenergy above the cyclic-N3 minimum appear to undergo uni-molecular decomposition or photodissociation. The second-ary N2 and N unimolecular dissociation fragments were de-tected and the observed translational energy distributions ofthose products were successfully interpreted by a chemicalmodel where highly excited N3 radicals fragment into bothN2�X 1�g
+�+N�4S� and N2�X 1�g+�+N�2D�. The fastest ob-
served N and N2 fragments are produced by secondary pho-todissociation processes of the primary NCl and N3 photo-products. There is indirect evidence that HEF-N3 isselectively photodissociated at 248 nm in the presence oflinear azide.
The observed translational energy releases of both the Nand N2 fragments cannot be explained by unimolecular de-composition of energized NCl fragments. Therefore, we rulethis secondary process out as a source of the observed slowCl fragments.
In summary, the velocity map imaging and the photo-fragment translational spectroscopy experiment carried outso far on this molecule are consistent with photolytic forma-tion of cyclic N3—although the structure of the HEF-N3 spe-cies remains unclear and more work is needed.
ACKNOWLEDGMENTS
One of the authors �A.M.W.� acknowledges the supportof an Air Force Office of Scientific Research contract underGrant No. F49620-95-1-0234. Another author �N.H.� ac-knowledges the support of the Alexander von Humboldt-Foundation under a Fyodor-Lynen Stipend while working atUCSB. One of the authors �D.M.N.� acknowledges support
from the Air Force Office of Scientific Research under GrantAIP license or copyright, see http://jcp.aip.org/jcp/copyright.jsp

104305-11 Spectroscopy of ClN3 J. Chem. Phys. 123, 104305 �2005�
No. F49620-03-1-0085. Sandia is a multiprogram laboratoryoperated by Sandia Corporation, a Lockheed Martin Com-pany, for the US Department of Energy’s National NuclearSecurity Administration under Contract No. DE-AC04-94-AL85000.
1 N. Hansen and A. M. Wodtke, J. Phys. Chem. A 107, 10608 �2003�.2 N. Hansen, A. M. Wodtke, A. V. Komissarov, and M. C. Heaven, Chem.Phys. Lett. 368, 568 �2003�.
3 N. Hansen, A. M. Wodtke, A. V. Komissarov, K. Morokuma, and M. C.Heaven, J. Chem. Phys. 118, 10485 �2003�.
4 A. M. Wodtke, N. Hansen, J. C. Robinson, N. E. Sveum, S. J. Goncher,and D. M. Neumark, Chem. Phys. Lett. 391, 334 �2004�.
5 P. C. Samartzis, J. J. Lin, T. Ching, C. Chadhuri, Y. T. Lee, S. Lee, and A.M. Wodtke J. Chem. Phys. 123, 051101 �2005�.
6 R. D. Coombe, D. Patel, A. T. Pritt, and F. J. Wodarczyk, J. Chem. Phys.75, 2177 �1981�.
7 A. J. Ray and R. D. Coombe, J. Phys. Chem. 97, 3475 �1993�.8 A. J. Ray and R. D. Coombe, J. Phys. Chem. 98, 8940 �1994�.9 T. L. Henshaw, S. D. Herrera, G. W. Haggquist, and L. A. V. Schlie, J.Phys. Chem. A 101, 4048 �1997�.
10 R. H. Jensen, A. Mann, and R. D. Coombe, J. Phys. Chem. A 104, 6573�2000�.
11 A. V. Komissarov, G. C. Manke, S. J. Davis, and M. C. Heaven, J. Phys.Chem. A 106, 8427 �2002�.
12 R. D. Coombe, S. J. David, T. L. Henshaw, and D. J. May, Chem. Phys.Lett. 120, 433 �1985�.
13 S. P. Tinney, J. Han, and M. C. Heaven, Proc. SPIE 5334, 25 �2004�.14 T. L. Henshaw, G. C. Manke, T. J. Madden, M. R. Berman, and G. D.
Hager, Chem. Phys. Lett. 325, 537 �2000�.15 G. C. Manke and G. D. Hager, J. Mod. Opt. 49, 465 �2002�.16 A. J. Ray and R. D. Coombe, J. Phys. Chem. 99, 7849 �1995�.17 J. M. Herbelin, T. L. Henshaw, B. D. Rafferty, B. T. Anderson, R. F. Tate,
Downloaded 07 Oct 2005 to 128.32.144.113. Redistribution subject to
T. J. Madden, G. C. Manke, and G. D. Hager, Chem. Phys. Lett. 299, 583�1999�.
18 G. C. Manke, C. B. Cooper, S. C. Dass, T. J. Madden, and G. D. Hager,IEEE J. Quantum Electron. 39, 995 �2003�.
19 D. Babikov, P. Zhang, and K. Morokuma, J. Chem. Phys. 121, 6743�2004�.
20 D. Babikov, B. K. Kendrick, P. Zhang, and K. Morokuma, J. Chem. Phys.122, 044315 �2005�.
21 R. Resta, J. Phys.: Condens. Matter 12, R107 �2000�.22 M. V. Berry, Proc. R. Soc. London, Ser. A 392, 45 �1984�.23 M. Bittererova, H. Ostmark, and T. Brinck, J. Chem. Phys. 116, 9740
�2002�.24 R. Tarroni and P. Tosi, Chem. Phys. Lett. 389, 274 �2004�.25 P. Zhang, K. Morokuma, and A. M. Wodtke, J. Chem. Phys. 122, 014106
�2005�.26 J. M. L. Martin, J. P. Francois, and R. Gijbels, J. Chem. Phys. 93, 4485
�1990�.27 R. E. Continetti, D. R. Cyr, D. L. Osborn, D. J. Leahy, and D. M. Neu-
mark, J. Chem. Phys. 99, 2616 �1993�.28 C. Paillard, R. Moreau, and J. Combouri, C. R. Seances Acad. Sci., Ser.
C 264, 1721 �1967�.29 M. Otto, S. D. Lotz, and G. Frenking, Inorg. Chem. 31, 3647 �1992�.30 S. S. Xantheas, T. H. Dunning, and A. Mavridis, J. Chem. Phys. 106,
3280 �1997�.31 Y. T. Lee, J. D. McDonald, P. R. Lebreton, and D. R. Herschbach, Rev.
Sci. Instrum. 40, 1402 �1969�.32 J. C. Robinson, S. A. Harris, W. Z. Sun, N. E. Sveum, and D. M. Neu-
mark, J. Am. Chem. Soc. 124, 10211 �2002�.33 D. Proch and T. Trickl, Rev. Sci. Instrum. 60, 713 �1989�.34 S. A. Harich, PHOTRAN, a program for forward convolution analysis of
photodissociation, 2003.35 A. M. Wodtke, ANALMAX, forward convolution analysis of photodissocia-
tion including secondary processes, 2004.36 A. T. Pritt, D. Patel, and R. D. Coombe, J. Chem. Phys. 75, 5720 �1981�.37 J. M. Dyke, N. B. H. Jonathan, A. E. Lews, and A. Morris, Mol. Phys.
47, 1231 �1982�.
AIP license or copyright, see http://jcp.aip.org/jcp/copyright.jsp