Photo credit: Theresa Walunas, ...
13
Photo credit: Theresa Walunas, http://www.keyboardbiologist.net/knitblog/ 1
Transcript of Photo credit: Theresa Walunas, ...

Photo credit: Theresa Walunas, http://www.keyboardbiologist.net/knitblog/
1
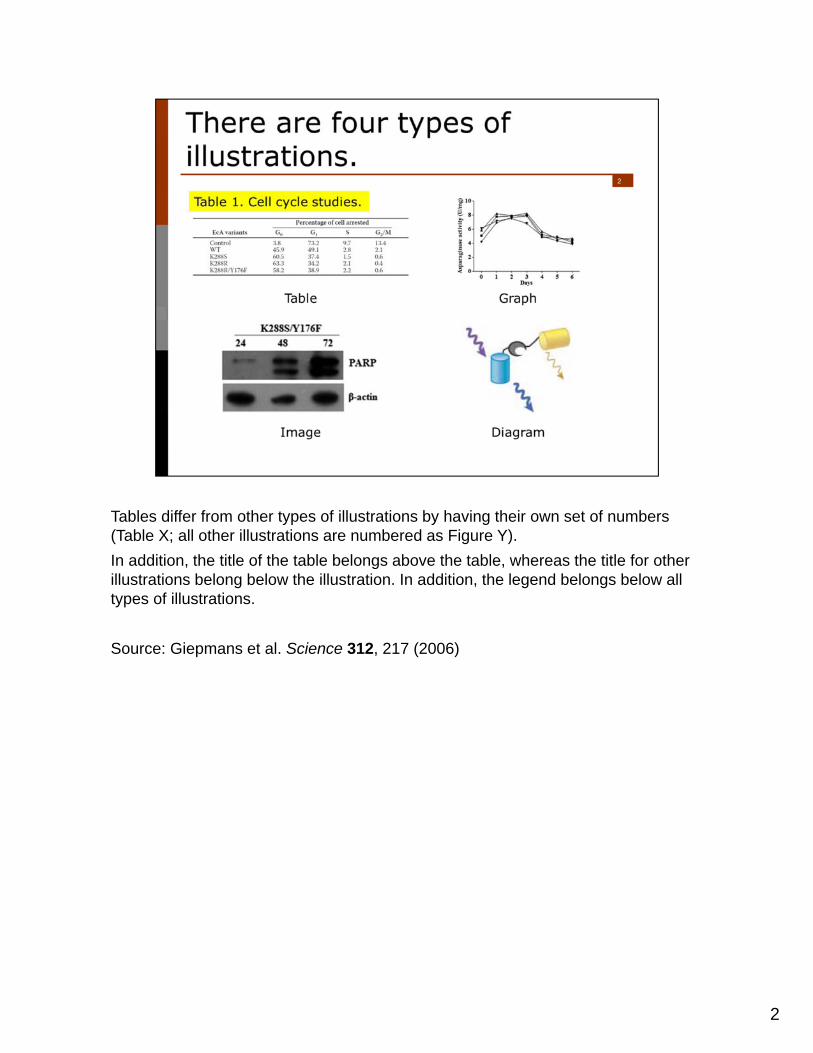
Tables differ from other types of illustrations by having their own set of numbers (Table X; all other illustrations are numbered as Figure Y).
In addition, the title of the table belongs above the table, whereas the title for other illustrations belong below the illustration. In addition, the legend belongs below all types of illustrations.
Source: Giepmans et al. Science 312, 217 (2006)
2

The table on the left is useless because the only useful (i.e., nonzero) data are found in a much smaller range of temperatures.
The graph on the right is useless because the numbers don’t relate to each other.
Source: How to Write and Publish a Scientific Paper by Robert Day
3

4

The graph on the left was copied straight from Excel 2010. The graph on the right was modified using the same program:
- Added axis titles and “series”; modified values of the x-axis
- Removed horizontal lines and useless tick marks on the axes (e.g., 120% on y-axis)
- Enlarged data points and labels for the axes (though should still be at least 18 point for an oral presentation)
- Used black for the lines
5

Format your gels properly:
-Gel is properly positioned and cropped; show wells, not edges
-Title and legend below gel.
-Labels:
--Above each lane; use abbreviations. Note that the labels of this gel are almost like a table.
--(Lane numbers below – this helps you refer to specific lanes in the Results section)
--Molecular weight markers, with units.
--Font big enough to withstand reduction.
Two free programs that could help you format your gels are Inkscape(http://inkscape.org/) and Gimp (http://www.gimp.org/). You could also try MS PowerPoint or MS Office Picture Manager in MS Office Tools.
6

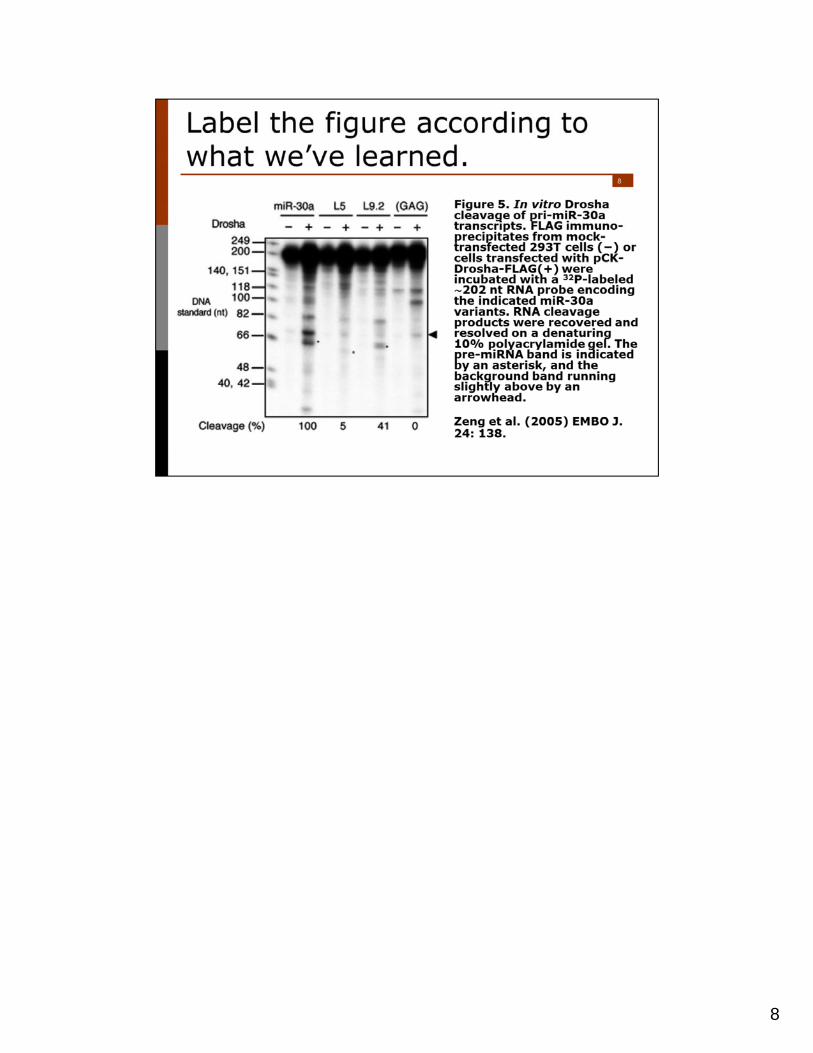
-Provides a title
-Explains how data was obtained, in this case the reaction performed and the electrophoresis conditions
-Defines abbreviations and symbols
Pitfalls to avoid:
-Reiterate results section, i.e., describes the data.
-Written in shorthand, abbreviated form rather than whole sentences
-Do not allow illustration to stand on its own, e.g. lack aspects of methods
-Contain self-referential language, e.g. “In this table/graph…” or “This figure shows…”
7
8

Running your gel
You will use a 0.7% agarose gel (prepared by the teaching faculty), running four samples as well as a reference lane of molecular weight markers (also called a DNA ladder).
1. Add 2.5 μL loading dye to the pGEM-5Zf digested by NotI, as well as to the pSP72 digested by EcoRI. o Loading dye contains xylene cyanol as a tracking dye to
follow the progress of the electrophoresis (so you don’t run the smallest fragments off the end of your gel!) as well as glycerol to help the samples sink into the well.
2. Flick the eppendorf tubes to mix the contents, then quick spin them in the microfuge to bring the contents of the tubes to the bottom.
3. Load the gel in the order shown in the table below. o To load your samples, draw the volume listed on the table
below into the tip of your P200. Lower the tip below the surface of the buffer and directly over the well. You risk puncturing the bottom of the well if you lower the tip too far into the well itself (puncturing well = bad!). Expel your sample into the well. Do not release the pipet plunger until after you have removed the tip from the gel box (or you'll draw your sample back into the tip!).
4. Once all the samples have been loaded, attach the gel box to the power supply and run the gel at 125 V for no more than 45 minutes.
5. You will be shown how to photograph your gel and excise the relevant bands of DNA.
Loading a gel Lane Sample Volume to
load 1 1 kb DNA ladder 20 μL 2 uncut pGEM-5Zf 10 μL 3 pGEM-5Zf NotI 5 μL 4 uncut pSP72 10 μL 5 pSP72 EcoRI 5 μL

Figure 1.

MW markers:
-Label the bands are bigger and smaller than the bands of interest, plus one of the higher MW bands.
-Write out the numbers to the same number of significant digits, e.g., 4.0
Sample labels:
-Label more efficiently. Some lanes can be grouped together because they share a common component such as a plasmid.
-Use abbreviations.
-Place labels outside of the image.
-Keep other marks on the image discreet; the red box potentially blocks other data, and could instead be replaced by a small asterisk or arrow off to the side of the image.
9

Notice that the image of the gel has been trimmed so that the reader does not see the edges of the gel, but can still see the wells.
Make sure to label at least a few of the MW marker bands, e.g., the bands are bigger and smaller than the bands of interest, plus one of the higher MW bands.
The figure legend below is very good because it has a title and describes how the image was created without describing the data.
“Figure 1. Electrophoresis of restriction-enzyme digested pGEM®-5Zf and pSP72 Vectors. NotI was used to digest the pGEM®-5Zf(+) Vector while EcoRI was used to cut the pSP72 Vector. The digestion products were analyzed on a 0.7% agarosegel. Lane M, 1kb DNA Ladder.”
Note that the title is specific (e.g., includes names of the plasmids), but does not contain all details (e.g., name of enzymes, type of gel used) because these details are in the legend. Basically, you want a title that helps the reader distinguish the illustration from other figures. A title that states the conclusion of the illustration would also be appropriate.
Photo: http://www.promega.com/resources/articles/pubhub/enotes/rapid-dna-digestion-using-promega-restriction-enzymes/
10

11