Phhyyssiiool looggiiccaal aanndd MMeettaabboolliicc ...
198
Physiological and Metabolic Flux Screening of S S a a c c c c h h a a r r o o m m y y c c e e s s c c e e r r e e v v i i s s i i a a e e Single Knockout Mutants on Different Carbon Sources Dissertation Zur Erlangung des akademischen Grades Doktor der Naturwissenschaften (Dr.rer.nat.) Der naturwissenschaftlich-technischen Fakultat III, Chemie, Pharmazie, Bio-und Werkstoffwissenschaften der Universitat des Saarlandes von Vidya R. Velagapudi, M.Sc., PGDiploma Saarbrucken, Germany 2009
Transcript of Phhyyssiiool looggiiccaal aanndd MMeettaabboolliicc ...

PPhhyyssiioollooggiiccaall aanndd MMeettaabboolliicc FFlluuxx SSccrreeeenniinngg ooffSSaacccchhaarroommyycceess cceerreevviissiiaaee SSiinnggllee KKnnoocckkoouutt
MMuuttaannttss oonn DDiiffffeerreenntt CCaarrbboonn SSoouurrcceess
Dissertation
Zur Erlangung des akademischen Grades
Doktor der Naturwissenschaften (Dr.rer.nat.)
Der naturwissenschaftlich-technischen Fakultat III,
Chemie, Pharmazie, Bio-und Werkstoffwissenschaften
der Universitat des Saarlandes
von
Vidya R. Velagapudi, M.Sc., PGDiploma
Saarbrucken, Germany
2009


Tag des kolloquiums: September 21st, 2009
Dekan: Prof. Stefan Diebels
Berichterstatter: Prof. Wilhelm F. Maier
Prof. Elmar Heinzle,
Prof. Manfred Schmitt
Dr. Frank Hannemann

I
AACCKKNNOOWWLLEEDDGGEEMMEENNTTSS
It is my pleasure to thank the people who made this thesis possible. First of all, I express my
deeply felt thanks to my thesis advisor, Prof. Elmar Heinzle, for providing me an opportu-
nity to work in his group, for his continuous support and constant guidance during the ten-
ure of my Ph.D program. It is difficult to overstate my gratitude to Prof. Heinzle, who with
his enthusiasm, inspiration, and his great efforts to explain things clearly made this thesis
possible. He is responsible for involving me in the Yeast project in the first place. Through-
out my thesis-writing period, he provided encouragement, sound advice, good teaching and
reviews, and lots of novel ideas and constructive criticism.
I wish to thank my second official thesis reviewer, Prof. Manfred Schmitt and academic re-
viewer Dr. Frank Hannemann for reviewing this dissertation and also extend my thanks to
the thesis chairman, Prof. Wilhelm F. Maier. I wish to thank Prof. Christoph Wittmann for
his support during the initial phase of this project and for providing me valuable back-
ground on metabolic flux analysis. I wish to thank Prof. Thomas Lengauer, Max-Planck
Institute for Informatics (MPI), Saarbrucken for coordinating our regular project meetings
and for providing me good insight on the computational aspects. I also thank Dr. Priti Tal-
war, MPI, who completed her Ph.D thesis by developing computational methods using the
data generated from this thesis work, for her collaboration.
I extend my sincere thanks to Dr. Klaus Hollemeyer for his help with the MALDI-ToF-MS
measurements. I thank Dr. Tae Hoon Yang for his invaluable support with the MATLAB
programming. I also thank Mr. Konstantin Schneider for his timely help. I wish to thank
my very good friend, Mr.Gopalacharyulu Peddinti for his timely help and support in the
programming part. I also thank Dr. Jing Tang for his help in the modelling aspects. My
special thanks to Mr. Michel Fritz for his invaluable help with the HPLC and GC-MS meas-
urements. I extend my thanks to Mrs.Veronika Witte for her help and support with the
yeast mutant strains during the initial phase and Mr. Robert Schmidt for his help in order-
ing the required chemicals in the laboratory. I express my sincere thanks to Dr. Susanne
Kohring for her timely help. This thesis is based on three years of research funded by the
DFG through the Center for Bioinformatics, University of Saarland and I express my sin-
cere thanks for the financial support.

II
I also like to thank my good friends Dr. Rahul Deshpande, Dr. Masoud Zabet-Moghaddam,
Mrs.Lucia & Dr.Uenal Coskun, Mr.Sathish Kumar and Dr. Maria Lasaosa for their good
company. I express my gratitude to Mrs. Anna Heinzle for her great hospitality and Ms.
Catherine Heinzle for her good company during my initial days at their home in Germany.
I express my sincere thanks to our Vice President R&D Biotechnology, Prof. Anu
Kaukovirta-Norja and Technology Manager, Dr. Richard Fagerstrom at VTT Technical
Research Center of Finland, who relieved me from the present work to finish my thesis and
for constant encouragement and support. Financial support from the VTT Management is
greatly acknowledged during the thesis-writing and research papers-writing period and for
covering the printing costs of this thesis and also for covering my travelling costs for the
Ph.D defense. I express my deep gratitude to Prof. Matej Oresic, Quantitative Biology and
Bioinformatics (QBIX) Group, VTT for offering me Post-doc position even before the com-
pletion of my thesis work and for his constant support and encouragement at every stage.
I wish to thank all my colleagues at VTT, who shared my present work during this period.
Special thanks to Dr. Tuulikki Seppanen-Laakso for her great help and support and I extend
my thanks to Mrs. Ulla Lahtinen and Mrs. Anna-Liisa Ruskeepaa. I also would like to thank
each and everybody at QBIX group and all my professional collaborators for their good
wishes and support. I thank Mrs. Paivi vahala for her support in formatting this thesis. I
wish to thank Mrs. Sirpa Nygren for her help in printing this thesis.
I would like to take this opportunity to thank my family. I thank my parents, Mr. Prabhakar
Rao & Mrs. Padmavathi for their love and affection. A special thanks to my loving husband
Dr. Ramakrishna Velagapudi for his ever lasting love, constant support, patience and for
taking care of the family during this period. I would also like to mention about our little
daughter Hansika, whose presence has brought a precious change into our lives. I wish to
thank my in-laws, Mr. Shiva Nageswara Rao & Mrs. Usha for their constant encourage-
ment, good words and blessings. I also thank my sister‘s family Mr. Shuan & Mrs. Jaya and
my lovely nephews Vickran and Raj for their love and affection. I thank my brother Mr.
Rajesh, for his wit and humour that helped me lift my spirits. I also thank my brother-in-
law, Mr. Vamsikrishna for always wishing me good success and happiness.

III
PPUUBBLLIICCAATTIIOONNSS
This Ph.D thesis work was carried out in Prof. Elmar Heinzle’s Applied Biochemistry-
Biochemical Engineering group, University of Saarland, Saarbrucken, Germany during Janu-
ary 2003 - December 2005. The following original research articles were published based on
this thesis work or are in preparation.
1. Velagapudi, V.R., Wittmann, C., Lengauer, T., Talwar, P., Heinzle, E., 2006. MetabolicScreening of Saccharomyces cerevisiae Single Knock-out Strains Reveals UnexpectedMobilization of Metabolic Potential. Process Biochemistry. 41, 2170-2179.
2. Hollemeyer, K., Velagapudi, V.R., Wittmann, C., Heinzle, E., 2007. Matrix-assisted la-ser desorption/ionization time-of-flight mass spectrometry for metabolic flux analyses us-ing isotope-labeled ethanol. Rapid Communications in Mass Spectrometry. 21, 336-342.
3. Velagapudi, V.R., Wittmann, C., Schnider, K., Heinzle, E., 2007. Metabolic FluxScreening of Saccharomyces cerevisiae Single Knock-out Strains on Glucose and Galac-tose Supports Elucidation of Gene Function. Journal of Biotechnology. 132, 395-404.
4. Velagapudi, V.R., Heinzle, E., 2009. Physiological and metabolic flux profiling of S.cerevisiae hexose transporter deletion mutants. (To be submitted)
5. Velagapudi, V.R., Heinzle, E., 2009. Comparative physiological profiling of S. cere-visiae single knockouts on different carbon sources – Fructose, Glucose and galactose.(To be submitted)
6. Velagapudi, V.R., Peddinti, G., Tang, J., Lengauer, T., Heinzle, E., 2009. Functionalgenomics of S. cerevisiae by utilising phenotypic and metabolic flux profiling data by us-ing bioinformatics tools (To be submitted)
7. Velagapudi, V.R., Heinzle, E., 2009. Summed fractional labelling analysis of yeast mu-tants on different carbon sources (To be submitted)
8. Talwar, P., Rahnenfuhrer, J., Heinzle, E., Wittmann, C., Velagapudi, V.R., Lengauer, T.,2009. Computtaional analysis of metabolite screening data (To be submitted)

IV

Contents
V
CCOONNTTEENNTTSS
ACKNOWLEDGEMENTS..............................................................................................................I
PUBLICATIONS…………………………………………………………………………………….III
1. ABSTRACT ........................................................................................................................................1
2. ZUSAMMENFASSUNG………………………………………………………………..………2
3. INTRODUCTION................................................................................................................... 3
3.1 MOTIVATION ..................................................................................................................... 3
3.2 OBJECTIVES ...................................................................................................................... 4
3.3 THEORETICAL BACKGROUND ON YEAST METABOLISM.............................................................7
4. MATERIALS AND METHODS .......................................................................................... 21
4.1 YEAST STRAINS ............................................................................................................... 21
4.2 MEDIA COMPOSITION....................................................................................................... 21
4.3 DEFINED MEDIUM OPTIMIZATION..................................................................................... 22
4.4 CULTIVATION................................................................................................................................23
4.5 ANALYTICS ..................................................................................................................... 25
4.6 SIMULATIONS.................................................................................................................. 28
4.7 ETHANOL LABELING ANALYSIS AND QUANTIFICATION USING MALDI-TOF-MS .....................32
4.8 LABELLING ANALYSIS OF PROTEINOGENIC AMINO ACIDS ......................................................39
4.9 METABOLIC NETWORK MODEL AND FLUX ANALYSIS........................................................ 40
4.10 STATISTICAL ANALYSES .................................................................................................. 43
5. RESULTS AND DISCUSSION ............................................................................................ 48
5.1 METABOLIC SCREENING OF S. CEREVISIAE SINGLE KNOCKOUT STRAINS ON
GLUCOSE AND GALACTOSE.............................................................................................. 49
5.1.1 Background ................................................................................................................ 49
5.1.2 Microtiter plate cultivation of S. cerevisiae................................................................. 49
5.1.3 Comparative growth analysis in MTP and SFC........................................................... 50
5.1.4 Effect of shaking rate on oxygen limitation.................................................................. 52
5.1.5 Method Validation...................................................................................................... 54
5.1.6 Comparative physiological analysis............................................................................ 55
5.1.7 Conclusions................................................................................................................. 67
5.2 MALDI-TOF-MS FOR METABOLIC FLUX ANALYSES USING ISOTOPE LABELED ETHANOL .... 68
5.2.1 Background ................................................................................................................ 68

Contents
VI
5.2.2 Ethanol quantification and validation ......................................................................... 69
5.2.3 Estimation and validation of flux split ratio................................................................. 69
5.2.4 Conclusions................................................................................................................ 70
5.3 METABOLIC FLUX SCREENING OF S. CEREVISIAE KNOCKOUT STRAINS ON GLUCOSE AND
GALACTOSE AT MINIATURIZED SCALE ............................................................................. 72
5.3.1 Background ................................................................................................................ 72
5.3.2 Flux through Pentose Phosphate Pathway (PPP)........................................................ 73
5.3.4 Flux through Anaplerotic pathway.............................................................................. 78
5.3.6 Comparative flux analysis on glucose and galactose................................................... 79
5.3.7 Conclusions................................................................................................................ 82
5.4 STOICHIOMETRIC AND METABOLIC FLUX SCREENING OF S. CEREVISIAE HEXOSE
TRANSPORTER (HXTS) SINGLE KNOCKOUT STRAINS ON GLUCOSE AND GALACTOSE .......... 84
5.4.1 Background ................................................................................................................ 84
5.4.2 Stoichiometric profiling of HXT knockout strains........................................................ 85
5.4.3 Comparative physiological profiling of HXT mutants.................................................. 93
5.4.3.1 Hexose sensors: rgt2 and snf3 ...…………………………………………………….…93
5.4.3.2 Low affinity HXT mutant strains: hxt1 , hxt3 and hxt4 ....…………………….......93
5.4.3.3 HXTs with limited known functions....................................................................….....94
5.4.3.4 Regulators……………………………………………………………………………………..95
5.4.4 Comparative metabolic flux profiling of HXT mutants................................................ 96
5.4.4.1 Glycolysis and Pentose phosphate pathway (PPP)……………………………………...96
5.4.4.2 TCA cycle and Fermentative pathway…………………………………………………......99
5.4.4.3 Anaplerotic pathway………………………………………………………………………..100
5.4.5 Conclusions.............................................................................................................. 102
5.5 METABOLIC SCREENING OF S. CEREVISIAE SINGLE KNOCKOUT STRAINS ON FRUCTOSE
SUGAR AND A COMPARATIVE STUDY ON DIFFERENT CARBON SOURCES.......................... 104
5.5.1 Background .............................................................................................................. 104
5.5.2 Physiological profiling of mutants on fructose .......................................................... 107
5.5.3 Comparative physiological profiling of mutants – fructose data with glucose and
galactose data .......................................................................................................... 114
5.5.4 Physiologically interesting strains…………………………………………………………....120
5.5.5 Conclusions.............................................................................................................. 123
5.6 FUNCTIONAL GENOMICS OF S. CEREVISIAE BY UTILISING PHENOTYPIC AND METABOLIC
FLUX PROFILING DATA BY USING BIOINFORMATICS TOOLS ............................................ 125
5.6.1 Background .............................................................................................................. 125
5.6.2 Statistical analysis of the data................................................................................... 125

Contents
VII
5.6.2.1 Hierarchical clustering analysis……………………………………………………….…126
5.6.2.2 Data visualisation as clustered heat maps…………………………………………….…130
5.6.2.3 Biological significance of mutant pairs………………………………………….…….…133
5.6.3 Functional prediction of hypothetical genes.................................................................... 134
5.6.3.1 Euclidean distance approach……………………………………………………………...134
5.6.3.2 Graphical Gaussian Models (GGMs) approach………………………………………..137
5.6.4 Conclusions.............................................................................................................. 140
6. SUMMARY & CONCLUSIONS........................................................................................ 141
7. OUTLOOK ......................................................................................................................... 144
8. REFERENCES.................................................................................................................... 146
9. APPENDICES..................................................................................................................... 156
9.1 SYMBOLS AND ABBREVIATIONS.................................................................................... 156
9.2 BERKELEY MADONNA PROGRAM FOR KLA DETERMINATION ........................................... 157
9.3 BERKELEY MADONNA PROGRAM FOR YX/O DETERMINATION ........................................... 157
9.4 PROGRAM FOR ETHANOL CORRECTION .......................................................................... 158
9.5 MATLAB PROGRAMS FOR SOLVING CARBON MASS ISOTOPOMER DISTRIBUTIONS AND
CORRECTING NATURAL ISOTOPIC EFFECTS FOR ETHANOL .............................................. 159
9.6 MATLAB PROGRAM FOR FLUX CALCULATIONS...……….…………………………………165
9.7 PROGRAM FOR QP-GRAPH ANALYSIS..……….………………………………...…………166
9.8 STOICHIOMETRIC MATRICES USED FOR METABOLIC FLUX CALCULATIONS ..................... 168
9.9 GROWTH PROFILES ON GLUCOSE ................................................................................... 169
9.10 GROWTH PROFILES ON GALACTOSE ............................................................................... 172
9.11 GROWTH PROFILES ON FRUCTOSE .................................................................................. 174
9.12 DISSOLVED OXYGEN PROFILES ON GLUCOSE .................................................................. 177
9.13 DISSOLVED OXYGEN PROFILES ON GALACTOSE.............................................................. 181
10. CURRICULUM VITAE........................................................................................................ 184

VIII

Abstract
1
11.. AABBSSTTRRAACCTT
A novel method for high-throughput stoichiometric and metabolic flux profiling was devel-
oped and a set of deletion mutants of S. cerevisiae, which are known to be involved in central
carbon metabolism were selected and investigated on glucose, galactose and fructose. On
glucose and fructose, the growth was predominantly fermentative and on galactose, respira-
tion was more active. mae1 strain did not show any significant growth phenotype on glu-
cose, however, it had highest PPP flux on galactose, which could be due to redirection of
NADPH production to the PPP. On fructose, mae1 strain had highest oxygen uptake rate
with very low ethanol yield, which could be due to reduced PPP flux and to maintain
NADPH levels either via NADPH specific -isocitrate dehydrogenase or -aldehyde dehydro-
genase. imp2’ strain had lowest PPP flux and very high respiratory activity on galactose;
and pck1 strain had lowest PPP flux on glucose, which might also point to a possible activa-
tion of malic enzyme. On fructose, hxt17 strain had highest sugar consumption and ethanol
production rates and imp2’ strain had highest ethanol yield. The functional prediction of
hypothetical genes by utilising this quantitative data using computational analyses suggested
a possible role in glycolysis or pyruvate metabolism for YBR184W and low affinity trans-
porter role for YIL170W.

Abstract
2
22.. ZZUUSSAAMMMMEENNFFAASSSSUUNNGG
Es wurde eine neue Hochdurchsatzmethode für die Charakterisierung der Stöchiometrie und
der metabolischen Flüsse entwickelt und auf ausgewählte Deletionsmutanten des Zentral-
stoffwechsels von S. cerevisiae angewendet, wobei Glucose, Galactose und Fructose als Sub-
strate eingesetzt wurden. Während auf Glucose und Fructose das Wachstum vorwiegend fer-
mentativ war, war es auf Galactose mehr respirativ. Der mae1 Stamm zeigte keinen Phäno-
typ auf Glucose, hatte aber auf Galactose einen sehr hohen Fluss in den Pentosephosphatweg
(PPP) mit entsprechend hoher Bereitstellung von NADPH und auf Fructose die höchste Sau-
erstoffaufnahmerate mit zugleich sehr niedriger Ethanolausbeute, was auf einen reduzierten
Fluss in den PPP und verstärkte Bildung von NADPH über die Isocitratdehydrogenase oder
die Aldehyddehydrogenase hindeutet. Der imp2’ Stamm hatte einen sehr niedrigen PPP-
Fluss und starke Respiration auf Galactose. Der pck1 Stamm hatte die niedrigsten PPP Fluss
auf Glucose, was auf eine Aktivierung des Malatenzyms hindeutet. Auf Fructose zeigte der
hxt17 Stamm höchste Zuckerverbrauchs- und Ethanolproduktionsraten und imp2’ hatte die
höchste Ethanolausbeute. Numerische Analysen erlaubten eine erste Vorhersage möglicher
Funktionen zweier hypothetischer Gene, in der Glykolyse oder im Pyruvatmetabolismus für
YBR184W und als niedrig affinen Transporter für YIL170W.
Introduction
3
33.. IINNTTRROODDUUCCTTIIOONN
33..11 MMOOTTIIVVAATTIIOONNS. cerevisiae is one of the most thoroughly studied microorganisms. Along with its industrial
importance, S. cerevisiae serves as a model organism for understanding and engineering eu-
karyotic cell function. S. cerevisiae was the first eukaryotic organism whose genome was
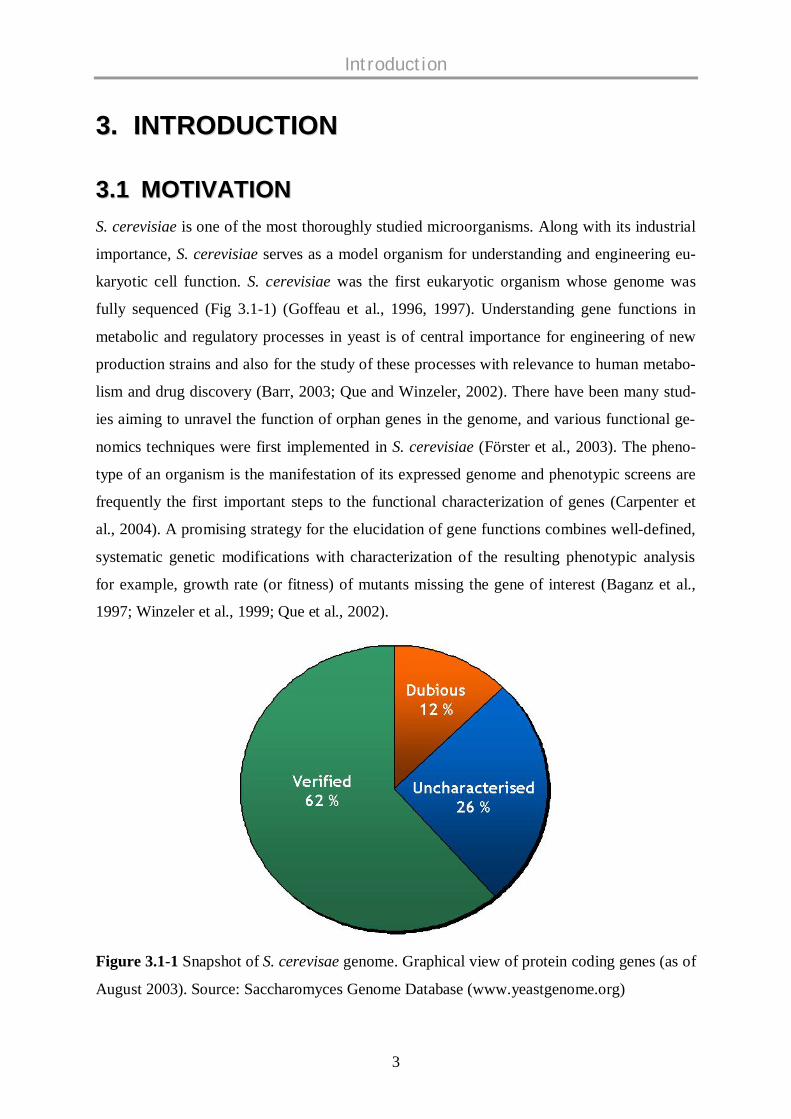
fully sequenced (Fig 3.1-1) (Goffeau et al., 1996, 1997). Understanding gene functions in
metabolic and regulatory processes in yeast is of central importance for engineering of new
production strains and also for the study of these processes with relevance to human metabo-
lism and drug discovery (Barr, 2003; Que and Winzeler, 2002). There have been many stud-
ies aiming to unravel the function of orphan genes in the genome, and various functional ge-
nomics techniques were first implemented in S. cerevisiae (Förster et al., 2003). The pheno-
type of an organism is the manifestation of its expressed genome and phenotypic screens are
frequently the first important steps to the functional characterization of genes (Carpenter et
al., 2004). A promising strategy for the elucidation of gene functions combines well-defined,
systematic genetic modifications with characterization of the resulting phenotypic analysis
for example, growth rate (or fitness) of mutants missing the gene of interest (Baganz et al.,
1997; Winzeler et al., 1999; Que et al., 2002).
Figure 3.1-1 Snapshot of S. cerevisae genome. Graphical view of protein coding genes (as of
August 2003). Source: Saccharomyces Genome Database (www.yeastgenome.org)

Introduction
4
In this context, an international consortium established a complete yeast strain collection with
the deletion of each single gene (Giaever et al., 2002). The availability of the complete set of
deletion mutants of S. cerevisiae provides a unique resource for systematic analysis of the
functional role of individual genes. Moreover, it is a quantitative tool for systematically
measuring the contribution to survival and reproduction (fitness) of most genes in the yeast
genome. In many of these analyses, the aim has been to determine how the different genes
(both the ones with known function and those open reading frames that have no assigned
function) interact with each other, enabling the cells to take up nutrients, grow, divide, regu-
late their metabolism, release products to the environment, and respond to different stimuli.
Exposition of such strains to a suitable environment, e.g. substrate mixture or stress condi-
tion, and subsequent measurement of fitness or gene expression supports discovery of gene
function.
33..22 OOBBJJEECCTTIIVVEESS
To exploit this unique resource of complete set of yeast single gene knockouts, high-
throughput assays are needed to provide a phenotypic profile of the functional role of indi-
vidual genes. Currently many high-throughput techniques are available for large scale screen-
ing of yeast mutant library based on fitness (Giaever et al., 2002). Although, these techniques
are useful for massive screening of mutant strains to find gene-environment interactions dur-
ing several stress responses (Gasch et al., 2002), e.g. oxidative stress (Weiss et al., 2004),
saline response (Warringer et al., 2003), weak organic acid (Mollapur et al., 2004) quantita-
tive information on the actual metabolic changes induced is limited to growth rate which
serves as an overall indicator of so called fitness.
In the field of functional genomics, several comprehensive methods have been developed for
the analysis of different ‘Omic’ data i.e. genome, transcriptome, proteome and metabolome
depending on the type of compounds measured, i.e., transcripts, proteins, or metabolites (An-
dreas et al., 2001), respectively. The primary approaches of functional genomics, until re-
cently, have been expression arrays and proteomics. Although these are powerful approaches,
they do not necessarily elucidate gene function (Trethewey et al., 2001). Since mRNA mole-
cules are not functional entities within the cell, gene expression profiles alone cannot directly
identify the functions of genes. On the other hand, proteins and metabolites constitute func-

Introduction
5
tional entities within the cell (Delneri et al., 2001). However, at the proteomic level, changes
in protein abundance do not necessarily indicate increases in activity within the cell associ-
ated with this protein (Trethewey et al., 2001). Measuring changes in metabolite concentra-
tions (metabolic profiling) is another powerful approach for assessing gene function and rela-
tionships to different phenotypes (Phelps et al., 2002).
Figure 3.2-1 Overall picture of the central idea of the project
Generally, the determination of basic physiological parameter as rates of growth, substrate
consumption, product formation and respiration and further of metabolic pathway activities is
of central importance for the characterization of strains. Thus it would be most desirable to
get a more detailed picture of metabolic activities of such mutants (Figure 3.2-1). Allen et al.
(2003) analyzed the supernatant of cultivated yeast deletion mutants using HPLC-MS, which
served as indicator for metabolic activities. Traditionally, this is only possible by controlled
cultivation of strains in fermenters. This is, however, hardly affordable for a large number of
strains. Therefore, controlled cultivation of microorganisms in microtiter plates has received
increased attention in recent years (John et al., 2003; Kumar et al., 2004; Sauer, 2004). Oxy-
gen supply has a major influence on the physiology of S. cerevisiae as has been shown in
continuous culture (Furukawa et al., 1983). Oxygen supply is, however, limited in microtiter
plates (Kumar et al., 2004). Recently, microtiter plates with integrated optical sensing of dis-
solved oxygen became available (John et al., 2003) and allow the measurement of dissolved
oxygen profiles of microbial cultures, which can serve as a basis for the estimation of oxygen
Introduction
6
uptake rate (Dunn et al., 2003). In batch culture the maximum range of exponential growth is
limited to a maximal critical cell concentration above which oxygenation is insufficient.
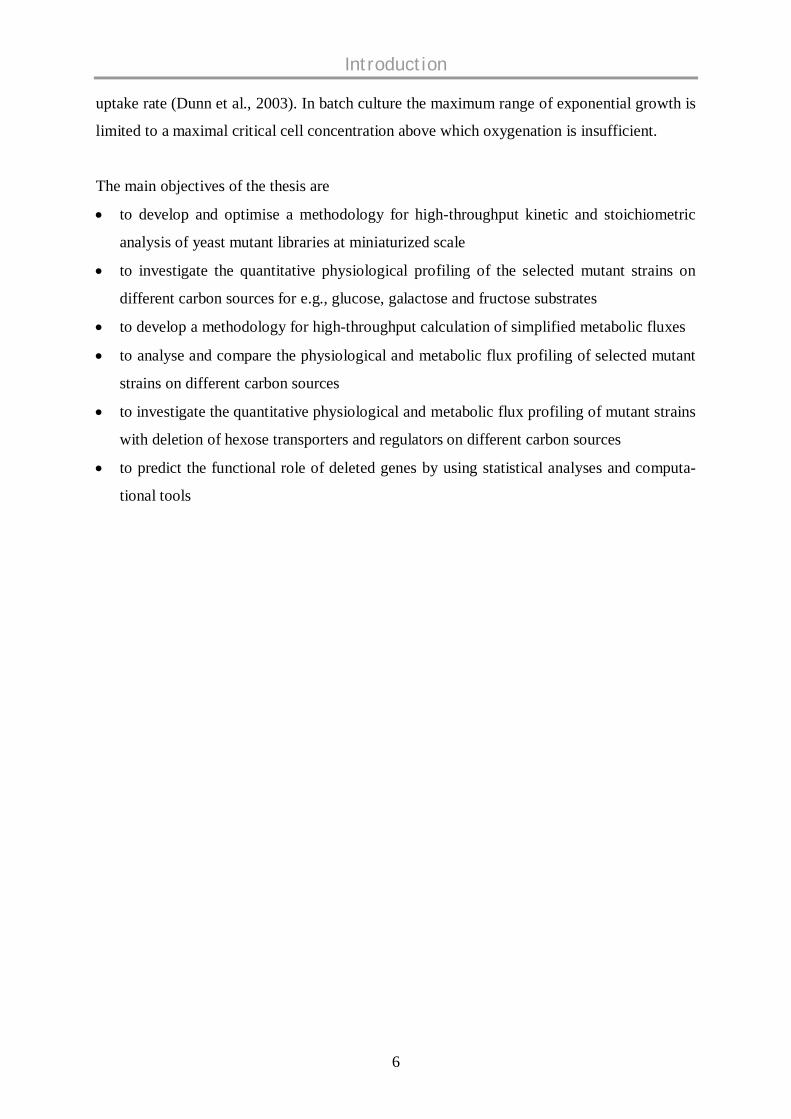
The main objectives of the thesis are
to develop and optimise a methodology for high-throughput kinetic and stoichiometric
analysis of yeast mutant libraries at miniaturized scale
to investigate the quantitative physiological profiling of the selected mutant strains on
different carbon sources for e.g., glucose, galactose and fructose substrates
to develop a methodology for high-throughput calculation of simplified metabolic fluxes
to analyse and compare the physiological and metabolic flux profiling of selected mutant
strains on different carbon sources
to investigate the quantitative physiological and metabolic flux profiling of mutant strains
with deletion of hexose transporters and regulators on different carbon sources
to predict the functional role of deleted genes by using statistical analyses and computa-
tional tools
Introduction
7
33..33 TTHHEEOORREETTIICCAALL BBAACCKKGGRROOUUNNDD OONN YYEEAASSTT MMEETTAABBOOLLIISSMM
S. cerevisiae is one of the most important species for biotechnological production and a most
relevant eukaryotic model organism. Yeast metabolism and growth are adapted to the avail-
ability of carbon source, in particular, to the type of carbon source for e.g., glucose, galactose
or fructose. Metabolism refers to the biochemical assimilation and dissimilation of nutrients
by the cells. Assimilatory, anabolic pathways are energy consuming, reductive processes
which lead to the biosynthesis of new cellular material. Whereas, dissimilatory, catabolic
pathways are oxidative processes, which remove electrons from intermediates and use these
to generate energy (Berg et al., 2002).
33..33..11 GGlluuccoossee mmeettaabboolliissmmThe major energy source in yeast is glucose and metabolises to produce energy in the form of
adenosine triphosphate (ATP). When ATP is hydrolysed to yield adenosine diphosphate
(ADP) and inorganic phosphate (Pi), the energy released is used by the cell for various reac-
tions and transformations.
33..33..11..11 GGllyyccoollyyssiiss
Glucose is metabolized in a series of steps known as Emben-Meyerhof-Parnas (EMP) path-
way or glycolysis in cytosol. Glycolysis provides yeast with energy, together with precursor
molecules and reducing power for biosynthetic pathways. Through a set of biochemical reac-
tions, metabolism of glucose eventually yields two pyruvate molecules. In the first stage glu-
cose is converted into fructose 1,6-bisphosphate by phosphorylation and isomerisation reac-
tions. Two ATP molecules are consumed per glucose molecule in these reactions. In the sec-
ond stage, fructose 1,6-bisphosphate is cleaved by aldolase into interconvertible dihydroxya-
cetone phosphate and glyceraldehyde 3-phosphate. In the third stage, ATP is generated when
glyceraldehyde 3-phosphate is converted to 3-phosphoglycerate. A phosphoryl shift and a
dehydration form phosphoenolpyruvate. Another molecule of ATP is formed when phos-
phoenolpyruvate is converted into pyruvate. There is a net gain of two molecules of ATP, and
NADH in the formation of two molecules of pyruvate from one molecule of glucose. The
glycolytic pathway is controlled by the regulation of the three irreversible reactions catalysed

Introduction
8
by hexokinase, phosphofructokinase and pyruvate kinase. The overall reaction of glycolysis
is (Berg et al., 2002)
OHHNADHATPOHCNADADPPOHC i 23436126 22222222
33..33..11..22 TTCCAA ccyyccllee
The pyruvate can enter either the Krebs cycle or tri carboxylic acid (TCA) cycle for complete
oxidation and production of carbon dioxide and adenosine triphosphate (ATP) under aerobic
conditions or it can be converted to fermentation products i.e., ethanol. The TCA cycle occurs
in the mitochondria of eukaryotic cells. The TCA cycle is responsible for the production of
reducing equivalents, required for ATP formation, and also for supplying biosynthetic pre-
cursors. The reducing equivalents are produced during the oxidation of carbon compounds.
The pyruvate produced by the glycolytic pathway from glucose easily enters the matrix of the
mitochondria. The pyruvate is than converted to a two-carbon fragment with the loss of the
carboxyl group as CO2 and this two carbon fragment attaches to a coenzyme known as coen-
zyme-A (CoA) forming acetyl-CoA. This reaction is catalyzed by pyruvate dehydrogenase.
Oxaloacetate reacts with acetyl-CoA and H2O to yield citrate and CoA by aldol condensation
followed by hydrolysis and is catalysed by citrate synthase. Citrate is isomerised to isocitrate,
catalysed by aconitase, accomplished by dehydration and hydration steps. Isocitrate is oxi-
dised and decarboxylated to –ketoglutarate by isocitrate dehydrogenase and this reaction
generates the first high-transfer-potential electron carrier, NADH. –ketoglutarate is oxida-
tive decarboxylated to yield succinyl CoA by –ketoglutarate dehydrogenase complex and
generates the second NADH. Succinyl CoA synthase catalyses the formation of succinate
from the energy-rich thioester compound, succinyl CoA and generates guanine triphosphate
(GTP), a compound with high-phosphoryl transfer capacity. Succinate is oxidised to fumarate
by succinate dehydrogenase and generates FADH2. Fumarate is hydrated to malate by fu-
marase. Finally, malate is oxidised to form oxaloacetate by malate dehydrogenase and gener-
ate the third NADH. A complete turn of the cycle results in the oxidation of the two carbon
fragment and formation of reducing equivalents. The TCA cycle is regulated by the activities
of the enzymes pyruvate dehydrogenase, citrate synthase, isocitrate dehydrogenase, -
ketoglutarate dehydrogenase and malate dehydrogenase (Berg et al., 2002). The net reaction
of the citric acid cycle is
Introduction
9
CoAHGTPFADHNADHCOOHPGDPFADNADAcetylCoA i 23223 222
33..33..11..33 OOxxiiddaattiivvee pphhoosspphhoorryyllaattiioonn
The NADH and FADH2 produced from glycolysis and TCA cycle are reoxidised to form
NAD+ and FAD through a complicated series of reactions known as oxidative phosphoryla-
tion and generate energy in the form of ATP for the cellular requirements. In eukaryotes oxi-
dative phosphorylation occurs in the mitochondrial compartment via the electron transport
assembly. The electron transport assembly is comprised of a series of protein complexes that
catalyze sequential oxidation reduction reactions. This process is facilitated by a proton car-
rier in the inner mitochondrial membrane known as ATP synthase. These reactions involve
the transfer of electrons through cytochromes with the ultimate electron acceptor being oxy-
gen to form water. Because of the need of oxygen, these reactions are active only under aero-
bic conditions. ATP will be produced from these reactions by a membrane-bound enzyme
ATPase at a rate of maximum 3 ATP molecules per a molecule of NADH oxidized (maxi-
mum 2 ATP molecules per a molecule of FADH2 oxidised). The oxidative phosphorylation is
controlled by the availability of ADP. Higher amount of ADP drives the process faster, as the
cells require more ATP (Berg et al., 2002).
33..33..11..44 PPeennttoossee pphhoosspphhaattee ppaatthhwwaayy ((PPPPPP))
The PPP generates necessary reducing equivalents, NADPH, pentose and erythrose carbon
units for the biosynthetic requirements of the cell. This pathway consists of two phases: the
oxidative generation of NADPH and non-oxidative interconversion of three-, four-, five-, six-
and seven-carbon molecules and results in the synthesis of five carbon sugars and connecting
the PPP with glycolysis. The first reaction in the oxidative phase is the dehydrogenation of
glucose 6-phosphate to 6-phosphoglucono- -lactone by glucose 6-phosphate dehydrogenase.
The next step is the conversion of 6-phosphoglucono- -lactone to 6-phosphogluconate by
lactonase. This six-carbon sugar is then oxidatively decarboxylated by 6-phosphogluconate
dehydrogenase to yield ribulose 5-phosphate. Two molecules of NADPH are generated from
these biochemical reactions. The net reaction of oxidative phase is (Berg et al., 2002)
22 22526cos COHNADPHphosphateRiboseOHNADPphosphateeGlu
Introduction
10
In non-oxidative phase, phosphopentose isomerase isomerizes ribulose 5-phosphate to ribose
5-phosphate and phosphopentose epimerase converts to xylulose 5-phosphate. Glyceralde-
hyde 3-phosphate and sedoheptulose 7-phosphate are generated by the transketolase and then
react to form fructose 6-phosphate and erythrose 4-phosphate by transaldolase. In the next
reaction, transketolase catalyses the synthesis of fructose 6-phosphate and glyceraldehyde 3-
phosphate from erythrose 4-phosphate and xylulose 5-phosphate. The first step of the oxida-
tive branch by the enzyme glucose 6-phosphate dehydrogenase, which is irreversible acts as
the main regulatory control for the pathway. The activity of this enzyme is determined by the
ratio of NADP+/NADPH. The net reaction of non-oxidative phase is (Berg et al., 2002).
phosphatehydeglyceraldephosphatefructosephosphateRibose 36253
33..33..11..55 FFeerrmmeennttaattiioonn
Several biotechnologically important yeasts are fermentative i.e., organisms which use or-
ganic substrates anaerobically as electron donor, electron acceptor and carbon source. When
oxygen is not available, the ability of the cell to reoxidise the reduced coenzymes (NADH
and FADH2) is greatly diminished. To compensate, the biochemistry of the cell is altered
such that pyruvate is decarboxylated by pyruvate decarboxylase to acetaldehyde and then to
ethanol by alcohol dehydrogenase in the fermentation process, which requires NADH. Thus,
the formation of ethanol allows the cell to reoxidise the NADH that was produced in earlier
steps of glycolysis (Eberhardt et al., 1999).
OHCOATPOHHCADPPOHC i 22526126 222222
Central carbon metabolic network model is depicted in figure 3-1, representing major path-
ways, i.e., glycolysis, TCA cycle, pentose phosphate pathway, anaplerotic pathway and fer-
mentation pathway.

Introduction
11
Figure 3-1 Metabolic network model in S. cerevisiae representing the major pathways incentral carbon metabolism; glycolysis, TCA cycle, pentose phosphate pathway, anapleroticpathway and fermentation pathway G6P - Glucose 6-phosphate, R5P – Ribose 5-phosphate,F6P – Fructose 6-phosphate, E4P – Erythrose 4-phosphate, DHAP – Dihydroxyacetonephosphate, GAP – Glyceraldehyde 3-phosphate, S7P – Sedoheptulose 7-phosphate, 3PG – 3-phosphoglycerate, PEP – Phosphoenol pyruvate, PYR – Pyruvate, AcCoA – Acetyl CoA,CIT – Citrate, AKG - -ketoglutarate, SUC – Succinate, OAA – Oxaloacetate, BM – Bio-mass
33..33..11..66 CCrraabbttrreeee eeffffeecctt
The Crabtree effect is a phenomenon, where at high glucose concentrations (>9 g/L) fermen-
tative metabolism and ethanol production continue to occur even in the presence of oxygen.
Here, NADH generated from the glycolysis is reoxidised by producing ethanol rather than the
combined pathways of respiration i.e., glycolysis, TCA cycle and oxidative phosphorylation.
The Crabtree effect may be due to a saturation of the limited respiratory capacity of yeast
cells. Thus glucose sensitive yeasts like S. cerevisiae i.e., Crabtree-positive yeast, may pos-
sess a limited oxidative capacity when grown on glucose which leads to an overflow reaction
at the pyruvate branch (Figure 3-2). This respiratory bottleneck in yeast indicates overflow
metabolism of glucose to ethanol when the respiratory capacity is saturated either due to glu-

Introduction
12
cose overload, the Crabtree Effect or to anaerobic conditions, the Pasteur Effect (Barwald and
Fischer, 1996).
Figure 3-2 Schematic representation of overflow metabolism at pyruvate branch in S. cere-
visiae
33..33..11..77 CCaarrbboonn ccaattaabboolliittee rreepprreessssiioonn
Glucose and fructose are the most preferred carbon substrates for yeast. When one of these
sugars is present, the enzymes required for the utilization of alternative carbon sources are
synthesized at low rates or not at all. This phenomenon is called “carbon catabolite repres-
sion” or most commonly “glucose repression”. Glucose may affect enzyme levels by causing
a decrease in the concentration of corresponding mRNAs, a decrease in their translation rate,
or an increase in the degradation rate of the protein. The main effect of glucose takes place at
the transcriptional level as the control of mRNA translation rate is not common in yeast
(Gancedo, 1998). Glucose and other repressing sugars can affect the rate of transcription by
two basic mechanisms; they interfere with activators of transcription, or they facilitate the
action of proteins with a negative effect on transcription (Gancedo, 1998).

Introduction
13
33..33..22 GGaallaaccttoossee mmeettaabboolliissmmThe galactose metabolic pathway is commonly known as Leloir pathway. S. cerevisiae con-
tains genes, which code for regulatory proteins for a number of metabolic pathways (Sellik et
al., 2008). This group of regulatory proteins acts as both positive as well as negative regula-
tory proteins. Galactose utilization consists of a biochemical pathway that converts galactose
into glucose-6-phosphate and a regulatory mechanism that controls whether the pathway is on
(in the presence of galactose) or off (in the absence of galactose). Several regulatory genes
are present, which code for these enzymes devoted to convert galactose to glucose phosphate.
The four enzymes are, galactokinase (coded by the gene, GAL1), uridylyltransferase (coded
by the gene, GAL7), epimerase (coded by a gene, GAL10), and phosphoglucomutase (coded
by the gene, GAL5/PGM2). These four genes are located on chromosome II of yeast cells. A
transporter gene (coded by the gene, GAL2) encodes a permease that transports galactose into
the cell. This gene is located on chromosome XII. Galactose acts as inducer in expressing all
the genes by a modulator called Gal4p. All the genes are never expressed unless Gal4p is
present in a cell. Hence, it’s a key player in gene regulation and plays a significant role in the
utilization of galactose. The Gal4p acts as positive regulator. It acts by binding to a specific
DNA sequence upstream from the site of initiation and transcription of the GAL1, GAL7 and
GAL10 genes (Platt and Reece, 1998) (Figure 3-3).
(A) (B)
Figure 3-3 Regulation of galactose metabolism. (A) When there is no galactose, the tran-scription of GAL genes is repressed by Gal80p by binding to the active site on Gal4p (B) Inthe presence of galactose, the repression on Gal4p by Gal80p is relieved by inducers, Gal3p,ATP and galactose
The regulatory genes GAL3, GAL4, and GAL80 exert tight transcriptional control over the
transporter, the enzymes, and to a certain extent, each other. Gal4p is a DNA-binding factor
that can strongly activate transcription, but in the absence of galactose, Gal80p binds Gal4p

Introduction
14
and inhibits its activity. When galactose is present in the cell, it causes Gal3p to associate
with Gal80p. This association causes Gal80p to release its repression of Gal4p, so that the
transporter and enzymes are expressed at a high level (Figure 3-3). In the presence of galac-
tose, genes for galactose utilizing enzymes are turned on and transcription is switched off
when galactose is absent (Ostergaard et al., 2001) (Figure 3-4). Although these genes and
interactions form the core of the GAL pathway, the complete regulatory mechanism is more
complex and involves genes whose roles in galactose utilization are not entirely clear. For
instance, the gene GAL6 (LAP3) functions predominantly in a drug-resistance pathway, but
can suppress transcription of the GAL transporter and enzymes under certain conditions and
may itself be transcriptionally controlled by GAL4.
Figure 3-4 In the presence of glucose, the transcription of GAL genes is repressed by a rep-ressor complex involving Tup1p, Ssn6p and Mig1p
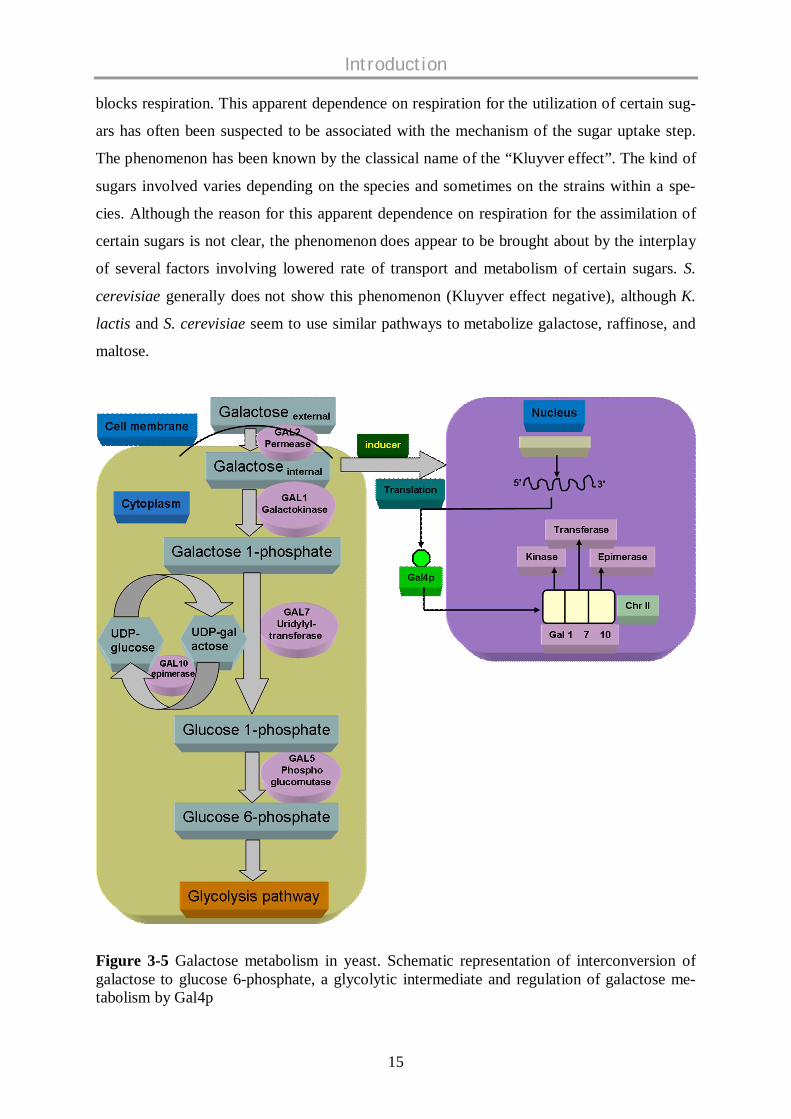
In this galactose-glucose interconversion pathway, galactose is phosphorylated to galactose
1-phosphate by galactokinase. Galactose 1-phosphate acquires an uridyl group from UDP-
glucose, an intermediate in the synthesis of glycosidic linkages, and produces UDP-galactose
and glucose 1-phosphate by galactose 1-phosphate uridyl transferase. The galactose moiety of
UDP-galactose is then epimerized to glucose by UDP-galactose 4-epimerase (Schulz et al.,
2004). Glucose 1-phosphate is isomerized to glucose 6-phosphate by phosphoglucomutase
and later on funnelled to glycolytic pathway (Figure 3-5). In many yeast species, growth on
certain sugars (such as galactose, raffinose, and maltose) occurs only under respiratory condi-
tions (Goffrini et al., 2002). That means yeast species can grow on these sugars aerobically,
but they cannot grow anaerobically or in the absence of respiration (Entian et al., 1983; Gof-
frini et al., 1989, 1996; Sims et al., 1978). Assimilation of these sugars occur only under re-
spiring conditions i.e., growth does not take place if inhibitors, mutation, or anaerobiosis
Introduction
15
blocks respiration. This apparent dependence on respiration for the utilization of certain sug-
ars has often been suspected to be associated with the mechanism of the sugar uptake step.
The phenomenon has been known by the classical name of the “Kluyver effect”. The kind of
sugars involved varies depending on the species and sometimes on the strains within a spe-
cies. Although the reason for this apparent dependence on respiration for the assimilation of
certain sugars is not clear, the phenomenon does appear to be brought about by the interplay
of several factors involving lowered rate of transport and metabolism of certain sugars. S.
cerevisiae generally does not show this phenomenon (Kluyver effect negative), although K.
lactis and S. cerevisiae seem to use similar pathways to metabolize galactose, raffinose, and
maltose.
Figure 3-5 Galactose metabolism in yeast. Schematic representation of interconversion ofgalactose to glucose 6-phosphate, a glycolytic intermediate and regulation of galactose me-tabolism by Gal4p

Introduction
16
33..33..33 FFrruuccttoossee mmeettaabboolliissmmIn yeast, fructose is metabolized by the fructose 6-phosphate pathway. Fructose is phosphory-
lated to fructose 6-phosphate by hexokinase (HXK1 gene) enzyme and then converted to fruc-
tose 1, 6-bisphosphate by 6-phosphofructokinase (PFK1 gene) enzyme. A specific fructose
bisphosphate aldolase (FBA1 gene) enzyme converts fructose 1, 6-bisphosphate to glyceral-
dehyde 3-phosphate and DHAP. Glyceraldehyde 3-phosphate is funnelled into glycolytic
pathway and further metabolized (Berg et al., 2002) (Figure 3-6).
Figure 3-6 Fructose metabolism in yeast. Schematic representation of interconversion offructose to glyceraldehyde 3-phosphate, a glycolytic intermediate
33..33..44 HHeexxoossee ttrraannssppoorrtteerrss ((HHXXTTss))The most preferred hexose carbon sources of yeast are glucose, fructose and mannose. At
very high concentrations of these sugars, glycolytic flux rates can attain very high levels lead-
ing to alcohol production even in the presence of oxygen. Yeast has a broad range of hexose
concentration tolerance, ranging from 1.5 M to micro-molar concentrations and exhibits char-
acteristic responses to changes in the environmental sugar concentrations. Among hexoses,
glucose is the most preferred carbon and energy source and its transport into the cells exerts a
high control on the glycolytic flux. Glucose can also act as a “growth hormone” to regulate
Introduction
17
several aspects of cell growth, metabolism and development and it triggers regulatory
mechanisms that are responsible for rapid changes in the activity of proteins and for slower
changes in the expression level of specific proteins. But how a cell senses glucose and signal
transduction, how this signal affects cellular processes and how optimal utilization of the
sugar is achieved are still unknown mechanisms. Defects in glucose sensing, signalling and
metabolism cause the severe metabolic disorders in mammals known as diabetes. Thus, it is
of major interest to understand these processes.
The first and essential step in hexose utilization is the transport of sugar molecules across the
plasma membrane into the cells. Hexose transport is mediated by two different mechanisms,
carrier mediated facilitated diffusion, which is energy independent and transports its sub-
strates down a concentration gradient and active proton-sugar symport systems, which is en-
ergy dependent and couples the uptake of glucose molecules to the uptake of protons. Yeast
has 20 different genes related to hexose sensors and transporters, which belong to major fa-
cilitator super family (MFS) of transporters (Ko et al., 1993). This includes
Hexose sensors - Snf3p and Rgt2p;
Galactose transporter - Gal2p;
Low affinity transporters - Hxt1p, Hxt3p;
Moderate affinity transporter – Hxt5p
High affinity transporters – Hxt2p, Hxt4p, Hxt6p, Hxt7p;
Pleiotropic drug resistance (PDR) process - Hxt9p and Hxt11p;
Unknown transporters – Hxt8p, Hxt10p, Hxt12p to Hxt17p;
33..33..44..11 HHeexxoossee sseennssoorrss
SNF3 and RGT2 have only limited sequence similarities to the other hexose transporters.
Snf3p serves as a regulatory signal (Liang et al., 1996) rather than nutritional uptake and
Snf3p functions as a sensor for low concentrations of glucose. RGT2 is 60 % identical to
SNF3 and is located 100 kb downstream of SNF3 on chromosome IV and functions as a sen-
sor for high concentrations of glucose (Moriya and Johnston, 2003).

Introduction
18
33..33..44..22 GGaallaaccttoossee ttrraannssppoorrtteerr
The deletion of GAL2, the gene coding for the transporter of galactose, which is located on
chromosome XII, causes poor growth on galactose medium (Tscopp et al., 1986; Nehlin et
al., 1989). HXT6 and HXT7 are 71.8% identical to GAL2.
33..33..44..33 LLooww aaffffiinniittyy hheexxoossee ttrraannssppoorrtteerrss
HXT1 is located on chromosome VIII. Hxt1p has extremely low-affinity for glucose, fructose
and mannose (Km (glucose) = 100 mM; Km (fructose) > 300 mM). HXT3 is located on chro-
mosome IV and 86.4% identical to HXT1. Hxt3p is also a low-affinity hexose transporter
with a very high Km for glucose (60 mM). Induction of HXT3 is independent of sugar concen-
tration and is expressed only on glucose medium. HXT4 is located on chromosome VIII, just
downstream of HXT1 and 83.4% identical to HXT6 and HXT7. Hxt4p has a moderately low
affinity for glucose (Km about 9 mM) and a low affinity for fructose (Km about 50 mM).
33..33..44..44 HHiigghh aaffffiinniittyy hheexxoossee ttrraannssppoorrtteerrss
HXT6 and HXT7 are highly similar and located on chromosome IV, downstream of HXT3.
These are high-affinity glucose transporters (Km about 1-2 mM). Hxt9p, Hxt11p and Hxt12p
are very closely related proteins with similar regulatory signals and located on chromosomes
X, XV and IX respectively. HXT9 and HXT11 are weakly expressed and are not regulated by
the carbon source. These have been found to be involved in the pleiotropic drug resistance
(PDR) process. Hxt5p and Hxt8p do not contribute significantly to catabolite glucose trans-
port. HXT5 is located on chromosome VIII, just upstream of HXT1 and HXT4. HXT8 is lo-
cated on chromosome X. HXT13, HXT15, HXT16 and HXT17, which are located on chromo-
somes V, IV, X and XIV respectively are closely related hexose transporter proteins and dis-
tantly related to the other members of the Hxtp family. Actual function of these transporters
is not known yet. Deletion of these genes did not cause any obvious growth phenotype.
33..33..44..55 GGlluuccoossee sseennssiinngg mmeecchhaanniissmmss iinn yyeeaasstt
In yeast, glucose is not only the most preferred carbon and energy source but also an impor-
tant primary messenger molecule, a global regulator of metabolism and signalling optimal
growth conditions to the cellular machinery (Rolland et al., 2002). Moreover, the major trans-
porters are also regulated at transcriptional level by the extracellular glucose concentration

Introduction
19
(Özcan et al., 1999). There are three different glucose sensing systems in yeast. Each system
senses the extracellular glucose and transmits the signal to the appropriate effectors differ-
ently.
1) Main glucose repression pathway. When glucose concentration is high, Snf1p pro-
tein kinase represses the expression of many genes involved in utilization of alterna-
tive carbon sources via Snf1-Mig1 glucose repression pathway (Gancedo et al., 1998;
Carlson et al., 1999; Kuchin et al., 2000, 2002).
2) Snf3/Rgt2 pathway. Snf3 and Rgt2 sensors induce expression of genes encoding
hexose transporters in the presence of glucose via Snf3-Rgt2-Rgt1 glucose induction
pathway (Johnston et al., 1999). Rgt1, a zinc-finger-containing DNA binding tran-
scriptional factor, is an ultimate target of this pathway. In the absence of glucose,
Rgt1p recruits the Ssn6p repressor complex to the promoters of specific genes (Ozcan
et al., 1996) and binds and represses the expression of both intermediate and low af-
finity HXT genes with the help of two paralogous proteins, Mth1p and Std1p (Schmidt
et al., 1999; Lafuente et al., 2000). Even low amounts of glucose inhibits the repressor
function of Rgt1p in the presence of Grr1p protein (Ozcan et al., 1995), resulting in
derepression of expression of HXT genes. In order to act as an activator, removal of
Mth1p and Std1p as well as phosphorylation of Rgt1p is required. The glucose signal
mediated by Snf3p and Rgt2p sensors inhibits Rgt1-mediated repression by stimulat-
ing the degradation of Mth1p and Std1p (Flick et al., 2003; Li et al., 1997).
3) Gpr1/Gpa2 pathway. The glucose signal mediated by G-protein-coupled receptor
Gpr1 and cyclic AMP as a second messenger (Thevelein et al., 1998; Rolland et al.,
2002) leads to activation of protein kinase A, which phosphorylates Rgt1p and re-
leases the repression of HXT genes (Kaniak et al., 2004; Ozcan et al., 1996).
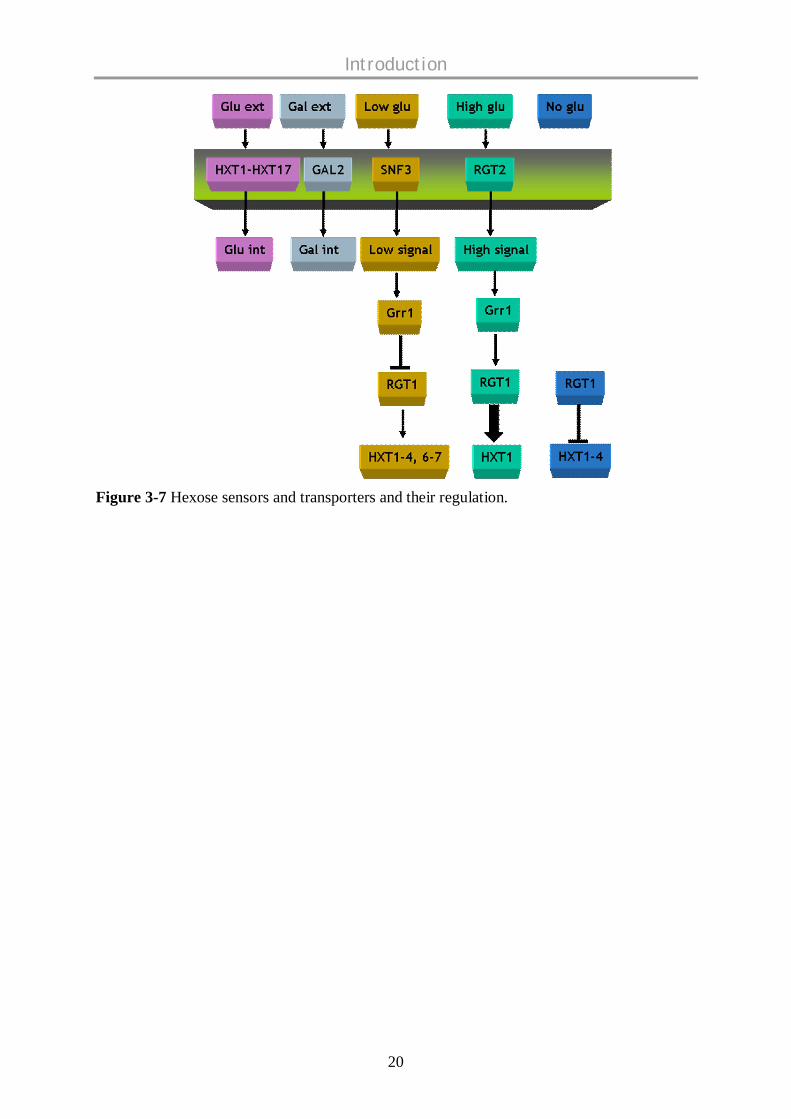
Figure 3-7 representing the hexose sensors and transporters and their regulation according to
the glucose levels (Ozcan and Johnston, 1995).
Introduction
20
Figure 3-7 Hexose sensors and transporters and their regulation.

Materials and methods
21
44.. MMAATTEERRIIAALLSS AANNDD MMEETTHHOODDSS
44..11 YYEEAASSTT SSTTRRAAIINNSS
S. cerevisiae deletion mutants with parental genotype of BY4742 Mat his3 1 leu2 0
lys2 0 ura3 0 were obtained from Open Biosystems (Heidelberg, Germany). These strains
exhibit auxotrophy for lysine, leucine, histidine, and uracil, and are resistant to the antibiotic
geneticin. From this collection, the parental strain, which was used as the reference strain,
and a set of deletion mutants, where genes are known to be involved in central carbon me-
tabolism, amino acid biosynthesis and a few strains with unknown function were chosen.
44..22 MMEEDDIIAA CCOOMMPPOOSSIITTIIOONN
Freeze cultures were revived on YPD agar plates with 200 mg L-1 geneticin. First precultiva-
tions were carried out in complex medium. Second precultivations and main cultivations
were carried out in defined medium. The media compositions are as follows. Vitamin and
trace element stock solutions, and stock solutions for lysine, leucine, histidine, and uracil,
respectively, were sterilized by filtration. All other solutions were sterilized by autoclaving
(15 min, 121 °C).
Table 4-1. YPD agar medium composition
Component Concentration (g/L)
Yeast extract 10Peptone 20Glucose 20Agar 20
Table 4-2. Complex medium composition
Component Concentration (g/L)Glucose monohydrate 11Yeast extract 3Peptone 5Malt extract 3

Materials and methods
22
Table 4-3. Defined medium composition
Component Concentration (g/L)(NH4)2HPO4 1.0(NH4)2SO4 8.75MgSO4·7H2O 1.0Citric acid 0.025KCl 1.1CaCl2·2H2O 0.15Glucose monohydrate 22.0Lysine 0.12Leucine 0.12Histidine 0.08Uracil 0.08Component Concentration (ml/L)0.5 M Na-phosphate buffer (pH 6) 100100x Trace element solution 10100x Vitamin solution 10
Table 4-4. 100x Trace element solution (pH <2)
Component Concentration(mg/50ml)
FeCl3·6H2O 75MnSO4·H2O 53ZnSO4·7H2O 45CuSO4·5H2O 12
Table 4-5. 100x Vitamin solution
Component Concentration(mg/50ml)
myo-inositol 301.5Ca-pantothenic acid 150Thiamin hydrochloride 30Pyridoxine hydrochloride 7.5Biotin 0.15
44..33 DDEEFFIINNEEDD MMEEDDIIUUMM OOPPTTIIMMIIZZAATTIIOONN
In order to obtain quantitative data for phenotypic profiling, reproducible and defined cultiva-
tion of the examined deletion mutants of S. cerevisiae was required. For this purpose a de-
fined medium was developed. Mutants exhibit auxotrophy for the amino acids lysine, leucine
and histidine and for uracil. To investigate the optimum amino acid concentrations required
for good growth of deletion mutants, growth experiments were carried out with YML054C
strain with different amino acid concentrations in the medium as follows, one fold concentra-

Materials and methods
23
tion of lysine, leucine (each 30 mg/L) & histidine, uracil (each 20 mg/L), two fold, four fold,
six fold and eight fold concentrations. Figure 4-1 shows that four-fold concentration of ly-
sine, leucine (each 120 mg/L) & histidine, uracil (each 80 mg/L) was optimal for good
growth. Defined medium with this composition was used for cultivation in all experiments.
0.0
0.5
1.0
1.5
2.0
2.5
3.0
3.5
4.0
4.5
5.0
0 2 4 6 8 10 12 14
Time (h)
OD 6
60nm
1 fold2 fold4 fold6 fold8 fold
Figure 4-1 Medium optimization. Strain YML054C was grown in 96-well microtiter platewith different amino acid concentrations in the defined medium. Cultivation profile with one,two, four, six and eight fold concentrations of lysine, leucine, histidine and uracil.
44..44 CCUULLTTIIVVAATTIIOONN
Cultivations were carried out either in shake flasks (SFC) or in microtiter plates (MTP).
44..44..11 SShhaakkee ffllaasskk ccuullttuurreessInitially revived cells from YPD agar plates were inoculated into 5 ml complex medium and
grown in 50 ml baffled shake flask at 30° C, 250 rpm (INFORS AG, Bottmingen-Basel,
Switzerland) for 12 h. Subsequently, cells were harvested by centrifugation (Labofuge 400 R,
Functionline, Heraeus Instruments, Bensheim, Germany) at 4° C, 3000 x g for 15 min in Fal-
con tubes with rotor 8172, and washed two times with sterile 0.9 % (w/v) NaCl. Hundred
microliters of the obtained cell suspension was then inoculated into 5 ml defined preculture
medium and grown as described above. Prior to main cultivation the inoculum was harvested
by centrifugation and washed as described above. Resulting pellet was resuspended in 1 ml
defined medium. Main cultivations were carried out in 100 ml baffled shake flasks with 10
ml defined medium and cultivated as described above.

Materials and methods
24
44..44..22 CCrroossss ccoonnttaammiinnaattiioonn cchheecckk iinn MMTTPPParallel handling of large number of strains in microtiter plate could lead to cross contamina-
tion risk. To check this, a cultivation experiment was carried out with the reference strain at
both high (1020 rpm) and low (540 rpm) shaking rates for 24 h. The microtiter plate layout
was, only the center four wells were inoculated and the surrounding wells were filled with
medium (Figure 4-2A). Only the inoculated wells showed increased optical density, which
confirmed that there was no cross contamination at both the shaking rates (Figure 4-2B).
(A)
(B)
Figure 4-2 Cross contamination check. (A) Microtiter plate layout. (B) The reference strainwas cultivated at low, 540 rpm (left panel) and high, 1020 rpm (right panel) shaking rates for24 h.

Materials and methods
25
44..44..33 MMiiccrroottiitteerr ppllaattee ccuullttuurreessFor microtiter plate cultivations, precultivations were carried out in 96 well microtiter plates
(Greiner bio-one, Frickenhausen, Germany) with 250 µl per well. The outermost wells of the
plate were not used for cultivation because of higher evaporation in these wells (John et al.,
2003). All wells not used for cultivation were filled with water. The microtiter plate was ad-
ditionally covered with a lid. Cells were incubated for 12 h in a fluorescence reader (Fluoros-
kan Ascent, Thermo Labsystems, Helsinki, Finland) at 30° C and 1020 rpm (orbital) with a
shaking diameter of 1 mm. Cells were harvested by centrifugation (Labofuge 400 R, Func-
tionline, Heraeus Instruments, Bensheim, Germany) at 4° C, 1660 x g for 10 min directly in
MTP with rotor 8177, and washed two times with sterile 0.9 % (w/v) NaCl. Ten micro liters
of the obtained cell suspension was then inoculated into 250 µl defined preculture medium
and grown as described above. Prior to main cultivation the inoculum was harvested by cen-
trifugation and washed as described above. The resulting pellet was re-suspended in 200 µl
defined medium. Main cultivations were carried out in 96 well microtiter plates with immobi-
lized oxygen sensors (Oxoplate F96, PreSens GmbH, Regensburg, Germany) with 150 µl
defined medium per well.
44..55 AANNAALLYYTTIICCSS
The following analytical methods were employed to calculate the sugar concentrations, opti-
cal density and dissolved oxygen measurements.
44..55..11 SSuuggaarrss aanndd eetthhaannooll mmeeaassuurreemmeennttssEnzyme assays were applied for the determination of glucose, fructose and ethanol (Boe-
hringer–Mannheim, R-Biopharm GmbH, and Germany). Galactose was quantified by HPLC
(Bio-Tek, Neufahrn, Germany) with an Aminex HPX 87-H column (300 x 7.8 mm; Bio-Rad,
Hercules, California) and 0.05 N H2SO4 as an eluent with a flow rate of 0.8 ml/min at 45° C
and UV detection at 210 nm.
44..55..22 OOppttiiccaall ddeennssiittyy mmeeaassuurreemmeennttssGrowth was monitored via optical density either at 660 nm (OD660) with a spectrophotometer
(Novaspec II, Pharmacia Biotech, Cambridge, England) or at 620 nm (OD620) with an ab-

Materials and methods
26
sorbance reader (iEMS Ascent, Thermo Labsystems, Helsinki, Finland) directly in the
Oxoplate. The obtained correlation between the absorbance reader signals and spectropho-
tometer measurements is not linear. For calibration, a growth experiment was carried out with
strain YML054C in a 96-well Oxoplate as described above for 16 h. Parallel OD measure-
ments were taken for every 1 h directly in the Oxoplate in the absorbance reader (OD620) and
in the spectrophotometer (OD660). A calibration curve was obtained between undiluted reader
signals and diluted spectrophotometer measurements (Figure 4-3). Thus OD values measured
in an absorbance reader can be directly converted to the corresponding diluted OD660 values
by using this calibration curve and equation 4-1.
5620
4620
3620
2620620660
53.15
76.3105.1678.671.462.0
OD
ODODODODOD corrected
(Eq 4-1)
Figure 4-3 Calibration curve for on-line measurement of OD. Strain YML054C was grownin 96-well microtiter plate and parallel OD measurements were taken in the absorbancereader (OD620) and in the spectrophotometer (OD660).
Biomass dry weight (BDW) was determined from corrected OD660 after calibration. For this
purpose, the reference strain was cultivated in a shake flask and dry cell weight was deter-
mined gravimetrically. For this purpose, 10 ml of culture was centrifuged at 4 o C for 10 min
at 10,000 rpm, washed twice with 0.9 % NaCl and then with water and centrifuged again.
Washed cells were dried at 80 o C to constant weight (Kiefer et al., 2002).
Y = 0.62 - 4.71X + 6.78X2 + 16.05X3 - 31.76X4+ 15.53X5
0.2 0.3 0.4 0.5 0.6 0.7 0.8 0.9 1.00.0
0.5
1.0
1.5
2.0
2.5
Reader signal
0.2 0.3 0.4 0.5 0.6 0.7 0.8 0.9 1.00.0
0.5
1.0
1.5
2.0
2.5
Spec
trop
hoto
met
er m
easu
rem
ents
, OD
660n
m
Reader signal, OD620nm
Y = 0.62 - 4.71X + 6.78X2 + 16.05X3 - 31.76X4+ 15.53X5
0.2 0.3 0.4 0.5 0.6 0.7 0.8 0.9 1.00.0
0.5
1.0
1.5
2.0
2.5
Reader signal
0.2 0.3 0.4 0.5 0.6 0.7 0.8 0.9 1.00.0
0.5
1.0
1.5
2.0
2.5
Spec
trop
hoto
met
er m
easu
rem
ents
, OD
660n
m
Reader signal, OD620nm

Materials and methods
27
The correlation factor (g biomass/OD660) between dry cell weight and OD660 was 0.498.
Biomass dry weight can be obtained by using the equation 4-2,
correctedODBDW 660498.0 (Eq 4-2)
44..55..33 DDiissssoollvveedd ooxxyyggeenn mmeeaassuurreemmeennttssThe use of microtiter plates with immobilized oxygen sensors allows on-line monitoring of
dissolved oxygen concentrations during cultivation. The OxoPlate F96 is a sterile polystyrene
microplate (PRESENS, Germany) with 96 integrated sensors and is calibration-free (Figure
4-4).
Figure 4-4 Oxoplate F96, 96-well round bottom microtiter plate with an immobilized oxygensensor.
High accuracy is assured using two different dyes to get an internal referenced signal. Be-
cause these two dyes are immobilized in a thin hydrophilic matrix (10 µm thickness) of the
OxoPlate, response times are very low. The fluorescent intensities were measured with the
fluorescence filter combinations 544/644 nm and 544/590 nm. The first one was depending
on oxygen concentration; the latter was a reference signal, which was independent of oxygen
concentration. The relationship between fluorescence intensity and dissolved oxygen concen-
tration is nonlinear and described by the Stern – Volmer equation for collision quenching
(Equation 4-3) (John et al., 2003),
OKII
svor
r
11
,
(Eq 4-3)

Materials and methods
28
O - Dissolved oxygen concentration
I r, o - Fluorescence intensity in the absence of O;
I r, - Fluorescence intensity at O
Ksv - Stern-Volmer constant
44..55..44 MMaalliicc eennzzyymmee aaccttiivviittyyPreparation of cell extracts and determination of malic enzyme activity was carried out as
described by Boles et al. (1998) with slight modifications. Extracts were not dialysed. Cells
were disrupted by sonication with 0.5-mm-diameter glass beads at 0 C for 3 min (15-s inter-
vals with 15-s resting time), using an MSE sonicator (Soniprep 150 with 150-W output,
10µm peak-to-peak amplitude).
44..66 SSIIMMUULLAATTIIOONNSS
The following simulations were carried out to estimate oxygen mass transfer coefficient and
to correct ethanol and water evaporation during the cultivation.
44..66..11 DDyynnaammiicc ooxxyyggeenn mmaassss ttrraannssffeerr ccooeeffffiicciieenntt ((kkLLaa))Oxygen uptake rate can be determined from a stationary liquid phase oxygen balance,
OUR-akdtd
L OOO (Eq 4-4)
where O* and O are the dissolved oxygen concentrations in the liquid phase and in equilib-
rium with the gas phase respectively, kLa is the volumetric liquid phase mass transfer coeffi-
cient and OUR is the oxygen uptake rate.
The volumetric liquid phase mass transfer coefficient, kLa was determined experimentally in
Oxoplates in 200 µL at 540 rpm by using sodium dithionite method as described previously
(John et al., 2003). In brief, dissolved oxygen was initially depleted by addition of 2 % (w/w)
sodium dithionite solution in 0.1 M sodium carbonate solution. Due to fast chemical reaction,
oxygen reaction rate was much greater than the air–liquid oxygen transfer. After consumption
of dithionite, oxygen reaction rate became zero and oxygen started to accumulate in the me-
dium. In this phase, kLa was estimated from the slope of the curve ln (O* O) versus time.
Materials and methods
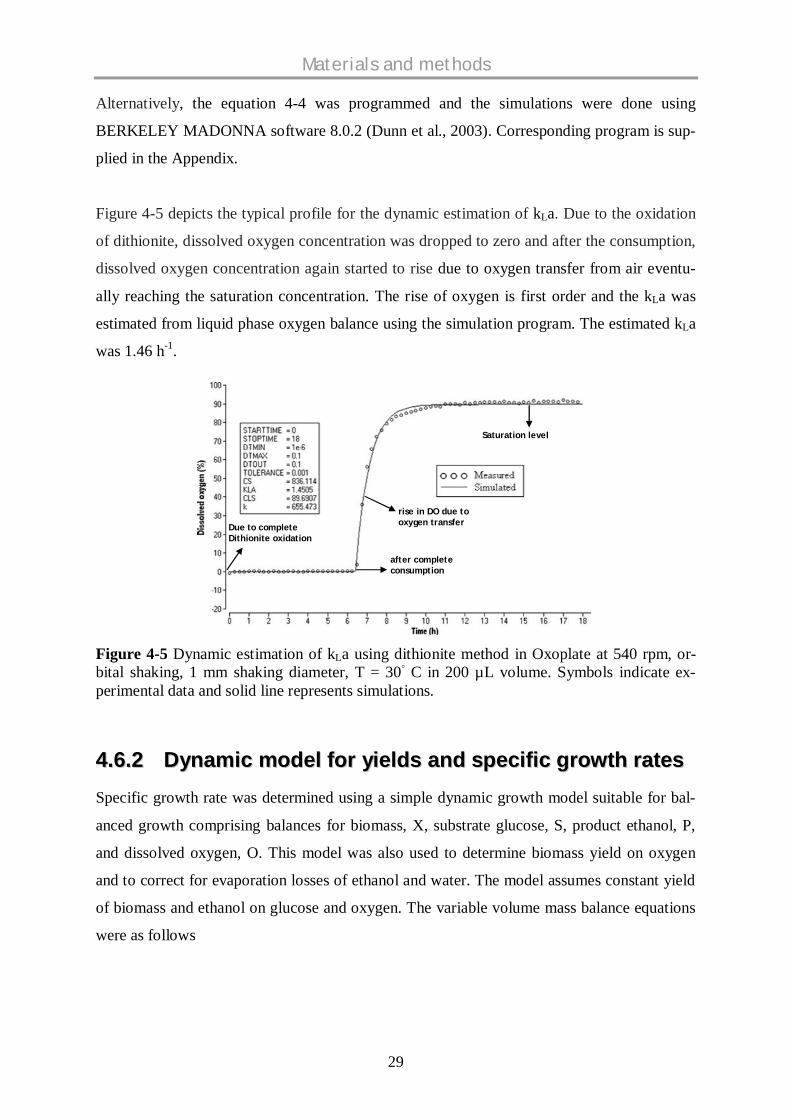
29
Alternatively, the equation 4-4 was programmed and the simulations were done using
BERKELEY MADONNA software 8.0.2 (Dunn et al., 2003). Corresponding program is sup-
plied in the Appendix.
Figure 4-5 depicts the typical profile for the dynamic estimation of kLa. Due to the oxidation
of dithionite, dissolved oxygen concentration was dropped to zero and after the consumption,
dissolved oxygen concentration again started to rise due to oxygen transfer from air eventu-
ally reaching the saturation concentration. The rise of oxygen is first order and the kLa was
estimated from liquid phase oxygen balance using the simulation program. The estimated kLa
was 1.46 h-1.
Figure 4-5 Dynamic estimation of kLa using dithionite method in Oxoplate at 540 rpm, or-bital shaking, 1 mm shaking diameter, T = 30 C in 200 µL volume. Symbols indicate ex-perimental data and solid line represents simulations.
44..66..22 DDyynnaammiicc mmooddeell ffoorr yyiieellddss aanndd ssppeecciiffiicc ggrroowwtthh rraatteessSpecific growth rate was determined using a simple dynamic growth model suitable for bal-
anced growth comprising balances for biomass, X, substrate glucose, S, product ethanol, P,
and dissolved oxygen, O. This model was also used to determine biomass yield on oxygen
and to correct for evaporation losses of ethanol and water. The model assumes constant yield
of biomass and ethanol on glucose and oxygen. The variable volume mass balance equations
were as follows
Due to completeDithionite oxidation
rise in DO due tooxygen transfer
after completeconsumption
Saturation level
Due to completeDithionite oxidation
rise in DO due tooxygen transfer
after completeconsumption
Saturation level

Materials and methods
30
( )X
d XV r V XVdt
(Eq 4-5)
( ) X
XG
r Vd SVdt Y
(Eq 4-6)
, ,( )
X PX P evap X PX P evapd PV r Y V r r Y V k P
dt(Eq 4-7)
*( ) XL
XO
r Vd OV k a O Odt Y
(Eq 4-8)
2 , ,( ) H O evap P evapr rd Vdt
(Eq 4-9)
Growth kinetics were described with Monod-type kinetics (Dunn et al., 2003)
maxXS O
S OrK S K O
(Eq 4-10)
Simulations were carried out using BERKELEY MADONNA software and corresponding
program is supplied in the Appendix. The meaning of the symbols is
V – Volume [L];
X – Biomass concentration [g L-1];
S – Glucose concentration [mol L-1];
P – Ethanol concentration [mol L-1];
O – Dissolved oxygen concentration [mol L-1];
O* – Gas-liquid equilibrium dissolved oxygen concentration [mol L-1];
t – Time [h];
rX – Biomass formation rate [g L-1 h-1];
µ - Specific growth rate [h-1];
YXG – Biomass yield on glucose [g mol];
YPX – Ethanol yield with reference to biomass production [mol g-1];
YXO – Biomass yield on oxygen [g mol-1];
rP,evap – Rate of ethanol evaporation [mol h-1];
kP,evap – First order rate constant for ethanol evaporation [h-1];
kLa – Oxygen mass transfer coefficient [h-1];
kH2O,evap – Rate of evaporation of water [g h-1];
KS, KO – Substrate and oxygen affinity constant [mol L-1]
Materials and methods
31
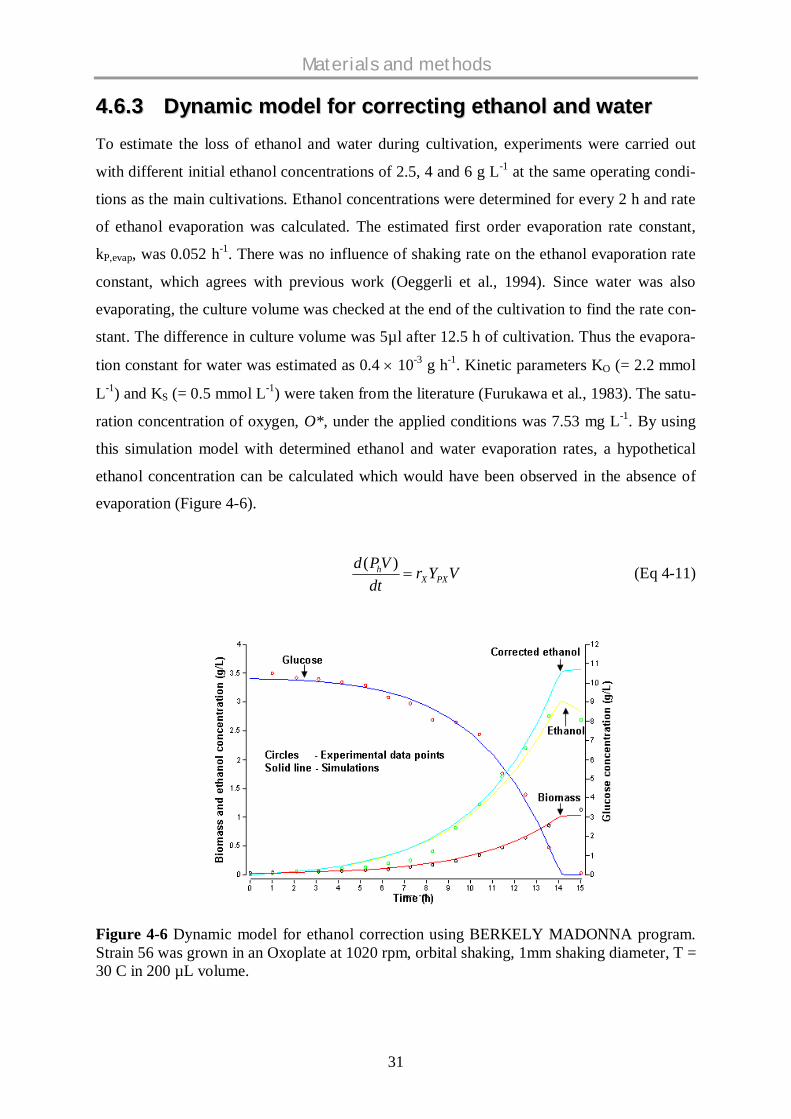
44..66..33 DDyynnaammiicc mmooddeell ffoorr ccoorrrreeccttiinngg eetthhaannooll aanndd wwaatteerrTo estimate the loss of ethanol and water during cultivation, experiments were carried out
with different initial ethanol concentrations of 2.5, 4 and 6 g L-1 at the same operating condi-
tions as the main cultivations. Ethanol concentrations were determined for every 2 h and rate
of ethanol evaporation was calculated. The estimated first order evaporation rate constant,
kP,evap, was 0.052 h-1. There was no influence of shaking rate on the ethanol evaporation rate
constant, which agrees with previous work (Oeggerli et al., 1994). Since water was also
evaporating, the culture volume was checked at the end of the cultivation to find the rate con-
stant. The difference in culture volume was 5µl after 12.5 h of cultivation. Thus the evapora-
tion constant for water was estimated as 0.4 10-3 g h-1. Kinetic parameters KO (= 2.2 mmol
L-1) and KS (= 0.5 mmol L-1) were taken from the literature (Furukawa et al., 1983). The satu-
ration concentration of oxygen, O*, under the applied conditions was 7.53 mg L-1. By using
this simulation model with determined ethanol and water evaporation rates, a hypothetical
ethanol concentration can be calculated which would have been observed in the absence of
evaporation (Figure 4-6).
( )hX PX
d PV r Y Vdt
(Eq 4-11)
Figure 4-6 Dynamic model for ethanol correction using BERKELY MADONNA program.Strain 56 was grown in an Oxoplate at 1020 rpm, orbital shaking, 1mm shaking diameter, T =30 C in 200 µL volume.
Materials and methods
32
This simplified growth model was only used for growth phases exhibiting balanced growth,
i.e. as long as there wasn’t any limitation of glucose or oxygen. Oxygen uptake rates were
only estimated at dissolved oxygen concentrations between 40 % and 90 % air saturation. If
oxygen mass transfer is very high, dissolved oxygen concentration is near saturation and be-
cause of experimental errors it is not possible to get reliable estimates of oxygen uptake rate.
Therefore, in cases of low oxygen uptake rates additional cultures at lower shaking rate were
carried out. In cases with oxygen limitation, ethanol evaporation and specific growth rate
were estimated with a reduced model lacking oxygen balance (Equation 4-8) and the oxygen
term of Equation 4-10.
Specific growth rates were directly estimated from estimated biomass concentrations during
true exponential growth phase. From the increase in biomass concentration and glucose con-
sumption, biomass yield on hexoses was directly determined. Ethanol yield on hexoses was
estimated using the model and high shaking rate experimental data. Biomass yield on oxygen
was determined from low shaking rate experiments during declining dissolved oxygen con-
centration above 20 % air saturation using the model (Equations 4-5 and 4-6). The dissolved
oxygen profiles for all the strains are given in the Appendix.
44..77 EETTHHAANNOOLL LLAABBEELLIINNGG AANNAALLYYSSIISS AANNDD QQUUAANNTTIIFFIICCAATTIIOONNUUSSIINNGG MMAALLDDII--TTOOFF--MMSS
A new method was developed for the quantitative estimation of isotope-labeled ethanol pro-
duced from labelled substrate during cultivation. Subsequently metabolic split ratio between
glycolysis and PP pathway was estimated based on the ethanol labelling using matrix-assisted
laser desorption/ionization time-of-flight mass spectrometry (MALDI-ToF-MS).
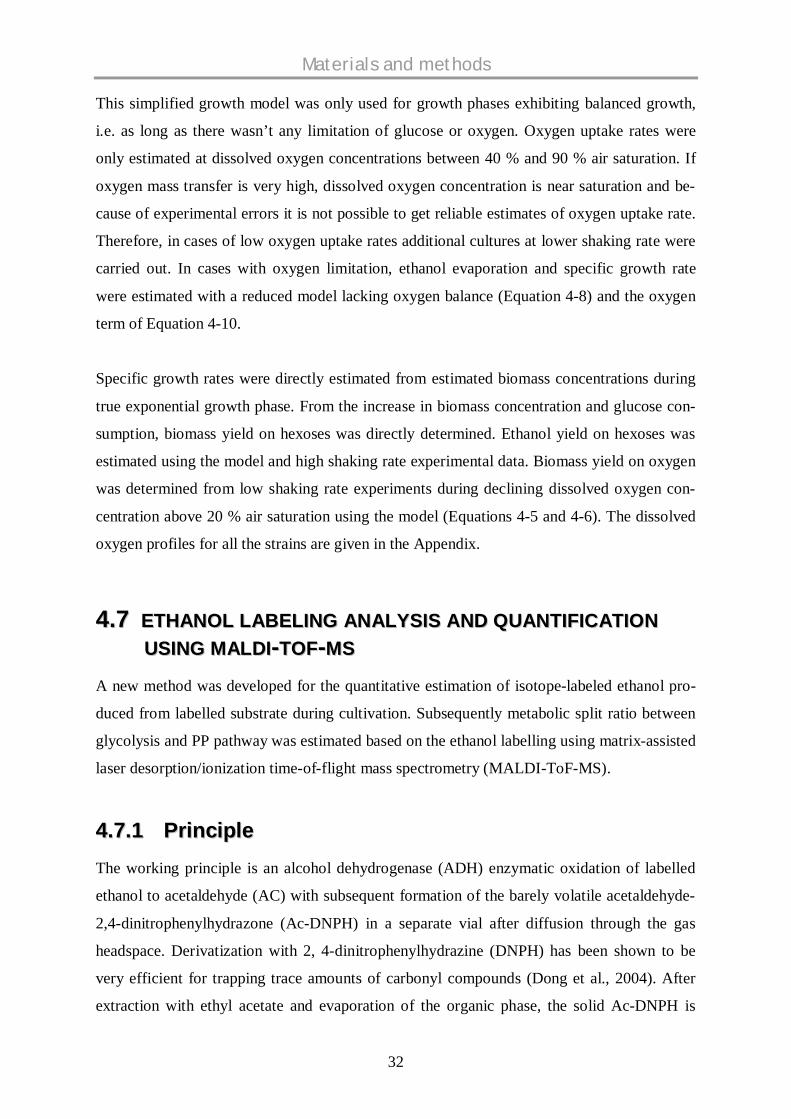
44..77..11 PPrriinncciipplleeThe working principle is an alcohol dehydrogenase (ADH) enzymatic oxidation of labelled
ethanol to acetaldehyde (AC) with subsequent formation of the barely volatile acetaldehyde-
2,4-dinitrophenylhydrazone (Ac-DNPH) in a separate vial after diffusion through the gas
headspace. Derivatization with 2, 4-dinitrophenylhydrazine (DNPH) has been shown to be
very efficient for trapping trace amounts of carbonyl compounds (Dong et al., 2004). After
extraction with ethyl acetate and evaporation of the organic phase, the solid Ac-DNPH is
Materials and methods
33
dissolved in -cyano-4-hydroxycinnamic acid (CCA) matrix solution and analyzed by
MALDI-ToF-MS. Schematic representation of the work flow is given in figure 4-7.
Figure 4-7 Schematic representation of analysis of ethanol labelling using MALDI-ToF-MS.
44..77..22 SSaammppllee pprreeppaarraattiioonnSeventy-five microliter of centrifuged and diluted culture supernatant was put into a 2 ml
glass vial sealable with rubber septum and alumina crimp seal. To this solution, 25 µl of 0.7
% [13C2]-ethanol in 400 mM Tris/HCl (pH 8.8) was added. For unlabeled ethanol quantifica-
tion 14 samples from 1 to 50 µl of 0.7 % (w/w) ethanol in 100 mM Tris/HCl (pH 8.8), topped
up with 100 mM Tris/HCl buffer to 100 µl were used. For quantification of [1-13C]-ethanol,
14 samples from 1 to 25 µl unlabeled ethanol plus the equal volumes of [1-13C]-ethanol were
topped with buffer and 25 µl of [13C2]-ethanol as described above. All three ethanol types
were 0.7 % (w/w) in 100 mM Tris/HCl buffer (pH 8.8). The enzymatic reaction was started
by adding 50 µl of 1 mg /ml ADH (corresponding to 30 U) followed by 50 µl of 70 mg/ml
NAD+, both in 100 mM Tris/HCl buffer (pH 8.8). A 0.3 ml micro insert tube containing 75 µl

Materials and methods
34
of supernatant of centrifuged saturated DNPH solution in 10 % phosphoric acid was placed
inside this 2 ml tube. The 2 ml vial was tightly closed immediately and incubated at 25o C for
16 h.
This set up (Figure 4-8) consists of an inner compartment of acidified DNPH solution, which
is separated from the culture supernatant. Volatile compounds can freely diffuse into this in-
ner compartment via the gas phase. After incubation, the insert tube was removed and 150 µl
of ethyl acetate was added and intensively mixed several times by pipetting. Organic and
aqueous phases were separated by short centrifugation. Hundred microliters of the upper or-
ganic phase was transferred into a PCR tube and dried in a vacuum centrifuge (Speed-Vac,
Juan, RC 10.22, Saint-Nazaire, France) for 30 min. The residue was dissolved in 15 µl of
CCA- matrix solution (saturated -cyano-4-hydroxycinnamic acid in 50 % acetonitrile and 1
% trifluoroacetic acid). Then 2 µl of this solution was pipetted onto the 384 MALDI-TOF
steel target plate and air-dried.
Figure 4-8 Design of the reaction vials. The outer tightly closed 2 ml vial contains 200 µlliquid consisting of sample, ADH from S. cerevisiae, NAD+ and [13C2]-ethanol as internalstandard. The insert was filled with 75 µl supernatant of saturated DNPH solution in dilutedphosphoric acid.

Materials and methods
35
44..77..33 AAccqquuiissiittiioonn ooff MMSS ssppeeccttrraa aanndd ppeeaakk sseelleeccttiioonnAnalyses were performed on a Bruker Reflex III time of flight mass spectrometer (Bruker-
Daltonic, Bremen, Germany) equipped with the SCOUT 384 probe ion source. The system
used a pulsed nitrogen laser (337 nm, Model VSL-337ND, Laser Science Inc., Boston, MA)
with energy of 400µJ/pulse. The ions were accelerated under delayed extraction conditions in
the positive mode with an acceleration voltage of 20 kV and a reflector voltage of 22.5 kV. A
6.7 kV potential difference between target and the extraction lens was applied with a time
delay of 200 ns. A Lecroy Signalyst LS 10, 2GS/s, 1 GHz digital storage oscilloscope was
used for data acquisition (Lecroy Corp., Chestnut Ridge, NY, USA). The detector signals
were amplified in two stages, digitized and transferred to the XACQ program on a NT 4
work-station (Microsoft, USA). Autoexecute mode was chosen for automated measurements
with 26-32 % laser power, a resolution better than 1400, a signal to noise-ratio (S/N) better
than 4 and a noise range of 100 leading to optimal intensity. Spectra with saturated peaks
were not used. For each spectrum, 12 sub spectra from more than 6 spots consisting of 25
successful laser shots were added. The data were further processed with the program XMASS
5.15 (Bruker Daltonics, Bremen, Germany) using the APEX-algorithm for the detection of all
peaks within 215-237 Da with a threshold of 250 a.i. Each sample was measured in four rep-
licates.
All m/z values were rounded to integers and used with their absolute intensities. Carbon mass
isotopomer fractions of ethanol were calculated from the measured distribution of the derivat-
ized analyte mass distribution using the method developed by Yang et al. (2006 and 2009),
which is based on earlier work of Wiechert et al. (2001). The peak with m/z 225 represents
the mono isotopic mass of the Ac-DNPH product formed with unlabeled acetaldehyde [mi]
(Figure 4-9A). The peak with m/z 226 represents the mono isotopic mass of the single labeled
[1-13C]-Ac-DNPH [mi+1] as well as the mass of the unlabeled Ac-DNPH (Fig 4-9B). The
peak with m/z 227 comprises the mono isotopic peak mass of the double-labeled [13C2]-Ac-
DNPH as well as the [mi+2] mass for the unlabeled Ac-DNPH and the [mi+1] mass of the
single labeled [1-13C]-Ac-DNPH. The measured signal intensities of m/z 225, 226 and 227
were used for the calculation for the carbon mass isotopomer fractions.
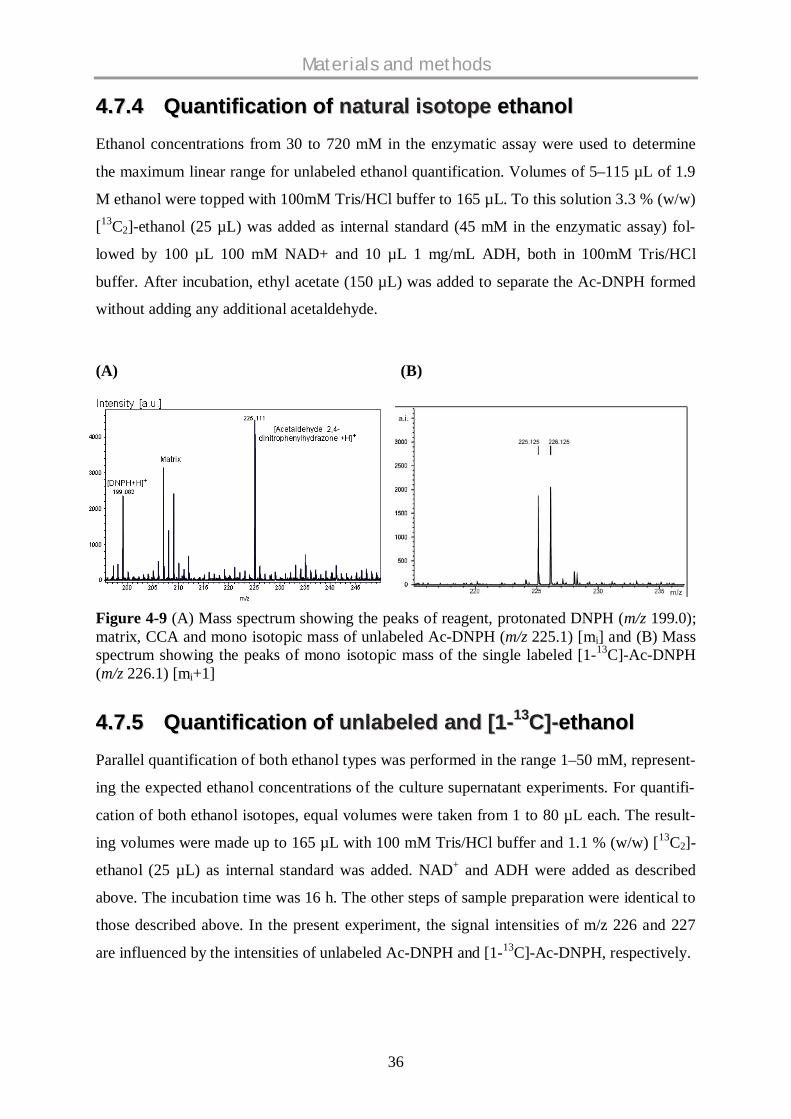
Materials and methods
36
44..77..44 QQuuaannttiiffiiccaattiioonn ooff nnaattuurraall iissoottooppee eetthhaannoollEthanol concentrations from 30 to 720 mM in the enzymatic assay were used to determine
the maximum linear range for unlabeled ethanol quantification. Volumes of 5–115 µL of 1.9
M ethanol were topped with 100mM Tris/HCl buffer to 165 µL. To this solution 3.3 % (w/w)
[13C2]-ethanol (25 µL) was added as internal standard (45 mM in the enzymatic assay) fol-
lowed by 100 µL 100 mM NAD+ and 10 µL 1 mg/mL ADH, both in 100mM Tris/HCl
buffer. After incubation, ethyl acetate (150 µL) was added to separate the Ac-DNPH formed
without adding any additional acetaldehyde.
(A) (B)
Figure 4-9 (A) Mass spectrum showing the peaks of reagent, protonated DNPH (m/z 199.0);matrix, CCA and mono isotopic mass of unlabeled Ac-DNPH (m/z 225.1) [mi] and (B) Massspectrum showing the peaks of mono isotopic mass of the single labeled [1-13C]-Ac-DNPH(m/z 226.1) [mi+1]
44..77..55 QQuuaannttiiffiiccaattiioonn ooff uunnllaabbeelleedd aanndd [[11--1133CC]]--eetthhaannoollParallel quantification of both ethanol types was performed in the range 1–50 mM, represent-
ing the expected ethanol concentrations of the culture supernatant experiments. For quantifi-
cation of both ethanol isotopes, equal volumes were taken from 1 to 80 µL each. The result-
ing volumes were made up to 165 µL with 100 mM Tris/HCl buffer and 1.1 % (w/w) [13C2]-
ethanol (25 µL) as internal standard was added. NAD+ and ADH were added as described
above. The incubation time was 16 h. The other steps of sample preparation were identical to
those described above. In the present experiment, the signal intensities of m/z 226 and 227
are influenced by the intensities of unlabeled Ac-DNPH and [1-13C]-Ac-DNPH, respectively.

Materials and methods
37
To obtain a standard curve for the quantification of natural isotope ethanol, different mixtures
of unlabeled and [13C2]-ethanol were applied and analyzed. Also in this case a correction for
natural isotopes was not necessary. The relative intensity of the peak m/z 225 (Irel, 225, mi) was
calculated using the absolute peak intensities of m/z 225 (I225, mi) and of m/z 227 (I227, mi+2)
according to equation 4-12
227
,225225, I
II mi
rel (Eq 4-12)
Linear regression analysis was performed using these relative intensities in relation to the
unlabeled ethanol concentrations (Figure 4-10). The slope of the straight line was 1.194, the
intercept 0.119 and the correlation r2 = 0.9948.
Figure 4-10 Standard curve for the quantification of natural isotope ethanol. Linear regres-sion analysis was performed between relative intensities [I225/I227] and unlabeled ethanol con-centrations.
44..77..66 EEssttiimmaattiioonn ooff tthhee fflluuxx sspplliitt rraattiioo bbeettwweeeenn ppeennttoossee--pphhoosspphhaattee ppaatthhwwaayy ((PPPPPP)) aanndd ggllyyccoollyyssiiss (( pppppp))
The flux split ratio ( PPP) between pentose-phosphate pathway and glycolysis can be esti-
mated simply from metabolite labeling of compounds directly derived from pyruvate, e.g.
alanine or ethanol as described by Wittmann et al. (2004) and the principle involved in the
calculation of PPP is shown in figure 4-11.
micorr
micorrPPP II
II
,225,226
,225,226
/*3/21/1
(Eq 4-13)

Materials and methods
38
This simplified calculation provides a minimal value for the flux ratio between PPP and gly-
colysis as has been shown for Corynebacterium glutamicum, but gives reasonable results
especially for low values of PPP (Wittmann et al., 2004). For screening comparison of a large
collection of mutants or effective compounds, calculations using equation 4-13 are clearly
sufficient since the reversibility of the glucose 6-phosphate isomerase would be very similar.
Once a mutant is identified showing a different PPP flux split ratio, it must be characterized
more thoroughly using a more detailed method using isotopomer models which require, how-
ever, much more detailed data involving analysis of labeling of metabolites using, e.g.,
GC/MS or HPLC/MS. For such screening experiments, the incomplete labeling of [1-13C]-
glucose introduces only a marginal error and it was therefore neglected.
Figure 4-11 The principle involved in the flux split ratio ( PPP) between pentose-phosphatepathway and glycolysis calculation.

Materials and methods
39
44..88 LLAABBEELLLLIINNGG AANNAALLYYSSIISS OOFF PPRROOTTEEIINNOOGGEENNIICC AAMMIINNOO AACCIIDDSS
Labelling patterns of proteinogenic amino acids were analysed from biomass hydrolysates
using gas chromatography mass spectrometry (GC-MS).
44..88..11 BBiioommaassss hhyyddrroollyyssaattee ssaammppllee pprreeppaarraattiioonnAliquots of batch cultures were harvested at OD660nm of 1.5-2.5, and centrifuged at 3000 g at
room temperature for 15 min. Pellets were washed twice with 1 ml 0.9 % (w/v) NaCl and
hydrolysed in 100 µL of 6 M HCl at 105° C for 24 h. The hydrolysate was filtered and freeze
dried and subsequently derivatised at 80° C in 20 µL of Dimethylformamide (DMF) with 0.1
% pyridine and 20 µL of MBDSTFA (N-methyl-tert.-butyldimethylsilyl-trifluoracetamide,
Macherey-Nagel, Düren, Germany) for 1 h. Protic sites of amino acids (OH-, NH-, and SH-
groups) were blocked by silylation to reduce dipole-dipole interactions and to increase vola-
tility for GC separation. The use of MBDSTFA had the advantage that mostly neutral and
volatile byproducts are formed that did not react with the column, hence enabling direct GC-
MS analysis.
44..88..22 GGaass CChhrroommaattooggrraapphhyy MMaassss SSppeeccttrroommeettrryyGC-MS was carried out using a HP 6890 GC-System equipped with HP5MS (95 % di-
methyl–5 % diphenylpolysiloxane; 30 m 0.25 mm x 250 µm, Restek, Bellefonte, PA, USA)
that was directly connected to a Quadrupole Mass Selective Detector 5973 Network (Agilent
Technologies, Waldbronn, Germany) with electron ionization at 70 eV. The injection volume
was 0.5 µL at a carrier gas flow rate of 1.5ml/min helium and column head pressure was 70
kPa. The temperature gradient for the separation of complex amino acid mixtures was 120 °C
for 5min, 4 °C/min up to 270 °C and 20 °C/min to 320 °C. Further operation temperatures
were 300 °C (inlet), 280 °C at the interface and 320 °C (quadrupole). In order to increase the
sensitivity, the mass isotopomer fractions [mi], [mi+1], and [mi+2] were quantified with se-
lected ion monitoring (SIM) of the corresponding ion clusters. Figure 4-12 demonstrating the
TIC chromatogram obtained using SIM method and about 14 amino acids were detected and
the names of the amino acids were given in the table 4-6.

Materials and methods
40
Figure 4-12 GC-MS chromatogram showing all the detected amino acids. Numbers on top ofeach peak represents serial number of detected peaks.
Table 4-6 Peak table showing the peak number in the chromatogram (Fig 4-12) and its corre-sponding amino acidPeak number Amino acid Peak number Amino acid1 Alanine 8 Threonine2 Glycine 9 Phenyl alanine3 Valine 10 Aspartic acid4 Leucine 11 Glutamic acid5 Isoleucine 12 Lysine6 Proline 13 Arginine7 Serine 14 Tyrosine
44..99 MMEETTAABBOOLLIICC NNEETTWWOORRKK MMOODDEELL AANNDD FFLLUUXX AANNAALLYYSSIISS
A system of connected chemical reactions that determine the physiological and biochemical
properties of a cell is called a metabolic network. These inter-connected metabolic networks
comprise a regulatory mechanism with the involvement of numerous enzymes. Metabolic
flux analysis (MFA) is a constraint based methodology for identifying metabolic flux distri-
butions using the stoichiometry based approach. The main advantage of MFA is a detailed
quantification of intracellular fluxes in the central metabolic pathways, which results in a flux
map that shows the distribution of anabolic and catabolic fluxes over the metabolic network
(Wiechert et al., 2001).

Materials and methods
41
44..99..11 MMeettaabboolliittee bbaallaanncciinnggMetabolite balancing applies the principle of material conservation for each and every me-
tabolite pool in the metabolic network. At steady state, metabolite pools are constant; hence
the total of all metabolic fluxes entering a specific pool must equal the total of fluxes leaving
that same pool. This yields, for every metabolite pool, one linear equation relating all fluxes
connecting with that pool. Available measurement data on fluxes e.g. substrate uptake rates
(qs) and product production rates (qp) provide additional equations. Setting up the equations
for every pool in the network then yields a high-dimensional system of linear equations, with
the fluxes as unknowns that can be solved mathematically using matrix procedures, provided
the system is (over)determined i.e., there are more independent equations than the unknowns
(De Graaf et al., 1996; Varma and Palsson, 1994).
bvS (Eq 4-14)
where S is the stoichiometric matrix, v is the vector of fluxes and b is the net specific excre-
tion rate vector (in the case of substrate uptake rate, the elements of b will be negative). The
stoichiometric matrices are given in the Appendix section. Fluxes were estimated using the
inverse of the stoichiometric matrix using standard methods implemented in MATLAB
(Stephanopoulos et al., 1998). The program for calculation of fluxes is given in the Appendix.
44..99..22 YYeeaasstt mmeettaabboolliicc nneettwwoorrkk mmooddeellA simplified yeast biochemical reaction network was used for the calculation of metabolic
fluxes. The specific substrate i.e., glucose or galactose (qs) consumption rate; specific prod-
uct, ethanol (qp) production rate; specific growth rate (µ) and the flux split ratio between gly-
colysis and pentose phosphate pathway ( PPP) were used in the model for flux calculations.
The mass balance equations around each node are as follows (Figure 4-13),
0:6 1321 vbvvvPG (Eq 4-15)
0:6 412133 vvvvPF (Eq 4-16)
0: 3151211134 vbvvvvvGAP (Eq 4-17)
0: 414765 vbvvvvPYR (Eq 4-18)
0: 787 vbvvAcCoA (Eq 4-19)

Materials and methods
42
0: 598 vbvvAKG (Eq 4-20)
0: 109 vvSUC (Eq 4-21)
0: 681014 vbvvvOAA (Eq 4-22)
0:5 213112 vbvvvPP (Eq 4-23)
0:4 81312 vbvvPE (Eq 4-24)
0:7 1211 vvPS (Eq 4-25)
v is a reaction rate or flux as specified in figure 4-13. This stoichiometric network has 15
metabolic reactions, v1 to v15, and 8 anabolic reactions, v1 to v8, representing biomass forma-
tion. The anabolic demand reactions were calculated as function of the specific growth rate as
described by Frick et al. (2004). The specific substrate, i.e., glucose or galactose consumption
rate (qHexose = v1), specific ethanol production rate (qp = v6) are two external fluxes.
This system would be underdetermined unless there was an additional measurement. The flux
split ratio between glycolysis and pentose phosphate pathway, PPP, provided an additional
measured variable and therefore the system was fully determined. The PPP can be estimated
simply from metabolite labeling of compounds directly derived from pyruvate, e.g. alanine or
ethanol as described by Wittmann et al. (2002). The net PPP flux split ratio is defined as
32
2
vvv
PPP (Eq 4-26)
The net anaplerotic flux split ratio was calculated from the fluxes already calculated, Anaple-
rotic
1476
14
vvvv
cAnapleroti (Eq 4-27)
This value does not take into account any reversibility of anaplerotic reactions. The estima-
tion of these would require a much more in-depth analysis (Frick et al., 2004; Blank et al.,
2005; Gombert et al., 2001; van Winden et al., 2005).

Materials and methods
43
Figure 4-13 Schematic diagram of the simplified central yeast metabolic network.Glu, Glucose; G6P, Glucose-6-phosphate; F6P, Fructose-6-phosphate; P5P, Pentose-5-phosphate; E4P, Erythrose-4-phosphate; S7P, Sedoheptulose-7-phosphate; GAP, Glyceralde-hyde-3-phosphate; Pyr, Pyruvate; ETH, Ethanol; AcCoA, Acetyl Co-A; AKG, Alpha-ketoglutarate; SUC, Succinate; OAA, Oxaloacetate, Bio-Biomass
44..1100 SSTTAATTIISSTTIICCAALL AANNAALLYYSSEESS
Mean errors of hexoses i.e., glucose, galactose and ethanol determination were derived from
all pair wise measurements carried out for each well. For the specific growth rate the 90 %
confidence interval was estimated according to Massart et al. (1997). 90 % confidence inter-
vals for yields and flux partitioning to the pentose phosphate pathway were estimated by cal-
culating Gaussian error propagation. Errors of metabolic fluxes were estimated using Monte
Carlo simulation (MATLAB, Mathworks) assuming Gaussian distribution of errors. The error
of biomass yield on oxygen was estimated from a sensitivity analysis and visual inspection
using the software BERKELEY MADONNA. To distinguish different mutant strains from
each other and different mutant strains from the reference strain, strains were compared pair
wise using a t-test with 90 % confidence interval. Strains with overlapping confidence inter-
vals were considered equal. These comparisons were made for all four individual parameters
specified above for both sugar substrates.

Materials and methods
44
44..1100..11 CCoonnffiiddeennccee iinntteerrvvaallss iinn rreeggrreessssiioonn aannaallyyssiissThe rate of cell growth is proportional to cell concentration during exponential phase of culti-
vation. Thus a plot of natural logarithm of biomass concentration (X) against time (t) yields a
straight line and the slope of this is the specific growth rate (µ).
Xdtdx (Eq 4-28)
The regression coefficient, µ is the specific growth rate. Confidence intervals were set for
specific growth rates by calculating the critical value for regression coefficient as follows
(Kreyszig et al., 1993).
1. A confidence level of 90 % was chosen.
2. The solution for p of the equation was determined from the table of the t-distribution with
n-2 degrees of freedom (n = sample size).
121pF (Eq 4-29)
3. For a sample of size (x1, y1) to (xn, yn), variances S1 and S2 were calculated for x and y,
respectively.
Critical value K for regression coefficient µ was computed as follows
112
2 2S
nSSpK (Eq 4-30)
The confidence interval is
KKCONF (Eq 4-31)
44..1100..22 SSttaannddaarrdd ddeevviiaattiioonnss ffoorr yyiieelldd ccaallccuullaattiioonnssYield coefficients were estimated as quantity of cell dry weight or ethanol produced per
quantity of carbon substrate utilized. Thus yield coefficients were coming from two inde-
pendent measurements i.e. the amount of glucose consumed, the amount of biomass or etha-
nol produced. When the final result is obtained from more than one independent measure-
ment, or when it is influenced by two or more independent sources of error, these errors can
accumulate or compensate. Thus standard deviations were calculated according to the law of

Materials and methods
45
propagation of errors (Massart et al., 1997). Random errors accumulate according to the law
of propagation of errors is given by:
yxz (Eq 4-32)
yxzdydz
dxdz 2
22
22 (Eq 4-33)
Where yxfz , (Eq 4-34)
and x, y must be independent variables and 2x,
2y, and 2
z are variances of x, y and z, respec-
tively. Standard deviation of z can be calculated by taking the partial derivative for the above
equation,
21
22
22
21
yxz yx
y (Eq 4-35)
44..1100..33 MMuuttaanntt ccoommppaarriissoonnMutant-mutant and mutant-reference separations were done in the following way; two strains
were checked, if the confidence intervals of specific growth rates and standard deviations of
all yields of one strain were overlapping the confidence intervals and standard deviations of
another strain or not. Strains, which were common in all four dimensions i.e. specific growth
rates, biomass yields, ethanol yields and biomass yields on oxygen were considered as ‘not
distinguishable’ strains i.e., strains with overlapping confidence intervals were considered
equal and strains that were not overlapping in at least one dimension were considered as ‘dis-
tinguishable’ strains.
44..1100..44 HHiieerraarrcchhiiccaall cclluusstteerriinnggHierarchical clustering was based on complete linkage method with Euclidean metric by us-
ing hclust function of stats package of R statistical language software (http://www.r-
project.org/). The log2 transformed fold changes of metabolic flux values of mutant strains
vs. reference strain were visualized using the heatmap.2 function of the gplots package of R.

Materials and methods
46
44..1100..55 EEuucclliiddeeaann ddiissttaannccee aapppprrooaacchhMutant strains were compared using relative Euclidean distance, d, between two strains using
all the available biological parameters i.e., specific growth rate, biomass yield on substrate,
ethanol yield on substrate and biomass yield on oxygen, using the equation 4-36,
2
1
,npar
i
ii
yyxyxd (Eq 4-36)
where x and y are the parameter values for the two selected strains. yi is the mean value of
parameter i for all strains.
44..1100..66 GGrraapphhiiccaall GGaauussssiiaann MMooddeelllliinngg ((GGGGMM)) aapppprrooaacchhGraphical Gaussian Modelling (GGM) or Covariance selection model or Concentration graph
is useful for learning undirected graphical Gaussian Markov models from data sets, where the
number of random variables ‘p’ exceeds the available sample size ‘n’ (Waddell and Kishino,
2000). GGM is used to infer the network of linear dependencies among a set of mutant strains
based on partial correlations as a measure of independence of any two strains by computing
all pair-wise correlations and subsequently the corresponding graph (To and Horimoto,
2002). If there is a missing edge between any two mutant strains i.e., partial correlation is
close to zero, that would mean that there is no direct dependency between those two strains.
If the partial correlation is close to one that would mean that there is a strong direct depend-
ency between those two strains. The corresponding program was written in ‘R’ is given in the
Appendix.
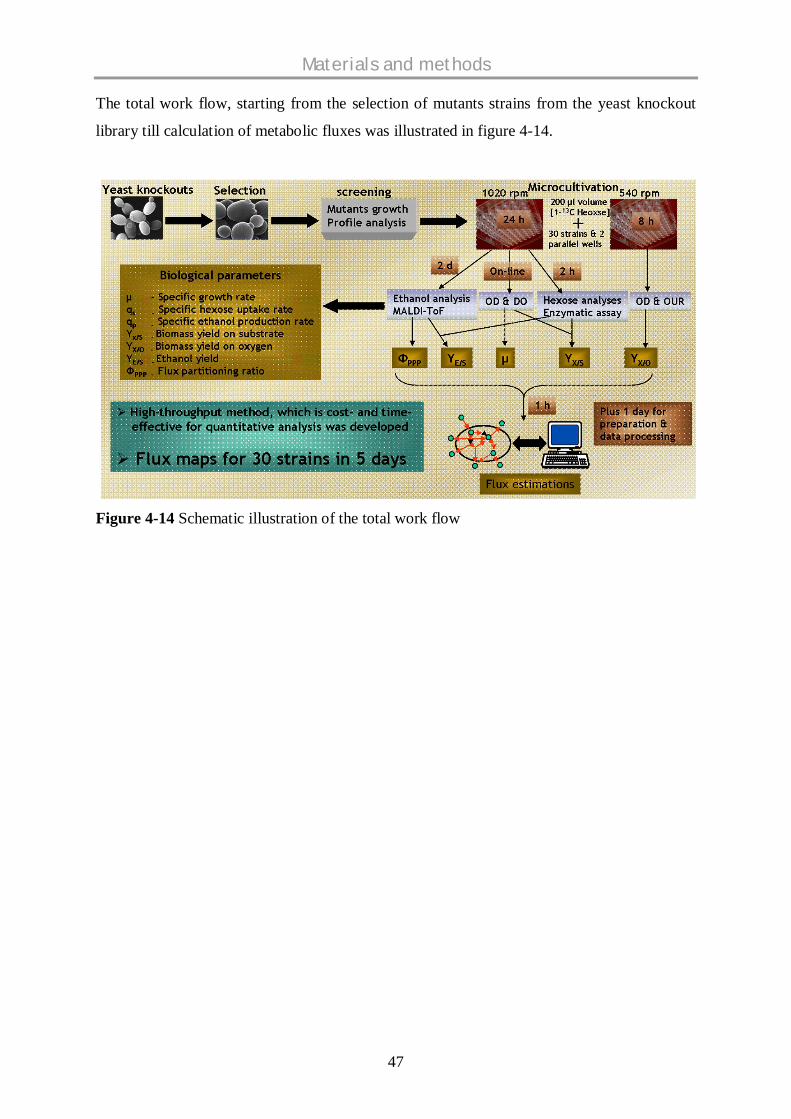
Materials and methods
47
The total work flow, starting from the selection of mutants strains from the yeast knockout
library till calculation of metabolic fluxes was illustrated in figure 4-14.
Figure 4-14 Schematic illustration of the total work flow

Results and discussion
48
55.. RREESSUULLTTSS AANNDD DDIISSCCUUSSSSIIOONNResults and discussion chapter is organised in the following manner. This chapter is divided
in to six sub-chapters (sub-chapters: 5.1 to 5.6).
The first sub-chapter, 5.1 deals with the high-throughput stoichiometric and metabolic
screening of a set of selected S. cerevisiae single deletion mutants, which are known to
be involved in central carbon metabolism using 96-well microtiter plates with integrated
optical sensors for dissolved oxygen monitoring on glucose and galactose sugars.
The 5.2 sub-chapter deals with the new method that was developed for the high-
throughput quantification of unlabeled and mono-13C-labeled ethanol, which also permits
the calculation of the flux split ratio between glycolysis and the pentose-phosphate
pathway (PPP).
The sub-chapter 5.3 deals with the comparative quantitative metabolic flux profiling of
the selected set of mutants on glucose and galactose sugars at miniaturised scale.
The sub-chapter 5.4 deals with the comparative stoichiometric and quantitative metabolic
flux profiling of hexose transporter deletion mutant strains on glucose and galactose.
The sub-chapter 5.5 deals with the stoichiometric and quantitative metabolic profiling of a
set of selected mutants on fructose sugar and comparison with the other carbon sources
i.e., glucose and galactose.
In the final overview sub-chapter 5.6, all the strains discussed so far are combined to
gether and analysed statistically by employing several techniques i.e., hierarchical clus
tering, mutant comparison using Euclidean distance approach and data visualisation using
clustered heat maps etc. Based on the available quantitative information on different car
bon sources for different strains, the functions of hypothetical genes are predicted using
Graphical Gaussian modelling approach.

Results and discussion
49
55..11 MMEETTAABBOOLLIICC SSCCRREEEENNIINNGG OOFF SS.. CCEERREEVVIISSIIAAEE SSIINNGGLLEEKKNNOOCCKKOOUUTT SSTTRRAAIINNSS OONN GGLLUUCCOOSSEE AANNDD GGAALLAACCTTOOSSEE
Most of the results presented in this chapter are contained in the following publication.
Velagapudi, V.R., Wittmann, C., Lengauer, T., Talwar, P., Heinzle, E., 2006. Metabolic screening of Saccharomyces cerevisiae single knockout strains reveals unexpected mobilization of metabolic potential. Process Biochem. 41, 2170–2179.
55..11..11 BBaacckkggrroouunnddThe determination of basic physiological parameters as rates of growth, substrate consump-
tion, product formation and respiration and further of metabolic pathway activities is of cen-
tral importance for the characterization of strains. To this end, a methodology for high-
throughput kinetic and stoichiometric analysis of yeast mutant libraries in 96 well microtiter
plates with on-line sensing of dissolved oxygen at miniaturized scale was developed and op-
timized. From this method, reliable data for specific growth rate, biomass and ethanol yields
on glucose and biomass yield on oxygen, which also allows mutant characterization, was
calculated. This method was applied to a selected set of mutants that were cultured on glu-
cose and galactose. A set of 27 deletion mutants were selected, which are proposed to be in-
volved in central carbon metabolism. The detailed information i.e., known or putative mo-
lecular, biological and cellular localization, about the mutants is described in Table 5.1-1.
55..11..22 MMiiccrroottiitteerr ppllaattee ccuullttiivvaattiioonn ooff SS.. cceerreevviissiiaaeeThe growth profile of the wild type S. cerevisiae ATCC 32167 in a 96 well microtiter plate is
shown in Figure 5.1-1. Cells grew exponentially with a specific growth rate of µ = 0.46 h-1
and eventually reached an OD of 3.7 after 8 h of cultivation. Glucose was completely con-
sumed during first 5 h of cultivation, which was accompanied by an increase in ethanol con-
centration (Figure 5.1-1A). The cells thus revealed the typical profile of yeast, where high
levels of readily metabolizable sugars repress the ability of the cell to carry out full aerobic
respiration (Postma et al., 1989).
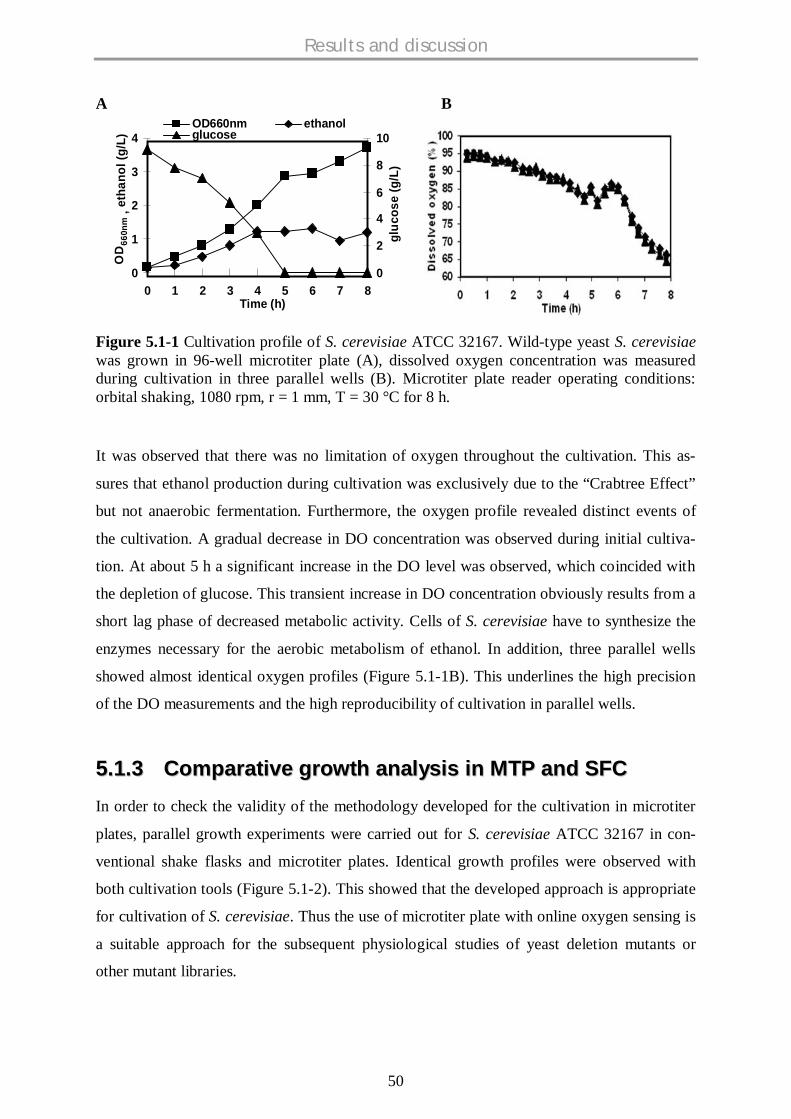
Results and discussion
50
A B
Figure 5.1-1 Cultivation profile of S. cerevisiae ATCC 32167. Wild-type yeast S. cerevisiaewas grown in 96-well microtiter plate (A), dissolved oxygen concentration was measuredduring cultivation in three parallel wells (B). Microtiter plate reader operating conditions:orbital shaking, 1080 rpm, r = 1 mm, T = 30 °C for 8 h.
It was observed that there was no limitation of oxygen throughout the cultivation. This as-
sures that ethanol production during cultivation was exclusively due to the “Crabtree Effect”
but not anaerobic fermentation. Furthermore, the oxygen profile revealed distinct events of
the cultivation. A gradual decrease in DO concentration was observed during initial cultiva-
tion. At about 5 h a significant increase in the DO level was observed, which coincided with
the depletion of glucose. This transient increase in DO concentration obviously results from a
short lag phase of decreased metabolic activity. Cells of S. cerevisiae have to synthesize the
enzymes necessary for the aerobic metabolism of ethanol. In addition, three parallel wells
showed almost identical oxygen profiles (Figure 5.1-1B). This underlines the high precision
of the DO measurements and the high reproducibility of cultivation in parallel wells.
55..11..33 CCoommppaarraattiivvee ggrroowwtthh aannaallyyssiiss iinn MMTTPP aanndd SSFFCCIn order to check the validity of the methodology developed for the cultivation in microtiter
plates, parallel growth experiments were carried out for S. cerevisiae ATCC 32167 in con-
ventional shake flasks and microtiter plates. Identical growth profiles were observed with
both cultivation tools (Figure 5.1-2). This showed that the developed approach is appropriate
for cultivation of S. cerevisiae. Thus the use of microtiter plate with online oxygen sensing is
a suitable approach for the subsequent physiological studies of yeast deletion mutants or
other mutant libraries.
0
1
2
3
4
0 1 2 3 4 5 6 7 8Time (h)
OD
660n
m,e
than
ol (g
/L)
0
2
4
6
8
10
gluc
ose
(g/L
)
OD660nm ethanolglucose
0
1
2
3
4
0 1 2 3 4 5 6 7 8Time (h)
OD
660n
m,e
than
ol (g
/L)
0
2
4
6
8
10
gluc
ose
(g/L
)
OD660nm ethanolglucose

Results and discussion
51
Table 5.1-1 Information about the selected yeast deletion mutant strainsORF Gene Name Biological process Molecular functionYMR280C CAT8 Regulation of transcription
from Pol II promoterSpecific RNA pol II transcription factoractivity
YML054C CYB2 Electron transport L-lactate dehydrogenaseYDL174C DLD2 Aerobic respiration D-lactate dehydrogenase (cytochrome)
activityYLR377C FBP1 Gluconeogenesis Fructose-bisphosphatase activityYJL155C FBP26 Gluconeogenesis Fructose-2,6-bisphosphate 2-
phosphatase activityYMR250W GAD1 Response to oxidative stress Glutamate decarboxylase activityYBR019C GAL10 Galactose metabolism UnknownYPL248C GAL4 Regulation of transcription DNA-dependent transcriptional activa-
tor activityYBR018C GAL7 Galactose metabolism UTP-hexose-1-phosphate uridylyltrans-
ferase activityYCL040W GLK1 Carbohydrate metabolism Glucokinase activityYML004C GLO1 Glutathione metabolism Lactoylglutathione lyase activityYIL154C IMP2 DNA repair Transcription co-activator activityYNL104C LEU4 Leucine biosynthesis 2-isopropylmalate synthase activityYKL029C MAE1 Pyruvate metabolism Malate dehydrogenase (oxaloacetate
decarboxylating) activityYBR297W MAL33 Regulation of transcription DNA-dependent transcription factor
activityYGL209W MIG2 Regulation of transcription
from Pol II promoterRNA pol II transcription factor activity
YKL062W MSN4 Response to stress Transcription factor activityYKR097W PCK1 Gluconeogenesis Phosphoenolpyruvate carboxykinase
(ATP) activityYIL107C PFK26 Fructose-2,6-bisphosphate me-
tabolism6-phosphofructo-2-kinase activity
YOL136C PFK27 Fructose-2,6-bisphosphate me-tabolism
6-phosphofructo-2-kinase activity
YDL168W SFA1 Formaldehyde assimilation Formaldehyde dehydrogenase (glu-tathione) activity
YNL257C SIP3 Transcription initiation frompol II promotor
Transcription cofactor activity
YDR073W SNF11 Chromatin modeling RNA pol II transcription factor activityYOR344C TYE7 Transcription Transcription factor activityYBR006W UGA5 Response to oxidative stress Succinate-semialdehyde dehydrogenase
(NAD(P)+) activityYGR194C XKS1 Xylulose catabolism Xylulokinase activityYBR184W YBR184W Unknown Unknown
(Sources: Saccharomyces genome deletion project)SGD (http://www.sequence.stanford.edu/group/yeast_deletion_project/references.html),MIPS (http://mips.gsf.de/genre/proj/yeast/)SGD (http://www.yeastgenome.org/) databases

Results and discussion
52
Figure 5.1-2 Comparative growth profile analysis of Wild-type yeast S. cerevisiae in micro-titer plate (MTP) and shake flask (SFC). Culture volumes were 10 ml in 100 ml shake flask,T = 30 °C, 250 rpm for 8 h and 150 µl in microtiter plate. Microtiter plate operating condi-tions were same as in Fig 5.1-1. (Open symbols: shake flask and closed symbols: microtiterplate)
55..11..44 EEffffeecctt ooff sshhaakkiinngg rraattee oonn ooxxyyggeenn lliimmiittaattiioonnTo investigate the effect of shaking rate on oxygen limitation, two cultivation experiments
were carried out with suc2 strain with an initial OD~0.05 at low shaking rate (540 rpm) and
at high shaking rate (1020 rpm). During cultivation at low shaking rate (540 rpm), cells grew
slowly and produced 0.55 g L-1 of biomass at 14.6 h of cultivation. There was still residual
glucose even after 14 h of cultivation. Figure 5.1-3A shows a fit between experimental and
simulated data of biomass, glucose and ethanol concentrations. Using equations (Eq 4-5 – 4-
11) overall specific growth rate that was calculated by the model was 0.17 h-1. Experimen-
tally determined ethanol concentration at 13.6 h was 1.85 g L-1, whereas the corrected ethanol
concentration by the model was 1.98 g L-1 corresponding to a difference of about 6 %. This
difference is larger than the estimation error. In other cultivations differences were signifi-
cantly larger. At 13.6 h of cultivation, estimated yield of biomass on glucose, YXS, was 0.086
g g-1, of ethanol on glucose, YPS, it was 0.35 g g-1, and YPX, the stoichiometric ratio of ethanol
to biomass production, was 4.0 g g-1. Figure 5.1-3B depicts the oxygen profile together with
optical density, which shows oxygen limitation after 8 h of cultivation. The measured DO
concentration at 15 h was 3 %. Simulations were made using the full model but only for the
first 8 h of cultivation, where there was no oxygen limitation. From this, the biomass yield on
oxygen, YXO, and specific growth rate, µ, were calculated. The calculated YXO for this time
period was 10.1 g g-1. This is clearly higher than typical yields at aerobic conditions with

Results and discussion
53
purely respiratory growth without any ethanol production. Furukawa et al. (1983) reported a
value of 1.1 g g-1 for a specific growth rate of 0.25 h-1 in continuous culture of S. cerevisiae,
where growth is almost entirely respiratory. The calculated specific growth rate for this time
period was 0.25 h-1, which was significantly different from the overall average growth rate
determined from growth until depletion of glucose, which was 0.17 h-1.
Careful investigation of experimental and simulated growth curves of figure 5.1-3A shows
systematic deviations also indicating biphasic growth on glucose. This also shows that the
strain revealed two different growth phases during the cultivation on glucose based on the
oxygen availability. When there was enough oxygen, the strain grew with high growth rate,
whereas it showed slow growth during oxygen limitation, which finally resulted in low bio-
mass production. This shows that oxygen limitation is not always very clearly seen solely
from growth profiles, whereas the measurement of dissolved oxygen provides a clear indica-
tion of oxygen limitation. During cultivation at a high shaking rate of 1020 rpm 0.89 g L-1 of
biomass was produced at 15 h of cultivation. During this process, it consumed all the glucose,
which was accompanied with an increase in ethanol concentration. Figure 5.1-3C shows a fit
between experimental and simulated data of biomass, glucose and ethanol concentrations.
Specific growth rate that was calculated by the model was 0.27 h-1. Experimentally deter-
mined ethanol concentration at 13.5 h was 2.75 g L-1, where as the corrected ethanol concen-
tration by the model was 3.06 g L-1 corresponding to about 10 % difference. Estimated yields
at 13.5 h were: YXS = 0.091 g g-1; YPS = 0.34 g g-1 and YPX = 3.7 g g-1. YXS is slightly larger
than in the oxygen limited case with a shaking rate of 540 rpm and YPS is slightly lower. The
deviations are, however not really significant since the error of estimation of these yields is in
the order of 5 to 10 %. Figure 5.1-3D shows the oxygen profile during the cultivation. The
measured DO concentration at 15 h was 95 %, which clearly shows that there wasn’t any
oxygen limitation throughout the cultivation. The specific growth rate for the first 8 h of cul-
tivation calculated by the model was 0.29 h-1, which was about 15 % higher than the above
reported growth rate. It was not possible to get any reliable estimate of the oxygen uptake rate
and therefore of YXO because of the very small difference of the measured dissolved oxygen
concentration from the saturation value. Determination of oxygen uptake rate and YXO using
the method proposed here requires cultivation at an appropriate oxygen transfer rate.

Results and discussion
54
Figure 5.1-3 Effect of shaking rate on oxygen limitation. suc2 strain was grown in 96-wellmicrotiter plate at two different shaking rates and correction for evaporation loss of ethanolwas made by using dynamic model. A fit was shown between these experimental data andsimulated data. At low shaking rate of 540 rpm, Biomass ( ), glucose consumption ( ) andethanol production profiles ( ) and corrected ethanol concentration (line) (A), Oxygen pro-file ( ) (B). At high shaking rate of 1020 rpm. Biomass ( ), glucose consumption ( ) andethanol production profiles ( ) and corrected ethanol concentration (line) (C), oxygen profile( ) (D).
This clearly indicates that at these operation conditions balanced growth prevailed throughout
the cultivation without oxygen limitation. The data of this strain were compared with that of
the reference strain (Table 5.1-2). The observed specific growth rate and the biomass yield on
glucose were significantly lower compared to the reference strain, whereas biomass yield on
oxygen and ethanol yield on glucose were not significantly different. The biological meaning
of these differences is not really clear since deletion of SUC2 should not have any effect,
provided the exclusive function of SUC2 was its known fructofuranosidase activity.
55..11..55 MMeetthhoodd VVaalliiddaattiioonnTo experimentally further proof the developed method, growth characteristics of mutants
with similar knocked out ORF functions were compared. We selected gene deletions for two
isoenzymes of 6-phosphofructose-2-kinase, pfk26 and pfk27 . It has bee reported that these
two genes have almost identical function and identical kinetic behaviour in susceptibility to
activation by cAMP-dependent protein kinase (Aragon et al., 1987). The second selected pair
Time (h)1614121086420
0.8
0.6
0.4
0.2
0
80
60
40
20
0
Time (h)
Bio
mas
s(g
L-1)
DO
(%)
B
12
10
8
6
4
2
0
Glu
cose
(gL-1
)AB
iom
ass,
Etha
nol(
gL-1
) 4
3
2
1
0
Bio
mas
s(g
L-1)
12
10
8
6
4
2
0
Glu
cose
(gL-1
)C
Bio
mas
s,Et
hano
l(g
L-1) 4
3
2
1
0
DO
(%)
1614121086420
80
60
40
20
0
D0.8
0.6
0.4
0.2
0
Time (h)1614121086420
0.8
0.6
0.4
0.2
0
80
60
40
20
0
Time (h)
Bio
mas
s(g
L-1)
DO
(%)
B
Time (h)1614121086420
0.8
0.6
0.4
0.2
0
80
60
40
20
0
Time (h)
Bio
mas
s(g
L-1)
DO
(%)
B
12
10
8
6
4
2
0
Glu
cose
(gL-1
)AB
iom
ass,
Etha
nol(
gL-1
) 4
3
2
1
12
10
8
6
4
2
0
Glu
cose
(gL-1
)AB
iom
ass,
Etha
nol(
gL-1
) 4
3
2
1
0
Bio
mas
s(g
L-1)
12
10
8
6
4
2
0
Glu
cose
(gL-1
)C
Bio
mas
0
Bio
mas
s(g
L-1)
12
10
8
6
4
2
0
Glu
cose
(gL-1
)C
Bio
mas
s,Et
hano
l(g
L-1) 4
3
2
1
0
DO
(%)
1614121086420
80
60
40
20
0
D0.8
0.6
0.4
0.2
0

Results and discussion
55
is nrg1 and nrg2 . These two regulatory proteins involved in glucose repression, are two
very similar proteins, which have closely related functions in the regulation of glucose-
repressed genes (Vyas et al., 2001; Berkey et al., 2004). However, these genes are themselves
differently regulated in response to carbon source. Growing on glucose as sole carbon source,
one would expect similar physiological behaviour of these strains. Experiments showed sig-
nificant decreases in growth rate and biomass yield on glucose of all four mutants compared
to the reference strain. At the same time biomass yield on oxygen increased significantly
which indicates a reduction in respiratory activities compared to the reference strain. Higher
biomass yield is consistent with increased respiratory activity with higher ATP-yields.
Changes in ethanol yield on glucose were not significant. This indicates that there must be
other fermentation products apart from ethanol since the same fraction of glucose was trans-
formed into ethanol in all experiments (Table 5.1-2).
Table 5.1-2 Stoichiometric data of the examined strains originating from the reference strainS. cerevisiae BY4742 Mat his3 1 leu2 0 lys2 0 ura3 0. (Relative errors were calculatedfrom each duplicate measurement for specific growth rates and yields. The average relativeerror of each parameter was applied for the calculation of the errors.)Strainname
Silencedgene
Specific growthrate
µ (h-1)
Biomass yieldon glucoseYXS (g g-1)
Biomass yieldon oxygenYXO (g g-1)
Corrected etha-nol yield on
glucoseYPS (g g-1)
Reference - 0.306 0.006 0.128 0.008 12.8 1.3 0.35 0.03YIL107C PFK26 0.231 0.004 0.085 0.006 32.7 3.2 0.36 0.03YOL136C PFK27 0.243 0.005 0.082 0.006 28.8 2.8 0.36 0.03YDR043C NRG1 0.228 0.004 0.098 0.006 30.1 3.0 0.30 0.03YBR066C NRG2 0.224 0.004 0.087 0.006 30.0 3.0 0.30 0.03YIL162W SUC2 0.270 0.005 0.091 0.006 10.1 1.0 0.34 0.03
55..11..66 CCoommppaarraattiivvee pphhyyssiioollooggiiccaall aannaallyyssiissAfter an initial selection, mutants were first cultivated on glucose at high shaking rate of 1020
rpm. Then mutants were classified into three groups. Some mutants grew only slowly with
µmax < 0.17 h-1. These were not further quantitatively investigated with the method developed
here because of too high evaporation of ethanol and water during long term cultivation.
Strains growing with specific growth rates of 0.17 to 0.26 h-1 were classified as slow growers
and were later cultivated together to allow a reasonable common harvest time point. The rest
of the strains with growth rates higher than 0.26 h-1 were classified as fast growers, which
were also cultivated as a group for more detailed studies. From these group-wise cultivations

Results and discussion
56
maximum specific growth rates, µmax, and yield coefficients of biomass and ethanol on glu-
cose were determined. All strains that did not show a significant decrease of dissolved oxy-
gen concentration were then cultivated at a shaking rate of 540 rpm to determine oxygen up-
take rates. In cases, where only a few biomass data points were measured within the period of
dissolved oxygen concentration higher than 20 % air saturation, the specific growth rate of
the fully aerated culture was applied. The resulting data set is listed in Table 5.1-3 for glucose
and in Table 5.1-4 for galactose. The errors for the estimation of growth rates, biomass and
ethanol yields were typically between 5 and 10 %, whereas the error for biomass yield on
oxygen was typically between 10 and 20 %. These allow various ways of comparison of the
mutants. First, specific rates calculated from specific growth rate and yield coefficients are
compared. Next, growth parameters of all strains on both sugars are compared. Then, every
single mutant is compared with the reference strain. Later, binary comparisons of all mutants
with respect to the 4 parameters determined for glucose and galactose as carbon substrates
follow.
55..11..66..11 CCoommppaarriissoonn ooff ssppeecciiffiicc rraatteess aanndd yyiieellddss ooff mmuuttaanntt sseett
In Figure 5.1-4 specific hexose consumption rates, qHexose, specific rates of ethanol produc-
tion, qEthanol, and specific oxygen consumption rates are plotted versus the maximum specific
growth rate of each mutant, µmax. From a first inspection it is evident that growth on galactose
is clearly different from growth on glucose. On glucose substrate consumption and ethanol
production are typically higher and respiration is clearly repressed. The parental reference
strain, indicated by the arrows, has about average characteristics for all specific rates. As
mentioned earlier, strains growing with slower rates than 0.17 h-1 were excluded from this
analysis. As expected, the strains gal4 , gal7 and gal10 did not grow on galactose at all.
Generally, the specific hexose uptake rate, qHexose, and the specific rate of ethanol production,
qEthanol, were about proportional to the specific growth rate, µmax, whereby the increase of
qEthanol with µmax was slightly higher on glucose than on galactose. The specific oxygen up-
take rate, qO2, was generally low on glucose because of the Crabtree-effect but qO2 increased
with increasing µmax. Oxygen uptake varied much more on galactose with some highly respir-
ing strains and a few almost complete lacking of respiration.
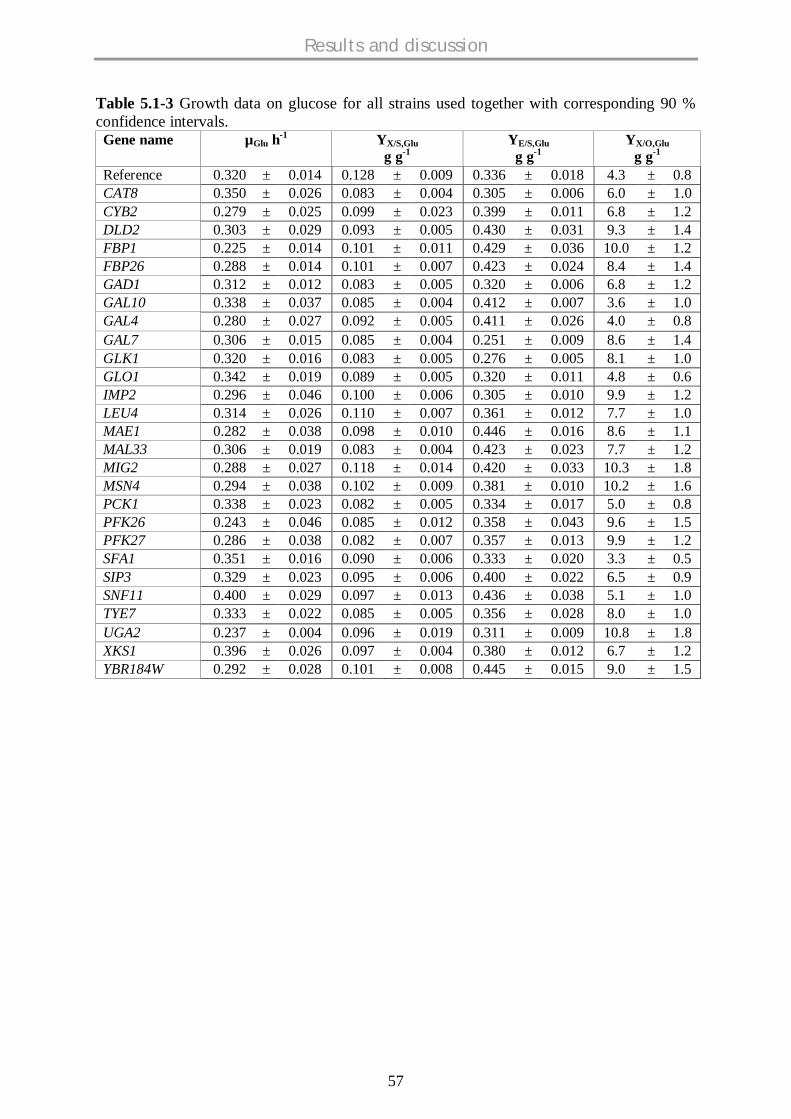
Results and discussion
57
Table 5.1-3 Growth data on glucose for all strains used together with corresponding 90 %confidence intervals.Gene name µGlu h-1 YX/S,Glu
g g-1YE/S,Glu
g g-1YX/O,Glu
g g-1
Reference 0.320 ± 0.014 0.128 ± 0.009 0.336 ± 0.018 4.3 ± 0.8CAT8 0.350 ± 0.026 0.083 ± 0.004 0.305 ± 0.006 6.0 ± 1.0CYB2 0.279 ± 0.025 0.099 ± 0.023 0.399 ± 0.011 6.8 ± 1.2DLD2 0.303 ± 0.029 0.093 ± 0.005 0.430 ± 0.031 9.3 ± 1.4FBP1 0.225 ± 0.014 0.101 ± 0.011 0.429 ± 0.036 10.0 ± 1.2FBP26 0.288 ± 0.014 0.101 ± 0.007 0.423 ± 0.024 8.4 ± 1.4GAD1 0.312 ± 0.012 0.083 ± 0.005 0.320 ± 0.006 6.8 ± 1.2GAL10 0.338 ± 0.037 0.085 ± 0.004 0.412 ± 0.007 3.6 ± 1.0GAL4 0.280 ± 0.027 0.092 ± 0.005 0.411 ± 0.026 4.0 ± 0.8GAL7 0.306 ± 0.015 0.085 ± 0.004 0.251 ± 0.009 8.6 ± 1.4GLK1 0.320 ± 0.016 0.083 ± 0.005 0.276 ± 0.005 8.1 ± 1.0GLO1 0.342 ± 0.019 0.089 ± 0.005 0.320 ± 0.011 4.8 ± 0.6IMP2 0.296 ± 0.046 0.100 ± 0.006 0.305 ± 0.010 9.9 ± 1.2LEU4 0.314 ± 0.026 0.110 ± 0.007 0.361 ± 0.012 7.7 ± 1.0MAE1 0.282 ± 0.038 0.098 ± 0.010 0.446 ± 0.016 8.6 ± 1.1MAL33 0.306 ± 0.019 0.083 ± 0.004 0.423 ± 0.023 7.7 ± 1.2MIG2 0.288 ± 0.027 0.118 ± 0.014 0.420 ± 0.033 10.3 ± 1.8MSN4 0.294 ± 0.038 0.102 ± 0.009 0.381 ± 0.010 10.2 ± 1.6PCK1 0.338 ± 0.023 0.082 ± 0.005 0.334 ± 0.017 5.0 ± 0.8PFK26 0.243 ± 0.046 0.085 ± 0.012 0.358 ± 0.043 9.6 ± 1.5PFK27 0.286 ± 0.038 0.082 ± 0.007 0.357 ± 0.013 9.9 ± 1.2SFA1 0.351 ± 0.016 0.090 ± 0.006 0.333 ± 0.020 3.3 ± 0.5SIP3 0.329 ± 0.023 0.095 ± 0.006 0.400 ± 0.022 6.5 ± 0.9SNF11 0.400 ± 0.029 0.097 ± 0.013 0.436 ± 0.038 5.1 ± 1.0TYE7 0.333 ± 0.022 0.085 ± 0.005 0.356 ± 0.028 8.0 ± 1.0UGA2 0.237 ± 0.004 0.096 ± 0.019 0.311 ± 0.009 10.8 ± 1.8XKS1 0.396 ± 0.026 0.097 ± 0.004 0.380 ± 0.012 6.7 ± 1.2YBR184W 0.292 ± 0.028 0.101 ± 0.008 0.445 ± 0.015 9.0 ± 1.5

Results and discussion
58
Table 5.1-4 Growth data on galactose for all strains used together with corresponding 90 %confidence intervals.
Gene name µGlu h-1 YX/S,Galg g-1
YE/S,Galg g-1
YX/O,Galg g-1
Reference 0.223 ± 0.012 0.190 ± 0.014 0.325 ± 0.019 1.3 ± 0.3CAT8 0.276 ± 0.008 0.148 ± 0.006 0.380 ± 0.014 25.0 ± 5.0CYB2 0.307 ± 0.069 0.119 ± 0.015 0.209 ± 0.006 1.7 ± 0.2DLD2 0.199 ± 0.005 0.189 ± 0.012 0.187 ± 0.028 1.3 ± 0.2FBP1 0.335 ± 0.019 0.214 ± 0.011 0.186 ± 0.022 1.1 ± 0.3FBP26 0.236 ± 0.021 0.132 ± 0.011 0.251 ± 0.013 2.0 ± 0.2GAD1 0.316 ± 0.021 0.166 ± 0.010 0.402 ± 0.018 1.8 ± 0.3GAL10 0.005 ± 0.001 - ± - - ± - - ± -GAL4 0.005 ± 0.001 - ± - - ± - - ± -GAL7 0.005 ± 0.001 - ± - - ± - - ± -GLK1 0.243 ± 0.023 0.122 ± 0.002 0.236 ± 0.004 1.5 ± 0.2GLO1 0.316 ± 0.023 0.131 ± 0.007 0.237 ± 0.013 2.4 ± 0.3IMP2 0.293 ± 0.017 0.164 ± 0.004 0.211 ± 0.012 1.6 ± 0.3LEU4 0.220 ± 0.011 0.239 ± 0.013 0.294 ± 0.005 1.2 ± 0.2MAE1 0.260 ± 0.015 0.181 ± 0.011 0.367 ± 0.033 1.4 ± 0.2MAL33 0.196 ± 0.013 0.183 ± 0.010 0.159 ± 0.026 1.9 ± 0.2MIG2 0.340 ± 0.028 0.140 ± 0.009 0.366 ± 0.030 4.5 ± 1.0MSN4 0.261 ± 0.018 0.123 ± 0.007 0.356 ± 0.033 1.9 ± 0.2PCK1 0.181 ± 0.012 0.158 ± 0.009 0.131 ± 0.014 1.7 ± 0.4PFK26 0.234 ± 0.013 0.235 ± 0.008 0.312 ± 0.012 1.3 ± 0.3PFK27 0.268 ± 0.028 0.145 ± 0.007 0.158 ± 0.017 5.6 ± 0.6SFA1 0.253 ± 0.021 0.147 ± 0.014 0.409 ± 0.027 1.2 ± 0.3SIP3 0.272 ± 0.014 0.134 ± 0.007 0.328 ± 0.014 1.9 ± 0.3SNF11 0.207 ± 0.011 0.154 ± 0.005 0.406 ± 0.020 22.0 ± 4.0TYE7 0.216 ± 0.018 0.136 ± 0.010 0.286 ± 0.026 1.7 ± 0.2UGA2 0.221 ± 0.015 0.156 ± 0.007 0.143 ± 0.013 1.3 ± 0.3XKS1 0.297 ± 0.020 0.084 ± 0.003 0.225 ± 0.007 1.7 ± 0.2YBR184W 0.259 ± 0.011 0.119 ± 0.008 0.275 ± 0.028 3.3 ± 0.4

Results and discussion
59
Figure 5.1-4 Specific conversion rates of carbon substrate, ethanol and oxygen as function ofthe specific growth rate, µmax, for selected deletion mutants during growth on glucose andgalactose (Tables 5.1-3 and 5.1-4). -glucose; - galactose. Arrows indicate the referencestrain BY4742 Mat his3 1 leu2 0 lys2 0 ura3 0.
The maximum sugar uptake was close to 25 mmol g-1 h-1. On glucose, 11 strains consumed
glucose at rates higher than 20 mmol g-1 h-1: cat8 – 23.3; gad1 – 20.8; gal10 – 22.1;
glk1 – 21.3; mal33 – 20.5; pck1 – 22.8; sfa1 – 21.6; glo1 – 21.3; snf11 – 22.9; tye7
– 21.8; xks1 – 22.6 mmol g-1 h-1, whereas a single mutant consumed galactose at such high
rate: xks1 - 19.6 mmol g-1 h-1. Rodriguez-Pena et al. (1998) assigned this gene xylulokinase
activity. Most of the high glucose consumers had specific oxygen consumption rates below 2
mmol g-1 h-1, but on galactose xks1 consumed oxygen at about 5.6 mmol g-1 h-1. At the same
time it had a relatively low specific maximum ethanol production rate of 17.3 mmol g-1 h-1 on
galactose. On glucose, all high rate glucose consumers had values of qEthanol between 20 and
40 mmol g-1 h-1 (Figure 5.1-5).

Results and discussion
60
Figure 5.1-5 Specific conversion rates of ethanol and oxygen as function of the specific hex-ose consumption rate, qHexose, for selected deletion mutants during growth on glucose andgalactose (Tables 5.1-3 and 5.1-4). -glucose; - galactose. Arrows indicate the referencestrain BY4742 Mat his3 1 leu2 0 lys2 0 ura3 0. Straight line indicates the maximumpossible ethanol yield of 2 mol mol-1
Some of the strains growing on galactose showed very high respiratory capacities with the
following qO2 values (mmol g-1 h-1): fbp1 - 9.3; imp2 - 8.1; sfa1 - 6.6. The two almost
respiratory deficient mutants were cat8 and snf11 that are both involved in RNA pol II
transcription factor activity. There isn’t any report so far reporting similar effects. Overall,
this part of the analysis shows that a significant number of strains show activities, which are
quite different from the reference strain. Some of them show entirely unanticipated improve-
ments of biotechnological interest. A number of strains grow clearly faster than the reference
strain. A significant number had higher specific substrate uptake rates and also high ethanol
production rates. The mig2 mutant, involved in the regulation of transcription from the pol
II promoter, showed qEthanol on galactose even higher than the corresponding value of the ref-
erence strain growing on glucose.
Figure 5.1-6 shows the missing carbon balance from these strains on glucose and galactose.
Most of the strains had less than 30 % of missing carbon balance, whereas few strains had
about 35 - 45 % of missing carbon balance, especially on galactose, which could be due to
the production of other metabolites, e.g. glycerol.

Results and discussion
61
Figure 5.1-6 Missing carbon balance (%) on glucose and galactose for the selected strains.
55..11..66..22 CCoommppaarriissoonn wwiitthh rreeffeerreennccee ssttrraaiinn
The reference strain was quite close to an average value with respect to µmax, qO2, qEthanol on
galactose and qGalactose, where qGlucose and qEthanol on glucose were at the lower boundary of the
observed values (figures 5.1-4, 5.1-5 and 5.1-7 and Table 5.1-3). µmax on glucose of the refer-
ence strain was identical with dld2 , gad1 , gal10 , glk1 , imp2 , leu4 , sip3 and tye7 ;
on galactose with fbp26 , leu4 , tye7 and uga2 . Therefore, for leu4 and tye7 , µmax was
indistinguishable from the reference strain on glucose and on galactose. dld2 , fbp1 ,
fbp26 , gal4 , leu4 , mig2 , pfk26 , sip3 , snf11 and ybr184w had the same biomass
yield on glucose; dld2 , mae1 and mal33 on galactose and therefore no strain had the
same YX/S on both sugars. gad1 , glo1 , leu4 , pck1 , pfk26 , pfk27 , sfa1 and tye7
showed the same ethanol yield on glucose, YE/S, as the reference strain, mae1 , mig2 ,
msn4 , pfk26 and sip3 on galactose and pfk26 on both sugars. Biomass yields on oxygen,

Results and discussion
62
YX/O, of the reference strain were identical with gal10 , gal4 and glo1 during growth on
glucose, with dld2 , fbp1 , glk1 , imp2 , leu4 , mae1 , pck1 , pfk26 , sfa1 and uga2
on galactose and no single strain had identical YX/O on both sugars.
Figure 5.1-7 Stoichiometric profiling of selected yeast deletion mutants. Correlation betweenspecific growth rate, µmax, and biomass yields, YX/S, on glucose (A) and galactose (C) as wellas with ethanol yield, YE/S, on glucose (B) and galactose (D). Circled points indicate the ref-erence strain BY4742 Mat his3 1 leu2 0 lys2 0 ura3 0.

Results and discussion
63
Another interesting comparison relates physiological parameters on both sugars for each sin-
gle mutant (Figure 5.1-7). YE/S was only identical for the reference strain on glucose (0.336 ±
0.018 g g-1) and galactose (0.325 ± 0.019 g g-1). The specific growth rate, µmax, was identical
on both sugars for cyb2 , gad1 , imp2 , mae1 , pfk26 and pfk27 , respectively. Two
strains grew slower on glucose than on galactose, fbp1 : glucose - 0.225 h-1 and galactose -
0.335 h-1 and mig2 : glucose - 0.288 h-1 and galactose - 0.340 h-1. fbp1 , fructose-
bisphosphatase, is usually required for gluconeogenesis and is therefore considered of minor
importance for growth on glucose and galactose, which joins glycolysis at the level of glu-
cose 6-phosphate. mig2 has RNA pol II transcription factor activity and it remains unclear,
why the deletion of this gene has such a pronounced effect on the growth on galactose.
55..11..66..33 CCoommppaarriissoonn ooff mmuuttaannttss aaggaaiinnsstt mmuuttaannttss
All the examined mutants were compared against each other in all eight dimensions. We
searched for the indistinguishable strain combinations. Depending on the parameter investi-
gated and on the substrate the discrimination between strains varied (Table 5.1-5).
Table 5.1-5 Strains not distinguishable based on maximum specific growth rate, µmax, bio-mass yield on carbon substrate, YX/S, ethanol yield on carbon substrate, YE/S, and on biomassyield on oxygen, YX/O, and growth on glucose and/or galactose as limiting substrate.
µmax YX/S YE/S YX/O allGlucose 109 337 114 85 13Galactose 44 65 52 109 1Glucose and galactose 44 58 17 28 0
Generally, with this set of strains the discrimination was stronger with galactose except on
the basis of YX/O where growth on glucose was more discriminative. Experiments on galac-
tose alone would only lead to one indistinguishable mutant pair, msn4 - sip3 . Both genes
have transcription factor activity, MSN4 upon stress and SIP3 in connection with transcrip-
tion initiation from pol II. On glucose alone, the 13 indistinguishable pairs were: dld2 -
fbp26 , dld2 – mae1 , dld2 - mig2 , dld2 - ybr184w , fbp26 - mae1 , fbp26 -
ybr184w , glo1 - pck1 , leu4 - tye7 , mae1 - mal33 , mae1 - ybr184w , mig2 -
msn4 and mig2 - ybr184w .

Results and discussion
64
55..11..66..44 HHiieerraarrcchhiiccaall cclluusstteerriinngg
In order to identify mutant pairs with similar physiological profiling, hierarchical clustering
was done using stoichiometric data on glucose, galactose, and combined data on glucose and
galactose i.e., µmax, YX/S, YE/S and YX/O using Euclidian distance as a distance metric. The rela-
tive Euclidian distances were calculated between mutant pairs and also between mutant and
the reference strain.
Glucose
The top five most closely related mutant pairs were mae1 -ybr184w (0.07); fbp26 -
mae1 (0.077); glo1 -pck1 (0.088); fbp26 - ybr184w (0.101); gal7 -glk1 (0.108). The
top three most closely related mutants with the reference strain were glo1 (0.427); sfa1
(0.436) and gal4 (0.453) and one mutant, uga2 (0.975) was distantly related to the refer-
ence strain indicating that this strain had a clear phenotype when grown on glucose. The
measured Euclidean distances were visualised as dendrogram and the data revealed 3 main
clusters, highlighted with colours in Figure 5.1-8.
Figure 5.1-8 Dendrogram on glucose. Hierarchical clustering was done using stoichiometricdata by using Euclidean distances as a metric.
In the first cluster (top to bottom), few strains that are involved in galactose metabolism were
clustered close to the reference strain for e.g., gal10 and gal4 suggesting no clear pheno-

Results and discussion
65
type on glucose. In the second cluster, isoenzymes pfk26 and pfk27 (phosphofructokinase
activity) were clustered together suggesting an identical phenotype and mae1 , fbp26 and
dld2 that are involved in pyruvate metabolism and glucose metabolic process were clustered
together and also close to the hypothetical gene ybr184w .
GGaallaaccttoossee
Similarly hierarchical clustering was done using stoichiometric data on galactose as well and
the relative Euclidian distances were calculated between mutant pairs and also between mu-
tant and the reference strain. The top five most closely related mutant pairs were leu4 -
pfk26 (0.097); msn4 -sip3 (0.133); fbp26 -glk1 (0.162); fbp26 - tye7 (0.177); dld2
-mal33 (0.196). The top three most closely related mutants with the reference strain were
mae1 (0.231); pfk26 (0.296) and leu4 (0.335). The measured Euclidean distances were
visualised as dendrogram and the data revealed 4 main clusters, highlighted with colours in
Figure 5.1-9.
Figure 5.1-9 Dendrogram on galactose. Hierarchical clustering was done using stoichiomet-ric data by using Euclidean distances as a metric.

Results and discussion
66
The clustering results were different on glucose and galactose suggesting substrate specific
phenotypes of the mutant strains. The distance between the mutant pairs is smaller on glucose
than on galactose, representing strong phenotype of deletion mutants on galactose when
compared to glucose grown conditions. Furthermore, two mutants, snf11 (5.62) and cat8
(6.43) were very distantly related to the reference strain. Whereas these strains were ten times
closer to the reference strain when grown on glucose (snf11 -0.51 and cat8 -0.54) indicat-
ing that these strains had clearer phenotypes when grown on galactose than on glucose.
CCoommbbiinneedd aannaallyyssiiss –– GGlluuccoossee aanndd GGaallaaccttoossee
Hierarchical clustering was done using combined stoichiometric data on glucose and galac-
tose and the relative Euclidian distances were calculated in the similar fashion. The top five
most closely related mutant pairs were dld2 –mal33 (0.31); glk1 –tye7 (0.328); sip3 –
tye7 (0.39); fbp26 – ybr184w (0.398); leu4 –pfk26 (0.444). The top three most closely
related mutants with the reference strain were leu4 (0.601); sfa1 (0.615) and sip3 (0.663).
The measured Euclidean distances were visualised as dendrogram and the data revealed 4
main clusters, highlighted with colours in Figure 5.1-10.
Figure 5.1-10 Dendrogram for glucose and galactose data. Hierarchical clustering was doneusing stoichiometric data by using Euclidean distances as a metric.

Results and discussion
67
55..11..77 CCoonncclluussiioonnssTwenty-seven deletion mutants of S. cerevisiae were investigated using a novel method for
high-content stoichiometric and kinetic metabolic profiling. From high-throughput quantita-
tive stoichiometric profiling of yeast mutants at miniaturized scale, quantitative information
was obtained about the metabolism of all tested mutants. Cultivation on glucose and galac-
tose in 96-well microtiter plates with on-line optical sensing of dissolved oxygen was repro-
ducible and identical to shake flask cultivation. At high shaking rate (1020 rpm) there was no
oxygen limitation throughout all cultivations whereas at low shaking rate (540 rpm) oxygen
uptake rate could be measured during declining dissolved oxygen concentration.
First one could detect, whether oxygen limitation is occurring during cultivation using the
oxygen sensing microtiter plate. Secondly, dissolved oxygen profiles indicate most substrate
limitations and diauxic behaviour (Figures 5.1-1 and 5.1-3). The application of a simple bal-
anced growth model allows correction for ethanol and water evaporation. From this new
method, reliable data for specific growth rate, biomass and ethanol yields on carbon substrate
and biomass yield on oxygen were calculated. Using the two substrates glucose and galac-
tose, overall 8 parameters were obtained which could successfully discriminate between the
27 strains described here. Maximum specific growth rates were in the same range for both
sugars. On glucose the growth was predominantly fermentative with high yield of ethanol,
low yield of biomass and low oxygen consumption rate. Clustering analysis on glucose re-
vealed that knockout strains with similar function were clustered together. On galactose, res-
piration was more active with correspondingly lower ethanol yields, higher biomass yields
and higher rates of oxygen consumption. The clustering results were different on galactose
than on glucose with large distance between the mutant strains and to the reference strain
suggesting strong phenotypes on galactose. Some strains showed unexpectedly high or low
growth rates and rates of ethanol production and respiration. Overall the four parameters de-
termined for each mutant on two different carbon sources (Figure 5.1-10) allowed statistically
significant discrimination of all mutants studied.
Results and discussion
68
55..22 MMAALLDDII--TTOOFF--MMSS FFOORR MMEETTAABBOOLLIICC FFLLUUXX AANNAALLYYSSEESSUUSSIINNGG IISSOOTTOOPPEE LLAABBEELLEEDD EETTHHAANNOOLL
Most of the results presented in this chapter are contained in the following publication.
Hollemeyer, K., Velagapudi, V.R., Wittmann, C., Heinzle, E., 2007. Matrix-assistedlaser desorption/ionization time-of-flight mass spectrometry for metabolic flux analysesusing isotope-labeled ethanol. Rapid Commun Mass Spectrom. 21, 336-342.
55..22..11 BBaacckkggrroouunnddUnknown gene function can be determined by phenotypic analysis of mutants missing the
gene of interest (Winzeler et al., 1999; Que et al., 2002). Complete libraries of gene deletion
mutants of S. cerevisiae have been established (Giaever et al., 2002; Brachmann et al., 1998).
Gene function analysis would be greatly supported by additional analysis of metabolic flux
distributions of mutants of this library. This requires the analysis of substrate consumption as
well as of biomass and product formation. Flux distribution can be determined by feeding13C-labeled substrate with subsequent precise analysis of metabolites or products by using
mass spectrometry (MS). This is also possible at a microliter scale using, e.g., 96-well mi-
croplates. Usually, ethanol is derivatized prior to GC/MS analysis (Knapp, 1979) and most
derivatizations have to be carried out in a water-free organic solvent. Derivatization of highly
diluted ethanol on the microtiter plate scale is therefore difficult because of the small amounts
produced, the high volatility of ethanol and the presence of the aqueous matrix.
A new method was developed for the quantification of isotope-labeled ethanol (A detailed
description of the method was given in the Materials and Methods section). The new method
is now routinely used for the determination of unlabeled and mono-13C-labeled ethanol as
products of 1-13C-labeled hexose substrates in yeast fermentation experiments. This permits
the calculation of the flux split ratio between glycolysis and the pentose-phosphate pathway
(PPP). Compared with standard GC/MS analysis the new application works with much higher
throughput, with an average MALDI-TOF measuring time of less than 30 s per sample with
the instrument applied here, and less than 2 s with a high-frequency laser instrument. For
high throughput purposes, all steps of the method can be automated. Furthermore, no hazard-
ous chemicals such as diazomethane or trimethylchlorosilane are required.
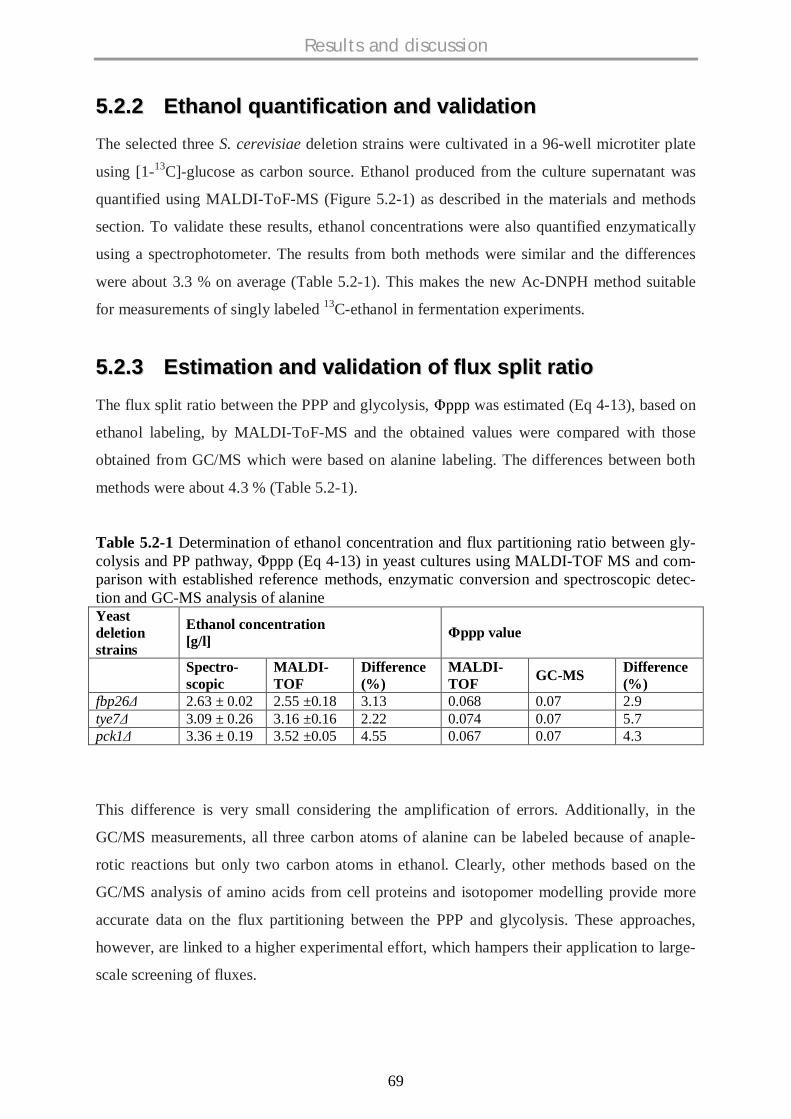
Results and discussion
69
55..22..22 EEtthhaannooll qquuaannttiiffiiccaattiioonn aanndd vvaalliiddaattiioonnThe selected three S. cerevisiae deletion strains were cultivated in a 96-well microtiter plate
using [1-13C]-glucose as carbon source. Ethanol produced from the culture supernatant was
quantified using MALDI-ToF-MS (Figure 5.2-1) as described in the materials and methods
section. To validate these results, ethanol concentrations were also quantified enzymatically
using a spectrophotometer. The results from both methods were similar and the differences
were about 3.3 % on average (Table 5.2-1). This makes the new Ac-DNPH method suitable
for measurements of singly labeled 13C-ethanol in fermentation experiments.
55..22..33 EEssttiimmaattiioonn aanndd vvaalliiddaattiioonn ooff fflluuxx sspplliitt rraattiiooThe flux split ratio between the PPP and glycolysis, ppp was estimated (Eq 4-13), based on
ethanol labeling, by MALDI-ToF-MS and the obtained values were compared with those
obtained from GC/MS which were based on alanine labeling. The differences between both
methods were about 4.3 % (Table 5.2-1).
Table 5.2-1 Determination of ethanol concentration and flux partitioning ratio between gly-colysis and PP pathway, ppp (Eq 4-13) in yeast cultures using MALDI-TOF MS and com-parison with established reference methods, enzymatic conversion and spectroscopic detec-tion and GC-MS analysis of alanineYeastdeletionstrains
Ethanol concentration[g/l] ppp value
Spectro-scopic
MALDI-TOF
Difference(%)
MALDI-TOF GC-MS Difference
(%)fbp26 2.63 ± 0.02 2.55 ±0.18 3.13 0.068 0.07 2.9tye7 3.09 ± 0.26 3.16 ±0.16 2.22 0.074 0.07 5.7pck1 3.36 ± 0.19 3.52 ±0.05 4.55 0.067 0.07 4.3
This difference is very small considering the amplification of errors. Additionally, in the
GC/MS measurements, all three carbon atoms of alanine can be labeled because of anaple-
rotic reactions but only two carbon atoms in ethanol. Clearly, other methods based on the
GC/MS analysis of amino acids from cell proteins and isotopomer modelling provide more
accurate data on the flux partitioning between the PPP and glycolysis. These approaches,
however, are linked to a higher experimental effort, which hampers their application to large-
scale screening of fluxes.
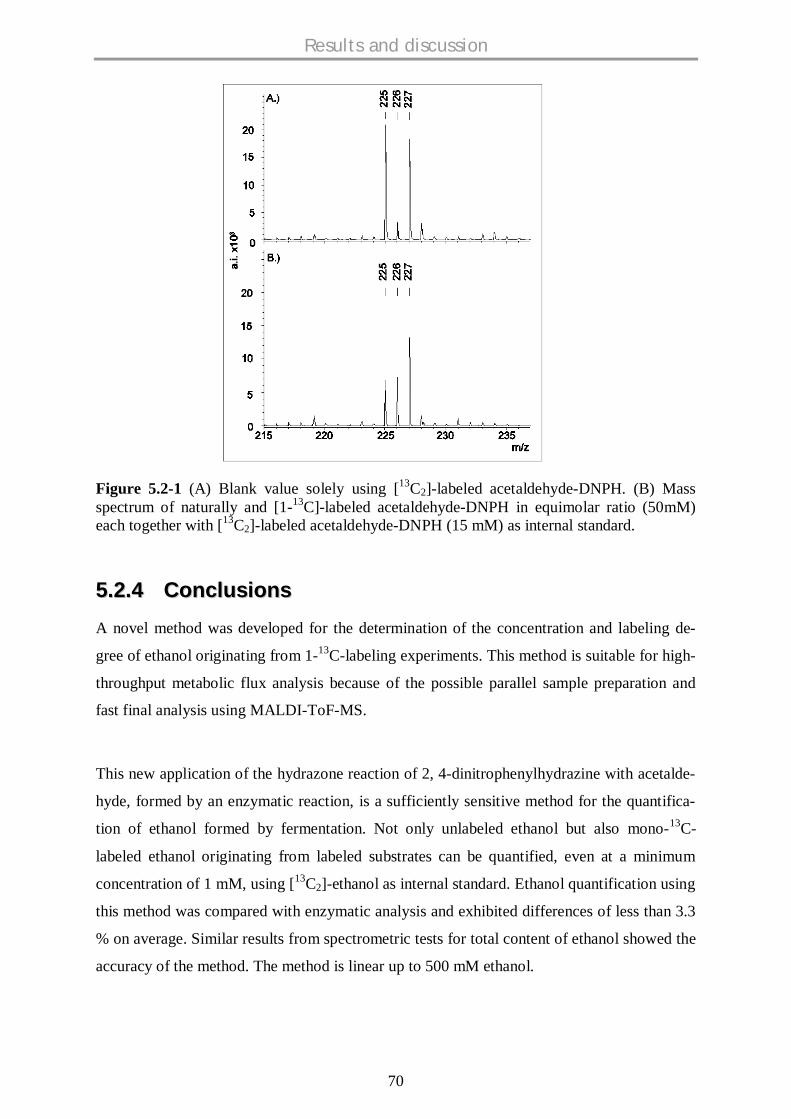
Results and discussion
70
Figure 5.2-1 (A) Blank value solely using [13C2]-labeled acetaldehyde-DNPH. (B) Massspectrum of naturally and [1-13C]-labeled acetaldehyde-DNPH in equimolar ratio (50mM)each together with [13C2]-labeled acetaldehyde-DNPH (15 mM) as internal standard.
55..22..44 CCoonncclluussiioonnssA novel method was developed for the determination of the concentration and labeling de-
gree of ethanol originating from 1-13C-labeling experiments. This method is suitable for high-
throughput metabolic flux analysis because of the possible parallel sample preparation and
fast final analysis using MALDI-ToF-MS.
This new application of the hydrazone reaction of 2, 4-dinitrophenylhydrazine with acetalde-
hyde, formed by an enzymatic reaction, is a sufficiently sensitive method for the quantifica-
tion of ethanol formed by fermentation. Not only unlabeled ethanol but also mono-13C-
labeled ethanol originating from labeled substrates can be quantified, even at a minimum
concentration of 1 mM, using [13C2]-ethanol as internal standard. Ethanol quantification using
this method was compared with enzymatic analysis and exhibited differences of less than 3.3
% on average. Similar results from spectrometric tests for total content of ethanol showed the
accuracy of the method. The method is linear up to 500 mM ethanol.

Results and discussion
71
Comparison of flux partitioning ratios between glycolysis and the pentose-phosphate pathway
(PPP) based on MALDI-TOFMS and gas chromatography GC/MS methods showed good
agreement, with differences for ethanol and alanine labeling of only 4.3 %. The main advan-
tage of the method compared with GC/MS methods is the possibility for high-throughput
analysis with parallel sample treatment using MALDI-TOFMS. Using MALDI-TOFMS,
large numbers of analyses of isotope-labeled ethanol can be performed almost in parallel with
measurement times of only a few seconds each. The sample preparation step of the new
method can also be automated using a robotic system. Therefore, this method is suitable for
high-throughput metabolic studies, e.g. of mutant libraries of yeast.
Results and discussion
72
55..33 MMEETTAABBOOLLIICC FFLLUUXX SSCCRREEEENNIINNGG OOFF SS.. CCEERREEVVIISSIIAAEEKKNNOOCCKKOOUUTT SSTTRRAAIINNSS OONN GGLLUUCCOOSSEE AANNDD GGAALLAACCTTOOSSEE AATTMMIINNIIAATTUURRIIZZEEDD SSCCAALLEE
Most of the results presented in this chapter are contained in the following publication.
Velagapudi, V.R., Wittmann, C., Schneider, K., Heinzle, E., 2007. Metabolic FluxScreening of Saccharomyces cerevisiae Single Knockout Strains on Glucose and Galactose Supports Elucidation of Gene Function. J Biotechnol. 132, 395–404.
55..33..11 BBaacckkggrroouunnddThe full understanding of yeast physiology requires quantitative methods. Continuous culti-
vation allows most thorough studies but requires an enormous amount of labour (von Meyen-
burg et al., 1969; Furukawa et al., 1983; Postma et al., 1989). Controlled batch cultivation
also may provide rich information (Westergaard et al., 2007) but the number of experiments
carried out is rather limited because of the high effort. New screening methods based on new
cultivation methods in microtiter plates as described in this thesis or by other groups (Fischer
and Sauer, 2003; Wittmann et al., 2004; Sauer, 2004) open up new possibilities in this field
particularly, when combined with modern analytical methods based on mass spectrometric
analysis.
The application of 13C-labelling techniques using mass spectrometry (Wittmann and Heinzle,
1999; 2001a and 2001b; Wittmann, 2002) shows a potential to carry out such analysis even at
a 96-well microtiter plate scale (Sauer, 2004) as was shown for C. glutamicum (Wittmann et
al., 2004), B. subtilis (Zamboni and Sauer, 2004) and E. coli (Fischer and Sauer, 2003).
Comprehensive flux analysis of yeast is complicated by the compartmentation, particularly
mitochondrial activity. Therefore, it requires extensive labelling analysis of amino acids con-
tained in cellular proteins (Frick and Wittmann, 2005; Blank et al., 2005; Gombert et al.,
2001) or even of intracellular metabolites (van Winden et al., 2005).
New microtiter plate cultivation techniques with integrated optical sensing of dissolved oxy-
gen (John et al., 2003) allow large-scale determination of specific growth rate, ethanol pro-
duction rate and glucose and oxygen consumption rates (Velagapudi et al., 2006). This study
Results and discussion
73
showed clear differences between strains cultivated on glucose and galactose. It also discov-
ered unexpected mobilization of metabolic potential and discrimination of all studied strains
using the four parameters mentioned above. It would be very interesting to extend the meta-
bolic information obtained by applying metabolic flux analysis. The above described new
technique in section 5.2, particularly suited to determine flux split ratios into the pentose
phosphate pathway in yeast that is based on MALDI-ToF mass spectrometry (Hollemeyer et
al., 2007). Using microtiter plate cultivation with dissolved oxygen measurement combined
with the new 13C flux screening method (for detailed description please refer to Materials and
Methods, section 4.10), a set of S. cerevisiae deletion mutants cultivated on glucose and ga-
lactose were studied to gain information about the function of deleted genes.
55..33..22 FFlluuxx tthhrroouugghh PPeennttoossee PPhhoosspphhaattee PPaatthhwwaayy ((PPPPPP))Metabolic flux split ratios at glucose 6-phosphate branch point towards pentose phosphate
pathway ( PPP) were obtained based on the ethanol labelling using MALDI-ToF-MS as de-
scribed in section 5.2.3. Based on the obtained PPP values, mutants were classified into three
groups. Strains having PPP of 0.05 to 0.15 were classified as strains with low PPP. On glu-
cose, 17 strains were having low PPP, whereas on galactose only 2 strains had low PPP.
Strains having PPP of 0.15 to 0.25 were classified as strains with high PPP. On glucose, 11
strains were having low PPP whereas on galactose, 9 strains had high PPP. Strains with PPP
of 0.25 to 0.35 were classified as strains with very high PPP. On galactose, 12 strains had
very high PPP whereas none of the strains had very high PPP on glucose. One strain mae1
had exceptionally very high PPP of 0.455 on galactose, whereas on glucose this strain mae1
had low PPP of 0.138 (Tables 5.3-1 and 5.3-2).
The flux through the PPP, PPP was correlated to the yield of biomass YXS, suggesting a bal-
anced production and consumption of NADPH. This trend was more certain on galactose
rather than on glucose (Figure 5.3-1).

Results and discussion
74
Figure 5.3-1 Comparison of biomass yield, YX/S, and flux partitioning into the pentose phos-phate pathway, PPP, in galactose and glucose cultures. Error bars indicate 90 % confidencelevels. - glucose; - galactose.

Results and discussion
75
Table 5.3-1 Growth data on glucose. Specific growth rate, µGlu, specific uptake rate of glucose, qGlu, specific rate of ethanol production, qETH,flux partitioning from glucose 6-phosphate into the pentose phosphate pathway, PPP,Glu; and from pyruvate/PEP into oxaloacetate/malate, A-
naplerotic,Glu, and biomass yield on glucose, YX/S,Glu, all with 90 % confidence levels. The last line shows the average values of all strains (Table5.1-1) and standard deviation between them.
Gene name µGlu h-1 qGlu mmol g-1 h-1 qETH mmol g-1 h-1PPP,Glu Anaplerotic,Glu YX/S,Glu g g-1
Reference 0.320 ± 0.014 13.9 ± 0.9 18.2 ± 1.5 0.102 ± 0.020 0.025 ± 0.004 0.128 ± 0.009CAT8 0.350 ± 0.026 23.4 ± 1.0 27.9 ± 1.3 0.170 ± 0.022 0.016 ± 0.002 0.083 ± 0.004CYB2 0.279 ± 0.025 15.6 ± 1.0 24.4 ± 1.7 0.142 ± 0.020 0.018 ± 0.003 0.099 ± 0.023DLD1 0.303 ± 0.029 18.1 ± 2.7 30.5 ± 5.1 0.081 ± 0.020 0.017 ± 0.003 0.093 ± 0.005FBP1 0.225 ± 0.014 12.4 ± 1.9 20.9 ± 3.6 0.191 ± 0.025 0.018 ± 0.003 0.101 ± 0.011FBP26 0.288 ± 0.014 15.8 ± 1.6 26.2 ± 3.1 0.153 ± 0.022 0.019 ± 0.003 0.101 ± 0.007GAD1 0.312 ± 0.012 20.8 ± 0.7 26.1 ± 1.0 0.156 ± 0.022 0.016 ± 0.002 0.083 ± 0.005GAL10 0.338 ± 0.037 22.1 ± 1.3 35.7 ± 2.2 0.158 ± 0.020 0.017 ± 0.003 0.085 ± 0.004GAL4 0.280 ± 0.027 16.9 ± 2.1 27.1 ± 3.8 0.174 ± 0.024 0.017 ± 0.003 0.092 ± 0.005GAL7 0.306 ± 0.015 20.0 ± 1.0 19.6 ± 1.2 0.138 ± 0.020 0.016 ± 0.002 0.085 ± 0.004GLK1 0.320 ± 0.016 21.3 ± 0.7 23.0 ± 0.8 0.184 ± 0.022 0.016 ± 0.002 0.083 ± 0.005GLO1 0.342 ± 0.019 21.3 ± 1.2 26.7 ± 1.8 0.114 ± 0.021 0.017 ± 0.003 0.089 ± 0.005IMP2 0.296 ± 0.046 16.4 ± 1.3 19.6 ± 1.7 0.133 ± 0.022 0.019 ± 0.003 0.100 ± 0.006LEU4 0.314 ± 0.026 15.8 ± 0.9 22.3 ± 1.5 0.116 ± 0.021 0.021 ± 0.003 0.110 ± 0.007MAE1 0.282 ± 0.038 16.0 ± 1.5 27.9 ± 2.7 0.139 ± 0.022 0.018 ± 0.003 0.098 ± 0.010MAL33 0.306 ± 0.019 20.6 ± 2.5 34.1 ± 4.5 0.157 ± 0.021 0.016 ± 0.003 0.083 ± 0.004MIG2 0.288 ± 0.027 13.5 ± 1.7 22.2 ± 3.3 0.086 ± 0.021 0.022 ± 0.004 0.118 ± 0.014MSN4 0.294 ± 0.038 16.0 ± 1.1 23.9 ± 1.8 0.090 ± 0.019 0.019 ± 0.003 0.102 ± 0.009PCK1 0.338 ± 0.023 22.9 ± 2.1 29.9 ± 3.1 0.076 ± 0.020 0.016 ± 0.002 0.082 ± 0.005PFK26 0.243 ± 0.046 15.8 ± 3.7 22.2 ± 5.8 0.212 ± 0.021 0.015 ± 0.002 0.085 ± 0.012PFK27 0.286 ± 0.038 19.3 ± 1.7 27.0 ± 2.5 0.101 ± 0.021 0.015 ± 0.002 0.082 ± 0.007SFA1 0.351 ± 0.016 21.6 ± 2.1 28.1 ± 3.2 0.157 ± 0.021 0.018 ± 0.003 0.090 ± 0.006SIP3 0.329 ± 0.023 19.2 ± 2.0 30.1 ± 3.6 0.145 ± 0.021 0.018 ± 0.003 0.095 ± 0.006SNF11 0.400 ± 0.029 22.9 ± 3.9 39.2 ± 7.5 0.108 ± 0.022 0.020 ± 0.004 0.097 ± 0.013TYE7 0.333 ± 0.022 21.8 ± 3.1 30.4 ± 4.9 0.181 ± 0.022 0.017 ± 0.003 0.085 ± 0.005UGA5 0.240 ± 0.004 14.0 ± 0.6 17.0 ± 0.9 0.128 ± 0.020 0.017 ± 0.003 0.096 ± 0.019XKS1 0.396 ± 0.026 22.6 ± 1.3 33.6 ± 2.3 0.132 ± 0.023 0.020 ± 0.003 0.097 ± 0.004YBR184W 0.292 ± 0.028 16.0 ± 1.2 27.9 ± 2.3 0.136 ± 0.022 0.019 ± 0.003 0.101 ± 0.008Average 0.309 ± 0.010 18.4 ± 0.9 26.5 ± 1.6 0.138 ± 0.001 0.018 ± 0.000 0.094 ± 0.005

Results and discussion
76
Table 5.3-2 Growth data on galactose. Specific growth rate, µGal, specific uptake rate of galactose, qGal, specific rate of ethanol production, qETH,flux partitioning from glucose 6-phosphate into the pentose phosphate pathway, PPP,Gal; and from pyruvate/PEP into oxaloacetate/malate, A-
naplerotic,Gal, and biomass yield on glucose, YX/S,Gal, all with 90 % confidence levels. The last line shows the average values of all strains and stan-dard deviation between them.Gene name µGal h-1 qGal mmol g-1 h-1 qETH mmol g-1 h-1
PPP,Gal Anaplerotic,Gal YX/S,Gal g g-1
Reference 0.223 ± 0.012 6.5 ± 0.2 8.3 ± 0.6 0.341 ± 0.029 0.037 ± 0.006 0.190 ± 0.014CAT8 0.276 ± 0.008 10.4 ± 0.2 15.4 ± 0.7 0.292 ± 0.028 0.029 ± 0.005 0.148 ± 0.006CYB2 0.307 ± 0.069 14.3 ± 1.1 11.7 ± 0.9 0.213 ± 0.021 0.023 ± 0.003 0.119 ± 0.015DLD1 0.199 ± 0.005 5.8 ± 0.2 4.3 ± 0.6 0.210 ± 0.022 0.035 ± 0.005 0.189 ± 0.012FBP1 0.335 ± 0.019 8.7 ± 0.3 6.3 ± 0.8 0.206 ± 0.023 0.045 ± 0.006 0.214 ± 0.011FBP26 0.236 ± 0.021 9.9 ± 0.5 9.7 ± 0.7 0.200 ± 0.024 0.024 ± 0.004 0.132 ± 0.011GAD1 0.316 ± 0.021 10.6 ± 0.4 16.7 ± 1.0 0.236 ± 0.026 0.034 ± 0.006 0.166 ± 0.010GAL10 0.000GAL4 0.000GAL7 0.000GLK1 0.243 ± 0.023 11.0 ± 0.5 10.2 ± 0.5 0.174 ± 0.023 0.022 ± 0.003 0.122 ± 0.002GLO1 0.316 ± 0.023 13.4 ± 0.5 12.4 ± 0.8 0.305 ± 0.028 0.026 ± 0.004 0.131 ± 0.007IMP2 0.293 ± 0.017 9.9 ± 0.3 8.2 ± 0.5 0.086 ± 0.021 0.032 ± 0.005 0.164 ± 0.004LEU4 0.220 ± 0.011 5.1 ± 0.2 5.9 ± 0.2 0.239 ± 0.013MAE1 0.260 ± 0.015 8.0 ± 0.3 11.5 ± 1.1 0.455 ± 0.030 0.037 ± 0.006 0.181 ± 0.011MAL33 0.196 ± 0.013 5.9 ± 0.2 3.7 ± 0.6 0.271 ± 0.026 0.034 ± 0.005 0.183 ± 0.010MIG2 0.340 ± 0.028 13.5 ± 0.6 19.3 ± 1.8 0.157 ± 0.021 0.028 ± 0.005 0.140 ± 0.009MSN4 0.261 ± 0.018 11.8 ± 0.5 16.4 ± 1.6 0.315 ± 0.026 0.024 ± 0.004 0.123 ± 0.007PCK1 0.181 ± 0.012 6.4 ± 0.2 3.3 ± 0.4 0.316 ± 0.026 0.029 ± 0.004 0.158 ± 0.009PFK26 0.234 ± 0.013 5.5 ± 0.2 6.8 ± 0.3 0.314 ± 0.026 0.047 ± 0.007 0.235 ± 0.008PFK27 0.268 ± 0.028 10.3 ± 0.5 6.4 ± 0.7 0.235 ± 0.024 0.028 ± 0.004 0.145 ± 0.007SFA1 0.253 ± 0.021 9.6 ± 0.5 15.3 ± 1.3 0.130 ± 0.023 0.027 ± 0.005 0.147 ± 0.014SIP3 0.272 ± 0.014 11.3 ± 0.4 14.5 ± 0.8 0.267 ± 0.025 0.026 ± 0.004 0.134 ± 0.007SNF11 0.207 ± 0.011 7.5 ± 0.2 11.9 ± 0.7 0.257 ± 0.024 0.028 ± 0.004 0.154 ± 0.005TYE7 0.216 ± 0.018 8.8 ± 0.4 9.9 ± 1.0 0.266 ± 0.024 0.025 ± 0.004 0.136 ± 0.010UGA5 0.277 ± 0.015 13.8 ± 0.4 12.5 ± 0.5 0.242 ± 0.028 0.021 ± 0.003 0.112 ± 0.004XKS1 0.297 ± 0.020 19.6 ± 0.6 17.3 ± 0.8 0.295 ± 0.027 0.016 ± 0.002 0.084 ± 0.003YBR184W 0.259 ± 0.011 12.1 ± 0.4 13.0 ± 1.4 0.273 ± 0.026 0.023 ± 0.003 0.119 ± 0.008Average 0.232 ± 0.012 10.0 ± 0.2 10.8 ± 0.4 0.252 ± 0.003 0.029 ± 0.001 0.155 ± 0.003

Results and discussion
The correlation of PPP between glucose and galactose showed PPP values are quite high on
galactose than on glucose. The reference strain itself showed three times higher PPP flux on
galactose than on glucose. Only 2 strains, glk1 and fbp1 had comparable PPP on both the
sugars. Mutant strains, pfk27 , sip3 , snf11 , xks1 and ybr184w had double PPP values
on galactose than on glucose; deletion strains, glo1 , msn4 and pck1 had three times
higher PPP values on galactose than on glucose. One strain, mae1 showed extremely high
about 3.5 times higher PPP values on galactose than on glucose. Interestingly two strains had
higher PPP values on glucose than on galactose, imp2’ (about tow times) and sfa1 (slightly
higher) (Figure 5.3-2; Tables 5.3-1 and 5.3-2).
Figure 5.3-2 Comparison of flux partitioning into the pentose phosphate pathway, PPP, ingalactose and glucose cultures. Error bars indicate 90 % confidence levels. The full straightline indicates identical values on glucose and galactose, the dashed one double ppp on galac-tose compared to glucose, and dotted line triple values.
An increasing hexose uptake rate was observed with increasing specific growth rate (Figure
5.3-3 upper part). An inverse correlation was observed between the maximum growth rate
and PPP on both the sugars (Figure 5.3-3 lower part).

Results and discussion
78
Figure 5.3-3 Specific growth rate, µ, specific hexose uptake rates, qHexose (upper part), andflux partitioning into the pentose phosphate pathway, PPP (lower part). Gene names arespecified in Table 5.1-1. Error bars indicate 90 % confidence regions (Tables 5.3-1 and 5.3-2). - glucose; - galactose.
55..33..33 FFlluuxx tthhrroouugghh AAnnaapplleerroottiicc ppaatthhwwaayyStrains having Anaplerotic of 0.005 to 0.015 were classified as strains with low Anaplerotic. On
glucose, 17 strains were having low Anaplerotic whereas on galactose only 1 strain had low
Anaplerotic. Strains having Anaplerotic of 0.015 to 0.025 were classified as strains with high
Anaplerotic. On glucose, 11 strains were having low Anaplerotic whereas on galactose 13 strains
had high Anaplerotic. Strains with Anaplerotic of 0.025 to 0.035 were classified as strains with
very high Anaplerotic. On galactose, 8 strains had very high Anaplerotic whereas none of the
strains had very high Anaplerotic on glucose. Two strains fbp1 and pfk26 had exceptionally
high Anaplerotic 0.0366 and 0.041 respectively on galactose (Figure 5.3-4; Tables 5.3-1 and
5.3-2).
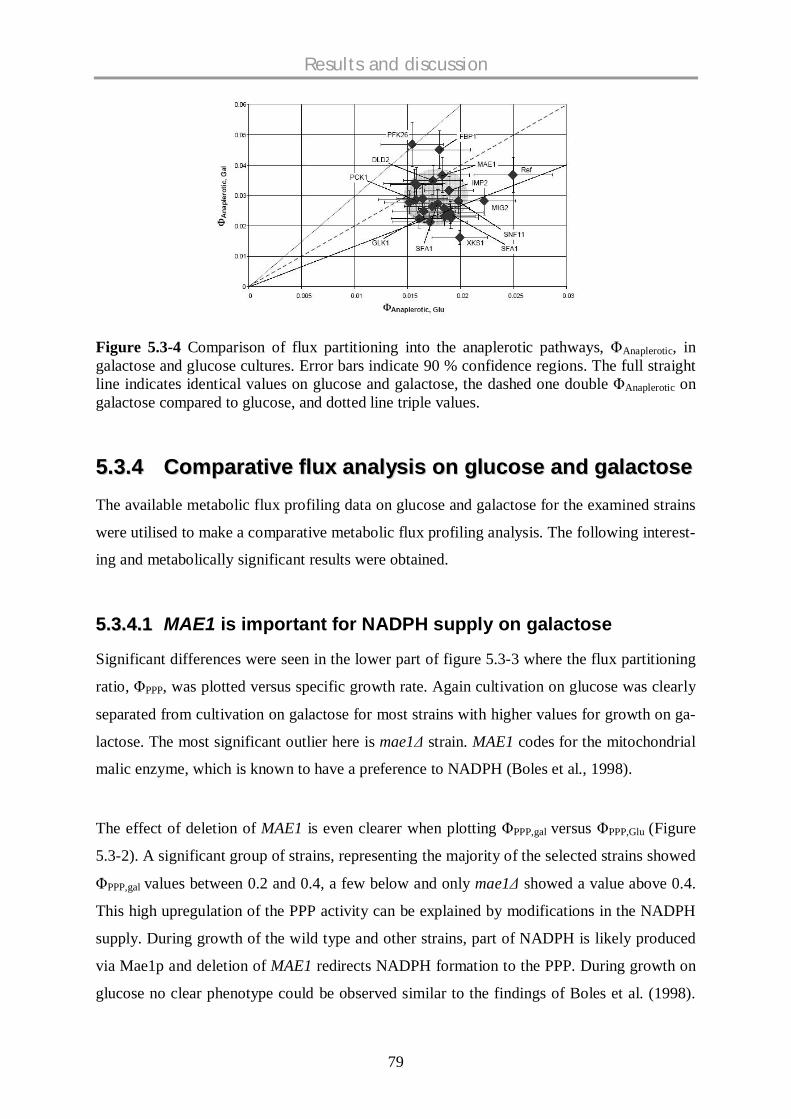
Results and discussion
79
Figure 5.3-4 Comparison of flux partitioning into the anaplerotic pathways, Anaplerotic, ingalactose and glucose cultures. Error bars indicate 90 % confidence regions. The full straightline indicates identical values on glucose and galactose, the dashed one double Anaplerotic ongalactose compared to glucose, and dotted line triple values.
55..33..44 CCoommppaarraattiivvee fflluuxx aannaallyyssiiss oonn gglluuccoossee aanndd ggaallaaccttoosseeThe available metabolic flux profiling data on glucose and galactose for the examined strains
were utilised to make a comparative metabolic flux profiling analysis. The following interest-
ing and metabolically significant results were obtained.
55..33..44..11 MAE1 is important for NADPH supply on galactose
Significant differences were seen in the lower part of figure 5.3-3 where the flux partitioning
ratio, PPP, was plotted versus specific growth rate. Again cultivation on glucose was clearly
separated from cultivation on galactose for most strains with higher values for growth on ga-
lactose. The most significant outlier here is mae1 strain. MAE1 codes for the mitochondrial
malic enzyme, which is known to have a preference to NADPH (Boles et al., 1998).
The effect of deletion of MAE1 is even clearer when plotting PPP,gal versus PPP,Glu (Figure
5.3-2). A significant group of strains, representing the majority of the selected strains showed
PPP,gal values between 0.2 and 0.4, a few below and only mae1 showed a value above 0.4.
This high upregulation of the PPP activity can be explained by modifications in the NADPH
supply. During growth of the wild type and other strains, part of NADPH is likely produced
via Mae1p and deletion of MAE1 redirects NADPH formation to the PPP. During growth on
glucose no clear phenotype could be observed similar to the findings of Boles et al. (1998).
Results and discussion
80
Obviously, sufficient NADPH is supplied during highly fermentative growth and correspond-
ingly lower biomass yield by reactions other than catalyzed by Mae1p. No significant differ-
ence was observed when comparing the net anaplerotic flux split on glucose, Anaplerotic,Glu,
with that on galactose, Anaplerotic,Gal, (Figure 5.3-4) again agreeing with earlier observations
of no clear phenotype (Boles et al., 1998). This metabolic split ratio only considers net fluxes.
The plot of the biomass yield on glucose, YX/S, versus PPP does not show any clear differ-
ence of the mae1 strain compared to the others during growth on glucose (Figure 5.3-1). On
the other hand mae1 has by far the highest value of PPP on galactose but only high value of
YX/S. Earlier a clear phenotype of this enzyme was only found during growth on ethanol
when PYK1 and MAE1 were both deleted (Boles et al., 1998). Either of the corresponding
proteins Pyk1p or Mae1p is required and permits biosynthesis of amino acids of the pyruvate
family. Disruption of MAE1 alone, however, did not show a clear phenotype during growth
on ethanol. Mae1p was not directly related to the supply of NADPH in that study.
55..33..44..22 xxkkss11 aanndd ssnnff1111 aarree ffaasstteesstt ggrroowwiinngg oonn gglluuccoossee
The two strains xks1 and snf11 exhibited the highest growth rates on glucose and also very
high glucose consumption rates.
xks1 : Xks1p is xylulokinase (Rodriguez-Pena et al., 1998) and is therefore important
for pentose metabolism, particularly for fermentation of D-xylose and D-xylulose (Toivari et
al., 2001; van Maris et al., 2006). Deletion of XKS1 also resulted in the strain with the high-
est galactose consumption rate. PPP was in an average range growing on glucose and galac-
tose (Figures 5.3-3 and 5.3-2). However, Anaplerotic,Gal was exceptionally low in this strain
(Figure 5.3-4). Biomass yield on galactose was lowest observed in this set of mutants (Fig-
ure 5.3-1). Specific ethanol production was also very high both on glucose and galactose
(Tables 5.3-1 and 5.3-2). It is hard to imagine that Xks1p would be catalytically active in the
other strains since the phosphorylation of D-xylulose is an exergonic reaction consuming
ATP. The yield of ethanol on glucose is not higher than with several other strains (Vela-
gapudi et al., 2006). It might be that Xks1p has unknown enzymatic activities producing a
compound limiting the growth rate.
snf11 : Snf11p is part of the SWI/SNF complex, which is a very large, 2000-KDa pro-
tein complex that appears to be highly conserved in all eukaryotes. In yeast it is composed of
11 different polypeptide subunits, and it is required in vivo for the transcriptional induction
Results and discussion
81
of a subset of yeast genes and for the functioning of a variety of sequence-specific transcrip-
tional activators. Conde et al. (2003) found affects in mannosylphosphorylation of cell wall
mannoproteins in snf11 strains when screening the strain from the same library as here.
SNF11 deletion did only influence maximal specific growth rate on glucose. No other sig-
nificant effect could be observed.
55..33..44..33 ppffkk2266 sshhoowwss hhiigghheesstt bbiioommaassss yyiieelldd
The deletion of PFK26 that is involved in the regulation of carbohydrate metabolism gave the
highest biomass yield on galactose with a high PPP,Gal and on glucose a low growth rate and
the highest PPP,Glu but no increase in yield. Pfk26p produces fructose 2,6-bisphosphate that
usually stimulates phosphofructokinase-1 and inhibits fructose 1,6-bisphosphatase. Muller et
al. (1997) demonstrated that Pfk26p is not needed in S. cerevisiae to sustain an adequate gly-
colytic flux under fermentative conditions, but rather is concerned with the homeostasis of
metabolite concentrations. No physiological significance found for inhibition of fructose 1,6-
bisphosphatase by Pfk26p (Muller et al., 1997).
55..33..44..44 ffbbpp11 hhaadd ddiiffffeerreenntt ggrroowwtthh rraatteess oonn gglluuccoossee aanndd ggaallaaccttoossee
Fbp1p, fructose 1,6-bisphosphatase, is essential for growth on ethanol when gluconeogenesis
is required. It seems, therefore, unnecessary during growth on glucose or galactose, and it is
even degraded in the proteasome when readily degradable sugars as glucose are available for
the cells (Hammerle et al., 1998). In this study, showing quantitative physiological data going
beyond published work, a lower growth rate on glucose and a higher one on galactose (Figure
5.3-3) and a higher biomass yield on galactose were observed (Figure 5.3-1). PPP,Glu is rela-
tively high but close to the majority of mutants (Figure 5.3-2). The increase in yield on galac-
tose is certainly not caused by an increased PPP activity.
55..33..44..55 OOtthheerr ssttrraaiinnss eexxhhiibbiittiinngg ssiiggnniiffiiccaanntt ddiiffffeerreenncceess
There are several other strains that are exhibiting interesting and significant metabolic flux
profiles on glucose and galactose.
glk1 strain: Deletion of glucokinase, GLK1, converting glucose to glucose 6-
phosphate does not show a very clear phenotype. It is however remarkable that PPP and
naplerotic were the same on both sugars. The glucose uptake and ethanol production rates

Results and discussion
82
were about half on galactose compared to glucose (Tables 5.3-1 and 5.3-2). In Penicillium
chrysogenum the deletion of GLK1 resulted in stimulation of beta-galactosidase and penicil-
lin biosynthesis (Barredo et al., 1988).
mig2 strain: MIG2 together with MIG1 is involved in glucose repression (Westergaard
et al., 2007). Disruption of MIG2 resulted in similar behaviour of yeast on both sugars con-
cerning most growth parameters. Only PPP,Gal was about 1.5 fold higher than PPP,Glu both
exhibiting relatively low values. Much clearer effects would be expected when feeding
mixed substrates.
pck1 strain: Pck1p, an ATP dependent phosphoenolpyruvate carboxykinase is impor-
tant for gluconeogenesis (Valdes-Hevia et al., 1989) and possibly for cyclic fluxes between
the PEP/pyruvate and oxaloacetate/malate pools that are frequently observed in many organ-
isms. Its deletion does not show a very drastic phenotype. The very low PPP,Glu might point
to a possible activation of Mae1p for the generation of NADPH. However, the determined
specific malic enzyme activity, referred to total protein was very similar, 9.68 ± 0.13
nmol/min/mg protein for the reference strain and 9.38 ± 0.17 nmol/min/mg protein for the
pck1 mutant.
sfa1 strain: Sfa1p is a long-chain alcohol dehydrogenase also capable of reducing for-
maldehyde (Wehner et al., 1993). In this study sfa1 was only exceptional having lower
PPP,Gal than PPP,Glu, a characteristic it shares with imp2’ .
dld1 and imp2’ strains: Deletion of DLD1, a D-lactate dehydrogenase, showed low
PPP,Glu but no other very significant differences. The deletion of IMP2 resulted in the lowest
PPP,Gal value of all strains studied but biomass yield similar to other strains. Imp2’p is a
sugar regulatory protein. Again it seems that the requirement of NADPH needed for ana-
bolic purposes may be supplied by Mae1p.
55..33..55 CCoonncclluussiioonnssNew methods for an extended physiological characterization of yeast at a microtiter plate
scale were applied to twenty-seven deletion mutants of S. cerevisiae cultivated on glucose
and galactose as sole carbon sources. In this way specific growth rates, specific rates of glu-
cose consumption and ethanol production were determined. Flux distribution, particularly
concerning branching into the pentose phosphate pathway was determined using a new 13C-
labelling method using MALDI-ToF mass spectrometry showed some new phenotypes that

Results and discussion
83
are useful for the elucidation of the function of the corresponding genes and other important
flux distributions at branching points were determined using metabolic network model.
On glucose the growth was predominantly fermentative whereas on galactose respiration was
more active with correspondingly lower ethanol production. Some deletion strains showed
unexpected behaviour providing very informative data about the function of the correspond-
ing gene. Deletion of MAE1 did not show any significant phenotype when grown on glucose
but a drastically increased branching from glucose 6-phosphate into the pentose phosphate
pathway on galactose. This allows the conclusion that Mae1p is important for the supply of
NADPH during aerobic growth on galactose. In pfk1 the pentose phosphate pathway flux
decreased significantly pointing to a replacement of Pfk1p catalyzed gluconeogenetic flux by
Mae1p activity.
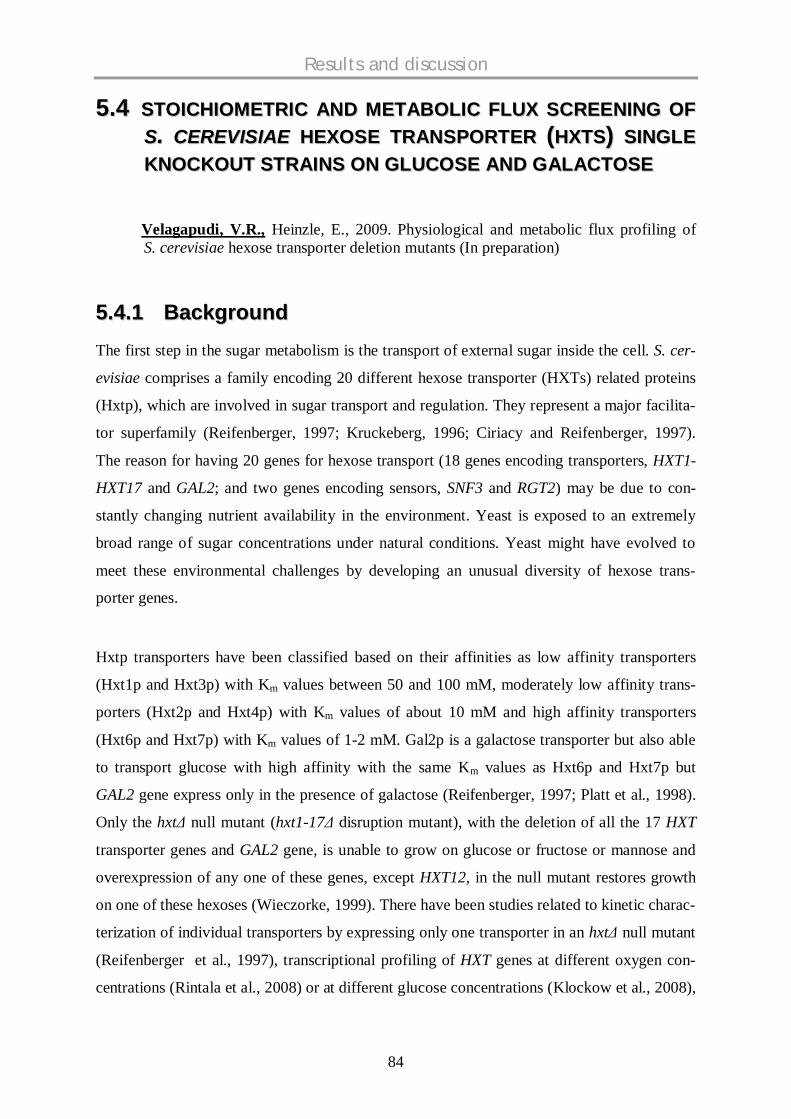
Results and discussion
84
55..44 SSTTOOIICCHHIIOOMMEETTRRIICC AANNDD MMEETTAABBOOLLIICC FFLLUUXX SSCCRREEEENNIINNGG OOFFSS.. CCEERREEVVIISSIIAAEE HHEEXXOOSSEE TTRRAANNSSPPOORRTTEERR ((HHXXTTSS)) SSIINNGGLLEEKKNNOOCCKKOOUUTT SSTTRRAAIINNSS OONN GGLLUUCCOOSSEE AANNDD GGAALLAACCTTOOSSEE
Velagapudi, V.R., Heinzle, E., 2009. Physiological and metabolic flux profiling ofS. cerevisiae hexose transporter deletion mutants (In preparation)
55..44..11 BBaacckkggrroouunnddThe first step in the sugar metabolism is the transport of external sugar inside the cell. S. cer-
evisiae comprises a family encoding 20 different hexose transporter (HXTs) related proteins
(Hxtp), which are involved in sugar transport and regulation. They represent a major facilita-
tor superfamily (Reifenberger, 1997; Kruckeberg, 1996; Ciriacy and Reifenberger, 1997).
The reason for having 20 genes for hexose transport (18 genes encoding transporters, HXT1-
HXT17 and GAL2; and two genes encoding sensors, SNF3 and RGT2) may be due to con-
stantly changing nutrient availability in the environment. Yeast is exposed to an extremely
broad range of sugar concentrations under natural conditions. Yeast might have evolved to
meet these environmental challenges by developing an unusual diversity of hexose trans-
porter genes.
Hxtp transporters have been classified based on their affinities as low affinity transporters
(Hxt1p and Hxt3p) with Km values between 50 and 100 mM, moderately low affinity trans-
porters (Hxt2p and Hxt4p) with Km values of about 10 mM and high affinity transporters
(Hxt6p and Hxt7p) with Km values of 1-2 mM. Gal2p is a galactose transporter but also able
to transport glucose with high affinity with the same Km values as Hxt6p and Hxt7p but
GAL2 gene express only in the presence of galactose (Reifenberger, 1997; Platt et al., 1998).
Only the hxt null mutant (hxt1-17 disruption mutant), with the deletion of all the 17 HXT
transporter genes and GAL2 gene, is unable to grow on glucose or fructose or mannose and
overexpression of any one of these genes, except HXT12, in the null mutant restores growth
on one of these hexoses (Wieczorke, 1999). There have been studies related to kinetic charac-
terization of individual transporters by expressing only one transporter in an hxt null mutant
(Reifenberger et al., 1997), transcriptional profiling of HXT genes at different oxygen con-
centrations (Rintala et al., 2008) or at different glucose concentrations (Klockow et al., 2008),

Results and discussion
85
but quantitative physiological information is lacking in strains with missing single HXT
genes. In order to address this issue, we have selected a set of available hexose transporter
deletion strains from the mutant library (Table 5-4-1) and studied each deletion mutant strain
on glucose and galactose and obtained quantitative stoichiometric and metabolic flux data
using previously developed platforms (Velagapudi et al., 2006; Hollemeyer et al., 2007).
Table 5.4-1 Information about the selected yeast deletion mutant strains
ORF Gene name Metabolic function Activity
YHR094C HXT1 Cellular sugar importLow affinity transmembrane hex-ose transport activity
YDR345C HXT3 Cellular sugar importLow affinity transmembrane hex-ose transport activity
YHR092C HXT4 Cellular sugar importHigh affinity transmembrane hex-ose transport activity
YJL214W HXT8 Cellular sugar import UnknownYFL011W HXT10 Cellular sugar import UnknownYIL170W HXT12 Unknown Unknown
YNL318C HXT14 Cellular sugar importTransmembrane galactose trans-port activity
YNR072W HXT17 Cellular sugar import UnknownYDL194W SNF3 Sugar binding High affinity glucose sensorYDL138W RGT2 Sugar binding Low affinity glucose sensor
YKL038W RGT1Regulation of carbohydrate metabo-lism Transcription factor activity
YLR081W GAL2 Galactose metabolism Galactose permease activity
YDR277C MTH1Regulation of carbohydrate metabo-lism
Repressor of hexose transportgenes
YDR043C NRG1Regulation of carbohydrate metabo-lism
Transcriptional repressoractivity
YBR066C NRG2Regulation of carbohydrate metabo-lism
Transcriptional repressoractivity
55..44..22 SSttooiicchhiioommeettrriicc pprrooffiilliinngg ooff HHXXTT kknnoocckkoouutt ssttrraaiinnssA recently developed novel method for high-content stoichiometric and kinetic metabolic
profiling was used to obtain quantitative information on physiological parameters i.e., spe-
cific growth rate, biomass yield, ethanol yield, specific substrate uptake rate and specific
ethanol production rate, of selected HXTs deletion mutants on glucose and galactose sub-
strates at miniaturized scale using 96-well microtiter plates with on-line optical sensing of
dissolved oxygen (Velagapudi et al., 2006). The results are presented in the tables 5.4-2 and
5.4-3.

Results and discussion
86
55..44..22..11 SSppeecciiffiicc ggrroowwtthh rraattee ((µµmmaaxx))
Strains growing with specific growth rates of 0.17 h-1 to 0.26 h-1 were classified as slow
growers and the rest of the strains with growth rates higher than 0.26 h-1 were classified as
fast growers. Growth on galactose is clearly distinct from that on glucose. The specific
growth rate of mutants on glucose was higher than on galactose. On glucose, mutants showed
varied growth patterns with specific growth rates ranging from 0.232 h-1 to 0.334 h-1, whilst
on galactose, specific growth rates ranged from 0.198 h-1 to 0.294 h-1. On glucose, 2 strains,
nrg1 and nrg2 , were slow growers with maximum specific growth rates, µmax, of 0.232 h-1
and 0.237 h-1, respectively, and the rest of the 14 strains were fast growers. On galactose, 11
strains were slow growers having maximum specific growth rates, µmax, less than 0.26 h-1 and
only 4 strains are fast growers. As expected, the strain with deletion of GAL2, a galactose
transporter with galactose permease activity, did not grow on galactose at all.
55..44..22..22 SSppeecciiffiicc hheexxoossee uuppttaakkee rraattee ((qqhheexxoossee))
Substrate consumption rates of transporter mutants were always higher on glucose than on
galactose. On glucose, specific consumption rates, qglucose, are ranging from 12 mmol/g/h – 27
mmol/g/h, whereas on galactose, specific consumption rates, qgalactose, are ranging from 3
mmol/g/h - 10 mmol/g/h. A single mutant, hxt8 , consumed glucose at a very high rate of
26.6 mmol/g/h, whereas on galactose, hxt8 had qgalactose of 7.6 mmol/g/h. One strain, hxt4 ,
had highest galactose consumption rate of 9.5 mmol/g/h, which is still less than the minimum
consumption rate on glucose and the same strain, hxt4 had qglucose of 23.3 mmol/g/h on glu-
cose.
55..44..22..33 SSppeecciiffiicc eetthhaannooll pprroodduuccttiioonn rraattee ((qqeetthhaannooll))
Specific ethanol production rate, qethanol, on glucose ranges from 14 mmol/g/h - 42 mmol/g/h.
Except hxt8 strain, all other high rate glucose consumers with qglucose above 20 mmol/g/h,
had specific ethanol production rates, qethanol, between 20 and 40 mmol/g/h. Two strains,
hxt3 and snf3 with qglucose16.4 mmol/g/h and 18.8 mmol/g/h, respectively, had qethanol
above 20 mmol/g/h (hxt3 - 22.5 mmol/g/h and snf3 – 32.4 mmol/g/h). The deletion strain
hxt8 , which had the maximum glucose consumption rate, 26.6 mmol/g/h had a qethanol of
only 17.8 mmol/g/h. Maximum qethanol value was observed for hxt4 strain – 41.2 mmol/g/h.
On galactose, specific ethanol production rates, qethanol, were ranging from 2 - 13 mmol/g/h.
Maximum qethanol value was observed for rgt1 strain – 12.5 mmol/g/h.

Results and discussion
87
Table 5.4-2 Growth data on glucose. Specific growth rate, µGlu, biomass yield, YX/S,Glu, etha-nol yield, YE/S,Glu, specific uptake rate, qGlu, specific rate of ethanol production, qETH. The lastline shows the average values of all strains and standard deviation between them.Gene µGlu
h-1YX/S,Glug g-1
YE/S,Glug g-1
qglucosemmolg-1 h-1
qethanolmmolg-1 h-1
Reference 0.320 ± 0.014 0.128 ± 0.009 0.336 ± 0.018 13.9 18.2HXT1 0.304 ± 0.047 0.080 ± 0.003 0.313 ± 0.005 21.1 25.8HXT3 0.305 ± 0.035 0.103 ± 0.002 0.350 ± 0.054 16.4 22.5HXT4 0.319 ± 0.040 0.076 ± 0.006 0.451 ± 0.031 23.4 41.2HXT8 0.334 ± 0.051 0.070 ± 0.004 0.171 ± 0.020 26.6 17.8HXT10 0.295 ± 0.047 0.082 ± 0.002 0.353 ± 0.010 20.1 27.8HXT12 0.329 ± 0.043 0.076 ± 0.002 0.343 ± 0.016 24.2 32.4HXT14 0.330 ± 0.035 0.121 ± 0.021 0.426 ± 0.064 15.1 25.2HXT17 0.272 ± 0.058 0.061 ± 0.003 0.394 ± 0.014 24.9 38.3SNF3 0.301 ± 0.035 0.089 ± 0.003 0.439 ± 0.013 18.9 32.5RGT2 0.292 ± 0.052 0.129 ± 0.007 0.304 ± 0.026 12.6 15.0RGT1 0.293 ± 0.037 0.070 ± 0.002 0.272 ± 0.016 23.2 29.4GAL2 0.285 ± 0.043 0.089 ± 0.003 0.214 ± 0.010 17.9 14.9MTH1 0.274 ± 0.039 0.083 ± 0.003 0.204 ± 0.010 18.2 14.6NRG1 0.232 ± 0.014 0.098 ± 0.013 0.245 ± 0.012 13.1 15.2NRG2 0.237 ± 0.016 0.087 ± 0.007 0.251 ± 0.031 15.1 17.5Average 0.295 ± 0.038 0.090 ± 0.006 0.317 ± 0.022 19.0 24.3
Table 5.4-3 Growth data on galactose. Specific growth rate, µGal, biomass yield, YX/S,Gal,ethanol yield, YE/S,Gal, specific uptake rate, qGal, specific rate of ethanol production, qETH. Thelast line shows the average values of all strains and standard deviations.Gene µGal
h-1YX/S,Gal
g g-1YE/S,Gal
g g-1qgal
mmolg-1 h-1
qethanolmmolg-1 h-1
Reference 0.223 ± 0.012 0.190 ± 0.014 0.325 ± 0.019 6.5 8.3HXT1 0.236 ± 0.017 0.265 ± 0.018 0.141 ± 0.025 4.9 2.7HXT3 0.203 ± 0.009 0.340 ± 0.032 0.249 ± 0.018 3.3 3.2HXT4 0.261 ± 0.031 0.152 ± 0.002 0.207 ± 0.012 9.5 7.7HXT8 0.264 ± 0.030 0.193 ± 0.018 0.342 ± 0.012 7.6 10.2HXT10 0.247 ± 0.022 0.172 ± 0.002 0.217 ± 0.003 7.9 6.8HXT12 0.198 ± 0.009 0.219 ± 0.005 0.369 ± 0.020 5.0 7.21HXT14 0.255 ± 0.021 0.371 ± 0.014 0.273 ± 0.007 3.8 4.1HXT17 0.262 ± 0.025 0.208 ± 0.006 0.322 ± 0.010 7.0 8.8SNF3 0.253 ± 0.022 0.211 ± 0.004 0.207 ± 0.009 6.6 5.4RGT2 0.235 ± 0.015 0.162 ± 0.001 0.259 ± 0.007 8.1 8.2RGT1 0.258 ± 0.018 0.171 ± 0.001 0.382 ± 0.009 8.4 12.5GAL2MTH1 0.230 ± 0.021 0.232 ± 0.014 0.306 ± 0.015 5.5 6.6NRG1 0.235 ± 0.017 0.311 ± 0.019 0.124 ± 0.036 4.2 2.0NRG2 0.294 ± 0.024 0.258 ± 0.015 0.343 ± 0.069 6.3 8.5Average 0.244 ± 0.020 0.231 ± 0.011 0.271 ± 0.018 6.3 6.8

Results and discussion
88
55..44..22..44 CCoommppaarriissoonn ooff ssppeecciiffiicc rraatteess aanndd yyiieellddss ooff mmuuttaanntt sseett
Specific uptake rate of hexose, qhexose and specific ethanol production rate, qethanol, were plot-
ted versus the maximum specific growth rate of each mutant, µmax (Figure 5.4-1A). Increasing
specific hexose consumption and ethanol production rates were observed with increasing
specific growth rate. However, the increase of qEthanol with µmax was higher on glucose than
on galactose. On glucose, 7 strains consumed glucose at rates higher than 20 mmol g-1 h-1:
hxt10 – 20.1; hxt1 – 21.1; rgt1 – 23.2; hxt4 – 23.3; hxt12 – 24.1; hxt17 – 24.8; hxt8
– 26.6 mmol g-1 h-1.
Figure 5.4-1 (A) Specific hexose uptake rate and specific ethanol production rates as func-tion of the specific growth rate, µmax, during growth on glucose and galactose (B) Specificrate of ethanol production as a function of the specific hexose consumption rate, qHexose, dur-ing growth on glucose and galactose (Tables 5.4-2 and 5.4-3). The solid line indicates themaximum theoretical qethanol Arrows indicate the reference strain BY4742 Mat his3 1leu2 0 lys2 0 ura3 0.
0
10
20
30
40
50
0 5 10 15 20 25 30
qp
Glucose
Galactose
0
10
20
30
40
50
0.0 0.1 0.2 0.3 0.4 0.5
0
5
10
15
20
25
30GlucoseGalactose
µmax (h-1)
q Eth
anol
(mm
olg-1
h-1)
q Hex
ose
(mm
olg-1
h-1)
qHexose (mmol g-1 h-1)
q Eth
anol
(mm
olg-1
h-1)
ReferenceReference
ReferenceReference
Reference
Reference
(A)
(B)
NRG1
NRG2
HXT14HXT3
MTH1HXT10
RGT1
HXT8
HXT12
SNF3
NRG1
NRG2
HXT8
HXT3
MTH1
HXT10
RGT2
HXT12
HXT4
HXT3
NRG1NRG2
HXT14
HXT8
HXT1 HXT14
RGT1
HXT17
HXT12SNF3
HXT17
NRG2
RGT2
HXT12HXT3
HXT4
HXT17
HXT12RGT1
HXT8MTH1
HXT1NRG2
NRG1RGT2
HXT3HXT14
SNF3
RGT1HXT4
HXT10SNF3
0
10
20
30
40
50
0 5 10 15 20 25 30
qp
Glucose
Galactose
0
10
20
30
40
50
0.0 0.1 0.2 0.3 0.4 0.5
0
5
10
15
20
25
30GlucoseGalactose
µmax (h-1)
q Eth
anol
(mm
olg-1
h-1)
q Hex
ose
(mm
olg-1
h-1)
qHexose (mmol g-1 h-1)
q Eth
anol
(mm
olg-1
h-1)
ReferenceReference
ReferenceReference
Reference
Reference
(A)
(B)
NRG1
NRG2
HXT14HXT3
MTH1HXT10
RGT1
HXT8
HXT12
SNF3
NRG1
NRG2
HXT8
HXT3
MTH1
HXT10
RGT2
HXT12
HXT4
HXT3
NRG1NRG2
HXT14
HXT8
HXT1 HXT14
RGT1
HXT17
HXT12SNF3
HXT17
NRG2
RGT2
HXT12HXT3
HXT4
HXT17
HXT12RGT1
HXT8MTH1
HXT1NRG2
NRG1RGT2
HXT3HXT14
SNF3
RGT1HXT4
HXT10SNF3

Results and discussion
89
On glucose, reference strain had qglucose of 13.9 mmol g-1 h-1 and qethanol of 18.2 mmol g-1 h-1,
values that are below the average values of all the other examined strains (qglucosee – 19.0
mmol g-1 h-1 and qethanol – 24.3 mmol g-1 h-1). In contrast, the specific uptake rate of galactose
and specific ethanol production rate on galactose were very small compare to glucose and
ranging from 3 – 10 mmol g-1 h-1 and 2 - 10 mmol g-1 h-1, respectively. On galactose, the ref-
erence strain had qgalactose of 6.5 mmol g-1 h-1 and qethanol of 8.3 mmol g-1 h-1, the values which
are about average values of all the other examined strains (qgalactose - 6.3 mmol g-1 h-1 and
qethanol - 6.8 mmol g-1 h-1).
A clear trend was observed when specific uptake rate of hexose, qhexose, was plotted against
specific ethanol production rate, qethanol, of each mutant (Figure 5.4-1B). An increasing spe-
cific ethanol production rate was observed with increasing specific uptake rate both in glu-
cose and galactose. On glucose, all high rate glucose consumers had values of qEthanol between
20 and 40 mmol g-1 h-1 except hxt8 , the strain with maximum glucose consumption rate of
26.6 mmol g-1 h-1 had qEthanol of only 17.8 mmol g-1 h-1, which is very close to the reference
strain (Figure 5.4-1B). One strain, rgt1 with high specific uptake rate of galactose (8.4
mmol g-1 h-1), also had highest specific ethanol production rate, qethanol (12.5 mmol g-1 h-1).
Figure 5.4-2 represents the correlation between specific growth rate, µmax, and biomass
yields, YX/S, as well as with ethanol yield, YE/S on glucose and galactose. The deletion mu-
tants had much higher biomass yield on galactose (0.15 – 0.35 g/g) than on glucose (0.06 –
0.13 g/g). One strain, hxt14 , had a very high biomass yield on both the sugars (0.121 g/g on
glucose and 0.371 g/g on galactose). The strains had higher ethanol yields on glucose (0.17 –
0.45 g/g) than on galactose (0.12 – 0.39 g/g). This represents that the strains showed higher
respiratory activity on galactose and fermentative activity on glucose.
55..44..22..55 CCoommppaarriissoonn ooff ggrroowwtthh aanndd yyiieellddss wwiitthh tthhee rreeffeerreennccee ssttrraaiinn
The maximum specific growth rate, µmax on glucose of the reference strain was identical with
hxt1 , hxt3 , hxt4 , hxt8 , hxt10 , hxt12 , hxt14 , hxt17 , snf3 , rgt2 , rgt1 , gal2 ,
grr1 , mth1 ; on galactose with hxt1 , hxt3 , hxt4 , hxt8 , hxt10 , hxt14 , snf3 , rgt2 ,
nrg1 , grr1 , mth1 . Therefore, for hxt1 , hxt3 , hxt4 , hxt8 , hxt10 , hxt14 , snf3 ,
rgt2 , grr1 and mth1 strains, µmax was indistinguishable from the reference strain on glu-
cose and on galactose. hxt14 and rgt2 strains had the same biomass yield as the reference

Results and discussion
90
on glucose; hxt8 and hxt17 on galactose and therefore no strain had the same YX/S on both
sugars. hxt1 , hxt3 , hxt10 , hxt12 and rgt2 showed the same ethanol yield on glucose,
YE/S, as the reference strain, hxt8 , hxt17 , grr1 , mth1 and nrg2 on galactose and there-
fore no strain had the same YE/S on both sugars.
Figure 5.4-2 Stoichiometric profiling of HXTs yeast deletion mutants. Correlation betweenspecific growth rate, µmax, and biomass yields, YX/S, as well as with ethanol yield, YE/S, onglucose and galactose.
55..44..22..66 CCoommppaarriissoonn ooff mmuuttaannttss aaggaaiinnsstt mmuuttaannttss
All the examined 14 mutants were compared against each other in all six dimensions i.e.,
three parameters on each carbon source and searched for the indistinguishable strain combi-
nations from the total of 91 possible unique binary combinations on glucose and galactose.
Depending on the parameter investigated and on the substrate the discrimination between
strains varied (Table 5.4-4). The discrimination of mutants against mutants was stronger on
galactose than on glucose. Experiments on galactose alone would only lead to one indistin-
guishable mutant pair, hxt8 – hxt17 . On glucose alone, 2 indistinguishable pairs were de-
tected: hxt3 – hxt14 and nrg1 – nrg2 . None of the mutant pairs was common in all the
biological parameters on both the sugars.
0.0
0.1
0.2
0.3
0.4
0.5
0.0 0.1 0.2 0.3 0.4 0.5
Yps
GlucoseGalactose
0.0
0.1
0.2
0.3
0.4
Yxs(
g/g)
GlucoseGalactose
µmax (h-1)
Y x/s
(g g
-1)
Y E/s
(g g
-1)
NRG1
NRG2
RGT2Reference
HXT14HXT3
HXT17
HXT10RGT1
HXT8
HXT12
HXT4
HXT1
SNF3
NRG1
NRG2
HXT12
HXT3
MTH1
HXT17
RGT2
RGT1HXT8HXT12
HXT1SNF3
Reference
RGT2 ReferenceHXT14
HXT8
NRG1
Reference
HXT14HXT17
HXT8
HXT4SNF3
0.0
0.1
0.2
0.3
0.4
0.5
0.0 0.1 0.2 0.3 0.4 0.5
Yps
GlucoseGalactose
0.0
0.1
0.2
0.3
0.4
Yxs(
g/g)
GlucoseGalactose
µmax (h-1)
Y x/s
(g g
-1)
Y E/s
(g g
-1)
NRG1
NRG2
RGT2Reference
HXT14HXT3
HXT17
HXT10RGT1
HXT8
HXT12
HXT4
HXT1
SNF3
NRG1
NRG2
HXT12
HXT3
MTH1
HXT17
RGT2
RGT1HXT8HXT12
HXT1SNF3
Reference
RGT2 ReferenceHXT14
HXT8
NRG1
Reference
HXT14HXT17
HXT8
HXT4SNF3

Results and discussion
91
Table 5.4-4 Strains not distinguishable based on maximum specific growth rate, µmax, bio-mass yield on carbon substrate, YX/S, ethanol yield on carbon substrate, YE/S, and growth onglucose and/or galactose as limiting substrate.Carbon source µmax YX/S YE/S allGlucose 74 25 19 2Galactose 63 11 17 1Glucose and galactose 51 4 5 0
55..44..22..77 HHiieerraarrcchhiiccaall cclluusstteerriinngg
Hierarchical clustering was done using stoichiometric data of glucose and galactose sepa-
rately using Euclidian distance as a distance metric. The relative Euclidian distances were
calculated between mutant pairs and also between mutant and the reference strain. The num-
ber of biological parameters is in total six, three on glucose and three on galactose. Seven
deletion mutant pairs, hxt4 – snf3 (0.033); hxt10 – snf3 (0.044); hxt1 – nrg1 (0.062);
hxt4 – hxt10 (0.068); hxt8 – hxt17 (0.073); hxt14 – rgt2 (0.097) on galactose; and
nrg1 – nrg2 (0.126) on glucose were most closely related to each other. The measured
Euclidean distances were visualised as dendrograms. Dendrogram of glucose and galactose
data revealed 4 clusters on each substrate, highlighted with colours in Figure 5.4-3.
On glucose, in the first cluster (bottom to top), snf3 and hxt4 were clustered together. De-
tails of protein interactions and complexes using MIPS MPact Protein Interactions and Com-
plex DB (Güldener et al., 2006) (www.mips.gsf.de/genre/proj/impact) revealed that snf3 has
genetic interaction with hxt4 (Ko et al., 1993). In the second cluster, low affinity transport-
ers hxt1 and hxt3 and transporters with limited known function hxt10 and pseudogene
hxt12 were clustered together. hxt8 strain is only distantly related to all other strains.
On galactose, members of the first cluster (bottom to top) comprise transporters with limited
known function, hxt8 , hxt12 and hxt17 . In the second cluster, hexose sensors, rgt2 and
snf3 were grouped. Protein-protein interaction studies revealed that snf3 has direct genetic
interactions with rgt2 (Yang and Bisson, 1996); low affinity transporters hxt1 and hxt3
were clustered together. On glucose, hxt8 strain is distantly related to all other strains
whereas on galactose hxt8 is closely related to hxt17 .

Results and discussion
92
Figure 5.4-3 Dendrograms on (A) glucose and (B) galactose. Hierarchical clustering wasdone using stoichiometric data by using Euclidean distances as a metric. Arrows indicate thereference strain BY4742 Mat his3 1 leu2 0 lys2 0 ura3 0.
(A)
(B)
(A)(A)
(B)(B)

Results and discussion
93
55..44..33 CCoommppaarraattiivvee pphhyyssiioollooggiiccaall pprrooffiilliinngg ooff HHXXTT mmuuttaannttssAnother interesting comparison relates physiological parameters on both sugars for each sin-
gle mutant. The specific growth rate, µmax, was indistinguishable on both the sugars for
hxt4 , hxt8 , hxt10 , hxt17 , snf3 , rgt2 , rgt1 , and mth1 and nrg1 mutant strains. One
strain, nrg2 , grew slower on glucose (0.237 h-1) than on galactose (0.294 h-1). None of the
mutants had similar biomass yield on glucose and galactose. Ethanol yield, YE/S, was identi-
cal on both the sugars for hxt12 and nrg2 . Interestingly, five mutant strains, hxt8 , hxt12 ,
rgt1 , mth1 and nrg2 , showed higher ethanol yields on galactose than on glucose.
55..44..33..11 HHeexxoossee sseennssoorrss:: rrggtt22 aanndd ssnnff33
On glucose, rgt2 strain grew slowly (µmax = 0.292 h-1) and had lowest specific glucose up-
take rate (qhexose = 12.6 mmol g-1 h-1) and specific ethanol production rate (qethanol = 14.9 mmol
g-1 h-1) as expected. This low affinity hexose sensor, Rgt2p, a glucose receptor that binds glu-
cose outside the cell and is induced only at high glucose concentrations. In rgt2 strain, no
signal can be generated inside the cell for induction of expression of HXT genes (Ozcan and
Johnston, 1999). The high affinity hexose sensor, snf3 is induced only at low concentration
of sugar. Thus the deletion of snf3 didn’t cause any physiological effect on glucose under
the examined experimental conditions of high glucose concentrations. Since these hexose
sensors are more specific to glucose and fructose, the deletion mutants didn’t show any spe-
cific phenotype on galactose (Ozcan and Johnston, 1995).
55..44..33..22 LLooww aaffffiinniittyy ttrraannssppoorrtteerrss:: hhxxtt11 ,, hhxxtt33 aanndd hhxxtt44
Low affinity transporters hxt1 and hxt3 (share 80 % homology) and hxt4 are induced at
high levels of glucose. Since the selected deletion mutants are single knockouts, deletion of
one transporter can be compensated by another transporter and vice versa (Ko et al., 1993).
Hence phenotype was not observed on glucose and the strains were close to the reference
strain in all the biological parameters, especially hxt3 (Euclidean distance d: 0.288). More-
over, these strains are indistinguishable from each other in most of the biological parameters.
hxt1 and hxt3 are quite close to each other (Euclidean distance d: 0.282), whereas hxt4 is
far and equally distant from both hxt1 and hxt3 (Euclidean distance d: 0.435) in all the
biological parameters. On glucose, hxt1 and hxt3 had similar maximum specific growth
rate, µmax (hxt1 – 0.304 h-1; hxt3 – 0.305 h-1), specific uptake rate, qhexose (hxt1 – 21.1

Results and discussion
94
mmol g-1 h-1; hxt3 – 16.4 mmol g-1 h-1) and specific ethanol production rate, qethanol (hxt1 –
25.8 mmol g-1 h-1; hxt3 – 22.5 mmol g-1 h-1).
55..44..33..33 HHXXTTss wwiitthh lliimmiitteedd kknnoowwnn ffuunnccttiioonnss
Except HXT12, which is a pseudo gene and not related to the hexose transporter family, the
function of the hexose transporters Hxt8p-Hxt17p is still not known completely. HXT8-
HXT17 transcript levels were very low in glucose-limited chemostat cultivation (Diderich et
al., 1999).
hxt8 : In a most recent global gene expression analysis study at different glucose con-
centrations, it has been shown that HXT8 is active during starvation and at low glucose con-
centrations (Klockow et al., 2008). On glucose substrate, the hxt8 strain showed a clear
phenotype with the highest specific growth rate (µmax = 0.334 h-1), highest specific glucose
consumption rate (qhexose = 26.6 mmol g-1 h-1) but low specific ethanol production rate (qetha-
nol =17.8 mmol g-1 h-1) with only 0.171 g/g ethanol yield. This phenotype might suggest a
possible role of Hxt8p on glucose fermentation capacity. hxt8 strain had the maximum
Euclidean distance (d, Eq 4-36) from the reference strain among all the other strains, d =
0.829. In order to obtain first insight on the function of this unknown transporter activity,
hxt8 strain was compared with all the other strains in all the biological parameters and the
Euclidean distances were calculated. On glucose, hxt8 strain was close to mth1 and gal2
strains with d = 0.27 and d = 0.3, respectively. On galactose, it showed no specific pheno-
type and was indistinguishable from the reference strain in all the parameters with Euclidian
distance d = 0.181. When compared pair-wise against each mutant, the following mutants
were close to the hxt8 strain; hxt17 (d = 0.073), nrg2 (d = 0.124), rgt1 (d = 0.148) and
mth1 (d = 0.192). Thus, mth1 is closely related to the hxt8 strain on both the sugars with
less distance on galactose than on glucose.
hxt10 : On glucose substrate, hxt10 strain was closely related to hxt1 (d = 0.131) and
hxt12 (d = 0.137) in all the biological parameters. Whereas on galactose, hxt10 strain was
closely related to snf3 (d = 0.044) and rgt2 (d = 0.161).
hxt12 : HXT12, a pseudogene, is not coding for a hexose transporter. hxt12 strain was
close to hxt1 strain on glucose (d = 0.134) and to rgt1 on galactose (d = 0.253).

Results and discussion
95
hxt14 : hxt14 strain had the highest biomass yield on both the sugars. The closest
strain to hxt14 on glucose is hxt3 strain (d = 0.322). On galactose, rgt2 is the most
closely related strain (d = 0.097) followed by mth1 (d = 0.159) and hxt17 (d = 0.181).
hxt17 : hxt17 strain had the lowest biomass yield on glucose and differs from the ref-
erence strain (d = 0.788). The closest strain to hxt17 on glucose is hxt10 (d = 0.278). On
galactose, mth1 (d = 0.145) and nrg2 (d = 0.153) are closely related to hxt17 and are
closely related to the reference strain (d = 0.162). An upregulation of HXT17 promoter activ-
ity was observed on media containing galactose and raffinose at pH 7.7 versus pH 4.7
(Greatrix et al., 2006). HXT17 promoter is a target for Mac1p transcription factor, which
regulates high affinity copper uptake genes under copper deficient conditions (Gross et al.,
2000; Jungmann et al., 1993).
55..44..33..44 RReegguullaattoorrss
mth1 : MTH1 is also known as HTR1. It encodes a component of the glucose induction
mechanism that regulates HXT gene expression. Mth1p is a negative regulator of the glu-
cose-sensing signal transduction pathway (Schmidt et al., 1999). A mutation in MTH1
causes defective transcription of probably all HXT genes. Thus deletion of MTH1 causes im-
paired glucose transport and consequently grows poorly on glucose. As expected, mth1 de-
letion strain grew relatively slowly (µmax= 0.274 h-1) when compare to the rest of the studied
mutant strains and had relatively low specific glucose consumption rate (qhexose = 18.2 mmol
g-1 h-1) and the lowest specific ethanol production rate (qethanol = 14.5 mmol g-1 h-1) on glu-
cose. On galactose, mth1 showed no specific phenotype.
nrg1 and nrg2 : Nrg1p (Negative Regulator of Glucose-repressed genes) and Nrg2p
are C2H2 zinc finger proteins that function as transcriptional repressors, regulating glucose
repressed genes (Park et al., 1999). These proteins interact with Snf1p (Sucrose Non-
Fermenting) protein kinase complex, a key component of glucose signalling pathway and is
essential for the transcription of many glucose-repressed genes (Celenza and Carlson, 1986;
Vyas et al., 2001; Zhou et al., 2001). Though both the proteins have similar DNA binding
domains (87 % identity), they differ in sequence outside the DNA binding domains (27 %
identity). Thus they are differentially regulated and functionally distant in response to car-
bon source (Berkey et al., 2004). nrg1 and nrg2 showed substrate specific phenotypes.

Results and discussion
96
Among the selected set of mutants, nrg1 and nrg2 were slow growers (µmax = 0.232 h-1
and µmax = 0.237 h-1, respectively) and they showed similar phenotypic profile on glucose
(qhexose = 13.1 mmol g-1 h-1 and qhexose = 15.0 mmol g-1 h-1, respectively; qethanol =15.1 mmol g-
1 h-1 and qethanol =17.5 mmol g-1 h-1). On galactose, nrg1 and nrg2 had very different phe-
notypic profile. The Euclidean distance between nrg1 and nrg2 is less on glucose (d =
0.126) than on galactose (d = 0.834) in all the biological parameters.
55..44..44 CCoommppaarraattiivvee mmeettaabboolliicc fflluuxx pprrooffiilliinngg ooff HHXXTT mmuuttaannttssMetabolic fluxes were calculated based on mass balances. The fluxes given are relative val-
ues normalized to the corresponding specific hexose uptake rates.
55..44..44..11 GGllyyccoollyyssiiss aanndd PPeennttoossee PPhhoosspphhaattee PPaatthhwwaayy ((PPPPPP))
Generally the absolute flux through glycolysis is higher on glucose than on galactose, except
for hxt8 and hxt17 mutant strains. Based on the PPP values, mutants were classified into
three groups. Strains having PPP of 0.1 to 0.15 were classified as strains with low PPP. On
glucose, 8 strains had low PPP, whereas on galactose none of the strains had low PPP.
Strains having PPP of 0.15 to 0.25 were classified as strains with high PPP. On glucose, 4
strains had high PPP whereas on galactose, 12 strains had high PPP. Strains with PPP of
0.25 to 0.35 were classified as strains with very high PPP. On glucose, 4 strains had very
high PPP whereas on galactose, 3 strains had very high PPP. One strain rgt1 had an excep-
tionally high PPP of 0.445 on galactose, whereas on glucose this strain rgt1 had a low PPP
of 0.126 (Figure 5.4-4).
A slight inverse correlation was observed between the maximum growth rate and PPP on
both the sugars. The correlation of PPP between glucose and galactose showed that only 3
strains, hxt3 , hxt1 and hxt10 had comparable PPP on both the sugars; and two strains,
hxt14 and nrg2 had double PPP values on galactose than on glucose (Figure 5.4-4).

Results and discussion
97
Figure 5.4-4 Comparison of flux partitioning into the pentose phosphate pathway, PPP, ongalactose and glucose. The solid line indicates identical values on glucose and galactose andthe dashed line indicates double ppp values on galactose compared to glucose.
Absolute flux through PP pathway increased with increasing specific hexose uptake rate
(Figure 5.4-5) as was also shown in Blank et al. (2005).
Figure 5.4-5 Correlation between the specific hexose uptake rates, qHexose and flux partition-ing into the pentose phosphate pathway in galactose and glucose cultures. Solid line repre-sents PPP of 33%. Arrows indicate the reference strain BY4742 Mat his3 1 leu2 0 lys2 0ura3 0.
0
2
4
6
8
10
0 5 10 15 20 25 30
PP
Pat
hway
flux
(mm
ol/g
/h) Glucose
Galactose
qHexose (mmol g-1 h-1)
Reference
Reference
HXT8
HXT1
HXT17
HXT3SNF3
RGT2HXT4
HXT12RGT1
NRG1
HXT14NRg2
MTH1HXT10
RGT1
HXT3HXT1
NRG1HXT17
HXT4
0
2
4
6
8
10
0 5 10 15 20 25 30
PP
Pat
hway
flux
(mm
ol/g
/h) Glucose
Galactose
qHexose (mmol g-1 h-1)
Reference
Reference
HXT8
HXT1
HXT17
HXT3SNF3
RGT2HXT4
HXT12RGT1
NRG1
HXT14NRg2
MTH1HXT10
RGT1
HXT3HXT1
NRG1HXT17
HXT4
0.00
0.10
0.20
0.30
0.40
0.50
0.00 0.05 0.10 0.15 0.20 0.25 0.30 0.35
Reference
PPP,
gal
PPP,glu
HXT3
HXT10
HXT1NRG2
HXT14NRG1 HXT12
MTH1
RGT2
HXT17
HXT8
RGT1
SNF3
0.00
0.10
0.20
0.30
0.40
0.50
0.00 0.05 0.10 0.15 0.20 0.25 0.30 0.35
Reference
PPP,
gal
PPP,glu
HXT3
HXT10
HXT1NRG2
HXT14NRG1 HXT12
MTH1
RGT2
HXT17
HXT8
RGT1
SNF3
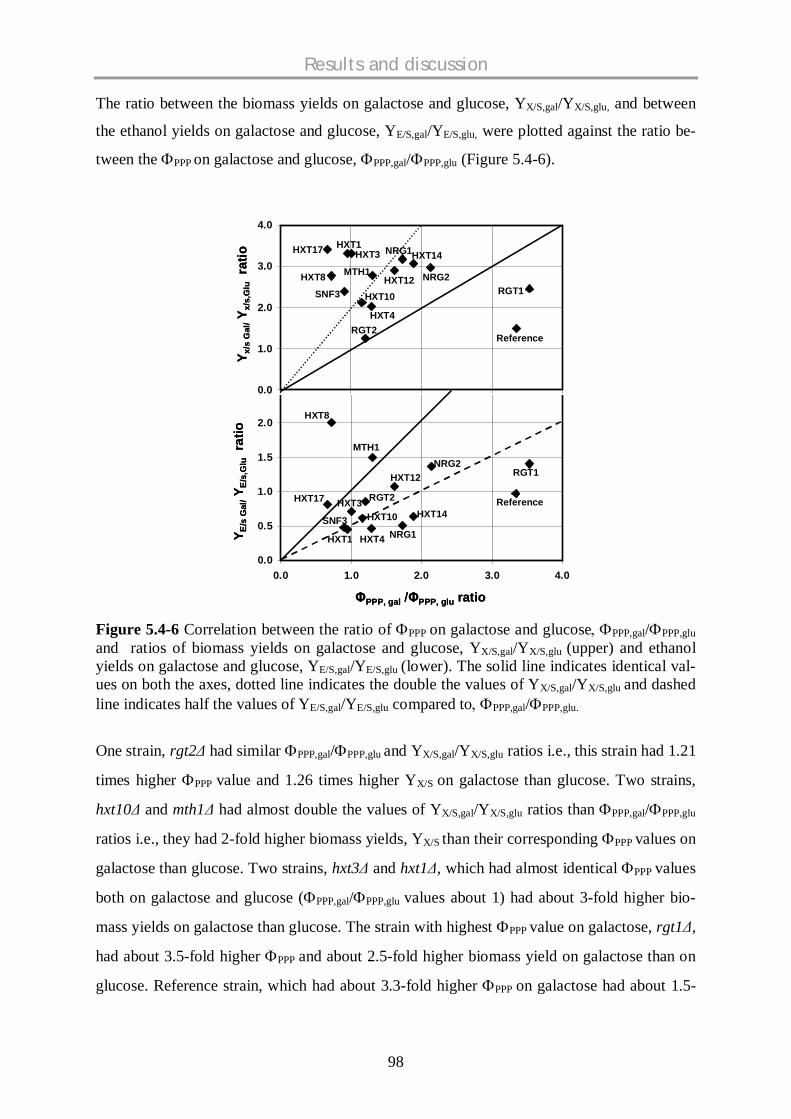
Results and discussion
98
The ratio between the biomass yields on galactose and glucose, YX/S,gal/YX/S,glu, and between
the ethanol yields on galactose and glucose, YE/S,gal/YE/S,glu, were plotted against the ratio be-
tween the PPP on galactose and glucose, PPP,gal/ PPP,glu (Figure 5.4-6).
Figure 5.4-6 Correlation between the ratio of PPP on galactose and glucose PPP,gal/ PPP,gluand ratios of biomass yields on galactose and glucose, YX/S,gal/YX/S,glu (upper) and ethanolyields on galactose and glucose, YE/S,gal/YE/S,glu (lower). The solid line indicates identical val-ues on both the axes, dotted line indicates the double the values of YX/S,gal/YX/S,glu and dashedline indicates half the values of YE/S,gal/YE/S,glu compared to PPP,gal/ PPP,glu.
One strain, rgt2 had similar PPP,gal/ PPP,glu and YX/S,gal/YX/S,glu ratios i.e., this strain had 1.21
times higher PPP value and 1.26 times higher YX/S on galactose than glucose. Two strains,
hxt10 and mth1 had almost double the values of YX/S,gal/YX/S,glu ratios than PPP,gal/ PPP,glu
ratios i.e., they had 2-fold higher biomass yields, YX/S than their corresponding PPP values on
galactose than glucose. Two strains, hxt3 and hxt1 , which had almost identical PPP values
both on galactose and glucose ( PPP,gal/ PPP,glu values about 1) had about 3-fold higher bio-
mass yields on galactose than glucose. The strain with highest PPP value on galactose, rgt1 ,
had about 3.5-fold higher PPP and about 2.5-fold higher biomass yield on galactose than on
glucose. Reference strain, which had about 3.3-fold higher PPP on galactose had about 1.5-
0.0
0.5
1.0
1.5
2.0
2.5
0.0 1.0 2.0 3.0 4.0
0.0
1.0
2.0
3.0
4.0
PPP, gal PPP, glu ratio
Y E/s
Gal
/Y E
/s,G
lura
tioY x
/sG
al/Y x
/s,G
lura
tio
HXT8
HXT17
MTH1
SNF3
HXT1 HXT4
HXT10HXT3 RGT2
HXT12
HXT14
NRG1
RGT1NRG2
Reference
Reference
RGT1HXT8
SNF3 HXT10
HXT4RGT2
HXT17 HXT3
MTH1
HXT1
NRG2
HXT14NRG1
HXT12
0.0
0.5
1.0
1.5
2.0
2.5
0.0 1.0 2.0 3.0 4.0
0.0
1.0
2.0
3.0
4.0
PPP, gal PPP, glu ratio
Y E/s
Gal
/Y E
/s,G
lura
tioY x
/sG
al/Y x
/s,G
lura
tio
HXT8
HXT17
MTH1
SNF3
HXT1 HXT4
HXT10HXT3 RGT2
HXT12
HXT14
NRG1
RGT1NRG2
Reference
Reference
RGT1HXT8
SNF3 HXT10
HXT4RGT2
HXT17 HXT3
MTH1
HXT1
NRG2
HXT14NRG1
HXT12

Results and discussion
99
fold higher biomass yield on galactose than on glucose (Figure 5.4-6 upper part). Two strains,
hxt17 and mth1 had about similar PPP,gal/ PPP,glu and YX/S,gal/YX/S,glu ratios (Figure 5.4-6
lower part). This means that biomass yield is not directly related to PPP activity in these mu-
tants.
Two strains, hxt1 and snf3 which had almost identical PPP values both on galactose and
glucose ( PPP,gal/ PPP,glu values about 1) had about half the ethanol yield on galactose than
glucose; one strain, hxt3 with PPP,gal/ PPP,glu value equal to 1 had about 75% ethanol yield
on galactose compared to glucose. hxt10 strain had half the values of YE/S,gal/YE/S,glu com-
pared to PPP,gal/ PPP,glu. hxt8 , which had lower PPP value on galactose, had 2-fold higher
ethanol yields on galactose than glucose. rgt1 strain, which had about 3.5-fold higher PPP
had about 1.5-fold higher ethanol yield on galactose than on glucose. Reference strain, which
had about 3.3-fold higher PPP on galactose had almost identical ethanol yield values on both
galactose and glucose sugars (Figure 5.4-6 lower part).
55..44..44..22 TTCCAA ccyyccllee aanndd FFeerrmmeennttaattiivvee ppaatthhwwaayy
On glucose, hxt4 , hxt14 and snf3 strains and on galactose, hxt12 , rgt1 and nrg2 had
very low TCA cycle flux and also OAA originating from TCA cycle fluxes, which represents
the non-cyclic operation of TCA cycle. These strains showed higher fermentative fluxes i.e.,
ethanol production on both the sugars. There was a very strong inverse correlation between
the TCA cycle flux and fermentative pathway flux on both the sugars. However, the strains
hxt4 , hxt10 and snf3 had similar TCA cycle and fermentative pathway fluxes on galac-
tose (Figure 5.4-7).
The strains, hxt8 and mth1 on glucose and hxt1 , hxt4 and nrg1 strains on galactose had
very high TCA cycle flux. Interestingly, the strains hxt4 and snf3 had extremely low TCA
cycle flux on glucose and extremely high TCA cycle flux on galactose. rgt1 and nrg2
strains had very low TCA cycle flux on galactose and very high TCA cycle flux on glucose.
When compared to the reference strain, hxt14 strain had low TCA cycle flux on both the
sugars and hxt17 strain had similar TCA cycle fluxes on both the sugars. TCA cycle flux is
neither correlated to the maximum specific growth rate nor to the specific hexose uptake rate

Results and discussion
100
on both the sugars and these observations are consistent with previous findings (Blank et al.,
2004).
Figure 5.4-7 Correlation between TCA cycle flux and fermentative pathway (ethanol produc-tion) flux on both the sugars. The dotted line represents a linear regression on glucose and thedashed line on galactose.
55..44..44..33 AAnnaapplleerroottiicc ppaatthhwwaayy
Pyruvate carboxylase mediates an anaplerotic reaction, replenishing the oxaloacetate (OAA)
pool, which is used to produce many of the biosynthetic intermediates needed for anabolism.
Strains having anaplerotic of 0.005 to 0.015 were classified as strains with low anaplerotic. On
glucose, 12 strains were having low anaplerotic, whereas none of the strains had low anaplerotic
on galactose. Strains having anaplerotic of 0.015 to 0.025 were classified as strains with high
anaplerotic. On glucose, 4 strains were having high anaplerotic whereas on galactose one strain
had high anaplerotic. Strains with anaplerotic of 0.025 to 0.035 were classified as strains with
very high anaplerotic. On galactose, 5 strains had very high anaplerotic whereas none of the
strains had very high anaplerotic on glucose. Eight strains had exceptionally high anaplerotic on
galactose; snf3 (0.036), hxt12 (0.038), mth1 (0.04), nrg2 (0.046), hxt1 (0.047), nrg1
(0.057), hxt3 (0.065) and hxt14 (0.071) (Figure 5.4-8).
The correlation of anaplerotic between glucose and galactose showed that except rgt2 and
reference strains, none of the other strains had comparable anaplerotic on both the sugars.
0
20
40
60
80
100
120
0 20 40 60 80 100 120 140 160 180 200
Fermentative pathway flux (%)
TCA
cyc
le fl
ux (%
)GlucoseGalactose
Reference
Reference
HXT8
MTH1
NRG2NRG1
RGT1RGT2HXT12
HXT10HXT3
HXT17
HXT14HXT4SNF3
NRG1HXT1 HXT4
HXT10SNF3 RGT2
HXT3
HXT14NRG2HXT12
MTH1
0
20
40
60
80
100
120
0 20 40 60 80 100 120 140 160 180 200
Fermentative pathway flux (%)
TCA
cyc
le fl
ux (%
)GlucoseGalactose
Reference
Reference
HXT8
MTH1
NRG2NRG1
RGT1RGT2HXT12
HXT10HXT3
HXT17
HXT14HXT4SNF3
NRG1HXT1 HXT4
HXT10SNF3 RGT2
HXT3
HXT14NRG2HXT12
MTH1

Results and discussion
101
Most of the strains had three times higher anaplerotic values on galactose than on glucose.
hxt14 , hxt3 and nrg1 strains had extremely high anaplerotic values (Figure 5.4-8).
Figure 5.4-8 Comparison of flux partitioning into the anaplerotic pathways, Anaplerotic, ingalactose and glucose cultures. The solid line indicates identical values on glucose and galac-tose and the dashed line indicates three times higher Anaplerotic values on galactose comparedto glucose.
The flux through anaplerotic pathway, which is normalised with the hexose uptake rate is
correlated to the maximum specific growth rate on glucose, which is in agreement with the
previous findings by Frick and Wittmann (2005) but no correlation was observed on galac-
tose (Figure 5.4-9 A). A strong inverse correlation was observed between the flux through
anaplerotic pathway and specific hexose uptake rate and specific ethanol production rate on
both the sugars (Figure 5.4-9 B).
hxt4 strain had lower respiration than other strains on glucose, whereas on galactose it had
highest respiratory flux. In contrast, hxt8 strain showed an opposite effect. Isogenic strains,
nrg1 and nrg2 had identical fluxes on glucose whereas on galactose they exhibited differ-
ent profiles. On galactose, nrg2 strain had higher PPP flux, biosynthesis from AKG in TCA
cycle flux and fermentative capacity than nrg1 .
0.00
0.01
0.02
0.03
0.04
0.05
0.06
0.07
0.08
0.000 0.005 0.010 0.015 0.020 0.025 0.030
Anaplerotic,glu
Ana
pler
otic
,gal
Reference
HXT3
HXT17
HXT4
HXT8
MTH1
HXT1
HXT14
NRG1
NRG2
RGT2
0.00
0.01
0.02
0.03
0.04
0.05
0.06
0.07
0.08
0.000 0.005 0.010 0.015 0.020 0.025 0.030
Anaplerotic,glu
Ana
pler
otic
,gal
Reference
HXT3
HXT17
HXT4
HXT8
MTH1
HXT1
HXT14
NRG1
NRG2
RGT2

Results and discussion
102
Figure 5.4-9 Correlation between (A) specific growth rate, µ, and flux partitioning into theanaplerotic pathway, which is normalised with the hexose uptake rate (B) flux partitioninginto the anaplerotic pathway, which is normalised with the hexose uptake rate and specifichexose uptake rate, qHexose, and specific ethanol production rate qEthanol.
55..44..55 CCoonncclluussiioonnssA set of hexose transporter deletion mutants were selected and quantitative stoichiometric
and metabolic flux data on glucose and galactose as sole carbon sources was obtained using
previously developed methodology (Velagapudi et al., 2006; Hollemeyer et al., 2007). Since
these are single knockouts and complementary, these strains had no growth defects, except
for gal2 on galactose. This type of quantitative stoichiometric and metabolic flux profiling
revealed different phenotypic profiles on different carbon sources. Strains had mainly fer-
mentative activity on glucose and respiratory and biosynthetic activity on galactose.
On glucose, hxt4 strain had as low TCA fluxes as anaplerotic fluxes (2-3 %) with high-
est ethanol yield. On galactose, it had higher respiratory flux.
0
5
10
15
20
25
30
35
40
45
0 1 2 3 4 5 6 7 8 9 10 11 12Anaplerotic flux (%)
0
5
10
15
20
25
30
35
40
45Glucose_qsGalactose_qs
Glucose_qpGalactose_qp
Reference
q Eth
anol
(mm
olg-1
h-1)
q Hex
ose(m
mol
g-1h-1
)
Reference
0
2
4
6
8
10
12
0.0 0.1 0.2 0.3 0.4 0.5
Anap
lero
tic fl
ux (%
)
Glucose
Galactose
µmax (h-1)
ReferenceReference
(A)
(B)
HXT14
HXT17
HXT3
NRG1NRG2HXT1
MTH1HXT12
RGT2 HXT4RGT1HXT8
HXT14
HXT8
NRG1NRG2
MTH1
HXT17
RGT2HXT3
0
5
10
15
20
25
30
35
40
45
0 1 2 3 4 5 6 7 8 9 10 11 12Anaplerotic flux (%)
0
5
10
15
20
25
30
35
40
45Glucose_qsGalactose_qs
Glucose_qpGalactose_qp
Reference
q Eth
anol
(mm
olg-1
h-1)
q Hex
ose(m
mol
g-1h-1
)
Reference
0
5
10
15
20
25
30
35
40
45
0 1 2 3 4 5 6 7 8 9 10 11 12Anaplerotic flux (%)
0
5
10
15
20
25
30
35
40
45Glucose_qsGalactose_qs
Glucose_qpGalactose_qp
Reference
q Eth
anol
(mm
olg-1
h-1)
q Hex
ose(m
mol
g-1h-1
)
Reference
0
2
4
6
8
10
12
0.0 0.1 0.2 0.3 0.4 0.5
Anap
lero
tic fl
ux (%
)
Glucose
Galactose
µmax (h-1)
ReferenceReference
(A)
(B)
HXT14
HXT17
HXT3
NRG1NRG2HXT1
MTH1HXT12
RGT2 HXT4RGT1HXT8
HXT14
HXT8
NRG1NRG2
MTH1
HXT17
RGT2HXT3

Results and discussion
103
On galactose, rgt1 strain had extremely high PPP flux.
On glucose, hxt8 grew with highest specific growth rate and had highest specific glu-
cose uptake rate with lowest ethanol yield. The strain had highest PPP and TCA cycle
fluxes, i.e., the hxt8 strain is highly respiring, thus most of the carbon flux that was
channelled to PPP and TCA cycle and released as CO2.
The mutant strain hxt14 had similar anaplerotic and TCA fluxes on both the sugars.
The mutant strain hxt17 had similar TCA and PPP fluxes as well as ethanol yields on
both the sugars.
Results and discussion
104
55..55 MMEETTAABBOOLLIICC SSCCRREEEENNIINNGG OOFF SS.. CCEERREEVVIISSIIAAEE SSIINNGGLLEEKKNNOOCCKKOOUUTT SSTTRRAAIINNSS OONN FFRRUUCCTTOOSSEE SSUUGGAARR AANNDD AA
CCOOMMPPAARRAATTIIVVEE SSTTUUDDYY OONN DDIIFFFFEERREENNTT CCAARRBBOONN SSOOUURRCCEESS
Velagapudi, V.R., Heinzle, E., 2009. Comparative physiological profiling of S. cere visiae single knockouts on different carbon sources – Fructose, Glucose and galactose (in preparation)
55..55..11 BBaacckkggrroouunnddGlucose and fructose are the most preferred carbon sources for S. cerevisiae and are metabo-
lised primarily via the glycolytic pathway. Like other hexoses, fructose is also transported via
a facilitated diffusion system mediated by hexose transporters. In S.cerevisiae, fructose is
first converted to fructose 6-phosphate pathway (detailed description was given in section
3.3.3) that is part of glycolysis. S.cerevisiae is the preferred species of yeasts for wine-
making. Both sugars are present in musts approximately in equal amounts. Since the affinity
for glucose is higher than for fructose in S.cerevisiae, in the wine alcoholic fermentation
process, glucose metabolises first leaving large quantities of fructose (approximately ten
times compared to glucose) at the end. As a consequence, maximal rate of fermentation is
reduced after most of the glucose is consumed, which leads to sluggish or stuck fermentation.
Therefore, fructose consumption by wine-yeast is of great importance for maintenance of
high rate of fermentation (Schutz et al., 1995). According to a previous study, it is possible to
predict the sluggish or stuck fermentation based on the glucose/fructose ratio (GFR) (Gafner
et al., 1996). Thus the studies on metabolic profiling on fructose substrate have significant
importance in wine industries. Hence it is of great interest in the point of industrial biotech-
nology to study the physiological profiling of S. cerevisiae mutants with deletions in central
carbon metabolism on fructose substrate. This kind of physiological analysis will provide an
insight on quantitative metabolic profiling i.e., specific fructose uptake rate and specific etha-
nol production rate, specific growth rate and yields of mutants on fructose, which might help
in identifying an industrially useful strain. In this chapter, about 50 mutant strains were se-
lected (Table 5.5-1) and grown on fructose as a sole carbon source as described in previous
chapters. In the first step, all the physiological parameters were calculated on fructose and
then compared with the glucose and galactose data, which were described in previous chap-
ters.

Results and discussion
Table 5.5-1 Information about the selected yeast deletion mutant strainsORF Gene name Metabolic function ActivityYML054C CYB2 Lactate metabolic process L-lactate dehydrogenase activityYML051W GAL80 Positive regulation of transcription by galactose Specific transcriptional repressor activityYMR205C PFK2 Glycolysis 6-phosphofructokinase activityYMR250W GAD1 Response to oxidative stress Glutamate decarboxylase activityYMR280C CAT8 Positive regulation of gluconeogenesis Specific RNA pol II transcription factor activityYNL257C SIP3 Transcription initiation from pol II promoter Transcription cofactor activityYOR344C TYE7 Transcription Transcription factor activityYPL248C GAL4 Positive regulation of transcription by galactose DNA-dependent transcriptional activator activityYBR184W YBR184W Unknown UnknownYDR073W SNF11 Chromatin modelling RNA pol II transcription factor activityYGR194C XKS1 Xylulose catabolism Xylulokinase activityYCL040W GLK1 Glycolysis Glucokinase activityYLR131C ACE2 Transcription during G1 mitotic cell cycle Transcription factor activityYKL029C MAE1 Pyruvate metabolism Malate dehydrogenase (oxaloacetate decarboxylating) activityYKL062W MSN4 Response to stress Transcription factor activityYJL155C FBP26 Gluconeogenesis Fructose-2,6-bisphosphate 2-phosphatase activityYDR216W ADR1 Transcription Transcription factor activityYGL209W MIG2 Regulation of transcription from Pol II promoter RNA pol II transcription factor activityYGL253W HXK2 Carbohydrate metabolic process Hexokinase activityYGR019W UGA1 Gamma-aminobutyric acid catabolic process 4-aminobutyrate transaminase activityYDR248C YDR248C Unknown UnknownYKR097W PCK1 Gluconeogenesis Phosphoenolpyruvate carboxykinase (ATP) activityYJR153W PGU1 Pectin catabolic process Polygalacturonase activityYBR297W MAL33 Regulation of transcription DNA-dependent transcription factor activityYCR036W RBK1 Ribose metabolic process Ribokinase activityYDL168W SFA1 Formaldehyde assimilation Formaldehyde dehydrogenase (glutathione) activityYDL174C DLD2 Aerobic respiration D-lactate dehydrogenase (cytochrome) activityYBR006W UGA5 Response to oxidative stress Succinate-semialdehyde dehydrogenase (NAD(P)+) activityYBR018C GAL7 Galactose metabolism UDP-hexose-1-phosphate uridylyltransferase activityYBR019C GAL10 Galactose metabolism UDP-glucose-4-epimerase activityYIL107C PFK26 Fructose-2,6-bisphosphate metabolism 6-phosphofructo-2-kinase activity

Results and discussion
106
YNL071W LAT1 Pyruvate metabolism Dihydrolipoyllysine-residue acetyltransferase activityYNL104C LEU4 Leucine biosynthesis 2-isopropylmalate synthase activityYLR377C FBP1 Gluconeogenesis Fructose-bisphosphatase activityYIL154C IMP2 DNA repair Transcription co-activator activityYOR290C SNF2 Chromatin remodelling RNA pol II transcription factor activityYHR094C HXT1 Cellular sugar import Low affinity transmembrane hexose transport activityYDR345C HXT3 Cellular sugar import Low affinity transmembrane hexose transport activityYHR092C HXT4 Cellular sugar import High affinity transmembrane hexose transport activityYJL214W HXT8 Cellular sugar import UnknownYFL011W HXT10 Cellular sugar import UnknownYIL170W HXT12 Unknown UnknownYNL318C HXT14 Cellular sugar import Transmembrane galactose transport activityYNR072W HXT17 Cellular sugar import UnknownYDL194W SNF3 Sugar binding High affinity glucose sensorYDL138W RGT2 Sugar binding Low affinity glucose sensorYKL038W RGT1 Regulation of carbohydrate metabolism Transcription factor activityYLR081W GAL2 Galactose metabolism Galactose permease activityYDR277C MTH1 Regulation of carbohydrate metabolism Repressor of hexose transport genesYDR043C NRG1 Regulation of carbohydrate metabolism Transcriptional repressor activityYBR066C NRG2 Regulation of carbohydrate metabolism Transcriptional repressor activity
Sources: Saccharomyces genome deletion project.SGD (http://www.sequence.stanford.edu/group/yeast_deletion_project/references.html),MIPS (http://mips.gsf.de/genre/proj/yeast/)SGD (http://www.yeastgenome.org/) databases

Results and discussion
107
55..55..22 PPhhyyssiioollooggiiccaall pprrooffiilliinngg ooff mmuuttaannttss oonn ffrruuccttoosseeRecently developed novel method for high-content stoichiometric and kinetic metabolic pro-
filing was used to obtain quantitative information of physiological parameters i.e., specific
growth rate, biomass yield, ethanol yield, specific substrate uptake rate, specific ethanol pro-
duction rate and specific oxygen uptake rate of selected deletion mutants on fructose sub-
strate as sole carbon source at miniaturized scale using 96-well microtiter plates with on-line
optical sensing of dissolved oxygen (Velagapudi et al., 2006).
55..55..22..11 SSppeecciiffiicc ggrroowwtthh rraattee ((µµmmaaxx))On fructose carbon source, deletion mutants were growing in a varying range of specific
growth rates, µmax, ranging from 0.238 h-1 to 0.438 h-1. Strains with µmax less than 0.26 h-1 are
classified as “slow growers”, µmax from 0.26 h-1 to 0.4 h-1 are classified as “fast growers” and
µmax above 0.4 h-1 are classified as “very fast growers”. The reference strain had specific
growth rate, µmax, of 0.236 h-1 and all other mutant strains were growing faster than the refer-
ence strain. According to the above classification, 3 strains, hxt4 , ace2 and snf3 were
slow growers; 39 strains were fast growers and 12 strains were very fast growers.
55..55..22..22 SSppeecciiffiicc hheexxoossee uuppttaakkee rraattee ((qqhheexxoossee))On fructose, deletion mutants had a very broad range of specific fructose consumption rates
(qfructose) ranging from 12 mmol/g/h - 48 mmol/g/h. Most of the strains had qfructose from 12
mmol/g/h - 25 mmol/g/h; 9 strains had high qfructose from 25 mmol/g/h - 30 mmol/g/h; 4
strains had very high qfructose from 30 mmol/g/h - 40 mmol/g/h; and one strain, hxt14 had
extremely high qfructose 43.8 mmol/g/h, and one strain, hxt17 had exceptionally high qfructose
48 mmol/g/h. Specific uptake rate of fructose, qfructose, is plotted versus the maximum specific
growth rate of each mutant, µmax (Figure 5.5-1A). In most of the strains, an increasing specific
hexose consumption rate was observed with increasing specific growth rate. Interestingly, all
the deletion strains with very high and exceptionally high fructose consumption rates are re-
lated to hexose transporter family and regulators (Figure 5.5-1A).
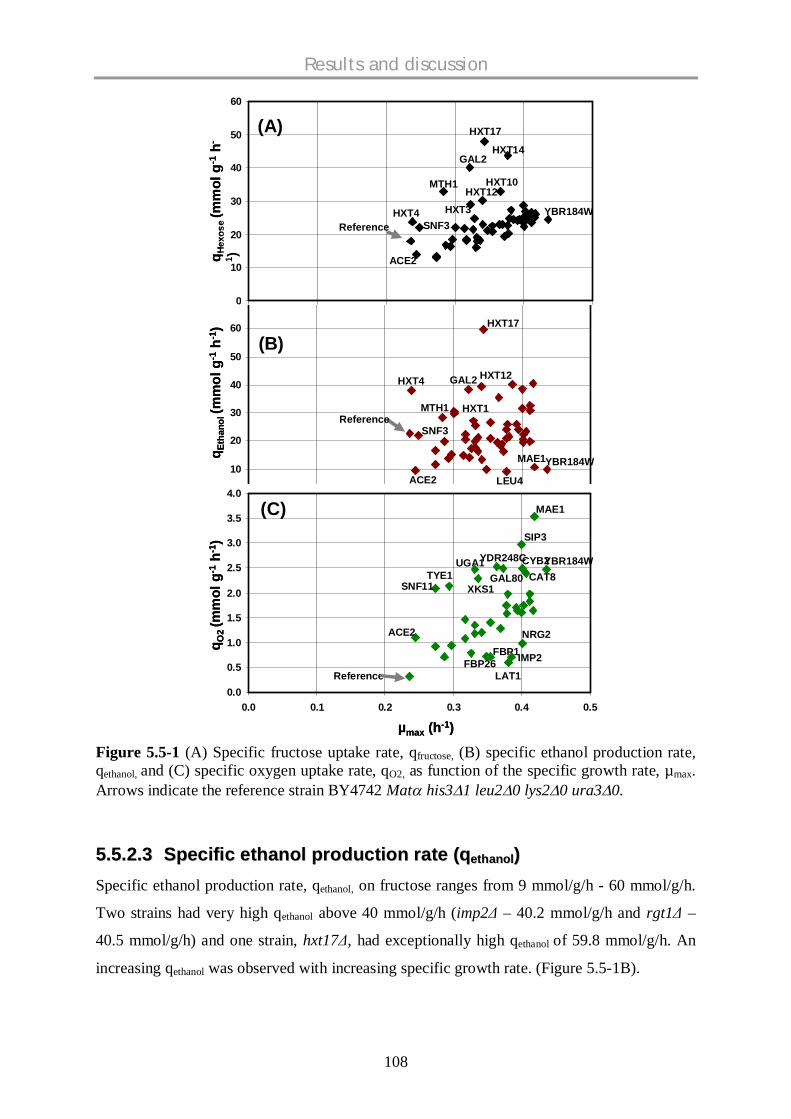
Results and discussion
108
Figure 5.5-1 (A) Specific fructose uptake rate, qfructose, (B) specific ethanol production rate,qethanol, and (C) specific oxygen uptake rate, qO2, as function of the specific growth rate, µmax.Arrows indicate the reference strain BY4742 Mat his3 1 leu2 0 lys2 0 ura3 0.
55..55..22..33 SSppeecciiffiicc eetthhaannooll pprroodduuccttiioonn rraattee ((qqeetthhaannooll))Specific ethanol production rate, qethanol, on fructose ranges from 9 mmol/g/h - 60 mmol/g/h.
Two strains had very high qethanol above 40 mmol/g/h (imp2 – 40.2 mmol/g/h and rgt1 –
40.5 mmol/g/h) and one strain, hxt17 , had exceptionally high qethanol of 59.8 mmol/g/h. An
increasing qethanol was observed with increasing specific growth rate. (Figure 5.5-1B).
0
10
20
30
40
50
60
700
10
20
30
40
50
60
qs
0.0
0.5
1.0
1.5
2.0
2.5
3.0
3.5
4.0
0.0 0.1 0.2 0.3 0.4 0.5
µmax (h-1)
q Eth
anol
(mm
olg-1
h-1)
q Hex
ose
(mm
olg-1
h-
1 )q O
2(m
mol
g-1h-1
)
(A)
(B)
(C)
HXT14
HXT10
HXT17
HXT12
HXT4 YBR184WReference
MTH1
GAL2
HXT3SNF3
ACE2
HXT17
HXT4 HXT12GAL2
ReferenceSNF3
MTH1 HXT1
ACE2
YBR184WMAE1
LEU4
MAE1
SIP3
YBR184W
Reference
ACE2
SNF11TYE1
UGA1
XKS1GAL80
YDR248CCYB2CAT8
FBP26FBP1
NRG2
IMP2
LAT1
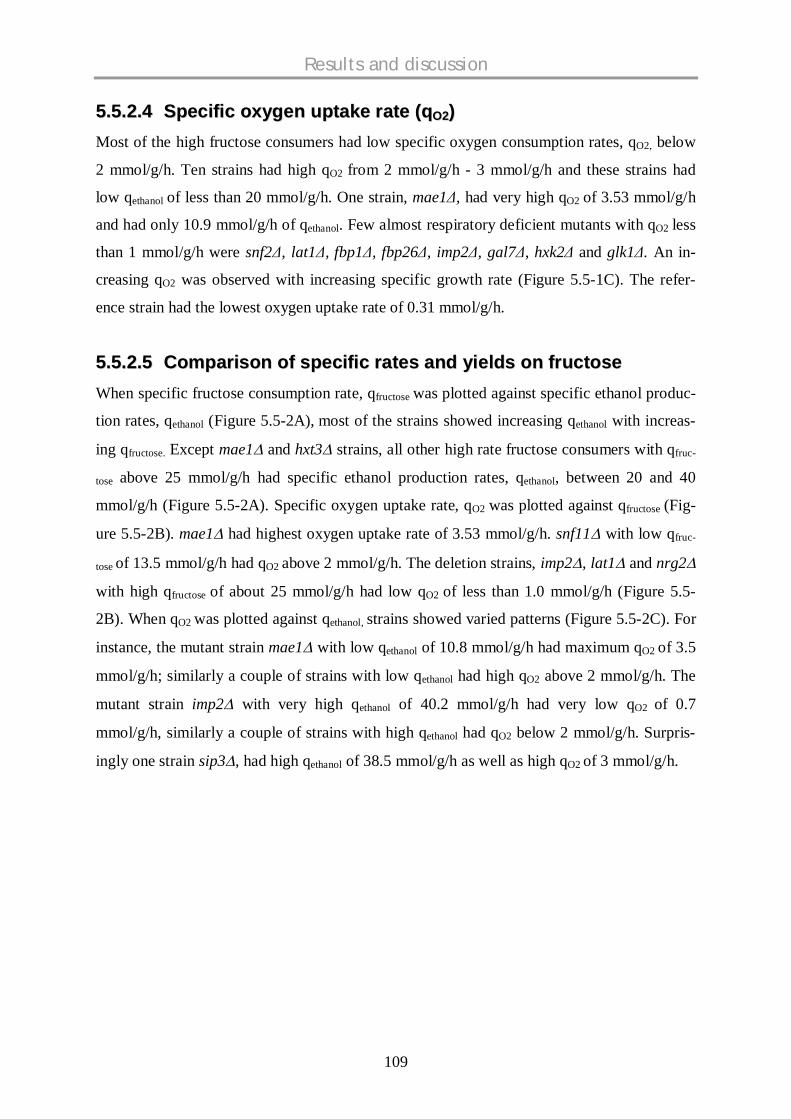
Results and discussion
109
55..55..22..44 SSppeecciiffiicc ooxxyyggeenn uuppttaakkee rraattee ((qqOO22))Most of the high fructose consumers had low specific oxygen consumption rates, qO2, below
2 mmol/g/h. Ten strains had high qO2 from 2 mmol/g/h - 3 mmol/g/h and these strains had
low qethanol of less than 20 mmol/g/h. One strain, mae1 , had very high qO2 of 3.53 mmol/g/h
and had only 10.9 mmol/g/h of qethanol. Few almost respiratory deficient mutants with qO2 less
than 1 mmol/g/h were snf2 , lat1 , fbp1 , fbp26 , imp2 , gal7 , hxk2 and glk1 . An in-
creasing qO2 was observed with increasing specific growth rate (Figure 5.5-1C). The refer-
ence strain had the lowest oxygen uptake rate of 0.31 mmol/g/h.
55..55..22..55 CCoommppaarriissoonn ooff ssppeecciiffiicc rraatteess aanndd yyiieellddss oonn ffrruuccttoosseeWhen specific fructose consumption rate, qfructose was plotted against specific ethanol produc-
tion rates, qethanol (Figure 5.5-2A), most of the strains showed increasing qethanol with increas-
ing qfructose. Except mae1 and hxt3 strains, all other high rate fructose consumers with qfruc-
tose above 25 mmol/g/h had specific ethanol production rates, qethanol, between 20 and 40
mmol/g/h (Figure 5.5-2A). Specific oxygen uptake rate, qO2 was plotted against qfructose (Fig-
ure 5.5-2B). mae1 had highest oxygen uptake rate of 3.53 mmol/g/h. snf11 with low qfruc-
tose of 13.5 mmol/g/h had qO2 above 2 mmol/g/h. The deletion strains, imp2 , lat1 and nrg2
with high qfructose of about 25 mmol/g/h had low qO2 of less than 1.0 mmol/g/h (Figure 5.5-
2B). When qO2 was plotted against qethanol, strains showed varied patterns (Figure 5.5-2C). For
instance, the mutant strain mae1 with low qethanol of 10.8 mmol/g/h had maximum qO2 of 3.5
mmol/g/h; similarly a couple of strains with low qethanol had high qO2 above 2 mmol/g/h. The
mutant strain imp2 with very high qethanol of 40.2 mmol/g/h had very low qO2 of 0.7
mmol/g/h, similarly a couple of strains with high qethanol had qO2 below 2 mmol/g/h. Surpris-
ingly one strain sip3 , had high qethanol of 38.5 mmol/g/h as well as high qO2 of 3 mmol/g/h.

Results and discussion
110
Figure 5.5-2 (A) Specific rate of ethanol production, qethanol, and (B) specific oxygen uptakerate, qO2, as a function of the specific fructose consumption rate, qfructose (C) Specific oxygenuptake rate, qO2, as a function of the specific rate of ethanol production, qethanol, Arrows indi-cate the reference strain BY4742 Mat his3 1 leu2 0 lys2 0 ura3 0.
0
10
20
30
40
50
60
70
0 10 20 30 40 50
qp
0.0
0.5
1.0
1.5
2.0
2.5
3.0
3.5
4.0
0 5 10 15 20 25 30 35 40 45
qEthanol (mmol g-1 h-1)
q O2(m
mol
g-1h-1
)
Reference
MAE1
YBR184W
SNF11
LEU4
TYE1GAL80
XKS1
CYB2
YDR248C
LAT1FBP1
ADR1
RBK1
SIP3
RGT1
IMP2
MSN4
0.0
0.5
1.0
1.5
2.0
2.5
3.0
3.5
4.0
0 5 10 15 20 25 30 35
qo2
qHexose (mmol g-1 h-1)
q Eth
anol
(mm
olg-1
h-1)
qHexose (mmol g-1 h-1)
q O2
(mm
olg-1
h-1)
(A)
(B)
HXT17
HXT10RBK1
HXT14MTH1
ADR1
GAL2HXT12
HXT3MAE1
YBR184W
Reference
Reference
MAE1
SIP3
SNF11 TYE1xks1
UGA1GAL80CAT8
YBR184WYDR248C
CYB2
RBK1
NRG2IMP2LAT1HXK2
ACE2
PFK2
(C)

Results and discussion
111
Figure 5.5-3 represents the correlation between specific growth rate, µmax, and biomass
yields, YX/S, ethanol yield, YE/S as well as with biomass yield on oxygen, YX/O. The results
were given in the Table 5.5-2. Most of the deletion mutants had biomass yield from 0.06 to
0.12 g/g, few strains, hxt17 , hxt4 , hxt14 and mth1 had low YX/S ranging from 0.04 to
0.06 g/g. Two strains, hxk2 and pfk2 , had a very high biomass yield (0.118 and 0.115 g/g,
respectively) (Figure 5.5-3A). Most of the strains had ethanol yields ranging from 0.20 – 0.35
g/g, some strains had low ethanol yields ranging from 0.10 – 0.2 g/g, and few strains, hxt4,
imp2 , sip3 and rgt1 had higher ethanol yields above 0.40 g/g (Figure 5.5-3B). Most of
the strains had biomass yield on oxygen, YX/O, ranging from 5 – 10 g/g, some strains had low
YX/O ranging from 3 – 5 g/g, and some strains had higher YX/O ranging from 10 – 20 g/g, the
reference strain had the highest YX/O of 23.5 g/g (Figure 5.5-3C).
Figure 5.5-3 Correlation between specific growth rate, µmax, and biomass yield on fructose,YX/S, ethanol yield, YE/S, as well as with biomass yield on oxygen, YX/O (Table 5.5-2) Arrowsindicate the reference strain BY4742 Mat his3 1 leu2 0 lys2 0 ura3 0.
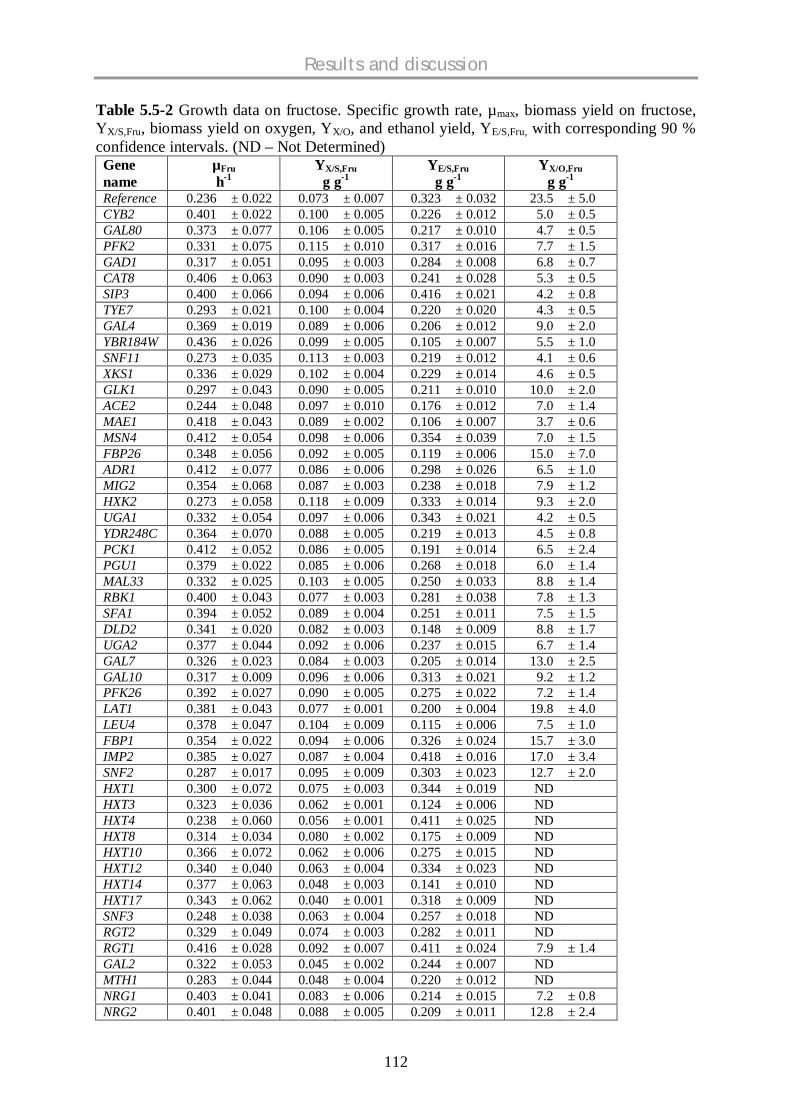
Results and discussion
112
Table 5.5-2 Growth data on fructose. Specific growth rate, µmax, biomass yield on fructose,YX/S,Fru, biomass yield on oxygen, YX/O, and ethanol yield, YE/S,Fru, with corresponding 90 %confidence intervals. (ND – Not Determined)Genename
µFruh-1
YX/S,Frug g-1
YE/S,Frug g-1
YX/O,Frug g-1
Reference 0.236 ± 0.022 0.073 ± 0.007 0.323 ± 0.032 23.5 ± 5.0CYB2 0.401 ± 0.022 0.100 ± 0.005 0.226 ± 0.012 5.0 ± 0.5GAL80 0.373 ± 0.077 0.106 ± 0.005 0.217 ± 0.010 4.7 ± 0.5PFK2 0.331 ± 0.075 0.115 ± 0.010 0.317 ± 0.016 7.7 ± 1.5GAD1 0.317 ± 0.051 0.095 ± 0.003 0.284 ± 0.008 6.8 ± 0.7CAT8 0.406 ± 0.063 0.090 ± 0.003 0.241 ± 0.028 5.3 ± 0.5SIP3 0.400 ± 0.066 0.094 ± 0.006 0.416 ± 0.021 4.2 ± 0.8TYE7 0.293 ± 0.021 0.100 ± 0.004 0.220 ± 0.020 4.3 ± 0.5GAL4 0.369 ± 0.019 0.089 ± 0.006 0.206 ± 0.012 9.0 ± 2.0YBR184W 0.436 ± 0.026 0.099 ± 0.005 0.105 ± 0.007 5.5 ± 1.0SNF11 0.273 ± 0.035 0.113 ± 0.003 0.219 ± 0.012 4.1 ± 0.6XKS1 0.336 ± 0.029 0.102 ± 0.004 0.229 ± 0.014 4.6 ± 0.5GLK1 0.297 ± 0.043 0.090 ± 0.005 0.211 ± 0.010 10.0 ± 2.0ACE2 0.244 ± 0.048 0.097 ± 0.010 0.176 ± 0.012 7.0 ± 1.4MAE1 0.418 ± 0.043 0.089 ± 0.002 0.106 ± 0.007 3.7 ± 0.6MSN4 0.412 ± 0.054 0.098 ± 0.006 0.354 ± 0.039 7.0 ± 1.5FBP26 0.348 ± 0.056 0.092 ± 0.005 0.119 ± 0.006 15.0 ± 7.0ADR1 0.412 ± 0.077 0.086 ± 0.006 0.298 ± 0.026 6.5 ± 1.0MIG2 0.354 ± 0.068 0.087 ± 0.003 0.238 ± 0.018 7.9 ± 1.2HXK2 0.273 ± 0.058 0.118 ± 0.009 0.333 ± 0.014 9.3 ± 2.0UGA1 0.332 ± 0.054 0.097 ± 0.006 0.343 ± 0.021 4.2 ± 0.5YDR248C 0.364 ± 0.070 0.088 ± 0.005 0.219 ± 0.013 4.5 ± 0.8PCK1 0.412 ± 0.052 0.086 ± 0.005 0.191 ± 0.014 6.5 ± 2.4PGU1 0.379 ± 0.022 0.085 ± 0.006 0.268 ± 0.018 6.0 ± 1.4MAL33 0.332 ± 0.025 0.103 ± 0.005 0.250 ± 0.033 8.8 ± 1.4RBK1 0.400 ± 0.043 0.077 ± 0.003 0.281 ± 0.038 7.8 ± 1.3SFA1 0.394 ± 0.052 0.089 ± 0.004 0.251 ± 0.011 7.5 ± 1.5DLD2 0.341 ± 0.020 0.082 ± 0.003 0.148 ± 0.009 8.8 ± 1.7UGA2 0.377 ± 0.044 0.092 ± 0.006 0.237 ± 0.015 6.7 ± 1.4GAL7 0.326 ± 0.023 0.084 ± 0.003 0.205 ± 0.014 13.0 ± 2.5GAL10 0.317 ± 0.009 0.096 ± 0.006 0.313 ± 0.021 9.2 ± 1.2PFK26 0.392 ± 0.027 0.090 ± 0.005 0.275 ± 0.022 7.2 ± 1.4LAT1 0.381 ± 0.043 0.077 ± 0.001 0.200 ± 0.004 19.8 ± 4.0LEU4 0.378 ± 0.047 0.104 ± 0.009 0.115 ± 0.006 7.5 ± 1.0FBP1 0.354 ± 0.022 0.094 ± 0.006 0.326 ± 0.024 15.7 ± 3.0IMP2 0.385 ± 0.027 0.087 ± 0.004 0.418 ± 0.016 17.0 ± 3.4SNF2 0.287 ± 0.017 0.095 ± 0.009 0.303 ± 0.023 12.7 ± 2.0HXT1 0.300 ± 0.072 0.075 ± 0.003 0.344 ± 0.019 NDHXT3 0.323 ± 0.036 0.062 ± 0.001 0.124 ± 0.006 NDHXT4 0.238 ± 0.060 0.056 ± 0.001 0.411 ± 0.025 NDHXT8 0.314 ± 0.034 0.080 ± 0.002 0.175 ± 0.009 NDHXT10 0.366 ± 0.072 0.062 ± 0.006 0.275 ± 0.015 NDHXT12 0.340 ± 0.040 0.063 ± 0.004 0.334 ± 0.023 NDHXT14 0.377 ± 0.063 0.048 ± 0.003 0.141 ± 0.010 NDHXT17 0.343 ± 0.062 0.040 ± 0.001 0.318 ± 0.009 NDSNF3 0.248 ± 0.038 0.063 ± 0.004 0.257 ± 0.018 NDRGT2 0.329 ± 0.049 0.074 ± 0.003 0.282 ± 0.011 NDRGT1 0.416 ± 0.028 0.092 ± 0.007 0.411 ± 0.024 7.9 ± 1.4GAL2 0.322 ± 0.053 0.045 ± 0.002 0.244 ± 0.007 NDMTH1 0.283 ± 0.044 0.048 ± 0.004 0.220 ± 0.012 NDNRG1 0.403 ± 0.041 0.083 ± 0.006 0.214 ± 0.015 7.2 ± 0.8NRG2 0.401 ± 0.048 0.088 ± 0.005 0.209 ± 0.011 12.8 ± 2.4

Results and discussion
113
55..55..22..66 CCoommppaarriissoonn ooff mmuuttaannttss aaggaaiinnsstt mmuuttaannttss aanndd wwiitthh rreeffeerreenncceeAll the examined mutants were compared against each other in all four dimensions i.e., µmax,
YX/S, YE/S and YX/O and searched for the indistinguishable strain combinations and Table 5.5-
3 reveals all the 38 indistinguishable strain combinations. The mutant strain mig2 had maxi-
mum of 6 indistinguishable mutant pairs (mig2 -nrg1 ; mig2 -uga2 ; mig2 -pfk26 ;
mig2 -pgu1 ; mig2 -sfa1 ; mig2 -glk1 ) followed by adr1 with 5 (adr1 -gad 1; adr1 -
pfk26 ; adr1 -pgu1 ; adr1 -rbk1 ; adr1 -msn4 ) and then followed by pgu1 with 4
(pgu1 -pfk26 ; pgu1 -rbk1 ; pgu1 -sfa1 ; pgu1 -uga2 ) indistinguishable mutant
pairs.
The reference strain was quite close to an average value with respect to YX/S and qEthanol
whereas µmax and YE/S were at the upper boundary and YE/S at the lower boundary of the ob-
served values (Figures 5.5-1 and 5.5-3 and Table 5.5-2). µmax of the reference strain was iden-
tical with ace2 , glk1 , hxk2 , hxt1 , hxt4 , mth1 , pfk2 , snf11 and snf3 . The deletion
strains adr1 , dld2 , hxt1 , hxt10 , hxt12 , hxt8 , lat1 , nrg1 , pgu1 , rbk1 , rgt2 and
snf3 had the same biomass yield as reference strain. Mutant strains adr1 , fbp1 , gad1 ,
gal10 , hxk2 , hxt1 , hxt2 , hxt12 , hxt17 , msn4 , pfk2 , pfk26 , rbk1 , rgt2 , snf2
and uga1 showed the same ethanol yield as the reference strain. Knockout strains, fbp1 ,
fbp26 , imp2 and lat1 had the same biomass yield on oxygen as reference strain. There-
fore, hxt1 strain was indistinguishable from the reference strain in all the three examined
biological parameters, µmax, YX/S and YE/S indicating that the deletion of HXT1 gene wouldn’t
cause any specific phenotype when grown on fructose.

Results and discussion
114
Table 5.5-3 Strains not distinguishable based on specific growth rate, µmax, biomass yield oncarbon substrate, YX/S, ethanol yield, YE/S, and biomass yield on oxygen, YX/OStrain name Number of
mutantpair(s)
adr1 gad1 pfk26 pgu1 rbk1 msn4 5cat8 pgu1 uga2 ydr248c 3cyb2 gal80 uga2 2gad1 mal33 pfk26 2gal4 nrg2 pck1 2gal80 snf11 tye7 xks1 3glk1 gal7 2mig2 nrg1 uga2 pfk26 pgu1 sfa1 glk1 6msn4 rgt1 1pck1 nrg1 1pfk2 hxk2 1pgu1 pfk26 rbk1 sfa1 uga2 4leu4 fbp26 ybr184w 2tye7 xks1 1uga2 nrg1 mal33 2sfa1 uga2 pfk26 2
55..55..33 CCoommppaarraattiivvee pphhyyssiioollooggiiccaall pprrooffiilliinngg ooff mmuuttaannttss ––ffrruuccttoossee ddaattaa wwiitthh gglluuccoossee aanndd ggaallaaccttoossee ddaattaa
The deletion mutants grown on glucose and galactose (Velagapudi et al., 2006) and fructose
were combined to study the comparative physiological profiling on these three carbon
sources.
55..55..33..11 CCoommppaarriissoonn ooff ssppeecciiffiicc rraatteess
Specific uptake rates qHexose, specific ethanol production rates, qethanol and specific oxygen
uptake rates, qO2 were plotted against specific growth rates, µmax, of each mutant (Figure 5.5-
5). Most of the mutants were growing faster than the reference strain on all the 3 carbon
sources. Strains grown on galactose were growing slowly when compared to glucose and
fructose. Some fructose grown strains were growing very fast when compared to the rest of
the strains on other carbon sources. A clear trend of increasing qHexose was observed with in-
creasing µmax for all most all the mutants on all the three carbon sources. However, there are
some outliers on fructose sugar with very high uptake rates and interestingly all of them are
hexose transport deletion mutants (Figure 5.5-5A).
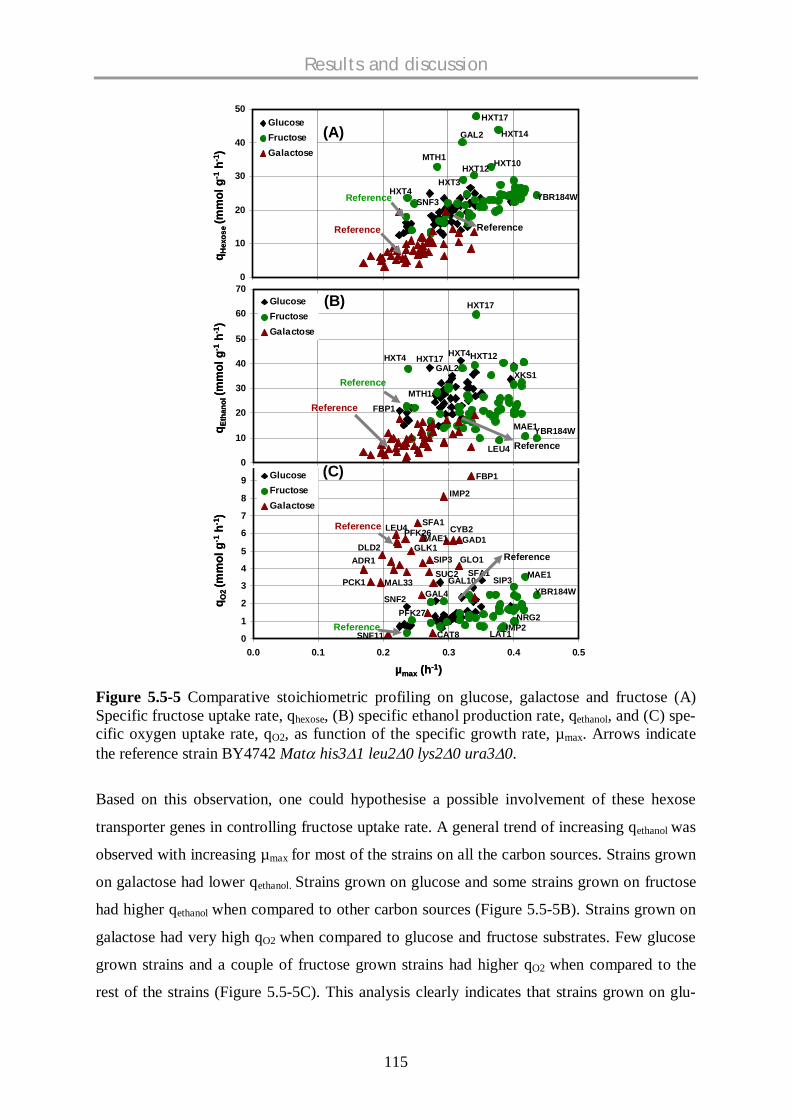
Results and discussion
115
Figure 5.5-5 Comparative stoichiometric profiling on glucose, galactose and fructose (A)Specific fructose uptake rate, qhexose, (B) specific ethanol production rate, qethanol, and (C) spe-cific oxygen uptake rate, qO2, as function of the specific growth rate, µmax. Arrows indicatethe reference strain BY4742 Mat his3 1 leu2 0 lys2 0 ura3 0.
Based on this observation, one could hypothesise a possible involvement of these hexose
transporter genes in controlling fructose uptake rate. A general trend of increasing qethanol was
observed with increasing µmax for most of the strains on all the carbon sources. Strains grown
on galactose had lower qethanol. Strains grown on glucose and some strains grown on fructose
had higher qethanol when compared to other carbon sources (Figure 5.5-5B). Strains grown on
galactose had very high qO2 when compared to glucose and fructose substrates. Few glucose
grown strains and a couple of fructose grown strains had higher qO2 when compared to the
rest of the strains (Figure 5.5-5C). This analysis clearly indicates that strains grown on glu-
0
10
20
30
40
50
qs
GlucoseFructoseGalactose
0
1
2
3
4
5
6
7
8
9
10
0.0 0.1 0.2 0.3 0.4 0.5mue
GlucoseFructoseGalactose
0
10
20
30
40
50
60
70
qp
GlucoseFructoseGalactose
µmax (h-1)
q Eth
anol
(mm
olg-1
h-1)
q Hex
ose(m
mol
g-1h-1
)q O
2(m
mol
g-1h-1
)
HXT14
HXT10
HXT17
HXT12MTH1
HXT4 YBR184WReference
GAL2
HXT3
HXT17
HXT4 HXT12GAL2
ReferenceMTH1
YBR184WMAE1
LEU4
MAE1SIP3YBR184W
ReferenceNRG2
IMP2LAT1
(A)
(B)
(C)
SNF3
HXT17 HXT4
XKS1
FBP1
FBP1
IMP2
SFA1
MAE1
SFA1GAL10
SUC2
SNF11 CAT8
LEU4PFK26GLK1
SIP3 GLO1ADR1
PCK1 MAL33
DLD2GAD1
CYB2
PFK27SNF2 GAL4
Reference
Reference
Reference
Reference
Reference
Reference
0
10
20
30
40
50
qs
GlucoseFructoseGalactose
0
1
2
3
4
5
6
7
8
9
10
0.0 0.1 0.2 0.3 0.4 0.5mue
GlucoseFructoseGalactose
0
10
20
30
40
50
60
70
qp
GlucoseFructoseGalactose
µmax (h-1)
q Eth
anol
(mm
olg-1
h-1)
q Hex
ose(m
mol
g-1h-1
)q O
2(m
mol
g-1h-1
)
HXT14
HXT10
HXT17
HXT12MTH1
HXT4 YBR184WReference
GAL2
HXT3
HXT17
HXT4 HXT12GAL2
ReferenceMTH1
YBR184WMAE1
LEU4
MAE1SIP3YBR184W
ReferenceNRG2
IMP2LAT1
(A)
(B)
(C)
SNF3
HXT17 HXT4
XKS1
FBP1
FBP1
IMP2
SFA1
MAE1
SFA1GAL10
SUC2
SNF11 CAT8
LEU4PFK26GLK1
SIP3 GLO1ADR1
PCK1 MAL33
DLD2GAD1
CYB2
PFK27SNF2 GAL4
Reference
Reference
Reference
Reference
Reference
Reference
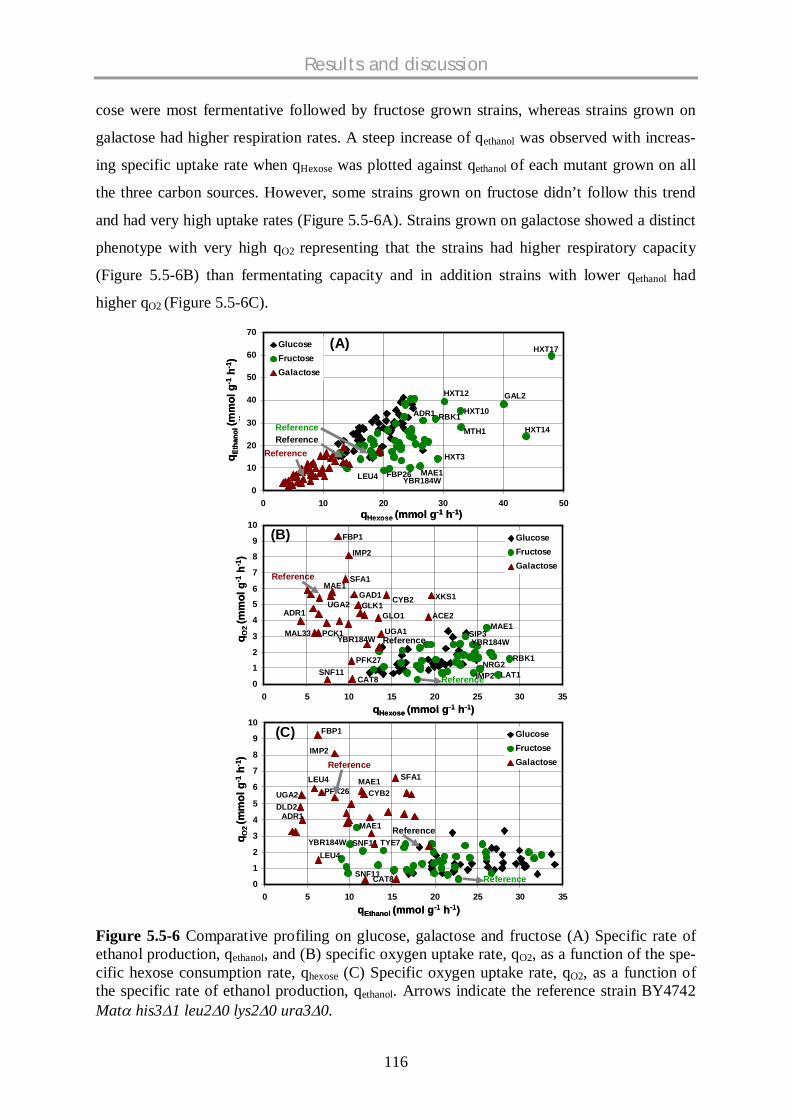
Results and discussion
116
cose were most fermentative followed by fructose grown strains, whereas strains grown on
galactose had higher respiration rates. A steep increase of qethanol was observed with increas-
ing specific uptake rate when qHexose was plotted against qethanol of each mutant grown on all
the three carbon sources. However, some strains grown on fructose didn’t follow this trend
and had very high uptake rates (Figure 5.5-6A). Strains grown on galactose showed a distinct
phenotype with very high qO2 representing that the strains had higher respiratory capacity
(Figure 5.5-6B) than fermentating capacity and in addition strains with lower qethanol had
higher qO2 (Figure 5.5-6C).
Figure 5.5-6 Comparative profiling on glucose, galactose and fructose (A) Specific rate ofethanol production, qethanol, and (B) specific oxygen uptake rate, qO2, as a function of the spe-cific hexose consumption rate, qhexose (C) Specific oxygen uptake rate, qO2, as a function ofthe specific rate of ethanol production, qethanol. Arrows indicate the reference strain BY4742Mat his3 1 leu2 0 lys2 0 ura3 0.
0
10
20
30
40
50
60
70
0 10 20 30 40 50
qp
GlucoseFructoseGalactose
0
1
2
3
4
5
6
7
8
9
10
0 5 10 15 20 25 30 35
GlucoseFructoseGalactose
0
1
2
3
4
5
6
7
8
9
10
0 5 10 15 20 25 30 35qp
GlucoseFructoseGalactose
qHexose (mmol g-1 h-1)
q Eth
anol
(mm
olg-1
h-1)
qHexose (mmol g-1 h-1)
q O2
(mm
olg-1
h-1)
qEthanol (mmol g-1 h-1)
q O2(m
mol
g-1h-1
)
HXT17
HXT10ADR1
HXT14
HXT12
LEU4
GAL2
RBK1
FBP26
MTH1
HXT3
MAE1YBR184W
Reference
Reference
MAE1SIP3YBR184W
RBK1NRG2
IMP2 LAT1
Reference
MAE1
YBR184W SNF11LEU4
TYE7
(A)
(B)
(C)
Reference
FBP1
IMP2
SFA1MAE1
UGA2ADR1
MAL33 PCK1
SNF11CAT8
PFK27
YBR184WUGA1
ACE2
XKS1CYB2
GLO1
GAD1GLK1
SNF11CAT8
ADR1DLD2UGA2
LEU4
FBP1
IMP2
SFA1MAE1CYB2PFK26
Reference
Reference
Reference
Reference
Reference
0
10
20
30
40
50
60
70
0 10 20 30 40 50
qp
GlucoseFructoseGalactose
0
1
2
3
4
5
6
7
8
9
10
0 5 10 15 20 25 30 35
GlucoseFructoseGalactose
0
1
2
3
4
5
6
7
8
9
10
0 5 10 15 20 25 30 35qp
GlucoseFructoseGalactose
qHexose (mmol g-1 h-1)
q Eth
anol
(mm
olg-1
h-1)
qHexose (mmol g-1 h-1)
q O2
(mm
olg-1
h-1)
qEthanol (mmol g-1 h-1)
q O2(m
mol
g-1h-1
)
HXT17
HXT10ADR1
HXT14
HXT12
LEU4
GAL2
RBK1
FBP26
MTH1
HXT3
MAE1YBR184W
Reference
Reference
MAE1SIP3YBR184W
RBK1NRG2
IMP2 LAT1
Reference
MAE1
YBR184W SNF11LEU4
TYE7
(A)
(B)
(C)
Reference
FBP1
IMP2
SFA1MAE1
UGA2ADR1
MAL33 PCK1
SNF11CAT8
PFK27
YBR184WUGA1
ACE2
XKS1CYB2
GLO1
GAD1GLK1
SNF11CAT8
ADR1DLD2UGA2
LEU4
FBP1
IMP2
SFA1MAE1CYB2PFK26
Reference
Reference
Reference
Reference
Reference

Results and discussion
117
Pair-wise comparison of specific rates on two different carbon sources allows identify the
strains, which possess similar phenotypic profile on both the carbon sources. When specific
growth rate, µmax, was plotted on glucose against fructose (Figure 5.5-7A), few strains, hxt1 ,
mth1 , gad1 , hxt12 showed similar growth rates on both the sugars. Two strains, xks1 and
snf11 had higher growth rates on glucose than on fructose. Mutant strains, nrg1 , pfk26
hxt17 , imp2’ and gad1 showed similar growth profiles on both glucose and galactose sug-
ars (Figure 5.5-7B). Two strains, xks1 and snf11 had high growth rates on glucose and
mig2 strain had high growth rate on galactose. Mutant strains, snf3 , gad1 , fbp1 , mig2 ,
and the reference strain had similar growth profiles on both galactose and fructose sugars
(Figure 5.5-7C). Except hxt4 strain, none of the mutant strains had higher growth rates on
galactose than on fructose.
When specific hexose uptake rate, qHexose, of glucose was plotted against qHexose of fructose
(Figure 5.5-7D) two strains, hxt1 and hxt4 showed identical values on both the sugars.
hxt17 strain had highest uptake rate on fructose and very high uptake rate on glucose. hxt14
strain, which had about an average value of qHexose of glucose had very high qHexose of fruc-
tose. mig2 strain had an identical values of qHexose, of glucose and galactose (Figure 5.5-7E).
xks1 strain had highest uptake rate on galactose (Figure 5.5-7E) and similar uptake rates on
glucose and fructose (Figure 5.5-7F) .
When specific ethanol production rate, qEthanol, on glucose was plotted against qEthanol on fruc-
tose (Figure 5.5-7G), two strains, mig2 and hxt14 showed identical values on both the sug-
ars and two strains, hxt1 and hxt4 had about the similar profile. hxt17 strain, which had
very high qEthanol on glucose had the highest qEthanol on fructose. xks1 and snf11 , which had
very high qEthanol on glucose had low qEthanol on fructose. None of the strains had identical
qEthanol profiles on glucose and galactose (Figure 5.5-7H). mig2 strain had highest qEthanol on
galactose and about similar profile on glucose. nrg1 strain had lowest qEthanol on both the
sugars. Mutant strains, mig2 , xks1 , snf11 , mae2 and fbp26 showed identical qEthanol
profiles on galactose and fructose sugars (Figure 5.5-7I).

Results and discussion
118
Figure 5.5-7 Pair-wise comparison of specific rates (A) Specific growth rate, µmax, on glu-cose vs. µmax on fructose (B) µmax on glucose vs. µmax on galactose (C) µmax on galactose vs.µmax on fructose (D) specific hexose uptake rate, qHexose, of glucose vs. qHexose of fructose (E)qHexose of glucose vs. qHexose of galactose (F) qHexose of galactose vs. qHexose of fructose (G) spe-cific ethanol production rate, qEthanol, on glucose vs. qEthanol on fructose (H) qEthanol on glucosevs. qEthanol on galactose (I) qEthanol on galactose vs. qEthanol on fructose. Solid line represents theidentical values on both the axes.
0.0
0.1
0.2
0.3
0.4
0.5
0.0 0.1 0.2 0.3 0.4 0.50.0
0.1
0.2
0.3
0.4
0.5
0.0 0.1 0.2 0.3 0.4 0.5µ glucose (h-1)
0.0
0.1
0.2
0.3
0.4
0.5
0.0 0.1 0.2 0.3 0.4 0.5
0
10
20
30
40
50
0 5 10 15 20 25 300
5
10
15
20
25
0 5 10 15 20 25 30qs glucose (mmol/g/h)
qs g
alac
tose
(mm
ol/g
/h)
0
10
20
30
40
50
0 5 10 15 20 25
010203040506070
0 10 20 30 40 500
5
10
15
20
0 10 20 30 40 500
10203040506070
0 5 10 15 20
µmax, glucose (h-1)
µ max
,fru
ctos
e (h
-1)
µmax, glucose (h-1)
µ max
,gal
acto
se(h
-1)
µ max
,fru
ctos
e (h
-1)
µmax, galactose (h-1)
qglucose (mmol g-1 h-1)
q fru
ctos
e(m
mol
g-1
h-1)
qglucose (mmol g-1 h-1)
q gal
acto
se(m
mol
g-1
h-1)
q fru
ctos
e(m
mol
g-1
h-1)
qgalactose (mmol g-1 h-1)
qEth, glucose (mmol g-1 h-1) qEthl, glucose (mmol g-1 h-1) qEthl, galactose (mmol g-1 h-1)
q Eth,
,gal
acto
se(m
mol
g-1
h-1)
q Eth
,,fr
ucto
se (m
mol
g-1
h-1)
q Eth
,,fr
ucto
se (m
mol
g-1
h-1)
MIG2
MIG2
NRG1
XKS1
SNF11
HXT17
HXT14
ReferenceHXT1
ReferenceHXT4SNF11
MIG2XKS1
HXT1
HXT17HXT14
NRG1
XKS1
SNF11Reference
HXT4
HXT1
NRG1
HXT17
MIG2HXT14
HXT17HXT14
Reference
MIG2
NRG1
SNF11XKS1
HXT4
HXT1
XKS1
MIG2
NRG1HXT14
HXT4
HXT17
SNF11
HXT1
Reference XKS1SNF11Reference
MIG2
HXT17HXT14
HXT4
NRG1HXT1
MIG2
XKS1SNF11
HXT17
ReferenceNRG1
HXT1
HXT14HXT4SNF11
HXT4
HXT17
XKS1MIG2
NRG1 HXT1
HXT14
Reference
HXT17
HXT4
SNF11XKS1
NRG1
ReferenceHXT1
HXT14
0.0
0.1
0.2
0.3
0.4
0.5
0.0 0.1 0.2 0.3 0.4 0.50.0
0.1
0.2
0.3
0.4
0.5
0.0 0.1 0.2 0.3 0.4 0.5µ glucose (h-1)
0.0
0.1
0.2
0.3
0.4
0.5
0.0 0.1 0.2 0.3 0.4 0.5
0
10
20
30
40
50
0 5 10 15 20 25 300
5
10
15
20
25
0 5 10 15 20 25 30qs glucose (mmol/g/h)
qs g
alac
tose
(mm
ol/g
/h)
0
10
20
30
40
50
0 5 10 15 20 25
010203040506070
0 10 20 30 40 500
5
10
15
20
0 10 20 30 40 500
10203040506070
0 5 10 15 20
µmax, glucose (h-1)
µ max
,fru
ctos
e (h
-1)
µmax, glucose (h-1)
µ max
,gal
acto
se(h
-1)
µ max
,fru
ctos
e (h
-1)
µmax, galactose (h-1)
qglucose (mmol g-1 h-1)
q fru
ctos
e(m
mol
g-1
h-1)
qglucose (mmol g-1 h-1)
q gal
acto
se(m
mol
g-1
h-1)
q fru
ctos
e(m
mol
g-1
h-1)
qgalactose (mmol g-1 h-1)
qEth, glucose (mmol g-1 h-1) qEthl, glucose (mmol g-1 h-1) qEthl, galactose (mmol g-1 h-1)
q Eth,
,gal
acto
se(m
mol
g-1
h-1)
q Eth
,,fr
ucto
se (m
mol
g-1
h-1)
q Eth
,,fr
ucto
se (m
mol
g-1
h-1)
MIG2
MIG2
NRG1
XKS1
SNF11
HXT17
HXT14
ReferenceHXT1
ReferenceHXT4SNF11
MIG2XKS1
HXT1
HXT17HXT14
NRG1
XKS1
SNF11Reference
HXT4
HXT1
NRG1
HXT17
MIG2HXT14
HXT17HXT14
Reference
MIG2
NRG1
SNF11XKS1
HXT4
HXT1
XKS1
MIG2
NRG1HXT14
HXT4
HXT17
SNF11
HXT1
Reference XKS1SNF11Reference
MIG2
HXT17HXT14
HXT4
NRG1HXT1
MIG2
XKS1SNF11
HXT17
ReferenceNRG1
HXT1
HXT14HXT4SNF11
HXT4
HXT17
XKS1MIG2
NRG1 HXT1
HXT14
Reference
HXT17
HXT4
SNF11XKS1
NRG1
ReferenceHXT1
HXT14
A B C
D E F
G H I
0.0
0.1
0.2
0.3
0.4
0.5
0.0 0.1 0.2 0.3 0.4 0.50.0
0.1
0.2
0.3
0.4
0.5
0.0 0.1 0.2 0.3 0.4 0.5µ glucose (h-1)
0.0
0.1
0.2
0.3
0.4
0.5
0.0 0.1 0.2 0.3 0.4 0.5
0
10
20
30
40
50
0 5 10 15 20 25 300
5
10
15
20
25
0 5 10 15 20 25 30qs glucose (mmol/g/h)
qs g
alac
tose
(mm
ol/g
/h)
0
10
20
30
40
50
0 5 10 15 20 25
010203040506070
0 10 20 30 40 500
5
10
15
20
0 10 20 30 40 500
10203040506070
0 5 10 15 20
µmax, glucose (h-1)
µ max
,fru
ctos
e (h
-1)
µmax, glucose (h-1)
µ max
,gal
acto
se(h
-1)
µ max
,fru
ctos
e (h
-1)
µmax, galactose (h-1)
qglucose (mmol g-1 h-1)
q fru
ctos
e(m
mol
g-1
h-1)
qglucose (mmol g-1 h-1)
q gal
acto
se(m
mol
g-1
h-1)
q fru
ctos
e(m
mol
g-1
h-1)
qgalactose (mmol g-1 h-1)
qEth, glucose (mmol g-1 h-1) qEthl, glucose (mmol g-1 h-1) qEthl, galactose (mmol g-1 h-1)
q Eth,
,gal
acto
se(m
mol
g-1
h-1)
q Eth
,,fr
ucto
se (m
mol
g-1
h-1)
q Eth
,,fr
ucto
se (m
mol
g-1
h-1)
MIG2
MIG2
NRG1
XKS1
SNF11
HXT17
HXT14
ReferenceHXT1
ReferenceHXT4SNF11
MIG2XKS1
HXT1
HXT17HXT14
NRG1
XKS1
SNF11Reference
HXT4
HXT1
NRG1
HXT17
MIG2HXT14
HXT17HXT14
Reference
MIG2
NRG1
SNF11XKS1
HXT4
HXT1
XKS1
MIG2
NRG1HXT14
HXT4
HXT17
SNF11
HXT1
Reference XKS1SNF11Reference
MIG2
HXT17HXT14
HXT4
NRG1HXT1
MIG2
XKS1SNF11
HXT17
ReferenceNRG1
HXT1
HXT14HXT4SNF11
HXT4
HXT17
XKS1MIG2
NRG1 HXT1
HXT14
Reference
HXT17
HXT4
SNF11XKS1
NRG1
ReferenceHXT1
HXT14
0.0
0.1
0.2
0.3
0.4
0.5
0.0 0.1 0.2 0.3 0.4 0.50.0
0.1
0.2
0.3
0.4
0.5
0.0 0.1 0.2 0.3 0.4 0.5µ glucose (h-1)
0.0
0.1
0.2
0.3
0.4
0.5
0.0 0.1 0.2 0.3 0.4 0.5
0
10
20
30
40
50
0 5 10 15 20 25 300
5
10
15
20
25
0 5 10 15 20 25 30qs glucose (mmol/g/h)
qs g
alac
tose
(mm
ol/g
/h)
0
10
20
30
40
50
0 5 10 15 20 25
010203040506070
0 10 20 30 40 500
5
10
15
20
0 10 20 30 40 500
10203040506070
0 5 10 15 20
µmax, glucose (h-1)
µ max
,fru
ctos
e (h
-1)
µmax, glucose (h-1)
µ max
,gal
acto
se(h
-1)
µ max
,fru
ctos
e (h
-1)
µmax, galactose (h-1)
qglucose (mmol g-1 h-1)
q fru
ctos
e(m
mol
g-1
h-1)
qglucose (mmol g-1 h-1)
q gal
acto
se(m
mol
g-1
h-1)
q fru
ctos
e(m
mol
g-1
h-1)
qgalactose (mmol g-1 h-1)
qEth, glucose (mmol g-1 h-1) qEthl, glucose (mmol g-1 h-1) qEthl, galactose (mmol g-1 h-1)
q Eth,
,gal
acto
se(m
mol
g-1
h-1)
q Eth
,,fr
ucto
se (m
mol
g-1
h-1)
q Eth
,,fr
ucto
se (m
mol
g-1
h-1)
MIG2
MIG2
NRG1
XKS1
SNF11
HXT17
HXT14
ReferenceHXT1
ReferenceHXT4SNF11
MIG2XKS1
HXT1
HXT17HXT14
NRG1
XKS1
SNF11Reference
HXT4
HXT1
NRG1
HXT17
MIG2HXT14
HXT17HXT14
Reference
MIG2
NRG1
SNF11XKS1
HXT4
HXT1
XKS1
MIG2
NRG1HXT14
HXT4
HXT17
SNF11
HXT1
Reference XKS1SNF11Reference
MIG2
HXT17HXT14
HXT4
NRG1HXT1
MIG2
XKS1SNF11
HXT17
ReferenceNRG1
HXT1
HXT14HXT4SNF11
HXT4
HXT17
XKS1MIG2
NRG1 HXT1
HXT14
Reference
HXT17
HXT4
SNF11XKS1
NRG1
ReferenceHXT1
HXT14
A B C
D E F
G H I

Results and discussion
119
55..55..33..22 CCoommppaarriissoonn ooff yyiieellddss
Comparison of yields on different carbon sources indicates that the strains grown on galac-
tose had very high biomass yields on substrate and very low biomass yields on oxygen, repre-
sents that the deletion strains grown on galactose are highly respiratory with high biomass
yields when compared to glucose and fructose (Figure 5.5-8A). Strains grown on glucose had
high ethanol yields representing that strains are more fermenting than on galactose and fruc-
tose grown strains (Figure 5.5-8B). Strains grown on fructose had higher biomass yields on
oxygen indicating that some of the strains grown on fructose are almost respiratory deficient
when compared to glucose and galactose grown strains (Figure 5.5-8C).
Figure 5.5-8 Stoichiometric profiling of yeast deletion mutants on glucose, galactose andfructose. Correlation between specific growth rate, µmax, and (A) biomass yield, YX/S, (B)ethanol yield, YE/S, as well as with (C) biomass yield on oxygen, YX/O (Table 5.5-2) Arrowsindicate the reference strain BY4742 Mat his3 1 leu2 0 lys2 0 ura3 0.
0.00
0.10
0.20
0.30
0.40GlucoseFructoseGalactose
0.00
0.10
0.20
0.30
0.40
0.50
0.60
0.0 0.1 0.2 0.3 0.4 0.5
GlucoseFructoseGalactose
0
5
10
15
20
25
30
35
0.0 0.1 0.2 0.3 0.4 0.5
GlucoseFructoseGalactose
µmax (h-1)
Y x/s
(g g
-1)
Y E/s
(g g
-1)
Y x/o
(g g
-1)
Reference
LAT1
IMP2
NRG2FBP26
Reference
Reference
(A)
(B)
(C)
HXT14HXT3
NRG1
HXT1 NRG2
FBP1LEU4
ADR1HXT12
PCK1
PFK27PCK1MAL33
DLD2
ADR1
CAT8
SNF11FBP1
NRG1
UGA2
Reference
Reference
Reference
Reference
Reference
0.00
0.10
0.20
0.30
0.40GlucoseFructoseGalactose
0.00
0.10
0.20
0.30
0.40
0.50
0.60
0.0 0.1 0.2 0.3 0.4 0.5
GlucoseFructoseGalactose
0
5
10
15
20
25
30
35
0.0 0.1 0.2 0.3 0.4 0.5
GlucoseFructoseGalactose
µmax (h-1)
Y x/s
(g g
-1)
Y E/s
(g g
-1)
Y x/o
(g g
-1)
Reference
LAT1
IMP2
NRG2FBP26
Reference
Reference
(A)
(B)
(C)
HXT14HXT3
NRG1
HXT1 NRG2
FBP1LEU4
ADR1HXT12
PCK1
PFK27PCK1MAL33
DLD2
ADR1
CAT8
SNF11FBP1
NRG1
UGA2
Reference
Reference
Reference
Reference
Reference
Results and discussion
120
55..55..44 PPhhyyssiioollooggiiccaallllyy iinntteerreessttiinngg ssttrraaiinnssBased on this comparative stoichiometric analysis on different carbon sources, yeast single
knockout strains that revealed interesting phenotypes were selected and further discusses as
follows.
55..55..44..11 mmaaee11
This strain lacks MAE1 gene, which encodes malic enzyme activity. It has been previously
shown that on glucose substrate deletion of MAE1 has no significant phenotype in S. cere-
visiae (Boles et al., 1998) and in C. glutamicum (Petersen et al., 2000). Previous studies also
reported that on fructose, flux through PPP is significantly lower (Kiefer et al., 2004) and the
flux through TCA cycle and malic enzyme activity are higher (Dominguez, 1998). However,
mae1 strain showed a clear phenotype of very high PPP flux when grown on galactose in
order to maintain the NADPH levels (Velagapudi et al., 2007). As described in this chapter,
when grown on fructose as sole carbon source, mae1 strain showed clear phenotype. mae1
strain had highest oxygen uptake rate (3.53 mmol/g/h) with very low ethanol yield (0.1 g/g).
The biological interpretation of this phenotype on fructose could be due to lack of malic en-
zyme and reduced PPP flux on fructose; mae1 strain would have only 2 routes to maintain
NADPH levels, one way via TCA cycle by activating NADPH specific isocitrate dehydro-
genase activity forming alpha-keto glutarate from citrate, which is repressed during growth
on glucose (Loftus et al., 1994; Haselbeck et al., 1993) and the other one via NADPH specific
aldehyde dehydrogenase forming acetate from acetaldehyde (Kurita et al., 1999), which in
turn produces acetyl-CoA, which could be transported back to mitochondrion and entering
the TCA cycle. The missing carbon balance for this strain is 66.3% suggesting the formation
of other by-products for e.g. glycerol and high CO2 production.
55..55..44..22 hhxxtt11 aanndd hhxxtt33
Low affinity transporters are highly expressed at very high levels of glucose or fructose and
repressed at low sugar levels. There have been many studies that aim to characterise hexose
transporters in yeast that usually used glucose as the substrate. On glucose, hxt1 and hxt3
strains showed similar phenotypic profiles (Please refer to chapter 5.4 for additional details)
as these are single knockouts; the function is complemented by other Hxtp. On fructose,

Results and discussion
121
hxt1 and hxt3 strains showed different phenotypes. hxt1 strain grew with a growth rate of
0.3 h-1 and fructose uptake rate (qfru = 22.1 mmol/g/h) and ethanol production rate (qEth =
29.8 mmol/g/h) with high ethanol yield (YP/S = 0.344 g/g). Whereas hxt3 strain had similar
growth rate (µmax = 0.32 h-1) and about similar fructose consumption rate (qfru = 29.1
mmol/g/h) but with low ethanol production rate (qEth = 14.1 mmol/g/h). In addition, hxt3
strain had very low ethanol yield (YP/S = 0.12 g/g) about three times less than hxt1 strain.
The possible explanation for this phenotype could be as follows. In a recent study by Luyten
et al. (2002), it has been shown that Hxt3p has the highest capacity to support fermentation
on fructose. That means, since HXT3 is expressed in hxt1 strain, it consumed fructose at
higher rates and produced very high ethanol when compared to hxt3 strain. It has also been
shown that HXT3 gene is responsible for the capacity for consuming fructose among certain
yeasts and a mutation on allele of HXT3 gene was responsible for improving the performance
of wine yeasts by increased utilisation of fructose during fermentation that would be very
desirable in cases of stuck fermentation (Guillaume et al, 2007). Analysis of hexose carrier
expression and characterisation of transport kinetics during wine alcohol fermentation re-
vealed that Hxt1p expression was predominant during growth phase and Hxt3p during fer-
mentation phase (Perez et al., 2005). hxt3 strain is also sensitive to external ethanol pertur-
bations and in a previous study it has been shown that hxt3 strain displayed growth defect
when grown on 10% ethanol (Karpel et al., 2008).
55..55..44..33 hhxxtt44 aanndd hhxxtt1144
On fructose, hxt4 strain was growing slowly with µmax = 0.23 h-1 and produced at a rela-
tively low biomass yield (YX/S = 0.05 g/g) but had a very high ethanol yield (YP/S = 0.411
g/g) when compared to other strains. On glucose hxt4 strain had µmax = 0.32 h-1; YX/S =
0.076 g/g and higher ethanol yield than other strains (YP/S = 0.451 g/g) (please refer to section
5.4 for additional details).
On glucose, hxt14 strain had µmax = 0.33 h-1, higher biomass yield YX/S = 0.121 g/g and
higher ethanol yield, YP/S = 0.426 g/g. On galactose, it didn’t show any specific phenotype.
On fructose, hxt14 strain had µmax = 0.377 h-1 and had very high fructose uptake rate, qfru =
43.8 mmol/g/h but had very low biomass yield, YX/S = 0.048 g/g and ethanol yield, YP/S =
0.141 g/g, suggesting that a lot of carbon flux might be channelled through TCA cycle and

Results and discussion
122
released as CO2 or might be channelled to by-product formation e.g. acetate, glycerol or lac-
tate etc.
These observations allowed to hypothesise that on fructose, Hxt4p might be interacting or
interfering with the Hxt3p in hxt1 strain (please refer to section 5.5.4.2); since Hxt1p and
Hxt3p have complementary functions on glucose, Hxt4p and Hxt14p might be interacting or
interfering either with Hxt1p or Hxt3p and subsequently affecting the fermentation rates.
55..55..44..44 hhxxtt88
On glucose and fructose, hxt8 strain was growing with similar growth rates (µmax = 0.334 h-
1 and 0.314 h-1, respectively), had similar biomass yields (YX/S = 0.07 g/g and 0.08 g/g, re-
spectively) and had similar but very low ethanol yields (YP/S = 0.171 g/g and 0.175 g/g, re-
spectively), whereas on galactose it had 0.342 g/g ethanol yield, which is similar to the refer-
ence, suggesting that on galactose deletion of HXT8 had no role on fermentation but had se-
vere effect on glucose and fructose fermentation.
Thus we can hypothesise that Hxt8p with limited known function so far might be involved in
glucose and fructose fermentations but not in galactose fermentation. Another interesting
phenotype of this strain is higher PPP and TCA fluxes on glucose than on galactose.
55..55..44..55 hhxxtt1177
On glucose and galactose, hxt17 strain was growing with similar growth rates (µmax = 0.272
h-1 and 0.262 h-1, respectively) and on galactose it had about an average values of uptake rate
and ethanol production rate. The strain had very high uptake rates and ethanol production
rates on glucose and fructose sugars (qglu = 24.85 mmol/g/h and qfru = 47.95 mmol/g/h, re-
spectively; qEth = 38.34 mmol/g/h and qEth = 59.75 mmol/g/h, respectively).
This observation suggests a possible role of this putative hexose transporter gene to be in-
volved in glucose and fructose fermentation processes and also controlling the uptake rates.
55..55..44..66 xxkkss11
On fructose and galactose, xks1 strain was growing with similar growth rates (µmax = 0.336
h-1 and 0.297 h-1, respectively), had similar uptake rates (qfru = 18.28 mmol/g/h and qgal =
19.62 mmol/g/h, respectively) and similar ethanol production rates (qEth = 16.38 mmol/g/h

Results and discussion
123
and qEth = 17.3 mmol/g/h, respectively), whereas on glucose, it showed different profile, the
strain was growing with a very high growth rate and also had higher rates than on galactose
and fructose. Overall, xks1 strain had lower uptake rates and ethanol production rates on
fructose followed by galactose and then glucose.
This observation suggests that xks1 strain (which had no xylulokinase activity, converting a
ketopentose, xylulose to xylulose phosphate), showed a phenotype when grown on ketohex-
ose, fructose rather than on aldohexoses, glucose and galactose.
55..55..44..77 iimmpp22’’
Imp2’p is a sugar utilisation regulatory protein and a transcriptional activator involved in
maintenance of ion homeostasis (Masson et al., 1998) and protects against DNA damage
caused by bleomycin and other oxidants (Masson et al., 1996). imp2’ strain had no obvious
phenotype when grown on glucose but on galactose it had the lowest PPP,gal and showed
highest oxygen uptake rate that was about ten times higher than on glucose (Velagapudi et
al., 2007). That means most of the carbon flux was channelled to TCA cycle rather than PPP
on galactose substrate. This is in agreement with previous findings, where Imp2’p was shown
to have a positive effect on glucose derepression of Leloir pathway (GAL genes), raffinose
and maltose utilisation pathways genes (Alberti et al., 2003) and in addition, imp2 strain is
unable to grow on these sugars in the presence of inhibitors of mitochondrial protein synthe-
sis or ethidium bromide (Donninni et al., 1992). That means higher mitochondrial activity is
required in utilisation of galactose. On fructose, imp2’ strain had highest ethanol yield when
compared to other strains and even higher when grown on glucose. This is industrially bene-
ficial feature in wine industry with respect to higher fructose fermentation capacity.
55..55..55 CCoonncclluussiioonnssIn this chapter, a set of strains were selected and quantitative physiological profiling was
done when the strains were grown on fructose as sole carbon source as described in previous
chapters. The obtained data on fructose sugar was compared with glucose and galactose data.
Comparative physiological profiling on three carbon sources clearly indicates that strains
grown on galactose were growing slowly when compared to glucose and fructose. Strains
grown on glucose had higher fermentation activity followed by fructose grown strains,
whereas strains grown on galactose had higher respiratory capacity. On fructose, mae1

Results and discussion
124
strain had highest oxygen uptake rate with very low ethanol yield, which could be due to re-
duced PPP flux. mae1 strain would have only 2 routes to maintain NADPH levels, one way
via TCA cycle by activating NADPH specific isocitrate dehydrogenase activity other one via
NADPH specific aldehyde dehydrogenase. The obtained results suggested a positive effect of
Hxt3p on fructose fermentation and Hxt8p on both glucose and fructose fermentations but not
on galactose. Hxt4p on fructose and Hxt4p and Hxt14p on glucose might have negative ef-
fects on fermentation. Based on this analysis, physiologically and industrially beneficial
strains could be identified.

Results and discussion
125
55..66 FFUUNNCCTTIIOONNAALL GGEENNOOMMIICCSS OOFF SS.. CCEERREEVVIISSIIAAEE BBYY UUTTIILLIISSIINNGGPPHHEENNOOTTYYPPIICC AANNDD MMEETTAABBOOLLIICC FFLLUUXX PPRROOFFIILLIINNGG DDAATTAA BBYYUUSSIINNGG BBIIOOIINNFFOORRMMAATTIICCSS TTOOOOLLSS
Velagapudi, V.R., Peddinti, G., Tang, J., Heinzle, E., 2009. Functional genomics of S. cerevisiae by utilising phenotypic and metabolic flux profiling data by using bioinformatics tools (in preparation)
55..66..11 BBaacckkggrroouunnddS. cerevisiae is an excellent eukaryotic model system and its genome was completely se-
quenced more than a decade ago. Even for this well studied microorganism, a major fraction
of gene functions are uncharacterized. According to Saccharomyces Genome Database (as of
May 2009) (www.yeastgenome.org), there are only 72.82 % of protein coding genes with
identified functions, whereas 14.91 % of genes are uncharacterized and the function of the
12.27 % of genes are still dubious. A powerful strategy to unravel the function of unknown
genes is by studying the phenotypic effects of deletion mutants, with missing gene. Func-
tional genomics represent a systematic approach to elucidating the function of the novel
genes revealed by complete genome sequence.
Since the quantitative stoichiometric data and metabolic flux data is available on different
carbon sources for a set of mutants that are known to be involved in central carbon metabo-
lism, it is of great interest to check whether one can predict the function of uncharacterized
genes based on this data. Hence, the first part of this chapter deals with an overview of all the
mutants studied on different carbon sources and at the end functional predictions are made
using bioinformatics tools.
55..66..22 SSttaattiissttiiccaall aannaallyyssiiss ooff tthhee ddaattaaIn this chapter, all the examined mutants were combined and analysed statistically applying
hierarchical clustering algorithm using stoichiometric data i.e., YX/S, YE/S and µmax, and meta-
bolic flux data on different carbon sources using Euclidian distance as a distance metric to
identify homogenous clusters of cases based on the measured data, which means mutants
within each cluster are more closely related to one another than mutants assigned to other
clusters. The relative Euclidian distances (d) were calculated between mutant pairs and also
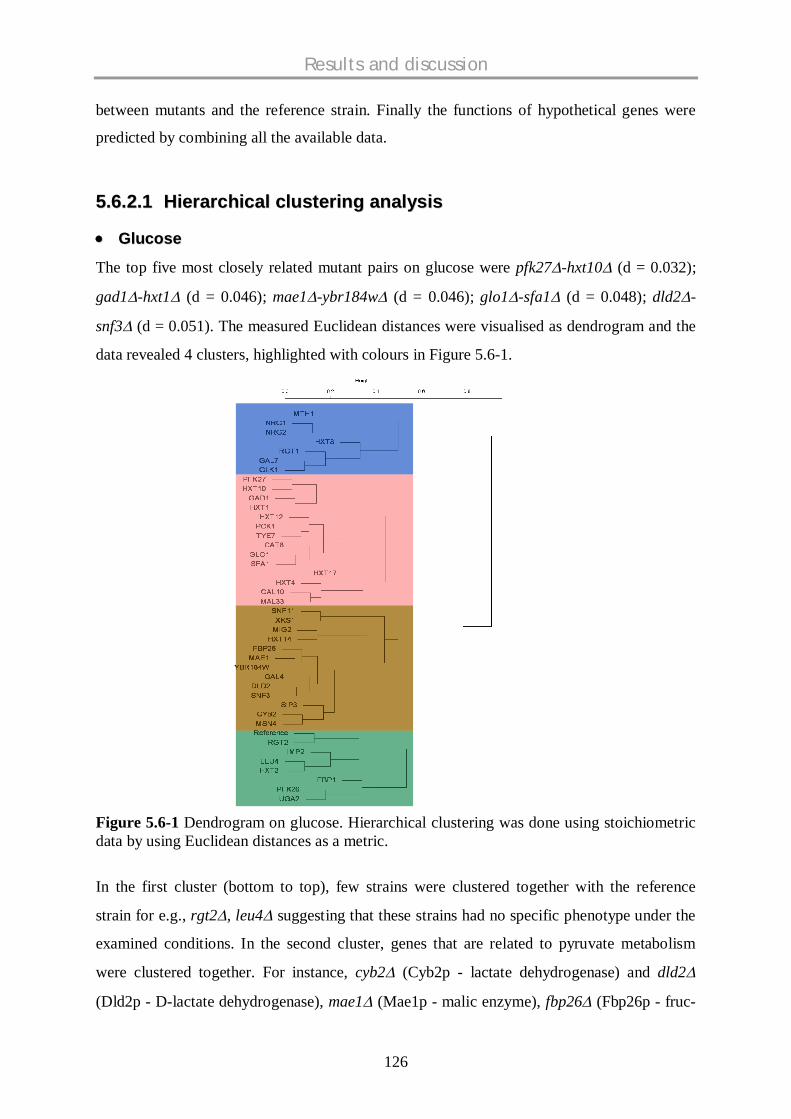
Results and discussion
126
between mutants and the reference strain. Finally the functions of hypothetical genes were
predicted by combining all the available data.
55..66..22..11 HHiieerraarrcchhiiccaall cclluusstteerriinngg aannaallyyssiiss
GGlluuccoossee
The top five most closely related mutant pairs on glucose were pfk27 -hxt10 (d = 0.032);
gad1 -hxt1 (d = 0.046); mae1 -ybr184w (d = 0.046); glo1 -sfa1 (d = 0.048); dld2 -
snf3 (d = 0.051). The measured Euclidean distances were visualised as dendrogram and the
data revealed 4 clusters, highlighted with colours in Figure 5.6-1.
Figure 5.6-1 Dendrogram on glucose. Hierarchical clustering was done using stoichiometricdata by using Euclidean distances as a metric.
In the first cluster (bottom to top), few strains were clustered together with the reference
strain for e.g., rgt2 , leu4 suggesting that these strains had no specific phenotype under the
examined conditions. In the second cluster, genes that are related to pyruvate metabolism
were clustered together. For instance, cyb2 (Cyb2p - lactate dehydrogenase) and dld2
(Dld2p - D-lactate dehydrogenase), mae1 (Mae1p - malic enzyme), fbp26 (Fbp26p - fruc-
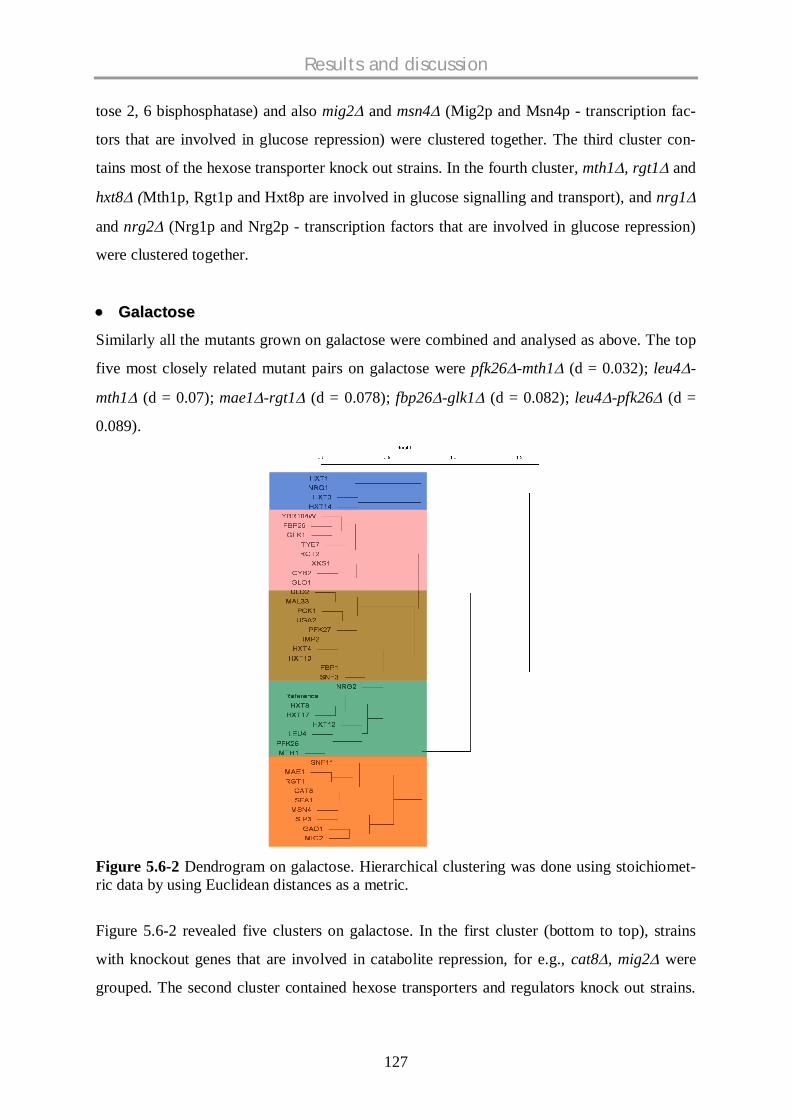
Results and discussion
127
tose 2, 6 bisphosphatase) and also mig2 and msn4 (Mig2p and Msn4p - transcription fac-
tors that are involved in glucose repression) were clustered together. The third cluster con-
tains most of the hexose transporter knock out strains. In the fourth cluster, mth1 , rgt1 and
hxt8 (Mth1p, Rgt1p and Hxt8p are involved in glucose signalling and transport), and nrg1
and nrg2 (Nrg1p and Nrg2p - transcription factors that are involved in glucose repression)
were clustered together.
GGaallaaccttoossee
Similarly all the mutants grown on galactose were combined and analysed as above. The top
five most closely related mutant pairs on galactose were pfk26 -mth1 (d = 0.032); leu4 -
mth1 (d = 0.07); mae1 -rgt1 (d = 0.078); fbp26 -glk1 (d = 0.082); leu4 -pfk26 (d =
0.089).
Figure 5.6-2 Dendrogram on galactose. Hierarchical clustering was done using stoichiomet-ric data by using Euclidean distances as a metric.
Figure 5.6-2 revealed five clusters on galactose. In the first cluster (bottom to top), strains
with knockout genes that are involved in catabolite repression, for e.g., cat8 , mig2 were
grouped. The second cluster contained hexose transporters and regulators knock out strains.

Results and discussion
128
In the third cluster glucose and pyruvate metabolism and hexose transporters knock out
strains were clustered. The fourth cluster comprises glucose, pyruvate, and glyoxalate me-
tabolism knock out strains. The fifth cluster includes hexose transport knock out strains and
nrg1 knock out strain (Nrg1p is a transcription repressor involved in glucose metabolism).
FFrruuccttoossee
The top five most closely related mutant pairs were cat8 -sfa1 (d = 0.054); gal4 -
ydr248c (d = 0.055); sip3 -rgt1 (d = 0.055); nrg1 -nrg2 (d = 0.062); pfk2 -hxk2 (d =
0.072). The top three most closely related mutants with the reference strain were hxt1 (d =
0.204); snf3 (d = 0.288) and rgt2 (d = 0.313) and two mutants, mae1 (d = 1.02) and
ybr184w (d = 1.08) are distantly related to the reference strain with Euclidean distance, d
above 1, indicating that these strains showed a clear phenotype when grown on fructose. The
measured Euclidean distances were visualised as dendrogram and the data revealed 4 clus-
ters, highlighted with colours in Figure 5.6-3.
Figure 5.6-3 Dendrogram on fructose. Hierarchical clustering was done using stoichiometricdata by using Euclidean distances as a metric.

Results and discussion
129
In the first cluster (bottom to top), strains with silenced genes that are involved in hexose
transportation, hexose sensing and regulation were clustered together for e.g., hxt1 , hxt4 ,
hxt10 , hxt12 , hxt17 , snf3 , rgt2 and mth1 suggesting that these strains had similar
phenotype under the examined conditions. Interestingly the details of protein interactions and
complexes using MIPS MPact Protein Interactions and Complex DB (Güldener et al., 2006)
(www.mips.gsf.de/genre/proj/impact) revealed that Snf3p has direct interactions with Rgt2p
(Yang and Bisson, 1996); Hxt4p (Ko et al., 1993); Hxt1p (Lewis and Bisson, 1991) and
Mth1p (Irie et al., 1993). In the second cluster, snf2 and sip3 (Snf2p - which is a compo-
nent of SNF1 protein complex, which in turn has direct interaction with Sip3p (Gavin et al.,
2002; Lesage et al., 1994)) were clustered together. In addition, pfk2 (Pfk2p - phosphofruc-
tokinase activity) and hxk2 (Hxk2p - hexokinase activity) and imp2’ (Imp2’p - transcrip-
tional activator involved in carbohydrate metabolic process) were clustered together. In the
third cluster, genes that are related to pyruvate metabolism and glucose metabolic process, for
instance, mae1 (Mae1p - Malic enzyme) and fbp26 (Fbp26p - Fructose 2, 6 bisphos-
phatase) were clustered together with the ybr184w (YBR184W – hypothetical gene). In the
fourth cluster, glk1 and dld2 (Glk1p and Dld2p are components of actin associated protein
complex (Amberg et al., 1995)); nrg1 and nrg2 (Nrg1p and Nrg2p - transcriptional repres-
sors) were clustered together; and gal4 and gal80 (Gal4p and Gal80p had direct physical
interaction (Sil et al., 1999)) were clustered together. All these evidences provide a biological
significance of clustering analysis.
CCoommbbiinneedd aannaallyyssiiss -- GGlluuccoossee,, GGaallaaccttoossee aanndd FFrruuccttoossee
Another interesting analysis would be to combine all the strains on all the three carbon
sources i.e., glucose, galactose and fructose and check for the most closely related strains.
The top five most closely related mutant pairs were cat8 -sfa1 (d = 0.186); fbp26 -
ybr184w (d = 0.314); msn4 -sip3 (d = 0.319); glk1 -tye7 (d = 0.346); cat8 -gad1 (d =
0.395). Figure 5.6-4 revealed four main clusters. In the first cluster (bottom to top), mainly
hexose transporters and regulators in glucose signalling knock out strains were clustered.
Second cluster contained strains that had gene deletions in glucose metabolism. Third cluster
contained hypothetical gene, fbp26 , mae1 and hexose transporters knock out strains. The
last cluster contained strains that had gene deletions in glucose and pyruvate metabolism,
gluconeogenesis and transcriptional repressors etc.
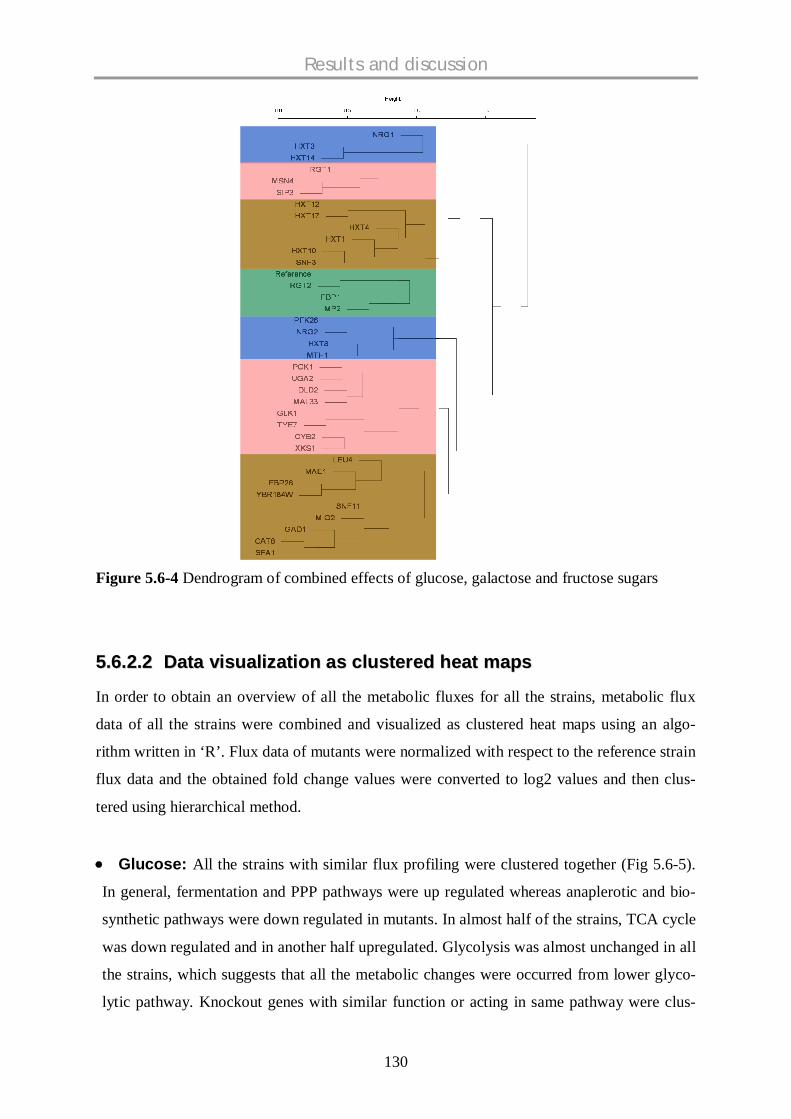
Results and discussion
130
Figure 5.6-4 Dendrogram of combined effects of glucose, galactose and fructose sugars
55..66..22..22 DDaattaa vviissuuaalliizzaattiioonn aass cclluusstteerreedd hheeaatt mmaappss
In order to obtain an overview of all the metabolic fluxes for all the strains, metabolic flux
data of all the strains were combined and visualized as clustered heat maps using an algo-
rithm written in ‘R’. Flux data of mutants were normalized with respect to the reference strain
flux data and the obtained fold change values were converted to log2 values and then clus-
tered using hierarchical method.
Glucose: All the strains with similar flux profiling were clustered together (Fig 5.6-5).
In general, fermentation and PPP pathways were up regulated whereas anaplerotic and bio-
synthetic pathways were down regulated in mutants. In almost half of the strains, TCA cycle
was down regulated and in another half upregulated. Glycolysis was almost unchanged in all
the strains, which suggests that all the metabolic changes were occurred from lower glyco-
lytic pathway. Knockout genes with similar function or acting in same pathway were clus-

Results and discussion
131
tered together based on the flux data. For instance, in the lower half of the heat map, deletion
strains involved in galactose utilisation pathway, gal4 and gal10 ; gluconeogenic gene de-
letions, fbp1 , fbp26 and mae1 ; hexose transporter knockouts, hxt4 , hxt14 ; lactate
metabolic process gene deletions, cyb2 and dld2 ; and Snf1p interacting protein Sip3p
knockouts, sip3 and snf11 were clustered together. In this cluster of strains, fermentation
and PP pathways were highly up regulated, respiration and anaplerosis were significantly
down regulated and glycolysis was unchanged (Fig 5.6-5). In the upper half of the heat map,
strains showed up regulation of both PP pathway and TCA cycle, down regulation of anaple-
rosis and most of the strains showed unchanged glycolysis and fermentation (Fig 5.6-5).
Figure 5.6-5 Heat map with clustering representing the log2 values of fold changes of fluxvalues with respect to the reference strain on glucose. (Ferm – Fermentative pathway; Anap –Anaplerotic pathway)
Glycolysis PP Pathway TCA cycle Ferm Anap
-4U
p re
gula
tion
Dow
n re
gula
tion
Con
stan
t0
-22
4
Glycolysis PP Pathway TCA cycle Ferm Anap
-4U
p re
gula
tion
Dow
n re
gula
tion
Con
stan
t0
-22
4-4
Up
regu
latio
nD
own
regu
latio
nC
onst
ant
0-2
24

Results and discussion
132
Galactose: An overview of metabolic flux profiling of all the strains grown on galactose
(Fig 5.6-6) revealed that the strains showed very high up regulation of respiration and down
regulation of fermentation, anaplerosis and PP pathways and glycolysis was mostly un-
changed (upper part of the heat map). However, there is a cluster of strains that showed sig-
nificant down regulation of TCA cycle, which was complemented by moderate up regulation
of fermentation (lower part of the heat map).
Figure 5.6-6 Heat map with clustering representing the log2 values of fold changes of fluxvalues with respect to the reference strain on galactose. (Ferm – Fermentative pathway; Anap– Anaplerotic pathway)
Glycolysis PP Pathway TCA cycle Ferm Anap
-4U
p re
gula
tion
Dow
n re
gula
tion
Con
stan
t0
-22
4
Glycolysis PP Pathway TCA cycle Ferm Anap
-4U
p re
gula
tion
Dow
n re
gula
tion
Con
stan
t0
-22
4-4
Up
regu
latio
nD
own
regu
latio
nC
onst
ant
0-2
24

Results and discussion
133
55..66..22..33 BBiioollooggiiccaall ssiiggnniiffiiccaannccee ooff mmuuttaanntt ppaaiirrss
Hierarchical clustering on all the strains when combined the data of all the three carbon
sources revealed most closely related clusters based on stoichiometric data (section 5.6.2.2)
and the following explanation gives a possible biological link between the two mutant strains.
cat8 -sfa1 pair: Cat8p encodes a zinc-finger cluster protein that is necessary for
derepression of number of genes during non-fermentative growth conditions (Hedges et al.,
1995). Genomic studies have shown that many of the genes encoding proteins involved in
gluconeogenesis, ethanol utilization and glycoxylate cycle are regulated by Cat8p (Haurie et
al., 2001; Tachibana et al., 2005). SFA1 is a bifunctional enzyme encoding both alcohol de-
hydrogenase and glutathione-dependent formaldehyde dehydrogenase activities (Grey et al.,
1996; Wehener et al., 1993). Clustering of these two strains was observed on all individual
sugars and also in combined analysis. Even the metabolic flux profiling of these two strains
on glucose (Fig 5.6-3) and galactose (Fig 5.6-4) revealed that these two strains had similar
flux profiles and thus clustered together. Since both Cat8p and Sfa1p are somewhere in-
volved in a common pathway, ethanol metabolism might be the reason for this clustering
and it would be interesting to study this further.
sip3 -msn4 pair: Clustering of this mutant pair was not only observed using com-
bined stoichiometric data of all the sugars (Fig 5.6-2) but also using flux data on galactose
(Fig 5.6-4). Msn4 is a transcriptional activator related to Msn2p and activated during sev-
eral stress conditions (Martinez-Pastor et al., 1996; Gorner et al., 1998) and it is a Multicopy
suppressor of SNF1 mutation (Estruch et al., 1993). Sip3p, a SNF1 Interacting Protein
(Yang et al., 1992), which has transcription activity, has a direct physical interaction with
Snf1p (Lesage et al., 1994).
glk1 -tye7 pair: Both combined stoichiometric data of all the sugars (Fig 5.6-2) and
flux data on glucose (Fig 5.6-3) and galactose (Fig 5.6-4) yielded the clustering of this mu-
tant pair. Glk1p, glucokinase, catalyses phosphorylation of glucose (Herrero et al., 1995) in
glycolysis pathway; Tye7p, TY-mediated expression, a serine-rich protein that contains a
basic-helix-loop-helix DNA binding motif (Lohning et al., 1994). It binds to E-boxes of gly-
colytic genes and contributes to their expression (Sato et al., 1999). This could be a possible
link between these two mutants.

Results and discussion
134
55..66..33 FFuunnccttiioonnaall pprreeddiiccttiioonn ooff hhyyppootthheettiiccaall ggeenneessSince the quantitative stoichiometric data is available for all the selected deletion mutant
strains on different carbon sources, it is of special interest to predict the role of unknown
genes based on the phenotype and to see whether this study can already provide first indica-
tions for the hitherto unknown function of the gene product. It is obvious that studies of this
type cannot always directly give conclusive functional information but allow to direct future
research. Interesting phenotypes will, together with other established methods (Oliver et al.,
1998) provide an important basis to the discovery of gene function in yeast. Among the se-
lected mutant strains, one strain had a hypothetical gene deletion (ybr184w ) and the other
with pseudogene deletion (yil170w ).
55..66..33..11 EEuucclliiddeeaann ddiissttaannccee aapppprrooaacchh
One possibility is to compare these strains with all other strains and further investigate the
most closely related ones by utilising the stoichiometric data on three different sugars, µmax,
YX/S and YE/S (tables 5.1-3 and 5.1-4) and metabolic flux profiling data on glucose and galac-
tose by calculating a relative Euclidian distance, d (detailed description is given in Materials
and Methods section).
YBR184W (SGD ID: S000000388): YBR184W alias YBR1306, located on chromo-
some II (Feldmann et al., 1994), is not an essential gene. The gene product of YBR184W, a
putative protein of unknown function, has not been studied extensively (Kellis et al., 2003).
However, the gene expression analysis revealed that this gene is induced during sporulation.
Sequence analysis shows that it is similar to the gene YSW1, which encodes a spore-specific
protein (Chu et al., 1998).
On glucose, the top five most closely related strains to ybr184w and their distances are—
mae1 -0.046; fbp26 -0.064; dld2 -0.103; snf3 -0.135; cyb2 -0.138 and the distance to ref-
erence is 0.435. All these strains also showed similar metabolic flux profiling and are part of
a cluster where TCA cycle was down regulated (Fig 5.6-3). On galactose, the top five most
closely related strains are—fbp26 -0.145; glk1 -0.158; tye7 -0.198; sip3 -0.218; rgt2 -
0.259 and the distance to reference is 0.451. All these strains except sip3 also showed simi-
lar metabolic flux profiling and are part of a cluster where TCA cycle was up regulated (Fig

Results and discussion
135
5.6-4). On fructose, the top five most closely related strains are—mae1 -0.127; leu4 -0.181;
fbp26 -0.271; dld2 -0.377; pck1 -0.378; and the distance to reference is 1.08. Therefore,
fbp26 is a common strain present among the top five most closely related strains in all three
sugars followed by mae1 and dld2 present in two sugars, glucose and fructose. For all
strains the distances to ybr184w are less on glucose than on galactose and fructose. This is
very pronounced for fbp26 with distances of 0.064 (Glucose), 0.145 (Galactose) and 0.271
(Fructose), and mae1 with distances of 0.046 (Glucose) and 0.127 (Fructose). In addition,
ybr184w strain is most distantly related to reference strain on fructose with distance of 1.08
when compared to glucose and galactose (0.435 and 0.451, respectively). One possible ex-
planation is that ybr184w has more specific effects during growth on fructose and galactose
than on glucose.
On glucose ybr184w has identical specific growth rate with fbp26 , identical biomass yield
with fpb26 , mae1 and cyb2 , and identical ethanol yield with mae1 and snf3 . On fruc-
tose, ybr184w is the fastest grower and had lowest ethanol yield and mae1 is closely re-
lated to µmax and YE/S and there is no identity with respect to biomass yield among the top five
closely related strains. On galactose ybr184w has identical biomass yield with glk1 and
ethanol yield with tye7 and there is no identity with respect to specific growth rate among
the top five closely related strains.
Since fbp26 is one among the top five most closely related strains to ybr184w in all the
three carbon sources, it seems therefore likely that the effects of ybr184w deletion are
somewhat similar as fbp26 deletion. Fbp26p hydrolyzes fructose-2, 6-bisphosphate, which
is activating phosphofructokinase, Pfk1p, and inhibiting fructose-1, 6-bisphosphatase, Fbp1p
that is involved in gluconeogenesis pathway (Paravicini et al., 1992; Kretschmer et al., 1987).
The next closely related strains are mae1 and dld2 . Mae1p, mitochondrial malic enzyme
catalyses the oxidative decarboxylation of malate to pyruvate (Boles et al., 1998) has a strong
similarity to other malate dehydrogenases and is involved in gluconeogenesis and pyruvate
metabolic processes. Dld2p, D-lactate dehydrogenase activity, located in mitochondrial ma-
trix (Chelstowska, et al., 1999) is involved in lactate metabolic process and pyruvate metabo-
lism. Details of protein interactions and complexes using MIPS MPact Protein Interactions
and Complex DB (Güldener et al., 2006) (www.mips.gsf.de/genre/proj/impact) revealed that

Results and discussion
136
Ybr184wp has 2 direct physical interactions and one protein complex in which Mdh1p,
malate dehydrogenase precursor is involved which in turn had protein complex with lac-
tate/malate dehydrogenase (Ho et al., 2002). Based on these observations, one could predict
that in a broader sense, Ybr184wp might be involved in glucose metabolic process or pyru-
vate metabolic pathways.
YIL170W (SGD ID: S 000001432): YIL170W, a pseudogene HXT12, located on
chromosome IX is a non-functional member of the hexose transporter family (Nelissen et
al., 1995; Kruckeberg et al., 1996). This gene has high similarity to other 18-20 members of
hexose transporter family (Wieczorke et al., 1999; Diederich et al., 1999).
On glucose, the top five most closely related strains to yil170w and their distances are—
pck1 -0.076; tye7 -0.105; gad1 -0.115; hxt1 -0.126; hxt10 -0.133 and the distance to ref-
erence is 0.566. All these strains also showed similar metabolic flux profiling and are part of
a cluster where TCA cycle was up regulated (Fig 5.6-3). On galactose, the top five most
closely related strains are—pfk26 -0.268; mth1 -0.274; leu4 -0.31; hxt17 -0.313; hxt8 -
0.313 and the distance to reference is 0.247. All these strains also showed similar metabolic
flux profiling and are part of a cluster where TCA cycle was either down regulated or con-
stant (Fig 5.6-4). On fructose, the top five most closely related strains are—hxt1 -0.185;
rgt2 -0.244; hxt10 -0.245; hxt17 -0.275; rbk1 -0.316 and the distance to reference is
0.323. Therefore, common strains present at least in two sugars among the top five most
closely related strains are hxt1 , hxt10 and hxt17 . In general, for all the strains the dis-
tances to yil170w are less on glucose than on fructose and galactose. This is very pro-
nounced for hxt10 with distances of 0.133 (Glucose); 0.245 (Fructose), and hxt1 with dis-
tances of 0.126 (Glucose); 0.185 (Fructose). Even though the distances are relatively smaller
on glucose than other two sugars, yil170w strain is most distantly related to reference strain
on glucose followed by fructose and galactose, which indicates substrate specific phenotypes
of yil170w strain. The deletion of YIL170W is somewhat similar to the deletion effects of
low affinity transporter, hxt1 , and hexose transporters with limited known function, hxt10
and hxt17 as these are among the top five most closely related strains to yil170w at least in
two sugars.
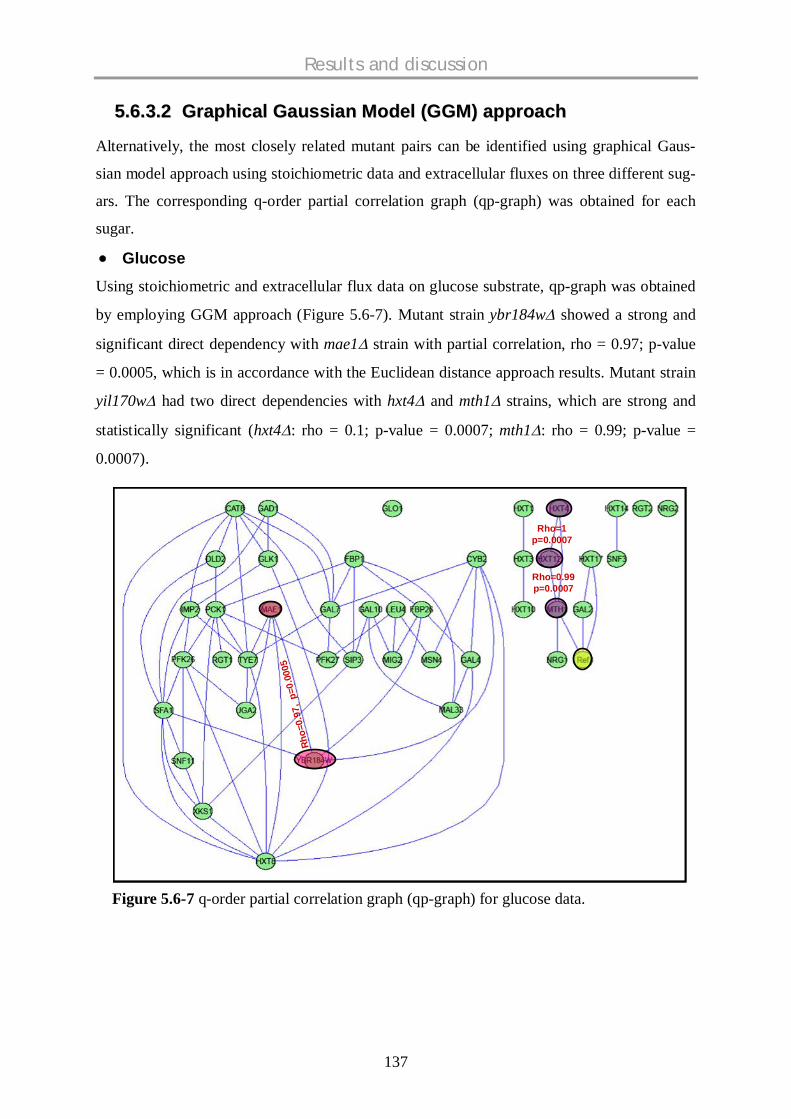
Results and discussion
137
55..66..33..22 GGrraapphhiiccaall GGaauussssiiaann MMooddeell ((GGGGMM)) aapppprrooaacchh
Alternatively, the most closely related mutant pairs can be identified using graphical Gaus-
sian model approach using stoichiometric data and extracellular fluxes on three different sug-
ars. The corresponding q-order partial correlation graph (qp-graph) was obtained for each
sugar.
Glucose
Using stoichiometric and extracellular flux data on glucose substrate, qp-graph was obtained
by employing GGM approach (Figure 5.6-7). Mutant strain ybr184w showed a strong and
significant direct dependency with mae1 strain with partial correlation, rho = 0.97; p-value
= 0.0005, which is in accordance with the Euclidean distance approach results. Mutant strain
yil170w had two direct dependencies with hxt4 and mth1 strains, which are strong and
statistically significant (hxt4 : rho = 0.1; p-value = 0.0007; mth1 : rho = 0.99; p-value =
0.0007).
Figure 5.6-7 q-order partial correlation graph (qp-graph) for glucose data.
Rho=
0.97
, p=
0.00
05
Rho=1p=0.0007
Rho=0.99p=0.0007
Rho=
0.97
, p=
0.00
05
Rho=1p=0.0007
Rho=0.99p=0.0007

Results and discussion
138
GalactoseSimilar analysis was done using quantitative data on galactose (Figure 5.6-8). The network
looks less connected when compared to glucose data suggesting that the mutant strains are
quite independent when grown on galactose and had their own phenotype. Mutant strain
ybr184w showed a strong and significant direct dependency with tye7 strain with partial
correlation, rho = 0.97; p-value = 0.0004, which is in accordance with the Euclidean distance
approach results. Whereas mutant strain yil170w showed a strong and significant direct de-
pendency with snf11 strain with partial correlation, rho = 0.1; p-value = 0.0007.
Figure 5.6-8 q-order partial correlation graph (qp-graph) for galactose data.
Rho=
0.87
p=0.
0004
Rho=1p=0.0007
Rho=
0.87
p=0.
0004
Rho=1p=0.0007
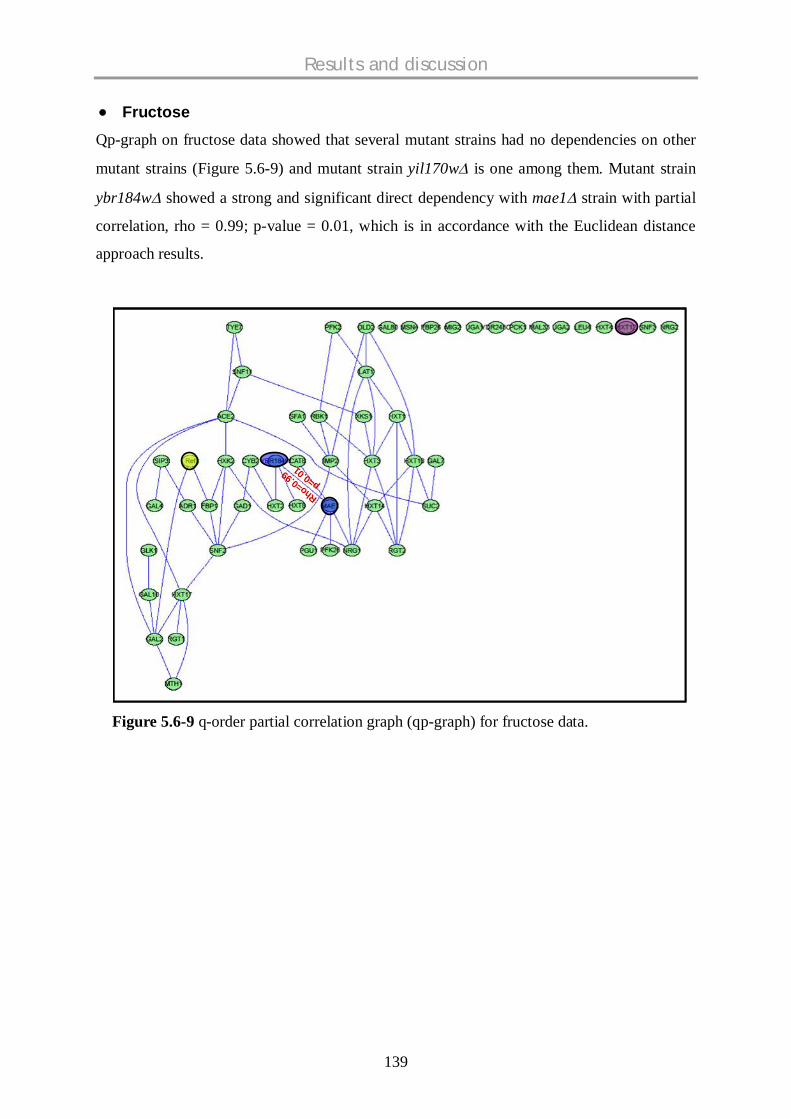
Results and discussion
139
FructoseQp-graph on fructose data showed that several mutant strains had no dependencies on other
mutant strains (Figure 5.6-9) and mutant strain yil170w is one among them. Mutant strain
ybr184w showed a strong and significant direct dependency with mae1 strain with partial
correlation, rho = 0.99; p-value = 0.01, which is in accordance with the Euclidean distance
approach results.
Figure 5.6-9 q-order partial correlation graph (qp-graph) for fructose data.
Rho=0.99p=0.01
Rho=0.99p=0.01

Results and discussion
140
55..66..44 CCoonncclluussiioonnssIn this overview chapter, all the strains studied on different carbon sources were combined
and analysed either individually on each sugar or together. The following statistical analyses
were employed for the computational analysis of the data (i) hierarchical clustering analysis,
and (ii) metabolic flux data visualization using clustered heat maps, relation between mutant
pairs using Euclidean distance measure and finally functional prediction of hypothetical
genes by combining all the above analyses and also by graphical Gaussian model approach.
Hierarchical clustering analysis of the stoichiometric data on each sugar revealed most
closely related mutant pairs. Combined clustering analysis revealed that cat8 -sfa1 ;
fbp26 -ybr184w ; msn4 -sip3 ; glk1 -tye7 ; cat8 -gad1 as most closely related mutant
pairs, which is also consistent with the metabolic flux profiling data. The functional predic-
tion of hypothetical gene YBR184W based on this quantitative data suggested a possible role
in glucose metabolic process or pyruvate metabolic pathways as the most closely related
strains in all the sugars were fbp26 , mae1 and dld2 . The functional prediction of a pseu-
dogene, YIL170W (HXT12), which is close to other hexose transporters suggested a possible
close association with the low affinity transporter knockout, hxt1 and with other hexose
transporters with limited known function knockouts, hxt10 and hxt17 .

Summary and Conclusions
141
6 SUMMARY AND CONCLUSIONSThe baker’s yeast, S. cerevisiae is a versatile eukaryotic model organism, whose genome was
first sequenced (Goffeau et al. 1996, 1997), and thoroughly investigated in several aspects,
which is used for understanding and engineering eukaryotic cell function (Ostergaard et al.,
2000). However, the function of a major fraction of genes coding for proteins has not yet
been determined. A powerful approach to determine gene function is the phenotypic analysis
of mutants missing the gene of interest (Winzeler et al., 1999; Que et al., 2002). The avail-
ability of the complete set of deletion mutants of S. cerevisiae provides a unique resource for
systematic analysis of the functional role of individual genes (Giaever et al., 2002; Brach-
mann et al., 1998). To exploit this unique resource of complete set, high-throughput assays
are needed to provide a quantitative phenotypic and metabolic profiles of the functional role
of individual genes besides already existing large-scale screenings to find gene-environment
interactions during several stress responses based on fitness (Giaever et al., 2002; Gasch et
al., 2002; Weiss et al., 2004; Warringer et al., 2003; Mollapur et al., 2004).
The determination of basic physiological parameters of deletion mutants on different carbon
sources would provide more detailed picture of metabolic activities of such mutants. Thus
this sort of research motivated to select and investigate the quantitative physiological charac-
terisation of a set of knockout strains involved in central carbon metabolism and hexose
transporters on different carbon sources. In order to screen a large number of deletion mu-
tants simultaneously, 96-well microtiter plates with immobilized oxygen sensors were used
and metabolic flux profiling was studied by using labeled substrates and simplified fluxes
were calculated using stoichiometric mass balances.
The first chapter (5.1) of the thesis dealt with the development and optimisation of high-
throughput kinetic and stoichiometric analysis of yeast mutant libraries in 96 well microtiter
plates with on-line sensing of dissolved oxygen at miniaturized scale and obtained reliable
quantitative data of physiological parameters on glucose and galactose. Twenty-seven dele-
tion mutants of S. cerevisiae were investigated using a novel method for high-content
stoichiometric and kinetic metabolic profiling. We can detect, whether oxygen limitation is
occurring during cultivation using the oxygen sensing microtiter plate. Secondly, dissolved
oxygen profiles indicate most substrate limitations and diauxic behaviour. The application of

Summary and Conclusions
142
a simple balanced growth model allowed correction for ethanol and water evaporation during
cultivation. From this new method, reliable data for specific growth rate, biomass and ethanol
yields on carbon substrate and biomass yield on oxygen were calculated on both the sugars
and allowed statistically significant discrimination of all mutants studied (Velagapudi et al.,
2006).
In the second chapter (5.2), a new method was developed for throughput quantification of
isotope-labeled ethanol originating from 1-13C-labeling experiments using MALDI-ToF-MS,
which permits the calculation of the flux split ratio between glycolysis and the pentose-
phosphate pathway (PPP). This new application of the hydrazone reaction of 2,4-
dinitrophenylhydrazine with acetaldehyde, formed by an enzymatic reaction, is a sufficiently
sensitive method for the quantification of ethanol formed by fermentation. Ethanol quantifi-
cation using this method was compared with enzymatic analysis and exhibited differences of
less than 3.3 % on average. Comparison of flux partitioning ratios based on MALDI-TOFMS
and gas chromatography GC/MS methods showed good agreement, with differences for etha-
nol and alanine labeling of only 4.3 % (Hollemeyer et al., 2007).
The third chapter (5.3) of the thesis dealt with the comparative metabolic flux profiling on
the selected mutants on glucose and galactose by utilizing the above developed methods. On
glucose, the growth was predominantly fermentative with high yield of ethanol, low yield of
biomass and low oxygen consumption rate. On galactose respiration was more active with
correspondingly lower ethanol yields, higher biomass yields and higher rates of oxygen con-
sumption. Some strains showed unexpectedly high or low growth rates and rates of ethanol
production and respiration providing very informative data about the function of the corre-
sponding gene. Deletion of malic enzyme gene, MAE1, did not show any significant pheno-
type when grown on glucose but a drastically increased branching from glucose 6-phosphate
into the pentose phosphate pathway on galactose. This allows the conclusion that Mae1p is
important for the supply of NADPH during aerobic growth on galactose (Velagapudi et al.,
2007).
The fourth chapter (5.4) of the thesis dealt with the hexose transporter deletion mutant
strains and each selected deletion mutant strain was grown on glucose and galactose to obtain
quantitative stoichiometric and metabolic flux data. Since these are single knockouts and
have complementary functions, these strains had no growth defects, except for gal2 on ga-
lactose but revealed substrate specific phenotypic profiles. On glucose, hxt4 strain was
highly fermentative (had as low TCA fluxes as anaplerotic fluxes), in contrast, on galactose,

Summary and Conclusions
143
it had higher respiratory flux. On glucose, hxt8 was the fastest grower with lowest fermenta-
tive capacity. However, the strain had highest specific glucose uptake rate, PPP and TCA
cycle fluxes. On galactose, rgt1 strain had extremely high PPP flux and also high fermenta-
tive capacity with lower respiratory and anaplerotic fluxes. The mutant strain hxt14 had
similar anaplerotic and TCA fluxes on both the sugars; and had similar TCA, PPP fluxes as
well as ethanol yields on both the sugars.
The fifth chapter (5.5) of the thesis dealt with the comparative physiological profiling on
three carbon sources, which clearly indicates that strains grown on galactose were growing
slowly when compared to glucose and fructose. Strains grown on glucose had higher fermen-
tative activity followed by fructose grown strains, whereas strains grown on galactose had
higher TCA and therefore higher respiratory activity. mae1 strain had highest oxygen up-
take rate with very low ethanol yield, which could be due to reduced PPP flux on fructose.
mae1 strain would have only 2 routes to maintain NADPH levels, one way via TCA cycle
by activating NADPH specific isocitrate dehydrogenase activity other one via NADPH spe-
cific aldehyde dehydrogenase. The obtained results suggested a positive effect of Hxt3p on
fructose fermentation and Hxt8p on both glucose and fructose fermentations but not on galac-
tose. Hxt4p on fructose and Hxt4p and Hxt14p on glucose might have negative effects on
fermentation. Based on this analysis, physiologically and industrially potentially beneficial
strains could be identified.
The sixth chapter (5.6) of the thesis dealt with the functional prediction of hypothetical
genes by utilising the quantitative stoichiometric and metabolic flux data on different carbon
sources. All the strains studied on different carbon sources were combined and analysed sta-
tistically. Combined hierarchical clustering analysis revealed that cat8 -sfa1 ; fbp26 -
ybr184w ; msn4 -sip3 ; glk1 -tye7 ; cat8 -gad1 as most closely related mutant pairs,
which is also consistent with the metabolic flux profiling data. Moreover, these mutant pairs
also have biological significance. Based on Euclidean distance approach, it seems that the
hypothetical gene YBR184W might play a role in pyruvate metabolism as ybr184w is close
to mae1 , dld2 and fbp26. Pseudogene, YIL170W (HXT12), might play a role as low affinity
transporter as yil170w is close to hxt1 and also with other hexose transporters with limited
known functions, hxt10 and hxt17 . These results were also confirmed by Graphical Gaus-
sian modelling approach.

Outlook
144
77.. OOUUTTLLOOOOKKImpact of the thesis work
This thesis presents the high-throughput phenotypic and metabolic flux profiling of yeast
single gene knockouts on different carbon sources. From the complete yeast knockout library,
which contains over 6,000 gene-disruption mutants, a sub-set of over 60 deletion mutants
whose gene functions are supposed to be involved in central carbon metabolism, hexose
transportation, transcriptional factors and few uncharacterised genes were selected, i.e., about
1 % of the complete collection. Since the effects of most of the gene deletions are silent (si-
lent phenotype due to complementary functions) or robust (due to tight integration of yeast
metabolic network), three different sugars, glucose, galactose and fructose were selected as
the sole carbon source. For parallel handling of deletion strains, 96-well microtiter plates with
immobilised oxygen sensors were used for miniaturised cultivation purpose, which is both
time and cost-effective approach.
Quantitative stoichiometric data and metabolic flux profiling data were obtained by imple-
menting the developed novel methodology. This high-content metabolic screening of yeast
mutants revealed unexpected metabolic mobilisation of metabolic potential and in addition
metabolic flux screening of mutants on different carbon sources supported the elucidation of
gene function. Furthermore, combined quantitative data analysis by using computational ap-
proaches enabled to predict the function of hypothetical genes. The work described in this
thesis contributes significantly to the yeast community where the main goals of the yeast de-
letion project consortium are physiological profiling of each deletion knockout where the
ultimate aim is to unravel the function of uncharacterised genes i.e., functional analysis of the
yeast genome.

Outlook
145
Directions for future research
1. Metabolic flux results of mae1 strain revealed a very high PP pathway on galactose
and very high oxygen uptake rate on fructose to maintain NADPH demand; it would
be interesting to do in-depth analysis of this strain.
2. More in depth analysis of mutants on fructose sugar by measuring all possible ex-
tracellular products and subsequent metabolic flux analysis.
3. In order to confirm the early functional predictions of uncharacterised gene YBR184W
further investigation of this strain and its closely related strains, mae1 , fbp26 and
dld2 is necessary. For instance, similar analysis on non-fermentable carbon sources.
4. In order to obtain more insights on hexose transport, it would be interesting to carry
out similar research on strains carrying only one HXT gene.

References
146
88.. RREEFFEERREENNCCEESS1. Alfenore, S., Molina-Jouve, C., Guillouet, S.E., Uribelarrea, J.L., Goma, G., Benbadis, L., 2002.
Improving ethanol production and viability of Saccharomyces cerevisiae by a vitamin feedingstrategy during fed-batch process. Appl Microbiol Biotechnol. 60, 67-72.
2. Allen, J., Davey, H.M., Broadhurst, D., Heald, J.K., Rowland, J.J., Oliver, S.G., Kell, D.B.,2003. High-throughput classification of yeast mutants for functional genomics using metabolicfootprinting. Nat Biotechnol. 21, 692-696.
3. Amberg, D.C, Basart, E., Botstein, D., 1995. Defining protein interactions with yeast actin invivo. Nature Struct. Biol. 2, 28-35.
4. Andre, B., 1995. Overview of membrane transport proteins in Saccharomyces cerevisiae. Yeast.16, 1575-611.
5. Baer, E., Stanacev, N.Z., 1964. Convenient Deuterium Labeling for Mass Spectrometry viaExchange of Enolizable Hydrogen on a Gas-Liquid Chromatorgaphy Column. J. Amer. Chem.Soc. 87, 3.
6. Barr, M.M., 2003. Super models. Physiol Genomics. 13, 15-24.
7. Barredo, J.L., Alvarez, E., Cantoral, J.M., Diez, B., Martin, J.F., 1988. Glucokinase-deficientmutant of Penicillium chrysogenum is derepressed in glucose catabolite regulation of both beta-galactosidase and penicillin biosynthesis. Antimicrob Agents Chemother. 32, 1061-1067.
8. Barwald, G., Fischer, A., 1996. Crabtree effect in aerobic fermentations using grape juice for theproduction of alcohol reduced wine. Biotechnol Letters. 18, 1187-1192.
9. Baudin, A., Ozier-Kalogeropoulos, O., Denouel, A., Lacroute, F., Cullin, C.A., 1993. Simpleand efficient method for direct gene deletion in Saccharomyces cerevisiae. Nucleic Acids Res.21, 3329-3330.
10. Berkey, C.D., Vyas, V.K., Carlson, M., 2004. Nrg1 and Nrg2 Transcriptional Repressors AreDifferently Regulated in Response to Carbon Source. Eukaryot Cell. 3, 311–317.
11. Blank, L.M., Lehmbeck, F., Sauer, U., 2005a. Metabolic-flux and network analysis in fourteenhemiascomycetous yeasts. FEMS Yeast Res. 5, 545-548.
12. Blank, L.M., Kuepfer, L., Sauer, U., 2005b. Large-scale 13C-flux analysis reveals mechanisticprinciples of metabolic network robustness to null mutations in yeast. Genome Biology. 6, R49.
13. Blank, L.M., Sauer, U., 2004. TCA cycle activity in S. cerevisiae is a function of theenvironmentally determined growth and glucose uptake rate. Microbiology. 150, 1085-1093.
14. Boles, E., de Jong-Gubbels, P., Pronk, J.T., 1998. Identification and characterization of MAE1,the Saccharomyces cerevisiae structural gene encoding mitochondrial malic enzyme. JBacteriol. 180, 2875-2882.
15. Brachmann, C.B., Davies, A., Cost, G.J., Caputo, E., Li, J., Hieter, P., Boeke, J.D., 1998.Designer deletion strains derived from Saccharomyces cerevisae S288C: A useful set of strainsand plasmids for PCR mediated gene disruption and other applications. Yeast. .14, 115-138.
16. Carlson, M., 1999. Glucose repression in yeast. Curr. Opin. Microbiol. 2, 202–207.
17. Carpenter, A.E., Sabatini, D.M., 2004. Systematic genome-wide screens of gene function. NatRev Genet. 5, 11-22.
18. Celenza, J.L., Carlson, M., 1986. A yeast gene that is essential for release from glucoserepression encodes a protein kinase. Science. 233, 1175–1180.

References
147
19. Chelstowska, A., 1999. Signalling between mitochondria and the nucleus regulates theexpression of a new D-lactate dehydrogenase activity in yeast. Yeast. 13, 1377-91.
20. Christensen, B., Nielsen, J., 2000. Metabolic network analysis of Penicillium chrysogenumusing 13C-labeled glucose. Biotechnol. Bioeng. 68, 652-659.
21. Chu, S., 1998. The transcriptional program of sporulation in budding yeast. Science. 282, 699–705.
22. Conde, R., Pablo, G., Cueva, R., Larriba, G., 2003. Screening for new yeast mutants affected inmannosylphosphorylation of cell wall mannoproteins. Yeast. 20,1189-211.
23. Diderich, J.A., Schepper, M., Hoek, P.V., Luttik, M.A.H., Johannes, P., van Dijken, Pronk, J.T.,Klaassen, P., Boelens, H.F., de Mattos, M.J., van Dam, K., Kruckeberg, A.L., 1999. GlucoseUptake Kinetics and Transcription of HXT Genes in Chemostat Cultures of Saccharomycescerevisiae. J Biol Chem 274, 15350–15359.
24. Doizaki, W.M., Lewitt, M.D., 1983. Gas chromatographic method for the determination oflower volatile alcohols in rat blood and in human stool specimens on a fused silica capillarycolumn. J Chromatogr. 276, 11-18.
25. Dominguez, H., Rollin, C., Guyonvarch, A., Guerquin-Kern, J.L., Cocaign-Bousquet, M.,Lindley, N.D., 1998. Carbon-flux distribution in the central metabolic pathways ofCorynebacterium glutamicum during growth on fructose. Eur. J. Biochem. 254, 96–102.
26. Dong, J.Z., Moldoveanu, S.C., 2004. Gas chromatography-mass spectrometry of carbonylcompounds in cigarette mainstream smoke after derivatization with 2,4-dinitrophenylhydrazine.J Chromatogr. A. 1027, 25-35.
27. Dunn, I.J., Heinzle, E., Ingham, J., Prenosil, J.E. 2003. Biological Reaction Engineering.Dynamic Modelling Fundamentals with Simulation Exercises. 2nd Edition. Wiley-VCH,Weinheim.
28. Eberhardt, I., Cederberg, H., Li, H., König, S., Jordan, F., Hohmann, S., 1999. Autoregulationof yeast pyruvate decarboxylase gene expression requires the enzyme but not its catalyticactivity. Eur J Biochem. 262, 191-201.
29. Estruch, F., Carlson, M., 1993. Two homologous zinc finger genes identified by multicopysuppression in a SNF1 protein kinase mutant of Saccharomyces cerevisiae. Mol Cell Biol. 7,3872-3881.
30. Feldmann, H., Aigle, M., Aljinovic, G., André, B., Baclet, M.C., Barthe, C., Baur, A., Bécam,A.M., Biteau, N., Boles, E., 1994. Complete DNA sequence of yeast chromosome II. EMBO J.24, 5795-5809.
31. Fischer, E., Sauer, U., 2003. Metabolic flux profiling of Escherichia coli mutants in centralcarbon metabolism by GC-MS. Eur J Biochem. .270, 880-891.
32. Fischer, E., Zamboni, N., and Sauer, U. 2004. High-throughput metabolic flux analysis based onGC-MS-derived 13C- constraints. Anal Biochem. 325, 308-321.
33. Flick, K.M., Spielewoy, N., Kalashnikova, T.I., Guaderrama, M., Zhu, Q., Chang, H.C.,Wittenberg, C., 2003. Grr1-dependent inactivation of Mth1 mediates glucose-induceddissociation of Rgt1 from HXT gene promoters. Mol. Biol. Cell. 14, 3230–3241.
34. Frick, O., Wittmann, C., 2005. Characterization of the metabolic shift between oxidative andfermentative growth in Saccharomyces cerevisiae by comparative 13C flux analysis. Microb.Cell. Factories. 4, 30-46.
35. Furukawa, K., Heinzle, E., and Dunn, I.J. 1983. Influence of oxygen on the growth ofSaccharomyces cerevisiae in continuous culture. Biotechnol. Bioeng. 25, 2293-2317.
References
148
36. Gafner, J., Schütz, M., 1996. Impact of glucose-fructose-ratio on stuck fermentations: practicalexperience to restart stuck fermentations. Vitic Enol Scien. 51, 214 - 218.
37. Gancedo, J.M., 1998. Yeast carbon catabolite repression. Microbiol Mol Biol Rev. 62, 334-361.
38. Gasch, A.P., Washburne, M.W., 2002. The genomics of yeast responses to enviranmental stressand starvation. Funct Integr genomics. 2, 181-192.
39. Gavin, A.C., Bösche, M., Krause, R., Grandi, P., Marzioch, M., Bauer, A., Schultz, J., Rick,J.M., Michon, A.M., Cruciat, C.M., Remor, M., Höfert, C., Schelder, M., Brajenovic, M.,Ruffner, H., Merino, A., Klein, K., Hudak, M., Dickson, D., Rudi, T., Gnau, V., Bauch, A.,Bastuck, S., Huhse, B., Leutwein, C., Heurtier, M.A., Copley, R.R., Edelmann, A., Querfurth,E., Rybin, V., Drewes, G., Raida, M., Bouwmeester, T., Bork, P., Seraphin, B., Kuster, B.,Neubauer, G., Superti-Furga, G., 2002. Functional organization of the yeast proteome bysystematic analysis of protein complexes. Nature. 10, 141-147.
40. Goffeau, A., Barrell, B.G., Bussey, H., Davis, R.W., Dujon, B., Feldmann, H., Galibert, F.,Hoheisel, J.D., Jacq, C., Johnston, M., Louis, E.J., Mewes, H.W., Murakami, Y., Philippsen, P.,Tettelin, H., Oliver, S.G., 1996. Life with 6000 genes. Science. 274, 563-567.
41. Gombert, A.K., Moreira, M., Christensen, B., Nielsen, J., 2001. Network identification and fluxquantification in the central metabolism of Saccharomyces cerevisiae under different conditionsof glucose repression. J Bacteriol. 183, 1441-1451.
42. Giaever, G., Chu, A.M., Ni, L., Connelly, C., Riles, L., Veronneau, S., Dow, S., Lucau-Danila,A., Anderson, K., Andre, B., Arkin, A.P., Astromoff, A., El-Bakkoury, M., Bangham, R.,Benito, R., Brachat, S., Campanaro, S., Curtiss, M., Davis, K., Deutschbauer, A., Entian, K.D.,Flaherty, P., Foury, F., Garfinkel, D.J., Gerstein, M., Gotte, D., Guldener, U., Hegemann, J.H.,Hempel, S., Herman, Z., Jaramillo, D.F., Kelly, D.E., Kelly, S.L., Kotter, P., LaBonte, D.,Lamb, D.C., Lan, N., Liang, H., Liao, H., Li,u L., Luo, C., Lussier, M., Mao, R., Menard, P.,Ooi, S.L., Revuelta, J.L., Roberts, C.J., Rose, M., Ross-Macdonald, P., Scherens, B.,Schimmack, G., Shafer, B., Shoemaker, D.D., Sookhai-Mahadeo, S., Storms, R.K., Strathern,J.N., Valle, G., Voet, M., Volckaert, G., Wang, C.Y., Ward, T.R., Wilhelmy, J., Winzeler, E.A.,Yang, Y., Yen, G., Youngman, E., Yu, K., Bussey, H., Boeke, J.D., Snyder, M., Philippsen, P.,Davis, R.W., Johnston, M., 2002. Functional profiling of the Saccharomyces cerevisiae genome.Nature. 418, 387-391.
43. Gorner, W., 1998. Nuclear localization of the C2H2 zinc finger protein Msn2p is regulated bystress and protein kinase A activity. Genes Dev. 12, 586-597.
44. Guillaume, C., Delobel, P., Sablayrolles, J.M., Blondin, B., 2007. Molecular basis of fructoseutilization by the wine yeast Saccharomyces cerevisiae: a mutated HXT3 allele enhancesfructose fermentation. Appl Environ Microbiol. 73, 2432 – 2439.
45. Güldener, U., Münsterkötter, M., Oesterheld, M., Pagel, P., Ruepp, A., Mewes, H.W.,Stümpflen, V., 2006. MPact: the MIPS protein interaction resource on yeast. Nucl. Acids Res.34, D436-D441.
46. Greatrix, B.W., Hennie, E., van Vuuren, J.J., 2006. Expression of the HXT13, HXT15 andHXT17 genes in Saccharomyces cerevisiae and stabilization of the HXT1 gene transcript bysugar-induced osmotic stress. Curr Genet. 49, 205–217.
47. Grey, M., 1996. Overexpression of ADH1 confers hyper-resistance to formaldehyde inSaccharomyces cerevisiae. Curr Genet. 29, 437-440.
48. Gross, C., Kelleher, M., Iyer, V.R., Brown, P.O., Winge, D.R., 2000. Identification of thecopper regulon in Saccharomyces cerevisiae by DNA microarrays. J Biol Chem. 275, 32310-32316.

References
149
49. Hammerle, M., Bauer, J., Rose, M., Szallies, A., Thumm, M., Dusterhus, S., Mecke, D., Entian,K.D., Wolf, D.H., 1998. Proteins of newly isolated mutants and the amino-terminal proline areessential for ubiquitin-proteasome-catalyzed catabolite degradation of fructose-1,6-bisphosphatase of Saccharomyces cerevisiae. J Biol Chem. 273, 25000-25005.
50. Haselbeck, R.J., McAlister-Henn, L., 1993. Function and expression of yeast mitochondrialNAD- and NADP-specific isocitrate dehydrogenases. J Biol Chem. 16, 12116-12122.
51. Haurie, V., 2001. The transcriptional activator Cat8p provides a major contribution to thereprogramming of carbon metabolism during the diauxic shift in Saccharomyces cerevisiae. JBiol Chem. 276, 76-85.
52. Hedges, D., 1995. CAT8, a new zinc cluster-encoding gene necessary for derepression ofgluconeogenic enzymes in the yeast Saccharomyces cerevisiae. Mol Cell Biol. 15, 1915-1922.
53. Herrero, P., 1995. Transcriptional regulation of the Saccharomyces cerevisiae HXK1, HXK2and GLK1 genes. Yeast, 11, 137-144.
54. Ho, Y., Gruhler, A., Heilbut, A., Bader, G.D., Moore, L., Adams, S.L., Millar, A., Taylor, P.,Bennett, K., Boutilier, K., Yang, L., Wolting, C., Donaldson, I., Schandorff, S., Shewnarane, J.,Vo, M., Taggart, J., Goudreault, M., Muskat, B., Alfarano, C., Dewar, D., Lin, Z.,Michalickova, K., Willems, A.R., Sassi, H., Nielsen, P.A., Rasmussen, K.J., Andersen, J.R.,Johansen, L.E., Hansen, L.H., Jespersen, H., Podtelejnikov, A., Nielsen, E., Crawford, J.,Poulsen, V., Sørensen, B.D., Matthiesen, J., Hendrickson, R.C., Gleeson, F., Pawson, T., Moran,M.F., Durocher, D., Mann, M., Hogue, C.W., Figeys, D., Tyers, M., 2002. Systematicidentification of protein complexes in Saccharomyces cerevisiae by mass spectrometry. Nature.415, 180-183.
55. Hollemeyer, K., Velagapudi, V.R., Wittmann, C., Heinzle, E., 2007. Matrix-assisted laserdesorption/ionization time-of-flight mass spectrometry for metabolic flux analyses usingisotope-labeled ethanol. Rapid Commun.Mass Spectrom. 21, 336-342.
56. Irie, K., Takase, M., Lee, K.S., Levin, D.E., Araki, H., Matsumoto, K., Oshima, Y., 1993.MKK1 and MKK2, which encode Saccharomyces cerevisiae mitogen-activated protein kinase-kinase homologs, function in the pathway mediated by protein kinase C. Mol Cell Biol. 13,3076-3083.
57. John, G.T., Klimant, I., Wittmann, C., Heinzle, E., 2003. Integrated optical sensing of dissolvedoxygen in microtiter plates – A novel tool for microbial cultivation. Biotechnol Bioeng. 81, 829-836.
58. Johnston, M., 1999. Feasting, fasting and fermenting. Glucose sensing in yeast and other cells.Trends Genet. 15, 29–33.
59. Jungmann, J., Reins, H.A., Lee, J., Romeo, A., Hassett, R., Kosman, D., Jentsch, S., 1993.MAC1, a nuclear regulatory protein related to Cu-dependent transcription factors is involved inCu/Fe utilization and stress resistance in yeast. EMBO J. 12, 5051-5056.
60. Kaniak, A., Xue, Z., Macool, D., Kim, J.H., Johnston, M., 2004. Regulatory network connectingtwo glucose signal transduction pathways in Saccharomyces cerevisiae. Eukaryot Cell. 3, 221-231.
61. Karpel, J.E., Place, W.R., Bisson, L.F., 2008. Analysis of the Major Hexose Transporter Genesin Wine Strains of Saccharomyces cerevisiae. Am. J. Enol. Vitic. 3, 265-275.
62. Kellis, M., Patterson, N., Endrizzi, M., Birren, B., Lander, E.S., 2003. Sequencing andcomparison of yeast species to identify genes and regulatory elements. Nature. 423, 241-254.
63. Kiefer, P., Heinzle, E., Wittmann, C., 2002. Influence of glucose, fructose and sucrose as carbonsources on kinetics and stoichiometry of lysine production by Corynebacterium glutamicum. JInd Microbiol Biotechnol. 28, 338-343.

References
150
64. Kiefer, P., Heinzle, E., Zelder, O., Wittmann, C., 2004. Comparative Metabolic Flux Analysisof Lysine-Producing Corynebacterium glutamicum Cultured on Glucose or Fructose. Appl. Env.Microbiol, 70, 229-239.
65. Kleijn, R.J., van Winden, W.A., Ras, C., van Gulik, W.M., Schipper, D., Heijnen, J.J., 2006.13C-Labeled Gluconate Tracing as a Direct and Accurate Method for Determining the PentosePhosphate Pathway Split Ratio in Penicillium chrysogenum. Appl. Environ. Microbiol. 72,4743-4754.
66. Klockow, C., Stahl, F., Scheper, T., Hitzmann, B., 2008. In vivo regulation of glucosetransporter genes at glucose concentrations between 0 and 500 mg/L in a wild type ofSaccharomyces cerevisiae. Journal of Biotechnology. 135, 161–167.
67. Knapp, D.R., 1979. In Handbook of Analytical Derivatization Reactions, Ed.: John Wiley &Sons: New York. 26-63.
68. Ko, C.H., Liang H., Gaber, R.F., 1993. Roles of Multiple Glucose Transporters inSaccharomyces cerevisiae. Mol.Cell. Biol. 13, 638-648.
69. Kretschmer, M., Schellenberger, W., Otto, A., Kessler, R., Hofmann, E., 1987. Fructose-2,6-bisphosphatase and 6-phosphofructo-2-kinase are separable in yeast. Biochem J. 246, 755–759.
70. Kruckeberg, A.L., 1996. The hexose transporter family of Saccharomyces cerevisiae, Arch.Microbid. 166, 283-292.
71. Kuchin, S., Treich, I., Carlson, M., 2000. A regulatory shortcut between the Snf1 protein kinaseand RNA polymerase II holoenzyme. Proc. Natl.Acad. Sci. USA 97, 7916–7920.
72. Kuchin, S., Vyas, V.K., Carlson, M., 2002. Snf1 protein kinase and the repressors Nrg1 andNrg2 regulate FLO11, haploid invasive growth, and diploid pseudohyphal differentiation. Mol.Cell. Biol. 22, 3994–4000.
73. Kumar, S., Wittmann, C., Heinzle, E., 2004. Minibioreactors. Biotechnol Lett. 26, 1-10.
74. Kurita, O., Nishida, Y., 1999. Involvement of mitochondrial aldehyde dehydrogenase ALD5 inmaintenance of the mitochondrial electron transport chain in Saccharomyces cerevisiae. FEMSMicrobiol Lett. 2, 281-287.
75. Lafuente, M.J., Gancedo, C., Jauniaux, J.C., Gancedo, J.M., 2000. Mth1 receives the signalgiven by the glucose sensors Snf3 and Rgt2 in Saccharomyces cerevisiae. Mol. Microbiol. 35,161–172.
76. Lesage, P., Yang, X., Carlson, M., 1994. Analysis of the SIP3 protein identified in a two-hybridscreen for interaction with the SNF1 protein kinase. Nucleic Acids Res. 22, 597-603.
77. Lewis, D.A.., Bisson, L.F., 1991. The HXT1 gene product of Saccharomyces cerevisiae is anew member of the family of hexose transporters. Mol Cell Biol. 11, 3804–3813.
78. Li, F.N., Johnston, M., 1997. Grr1 of Saccharomyces cerevisiae is connected to the ubiquitinproteolysis machinery through Skp1: coupling glucose sensing to gene expression and the cellcycle. EMBO J. 16, 5629–5638.
79. Liang, H., Gaber, R.F.,1996. A Novel Signal Transduction Pathway in Saccharomycescerevisiae Defined by Snf3-regulated Expression of HXT6. Mol Biol Cell. 7, 1953-1966.
80. Loftus, T.M., Hall, L.V., Anderson, S.L., McAlister-Henn, L., 1994. Isolation, characterization,and disruption of the yeast gene encoding cytosolic NADP-specific isocitrate dehydrogenase.Biochemistry. 32, 9661-9667.
81. Lohning, C., Ciriacy, M., 1994. The TYE7 gene of Saccharomyces cerevisiae encodes a putativebHLH-LZ transcription factor required for Ty1-mediated gene expression. Yeast. 10, 1329-1339.

References
151
82. Luyten, K., Riou, C., Blondin, B., 2002. The hexose transporters of Saccharomyces cerevisiaeplay different roles during enological fermentation. Yeast. 19, 713–726.
83. Martinez-Pastor, M.T., 1996. The Saccharomyces cerevisiae zinc finger proteins Msn2p andMsn4p are required for transcriptional induction through the stress response element (STRE).EMBO J. 15, 2227-2235.
84. Massart, D.L., Vandeginste, B.G.M., Buydens, L.M.C., De Jong, S., Lewi, P.J., Smeyers-Verbeke, J., 1997. Handbook of Chemometrics and qualimetrics: Part A, Elsevier, Amsterdam,94.
85. Masson, J.Y., Ramotar, D., 1996. The Saccharomyces cerevisiae IMP2 Gene Encodes aTranscriptional Activator That Mediates Protection against DNA Damage Caused by Bleomycinand Other Oxidants. Mol Cell Biol 16, 2091-2100.
86. Masson, J.Y., Ramotar, D., 1998. The Transcriptional Activator Imp2p Maintains IonHomeostasis in Saccharomyces cerevisiae. Genetics. 149, 893-901.
87. Mollapour, M., Fong, D., Balakrishnan, K., Harris, N., Thompson, S., Schuller, C., Kuchler, K.,Piper, P.W., 2004. Screening the yeast deletant mutant collection for hypersensitivity and hyper-resistance to sorbate, a weak organic acid food preservative. Yeast. 21, 927-946.
88. Moriya, H., Johnston, M., 2004. Glucose sensing and signaling in Saccharomyces cerevisiaethrough the Rgt2 glucose sensor and casein kinase I. 101, 1572-1577.
89. Muller, S., Zimmermann, F.K., Boles, E., 1997. Mutant studies of phosphofructo-2-kinases donot reveal an essential role of fructose-2, 6-bisphosphate in the regulation of carbon fluxes inyeast cells. Microbiology. 143, 3055-3061.
90. Neef, D.W., Kladde, M.P., 2003. Polyphosphate loss promotes SNF/SWI- and Gcn5-dependentmitotic induction of PHO5. Mol Cell Biol. 23, 3788-3797.
91. Nehlin, J.O., Carlberg, M., and Ronne, H. 1989. Yeast galactose permease is related to yeast andmammalian glucose transporters. Gene. 85, 313-319.
92. Nelissen, B., 1995. Phylogenetic classification of the major superfamily of membrane transportfacilitators, as deduced from yeast genome sequencing. FEBS Lett. 377, 232-236.
93. Oeggerli, A., Heinzle, E., 1994. On-line Exhaust Gas Analysis of Volatiles in FermentationUsing Mass Spectrometry. Biotechnol. Prog. 10, 284-290.
94. Oliver, S.G., Winson, M.K., Kell, D.B., Baganz, F., 1998. Systematic functional analysis of theyeast genome. Trends Biotechnol. 16, 373–378.
95. Ostergaard, S., Olsson, L., Nielsen, J., 2000. Metabolic engineering of Saccharomycescerevisiae. Microbiol Mol Biol Rev. 64, 34-50.
96. Ostergaard, S., Olsson, L., Nielsen, J., 2001. In vivo dynamics of galactose metabolism inSaccharomyces cerevisiae: metabolic fluxes and metabolite levels. Biotechnol Bioeng. 5, 412-425.
97. Özcan, S., Johnston, M., 1999. Function and regulation of yeast hexose transporters. MicrobiolMol Biol Rev. 63, 554-569.
98. Ozcan, S., Leong, T. and Johnston, M. 1996. Rgt1p of Saccharomyces cerevisiae, a keyregulator of glucose-induced genes, is both an activator and a repressor of transcription. Mol.Cell. Biol. 16, 6419-6426.
99. Ozcan, S. and Johnston, M. 1995. Three different regulatory mechanisms enable yeast hexosetransporter (HXT) genes to be induced by different levels of glucose. Mol. Cell. Biol. 15, 1564-1572.
100. Paravicini, G., Kretschmer, M., 1992. The yeast FBP26 gene codes for a fructose-2,6-bisphosphatase. Biochemistry. 31, 7126-7133.

References
152
101. Park, S.H., Koh, S.S., Chun, J.H., Hwang, H.J., Kang, H.S., 1999. Nrg1 is a transcriptionalrepressor for glucose repression of STA1 gene expression in Saccharomyces cerevisiae. Mol.Cell. Biol. 19, 2044–2050.
102. Park, H., Girdaukas, G.G., 2006. Northrop DB. Effect of pressure on a heavy-atom isotopeeffect of yeast alcohol dehydrogenase. J. Am. Chem. Soc. 128, 1868-1872.
103. Perez, M., Luyten, K., Michel, R., Riou, C., Blondin, B., 2004. Analysis of Saccharomycescerevisiae hexose carrier expression during wine fermentation. Both low and high affinity Hxttransporters are expressed. FEMS Yeast Res. 5, 351–361.
104. Petersen, S., de Graaf, A.A., Eggeling, L., Mollney, M., Wiechert, W., Sahm, H., 2000. In vivoquantification of parallel and bidirectional fluxes in the anaplerosis of Corynebacteriumglutamicum. J. Biol. Chem. 75, 35932–35941.
105. Platt, A., Reece, R.J., 1998. The yeast galactose genetic switch is mediated by the formation of aGal4p-Gal80p-Gal3p complex. EMBO J. 17, 4086-4091.
106. Postma, E., Verduyn, C., Scheffers, W.A., Van Dijken, J.P., 1989. Enzymic analysis of thecrabtree effect in glucose-limited chemostat cultures of Saccharomyces cerevisiae. ApplEnviron Microbiol. 55, 468-477.
107. Que, Q.Q., Winzeler, E.A., 2002. Large-scale mutagenesis and functional genomics in yeast.Funct Integr Genomics. 2, 193-198.
108. Reifenberger, E., Boles, E., Ciriacy, M., 1997. Kinetic characterization of individual hexosetransporters of Saccharomyces cerevisiae and their relation to the triggering mechanisms ofglucose repression. Eur J Biochem.. 15, 324–333.
109. Reifenberger, E., Freidel, K., Ciriacy, M., 1995. Identification of novel HXT genes inSaccharornyces cerevisiae reveals the impact of individual hexose transporters on glycolyticflux. Mol. Microbiol.16, 157- 167.
110. Rintala, E., Wiebe, M.G., Tamminen, A., Ruohonen, L., Penttilä, M., 2008. Transcription ofhexose transporters of Saccharomyces cerevisiae is affected by change in oxygen provision.BMC Microbiology. 8, 53.
111. Rodriguez-Pena, J.M., Cid, V.J., Arroyo, J., Nombela, C., 1998. The YGR194c (XKS1) geneencodes the xylulokinase from the budding yeast Saccharomyces cerevisiae. FEMS MicrobiolLett. 162, 155-160.
112. Rolland, F., Winderickx, J., Thevelein, J.M., Glucose-sensing and -signalling mechanisms inyeast. FEMS Yeast Res. 2, 183–201.
113. Sato, T., 1999. The E-box DNA binding protein Sgc1p suppresses the gcr2 mutation, which isinvolved in transcriptional activation of glycolytic genes in Saccharomyces cerevisiae. FEBSLett. 463, 307-311.
114. Sauer, U., 2004. High-throughput phenomics: experimental methods for mapping fluxomes.Curr Opin Biotechnol. 15, 58-63.
115. Schmidt, M.C., McCartney, R.R., Zhang, X., Tillman, T.S., Solimeo, H., Wolfl, S., Almonte, C.,Watkins, S.C., 1999. Std1 and Mth1 proteins interact with the glucose sensors to controlglucose-regulated gene expression in Saccharomyces cerevisiae. Mol. Cell. Biol.19, 4561–4571.
116. Schulz, J.M., Watson, A.L., Sanders, R., Ross, K.L., Thoden, J.B., Holden, H.M., Fridovich-Keil, J.L.J., 2004. Determinants of function and substrate specificity in human UDP-galactose4'-epimerase. Biol Chem. 30, 32796-32803.
117. Schutz, M., Gafner, J., 1995. Lower fructose uptake capacity of genetically characterized strainsof Saccharomyces bayanus compared to strains of Saccharomyces cerevisiae: a likely cause ofreduced alcoholic fermentation activity. Am. J. Enol. Vitic. 46, 175-180.

References
153
118. Sellick, C.A., Campbell, R.N., Reece, R.J., 2008. Galactose metabolism in yeast-structure andregulation of the leloir pathway enzymes and the genes encoding them. Int Rev Cell Mol Biol.269, 111-150.
119. Siebert, T.E., Smyth, H.E., Capone, D.L., Neuwohner, C., Pardon, K.H., Skouroumounis, G.K.,Herderich, K.H., Sefton, M.A., Pollnitz, A.P. 2005 Stable isotope dilution analysis of winefermentation products by HS-SPME-GC-MS. Anal Bioanal. Chem. 381, 937-947.
120. Sil, A.K., Alam, S., Xin, P., Ma, L., Morgan, M., Lebo, C.M., Woods, M.P., Hopper, J.E., 1999.The Gal3p-Gal80p-Gal4p Transcription Switch of Yeast: Gal3p Destabilizes the Gal80p-Gal4pComplex in Response to Galactose and ATP. Mol Cell Biol. 19, 7828-7840.
121. Stephanopoulos, G., Aristodou, A., Nielsen, J., 1998. Metabolic Engineering. Academic Press,San Diego.
122. Tachibana, C., 2005. Combined global localization analysis and transcriptome data identifygenes that are directly coregulated by Adr1 and Cat8. Mol Cell Biol. 25, 2138-2146.
123. Tangerman, A., 1997. Highly sensitive gas chromatographic analysis of ethanol in whole blood,serum, urine, and fecal supernatants by the direct injection method. Clin. Chem. 43, 1003-1009.
124. Thevelein, J.M., de Winde, J.H., 1999. Novel sensing mechanisms and targets for the cAMP-protein kinase A pathway in the yeast Saccharomyces cerevisiae. Mol Microbiol. 33, 904-918.
125. Toh, H., Horimoto, K., 2002. Inference of a genetic netwok by a combined approach of clusteranalysis and graphical Gaussian modelling. Bioinformatics. 18, 287-297.
126. Toivari, M.H., Aristidou, A., Ruohonen, L., Penttila, M., 2001. Conversion of xylose to ethanolby recombinant Saccharomyces cerevisiae: importance of xylulokinase (XKS1) and oxygenavailability. Metab. Eng. 3, 236–249.
127. Tschopp, J.F., Emr, S.D., Field, C., and Schekman, R. 1986. GAL2 codes for a membrane-bound subunit of the galactose permease in Saccharomyces cerevisiae. J. Bacteriol. 166, 313-318.
128. Valdes-Hevia, M.D., de la Guerra, R., Gancedo, C., 1989. Isolation and characterization of thegene encoding phosphoenolpyruvate carboxykinase from Saccharomyces cerevisiae. FEBS Lett.258, 313-316.
129. Van Maris, A.J., Abbott, D.A., Bellissimi, E., van den Brink, J., Kuyper, M., Luttik, M.A.,Wisselink, H.W., Scheffers, W.A., van Dijken, J.P., Pronk, J.T., 2006. Alcoholic fermentationof carbon sources in biomass hydrolysates by Saccharomyces cerevisiae: current status. AntonieVan Leeuwenhoek. 90, 391-418.
130. Van Winden, W.A., van Dam, J.C., Ras, C., Kleijn, R.J., Vinke, J.L., van Gulik, W.M., Heijnen,J.J., 2005. Metabolic-flux analysis of Saccharomyces cerevisiae CEN.PK113-7D based on massisotopomer measurements of 13C-labeled primary metabolites, FEMS Yeast Res. 5, 559-568.
131. Velagapudi, V.R., Wittmann, C., Lengauer, T., Talwar, P., Heinzle, E., 2006. Metabolicscreening of Saccharomyces cerevisiae single knockout strains reveals unexpected mobilizationof metabolic potential. Process Biochem. 41, 2170–2179.
132. Velagapudi, V.R., Wittmann, C., Schneider, K., Heinzle, E., 2007. Metabolic Flux Screening ofSaccharomyces cerevisiae Single Knockout Strains on Glucose and Galactose SupportsElucidation of Gene Function. J Biotechnol. 132, 395–404.
133. Von Meyenburg, K., 1969. Katabolit-Repression und der Sprossungszyklus von Saccharomycescerevisiae. Dissertation No. 4279, ETH, Zurich.
134. Vyas, V.K., Kuchin, S., Carlson, M., 2001. Interaction of the repressors Nrg1 and Nrg2 with theSnf1 protein kinase in Saccharomyces cerevisiae. Genetics. 158, 563–572.

References
154
135. Waddell, P.J., Kishino, H., 2000. Correspondence analysis fo genes and tissue types and findinggenetics links from microarray data. Genome Informatics. 11, 83-95.
136. Warringer, J., Ericson, E., Fernandez, L., Nerman, O., Blomberg, A., 2003. High-resolutionyeast phenomics resolves different physiological features in the saline response. Proc Natl AcadSci USA. 100, 15724-15729.
137. Watts, M.T., McDonnald, O.L., 1987. The effect of biological specimen type on the gaschromatographic headspace analysis of ethanol and other volatile compounds. Am J. Clin.Pathol. 87, 79-85.
138. Wehner, E.P., Rao, E., Brendel, M., 1993. Molecular structure and genetic regulation of SFA, agene responsible for resistance to formaldehyde in Saccharomyces cerevisiae andcharacterization of its protein product. Mol Gen Genet. 237, 351-358.
139. Weiss, A., Delproposto, J., Giroux, N.C., 2004. High-throughput phenotypic profiling of gene-environment interactions by quantitative growth curve analysis in Saccharomyces cerevisiae.Anal Biochem. 327, 23-34.
140. Westergaard, S.L., Oliveira, A.P., Bro, C., Olsson, L., Nielsen, J., 2007. A systems biologyapproach to study glucose repression in the yeast Saccharomyces cerevisiae. Biotechnol Bioeng.96, 134-45.
141. Wiechert, W., Mollney, M., Petersen, S., de Graaf, A.A., 2001. A universal framework for 13Cmetabolic flux analysis. Metab. Eng. 3, 265-283.
142. Wieczorke, R., Krampe, S., Weierstall, T., Freidel, K., Hollenberg, C.P., Boles, E., 1999.Concurrent knock-out of at least 20 transporter genes is required to block uptake of hexoses inSaccharomyces cerevisiae. FEBS Lett. 464, 123-128.
143. Winzeler, E.A., 1999. Functional characterization of the S. cerevisiae genome by gene deletionand parallel analysis. Science. 285, 901-905.
144. Wittmann, C., Kim, H.M., Heinzle, E., 2004. Metabolic flux analysis of lysine producingCorynebacterium glutamicum at miniaturized scale. Biotechnol Bioeng. 87, 1-6.
145. Wittmann, C., Heinzle, E., 1999. Mass Spectrometry for Metabolic Flux Analysis. Biotechnol.Bioeng. 62, 739-750.
146. Wittmann, C., Heinzle, E., 2001(a). Novel approach for metabolic flux analysis - application ofMALDI-TOF MS to lysine-producing Corynebacterium glutamicum. Eur. J. Biochem. 268,2441-2455.
147. Wittmann, C., Heinzle, E., 2001(b). MALDI TOF MS for quantification of substrates andproducts in cultivations of lysine producing Corynebacterium glutamicum. Biotechnol. Bioeng.72, 642-647.
148. Wittmann, C., Heinzle, E., 2001(c). Modeling and experimental design for metabolic fluxanalysis of lysine-producing corynebacteria by mass spectrometry. Metabol. Eng. 3, 173-191.
149. Wittmann, C., Heinzle, E., 2002. Genealogy profiling through strain improvement usingmetabolic network analysis – metabolic flux genealogy of several generations of lysineproducing corynebacteria. Appl. Environ. Microbiol. 68, 5843-5859.
150. Wittmann, C., 2002. Metabolic flux analysis using mass spectrometry. Adv. Biochem. Eng.Biotechnol, 74: 39-64.
151. Yang, T.H., 2006. In vivo respirometric 13C flux analysis. Design, Modeling, Optimisation andApplication. PhD thesis, Saarland University, Germany.
152. Yang, T.H., Bolten, C.J., Coppi, M.V., Sun, J., Heinzle, E., 2009. Numerical Bias Estimation forMS Mass Isotopomer Analysis. Anal Biochem. 388, 192-203.

References
155
153. Yang, X., 1992. A protein kinase substrate identified by the two-hybrid system. Science. 257,680-682.
154. Yang, Z., Bisson, L.F., 1996. The SKS1 protein kinase is a multicopy suppressor of the snf3mutation of Saccharomyces cerevisiae. Yeast. 12, 1407-1419.
155. Zamboni, N., Sauer, U., 2004. Model-independent fluxome profiling from 2H and 13Cexperiments for metabolic variant discrimination. Genome Biol. 5, R99.
156. Zhou, H., Winston, F., 2001. NRG1 is required for glucose repression of the SUC2 and GALgenes of Saccharomyces cerevisiae. BMC Genetics. 2, 5.

Appendicies
156
99.. AAPPPPEENNDDIICCEESS
99..11 SSYYMMBBOOLLSS AANNDD AABBBBRREEVVIIAATTIIOONNSS
µ Specific growth rateqO2 Specific oxygen uptake rateqhexose Specific hexose uptake rateqethanol Specific ethanol production rateAcCoA Acetyl CoAADP Adenosine diphosphateAKG -KetoglutarateALA AlanineARG ArginineASN AsparagineASP Aspartic acidATP Adenosine triphosphateCIT CitrateDNA Deoxyribonucleic acidE4P Erythrose-4-phosphateF6P Fructose-6-phosphateFAD Flavin adenine dinucleotide oxidisedFADH Flavin adenine dinucleotide reducedFUM FumarateG6P Glucose-6-phosphateGAP Glyceraldehyde-3-phosphateGLC GlucoseGLU Glutamic acidGLY GlycineHIS HistidineILE IsoleucineLAC LactateLEU LeucineLYS LysineKLa Volumetric mass transfer coeffficientMTP Microtiter plateNAD Nicotinamide adenine dinucleotide oxidisedNADH Nicotinamide adenine dinucleotide reducedNADP Nicotinamide adenine dinucleotide phosphate oxidisedNADPH Nicotinamide adenine dinucleotide phosphate reducedOAA OxaloacetateOUR Oxygen uptake rateP5P Pentose-5-phosphatePG PhosphoglyceratePHE PhenylalaninePPP Pentose phosphate pathwayPYR PyruvateRNA Ribonucleic acidS7P Sedoheptulose-7-phosphateSUC SuccinateTCA Tricarboxylic acidYX/S Biomass yield on substrate
Appendicies
157
YE/S Ethanol yield on substarteYX/O Biomass yield on oxygen
99..22 BBEERRKKEELLEEYY MMAADDOONNNNAA PPRROOGGRRAAMM FFOORR KKLLAA EESSTTIIMMAATTIIOONN{Created by Prof.Elmar Heinzle. Berkeley Madonna program for calculation of kla using microtiterplate with integrated oxygen sensor. Oxygen removed by addition of dithionite. After consumption ofdithionite which reacts rapidly with oxygen, oxygen concentration rises again}DT = 0.01DTMAX = 0.1DTOUT = 0.1TOLERANCE = 0.001KLA = 0.001 ;volumetric liquid phase mass transfer coefficient (h-1)CLS = 100 ;Saturation concentration of Oxygen (%)init CS = 0.5 ;Initial concentration of Dithionite (mM)k = 200 ;Rate constant for dithionite reactioninit CL = 0 ;Initial concentration of oxygen{Oxygen balance for dithionite oxidation}DCLDT = KLA*(CLS-CL)-k*CL*CSd/dt (CL) = DCLDT{Rate equation for dithionite oxidation}d/dt (CS) = -k*CL*CSLimit CL > = 0
9.3 BBEERRKKEELLEEYY MMAADDOONNNNAA PPRROOGGRRAAMM FFOORR YYXX//OO EESSTTIIMMAATTIIOONN{Created by Prof.Elmar Heinzle Yeast growth and ethanol production assumptions: 1) constant spe-cific growth rate; 2) constant biomass yield; 3) constant ethanol yield; 4) constant kLa; X biomass g/L;G glucose g/L; E ethanol g/L; O oxygen g/L}METHOD STIFFSTARTTIME = 0STOPTIME = 15DT = 0.02Tolerance = 0.0001muem = 0.3 ;h-1
KSG = 0.1 ;g/LKS2 = 0.1 ;g/LKSO = 7e-5 ;g/LYXG = 0.3 ;gX/gSOsat = 7.53e-3 ;gO/100% saturationYEX = 0.2 ;gE/gXrevap_H2O = 1e-3 ;g/hYXO = 1 ;gX/gOVinit = 0.15e-3 ;Lrho = 1000 ;g/Lkevap_E = 5.2e-6 ;L*h-1
Exp_evap = 2kLa = 1.45 ;h-1
Xinit = 0.024 ;g/LGinit = 22 ;g/LEinit = 0 ;g/LOinit = 7e-3

Appendicies
158
INIT V = VinitINIT XV = Xinit*VinitINIT GV = Ginit*VinitINIT EV = Einit*VinitINIT OV = Oinit*VinitINIT ENV = Einit*VinitrEtOH_evap = kevap_E*E^Exp_evapV' = (-revap_H2O - rEtOH_evap)/rhoGkin = G/(KSG+G)Okin = O/(KSO+O)mue = muem*Gkin*OkinrX = mue*XrXtot = rX*VXV' = rXtotX = XV/VGV' = -rXtot/YXGG = GV/VqGlc = mue/YXGEV' = rXtot*YEX - rEtOH_evaplimit EV> = 1e-10E = EV/VOV' = kLa*(Osat-O)*V - rXtot/YXOlimit OV> = 0O = OV/VOproz = O/Osat*KprozKproz = 100ENV' = rXtot*YEXEN = ENV/V
99..44 PPRROOGGRRAAMM FFOORR EETTHHAANNOOLL CCOORRRREECCTTIIOONN{Created by Prof.Elmar Heinzle Yeast growth and ethanol production assumptions:1) constant specific growth rate2) constant biomass yield3) constant ethanol yield4) constant klaX biomass g/L; G glucose g/L; E ethanol g/L; O oxygen g/L}METHOD STIFFSTARTTIME = 0STOPTIME = 30DT = 0.02Tolerance = 0.0001muem = 0.3 ;h-1
KSG = 0.1 ;g/LKSO = 7e-5 ;g/LYXG = 0.3 ;gX/gSOsat = 7e-3 ;gO/100% saturationYEX = 0.2 ;gE/gXrevap_H2O = 1e-3 ;g/hYXO = 1 ;gX/gOVinit = 0.15e-3 ;Lrho = 1000 ;g/Lkevap_E = 0.052 ;L*h-1
Appendicies
159
kLa = 0.246 ;h-1
Xinit = 0.024 ;g/LGinit = 22 ;g/LEinit = 0 ;g/LOinit = 7e-3INIT V = VinitINIT XV = Xinit*VinitINIT GV = Ginit*VinitINIT EV = Einit*VinitINIT ENV = Einit*VinitrEtOH_evap = kevap_E*EV' = (-revap_H2O - (rEtOH_evap*V))/rhoGkin = G/(KSG+G)Okin = 1 ;O/(KSO+O)mue = muem*Gkin*OkinrX = mue*XrXtot = rX*VXV' = rXtotX = XV/VGV' = -rXtot/YXGG = GV/VqGlc = mue/YXGEV' = rXtot*YEX -(rEtOH_evap*V)limit EV> = 1e-10E = EV/VENV' = rXtot*YEXEN = ENV/V
99..55 MMAATTLLAABB PPRROOGGRRAAMMSS FFOORR SSOOLLVVIINNGG CCAARRBBOONN MMAASSSSIISSOOTTOOPPOOMMEERR DDIISSTTRRIIBBUUTTIIOONNSS AANNDD CCOORRRREECCTTIINNGGNNAATTUURRAALL IISSOOTTOOPPIICC EEFFFFEECCTTSS FFOORR EETTHHAANNOOLL
% - High-Level Artificial Intelligence Technology (HiLAIT) by Dr.Tae hoon Yang% << OHmasscorr.m >> Version 1.00 .............................................................% - solving carbon mass isotopomer distributions for ethanol% - Multiple measurement of ethaol MALDI-derivatives (m; m+1; m+2)% - nonlinear least squares minimization using fmincon% - input mat-file% input.mat: << MSintmat >> measured mass isotopomer intensities% - output mat-file% output.mat: << mdvcorr >> carbon mass isotopomer distributions.% - DO NOT SUPPLY NORMALIZED DATA!% ............................................................................................. echo on; disp(' ')echo offwarning off% 3-times clear clear; clear globals; clear all % molecule structure and name of GCMS fragments load input % check size of matrices (multiple measurement of ETOH)
Appendicies
160
[rMDV, cMDV] = size(MSintmat); % numerical calculation MDV of carbon mass isotopomers % structure identification CCHONSiS = [2, 6, 9, 4, 4, 0, 0]; global sumerrcounter sumerror sumerrcounter = 1;% normalization for iteration = 1: cMDV clear global Matcorr MDVexp sumvec1 Weight clear MSnorm sumvector idvcar mdvcar mdv skeleton Mcorr MDVexp xmdv global Matcorr MDVexp sumvec1 Weight sumvector = ones(1,3); MSnorm = MSintmat(:,iteration)/(sumvector*MSintmat(:,iteration))% size of positional carbon isotopomer distribution idvcar = zeros(2^CCHONSiS(1),1); mdvcar = zeros(CCHONSiS(1)+1,1);% calculation of additional mass distribtion except carbon skeleton of the metabolite [mdv,skeleton] = mdvresidue(idvcar, CCHONSiS);% matrix composition Mcorr = zeros(skeleton+1, length(mdvcar)); for k = 1:(skeleton+1) Mcorr(k:(k+length(mdv)-1),k) = mdv; end% experimental MDV data Matcorr = Mcorr(1:3,:)% optimization process to solve carbon mass isotopomer distribution MDVexp = MSnorm; xmdv = mdveqsolver(Matcorr, MDVexp, mdvcar); sumerrcounter = sumerrcounter+1; disp('>> Difference between measured and calculated Mass Isotopomer Distribution .......') Difference = MDVexp - (Matcorr*xmdv/sum(Matcorr*xmdv)) disp('..................................................................................')% resize of xmdv to horizontal concatenation (maximum allowed carbon = 12) mdvcorr(:,iteration) = xmdv end filename = input('Filename to save results e.g. 25-OCT-04 >> ','s'); save (['output_',filename], 'mdvcorr') copyfile('input.mat',['input_',filename,'.mat']) clear all warning off MATLAB:mir_warning_variable_used_as_function warndlg = warndlg('Created By TAE HOON YANG September 2004','HiLAIT Technology'); pause(1.5) close(warndlg)
********************************************************************************function xmdv = mdveqsolver(Matcorr, MDVexp, mdvcar);
% << mdveqsolver.m >> Version 1.00 ...........................................% - solving equation system of carbon mass isotopomer distributions using% nonlinear least-square approach.% - High-Level Artificial Intelligence Technology (HiLAIT) by Tae hoon Yang% ............................................................................% Optimization to solve carbon isotopomer distributions global sumvec1 Weight sumerrcounter sumerror

Appendicies
161
sumvec1 = ones(1,length(mdvcar));% initial guess if length(MDVexp) ~= length(mdvcar) xmdv0 = zeros(length(mdvcar),1); else xmdv0 = MDVexp; end% linear equality constraint Aeq = sumvec1; beq = 1;% lower and upper bounds lb = zeros(length(mdvcar),1); ub = ones(length(mdvcar),1);for optim = 1:1 loopstop = 0; % loopstop deactivation exitflag = 1; % exitflag = 1 for starting iteration if optim == 1 tolx = 1e-15; tolfun = 1e-30; Weight = eye(length(MDVexp),length(MDVexp)); end if optim > 1 xmdv0 = xmdv; if rcond(diag(residabs)) <= 2*eps Weight = pinv(diag(residabs)); else Weight = diag(residabs)\eye(length(MDVexp),length(MDVexp)); end end tolerror = 1; flagone = 1; flagzero = 1; displaying = 'iter';% logical loop operation (Yang et al. 2004. Met. Eng.) while loopstop ~= 1 % Optimization setting and function designation options = optim-set('Display',displaying,'LargeScale','off','GradObj','on','TolX',tolx,'TolFun',tolfun,'TolCon',1e-100, ... 'DiffMaxChange',0.1,'DiffMinChange',1e-10,... 'MaxFunEvals',50,'MaxIter',50,... 'LevenbergMarquardt','on'); [xmdv,fval,exitflag,output,lambda,grad] = fmin-con(@getmdv,xmdv0,[],[],Aeq,beq,lb,ub,[],options); % Successful Optimization: Overwriting results if exitflag > 0 % sum of mdv check errmdv = 0; sumxmdv = sum(xmdv); minusmdv = any(xmdv < 0); % Finalizing conditions if sumxmdv >= 1+(1e-14) | sumxmdv <= 1-(1e-14) | minusmdv ~= 0 % > 0.01 % Error ofSum of mdv or Negativ Frequency errmdv = 1; else

Appendicies
162
errmdv = 0; end if errmdv == 1 if flagone == 1 disp(' ') disp('... Please wait.. HiLAIT is trying to isolate the system root...') disp(' ') flagzero = 1; flagone = 0; displaying ='off'; end xmdvcheck = abs(xmdv); % no negative distribution allowed sumxmdv = sum(xmdvcheck); while abs(1-sumxmdv) >= 1e-14 % no significant digits error xmdvcheck = xmdvcheck/sum(xmdvcheck); sumxmdv = sum(xmdvcheck); end counter = 0; while sumxmdv ~= 1 & counter ~= 20 xmdvcheck(1) = xmdvcheck(1) + (1-sumxmdv); sumxmdv = sum(xmdvcheck); counter = counter + 1; end disp(' ') disp('>>>> TOLERANCE dereased') tolx = tolx*0.1; tolfun = tolfun*0.1; xmdv0 = xmdvcheck; loopstop = 0; clear xmdvcheck sumxmdv elseif errmdv == 0 xmdvfin = xmdv; disp(' ') disp('... System root found by HiLAIT technology ...') disp(' ') xmdvcheck = abs(xmdv); % no negative distribution allowed sumxmdv = sum(xmdvcheck); while abs(1-sumxmdv) >= 1e-14 % no significant digits error xmdvcheck = xmdvcheck/sum(xmdvcheck); sumxmdv = sum(xmdvcheck); end counter = 0; while sumxmdv ~= 1 & counter ~= 20 xmdvcheck(1) = xmdvcheck(1) + (1-sumxmdv); sumxmdv = sum(xmdvcheck); counter = counter + 1; end xmdv = xmdvcheck; loopstop = 1; clear xmdvcheck sumxmdv end elseif exitflag ~= 1 if flagzero == 1 disp(' ')

Appendicies
163
disp('... Lost in the space.. HiLAIT activated...') disp(' ') flagone = 1; flagzero = 0; displaying ='off'; end xmdvcheck = abs(xmdv); % no negative distribution allowed sumxmdv = sum(xmdvcheck); while abs(1-sumxmdv) >= 1e-14 % no significant digits error xmdvcheck = xmdvcheck/sum(xmdvcheck); sumxmdv = sum(xmdvcheck); end counter = 0; while sumxmdv ~= 1 & counter ~= 20 xmdvcheck(1) = xmdvcheck(1) + (1-sumxmdv); sumxmdv = sum(xmdvcheck); counter = counter + 1; end xmdv0 = xmdvcheck; loopstop = 0; tolerror = tolerror+1; if tolerror > 5 tolx = tolx*10; tolfun = tolfun*10; tolerror = 1; end end end residabs = abs(MDVexp -(Matcorr*xmdv/sum(Matcorr*xmdv))); sumerror(sumerrcounter,1) = sum(residabs)end
********************************************************************************function [mdv,skeleton] = mdvresidue(idvcar, CCHONSiS);% << mdvresidue.m >> Version 1.0.............................................................................% - idvcar: zero vector% - CCHONSiS: molecular formular C[a,molecule]C[b,TBDMS]H[c]O[d]N[e]Si[f]S[g] as an array [ab c d e f g]% - since% - see Rosman and Taylor (1998) Isotopic Compositions of the Elements 1997% Representative isotopic composition% ..........................................................................................................mCarbon = [1.2e+1;1.3003355e+1];fCarbon = [9.893e-1;1.07e-2]; fCarbon = fCarbon/sum(fCarbon);mHydrogen = [1.0078250; 2.0141020];fHydrogen = [9.99885e-1;1.15e-4]; fHydrogen = fHydrogen/sum(fHydrogen);mNitrogen = [1.4003074e+1;1.5000109e+1];fNitrogen = [9.9632e-1; 3.68e-3]; fNitrogen = fNitrogen/sum(fNitrogen);mOxygen = [1.5994915e+1;1.6999131e+1;1.7999159e+1];fOxygen = [9.9757e-1;3.8e-4;2.05e-3]; fOxygen = fOxygen/sum(fOxygen);mSilicon = [2.7976928e+1;2.8976496e+1;2.9973772e+1];fSilicon = [9.22297e-1;4.6832e-2;3.0872e-2]; fSilicon = fSilicon/sum(fSilicon);mSulfur = [32;33;34;36];fSulfur = [9.493e-1;7.6e-3;4.29e-2;2e-5]; fSulfur = fSulfur/sum(fSulfur);
Appendicies
164
if CCHONSiS(1) ~= 0 for k = 1:length(idvcar) binind = dec2bin(k-1); clear mass for j = 1:length(binind); mass(j) = str2num(binind(j)); end massind(k,1) = sum(mass)+1; endendskeleton = CCHONSiS(1);CHONSiS = CCHONSiS(2:7);atoms = {'Carbon','Hydrogen','Oxygen','Nitrogen','Silicon','Sulfur'};[CHONSiS, indexist] = sort(CHONSiS);atoms = atoms(indexist);nonzero = find(CHONSiS ~= 0);molstructure = CHONSiS(nonzero);isotopes = atoms(nonzero);clear CHONSiS atoms indexist nonzerofor atomloop = 1:length(molstructure) if atomloop == 1 if molstructure(atomloop) == 1 eval(['mdv_temp = f',char(isotopes(atomloop)),';']); else for subloop_01 = 1:molstructure(atomloop) if subloop_01 == 1 eval(['mdv_temp = f',char(isotopes(atomloop)),';']); else clear mdmtemp eval(['mdm_temp = mdv_temp*f',char(isotopes(atomloop)),''';']); clear mdv_temp mdm_temp = fliplr(mdm_temp'); [row,col] = size(mdm_temp); diagmax = col-1; diagmin = 1-row; diagind = fliplr([diagmin:1:diagmax]); for subloop_02 = 1:length(diagind); mdv_temp(subloop_02,1) = sum(diag(mdm_temp,diagind(subloop_02))); end end end end else for subloop_01 = 1:molstructure(atomloop) clear mdm_temp eval(['mdm_temp = mdv_temp*f',char(isotopes(atomloop)),''';']); clear mdv_temp mdm_temp = fliplr(mdm_temp'); [row,col] = size(mdm_temp); diagmax = col-1; diagmin = 1-row; diagind = fliplr([diagmin:1:diagmax]); for subloop_02 = 1:length(diagind); mdv_temp(subloop_02,1) = sum(diag(mdm_temp,diagind(subloop_02))); end end

Appendicies
165
endendmdv = mdv_temp;clear mdv_temp;
*******************************************************************************function [f,g] = getmdv(xmdv);% << getmdv.m >> Version 1.00 ..............................................% - solving equation system of carbon mass isotopomer distributions using% nonlinear least-square approach.% - High-Level Artificial Intelligence Technology (HiLAIT) by Tae hoon Yang% ..........................................................................global sumvec1 Matcorr MDVexp Weight% objective function f = (MDVexp-(Matcorr*xmdv/(sumvec1*Matcorr*xmdv)))'*Weight*(MDVexp-(Matcorr*xmdv/(sumvec1*Matcorr*xmdv)));% output function's derivative Jacsys = ((Matcorr-(Matcorr*xmdv)*(sumvec1*Matcorr)/(sumvec1*Matcorr*xmdv))/(sumvec1*Matcorr*xmdv)); if nargout > 1 % analytical gradient g = ((Matcorr*xmdv/(sumvec1*Matcorr*xmdv))-MDVexp)'*(Weight'+Weight)*eye(length(MDVexp),length(MDVexp))*Jacsys; end********************************************************************************
99..66 MMAATTLLAABB PPRROOGGRRAAMM FFOORR FFLLUUXX CCAALLCCUULLAATTIIOONNSS
% Created by Dr.Tae hoon Yangglobal Ndata StMat StMatex kload inputs % save inputs StMat StMatex% StMat: Stoichiometric matrix for intracellular fluxes% StMatex: Stoichiometric matrix for effluxes and anabolic fluxesdisp(' ')Ndata = input('The Number of Data Sets ? >> '); % 1for k = 1:Ndata % putmatrix MeasMat (input qs, qp, µ, ppp) eval(['load meas',int2str(k)]); % save meas1 MeasMat
% MeasMat : measurement matrix [row, col] = size(MeasMat); % MeasVec: particular measurement vector for kk = 1:col MeasVec = MeasMat(:,kk); StMat(1,1) = -1/MeasVec(4,1); StMat(3,1) = (1-MeasVec(4,1))/MeasVec(4,1); intflux = inv(StMat)*StMatex*MeasVec(1:3); FluxMat(:,kk) = intflux; clear intflux end FluxMat savename = ['save result',int2str(k),' FluxMat']; eval(savename) clear

Appendicies
166
global Ndata StMat StMatex kend
99..77 PPRROOGGRRAAMM FFOORR QQPP--GGRRAAPPHH AANNAALLYYSSIISS
# Created by Dr. Jing Tang# function for qpgraph analysis# Input:# data:# The column is the one defining the random variables# The row defines samples(conditions)# variable_name:# dim(variable_name) = [1 colnum]# sample_name:# dim(sample_name) = [1 rownum]#source("http://bioconductor.org/biocLite.R")#biocLite("Rgraphviz")#library(Rgraphviz)#setwd("d:/Obesity/data")#data<-read.table("discordant_preprocessed.txt",header=F,sep=",",quote="");#data<-t(data)#variable_name<-read.table("variable_name.txt",header=F,sep="\t",quote="");#sample_name<-read.table("sample_name.txt",header=F,sep="\t",quote="")#variable_name<-t(variable_name)#sample_name<-t(sample_name)
qpgraph<-function(data, variable_name, sample_name, t){
colnames(data)<-variable_name rownames(data)<-sample_name
# averageNrr avgnrr.estimates<-qpAvgNrr(data,long.dim.are.variables=FALSE)
g<-qpGraph(avgnrr.estimates, threshold=t, return.type="graphNEL") gSymbols<-g nodes(gSymbols)<-as.character(variable_name)
# chech the clique number # browser()
cliquenumber<-qpCliqueNumber(g) if(cliquenumber > dim(data)[1])
stop("clique number larger than the sample size, pac estiamtion unreliable, try smallerthreshold")
else { # browser() pac.estimates<-qpPAC(data,g,return.K=FALSE,long.dim.are.variable=FALSE, verbose=FALSE) #nrrs<-avgnrr.estimates #pacs.rho<-pac.estimates$R #pacs.pva<-pac.estimates$P
Appendicies
167
pcc.estimates<-qpPCC(data,long.dim.are.variable=FALSE) #pccs.rho<-pcc.estimates$R #pccs.pva<-pcc.estimates$P
edL<-edges(g)[names(edges(g))[unlist(lapply(edges(g),length))>0]] edM<-matrix(unlist(sapply(names(edL),function(x)t(cbind(x,edL[[x]])),USE.NAMES=FALSE)),ncol=2,byrow=TRUE) edM <- matrix(as.numeric(edM), nrow=nrow(edM), ncol=ncol(edM))
idx1<-edM[,1] idx2<-edM[,2]
nrrs<-avgnrr.estimates[cbind(idx1,idx2)] pacs.rho<-pac.estimates$R[cbind(idx1,idx2)] pacs.pva<-pac.estimates$P[cbind(idx1,idx2)]
pccs.rho<-pcc.estimates$R[cbind(idx1,idx2)]pccs.pva<-pcc.estimates$P[cbind(idx1,idx2)]
network<-data.frame(AvgNRR=round(nrrs,digits=2),PCC.rho=round(pccs.rho,digits=2),PCC.pva=format(pccs.pva,scientific=TRUE,digit=3),PAC.rho=round(pacs.rho,digits=2),PAC.pva=format(pacs.pva,scientific=TRUE,digits=3))
networkSymbols<-network
rownames(network)<-paste(edM[,1],edM[,2],sep=" -> ")
networkSymbols[sort(networkSymbols[["AvgNRR"]],index.return=TRUE)$ix,]summary<-network[sort(network[["AvgNRR"]],index.return=TRUE)$ix,]
edM1<-matrix(unlist(sapply(names(edL),function(x)t(cbind(x,edL[[x]])),USE.NAMES=FALSE)),ncol=2,byrow=TRUE) edSymbols<-cbind(as.character(variable_name[1,edM[,1]]),as.character(variable_name[1,edM[,2]])) rownames(networkSymbols)<-paste(edSymbols[,1],edSymbols[,2],sep=" -> ")
summary<-network[sort(network[["AvgNRR"]],index.return=TRUE)$ix,] summarySymbols<-networkSymbols[sort(network[["AvgNRR"]],index.return=TRUE)$ix,]
write.csv(summarySymbols,"summarySymbols1.csv")write.csv(summary,"summary1.csv")
x11()g<-layoutGraph(g)gSymbols<-layoutGraph(gSymbols)graph.par(list(edges=list(col="purple")))nodeRenderInfo(g)<-list(shape="ellipse",fill="lightgray", textCol="black", fontsize=10,lwd=1)rownames(network)<-paste(edM[,1],edM[,2],sep="~")edgeweight<-matrix()for(i in 1:numEdges(g)){edgeweight[i]<-network$AvgNRR[which(rownames(network)==as.character(edgeNames(g)[i]))]}names(edgeweight)<-as.character(edgeNames(g))edgeRenderInfo(g)<-list(lwd=round(t*10-edgeweight*10))renderGraph(g)
x11()

Appendicies
168
graph.par(list(edges=list(col="purple")))nodeRenderInfo(gSymbols)<-list(shape="ellipse", textCol="black", fontsize=26,lwd=2)rownames(networkSymbols)<-paste(edSymbols[,1],edSymbols[,2],sep="~")edgeweightSymbols<-matrix()for(i in 1:numEdges(g)){ edgeweightSymbols[i]<-networkSym-bols$AvgNRR[which(rownames(networkSymbols)==as.character(edgeNames(gSymbols)[i]))]}names(edgeweightSymbols)<-as.character(edgeNames(gSymbols))edgeRenderInfo(gSymbols)<-list(lwd=round(t*10-edgeweightSymbols*10))renderGraph(gSymbols)
# adjacency matrixg_adj<-as(g,"matrix")colnames(g_adj)<-variable_namerownames(g_adj)<-variable_name} }
99..88 SSTTOOIICCHHIIOOMMEETTRRIICC MMAATTRRIICCEESS UUSSEEDD FFOORR MMEETTAABBOOLLIICCFFLLUUXX CCAALLCCUULLAATTIIOONNSS
vbvv 61
00110000000011000000001000101000000001100000000001100000000001100010000001100
01110000120011000000100102000000100000000001
74
656
PSPE
OAASUCAKG
AcCoAPYRGAP
PFPPPG
S
00023.00065.00000096.00057.20022.11008.00000011.00024.201
74
656
PSPE
OAASUCAKG
AcCoAPYRGAP
PFPPPG
b
14
13
12
11
10
9
8
7
5
4
2
vvvvvvvvvvv
vVector of fluxes – v Net specific excretion rate vector – b (Signs are changed)

Appendicies
169
99..88 GGRROOWWTTHH PPRROOFFIILLEESS OONN GGLLUUCCOOSSEEGrowth profiles of S.cerevisae single knockout strains grown on glucose. Mutants were cultivated in a 96-well microtite plates with immobilized
oxygen sensors. Natural log of optical density [Ln (OD)] was plotted against time [t]. Only regions with clear exponential growth are shown.
CAT8
y = 0.3497x - 5.1958R2 = 0.9984
-3.5
-3
-2.5
-2
-1.5
-1
-0.5
00 2 4 6 8 10 12 14 16
Time (h)
Ln (O
D)
CYB2
y = 0.2791x - 3.8538R2 = 0.9979
-3.5
-3
-2.5
-2
-1.5
-1
-0.5
00 2 4 6 8 10 12 14 16
Time (h)
Ln (O
D)
DLD2
y = 0.3026x - 4.536R2 = 0.9977
-3.5
-3
-2.5
-2
-1.5
-1
-0.5
00 2 4 6 8 10 12 14 16
Time (h)
Ln (O
D)
FBP1
y = 0.2247x - 3.7209R2 = 0.9989
-3.5
-3
-2.5
-2
-1.5
-1
-0.5
00 2 4 6 8 10 12 14 16
Time (h)
Ln (O
D)
FBP26
y = 0.2875x - 4.1475R2 = 0.9994
-3.5
-3
-2.5
-2
-1.5
-1
-0.5
00 2 4 6 8 10 12 14 16
Time (h)
Ln (O
D)
GAD1
y = 0.3117x - 4.3829R2 = 0.9996
-3.5
-3
-2.5
-2
-1.5
-1
-0.5
00 2 4 6 8 10 12 14 16
TIme (h)
Ln (O
D)
GAL10
y = 0.3379x - 5.2791R2 = 0.9969
-3.5
-3
-2.5
-2
-1.5
-1
-0.5
00 2 4 6 8 10 12 14 16
Time (h)
Ln (O
D)
GAL4
y = 0.2796x - 4.0223R2 = 0.9975
-3.5
-3
-2.5
-2
-1.5
-1
-0.5
00 2 4 6 8 10 12 14 16
Time (h)
Ln (O
D)
GAL7
y = 0.3057x - 4.8857R2 = 0.9993
-3.5
-3
-2.5
-2
-1.5
-1
-0.5
00 2 4 6 8 10 12 14 16
Time (h)
Ln (O
D)
GLK1
y = 0.3198x - 4.9585R2 = 0.9993
-3.5
-3
-2.5
-2
-1.5
-1
-0.5
00 2 4 6 8 10 12 14 16
Time (h)
Ln (O
D)
MIG2
y = 0.2877x - 3.4556R2 = 0.9974
-3.5
-3
-2.5
-2
-1.5
-1
-0.5
00 2 4 6 8 10 12 14 16
Time (h)
Ln (O
D)
MSN4
y = 0.2936x - 3.5855R2 = 0.9953
-3.5
-3
-2.5
-2
-1.5
-1
-0.5
00 2 4 6 8 10 12 14 16
Time (h)
Ln (O
D)
PCK1
y = 0.3376x - 4.5946R2 = 0.9989
-3.5
-3
-2.5
-2
-1.5
-1
-0.5
00 2 4 6 8 10 12 14 16
Time (h)
Ln (O
D)
PFK26
y = 0.2425x - 3.8462R2 = 0.9903
-3.5
-3
-2.5
-2
-1.5
-1
-0.5
00 2 4 6 8 10 12 14 16
Time (h)
Ln (O
D)
PFK27
y = 0.2862x - 3.7272R2 = 0.9946
-3.5
-3
-2.5
-2
-1.5
-1
-0.5
00 2 4 6 8 10 12 14 16
Time (h)
Ln (O
D)
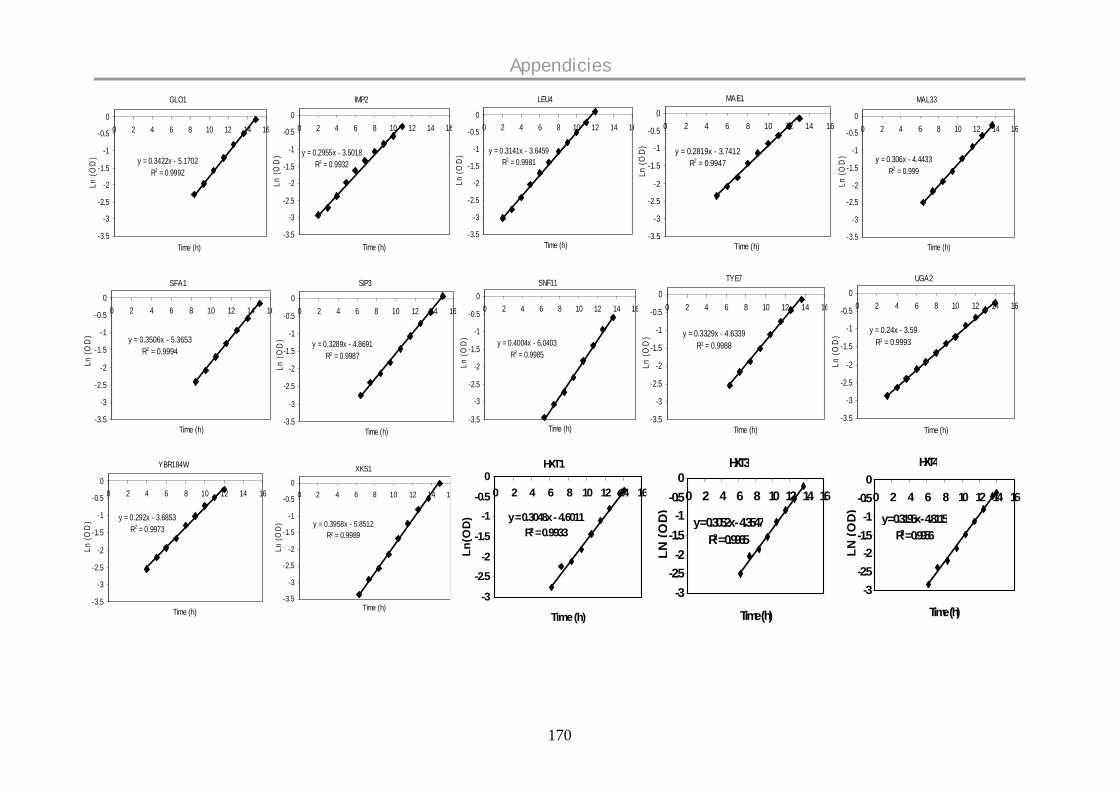
Appendicies
170
GLO1
y = 0.3422x - 5.1702R2 = 0.9992
-3.5
-3
-2.5
-2
-1.5
-1
-0.5
00 2 4 6 8 10 12 14 16
Time (h)
Ln (O
D)
IMP2
y = 0.2955x - 3.5018R2 = 0.9932
-3.5
-3
-2.5
-2
-1.5
-1
-0.5
00 2 4 6 8 10 12 14 16
Time (h)
Ln (O
D)
LEU4
y = 0.3141x - 3.6459R2 = 0.9981
-3.5
-3
-2.5
-2
-1.5
-1
-0.5
00 2 4 6 8 10 12 14 16
Time (h)
Ln (O
D)
MAE1
y = 0.2819x - 3.7412R2 = 0.9947
-3.5
-3
-2.5
-2
-1.5
-1
-0.5
00 2 4 6 8 10 12 14 16
Time (h)
Ln (O
D)
MAL33
y = 0.306x - 4.4433R2 = 0.999
-3.5
-3
-2.5
-2
-1.5
-1
-0.5
00 2 4 6 8 10 12 14 16
Time (h)
Ln (O
D)
SFA1
y = 0.3506x - 5.3653R2 = 0.9994
-3.5
-3
-2.5
-2
-1.5
-1
-0.5
00 2 4 6 8 10 12 14 16
Time (h)
Ln (O
D)
SIP3
y = 0.3289x - 4.8691R2 = 0.9987
-3.5
-3
-2.5
-2
-1.5
-1
-0.5
00 2 4 6 8 10 12 14 16
Time (h)
Ln (O
D)
SNF11
y = 0.4004x - 6.0403R2 = 0.9985
-3.5
-3
-2.5
-2
-1.5
-1
-0.5
00 2 4 6 8 10 12 14 16
Time (h)
Ln (O
D)
TYE7
y = 0.3329x - 4.6339R2 = 0.9988
-3.5
-3
-2.5
-2
-1.5
-1
-0.5
00 2 4 6 8 10 12 14 16
Time (h)
Ln (O
D)
UGA2
y = 0.24x - 3.59R2 = 0.9993
-3.5
-3
-2.5
-2
-1.5
-1
-0.5
00 2 4 6 8 10 12 14 16
Time (h)
Ln (O
D)
YBR184W
y = 0.292x - 3.6853R2 = 0.9973
-3.5
-3
-2.5
-2
-1.5
-1
-0.5
00 2 4 6 8 10 12 14 16
Time (h)
Ln (O
D)
XKS1
y = 0.3958x - 5.8512R2 = 0.9989
-3.5
-3
-2.5
-2
-1.5
-1
-0.5
00 2 4 6 8 10 12 14 16
Time (h)
Ln (O
D)
HXT1
y = 0.3048x - 4.6011R2 = 0.9933
-3
-2.5
-2
-1.5
-1-0.5
00 2 4 6 8 10 12 14 16
Time (h)
Ln(O
D)
HXT3
y = 0.3052x - 4.3547R2 = 0.9965
-3-2.5-2
-1.5-1
-0.50
0 2 4 6 8 10 12 14 16
Time (h)
LN (O
D)
HXT4
y = 0.3195x - 4.8115R2 = 0.9956
-3-2.5-2
-1.5-1
-0.50
0 2 4 6 8 10 12 14 16
Time (h)
LN (O
D)
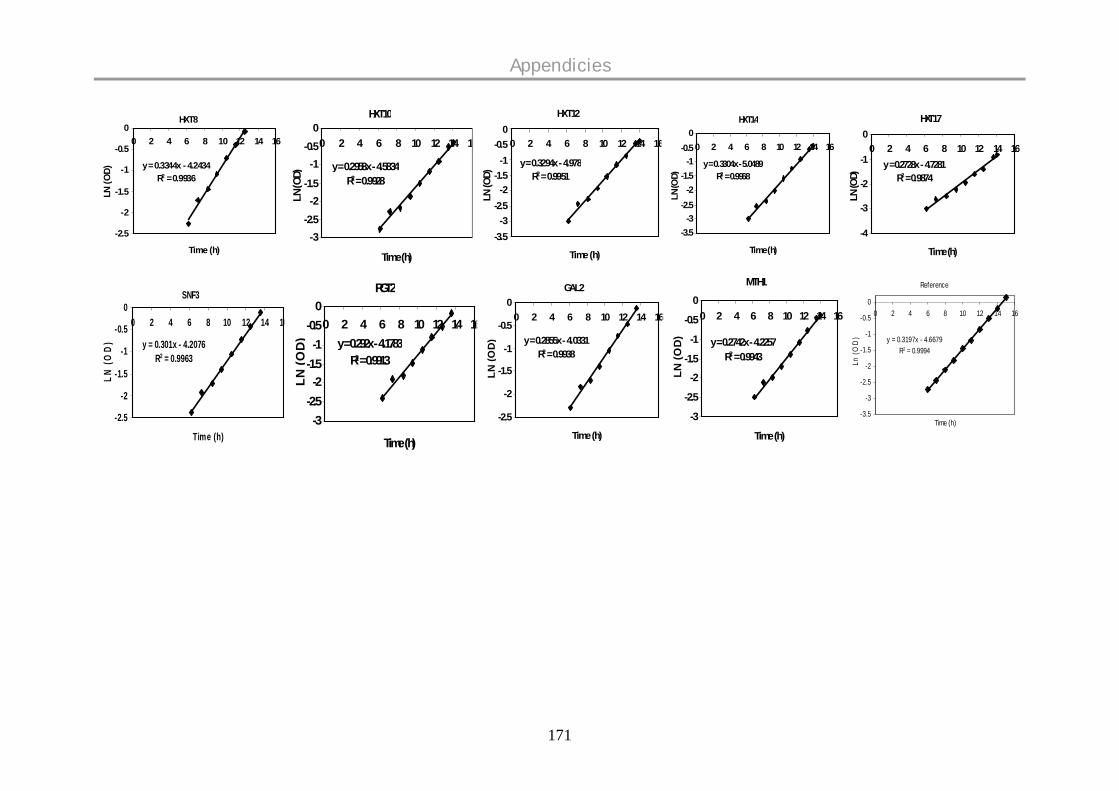
Appendicies
171
HXT8
y = 0.3344x - 4.2434R2 = 0.9936
-2.5
-2
-1.5
-1
-0.5
00 2 4 6 8 10 12 14 16
Time (h)
LN (O
D)HXT10
y = 0.2958x - 4.5834R2 = 0.9928
-3-2.5-2
-1.5
-1-0.5
00 2 4 6 8 10 12 14 16
Time (h)
LN (O
D)
HXT12
y = 0.3294x - 4.978R2 = 0.9951
-3.5-3
-2.5-2
-1.5-1
-0.50
0 2 4 6 8 10 12 14 16
Time (h)
LN (O
D)
HXT14
y = 0.3304x - 5.0489R2 = 0.9968
-3.5-3
-2.5-2
-1.5-1
-0.50
0 2 4 6 8 10 12 14 16
Time (h)
LN (O
D)
HXT17
y = 0.2728x - 4.7281R2 = 0.9874
-4
-3
-2
-1
00 2 4 6 8 10 12 14 16
Time (h)
LN (O
D)
Reference
y = 0.3197x - 4.6679R2 = 0.9994
-3.5
-3
-2.5
-2
-1.5
-1
-0.5
00 2 4 6 8 10 12 14 16
Time (h)
Ln (O
D)
SNF3
y = 0.301x - 4.2076R2 = 0.9963
-2.5
-2
-1.5
-1
-0.5
00 2 4 6 8 10 12 14 16
Time (h)
LN (O
D)
RGT2
y = 0.292x - 4.1783R2 = 0.9913
-3-2.5-2
-1.5-1
-0.50
0 2 4 6 8 10 12 14 16
Time (h)
LN (O
D)
GAL2
y = 0.2855x - 4.0331R2 = 0.9938
-2.5
-2
-1.5
-1
-0.5
00 2 4 6 8 10 12 14 16
Time (h)
LN (O
D)
MTH1
y = 0.2742x - 4.2257R2 = 0.9943
-3
-2.5
-2
-1.5
-1
-0.5
00 2 4 6 8 10 12 14 16
Time (h)
LN (O
D)

Appendices
172
99..99 GGRROOWWTTHH PPRROOFFIILLEESS OONN GGAALLAACCTTOOSSEE
Growth profiles of S.cerevisae single knockout strains grown on galactose. Mutants were cultivated in a 96-well microtite plates with immobi-lized oxygen sensors. Natural log of optical density [Ln (OD)] was plotted against time [t]. Only regions with clear exponential growth areshown.
CAT8
y = 0.2762x - 4.8994R2 = 0.9998
-4
-3.5
-3
-2.5
-2
-1.5
-1
-0.5
00 2 4 6 8 10 12 14 16 18
Time (h)
Ln (O
D)
CYB2
y = 0.3067x - 5.7927R2 = 0.9949
-4
-3.5
-3
-2.5
-2
-1.5
-1
-0.5
00 2 4 6 8 10 12 14 16 18
Time (h)
Ln (O
D)
DLD2
y = 0.1988x - 3.1932R2 = 0.9998
-4
-3
-2
-1
00 2 4 6 8 10 12 14 16 18
Time (h)
Ln (O
D)
FBP1
y = 0.3345x - 5.3158R2 = 0.9991
-4
-3
-2
-1
00 2 4 6 8 10 12 14 16 18
Time (h)
Ln (O
D)
FBP26
y = 0.2361x - 3.6499R2 = 0.998
-4
-3
-2
-1
00 2 4 6 8 10 12 14 16 18
Time (h)
Ln (O
D)
GAD1
y = 0.321x - 5.5093R2 = 0.9991
-4
-3
-2
-1
00 2 4 6 8 10 12 14 16 18
Time (h)
Ln (O
D)
GLK1
y = 0.2428x - 4.9567R2 = 0.9975
-4
-3
-2
-1
00 2 4 6 8 10 12 14 16 18
Time (h)
Ln (O
D)
GLO1
y = 0.3155x - 5.9753R2 = 0.9985
-4
-3
-2
-1
00 2 4 6 8 10 12 14 16 18
Time (h)
Ln (O
D)
LEU4
y = 0.2203x - 3.3943R2 = 0.9993
-4
-3
-2
-1
00 2 4 6 8 10 12 14 16 18
Time (h)
Ln (O
D)
MAE1
y = 0.2603x - 5.123R2 = 0.999
-4
-3
-2
-1
00 2 4 6 8 10 12 14 16 18
Time (h)
Ln (O
D)
MAL33
y = 0.1955x - 3.1328R2 = 0.9989
-4
-3
-2
-1
00 2 4 6 8 10 12 14 16 18
Time (h)
Ln (O
D)
MIG2
y = 0.3396x - 5.2975R2 = 0.9982
-4
-3
-2
-1
00 2 4 6 8 10 12 14 16 18
Time (h)
Ln (O
D)
MSN4
y = 0.2613x - 5.7221R2 = 0.9985
-4
-3
-2
-1
00 2 4 6 8 10 12 14 16 18
Time (h)
Ln (O
D)
PCK1
y = 0.1811x - 3.1965R2 = 0.9989
-4
-3
-2
-1
00 2 4 6 8 10 12 14 16 18
Time (h)
Ln (O
D)
PFK26
y = 0.2338x - 4.3363R2 = 0.9992
-4
-3
-2
-1
00 2 4 6 8 10 12 14 16 18
Time (h)
Ln (O
D)
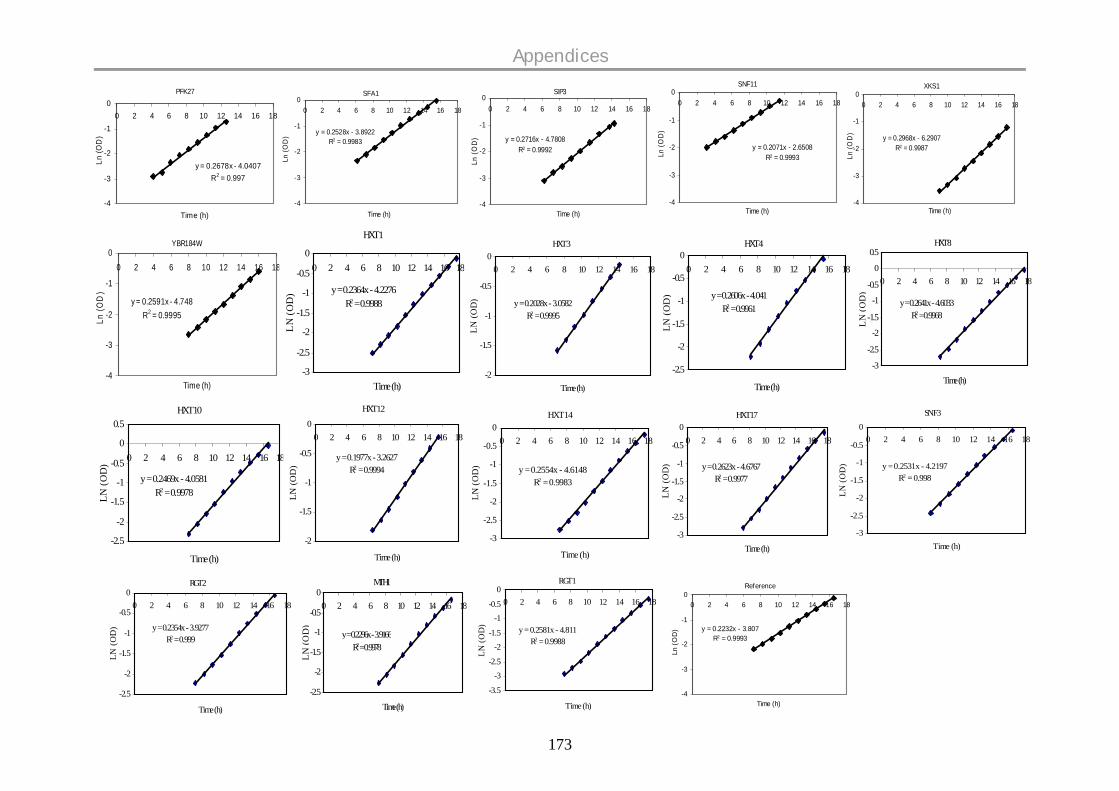
Appendices
173
PFK27
y = 0.2678x - 4.0407R2 = 0.997
-4
-3
-2
-1
00 2 4 6 8 10 12 14 16 18
Time (h)
Ln (O
D)
SFA1
y = 0.2528x - 3.8922R2 = 0.9983
-4
-3
-2
-1
00 2 4 6 8 10 12 14 16 18
Time (h)
Ln (O
D)
SIP3
y = 0.2716x - 4.7808R2 = 0.9992
-4
-3
-2
-1
00 2 4 6 8 10 12 14 16 18
Time (h)
Ln (
OD
)
SNF11
y = 0.2071x - 2.6508R2 = 0.9993
-4
-3
-2
-1
00 2 4 6 8 10 12 14 16 18
Time (h)
Ln (O
D)
XKS1
y = 0.2968x - 6.2907R2 = 0.9987
-4
-3
-2
-1
00 2 4 6 8 10 12 14 16 18
Time (h)
Ln (O
D)
YBR184W
y = 0.2591x - 4.748R2 = 0.9995
-4
-3
-2
-1
00 2 4 6 8 10 12 14 16 18
Time (h)
Ln (O
D)
HXT1
y = 0.2364x - 4.2276R2 = 0.9988
-3
-2.5
-2
-1.5
-1
-0.5
00 2 4 6 8 10 12 14 16 18
Time (h)
LN
(OD
)
HXT3
y = 0.2028x - 3.0582R2 = 0.9995
-2
-1.5
-1
-0.5
00 2 4 6 8 10 12 14 16 18
Time (h)
LN (O
D)
HXT4
y = 0.2606x - 4.041R2 = 0.9961
-2.5
-2
-1.5
-1
-0.5
00 2 4 6 8 10 12 14 16 18
Time (h)
LN (
OD
)
HXT8
y = 0.2641x - 4.6033R2 = 0.9968
-3
-2.5
-2
-1.5
-1
-0.5
0
0.5
0 2 4 6 8 10 12 14 16 18
Time (h)
LN
(OD
)
HXT10
y = 0.2469x - 4.0581R2 = 0.9978
-2.5
-2
-1.5
-1
-0.5
0
0.5
0 2 4 6 8 10 12 14 16 18
Time (h)
LN (O
D)
HXT12
y = 0.1977x - 3.2627R2 = 0.9994
-2
-1.5
-1
-0.5
00 2 4 6 8 10 12 14 16 18
Time (h)
LN (O
D)
HXT14
y = 0.2554x - 4.6148R2 = 0.9983
-3
-2.5
-2
-1.5
-1
-0.5
00 2 4 6 8 10 12 14 16 18
Time (h)
LN (O
D)
HXT17
y = 0.2623x - 4.6767R2 = 0.9977
-3
-2.5
-2
-1.5
-1
-0.5
00 2 4 6 8 10 12 14 16 18
Time (h)
LN (O
D)
SNF3
y = 0.2531x - 4.2197R2 = 0.998
-3
-2.5
-2
-1.5
-1
-0.5
00 2 4 6 8 10 12 14 16 18
Time (h)
LN (O
D)
Reference
y = 0.2232x - 3.807R2 = 0.9993
-4
-3
-2
-1
00 2 4 6 8 10 12 14 16 18
Time (h)
Ln (
OD
)
RGT2
y = 0.2354x - 3.9277R2 = 0.999
-2.5
-2
-1.5
-1
-0.5
00 2 4 6 8 10 12 14 16 18
Time (h)
LN (O
D)
MTH1
y = 0.2296x - 3.9166R2 = 0.9978
-2.5
-2
-1.5
-1
-0.5
00 2 4 6 8 10 12 14 16 18
Time (h)
LN (O
D)
RGT1
y = 0.2581x - 4.811R2 = 0.9988
-3.5
-3
-2.5
-2
-1.5
-1
-0.5
00 2 4 6 8 10 12 14 16 18
Time (h)
LN (O
D)
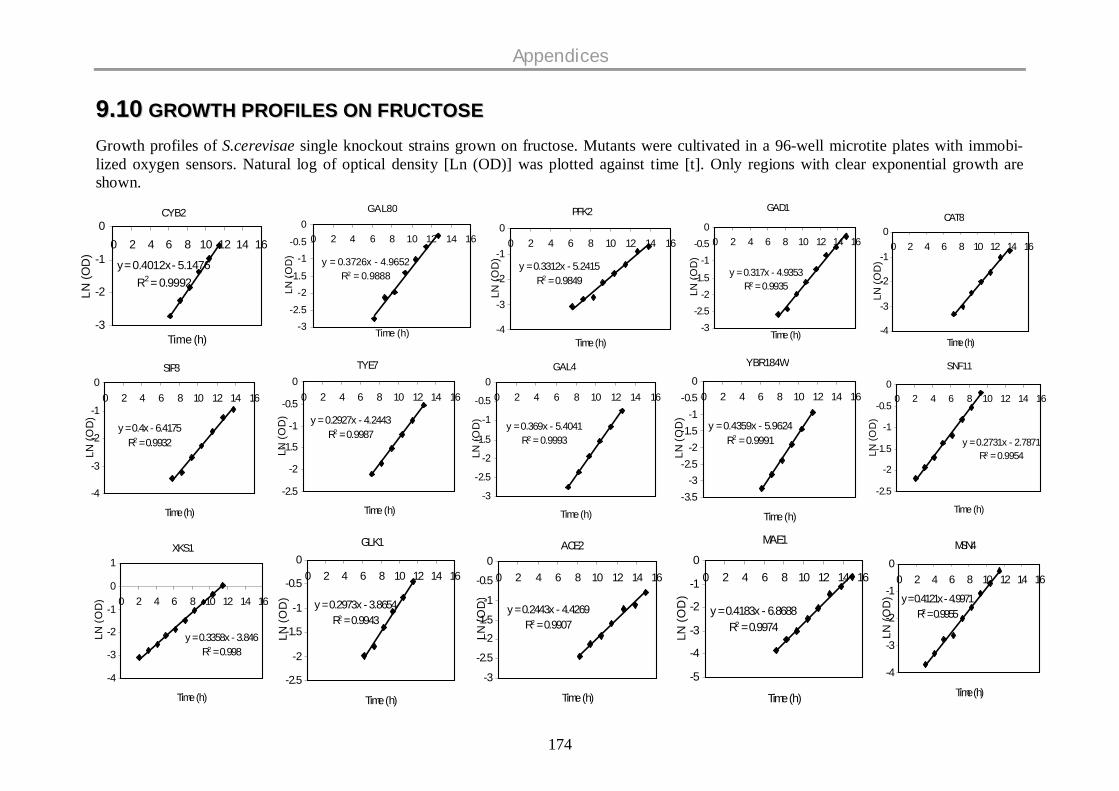
Appendices
174
99..1100 GGRROOWWTTHH PPRROOFFIILLEESS OONN FFRRUUCCTTOOSSEE
Growth profiles of S.cerevisae single knockout strains grown on fructose. Mutants were cultivated in a 96-well microtite plates with immobi-lized oxygen sensors. Natural log of optical density [Ln (OD)] was plotted against time [t]. Only regions with clear exponential growth areshown.
CYB2
y = 0.4012x - 5.1476R2 = 0.9992
-3
-2
-1
00 2 4 6 8 10 12 14 16
Time (h)
LN (O
D)
GAL80
y = 0.3726x - 4.9652R2 = 0.9888
-3-2.5
-2-1.5
-1-0.5
00 2 4 6 8 10 12 14 16
Time (h)
LN (O
D)
PFK2
y = 0.3312x - 5.2415R2 = 0.9849
-4
-3
-2
-1
00 2 4 6 8 10 12 14 16
Time (h)
LN (O
D)
GAD1
y = 0.317x - 4.9353R2 = 0.9935
-3-2.5
-2-1.5
-1-0.5
00 2 4 6 8 10 12 14 16
Time (h)
LN (O
D)
CAT8
-4
-3
-2
-1
00 2 4 6 8 10 12 14 16
Time (h)
LN (O
D)
SIP3
y = 0.4x - 6.4175R2 = 0.9932
-4
-3
-2
-1
00 2 4 6 8 10 12 14 16
Time (h)
LN (O
D)
TYE7
y = 0.2927x - 4.2443R2 = 0.9987
-2.5
-2
-1.5
-1
-0.5
00 2 4 6 8 10 12 14 16
Time (h)
LN (O
D)
GAL4
y = 0.369x - 5.4041R2 = 0.9993
-3
-2.5
-2
-1.5
-1
-0.5
00 2 4 6 8 10 12 14 16
Time (h)
LN (O
D)
YBR184W
y = 0.4359x - 5.9624R2 = 0.9991
-3.5-3
-2.5-2
-1.5-1
-0.50
0 2 4 6 8 10 12 14 16
Time (h)
LN (O
D)
SNF11
y = 0.2731x - 2.7871R2 = 0.9954
-2.5
-2
-1.5
-1
-0.5
00 2 4 6 8 10 12 14 16
Time (h)
LN (O
D)
XKS1
y = 0.3358x - 3.846R2 = 0.998
-4
-3
-2
-1
0
1
0 2 4 6 8 10 12 14 16
Time (h)
LN (O
D)
GLK1
y = 0.2973x - 3.8654R2 = 0.9943
-2.5
-2
-1.5
-1
-0.5
00 2 4 6 8 10 12 14 16
Time (h)
LN (O
D)
ACE2
y = 0.2443x - 4.4269R2 = 0.9907
-3
-2.5
-2-1.5
-1
-0.5
00 2 4 6 8 10 12 14 16
Time (h)
LN (O
D)
MAE1
y = 0.4183x - 6.8688R2 = 0.9974
-5
-4
-3
-2
-1
00 2 4 6 8 10 12 14 16
Time (h)LN
(OD
)
MSN4
y = 0.4121x - 4.9971R2 = 0.9955
-4
-3
-2
-1
00 2 4 6 8 10 12 14 16
Time (h)
LN (O
D)

Appendices
175
FBP26
y = 0.3482x - 4.7079R2 = 0.9932
-3-2.5
-2-1.5
-1-0.5
00 2 4 6 8 10 12 14 16
Time (h)
LN (O
D)
ADR1
y = 0.4118x - 5.3146R2 = 0.9907
-4
-3
-2
-1
00 2 4 6 8 10 12 14 16
Time (h)
LN (O
D)
MIG2
y = 0.3536x - 5.2715R2 = 0.9906
-3-2.5
-2-1.5
-1-0.5
00 2 4 6 8 10 12 14 16
Time (h)
LN (O
D)
HXK2
y = 0.2732x - 4.7356R2 = 0.9911
-3-2.5
-2-1.5
-1-0.5
00 2 4 6 8 10 12 14 16
Time (h)
LN (O
D)
UGA1
y = 0.3317x - 5.5702R2 = 0.9935
-3.5-3
-2.5-2
-1.5-1
-0.50
0 2 4 6 8 10 12 14 16
Time (h)
LN (O
D)
YDR248C
y = 0.3636x - 5.3919R2 = 0.9908
-3
-2
-1
0
1
0 2 4 6 8 10 12 14 16
Time (h)
LN (O
D)
PCK1
y = 0.4124x - 5.2749R2 = 0.9957
-4
-3
-2
-1
00 2 4 6 8 10 12 14 16
Time (h)
LN (O
D)
PGU1
y = 0.3786x - 5.9204R2 = 0.999
-4
-3
-2
-1
00 2 4 6 8 10 12 14 16
Time (h)
LN (O
D)
MAL33
y = 0.3317x - 4.0097R2 = 0.9984
-2.5
-2
-1.5
-1
-0.5
00 2 4 6 8 10 12 14 16
Time (h)
LN (O
D)
RBK1
y = 0.3997x - 5.212R2 = 0.9968
-4
-3
-2
-1
00 2 4 6 8 10 12 14 16
Time (h)
LN (O
D)
SFA1
y = 0.394x - 4.9952R2 = 0.9953
-3.5-3
-2.5-2
-1.5-1
-0.50
0 2 4 6 8 10 12 14 16
Time (h)
LN (O
D)
DLD2
y = 0.3409x - 4.2245R2 = 0.999
-3
-2.5-2
-1.5
-1-0.5
00 2 4 6 8 10 12 14 16
Time (h)
LN (O
D)
UGA2
y = 0.3769x - 5.4803R2 = 0.9978
-4
-3
-2
-1
00 2 4 6 8 10 12 14 16
Time (h)
LN (O
D)
GAL7
y = 0.3261x - 4.5969R2 = 0.9987
-4
-3
-2
-1
00 2 4 6 8 10 12 14 16
Time (h)
LN (O
D)
GAL10
y = 0.3171x - 4.4055R2 = 0.9998
-3-2.5
-2-1.5
-1-0.5
00 2 4 6 8 10 12 14 16
Time (h)
LN (O
D)
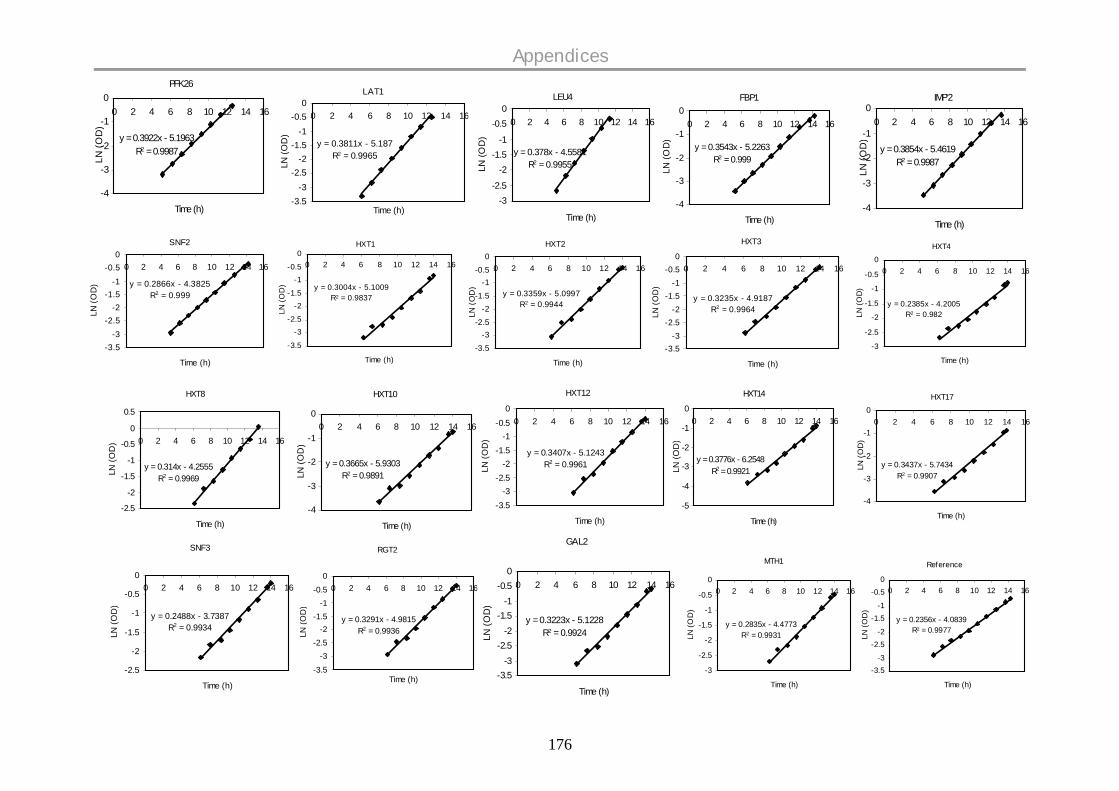
Appendices
176
PFK26
y = 0.3922x - 5.1963R2 = 0.9987
-4
-3
-2
-1
00 2 4 6 8 10 12 14 16
Time (h)
LN (O
D)
LAT1
y = 0.3811x - 5.187R2 = 0.9965
-3.5-3
-2.5-2
-1.5-1
-0.50
0 2 4 6 8 10 12 14 16
Time (h)
LN (O
D)
LEU4
y = 0.378x - 4.5581R2 = 0.9955
-3-2.5
-2-1.5
-1
-0.50
0 2 4 6 8 10 12 14 16
Time (h)
LN (O
D)
FBP1
y = 0.3543x - 5.2263R2 = 0.999
-4
-3
-2
-1
00 2 4 6 8 10 12 14 16
Time (h)
LN (O
D)
IMP'2
y = 0.3854x - 5.4619R2 = 0.9987
-4
-3
-2
-1
00 2 4 6 8 10 12 14 16
Time (h)
LN (O
D)
SNF2
y = 0.2866x - 4.3825R2 = 0.999
-3.5-3
-2.5-2
-1.5-1
-0.50
0 2 4 6 8 10 12 14 16
Time (h)
LN (O
D)
HXT1
y = 0.3004x - 5.1009R2 = 0.9837
-3.5
-3-2.5
-2-1.5
-1-0.5
00 2 4 6 8 10 12 14 16
Time (h)
LN (O
D)
HXT2
y = 0.3359x - 5.0997R2 = 0.9944
-3.5-3
-2.5-2
-1.5-1
-0.50
0 2 4 6 8 10 12 14 16
Time (h)
LN (O
D)
HXT3
y = 0.3235x - 4.9187R2 = 0.9964
-3.5-3
-2.5-2
-1.5-1
-0.50
0 2 4 6 8 10 12 14 16
Time (h)
LN (O
D)
HXT4
y = 0.2385x - 4.2005R2 = 0.982
-3
-2.5
-2
-1.5
-1
-0.5
00 2 4 6 8 10 12 14 16
Time (h)
LN (O
D)
HXT8
y = 0.314x - 4.2555R2 = 0.9969
-2.5
-2
-1.5
-1
-0.5
0
0.5
0 2 4 6 8 10 12 14 16
Time (h)
LN (O
D)
HXT10
y = 0.3665x - 5.9303R2 = 0.9891
-4
-3
-2
-1
00 2 4 6 8 10 12 14 16
Time (h)
LN (O
D)
HXT12
y = 0.3407x - 5.1243R2 = 0.9961
-3.5-3
-2.5-2
-1.5-1
-0.50
0 2 4 6 8 10 12 14 16
Time (h)
LN (O
D)
HXT14
y = 0.3776x - 6.2548R2 = 0.9921
-5
-4
-3
-2
-1
00 2 4 6 8 10 12 14 16
Time (h)
LN (O
D)
HXT17
y = 0.3437x - 5.7434R2 = 0.9907
-4
-3
-2
-1
00 2 4 6 8 10 12 14 16
Time (h)
LN (
OD
)
SNF3
y = 0.2488x - 3.7387R2 = 0.9934
-2.5
-2
-1.5
-1
-0.5
00 2 4 6 8 10 12 14 16
Time (h)
LN (O
D)
RGT2
y = 0.3291x - 4.9815R2 = 0.9936
-3.5
-3-2.5
-2-1.5
-1-0.5
00 2 4 6 8 10 12 14 16
Time (h)
LN (O
D)
GAL2
y = 0.3223x - 5.1228R2 = 0.9924
-3.5-3
-2.5-2
-1.5-1
-0.50
0 2 4 6 8 10 12 14 16
Time (h)
LN (O
D)
MTH1
y = 0.2835x - 4.4773R2 = 0.9931
-3
-2.5
-2
-1.5
-1
-0.5
00 2 4 6 8 10 12 14 16
Time (h)LN
(OD
)
Reference
y = 0.2356x - 4.0839R2 = 0.9977
-3.5-3
-2.5-2
-1.5-1
-0.50
0 2 4 6 8 10 12 14 16
Time (h)
LN (O
D)
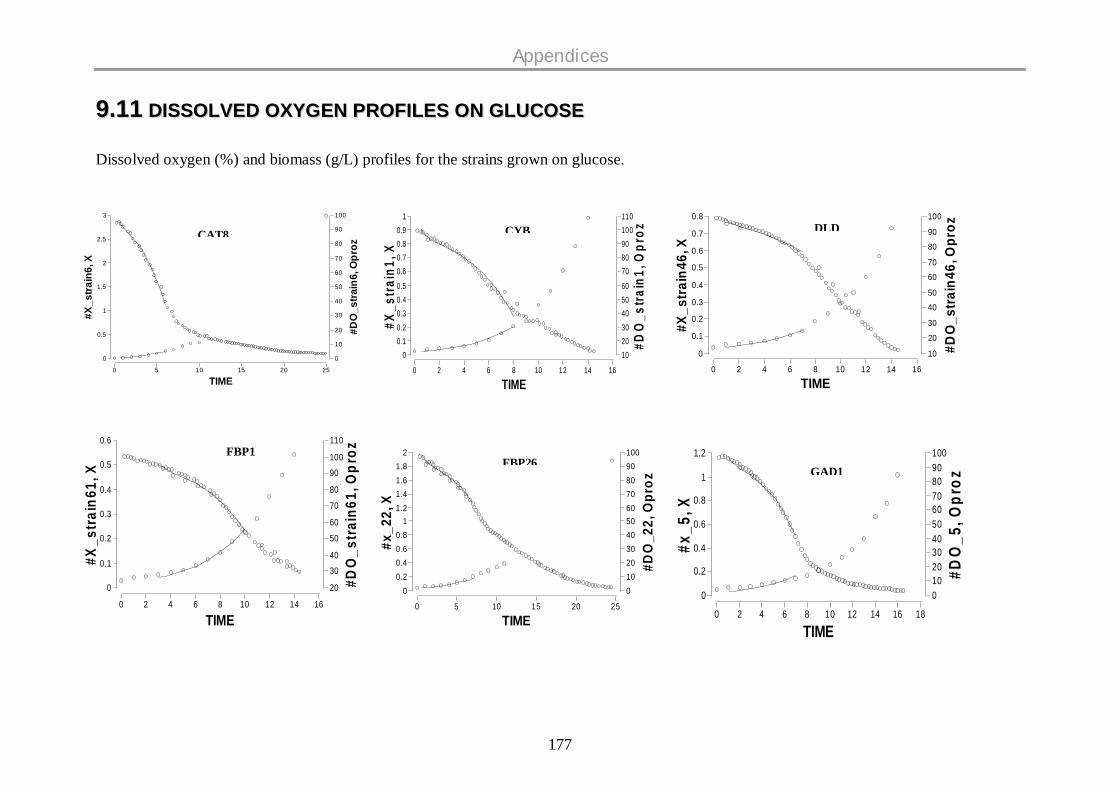
Appendices
177
99..1111 DDIISSSSOOLLVVEEDD OOXXYYGGEENN PPRROOFFIILLEESS OONN GGLLUUCCOOSSEE
Dissolved oxygen (%) and biomass (g/L) profiles for the strains grown on glucose.
2520151050
3
2.5
2
1.5
1
0.5
0
100
90
80
70
60
50
40
30
20
10
0
TIME
#X_s
train
6, X
#DO
_stra
in6,
Opr
oz
CAT8
1614121086420
10.90.80.70.6
0.50.40.30.20.1
0
110100908070
605040302010
TIME#X
_str
ain1
, X
#DO
_stra
in1,
Opr
ozCYB
1614121086420
0.8
0.7
0.6
0.5
0.4
0.3
0.2
0.1
0
100
90
80
70
60
50
40
30
20
10
TIME
#X_s
train
46, X
#DO
_stra
in46
, Opr
ozDLD
1614121086420
0.6
0.5
0.4
0.3
0.2
0.1
0
110
100
90
80
70
60
50
40
30
20
TIME
#X_s
train
61, X
#DO
_stra
in61
, Opr
ozFBP1
2520151050
21.81.61.41.2
10.80.60.40.2
0
1009080706050403020100
TIME
#x_2
2, X
#DO
_22,
Opr
oz
FBP26
181614121086420
1.2
1
0.8
0.6
0.4
0.2
0
1009080706050403020100
TIME
#x_5
, X
#DO
_5, O
proz
GAD1
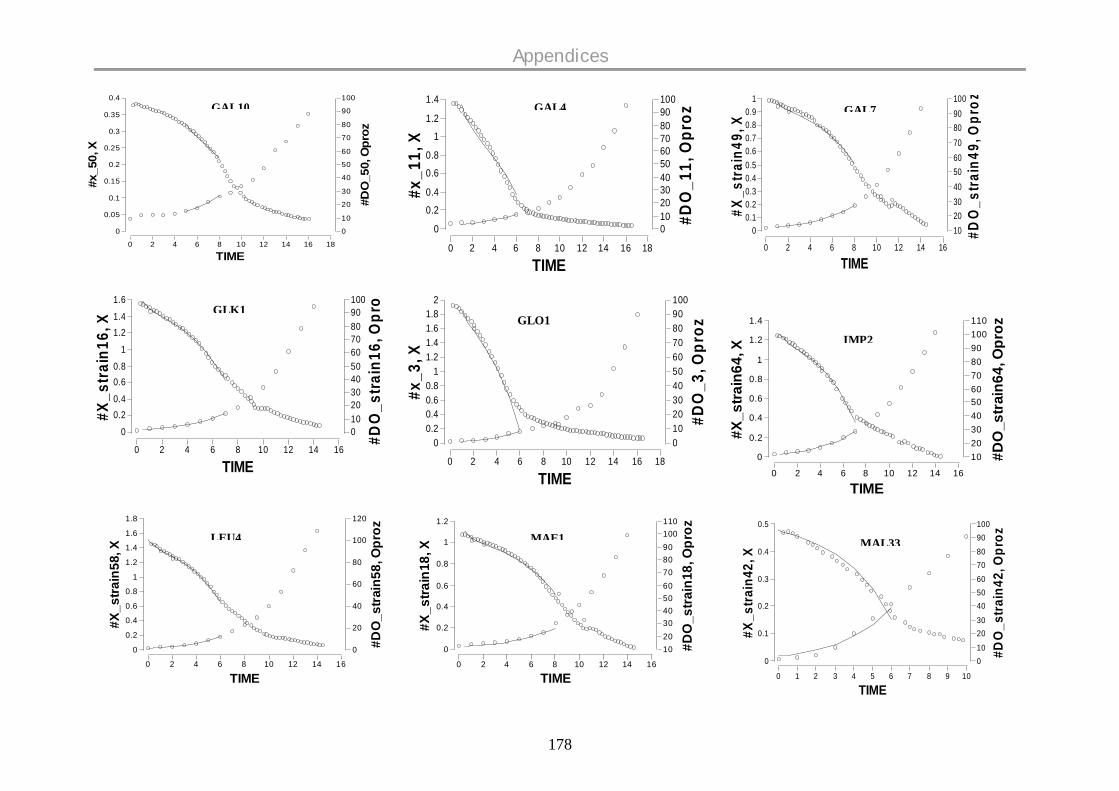
Appendices
178
181614121086420
0.4
0.35
0.3
0.25
0.2
0.15
0.1
0.05
0
100
90
80
70
60
50
40
30
20
10
0
TIME
#x_5
0, X
#DO
_50,
Opr
oz
GAL10
181614121086420
1.4
1.2
1
0.8
0.6
0.4
0.2
0
1009080706050403020100
TIME
#x_1
1, X
#DO
_11,
Opr
oz
GAL4
1614121086420
10.90.80.70.60.50.40.30.20.1
0
100908070605040302010
TIME
#X_s
train
49, X
#DO
_stra
in49
, Opr
ozGAL7
1614121086420
1.6
1.41.2
1
0.80.6
0.40.2
0
1009080706050403020100
TIME
#X_s
trai
n16,
X
#DO
_stra
in16
, Opr
ozGLK1
181614121086420
21.81.61.41.2
10.80.60.40.2
0
1009080706050403020100
TIME
#x_3
, X
#DO
_3, O
proz
GLO1
1614121086420
1.4
1.2
1
0.8
0.6
0.4
0.2
0
110100908070605040302010
TIME
#X_s
train
64, X
#DO
_str
ain6
4, O
proz
IMP2
1614121086420
1.8
1.6
1.4
1.2
1
0.8
0.6
0.4
0.2
0
120
100
80
60
40
20
0
TIME
#X_s
train
58, X
#DO
_str
ain5
8, O
prozLEU4
1614121086420
1.2
1
0.8
0.6
0.4
0.2
0
110100908070605040302010
TIME
#X_s
train
18, X
#DO
_stra
in18
, Opr
ozMAE1
109876543210
0.5
0.4
0.3
0.2
0.1
0
10090
8070
605040
3020
100
TIME
#X_s
train
42, X
#DO
_str
ain4
2, O
prozMAL33
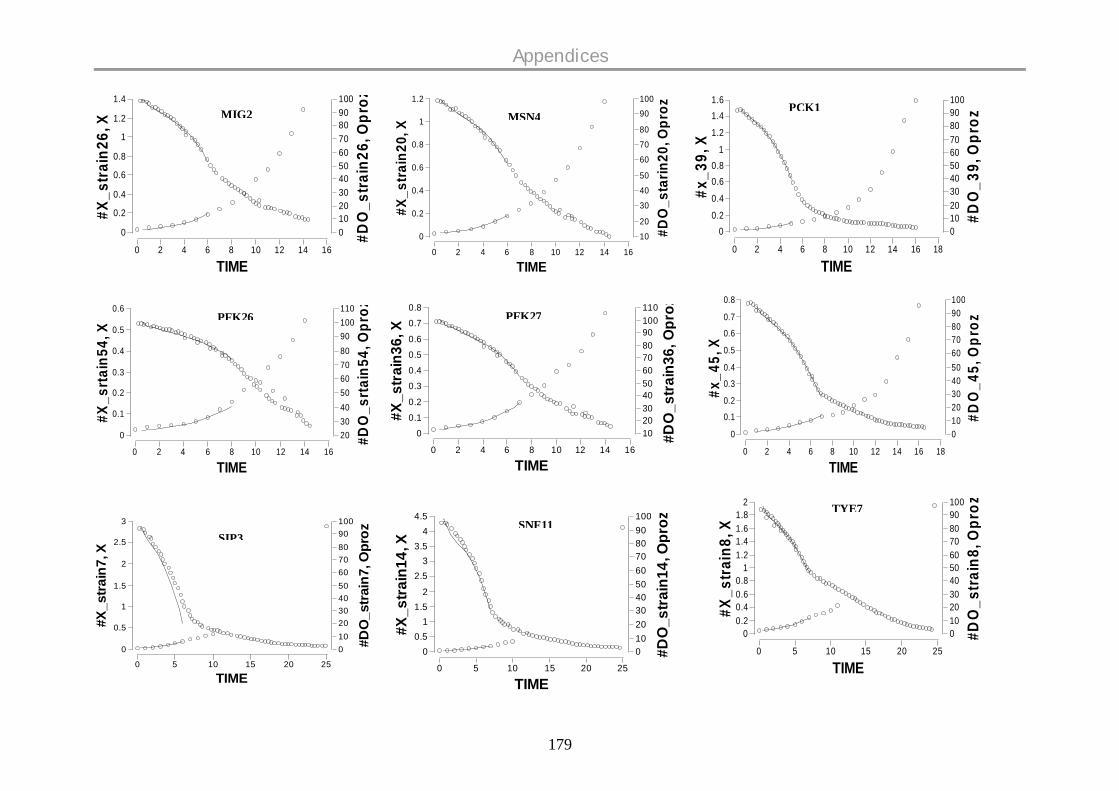
Appendices
179
1614121086420
1.4
1.2
1
0.8
0.6
0.4
0.2
0
1009080706050403020100
TIME
#X_s
trai
n26,
X
#DO
_stra
in26
, Opr
oz
MIG2
1614121086420
1.2
1
0.8
0.6
0.4
0.2
0
100
90
80
70
60
50
40
30
20
10
TIME
#X_s
train
20, X
#DO
_sta
rin20
, Opr
ozMSN4
2520151050
21.81.61.41.2
10.80.60.40.2
0
1009080706050403020100
TIME
#X_s
train
8, X
#DO
_stra
in8,
Opr
ozTYE7
181614121086420
1.61.4
1.2
10.80.6
0.4
0.20
1009080706050403020100
TIME
#x_3
9, X
#DO
_39,
Opr
oz
PCK1
1614121086420
0.6
0.5
0.4
0.3
0.2
0.1
0
1101009080706050403020
TIME
#X_s
rtain
54, X
#DO
_srta
in54
, Opr
ozPFK26
1614121086420
0.8
0.7
0.6
0.5
0.4
0.3
0.2
0.1
0
110100908070605040302010
TIME
#X_s
trai
n36,
X
#DO
_str
ain3
6, O
prozPFK27
181614121086420
0.8
0.7
0.6
0.5
0.4
0.3
0.2
0.1
0
1009080706050403020100
TIME
#x_4
5, X
#DO
_45,
Opr
ozSFA1
2520151050
3
2.5
2
1.5
1
0.5
0
1009080706050403020100
TIME
#X_s
train
7, X
#DO
_str
ain7
, Opr
ozSIP3
2520151050
4.54
3.53
2.5
21.5
10.5
0
1009080706050403020100
TIME
#X_s
train
14, X
#DO
_stra
in14
, Opr
ozSNF11
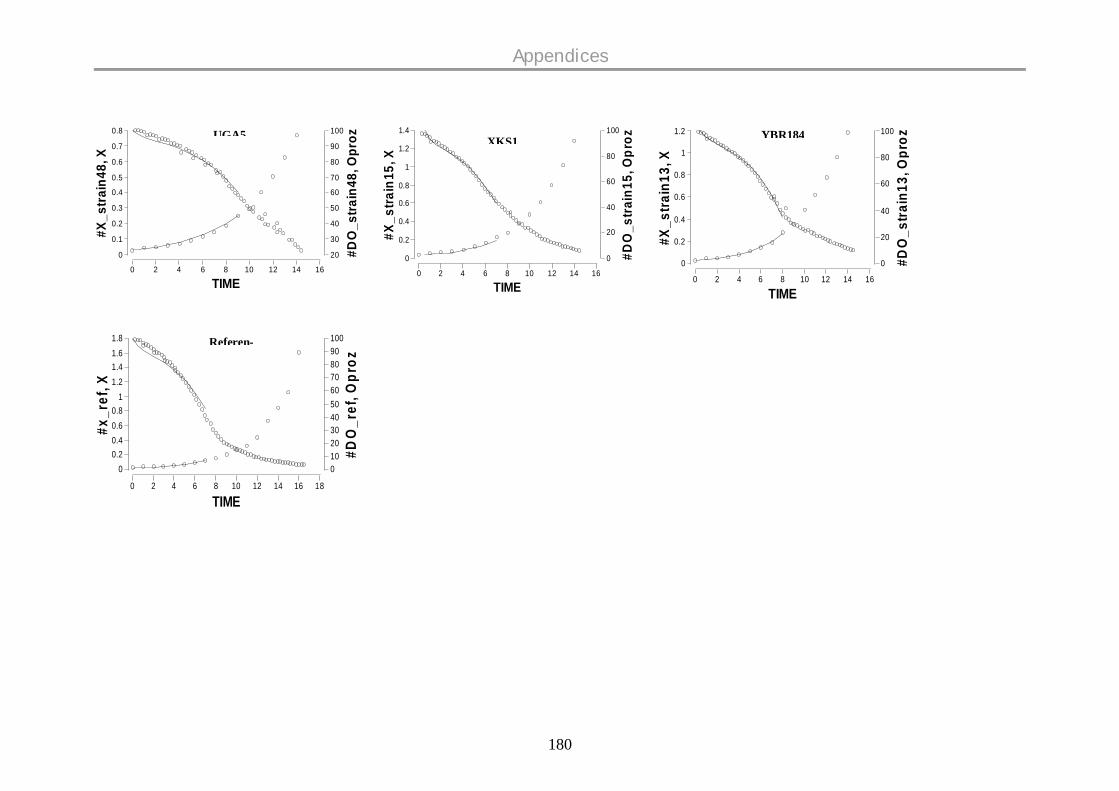
Appendices
180
1614121086420
0.8
0.7
0.6
0.5
0.4
0.3
0.2
0.1
0
100
90
80
70
60
50
40
30
20
TIME
#X_s
trai
n48,
X
#DO
_stra
in48
, Opr
ozUGA5
1614121086420
1.4
1.2
1
0.8
0.6
0.4
0.2
0
100
80
60
40
20
0
TIME
#X_s
train
15, X
#DO
_stra
in15
, Opr
ozXKS1
1614121086420
1.2
1
0.8
0.6
0.4
0.2
0
100
80
60
40
20
0
TIME
#X_s
train
13, X
#DO
_stra
in13
, Opr
ozYBR184
181614121086420
1.81.61.41.2
10.80.60.40.2
0
1009080706050403020100
TIME
#x_r
ef, X
#DO
_ref
, Opr
ozReferen-

Appendices
181
99..1122 DDIISSSSOOLLVVEEDD OOXXYYGGEENN PPRROOFFIILLEESS OONN GGAALLAACCTTOOSSEE
Dissolved oxygen (%) and biomass (g/L) profiles for the strains grown on galactose.
9876543210
0.25
0.2
0.15
0.1
0.05
0
100
90
80
70
60
50
40
30
20
10
0
TIME
X, #
Gal
_540
_CA
T8_X
Opr
oz, #
Gal
_540
_CA
T8_D
O_a
, #G
al_5
40_C
AT8
_DO
_b
CAT
9876543210
0.25
0.2
0.15
0.1
0.05
0
1009080706050403020100
TIMEX
, #G
al_5
40_C
YB2_
X_a
Opr
oz, #
Gal
_540
_CYB
2_D
O_a
, #G
al_5
40_C
YB
2_D
O_b
CYB
9876543210
0.25
0.2
0.15
0.1
0.05
0
1009080706050403020100
TIME
X, #
Gal
_540
_DLD
2_X
Opr
oz, #
Gal
_540
_DLD
2_D
O_a
DLD2
1614121086420
1
0.8
0.6
0.4
0.2
0
1009080706050403020100
TIME
X, #
Gal
_102
0_LE
U4_
X
Opr
oz, #
Gal
_102
0_LE
U4_
DO
_a
FBP1
9876543210
0.25
0.2
0.15
0.1
0.05
0
1009080706050403020100
TIME
X, #
Gal
_540
_MS
N4_
X
Opr
oz, #
Gal
_540
_MSN
4_D
O_b
FBP2
9876543210
0.25
0.2
0.15
0.1
0.05
0
1009080706050403020100
TIME
X, #
Gal
_540
_GA
D1_
X
Opr
oz, #
Gal
_540
_GA
D1_
DO
_b
GAD1

Appendices
182
9876543210
0.25
0.2
0.15
0.1
0.05
0
100
90
80
70
60
50
40
30
20
10
0
TIME
X, #
Gal
_540
_GLK
1_X
Opr
oz, #
Gal
_540
_GLK
1_D
O_a
GLK1
9876543210
0.25
0.2
0.15
0.1
0.05
0
1009080706050403020100
TIME
X, #
Gal
_540
_GA
L80_
X
Opr
oz, #
Gal
_540
_GA
L80_
DO
_a
GLO
20181614121086420
1
0.8
0.6
0.4
0.2
0
1009080706050403020100
TIME
X, #
Gal
_102
0_IM
P2_X
Opr
oz, #
Gal
_102
0_IM
P2_D
O_a
IMP
20181614121086420
1
0.8
0.6
0.4
0.2
0
1009080706050403020100
TIME
X, #
Gal
_102
0_LE
U4_
X
Opr
oz, #
Gal
_102
0_LE
U4_
DO
_aLEU4
9876543210
0.25
0.2
0.15
0.1
0.05
0
100
90
80
70
60
50
40
30
20
10
0
TIME
X, #
Gal
_540
_MA
E1_X
Opr
oz, #
Gal
_540
_MA
E1_D
O_a
MAE1
9876543210
0.25
0.2
0.15
0.1
0.05
0
100
90
80
70
60
50
40
30
20
10
0
TIME
X, #
Gal
_540
_MA
L33_
X
Opr
oz, #
Gal
_540
_MA
L33_
DO
_b
MAL3
9876543210
0.25
0.2
0.15
0.1
0.05
0
100
90
80
70
60
5040
30
20
10
0
TIME
X, #
Gal
_540
_PC
K1_
X
Opr
oz, #
Gal
_540
_PC
K1_
DO
_b
9876543210
0.25
0.2
0.15
0.1
0.05
0
1009080706050403020100
TIME
X, #
Gal
_540
_MIG
2_X
Opr
oz, #
Gal
_540
_MIG
2_D
O_a
MIG2
9876543210
0.25
0.2
0.15
0.1
0.05
0
100
90
80
70
60
50
40
30
20
10
0
TIME
X, #
Gal
_540
_MS
N4_
X
Opr
oz, #
Gal
_540
_MSN
4_D
O_a
MSN

Appendices
183
181614121086420
1
0.8
0.6
0.4
0.2
0
1009080706050403020100
TIME
X, #
Gal
_102
0_P
FK26
_X
Opr
oz, #
Gal
_102
0_PF
K26
_DO
_a, #
Gal
_102
0_P
FK26
_DO
_b
9876543210
0.25
0.2
0.15
0.1
0.05
0
1009080706050403020100
TIME
X, #
Gal
_540
_SN
F11_
X
Opr
oz, #
Gal
_540
_SN
F11_
DO
_b
SNF1
181614121086420
1
0.8
0.6
0.4
0.2
0
100
908070
60
504030
20
100
TIME
X, #
Gal
_102
0_YB
R00
6W_X
Opr
oz, #
Gal
_102
0_YB
R00
6W_D
O_b
UGA
9876543210
0.25
0.2
0.15
0.1
0.05
0
1009080706050403020100
TIME
X, #
Gal
_540
_XK
S1_X
Opr
oz, #
Gal
_540
_XK
S1_D
O_b
XKS1
9876543210
0.25
0.2
0.15
0.1
0.05
0
1009080706050403020100
TIME
X, #
Gal
_540
_YB
R18
4W_X
Opr
oz, #
Gal
_540
_YB
R18
4W_D
O_a
YBR184
9876543210
0.25
0.2
0.15
0.1
0.05
0
100
90
80
70
60
50
40
30
20
10
0
TIME
X, #
Gal
_540
_Ref
eren
ce_X
Opr
oz, #
Gal
_540
_Ref
eren
ce_D
O_a
, #G
al_5
40_R
efer
ence
_DO
_b
Referen-
9876543210
0.25
0.2
0.15
0.1
0.05
0
1009080706050403020100
TIME
X, #
Gal
_540
_TYE
7_X
Opr
oz, #
Gal
_540
_TY
E7_D
O_a
TYE7

10. Curriculum Vitae
184
Vidya R.Velagapudi, Ph.D
Contact Information Personal DetailsKalakontintie – 1B-37, Nationality: Indian Date: September 2009Espoo-02230, Finland Age: 29 yrs Status: Married (Dec, 2003)E-mail: [email protected] Gender: Female Children: One Girl (2 yrs)Website: http://sysbio.vtt.fi Phone: +358-40-5825754 Fax: +358-20-7227071
Academic background2006-2006 PDF at Systems Biology, QBIX group, VTT Technical Research Center of Finland
(Jan – Dec) in collaboration with University of Cambridge, UK and Helsinki medical school2003-2005 Ph.D at Applied Biochemistry, University of Saarland & Max- Planck Institute for
(Jan – Dec) Informatics, Saarbrucken, Germany with “Magna cum laude” (~ Very Good) grade2001-2002 PGDiploma Bioinformatics from JNU, New Delhi, India with 6.5/9 CGPA ~ 71.5%1999-2001 M.Sc Biotechnology from University of Hyderabad, Hyderabad, India with 72%1996-1999 B.Sc Biosciences from Sri Venkateswara University, Tirupathi, India with 80%
Certificate courses and short-term training2009 (Nov) Course on detection & chatacterisation of T-cells in Type 1 diabetes, Paris, France2009 (Feb) Advanced course on Mass spectrometric metabolomics, Copenhagen, Denmark2009 (Jan) Advanced course on Multivariate data modeling for Systems Biology, Oslo, Norway2008 (July) Training course on Project Management, VTT Management/Finance team, Finland2007 (Mar) Microarray data analysis using R package/Bioconductor, CSC, Espoo, Finland2005 (Mar) Advanced lecture course on Systems Biology, FEBS, Gosau, Austria.
Professional Experience (3.5 yrs)2007 - Research Scientist cum Project Manager at Quantitative Biology and Bioinformatics
(Jan – ) (QBIX) group, VTT Technical Research Center of Finland, Espoo, Finland2002 - 2002 Research Associate in Proteomics group, Bioinformatics division, Zenovus Biotech
(June – Dec) Limited, Dr. Reddy’s Laboratories, Hyderabad, India
Academic Research Experience (5.5 yrs)PDF project (Jan 2006 - Dec 2006)
Comprehensive metabolomic characterization of lipoproteins in insulin resistance and normal subjectsPh.D thesis (Jan 2003 - Dec 2005)
Physiological and metabolic flux screening of S. cerevisiae mutants on different carbon sourcesPGDiploma thesis (Jan - May 2002)
Statistical characterization of complete microbial genomesMasters thesis (July 2000 - Apr 2001)
Screening for phosphate solubilising activity of Rhizobacteria and cloning one Rhizobacterial isolateSummer project (May - July 2000)
Sugar transport defective mutants of S. pombe: Analysis of genomic and cDNA clones
Teaching Experience (6 months)2003-2005 Supervisor to under-graduate and post-graduate students in a Biochemistry practical
course at Biochemical Engineering Institute, University of Saarland, Germany.
Fellowships2006- Post Doctoral Fellowships from EU FP6 and FP7 and Human Frontier Science or-
ganization (HFSO) through VTT Technical Research Center of Finland, Espoo.2003-2005 Doctoral Fellowship from Center for Bioinformatics under BioSapiens project FP6
programme and Deutsche Forschungsgemeinschaft

10. Curriculum Vitae
185
2000-2000 Visiting Student Research Program Fellowship (VSRP-2000) from Tata Institute ofFundamental Research (TIFR), Mumbai, India during summer internship
1999-2002 Merit Fellowships from Department of Biotechnology, India during both Mastersdegree and Advanced Postgraduate Diploma in Bioinformatics (PGDiploma)
Awards, Grants and Academic AchievementsAward for Merit - 2008 (Cash prize & Certificate) for excellent collaborative work in establish-ment of Systems Biology platform at VTT Technical Research Centre of Finland, FinlandAward for Merit - 2007 (Hike in salary & Certificate) for exceptionally well performed projectwork at VTT Technical Research Centre of Finland, Finland.Young post-doctoral scientist grant to attend first focused “FutureSysBio” workshop, Nov 19 th -21st, 2008 Gothenburg, Sweden.Young scientist bursary scheme award to attend “Genomes to systems” conference, Mar 22nd -24th, 2006 Manchester, UK.Graduate Student grants to attend 5th European Symposium on Biochemical Engineering Science(ESBES), Sep 8th -11th, 2004 Stuttgart, Germany.Selected in All India National level entrance for 2 months summer internship in Tata Institute ofFundamental Research (TIFR), Center for DNA fingerprinting and diagnosis (CDFD) and Inter-national Crops Research Institute for the Semi-Arid Tropics (ICRISAT), India (2000).
Professional ActivitiesVisiting Scientist in Metabolic Research Laboratories, University of Cambridge, UK - Nov 2009.Coordinator for Metabolomics for clinical research training course at VTT, Finland, Oct 2009Member in Metabolomics Society, MA, USA.Member in “The Biobio Society”, Helsinki, Finland.Member in international research organizations- FEBS, FEMS, IUBMB, IUMS, IUPAB, EBSA
Technical ExpertiseAnalytical Mass spectrometry (UPLC-MS/MS [QToF]; LC-MS, GC-MS; GC-FID;
GCxGC-ToF-MS, MALDI-TOF-MS; HPLC), Spectrophotometry; Fluoro-scence and Absorbance Readers; Chromatography (Affinity, Paper, TLCand Gel Filtration);
Fermentation Microtiter plate and Shake flask cultivation techniquesProteomics Protein extraction and quantification; 2-D-, SDS-, native- PAGE; IEFMolecular Biology Plasmid and Genomic DNA isolation; Cloning; PCR; Transformation of
Bacteria, Transfection, Agarose Gel Electophoresis; Western blottingTissue Culture Basic animal tissue culture techniques; Maintenance of Cell Lines; Plant
tissue culture techniques- Callus production, Artificial seed synthesis
Computational SkillsBioinformatics: Multivariate & Univariate analyses, Clustering & Regression analysesSoftwares: MATLAB, PERL, C, R/Bioconductor, MySQL RDBMS,Platforms: MS Windows, XP, MS Office and Linux
Publications (* Joint Authors)Research Articles
10. López, M., Varela, L.,* Velagapudi, V.R.,* Lage, R., Vázquez, M.J., Tovar, S., Rodríguez-Cuenca, S., Gonzalez, C.R., Martinez de Morentin, P.B., Nogueiras, R., Carling, D., Lelliott, C.J.,Saha, A.K., Oreši , M., Diéguez, C., Vidal-Puig, A., 2009. Dysregulation of hypothalamic AMPKand fatty acid metabolism mediates hyperthyroidism-induced alterations in energy balance. Na-ture Medicine. (Submitted)

10. Curriculum Vitae
186
9. Velagapudi, V.R., Hezaveh, R., Reigstad, C., Peddinti, G.V., Felin, J., Yetukuri, L., Mattila, I.,Borén, J., Oreši , M., Bäckhed, F., 2009. The gut microbiota as a global modulator of host me-tabolism. Molecular Systems Biology. (Submitted)
8. Medina-Gomez, G., Yetukuri, L., Velagapudi, V.R., Campbell, M., Jimenez-Linan, M., Blount,M., Ros, M., Oreši , M., Vidal-Puig, A., 2009. Early mechanisms of beta cell adaptation and fail-ure in the insulin resistant ob/ob and POKO mice. Disease Models and Mechanisms. (In Press)
7. Kotronen, A.,* Velagapudi, V.R.,* Yetukuri, L., Westerbacka, J., Bergholm, R., Ekroos, K.,Makkonen, J., Taskinen, M.R., Oreši , M., Yki-Järvinen, H., 2009. Saturated fatty acids contain-ing triglycerides are better markers of insulin resistance than total serum triglyceride concentra-tions. Diabetologia. 52, 684-690.
6. Peddinti, G.V.,* Velagapudi, V.R.,* Lindfors, E., Halperin, E., Oresic, M., 2009. Dynamic net-work topology changes in functional modules predict responses to oxidative stress in yeast. Mo-lecular BioSystems. 5, 276-287.
7. Velagapudi, V.R., Wittmann, C., Schniden, K., Heinzle, E., 2007. Metabolic Flux Screening ofSaccharomyces cerevisiae Single Knock-out Strains on Glucose and Galactose Supports Elucida-tion of Gene Function. Journal of Biotechnology. 132, 395-404.
4. Sysi-Aho, M., Vehtari, A., Velagapudi, V.R., Westerbacka, J., Yetukuri, L., Bergholm, R.,Taskinen, M.R., Yki-Järvinen, H., Oreši , M., 2007. Predicting the lipoprotein composition usingBayesian regression on serum lipidomic profiles. Bioinformatics. 23, i519 – i528.
3. Kolak, M*., Westerbacka, J*., Velagapudi, V.R., Wågsäter, D., Yetukuri, L., Makkonen, J.,Rissanen, A., Häkkinen, A.M., Lindell, M., Hamsten, A., Eriksson, P., Fisher, R.M., Oreši , M.,Yki-Järvinen, H., 2007. Adipose Tissue Inflammation And Increased Ceramide Content Charac-terize Subjects with High Liver Fat Content Independent of Obesity. Diabetes. 56, 1960.
2. Hollemeyer, K., Velagapudi, V.R., Wittmann, C., Heinzle, E., 2007. Matrix-assisted laser de-sorption/ionization time-of-flight mass spectrometry for metabolic flux analyses using isotope-labeled ethanol. Rapid Communications in Mass Spectrometry. 21, 336-342.
1. Velagapudi, V.R., Wittmann, C., Lengauer, T., Talwar, P., Heinzle, E., 2006. Metabolic Screen-ing of Saccharomyces cerevisiae Single Knock-out Strains Reveals Unexpected Mobilization ofMetabolic Potential. Process Biochemistry. 41, 2170-2179.
Conference Talks
5. Velagapudi, V.R., (2009) Microbial regulation of host physiology. In: Academy of Finland’sAnnual seminar in Research Programme on Nutrition, Food and Health, Mar 19th, Finland.
6. Velagapudi, V.R., (2009) Systems biology approach to examine gut microbial effects on hostmetabolism in mice. In: Mass spectrometric metabolomics workshop, Feb 27th, Denmark.
3. Velagapudi, V.R., (2009) Multivariate analysis of lipidomics data. In: Multivariate data modelingfor Systems Biology (Sysdiet) workshop, Jan 16th, Oslo, Norway
2. Velagapudi, V.R., (2008) Microbial regulation of host metabolism - A metabolomics strategy. In:The Second Finnish Gut day, Nov 7th, Helsinki, Finland.
1. Velagapudi, V.R., (2008) Lipidomic profiling of animal models. In: EU Consortium meeting ofHepatic & Adipose tissue and functions in the metabolic syndrome (HEPADIP), Oct 23rd, France.
Refereed Conference talk Abstracts
8. Velagapudi, V.R., Hezaveh, R., Reigstad, C., Peddinti, G.V., Felin, J., Yetukuri, L., Mattila, I.,Borén, J., Oreši , M., Bäckhed, F., 2009. The gut microbiota regulates energy and lipid metabo-lism. In: Frontier lipidology: Lipidomics in health and diseases. May 10-13, Sweden
7. Sysi-Aho, M., Vehtari, A., Velagapudi, V.R., Westerbacka, J., Yetukuri, L., Bergholm, R.,Taskinen, M.R., Yki-Järvinen, H., Oreši , M., 2007. Predicting the lipoprotein composition usingBayesian regression on serum lipidomic profiles. In: 15th ISMB/ECCB, July 21-25, Austria
6. Velagapudi, V.R., Yetukuri, L., Westerbacka, J., Sysi-Aho, M., Bergholm, R., Vehtari, A.,Taskinen, M.R., Yki-Järvinen, H., Oreši , M., 2007. Characterisation of Lipoprotein Fractions us-ing Comprehensive UPLC/MS and GCxGC ToF/MS Analyses in patients with metabolic syn-drome. In: Metabolomics 3rd Scientific Meeting. June 11-14, Manchester, UK.

10. Curriculum Vitae
187
5. Heinzle, E., Wittmann, C., Velagapudi, V.R., Kim, H.M., John, G.T., 2006. Miniaturization andmini-bioreactors In: Engineering conferences international (ECI) - Natural products discovery andproduction: New challenges, new opportunities. June 4-8, New Mexico, USA
4. C. Wittmann., Kim, H.M., Velagapudi, V.R., Heinzle, E., 2005. Metabolic network analysis atminiaturized scale - A novel tool in strain and process development. In: Industrial Microbiology& Biotechnology Conference SIM Annual Meeting, August 21-25, Chicago, IL, USA.
3. Heinzle, E., Velagapudi, V.R., Wittmann, C., Hollemeyer, K., Talwar, P., Lengauer, T., 2005.Metabolische Hochdurchsatz-Charakterisierung von Deletionsmutanten von Saccharomyces cere-visiae. In: Systembiologie für industrielle Prozesse, May 1-4, Braunschweig, Germany.
2. Heinzle, E., John, G., Velagapudi, V.R., Desphande, R., Wittmann, C., 2004. Biocatalyst screen-ing using novel microtiter plates. In: Bioperspectives, May 4-6, Wiesbaden, Germany.
1. Wittmann, C., Kim, H.M., Velagapudi, V.R., Heinzle, E., 2004. Cultivation and metabolic profil-ing at miniaturized scale. In: Bioperspectives, May 4-6, Wiesbaden, Germany.
Refereed Conference Poster Abstracts16. Velagapudi, V.R., Bäckhed, F., Oreši , M., 2009. A systems biology approach to examine gut microbial
effects on host metabolism in mice. In: The fifth International Conference of the Metabolomics Society,Aug 30 – Sep 2, Edmonton, Alberta, Canada.
15. Peddinti, G.V.,* Velagapudi, V.R.,* Lindfors, E., Halperin, E., Oresic, M., 2008. Dynamic network topol-ogy changes in functional modules predict responses to oxidative stress in yeast. In: 9th International Con-ference on Systems Biology (ICSB-9), Aug 22 – 28, Gothenburg, Sweden.
14. Peddinti, G.V., Velagapudi, V.R.,* Lindfors, E., Halperin, E., Oresic, M., 2007. Dynamic network topol-ogy changes as result of cellular stress. In: 15th ISMB/ECCB, July 21-25, Austria.
13. Velagapudi, V.R., Yetukuri, L., Westerbacka, J., Sysi-Aho, M., Bergholm, R., Vehtari, A., Taskinen, M.R.,Yki-Järvinen, H., Oreši , M., 2007. Comprehensive metabolomic characterisation of lipoprotein fractionsreveals differential lipoprotein-specific regulation of xenobiotic and pro-inflammatory metabolites in pa-tients with metabolic syndrome. In: 76th EAS, June, Finland.
12. Talwar, P., Lengauer, T., Wittmann, C., Velagapudi, V.R., Heinzle, E., 2006. Development of Computa-tional Methods for Analysis of Metabolic Profiling Data. In: 7th ICSB, Japan.
11. Peddinti, G.V.,* Velagapudi, V.R.,* Lindfors, E., Halperin, E., Oresic, M., 2007. Dynamic network topol-ogy changes as result of cellular stress. In: ISSY-25, June 18-21, Espoo, Finland.
10. Velagapudi, V.R., Wittmann, C., Hollemeyer, K., Lengauer, T., Talwar, P., Heinzle, E., 2006. Metabolichigh-throughput characterization of yeast deletion mutants. In: ISSY-25. Finland.
9. Velagapudi, V.R., Wittmann, C., Lengauer, T., Talwar, P., Heinzle, E., 2006. Functional Genomics ofYeast by Phenotypic and Metabolic Flux Profiling. In: Genomes to Systems Conference, 3rd Consortium forPost-genome science, Mar 22-24, Manchester, UK.
8. Talwar, P., Lengauer, T., Rahnenführer, J., Heinzle, E., Velagapudi, V.R., Wittmann, C., 2005. Computa-tional methods for protein functional prediction using metabolomics and transcript co-response data. In: 6th
ICSB, Oct 19 – 23, Boston, USA.7. Talwar, P., Lengauer, T., Rahnenführer, J., Wittmann, C., Velagapudi, V.R., Heinzle, E., 2005. Computa-
tional methods for protein functional prediction using metabolomics data. In: International workshop onsystems biology, May 12-13, Milan, Italy.
6. Velagapudi, V.R., Wittmann, C., Lengauer, T., Talwar, P., Heinzle, E., 2005. High-throughput screeningof Saccharomyces cerevisiae Knockout Library: Method Development and Stoichiometric Profiling. In:FEBS Advanced Course on Systems Biology, March 12-18, Austria.
5. Talwar, P., Lengauer, T., Rahnenführer, J., Wittmann, C., Velagapudi, V.R., Heinzle, E., 2004. Computa-tional Methods for Metabolite Screening. In: 12th ISMB/ECCB, July 31-Aug 4, UK.
4. Talwar, P., Lengauer, T., Rahnenführer, J., Velagapudi, V.R., Wittmann, C., Heinzle, E., 2004. Computa-tional Methods for Metabolite Screening. In: 5th ICSB, Oct 9 – 13, Heidelberg, Germany.
3. Velagapudi, V.R., Wittmann, C., Talwar, P., Lengauer, T., Heinzle, E., 2004. Functional Genomics ofYeast by Metabolic Flux Profiling. In: 5th ICSB, Oct 9-13, Heidelberg, Germany.
2. Velagapudi, V.R., Wittmann, C., Lengauer, T., Talwar, P., Heinzle, E., 2004. Metabolic Flux Profiling ofSaccharomyces cerevisiae Mutants with Deletion of Genes in Central Metabolism at Miniaturized Scale. In:5th ESBES, Sep 8-11, Stuttgart, Germany.
1. Talwar, P., Lengauer, T., Wittmann, C., Velagapudi, V.R., Heinzle, E., 2003. Towards cellular functionthrough metabolite screening. In: Metabolic Profiling-Pathways in Discovery, Cambridge Healthtech Insti-tute Conference, Dec 8-9, New Jersey, USA