Phase Transformations in a Uranium-Zirconium Alloy ... · Phase Transformations in a...
56
AE-50 Phase Transformations in a Uranium-Zirconium Alloy containing 2 weight per cent Zirconium G, Lagerberg AKTIEBOLAGET ATOMENERGI STOCKHOLM • SWEDEN • 1961
Transcript of Phase Transformations in a Uranium-Zirconium Alloy ... · Phase Transformations in a...

AE-50
Phase Transformations in a
Uranium-Zirconium Alloy containing
2 weight per cent Zirconium
G, Lagerberg
AKTIEBOLAGET ATOMENERGI
STOCKHOLM • SWEDEN • 1961


AE-50.
PHASE TRANSFORMATIONS IN A URANIUM - ZIRCONIUM
ALLOY CONTAINING 2 WEIGHT PER CENT ZIRCONIUM.
G. Lagerberg
Summary.
The phase transformations in a uranium-zirconium alloy contai-
ning 2 weight percent zirconium have been examined metallographically
after heat treatments involving isothermal transformation of y and coo-
ling from the -y-range at different rates. Transformations on heating and
cooling have also been studied in uranium-zirconium alloys with 0. 5, 2
and 5 weight per cent zirconium by means of differential thermal analy-
sis. The results are compatible with the phase diagram given by Howlett
and Knapton (1).
On quenching from the y-range the y phase transforms marten-
sitically to supersaturated a the Mq temperature being about 490 C.
During isothermal transformation of y in the temperature range 735 to
700 C {3-phase is precipitated as Widmanstätten plates and the eqx i-
librium structure consists of (3 and y,. Below 700 C y transforms
completely to Widmanstätten plates which consist of (3 above 660 C
and of a at lower temperatures. Secondary phases, y~ above 610 C
and 6 below this temperature, are precipitated from the initially super-
saturated Widmanstätten plates during the isothermal treatments. At
and slightly below 700 C the cooperative growth of |3 and y? is observed.
The results of isothermal transformation are summarized in a TTT-
diagram.
Printed and distributed in April 1961.
LIST OF CONTENTS
s Page
1« Introduction 3
2. Experimental methods 4
3. Experimental results 8
4. Discussion 19
5. Summary and conclusions 22
Acknowledgements 24'
References 25

Phase transformations in a uranium- zirconrnm alloy containing 2 weight
percent zirconium.
1. Int r odu c ti on.
The efficient use of metallic uranium as a nuclear reactor fuel is
limited due to dimensional changes occurring as a result of irradiation
and thermal cycling at elevated temperatures. Iiz order to minimize these
effects as far as possible a fine grained and texture-less metal is desired.
Such a condition is more easily obtained if the uranium is alloyed. Alloying
might also increase the resistance to plastic flow which in turn will in-
crease the critical temperature for swelling due to the formation of
fission gas bubbles. From the point of view of neutron economy zirco-
nium with its low absorption cross section for thermal neutrons is one
of the very few alloying elements that could be considered for these
purposes in a reactor based on natural uranium. An optimum addition
seems to be about 2 weight percent (w/o). The behaviour of this alloy
as a reactor fuel has also been extensively studied and is described in
several reports from Argonne National Laboratory, Nuclear Metals Inc.
and Battelle Memorial Institute in U S A and from the Atomic: Energy of
Canada Ltd.
The binary phase diagram uranium-zirconium has been studied by
several investigators. Fig. 1 shows the diagram according to Howiett
and Knapton (l) which was based on a re-investigation of earlier work
by Summers-Smith (2). The latter author did not. include the intermediate
phase here designated 5. This phase has sometimes been assumed to be
metastable but is now well established as a stable phase (3, 4). On the
low zirconium side of the diagram disagreement exists about the extension
of "the a phase field. Thus according to the diagram dtte to Howl ett and
Knapton 3 transforms eutectoidally to a and y~ at 662 C. However, Sailer,
Rough and Bauer (5) assume a peritectoid reaction 3 + -v, —> a at 700 C,
as based on quantitative metallographic analysis and on high temperature
X-ray diffraction studies (6). Their version of the phase diagram, shown
in fig. 2, is supported by investigations by Philibert and Adda (7) and by
Bellot, Henry and Cabane (8) using X-ray microanalysis and differential

4.
thermal analysis respectively. However, Chiswik et al (9) arrive at
similar results as Howlett and Knapton. Neither of these authours
specify their methods of investigation.
Studies of transformation behaviour have been reported for ura-
nium-zirconium alloys with rather high zirconium contents (10, 11)
but no systematic investigation of the transformations at low zirconium
contents seems to have been published. The present investigation deals
with the transformation behaviour in a uranium-2 w/o-zirconium alloy.
The main part consists of a metallographic study of the isothermal
transformation of v in the temperature region 720 to 100 C from which
a time-temperature-transformation (TTT) diagram is derived. Supple-
mentary studies of transformation during heating c-->d cooling were carried
out for alloys with zirconium contents ranging from O to5 w/o by means
of differential thermal analysis (DTA).
The results support the phase diagram proposed by Howlett and
Knapton.
2. Experimental methods.
Test materials
The uranium-2 w/o-zirconium alloy was produced from calcium
reduced uranium metal and zirconium sponge. The alloy was first
melted under vacuum in a graphite crucible with a double coating of
magnesium zirconate and thoria to prevent excessive carbon pick up.
The melt was cast under vacuum in similarly lined graphite molds
into ingots, 38 mm in diameter and 500 mm in length. Two such ingots
were welded together and melted as a consumable electrode in a vacuum
arc furnace with a water cooled copper hearth. The resulting ingot with
a diameter of 80 mm was divided into four 90 sectors one of which
was machined to a bar with a 30 mm diameter. This bar was hot rolled
at 650 C to a diameter of 12 mm. Chemical analysis yielded the following
results.

12 mm. bar
Top end
Middle
Bottom end
Zr w/o
2 . 4
1.9
1.8
C
700
40
85
N
150
-
15
O
640„
110
ppm
Under the microscope specimens from the top end showed much car-
bides "whereas the bottom end was relatively free from these inclusions,
It is believed that the carbides seggregated towards the top end of the
ingot during arc melting because of their low density as compared to
that of the metal. UC and ZrC are isomorphous and have been shown
to be mutually soluble at 1200 °C (12). Hence it is likely that the car-
bide phase observed is (U, Zr) C in accordance with the fact that both
carbon and zirconium are enriched at the top end. Also oxygen and
nitrogen are enriched at this end and it is not unlikely that they are at
least partially dissolved in the carbide phase (13). It v/as found that
the high carbide content was confined to a short piece of the top end
of the bar. The remainder of it exhibited the low carbode content, cor-
responding to the analysis figures for the middle and bottom end of
the bar and was used at test material»
For the DTA-measurements two additional alloys with 0.5 and
5 w/o zirconium were prepared by arc melting» For the low zirconium
alloy metal from the ?- w/o alloy was diluted with technically pvtre ura-
nium and for the high zirconium, content s\ich uranium was melted to-
gether with iodide .zirconium. Melting v/as carried out in argon at low
pressure on a water cooled copper hearth and was repeated six times.
It was followed by annealing in the arc for 15 minutes at a temperature
slightly below solidus. The melts weighed about 20 g and their com-
positions were calculated from the known weights of the starting ma-
terials assuming complete recovery. The technically pure uranium ana-
lyzed 60 ppm of carbon as chief impurity.

6.
Heat treatment
The specimens used for heat treatment were half moon shaped
disks obtained by cutting 3 mm thick slices normal to the rolling direc-
tion of the uranium-2 w/o zirconium bar and dividing these along a
diameter. A small hole was drilled at the edge of the specimen so that
it could be attached to a stainless steel wire for the rapid manipulation
during heat treatment. For short times of isothermal heat treatment
0, 5 mm thick specimens were used to ensure rapid attainment of the
transformation temperature.
For the isothermal transformation treatments specimens were
solution treated at 900 C for 15 minutes in a tube furnace with argon
atmosphere. They were then rapidly transferred to the transformation
temperature at which they were held for various lengths of time. The
transformation was interrupted by quenching in a solution of 10 % so-
dium hydroxide in water. For transformation temperatures between
720 and 575 °C a salt bath was used consisting of a mixture of CaCl-,
NaCl and KC1 (Durferrit GS 430) in a steel crucible. Before use the
bath was deoxidized with silicon. For intermediate temperatures down
to 200 °C transformations were carried out in a lead-tin bath and at
100 C in boiling water.
In general the specimens started to corrode heavily after some
hours in the salt bath or in the lead-tin bath. Hence specimens inten-
ded for long transformation times (8 hours and more) were sealed into
evacuated quartz capsules and rapidly transferred from a tube furnace
at the solution temperature to another tube furnace at the transformation
temperature. Subsequently the specimen was quenched by breaking the
capsule under the sodium hydroxide solution. This transformation
treatment proved satisfactory for the higher temperatures. Below about
660 °C the cooling from the solution temperature was too slow to pre-
vent partial transformation before the transformation temperature was
reached, however. Lengthy isothermal treatments at these tempera-
tures were therefore carried out also by first transforming the bare
specimen in a salt or lead bath until all -y had transformed, quench, and

7.
then continue the treatment in a tube furnace with the specimen sealed
in a quartz capsule. Except for the transformation products formed
above the transformation temperature in the first method, the two
methods yielded the same structures. The second method was used
at 575 C and lower temperatures exclusively.
Heat treatments involving furnace cooling and air cooling were
performed with the specimens sealed in evacuated quartz; capsules.
To reduce contamination from quartz capsules specimens were some-
times wrapped in zirconium foil.
Metallographic preparation
After mounting the specimen a section parallell to the rolling
direction was prepared for metallographic examination. The surface
was wet ground on successively finer silicon carbide papers down to
paper no 320. It was then polished electrolytically according to Mott
and Haines (14) using an electrolyte of 1 0 g pyrophosphoric acid, 10 g
chromic oxide, 40 cc orth.opb.osph.oric acid, 100 cc sulphuric acid and
100 cc distilled water» The voltage was 1 0 V, the current density
0. 25 A/cm and the time of polishing a.bout 1 minute. During polishing
the specimen was gently rxtbbed with a piece of cotton to remove the
reaction products formed. The resulting specimen surface exhibited
a slight tarnish which was removed by a light mechanical polish on
alumina In this condition the morphology of the a-uranium crystals
co*xld be studied in polarized light.
A large number of the etching methods recommended in the li-
terature for uranium-zirconium, alloys were tried. Most of these
yielded poor results mainly because of heavy oxidation. The method
finally adopted was an electroe'.«.h used for uranium-molybdenum alloys
by Hills et al (15). The composition of the electrolyte was 10 g citric
acid, 10 g nitric acid and 90 cc distilled water. The voltage was 3 V,
the current density 0.2 A/cm and the etching time 5 to 15 seconds.
The best etching results were obtained if the specimen had been

8.
polished as described above. A specimen that had been polished mechani-
cally on diamond dust and on alumina was in general considerably tar-
nished dux'ing etching.
Cathodic bombardment etching according to Armstrong, Madsen
and Sykes (16) was tried on mechanically polished specimens. Except
for a few cases in which finely dispersed structures were clearly dis-
closed the results were not satisfactory.
3. Experimental results.
*)3.1. Isothermal transformation of y
Quenching from the y~range
Quenching from the -y-range results in a structure of lens shaped
plates with irregular boundaries in an acicular matrix consisting of
fine plates or needles as is illustrated in fig. 3 for a specimen quenched
from 900 C. Fig. 3 a shows the structure after etching in citric acid
and fig. 3 b the same area in the unetched condition using polarized
light. A previous v-grain boundary is visible as a border line limiting
the extension of a group of large plates. X-ray diffraction of the polished
surface using a Norelco diffractometer with Cu Ka radiation yielded a
a-uranium pattern corresponding to a slightly expanded unit cell. It is
believed that the large plates as well as the fine plates or needles of
the matrix are formed by the martensitic transformation of v to a as
will be discussed below» The a formed in this way *• 11 probably to a
large extent inherit the zirconium content of the -y-phase and will thus
become supersaturated with zirconium. This type of a will be termed
a in the following account in order to distinguish it from the a formed
under conditions permitting its composition to approach equilibrium more
closely.
*) '' The notation v i** the following account generally refers to a composi-
tion corresponding to y. in the phase diagrams in figs. 1 and 2.
9.
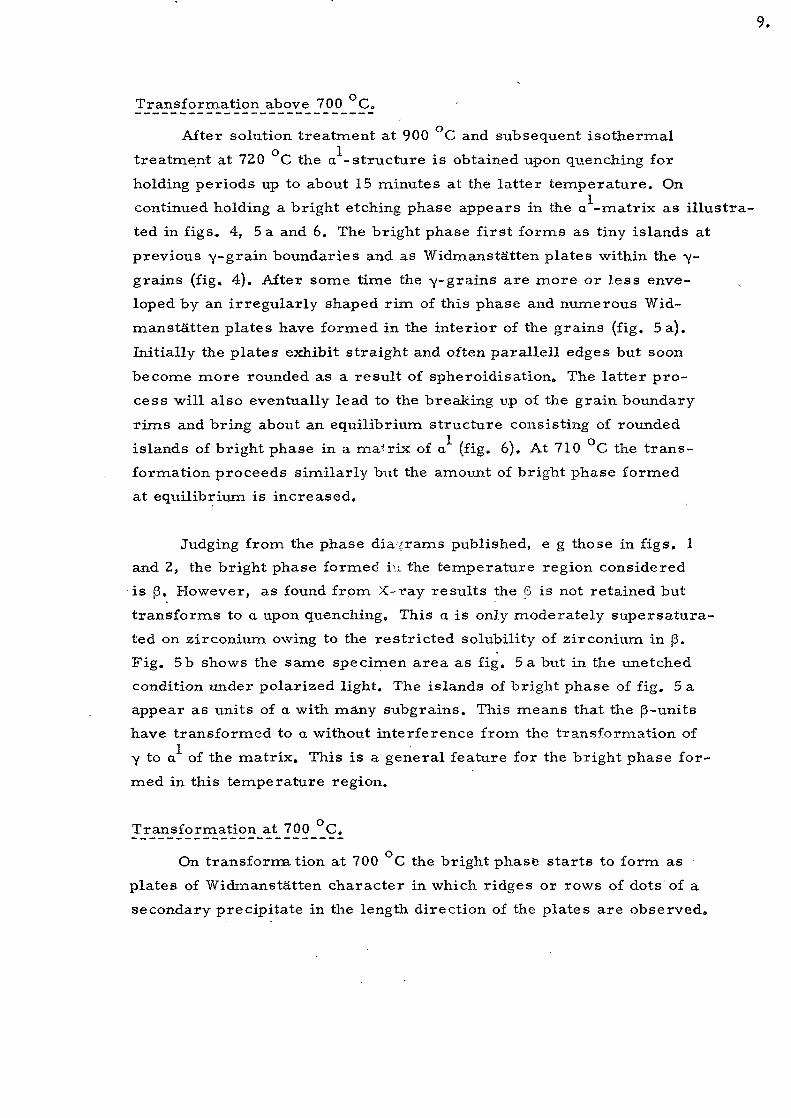
Transformation above 100 C.
After solution treatment at 900 C and subseqttent isothermal
treatment at 720 C the a -structure is obtained upon quenching for
holding periods up to about 15 minutes at the latter temperature. On
continued holding a bright etching phase appears in the a -matrix as illustra-
ted in figs.. 4, 5 a and 6. The bright phase first forms as tiny islands at
previous y-grain boundaries and as Widmanstätten plates within the y-
grains (fig. 4). After some time the y-gra-ins are more or less enve-
loped by an irregularly shaped rim of this phase and numerous Wid-
manstätten plates have formed in the interior of the grains (fig. 5 a).
Initially the plates exhibit straight and often parallell edges but soon
become more rounded as a result of spheroidisation. The latter pro-
cess will also eventually lead to the breaking up of the grain boundary
rims and bring about an equilibrium structure consisting of rounded
islands of bright phase in a matrix of a (fig. 6). At 710 C the trans-
formation proceeds similarly but the amount of bright phase formed
at equilibrium is increased.
Judging from the phase diagrams published, e g those in figs. 1
and 2, the bright phase formed in the temperature region considered
is {3, However, as found from X-ray results the 6 is not retained but
transforms to a upon qxienching. This a is only moderately supersatura-
ted on zirconium owing to the restricted solubility of zirconium in p.
Fig. 5b shows the same specimen area as fig. 5 a but in the unetched
condition under polarized light. The islands of bright phase of fig. 5 a
appear as units of a with many subgrains. This means that the p-
have transformed to a without interference from the transformation of
y to a of the matrix, This is a general feature for the bright phase for-
med in this temperature region.
Transformation at 700 C.
On transformation at 700 C the bright phase starts to form as
plates of Widmanstätten character in which ridges or rows of dots of a
secondary precipitate in the length direction of the plates are observed»

10.
In between these plates a pearlite like product of the same phases de-
velops. Both structure types are shown in fig. 7. Within 10 minutes the
•y-phase has transformed completely. Because of the proximity to the
eutectoid temperature longer times of heat treatment resulted in in-
consistent structures indicating that the specimen had spent unknown
proportions of the time in differc at phase regions. Hence, for these
times studies of structural changes were not attempted.
Transformation in the region 690 to 500 C.
As observed itnder the microscope the isothermal transformation
of -y in the region 690,to 500 C seems to follow one and the same ge-
neral pattern. The typical sequence of changes is illustrated for the
transformation at 690 C in figs. 8 to 11. After about 15 seconds at
this temperature narrow Widm uistätten plates which after etching
stand in relief over the a -ma'rix start to appear (fig. 8). They seem
to nucleate rather uniformly ti c mghout the matrix with a slight pre-
ference for nucleation sites at inclusions and v-grain boundaries. The
etched surface of the plates has ;, wrinkled appearence giving the im-
pression of a system of densly saaced ridges parallell to the longi-
tudinal directions of the plates» The Widmanstätten plates grow rapidly
and soon consume the y-matrix entirely as illustrated by fig. 9 a. The
same Widmanstätten pattern is also observed in the unetched condition
in polarized light (fig. 9b). At this stage of transformation the ridges
are more marked and on further holding they partially transform into
rows of dots (fig. 10 a). Obviously a secondary phase is precipitated
from the initially supersaturated Widmanstätten plates. When the pre-
cipitation reaction appears to be about completed the Widmanstätten
plates merge together to form a smooth and uniform, background (fig. 10 a)
which is probably a result of grain growth or re crystallization as is
obvious from fig. 10b. In the following account the process will be
referred to as re crystallization. On prolonged holding the precipitate
undergoes coalescence to rounded particles and plates (fig. 11),
At decreasing temperatures the Widmanstätten plates formed on
isothermal transformation become successively finer. The initial

11.
precipitation possibly proceeds somewhat more rapidly when decreasing
the temperature from 690 C to 650 C as the surface of the plates after
short times of treatment appears more mottled the lower the tempera-
ture in this region. At still lower temperatures no accurate observations
of the initial precipitation has been made because the structures are so
finely dispersed. The lower the temperature the longer are the times
required until a distinct precipitate is observed and until the recrystal-
lization commences. Below about 650 C the preference for nucleation
of Widmanstätten plates at grain boundaries is increased. This is no-
ticeable from the fact that -y-grain boundaries are often decorated by
fringes of parallell plates of a uniform lattice orientation growing into
the grain as shown in figs. 12 a and b. The finer scale of the reaction
products at lower temperatures is illustrated in figs. 12 and 13. The
transformation proceeds very rapidly below about 600 C as no remnants
of y are observed after periods as short as 2 seconds.
From the microscopical features of the Widmanstätten plates
formed in the temperature region considered no conclusions can be
drawn as to whether they are formed as j3-platea which subsequently
transform to a on quenching or form directly as a-plates,, X-ray
diffraction indicated the a-uranium structure in all instances the unit
cell being slightly expanded at the beginning of transformation and
gradually approaching the normal lattice parameters during the course
of transformation. However, as inferred from the DTA-results pre-
sented below the plates are (3 above about 660 C and a below this
temperature. This means that (3-plates on quenching transform indi-
vidually to more or less perfect a-plates as is evident from figs. 9a
and 9b. The decrease in lattice parameter as a result of isothermal
treatment probably reflects the rejection of zirconium from the initially
supersaturated transformation j. roduct.
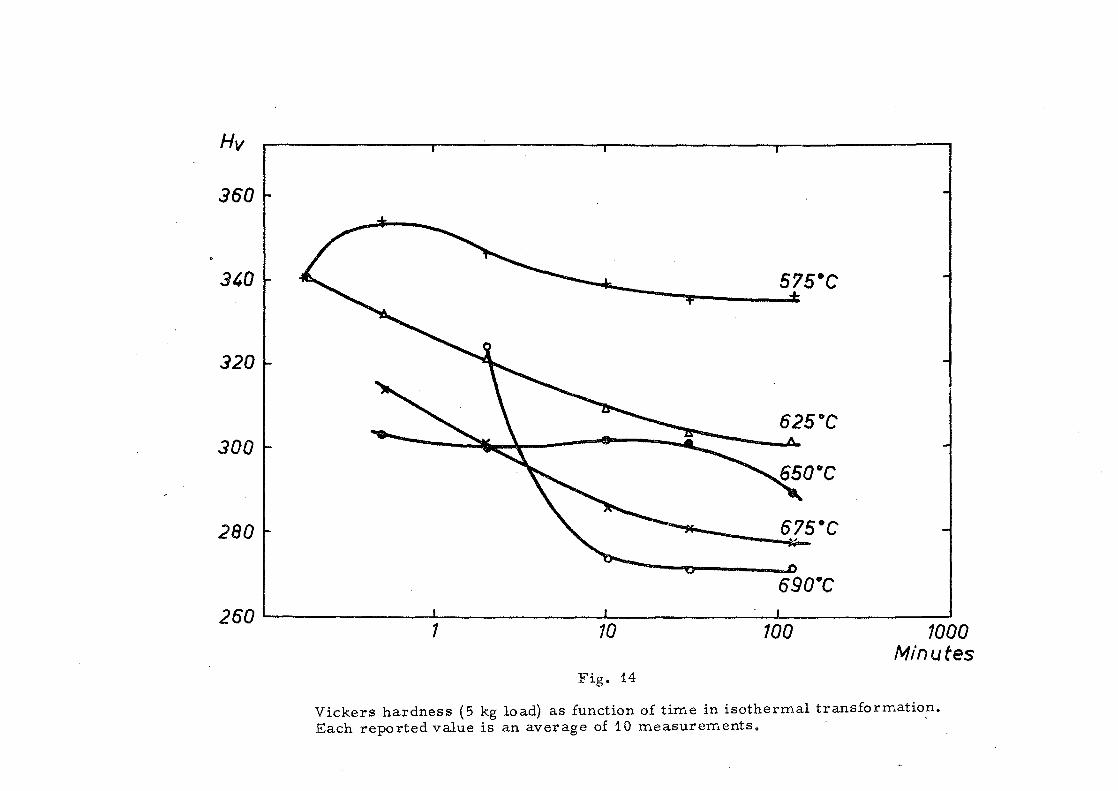
The changes taking place daring isothermal treatment for periods
up to 2 hours were also followed \ y measuring the hardness of quenched
specimens (fig. 14). As would be expected the precipitation of a secon-
dary phase, and at 690 and 675 ",, also the recrystallization ventually
leads to a softening. The curve at 575 C exhibits a typical x. .jecipitation

12.
hardening peak. The decrease in initial hardness with temperature in
the region from 690 to 650 C might be a consequence of a correspon-
ding acceleration in the initial precipitation reaction. The increase in
initial hardness when decreasing the temperature below 650 C is pro-
bably a result of a finer dispersion of the reaction products.
Transformation below 500 C.
After short transformation times in the temperature region below
500 C large lens shaped plates appear in a finely accicular matrix as
is illustrated for transformation at 350 C in fig» 15. The size and shape
of the large plates is independent of transformation temperature and
time. However, the number of these plates increases the lower the
transformation temperature. Thus at 475 C only a few single plates
are observed whereas at 100 C plates appear rather densly as shown
in fig. 16. Still more large plat JS are formed upon quenching to room
temperature as is evident froi i fig. 3 a. Obviously the large plates are
the a phase formed by the marxnsitic transformation of v. The Ms
temperature for this reaction li •*s between 500 and 475 C.
The acicular matrix surror ading the a plates forms in a manner
analogous to that described for tl ^ temperature region abo e ->D0 C.
Thus the part of the v phase, thai on passing the M temperature does1 S
not form a , rapidly transforms by the formation of fine plates which
are probably supersaturated with zirconium. The nucleation of such plates
at y-gra.in boundaries is frequently observed (fig. 15). On prolonged hol-
ding fine particles of a secondary phase are precipitated from the fine
supersaturated plates and at least at the higher tsmpenture? s transition
from a large number of individual crystals to a coarser crystalline struc-
ture is observed under polarized light. However, these reactions proceed
very sluggishly and they have not been studied in detail.
Precipitation of a secondary phase within the a plates on prolonged
holding at the transformation temperature has also been observed.

13.
The transformation diagram
Based on the observed structures of transformed specimens the
TTT-diagram of fjg. 17 has been constructed. The solid curves denote
the beginning and end of y-transformation. The accurate drawing of
these curves was to some extent aided by judging visually the degree
of transformation. In their uncertain extensions the curves are dashed,
A dashed curve also denotes the start of recrysta Jization of the Wid-
maristätten matrix.
The marked discontinuities at about 660 C in the curves for the
beginning and end of y-transformation indicate a change in. the trans-
formation mechanism at: that temperature, This result combined with
the fact that the curve for the start of transformation seems to be
contimious from 660 C and upwards in the (p + y.)-region strongly
suggest the type of phase diagram proposed by Hewlett and Knap ton (l),
fig» 1. The discontinuity at about 610 C in the curve for the end of
y-transformation might possibly reflect the horizontal for the peritectoid
reaction y_ + a —*S in this phase diagram, which is also qua.! itatively
supported by the DTA-measurements presented below. However, a
more likely explanation will be g;ven in the discussion, The M tempe-
rature for the martensitic y—> a reaction has been placed at 490 C.
La accordance with the phase diagram the secondary phases ob-
served are assumed to be y? above and 5 below about 610 "" C,
The existence ranges for the various phases that are indicated In
the TTT-diagram have been inferred from the phase diagram of fig. 1
and the present observations.
3O2. Transformation ^structures obtained on cooling from the y-range
As an application to the TTT-diagram transformation structures
were studied after cooling from the y-range at different rate,%

14.
Oil quenching from 900 C yielded a structure similar to that ob-
served on quenching in boiling water, fig. 16. Hence, at this cooling
rate the Y transforms below the M -temperature (about 490 C) by the
martensitic Y-><* reaction and possibly also to a minor extent by the
direct formation of supersaturated acicular a as previously outlined.
The distinction between these two reactions will be further discussed.
Cooling in air from the same temperature results in a Widman-
statten structure typical of that formed on isothermal transformation
between 700 and 650 C as illustrated in fig. 9 a. The same plate struc-
ture is also observed in polarized light. It is concluded that the Y trans-
forms to p-plates which in turn transform individually to a-plates.
Furnace cooling at a rate of about 2 C per minute results in a
complex structure the formation of which was studied by cooling spe-
cimens from 800 C to successively lower temperatures from which
they were quenched. Slightly above 700 C j3 starts to form as a few roun-
ded islands that rapidly grow in si^e while retaining smooth boundaries
towards the Y-matrix. After cooliag to 690 C the p-island- have grown
further and in some places theii boundaries appear ragged because of
the outgrowth of fringes of parallell Widmanstatten plates from the
smooth p as shown in fig. 18. A secondary precipitate is observed as
dots or ridges at the boundaries of these plates. At 680 C about 40 %
of the specimen area is occupied by untransformed Y» The (3-islands
seem to have grown exclusively by extending Widmanstatten fringes
but isolated plates of p also occur within the v-matrix as shown in fig. 19.
Slightly below 670 C the last remnants of Y are transformed. The struc-
ture now consists of smooth patches ((3 formed above and slightly below
700 °C) in a matrix of Widmanstatten plates of varying size. The larger
plates are those which originally formed as isolated units in the Y~3^iatrix.
The secondary phase at the plate boundaries becomes more distinct on
further cooling but otherwise no spectacular changes are observed.
Fig. 20 shows the Widmanstatten pattern outlined by the precipitate
after cooling to room temperature. Re crystallization as observed during
isothermal transformation is almost completed at the end of Y transfor-
mation (slightly below 670 C) anO the transformation of p to a must be
assumed to take place somewhere below 650 C (ef DTA-measurements),

15.
3. 3. Grain size of the a-phase4
Since one of the main objectives for alloying uranium metal is to
reduce its grain size it is of interest to study the effect of an addition
of 2 w/o zirconium in this respect. Grain size in a-uranium is difficult
to estimate because of the abundance of subgrains which makes measure-
ments of grain diameters in polarized light very subjective. With this
reservation the following figures may be quoted for some of the heat
treatments in the present investigation.
Heat treatment Average grain diameter in microns
Isothermal transformation
at 690 °C for 8 hr (fully recrystallized) 50 - 100
Isothermal transformation
at 575 °C for 144 hr (partly "W idmanstätten) 20 - 50
Furnace cooling from
800 °C at a rate of 2 °C/min. (fully recrystallized) 80
Air cooling from
900 °C (Widmanstätten) 10-30 .
These figures should be compared to a grain diameter of 200 microns
which about corresponds to the smallest grain size which could be consi-
dered as reasonably stable in the a-range for technically -pure uranium.
3.4. Differential thermal analysis (DTA)
As a supplement to the microscopic study of transformation be-
haviour in the uranium - 2 w/o - zirconium alloy the transformations in
uranium and uranium - zirconium alloys containing 0.5, 2 and 5 w/o
zirconium were investigated by means of DTA using argon as protective
atmosphere. The results of these measurements are summarized in
figs. 21 and 22. The curves represent the temperature difference between
the specimen studied and a reference sample of platinum (which has no

16.
allotropic transformations) during heating (fig. 2t) and cooling (fig. 22)
at a rate of 10 C per minute. In general the temperature difference is
zero but when a transformation occurs on heating the uranium or ura-
nium - zirconium alloy, its temperature will decrease åve to heat ab-
sorption. This is reflected as a dip in the DTA-curve. Similarly the
heat evolved during transformation on cooling will cause a peak in the
curve. On heating the start of transformation corresponds to the point of
deflection on the low temperature side of the dip and the end of trans-
formation to the minimum point. The ojaposite conditions prevail for
cooling.
The DTA-curves recorded always exhibited a slight change in tem-
perature difference between the two samples, noticeable as a moderate
and slowly varying slope. This yffect was probably caused by oxidation
of the uranium or uranium - zirconium alloy due to oxygen impurities
in the argon gas and to differej (.>s in heat transfer properties for the
two samples. The presented ciu-v is have been corrected f^r 'his back-
ground drift and show only the - < ry distinct dips and peaks: ' i the re-
corded curves.
The transformation temperatures in uranium and uranium - zir-
conium alloys are subject to considerable hysteresis. Thus, it has
been shown by Duwez (17) that the transformation temperatures in tira-
nium can be suppressed by more than 100 C on rapid cooling. Therefore
itwouldbe desirable to carry out the DTA-measurements at a slow rate
of temperature change but a limit is set for this rate in that too slow a
temperature change will result in poor resolution of dips and peaks. The
selected rate of 10 C per min
of experiments reported here.
selected rate of 10 C per minute appears to be convenient for the type
The temperature scale in the recorded DTA-curves is to be con-
sidered as a relative scale only since its measurement is carried out
under a non-steady state. The recorded temperature may therefore not
be representative for the exact temperatures of the two samples. There
might also between runs be slight changes in the environment of the hot

17.
junctions of the thermocouples leading to different recorded temperature
scales in separate runs. To overcome these difficulties a common tempe-
rature scale -was established by carrying out DTA-measurements for the
uranium - zirconium alloys also against pure uranium. The start of the
transition from a to p on heating was set at 666 C in the pure uranium
in accordance with the results of Klepfer and Chiotti (18). It is reaso-
nable to adopt this vahie for the present experiments since the suppresion
of the transformation on cooling at 10 C per minute amounts to a few '
degrees only according to Duvez and the overshoot on heating at this rate
is likely to be less . With this temperature scale the transformation tem-
peratures as obtained for pure uranium with DTA are in good agreement
with the values obtained by resistance measurements by Klepfer and
Chiötti as shown in the following table.
Check of the established temperature scale for DTA-measurements.
Transformation temperatures in uranium, C.
Heating Cooling
P Pr Y Yc P Ps a- a ,S> X O X ö X £> J .
Klepfer and Chiotti (18) j>66 690 776 786 772 761 658 645
DTA, this investigation j>66 690 776 795 770 758 665 650
The subscripts s and f refer to start and finish.
The accurate positioning of the dips and peaks for the uranium -
zirconium alloys in the DTA curves was greatly facilitated by measure-
ments against the uranium sample.
It is seen in fig. 21 that the temperature for the sto .*t of ^-formation
on heating is raised at least 5 C by the addition of 0. 5 w/o zirconium. A
further rise is evident at increased zirconium content. Possibly the zir-
conium content has a delaying effect on the mxcleation of (3 on heating. The
transition of fi to y is lowered x, 0. 5 w/o zirconium in accordance with
the phase diagram, fig. 1. Following this diagram in the interpretation

18.
of the heating curve for the 2 w/o zirconium, alloy it is seen that the
transition from a (+ Y?) t o P (+ Y?) *S s o o n f°H°we(i by the reaction
(3 + Y? —>P + y-i. The corresponding dips overlap. The continued trans-
formation of (3 + Y, to y occurs over a temperature interval which is
reflected in the flattening of the curve on the high temperature side of
the minimum. In the heating curve for the 5 w/o zirconium alloy the
reactions a (+ Y?) "" P (+ Y->) a n <^ P * Y?~~*P " Yi overlap completely.
The last reaction could also be considered as |3 + y~—>Yi since 5 w/o
zirconium is very close to the eutectoid composition for this reaction.
If there is a temperature interval over which the transition occurs due
to non-eutectoid composition it is too small to be reflected in the DTA-
curve. The dips observed at about 625 C in the 2 and 5 w/o zirconium
curves correspond to the 8—»y? transition.
On cooling (fig. 22) the corresponding transformations are ob-
served although displaced to lower temperatures because of the hysteresis
effect. In the 2 w/o zirconium alloy the -y to |3 transition is suppressed
so much that most of it occurs in the (p + Y2)~regi°n °f t n e phase diagram.
Consequently no transformation over a temperature interval is reflected
by the curve. For the 5 w/o zirconium alloy the peaks corresponding to
P and j3—>a reaction overlap as was also the case on heating.
The transition temperatures found in the uranium - zirconium alloys
agree qualitatively with the phase diagram of Howlett and Knapton (1),
fig. 1. The hysteresis effects, however make a quantitative comparison
difficult. Particularly large hysteresis is encountered for the a + Y?<^P + Y?
reaction.
The integrated area over a dip or under a peak is a measure of the
heat of reaction. In pure uranium the values of A H are 714 and 1166
cal/mole for the a—-»p and j3—»Y reactions respectively (19). The corre-
sponding areas from the DTA-curves roughly agree with these figures.
It is also noticable that the area for the S^Y? reaction increases as the
amounts of these phases increase at increasing zirconium content. How-
ever, the ordinate scales for the separate runs may be slightly different
and only qualitative comparisons shoiild be made.
19.
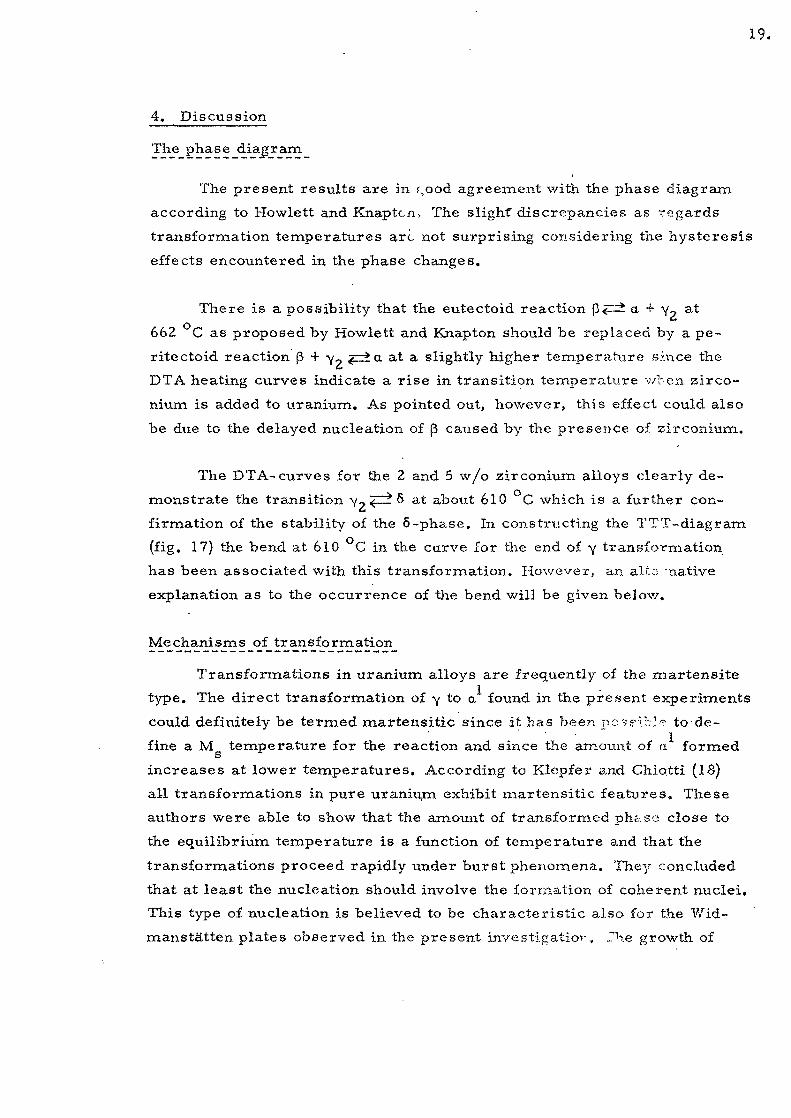
4, Discussion
The phase diagram
The present results are in r,ood agreement with the phase diagram
according to Howlett and Knaptcn, The slight discrepancies as regards
transformation temperatures are not surprising considering the hysteresis
effects encountered in the phase changes.
There is a possibility that the eutectoid reaction P<P a -f v? att
662 C as proposed by Howlett and Knapton should be replaced by a pe-
ritectoid reaction (3 + y~ r±a at a slightly higher temperature since the
DTA heating curves indicate a rise in transition temperature v/hen zirco-
nium is added to uranium. As pointed out, however, this effect could also
be due to the delayed nucleation of j3 caused by the presence of zirconium.
The DTA-curves for the 2 and 5 w/o zirconium alloys clearly de-
monstrate the transition v-^Z^S at abotxt 610 C which is a further con-
firmation of the stability of the 6~phaser In constructing the TTT-diagram
(fig. 17) the bend at 610 C in the curve for the end of y transformation
has been associated with this transformation. However, an alt,?..-native
explanation as to the occurrence of the bend will be given below.
Mechanisms of transformation
Transformations in uranium alloys are frequently of the martensite
type. The direct transformation of -y to a found in the present experiments
could definitely be termed martensitic since it has been pcse-Vcie to de-
fine a M temperature for the reaction and since the amount of a formed
increases at lower temperatures. According to Klepfer and Chiotti (18)
all transformations in pure uranium exhibit martensitic features. These
authors were able to show that the amount of transformed phf.se close to
the equilibrium temperature is a function of temperature and that the
transformations proceed rapidly under burst phenomena. They concluded
that at least the nucleation should involve the formation of coherent nuclei.
This type of nucleation is believed to be characteristic also for the Wid-
manstätten plates observed in the present investigation-, 1'h.e growth of

20.
of such plates may occur by an atom by atom diffusion process or by a
shear mechanism in which case the reaction is to be considered as
martensitic. The probable mechanisms encountered during isothermal
transformation of y will be discussed in terms of these concepts.
In the (j3 + Yii-^gion the precipitation of j3 is likely to be con-
trolled by zirconium diffusion. The nuclei are believed to be coherent
to a large extent, also for the p-particles nucleated at grain boundaries.
This is inferred from the observation that on slow cooling, Widman-
stätten plates start to grow from and are continous with the rounded
p-islands (figs. IS and 19) which presupposes a definite orientation re-
lation between the lattices of the j3- and -y-phases already from the start
of (3-formation.
Slightly below the eutectoid temperature at 700 C, p and y7 form
simultaneously, the p-phase exhibiting marked Wldmanstatten character.
Adopting the terminology suggested by Hillert (20) the process may be
described as cooperative growth implying that the two phases grow to-
gether as an aggregate, thereby accelerating each others growth rates.
As pointed out by Hillert both pearlite and bainite in stee] can be de-
scribed on this basis and the difference in their modes of formation is
not clear. The evidence of analogous types of aggregates in the present
case (fig. 7) is to be noted. It is possible that their mechanisms of for-
mation are basically the same, e g the morphology might be determined
by the Widmanstätten orientation of (3 in both instances.
At somewhat lower temperatures p as Widmanstätten plates is the
only phase formed at the initial period of transformation (fig. C). Since
the subsequent precipitation of y? occurs within the j3-plates these are
initially assumed to be supersaturated on zirconium by inheriting the
zirconium content of the matr-z . The growth process should then not
require long range zirconium difusion, as postulated for j3-growth above
the eutectoid temperature, althovgh it might still occur L means of
diffusion jumps across the advar cing interface. (On furnace cooling through
this temperature region long r u ge diffusion of zirconium seems to be of
importance since it is observed that the last y transforms at about 670 C
which probably implies zirconium enrichment in that y).

2 1 .
In the (a + -y-)-region supersaturated Widmanstätten plates of a
are believed to form directly from y in a manner similar to that de-
scribed for (3 in the (|3 + -y?)-region. However, the bend at 610 C in
the curve for completed -y-transformation might possibly indicate a
transition in the growth mechanism from a diffusion to a shes,r process
since the reaction rate is markedly increased below this temperature.
Such a transition provides a more likely explanation for the bend than
does the phase change y~ ^dt 6 since the growth mechanism should be
unaffected by a subsequent precipitation process within the transformed
phase. White (21) observed a similar discontinuity in the transformation
of low chromium uranium-chromium allots and he attributed this to a
change from diffusion to martensitic growth. Below aboi t 610 C the
transformation of -y should then occur by the martensitic formation of
supersaturated a. However, at temperatures below about 490 C this
reaction is prece.eded by the partial transformation of -y to large a -plates,
i e the transformation proceeds by two siiccessive and possibly compe-
titive martensite reactions. The crystallographic features of these reac-
tions might differ but the transformation products are probably the same,
apart from their morphologies.
Precipitation within the transformation products
The supersaturated Widmanstätten plates of (3 and a formed on
isothermal transformation, rapidly reject their excess of zirconium by
the precipitation of y? above 610 C and of 5 below this temperature. It
seems as if the initial precipitation is somewhat slower at 690 than 650 C.
This is obvious both from the metallographic observations and from the
decrease in initial hardness (fig. 14). However, the over all process
requires longer times the lower the temperature. It has not been possible
to outline the start and end of tre;e reactions in the TTT-diagram. They
seem to start in the individual ".Vidmanstätten plates shortly after their
formations (cf selftempering of \ artensite in steel). The experimental
methods used are not capable of Oe'erming the end of the precipitation
reactions which also involve the co;.lescense and the d~rre< 3e in number
and increase in size of the precipitated particles.

22,
Particles of •y-, will transform to 6 ox-, quenching. This reaction
probably occurs in situ as has been shown by Holden and Seymour (22)
for massive 5-phase alloy.
The 0 to a transformation
It is a striking fact that the appearance after etching of the Wid-
manstätten plates does not change markedly when 11 e transition temperature
at 660 C is passed. Possibly this has been one of the reasons for the out-
lining of the phase diagram as proposed by Sailer et al (5), The transfor-
mation of (3-plates to a on quenching probably occurs in situ as demon-
strated by figs, 9 a and b. This is also true for the (3 formed above the
eutectoid temperature at 700 C (figs. 5 a and!)). To a large extent the
G-units seem to be transferred to single crystals of a which, however
often display subgrains. The sutgrains are believed to result from strain-
induced polygonization caused by the volume changes accompanying the
transformation as has been she \ •> by Cbiswik and Lloyd (23) and Cahn
and Tomlinson (24), The charaeie. of an in situ transformation is pro-
bably preserved as long as differ- i ces in the dissolved zirconium con-
tent and in states of stress exis' titween adjacent p-crystals. When pre-
cipitation reactions have come t -• n ena, however, the boundaries be-
come more mobile leading to the observed crystal growth or recrystalli-
zation.
5, Summary and conclusions
Phase transformations in a uranium-zirconium alloy containing
2 weight precent zirconium have been studied with the microscope after
heat treatments comprising isothermal transformation of v in the tem-
perature region 720 to 100 C and cooling from the -y-range at vario\is
rates. The transformations on heating and cooling of a series of uranium-
zirconium alloys containing 0, 5, 2 and 5 w/o zirconium have been studied
by means of differential thermal analysis and the results have been cor-
related with the transformations in technically pure uranium. The fin-
dings are compatible with the uranium-zirconium phase diagram pro-
posed by Howlett and Knapton (1) but not with the diagram according to
Sailer, Rough and Bauer (5).

23.
The isothermal transformation study has been summarized in a
time-temperature-transformation diagram. The various reactions
occurring during isothermal transformations and their corresponding
mechanisms have been suggested as follows.
a) Above 700 C. j3-phase is precipitated mainly as Widmanstät-
ten plates. The growth is controlled by zirconium diffusion.
The equilibrium structure consists of (3 + y.
b) At and slightly below 700 C. v transforms by the diffusion
controlled cooperative growth of ,6 and y^.
c) Between 690 and 660 C. y transforms to s\iper saturated Wid-
manstätten plates of p which subsequently precipitate particles
of Y ? . The growth is probably diffusion controlled.
d) Between 660 and 610 C, y transforms to supersaturated Wid-
manstätten plates of a which subsequently precipitate particles
of Y->« The growth is probably diffusion controlled.
e) Between 610 and 490 C. y transforms to supersaturated a in
the shape of plates and needles and possibly by a martensitic
reaction. From the a-phase,particles of 6 are subsequently
precipitated,
f) Between 490 C and room temperature, y transforms to .super-
saturated a by two successive and possibly competitive marten-
sitic reactions. In the first reaction part of the y transforms
to fairly large lens shap' d plates called a and in the second,the
remaining y transforms to a fine acicular structure analogous
to that described under e). The number of a -plates increases
at lower temperatures. From both structure types 6 particles
are subseq\iently precipitaced but this reaction is extremly
sluggish.
The p-phase is not retained but transforms co a upon quenching.
This transformation often seems to involve the formation of single

24.
a-crystals from each individual Widirxanstälten plate of p\ These a-
crystals often contain subgrains, probably as a result of strain-
induced polygonizafcion. Yvidmanstattcn olates of supersaturated 3
or a disappear, subsequent, to the precipitation of secondary phases,
as a result of grain growth or re cry stalijz.rtiort.
Cooling from the -y-range at various rates yields structures
that are easily interpreted froTrs the tiroe-temperature-transformation
diagram. It is established that the addition ox 2 weight percent zir-
conium to uranium markedly refines the strain siz;e.
Acknowledgements.
The author is indebted to Dx R, Kies^iing, bead of the depart-
ment for Materials Research, for his interest and support in this
investigation. Thanks are due to Mr B» "Ulanxier for his jissistance
in heat treatment and metaliographic preparation, to Mr G, Berggren
for preforming the DTA-measurements» to Mr A. Ostlund for assi-
stance in alloy preparations and Io Messrs G. Östberg and J>« Nelson
for valuable discussions»

25.
References.
1. HOWLETT B W, KNAPTON A GThe alloy systems uranium-1 Itanium, uranium-zirconium anduranium- titanium- zir conii imA/Conf. 15/P/1469 (1958)
2. SUMMERS-SMITH DThe constitution of uranium-zirconium alloysJ. In.st. Metals J53 (1954-55) 277
3. ROUGH F A, AUSTIN A E, BAUER A A, DOIG J RThe stability and existence range of the zirconium-uraniumepsilon (delta) phaseBMI-1092 (1956)
4. DUFFEY J F, BRUCH C ADelta phase field of the U-Zr equilibrium diagramTrans AIME 212J1958) 17
5. SALLER H A, ROUGH F A, BAUER A AThe system U-Zr in "Constitution of uranium and thoriumalloys, BMI-1300 (1958)" based on unpublished work 1954.
6. BAUER A AAn evaluation of the properties and behaviour of zirconium-uranium alloysBMI-1350 (1959)
7. PHILIBERT J, ADDA YEtablissement des diagram.Taes des alliages binaires pardes experiences de diffusion intermetalliqueCompt. Rend ,245 (1957) 2507
8. BELLOT J, HENRY J M, CABANE GContribution a 1'étude des alliages d "uranium par analyse thermiquedifferentielle sous videRev. Métallurgie J36 (1959) 301.
9. CHISWIK H H, DWIGHT A E," LLOYD L T, NEVITT M V,ZEGLER S TAdvances in the physical metallurgy of uranium and its alloysA/Conf 15/P/713 (1958)
10. KEARNS J JThe transformation kinetics of uranium zirconium alloys con-taining 50 and 60 weight percent uraniumWAPD-T-417 (1956). Submitted to Trans AIME.
11. DOUGLAS B L, MARSH Jr L L, MANNING G KTransformation kinetics of zirconium-uranium alloysTrans, ASM 50 (1958) 305

26.
12. BROWNLEE L DThe pseudo-biiiary systems of vraniiim carbide and Kirconmmcarbide, tantalum carbide and niobium carbideJ. Inst. MetaJs £7 (I95C-59) 5C
13. KEIiL G L, MZNDDL E, JARAIZ F E, MUELLE;t M HMctallograohic identification of inclusions hi. i-raniumTrans ASM _5i (i959) 717
14. MÖTT B W, ITAINES H RMetallography of uraniumJ. Inst." Metals £0_ (i 95] - 6 c) 62]
15. KILLS R F, RA,<RDCS D a, IIODKIK O J, V/ALDIION M BTransformation of meta stab i c phases i i VAC \iraniuin- molybdenumalloy systemAERE M/R 2840 (1959)
16. ARMSTRONG D, MADSEN P E, SYKES E CCathodic bombardment etching of rnetnls with particular refe-rence to uranium., thorii'.in arsd tbeii: allovsJ. ISivcl. Materials l_ (1959) 127
17. DUWEZ PThe effect of the rate of cooJing OTI the atlotropic trai\sformationtemperatures of uraniumJ. AppL Pays. 2A (1953) 152
10. KLEPFER K H, CH1OTTT PCharacteristics of Lhe solid state transformations in uranmrr!ISC-893 (1957)
19. HOLD EN A NPhysical Metallx'rgy of Ura;\b*m. Add i K on Wesley Publishing Co, ,lac. Heading, Mass. USA 195C.
20. HILLERT MThe role of interfacial ei:erD;y du.rin« solid state IransformationsJernk. Ann. 14] (1957) 757'
21. WHITE Jr D \VTransformation kinetics in uranium-chromium alloysTrans AIME 2_03 (1955) 1221
22» KÖLDEN A N, SEYMOTjT W EIntermediate phase in the iiraniuni-zircoiiium systemTrans AIME |o6 (1956) 1 ?• 1 Z
23, CHISWIK II ]•:, LLOYD L TSome aspects of the beta to alpha transformation in r.raniiim,Metallo«raphic strucU-re aaid orientation relationshipsANJL-5777 (i959)

24. CAHN R W; TOM LINS ON HThe nature of subgrain boundaries due to phase transformationsin uraniumJ. Nucl. Materials 2 (I960) 88.
GL/EL


2 5 10 20 30 40 50 60 70 80 90100w/0Zri | * • * i i » r
850
800 -
550
oOO
20 30 40 50 60 70 80 90 100 &/0 ZrFig. 1
Uranium-zirconium phase diagram according to Howlett and Knapton (1).


2 5 10 20 30 40 50 60 70 80 90 100 ^0 Zr
500 -
O 10 20 30 40 50 70 SO 90 100 <*/OZr
Fig. 2
Uranium-zirconium phase diagram according to Sailer, Rough and Bauer (5).


»
900 C 15 min., quenched. Plates of a'
a) Citric acid etch. x 500.
b) Same area unetched, polarized light. x 500.
Fig. 4 900 C 15 min., quenched to
720 C, isothermally trans-
formed 15 min., quenched.
Bright phase at y -grain
boundaries. x 500.
Fig. 5 900°C 15 min., quenched to 720°C, isothermally
transformed 30 min. Bright phase as Widmanstätten
plates and grain boundary rim.
iff
a) Citric acid etch. x 500.
b) Same area unetched, polarized light. x 500.

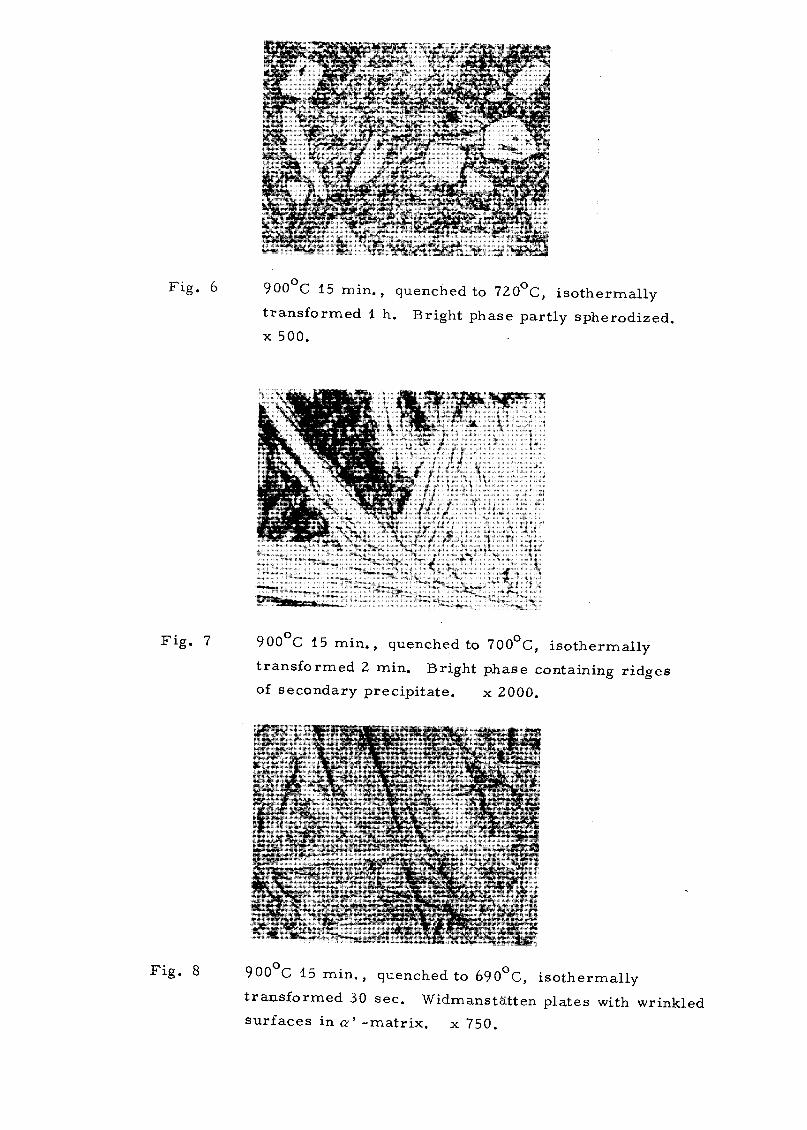
Fig. 6 900°C 15 min., quenched to 720°C, isothermally
transformed I h. Bright phase partly spherodized.
x 500.
Fig. 7 900 C 15 min., quenched to 700°C, isothermally
transformed 2 min. Bright phase containing ridges
of secondary precipitate. x 2000.
Fig. 8 900°C 15 min. , quenched to 690°C, isothermally
transformed 30 sec. Widmanstätten plates with wrinkled
surfaces in a' -matrix. x 750.

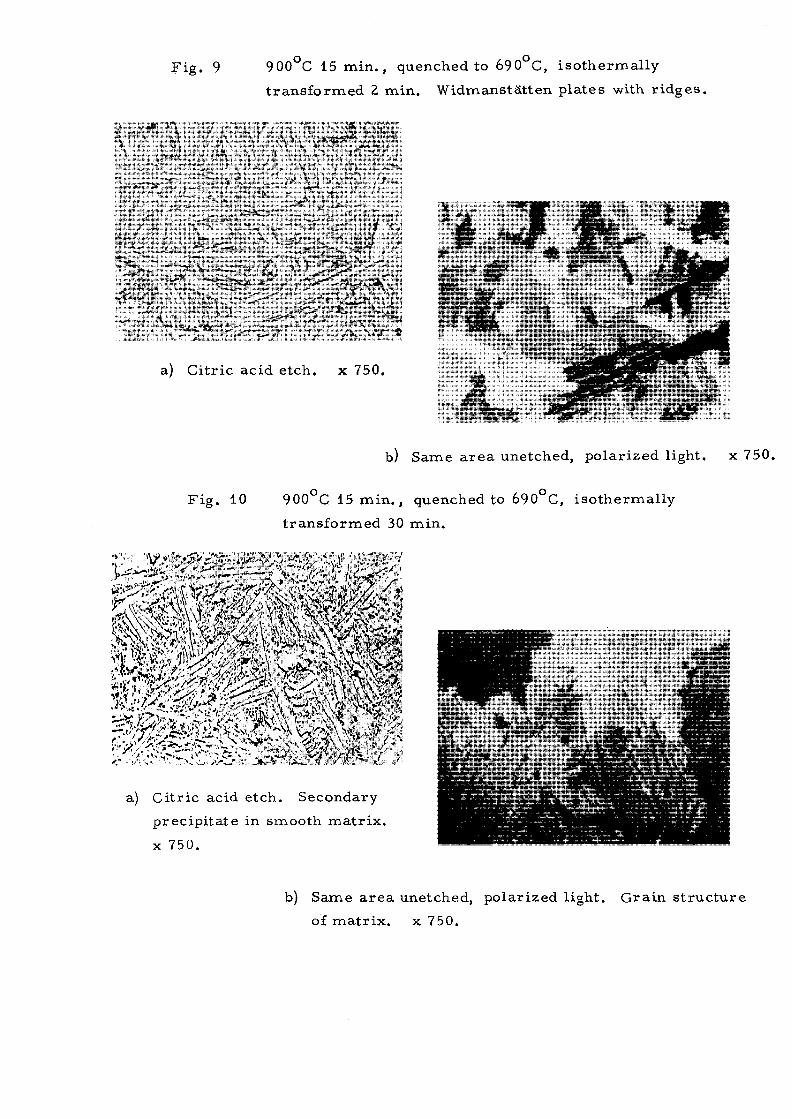
Fig. 9 900°C 15 min. , quenched to 690°C, isothermally
transformed 2 min. Widmanstätten plates with ridges.
a) Citric acid etch. x 750.
•Sr* ' )HF
b) Same area unetched, polarized light. x 750,
Fig. 10 900°C 15 min., quenched to 690°C, isothermally
transformed 30 min.
a) Citric acid etch. Secondary
precipitate in smooth matrix.
x 750.
b) Same area unetched, polarized light. Grain structure
of matrix. x 750.


Fig. 11 900°C15min., quenched to 690°C, isothermally
transformed 24 h. Secondary precipitate. x 75 0.
Fig. 12 900°C 15 min., quenched to 575°C, isothermally
transformed 10 min. Mottled Widmanstätten plates.
a) Citric acid etch. x 1200.
b) Same area unetched, polarized light. Note uniform
orientation of plates nucleated at the grain boundary.
x 1200.


Fig. 13 900°C 15 min. , quenched to 575°C, isothermally
transformed 144 h. Secondary precipitate in smooth
matrix. x 1200.
Fig. 15 900°C, quenched to 350°C, isothermally transformed
10 min. Large a' -plates in finely acicular matrix.
Note the previous y -grain boundary. x 750.
'
Fig. 16 900°C 15 min., quenched to 100°C, isothermally trans
formed 10 min. Large and fine a' -plates. k 750.

300 h
280
2601000
Minutes
Vickers hardness (5 kg load) as function of time in isothermal transformation.Each reported value is an average of 10 measurements.


700 —
600
400
300
735*0
700'C
6S0'C
RecrystalUzation
*Z 610'C
O.ci 0,1
d.o recrystatiized
B d.o recrystallfzed
10 100 1000 10000Minutes
Figo 17
Time-temperature-transformation diagram for a uranium-2 w/o-zirconium alloy.


. 1 . . ,
"7) ** f 5 / 7 . /'"' '•'*'•
Fig. 18 800°C 1 h, furnace cooled at 2°C per minute to 690OC,
quenched Outgrowth of Widm anstått en plates from rounded
|3-phase particle. x 750.
• V f - ^
Fig. 19 800°C 1 h, furnace cooled at 2°C per minute to 680°C,
quenched. Widmanstätten fringes growing from rounded
/3-plates and isolated j3-plates within the matrix. x 250.
'•- ' >
Fig. 20 800 C 1 h, furnace cooled at about 2 C per minute to room
temperature. Ionic bombardment etch. Widmanstätten
pattern outlined by secondary precipitate. x 750.


Heating
500 600 700 800 °C
Temp,d/ff.
u-0,5
u-2 w/0 Zr
u-5W/0Zr
Fig. 21
Differential thermal analysis heating curves.


Cooling**m
500 600 700 800 "C
Temp,diff.
Zr
u-2*/0Zr
Fig. 22
Differential thermal analysis cooling curves,


List of reports published In the AE-aeriea.
1. Calculation of the geometric buokling for reactors of variousshapes. By N. 0. Sjöstrand. 1958. 23 P. Sw, Cr. 3:-
2. The variation of the reactivity with the number, diameter andlength of the control rods in a heavy water natural uraniumreactor. By H. Me Cririck. 1958. 24 p. Sw. (Jr. 3:-
3. Comparison of filter papers and an electrostatic precipitatorfor measurements on radioactive aerosols. By R. Wiener. 1958.4 p. Sw. or. 4t-
4. A slowing-down problem. By I. Carlvik and B. Pershagen, 1958.14 p. Sw. or. 3t-
5. Absolute measurements with a 4 a-counter. (2nd rev. ed,}. ByKeratin Martinsson, 1958, 20 p. Sw, cr. 4;-
6. Monte Carlo calculations of neutron thermallzation in &heterogeneous system. By T. Högberg. 1959. 13 P. Sw. or, 4j-
®. Metallurgical viewpoints on the brittleness of beryllium.By 0, Lagerberg, i960, 14 p. Sw. cr. 4i-
9. Swedish research on aluminium reactor technology. By B, Porsen.I960. 13 p. Sw. or. 4i-
10. Equipment for thermal neutron flux measurements in Reactor R2.By E, Johansson, T, Nilsson and S, Claesson, i960, 9 p. Sw. cr. 6:-
11. Cross sections and neutron yields for U 2 3 5, U2-55 and Pu2-59
at 2200 m/sec By N.G. Sjöstrand and J.S. Story, i960. 34 p.Sw, cr, 4j-
12. Geometric buckling measurements using the pulsed neutron souroemethod. By N.O. Sjöstrand, J. Mednls and T. Nilsson. 1959.22 p. Sw. or, 4|-
13. Absorption and flux density measurements in an Iron plug in Rl.By R. Nilsson and J, Braun. 1958. 24 p. Sw, cr. 4t-
14. GARLIC> a shielding program for GAmma Radiation from Line- andCylinder-sourceB, By M. Roos. 1959- 36 p. Sw. cr. 4i-
15. On the spherioal harmonic expansion of the neutron angulardistribution function. By S. Depken. 1959. 53 P. Sw. or. 4i-
16. The Dancoff correction in various geometries. By I, Carlvikand B. Pershagen. 1959. 23 p. Sw. or, 4t-
17. Radloaotive nuolides formed by Irradiation of the naturalelements with thermal neutrons. By K. Ekberg. 1959. 29 p.Sw. or, 4i-
18. The resonanoe integral of gold. By K. Jirlow and E, Johansson.X959. 19 P. Sw, or. 4t-
19. Sources of gamma radiation in & reaotor oore. By M, Roos. 1959.21 p, Sw, or. 4j-
20. Optimisation of gas-oooled reactors with the aid of mathematicalcomputers. By P. H. Margen. 1959. 33 p. Sw. or. 4:-
21. Itie fast fission effect In a cylindrical fuel element. By I. Carlvikand B. Pershagen. 1959. 25 p. Sw. cr. 4i-
22. The temperature coefficient of the resonance integral for uraniummetal end oxide. By P. Blomberg» E. Hell strand and S. Homer, i960,25 p. Sw, or, 4t-
23, Definition of ihe diffusion oonstant in one-group theory'. ByN,G. Sjöstrand, i960, 8 p . Sw. cr, 4i-
25. A study of some temperature effeots on the phonons In alurainuse of cold neutrons. By X-E. Larsson, U, Dahlborg and S, HoI960. 32 P. Sw. or. 4:-
26. The effeot of a diagonal control rod In a cylindrical reaeto:By T. Nilsson and N.G. Sjöstrand. I960. 4 p. Sw. cr. 4;-
23. RESEARCH AEMINISTRATIONt A Seleoted and annotated blbllograp;of recent l i teratur . By E. Rhenman and 3. Svensson, i960.49 p. Sw, or. 6 j -
29. Some general requirements for irradiation experiments. By H.iand R. Skjöldebrand. i960. 9 P. Sw. cr. 6t-
30. Metallographlo Study of the Isothermal Transformation of Bet)Phase in Zlrcaloy-2.' By O, Östberg, i960, 47 p. Sw. or, 6t-
32. Structure investigations of some beryllium materials. By I . '.and G. Lagerberg, I960. 15 p. Sw, cr. 6t-
53. An Emergency Dosimeter for Neutrons. By J . Braun and R. Nil»!I960. 32 p. Sw. or, 6t-
35, The Multigroup Neutron Diffusion Equations / I Space EHmensloiBy S. Linde. i960. 41 p . Sw. er. 6;-
36. Oeooharaloal Prospecting of a uraniferous bog deposit atMasugnsbyn,. Forthern Sweden, By O. Armanda. 1°.61. Sw.or.
37- Speotrophotometrio Determination of Thorium In LowGrade Minerals and Ores. By A-L, Arnfelt and I . Edmundssoi1960. 14 p . Sw. Cr. 61-
38. Kinetics of Pressurized Water Keaotors with Hot or ColdModerators. By 0* Norinder. 196O, Sw.Cr. 61-
39. The dependenoe of the resonance on the Doppler effect.By J . Rosén. 1960. Sv. Cr. 61-
40. Measurements of the fast fission faotor (c) in UO^-elementBy 0. Nylund. 1960. Sw. or. 6%-
44* Hand monitor for simultaneous measurement of alpha andbeta contamination. By I . ö . Andersson, J . Braun and B.SSderlund. 1960. Sw.or. 61-
46. The magnetismwof MnB and i t s variation with the tempera-ture . By H. L ndquist and E.P. Myers. 196O. Sw.or. 61-
47• -An experimental study of the scattering of slow neutronsfrom EpO and D?0. By K.B* Larsson, S. Eolmryd and E. Otnes.1960. Sw.or. 61-
48. The resonance integral of thorium metal rods. By S. Eell-Btrand and J. Weitman. 1960, Sw.or. 6»-
49- Pressure tube and pressure vessels reaotorsf oertaincomparisons. 1961. By P.H. Hargen, F.E, AhlBtrSm andB. Pershagen. Sw.or. 6t-
50. Phase transformations in a uranium-ziroonium alloy oon-taining 2 weight per cent zlroonlu'm . By Q. Lagerberg.1961. Sw.or. 61-
Addltional ooples available at the library of AB Atomenergi, Studsvik,Tystberga, Sweden. Transparent mlorocards of the reports are obtainablethrough the International Documentation Center* Tumba, Sweden,
Affäretryck, Stockholm 1961