PHASE II REMEDIAL INVESTIGATION REPORT - … · phase ii remedial investigation report for load...
40
FINAL PHASE II REMEDIAL INVESTIGATION REPORT FOR LOAD LINE 12 AT THE RAVENNA ARMY AMMUNITION PLANT, RAVENNA, OHIO VOLUME 1—MAIN TEXT AND APPENDICES A – H PREPARED FOR LOUISVILLE DISTRICT CONTRACT No. DACA62-00-D-0001 DELIVERY ORDER CY06 March 2004
Transcript of PHASE II REMEDIAL INVESTIGATION REPORT - … · phase ii remedial investigation report for load...
FINAL PHASE II REMEDIAL INVESTIGATION REPORT FOR LOAD LINE 12 AT THE RAVENNA ARMY AMMUNITION PLANT, RAVENNA, OHIO
VOLUME 1—MAIN TEXT AND APPENDICES A – H PREPARED FOR
LOUISVILLE DISTRICT CONTRACT No. DACA62-00-D-0001 DELIVERY ORDER CY06 March 2004
01-133(doc)/030204
FINAL
PHASE II REMEDIAL INVESTIGATION REPORT FOR
LOAD LINE 12 AT THE
RAVENNA ARMY AMMUNITION PLANT, RAVENNA, OHIO
March 2004
Prepared for
U.S. Army Corps of Engineers Louisville District
Contract No. DACA62-00-D-0001 Delivery Order No. CY06
Prepared by
Science Applications International Corporation 151 Lafayette Drive,
Oak Ridge, Tennessee 37830
01-133(doc)/030204
SCIENCE APPLICATIONS INTERNATIONAL CORPORATION
contributed to the preparation of this document and should not
be considered an eligible contractor for its review.
RVAAP Load Line 12 Final Phase II RI Report
01-133(doc)/030204 v
TABLE OF CONTENTS
LIST OF FIGURES ..................................................................................................................................... xi LIST OF TABLES.....................................................................................................................................xiii LIST OF ACRONYMS .............................................................................................................................. xv EXECUTIVE SUMMARY ....................................................................................................................... xix
1.0 INTRODUCTION ...........................................................................................................................1-1 1.1 PURPOSE AND SCOPE .......................................................................................................1-1 1.2 GENERAL FACILITY DESCRIPTION...............................................................................1-5
1.2.1 Historical Mission and Current Status.......................................................................1-5 1.2.2 Demography and Land Use.......................................................................................1-6
1.3 LOAD LINE 12 SITE DESCRIPTION .................................................................................1-6 1.3.1 Operational History ...................................................................................................1-8 1.3.2 Previous Investigations at Load Line 12 .................................................................1-12 1.3.3 Chemicals of Potential Concern ..............................................................................1-15 1.3.4 Load Line 12 Phase II RI Data Quality Objectives .................................................1-15
1.4 REPORT ORGANIZATION...............................................................................................1-17
2.0 ENVIRONMENTAL SETTING .....................................................................................................2-1 2.1 RVAAP PHYSIOGRAPHIC SETTING................................................................................2-1 2.2 SURFACE FEATURES AND SITE TOPOGRAPHY..........................................................2-1 2.3 SOILS AND GEOLOGY.......................................................................................................2-2
2.3.1 Regional Geology......................................................................................................2-2 2.3.2 Geologic Setting of Load Line 12 .............................................................................2-4
2.4 HYDROLOGY ......................................................................................................................2-7 2.4.1 Regional Hydrogeology ............................................................................................2-7 2.4.2 Load Line 12 Hydrologic/Hydrogeologic Setting...................................................2-11
2.5 CLIMATE............................................................................................................................2-11 2.6 POTENTIAL RECEPTORS ................................................................................................2-13
2.6.1 Human Receptors ....................................................................................................2-13 2.6.2 Ecological Receptors...............................................................................................2-14
2.7 PRELIMINARY CONCEPTUAL SITE MODEL ..............................................................2-16
3.0 STUDY AREA INVESTIGATION.................................................................................................3-1 3.1 SOIL AND VADOSE ZONE CHARACTERIZATION .......................................................3-1
3.1.1 Rationale..................................................................................................................3-14 3.1.2 Surface and Subsurface Soil Field Sampling Methods ...........................................3-16 3.1.3 Test Pits ...................................................................................................................3-18
3.2 SEDIMENT CHARACTERIZATION ................................................................................3-18 3.2.1 Rationale..................................................................................................................3-18 3.2.2 Sediment Field Sampling Methods .........................................................................3-23
3.3 SURFACE WATER CHARACTERIZATION ...................................................................3-23 3.3.1 Rationale..................................................................................................................3-23 3.3.2 Surface Water Field Sampling Methods..................................................................3-24
3.4 GROUNDWATER CHARACTERIZATION .....................................................................3-24 3.4.1 Rationale..................................................................................................................3-24 3.4.2 Piezometer and Monitoring Well Installation Methods ..........................................3-28 3.4.3 Well Development Methods....................................................................................3-30 3.4.4 Groundwater Field Sampling Methods ...................................................................3-30
RVAAP Load Line 12 Final Phase II RI Report
01-133(doc)/030204 vi
3.4.5 In Situ Permeability Testing....................................................................................3-30 3.5 SEWER LINE SAMPLING AND VIDEO CAMERA SURVEY.......................................3-30
3.5.1 Rationale..................................................................................................................3-30 3.5.2 Sediment and Water Sampling ................................................................................3-31 3.5.3 Video Camera Survey .............................................................................................3-31
3.6 ANALYTICAL PROGRAM OVERVIEW.........................................................................3-32 3.6.1 Field Analysis for Explosives Compounds .............................................................3-32 3.6.2 X-Ray Fluorescence Field Analyses for Metals ......................................................3-33 3.6.3 Geotechnical Analyses ............................................................................................3-34 3.6.4 Laboratory Analyses ...............................................................................................3-34 3.6.5 Data Review, Validation, and Quality Assessment.................................................3-36
3.7 ORDNANCE AND EXPLOSIVES AVOIDANCE AND FIELD RECONNAISSANCE..........................................................................................................3-37
4.0 NATURE AND EXTENT OF CONTAMINATION ......................................................................4-1 4.1 DATA EVALUATION METHODS .....................................................................................4-1
4.1.1 Site Chemical Background........................................................................................4-1 4.1.2 Definition of Aggregates ...........................................................................................4-3 4.1.3 Data Reduction and Screening ..................................................................................4-5 4.1.4 Data Presentation.....................................................................................................4-32 4.1.5 Use of Phase I RI Data ............................................................................................4-32
4.2 SURFACE SOIL..................................................................................................................4-32 4.2.1 Summary of Phase I RI Data...................................................................................4-33 4.2.2 Geotechnical Results ...............................................................................................4-33 4.2.3 Explosives and Propellants......................................................................................4-35 4.2.4 Inorganic Constituents.............................................................................................4-42 4.2.5 SVOCs, VOCs, and Pesticides and PCBs ...............................................................4-70 4.2.6 Building 904 Pit Samples ........................................................................................4-84 4.2.7 Summary .................................................................................................................4-85
4.3 SUBSURFACE SOIL ..........................................................................................................4-86 4.3.1 Summary of Phase I RI Data...................................................................................4-87 4.3.2 Geotechnical Results ...............................................................................................4-87 4.3.3 Explosives and Propellants......................................................................................4-87 4.3.4 Inorganic Constituents.............................................................................................4-95 4.3.5 SVOCs, VOCs, and PCBs.....................................................................................4-107 4.3.6 Summary ...............................................................................................................4-112
4.4 SEDIMENT .......................................................................................................................4-113 4.4.1 Summary of Phase I RI Data.................................................................................4-113 4.4.2 Geotechnical Results .............................................................................................4-114 4.4.3 Explosives and Propellants....................................................................................4-114 4.4.4 Inorganic Constituents...........................................................................................4-116 4.4.5 SVOCs, VOCs, and PCBs.....................................................................................4-121 4.4.6 Summary of Sediment Results ..............................................................................4-123
4.5 SURFACE WATER ..........................................................................................................4-124 4.5.1 Explosives and Propellants....................................................................................4-124 4.5.2 TAL Metals and Cyanide ......................................................................................4-126 4.5.3 SVOCs, VOCs, and Pesticides/PCBs....................................................................4-129 4.5.4 Summary of Surface Water Results ......................................................................4-131
4.6 GROUNDWATER ............................................................................................................4-131 4.6.1 Explosives and Propellants....................................................................................4-132 4.6.2 TAL Metals and Cyanide ......................................................................................4-132
RVAAP Load Line 12 Final Phase II RI Report
01-133(doc)/030204 vii
4.6.3 SVOCs, VOCs, and PCBs.....................................................................................4-132 4.6.4 Summary ...............................................................................................................4-136
4.7 SEWER SYSTEM CHARACTERIZATION ....................................................................4-136 4.7.1 Sewer Line Video Survey Results.........................................................................4-136 4.7.2 Sanitary Sewer System Water Samples.................................................................4-137 4.7.3 Sewer Line Sediment Samples ..............................................................................4-137
4.8 ORDNANCE AND EXPLOSIVES AVOIDANCE SURVEY SUMMARY....................4-140 4.9 COMPARATIVE EVALUATION OF FIELD AND LABORATORY ANALYSES
FOR EXPLOSIVES AND METALS ................................................................................4-144 4.9.1 Field TNT and RDX Screening Analysis..............................................................4-144 4.9.2 Field Metals Analysis by XRF ..............................................................................4-147
4.10 SUMMARY OF CONTAMINANT NATURE AND EXTENT.......................................4-157 4.10.1 Surface Soil ...........................................................................................................4-157 4.10.2 Subsurface Soil......................................................................................................4-158 4.10.3 Sediment................................................................................................................4-159 4.10.4 Surface Water ........................................................................................................4-159 4.10.5 Groundwater..........................................................................................................4-160 4.10.6 Sanitary Sewer Water and Sediment .....................................................................4-160
5.0 CONTAMINANT FATE AND TRANSPORT ...............................................................................5-1 5.1 INTRODUCTION .................................................................................................................5-1 5.2 PHYSICAL AND CHEMICAL PROPERTIES OF SITE-RELATED
CONTAMINANTS................................................................................................................5-1 5.2.1 Chemical Factors Affecting Fate and Transport .......................................................5-2 5.2.2 Biodegradation ..........................................................................................................5-2 5.2.3 Inorganic Compounds ...............................................................................................5-3 5.2.4 Organic Compounds..................................................................................................5-4
5.3 CONCEPTUAL SITE MODEL FOR FATE AND TRANSPORT .......................................5-4 5.3.1 Contaminant Sources.................................................................................................5-6 5.3.2 Hydrogeology............................................................................................................5-6 5.3.3 Contaminant Release Mechanism and Migration Pathways .....................................5-7 5.3.4 Water Balance ...........................................................................................................5-7 5.3.5 Natural Attenuation of Contaminants in Load Line 12 AOCs ..................................5-8
5.4 SOIL LEACHABILITY ANALYSIS....................................................................................5-8 5.4.1 Comparison of the CSM to Soil Screening Levels....................................................5-8 5.4.2 Limitations and Assumptions of Soil Screening Analysis ........................................5-9
5.5 FATE AND TRANSPORT MODELING..............................................................................5-9 5.5.1 Modeling Approach.................................................................................................5-10 5.5.2 Model Applications .................................................................................................5-12
5.6 SURFACE SOIL EROSION MODELING .........................................................................5-20 5.7 SUMMARY AND CONCLUSIONS ..................................................................................5-21
5.7.1 Leachate and Groundwater Modeling .....................................................................5-21 5.7.2 Erosion Modeling ....................................................................................................5-24
6.0 BASELINE HUMAN HEALTH RISK ASSESSMENT.................................................................6-1 6.1 INTRODUCTION .................................................................................................................6-1 6.2 DATA EVALUATION..........................................................................................................6-1
6.2.1 SRC Screening ..........................................................................................................6-2 6.2.2 COPC Screening .......................................................................................................6-3
6.3 EXPOSURE ASSESSMENT.................................................................................................6-5 6.3.1 Exposure Setting .......................................................................................................6-5
RVAAP Load Line 12 Final Phase II RI Report
01-133(doc)/030204 viii
6.3.2 Exposure Pathways....................................................................................................6-7 6.3.3 Quantification of Intake...........................................................................................6-19 6.3.4 Exposure Point Concentrations ...............................................................................6-22 6.3.5 Intake Results ..........................................................................................................6-28
6.4 TOXICITY ASSESSMENT ................................................................................................6-28 6.4.1 Toxicity Information and EPA Guidance for Noncarcinogens ...............................6-28 6.4.2 Toxicity Information and EPA Guidance for Carcinogens .....................................6-28 6.4.3 Estimated Toxicity Values for Dermal Exposure....................................................6-29 6.4.4 Assumptions Used in the Toxicity Assessment.......................................................6-29 6.4.5 Chemicals Without EPA Toxicity Values...............................................................6-29
6.5 RISK CHARACTERIZATION ...........................................................................................6-30 6.5.1 Methodology ...........................................................................................................6-30 6.5.2 Risk Characterization Results .................................................................................6-32 6.5.3 Remedial Goal Options ...........................................................................................6-45
6.6 UNCERTAINTY ANALYSIS.............................................................................................6-47 6.6.1 Uncertainties Associated with the Data Evaluation ................................................6-47 6.6.2 Uncertainties Associated with the Exposure Assessment .......................................6-57 6.6.3 Uncertainties Associated with Toxicity Information ..............................................6-58 6.6.4 Uncertainties and Assumptions in the Risk Characterization .................................6-59
6.7 SUMMARY AND CONCLUSIONS ..................................................................................6-60 6.7.1 Groundwater............................................................................................................6-61 6.7.2 Surface Water and Sediment ...................................................................................6-61 6.7.3 Soil ..........................................................................................................................6-61
6.8 TOXICITY PROFILES .......................................................................................................6-62 6.8.1 Inorganics ................................................................................................................6-62 6.8.2 Organics ..................................................................................................................6-73
7.0 SCREENING ECOLOGICAL RISK ASSESSMENT ....................................................................7-1 7.1 SCOPE AND OBJECTIVES .................................................................................................7-1 7.2 PROCEDURAL FRAMEWORK ..........................................................................................7-2 7.3 PROBLEM FORMULATION...............................................................................................7-3
7.3.1 Ecological Conceptual Site Model ............................................................................7-3 7.3.2 Selection of Exposure Units ......................................................................................7-5 7.3.3 Ecological Surveys and Description of Habitats and Populations ............................7-6 7.3.4 Identification of Preliminary COPECs....................................................................7-11 7.3.5 Ecological Assessment and Measurement Endpoints .............................................7-18 7.3.6 Summary of Preliminary COPECs..........................................................................7-24
7.4 EXPOSURE ASSESSMENT...............................................................................................7-24 7.4.1 Ecological Receptors and Their Exposure ..............................................................7-24 7.4.2 Quantification of Exposure .....................................................................................7-27 7.4.3 Summary of Exposure Assessment .........................................................................7-31
7.5 EFFECTS ASSESSMENT...................................................................................................7-31 7.5.1 Chemical Toxicity ...................................................................................................7-31 7.5.2 Toxicity Reference Values ......................................................................................7-32
7.6 RISK CHARACTERIZATION FOR ECOLOGICAL RECEPTORS ................................7-33 7.6.1 Current Preliminary Risk to Ecological Receptors .................................................7-33 7.6.2 Future Preliminary Risk to Ecological Receptors ...................................................7-42 7.6.3 Use of Characterization Results ..............................................................................7-43
7.7 UNCERTAINTIES ..............................................................................................................7-43 7.7.1 Uncertainties in Problem Formulation ....................................................................7-43 7.7.2 Uncertainties in Exposure Assessment....................................................................7-43
RVAAP Load Line 12 Final Phase II RI Report
01-133(doc)/030204 ix
7.7.3 Uncertainties in Effects Assessment .......................................................................7-45 7.7.4 Uncertainties in Risk Characterization....................................................................7-46 7.7.5 Summary of Uncertainties.......................................................................................7-47
7.8 SUMMARY OF THE SCREENING ECOLOGICAL RISK ASSESSMENT....................7-47 7.8.1 Soil COPECs (HQs ≥ 1 and PBT compounds) .......................................................7-49 7.8.2 Sediment COPECs (HQs ≥ 1 and PBT compounds)...............................................7-50 7.8.3 Surface water COPECs (HQs ≥ 1 and PBT compounds)........................................7-53 7.8.4 Overall Summary ....................................................................................................7-54
8.0 SUMMARY AND CONCLUSIONS ..............................................................................................8-1 8.1 SUMMARY OF CONTAMINANT NATURE AND EXTENT...........................................8-1
8.1.1 Contaminant Nature and Extent ................................................................................8-1 8.2 SUMMARY OF CONTAMINANT FATE AND TRANSPORT .........................................8-4 8.3 SUMMARY OF THE BASELINE HUMAN HEALTH RISK ASSESSMENT ..................8-5
8.3.1 Soil ............................................................................................................................8-5 8.3.2 Surface Water and Sediment .....................................................................................8-6 8.3.3 Groundwater..............................................................................................................8-7
8.4 SUMMARY OF THE SCREENING ECOLOGICAL RISK ASSESSMENT......................8-7 8.4.1 Soil ............................................................................................................................8-7 8.4.2 Sediment and Surface Water .....................................................................................8-8
8.5 SITE-SPECIFIC CONCEPTUAL MODEL ..........................................................................8-9 8.5.1 Source-Term and Release Mechanisms.....................................................................8-9 8.5.2 Contaminant Migration Pathways and Exit Points..................................................8-11 8.5.3 Uncertainties............................................................................................................8-11
8.6 CONCLUSIONS..................................................................................................................8-12 8.6.1 Western Soil Aggregate...........................................................................................8-12 8.6.2 Eastern Soil Aggregate............................................................................................8-18 8.6.3 Surface Water and Sediment ...................................................................................8-19 8.6.4 Groundwater............................................................................................................8-19 8.6.5 Sanitary Sewer Water and Sediment .......................................................................8-20
8.7 LESSONS LEARNED.........................................................................................................8-20
9.0 RECOMMENDATIONS .................................................................................................................9-1
10.0 REFERENCES ..............................................................................................................................10-1 APPENDICES
A SOIL SAMPLING LOGS ...............................................................................................................A-1 B TEST PIT LOGS............................................................................................................................. B-1 C SEDIMENT AND SURFACE WATER SAMPLING LOGS........................................................ C-1 D PIEZOMETER AND MONITORING WELL INSTALLATION LOGS ......................................D-1 E GROUNDWATER MONITORING WELL DEVELOPMENT AND SAMPLING LOGS.......... E-1 F SLUG TEST LOGS .........................................................................................................................F-1 G PROJECT QUALITY ASSURANCE SUMMARY.......................................................................G-1 H QUALITY CONTROL SUMMARY REPORT .............................................................................H-1 I LABORATORY ANALYTICAL RESULTS ..................................................................................I-1 J EXPLOSIVES FIELD ANALYTICAL RESULTS ........................................................................ J-1 K XRF ANALYTICAL RESULTS....................................................................................................K-1 L GEOTECHNICAL ANALYTICAL RESULTS............................................................................. L-1 M FATE AND TRANSPORT MODELING RESULTS ................................................................... M-1
RVAAP Load Line 12 Final Phase II RI Report
01-133(doc)/030204 x
N TOPOGRAPHIC SURVEY REPORT............................................................................................N-1 O SEWER LINE VIDEO SURVEY REPORT ..................................................................................O-1 P ORDNANCE AND EXPLOSIVES AVOIDANCE SURVEY REPORT .......................................P-1 Q INVESTIGATION-DERIVED WASTE MANAGEMENT REPORT ..........................................Q-1 R HUMAN HEALTH RISK ASSESSMENT TABLES AND FIGURES......................................... R-1 S THREATENED AND ENDANGERED SPECIES LISTS .............................................................S-1 T ECOLOGICAL RISK ASSESSMENT DATA............................................................................... T-1

RVAAP Load Line 12 Final Phase II RI Report
01-133(doc)/030204 xi
LIST OF FIGURES
1-1 General Location and Orientation of RVAAP .................................................................................1-2 1-2 Ravenna Army Ammunition Plant Facility Map .............................................................................1-3 1-3 CERCLA Approach at RVAAP.......................................................................................................1-4 1-4 Current Land Use at RVAAP...........................................................................................................1-7 1-5 Load Line 12 Site Map.....................................................................................................................1-9 1-6 Photograph of Load Line 12 Operations circa 1970 ......................................................................1-10 1-7 Load Line 12 Phase I RI Sampling Location Map.........................................................................1-14 2-1 Current Site Conditions at Load Line 12, Fall 2000 ........................................................................2-2 2-2 Geologic Map of Unconsolidated Deposits on RVAAP..................................................................2-3 2-3 Generalized Geologic Cross Section of Unconsolidated Deposits at Load Line 12 ........................2-6 2-4 Facility-wide Potentiometric Map, August 2001 .............................................................................2-9 2-5 Potentiometric Groundwater Surface at Load Line 12, November 9, 2000...................................2-12 3-1 Surface Soil/Subsurface Soil Sampling Locations, Load Line 12 Phase II RI ................................3-3 3-2 Sediment, Surface Water, and Sanitary Sewer Sampling and Video Survey Locations, Load
Line 12 Phase II RI ........................................................................................................................3-22 3-3 Groundwater Sampling Locations, Load Line 12 Phase II RI .......................................................3-25 4-1 Spatial Aggregates for the Load Line 12 Phase II RI.......................................................................4-4 4-2 Explosives and Propellants Detected in Surface Soil at Load Line 12 ..........................................4-40 4-3 Distribution of Antimony in Soil at Load Line 12 .........................................................................4-65 4-4 Distribution of Arsenic in Surface Soil at Load Line 12................................................................4-66 4-5 Distribution of Copper in Soil at Load Line 12 .............................................................................4-67 4-6 Distribution of Lead in Soil at Load Line 12 .................................................................................4-68 4-7 Distribution of Mercury in Soil at Load Line 12 ...........................................................................4-69 4-8 Selected SVOCs Detected in Surface Soil at Load Line 12...........................................................4-79 4-9 Pesticides and PCBs Detected in Surface Soil at Load Line 12.....................................................4-83 4-10 Explosives and Propellants Detected in Subsurface Soil at Load Line 12.....................................4-90 4-11 Selected SVOCs Detected in Subsurface Soil at Load Line 12 ...................................................4-111 4-12 Selected Metals in Sediment in the Main Ditch Aggregate .........................................................4-119 4-13 Selected Metals in Sediment in the West Ditches Aggregate ......................................................4-120 4-14 SVOCs Detected in Sediment in the Active Area Channel Aggregate ........................................4-122 4-15 Explosive Compounds in Surface Water in the Active Area Channel Aggregate .......................4-125 4-16 Selected Metals in Surface Water in the Active Area Channel Aggregate ..................................4-128 4-17 Selected Metals in Surface Water in the West Ditches Aggregate ..............................................4-130 4-18 Explosive and Propellant Compounds in Groundwater at Load Line 12.....................................4-133 4-19 Selected Inorganics in Groundwater at Load Line 12..................................................................4-135 4-20 Selected Site-related Contaminants in Sanitary Sewer Water Samples .......................................4-139 4-21 Selected Site-related Contaminants in Sanitary Sewer Sediment Samples..................................4-143 4-22 TNT Field Screening/Laboratory Data Correlation .....................................................................4-146 4-23 Comparison of XRF and Laboratory Measurements of Antimony and Arsenic..........................4-151 4-24 Comparison of XRF and Laboratory Measurements of Barium and Copper...............................4-152 4-25 Comparison of XRF and Laboratory Measurements of Chromium and Iron ..............................4-153 4-26 Comparison of XRF and Laboratory Measurements of Lead and Manganese ............................4-154 4-27 Comparison of XRF and Laboratory Measurements of Nickel and Zinc ....................................4-155 5-1 2,4,6-TNT Biotransformation Pathway............................................................................................5-5 5-2 2,4-DNT Biotransformation Pathway ..............................................................................................5-5 5-3 Contaminant Migration Conceptual Model....................................................................................5-11 6-1 Conceptual Exposure Model for Load Line 12................................................................................6-8 7-1 Exposure Pathways for Terrestrial and Aquatic Receptors..............................................................7-4
RVAAP Load Line 12 Final Phase II RI Report
01-133(doc)/030204 xii
7-2 Terrestrial Food Web for Ecological Risk Assessment for Load Line 12 .....................................7-21 7-3 Aquatic Food Web for Ecological Risk Assessment for Load Line 12 .........................................7-22 8-1 Site-Specific Conceptual Model for Load Line 12 ........................................................................8-10
RVAAP Load Line 12 Final Phase II RI Report
01-133(doc)/030204 xiii
LIST OF TABLES
1-1 Load Line 12 Operations Chronology............................................................................................1-11 1-2 Summary of Historical Analytical Data for Load Line 12.............................................................1-13 2-1 Horizontal Hydraulic Conductivities in Phase II RI Monitoring Wells .........................................2-13 2-2 RVAAP Rare Species List as of April 19, 2000 ............................................................................2-15 3-1 Load Line 12 Phase II RI Functional Areas and Sample Matrices ..................................................3-2 3-2 Soil Sample List and Rationales, Load Line 12 Phase II RI ............................................................3-4 3-3 Sediment and Surface Water Sample List and Rationales, Load Line 12 Phase II RI...................3-19 3-4 Groundwater Sample List and Rationales, Load Line 12 Phase II RI............................................3-26 3-5 Load Line 12 Phase II RI Monitoring Well Construction Data .....................................................3-29 4-1 RVAAP Facility-Wide Background Criteria ...................................................................................4-2 4-2 Summary Statistics and Determination of Site-related Contaminants in Surface Soil ....................4-7 4-3 Summary Statistics and Determination of Site-related Contaminants in Subsurface Soil .............4-11 4-4 Summary Statistics and Determination of Site-related Contaminants in Sediment .......................4-14 4-5 Summary Statistics and Determination of Site-related Contaminants in Surface Water ...............4-21 4-6 Summary Statistics and Determination of Site-related Contaminants for Groundwater ...............4-25 4-7 Summary Statistics and Determination of Site-related Contaminants in Sanitary Sewer
Sediment.........................................................................................................................................4-27 4-8 Summary Statistics and Determination of Site-related Contaminants in Sanitary Sewer Line
Water Samples ...............................................................................................................................4-29 4-9 Summary Statistics and Determination of Site-related Contaminants in Building 904 Pits
Samples ..........................................................................................................................................4-30 4-10 Geotechnical Data for Load Line 12 Surface Soil Samples...........................................................4-34 4-11 Summary Data for Explosives and Propellants Detected in Western Aggregate Surface Soil ......4-36 4-12 Summary Data for Site-related Inorganics in Eastern Aggregate Surface Soil..............................4-43 4-13 Summary Data for Site-related Inorganics in Western Aggregate Surface Soil ............................4-45 4-14 Summary Data for Site-related SVOCs Detected in Eastern Aggregate Surface Soil ...................4-71 4-15 Summary Data for Site-related VOCs Detected in Eastern Aggregate Surface Soil .....................4-71 4-16 Summary Data for Site-related SVOCs Detected in Western Aggregate Surface Soil..................4-73 4-17 Summary Data for Site-related VOCs Detected in Western Aggregate Surface Soil ....................4-80 4-18 Summary Data for Site-related Pesticides and PCBs Detected in Western Aggregate
Surface Soil ....................................................................................................................................4-82 4-19 Summary of Site-related Contaminants in Soil at the Building 904 Test Pits ...............................4-84 4-20 Geotechnical Data for Load Line 12 Subsurface Soil Samples .....................................................4-88 4-21 Summary Data for Explosives and Propellants Detected in Subsurface Soil ................................4-92 4-22 Summary Data for Site-related Inorganics in Subsurface Soil.......................................................4-96 4-23 Summary Data for Site-related SVOCs in Subsurface Soil .........................................................4-108 4-24 Geotechnical Data for Load Line 12 Phase II RI Sediment Samples...........................................4-115 4-25 Summary Results for Site-related Inorganics in Sediment ..........................................................4-117 4-26 Summary Data for Inorganic Site-related Contaminants in Surface Water .................................4-127 4-27 Summary of Site-related Inorganics in Groundwater...................................................................4-134 4-28 Summary of Site-related Contaminants in Sewer System Water.................................................4-138 4-29 Summary of Site-related Contaminants in Sewer System Sediment............................................4-141 4-30 Comparison of Laboratory and Field TNT Results, Load Line 12 Phase II RI ...........................4-145 4-31 Comparison of Laboratory and Field RDX Results, Load Line 12 Phase II RI...........................4-148 4-32 Summary of Ex Situ XRF Metal Analyses ..................................................................................4-149 4-33 Summary of Laboratory ICP and AA Metal Analyses.................................................................4-150 4-34 Summary of In Situ XRF Metal Measurements...........................................................................4-156 5-1 Summary of Leachate Modeling Results for Load Line 12 ...........................................................5-14
RVAAP Load Line 12 Final Phase II RI Report
01-133(doc)/030204 xiv
5-2 Unit-Specific Parameters Used in SESOIL and AT123D Modeling for Load Line 12 .................5-16 5-3 Summary of Groundwater Modeling Results for Load Line 12 ....................................................5-18 5-4 Constituents Predicted to Exceed Background Concentrations, EPA Region 9 PRGs, and
RGOs in Eroded Sediment and Surface Water Runoff ..................................................................5-22 5-5 Input Parameters for Soil Erosion Modeling..................................................................................5-23 6-1 Potential Receptors for the Load Line 12 BHHRA..........................................................................6-9 6-2 Parameters Used to Quantify Exposures for Each Medium and Receptor at Load Line 12 ..........6-10 6-3 Modified Caretaker/Managed Recreational Receptors and Activities ...........................................6-16 6-4 National Guard Training Activities................................................................................................6-17 6-5 Total Hazards/Risks and COCs in Groundwater............................................................................6-32 6-6 Total Hazards/Risks and COCs for Direct Contact with Surface Water........................................6-34 6-7 Total Hazards/Risks and COCs for Ingestion of Fish ....................................................................6-36 6-8 Total Hazards/Risks and COCs for Sediment ................................................................................6-37 6-9 Total Hazards/Risks and COCs for Direct Contact with Surface Soil ...........................................6-39 6-10 Total Hazards/Risks and COCs for Ingestion of Foodstuffs ..........................................................6-41 6-11 Total Hazards/Risks and COCs for Direct Contact with Subsurface Soil......................................6-42 6-12 Receptor/Medium/Exposure Unit Combinations with COCs ........................................................6-43 6-13 COCs with Large Risks/Hazards: Direct and Indirect Contact with Surface Water and
Sediment.........................................................................................................................................6-44 6-14 COCs with Large Risks/Hazards: Indirect Contact with Surface Soil by the On-Site
Resident Farmer (adult and child)..................................................................................................6-44 6-15 Groundwater Remedial Goal Options (mg/L) for Open Residential Chemicals of Concern.........6-48 6-16 Surface Water Remedial Goal Options (mg/L) for Open Residential Chemicals of Concern .......6-49 6-17 Sediment Remedial Goal Options (mg/kg) for Open Residential Chemicals of Concern .............6-51 6-18 Surface Soil Remedial Goal Options (mg/kg) for Open Residential Chemicals of Concern.........6-53 6-19 Subsurface Soil Remedial Goal Options (mg/kg) for Open Residential Chemicals of
Concern ..........................................................................................................................................6-56 7-1 Plant communities and other habitat recorded at Load Line 12.......................................................7-6 7-2 Summary of Analytes to Be Carried Forward to the Receptor-Specific Screening for
Identification of Soil COPECs .......................................................................................................7-13 7-3 Summary of Analytes to Be Carried Forward to the Receptor-Specific Screening for
Identification of Sediment COPECs ..............................................................................................7-15 7-4 Summary of Analytes to Be Carried Forward in the Receptor-Specific Screening for
Identification of Surface Water COPECs.......................................................................................7-17 7-5 Policy Goals, Ecological Assessment Endpoints, Measurement Endpoints, and Decision
Rules for LL12 ...............................................................................................................................7-19 7-6 Summary of Soil COPECs (HQs > or equal to 1 and PBT Compounds) – Receptor-Specific
Screens at Load Line 12.................................................................................................................7-34 7-7 Summary of Sediment COPECs (HQs > or equal to 1 and PBT Compounds) Receptor-
Specific Screens at Load Line 12...................................................................................................7-35 7-8 Summary of Surface Water COPECs (HQs > or equal to 1 and PBT Compounds) Receptor-
Specific Screens at Load Line 12...................................................................................................7-37 8-1 Comparison of Surface Soil Concentrations (mg/kg) at Load Line 12 to Preliminary RGOs .......8-13 8-2 Comparison of Subsurface Soil Concentrations (mg/kg) at Load Line 12 to Preliminary
RGOs..............................................................................................................................................8-15 8-3 Comparison of Sediment Concentrations (mg/kg) at Load Line 12 to Preliminary RGOs............8-16 8-4 Comparison of Surface Water Concentrations (mg/L) at Load Line 12 to Preliminary RGOs .....8-17 8-5 Comparison of Groundwater Concentrations (mg/L) at Load Line 12 to Preliminary RGOs .......8-21

RVAAP Load Line 12 Final Phase II RI Report
01-133(doc)/030204 xv
LIST OF ACRONYMS
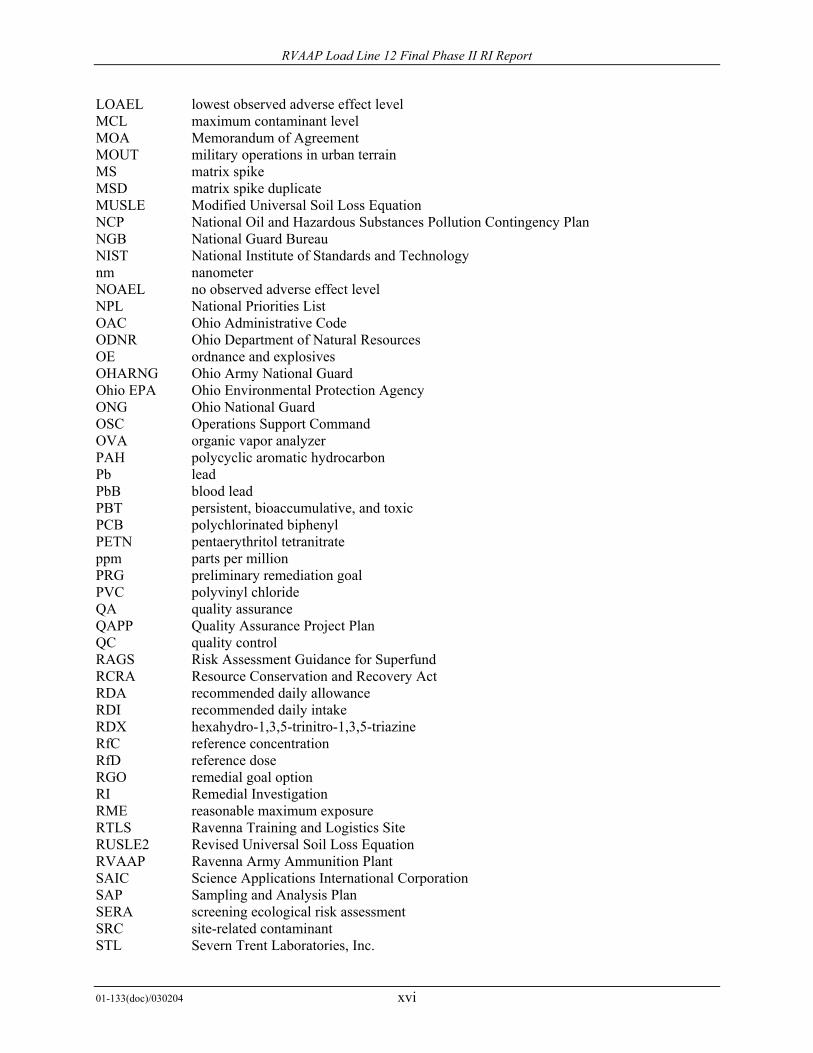
AA atomic absorption ADD average daily dose ALM Adult Lead Methodology amsl above mean sea level AOC area of concern AUF area use factor BAF bioaccumulation factor BCF bioaccumulation concentration factor BERA Baseline Ecological Risk Assessment bgs below ground surface BHHRA Baseline Human Health Risk Assessment BSAF biota to sediment accumulation factor CERCLA Comprehensive Environmental Response, Compensation, and Liability Act CMCOPC contaminant migration constituent of potential concern CNS central nervous system COC chemical of concern COPC contaminant of potential concern COPEC contaminant of potential ecological concern CSF Cancer Slope Factor CSM Conceptual Site Model DAD dermally absorbed dose DAF dilution attenuation factor DCE 1,2-dichloroethene DNB dinitrobenzene DNT dinitrotoluene DQO data quality objective EDQL ecological data quality level EPA U.S. Environmental Protection Agency EPC exposure point concentration ERA ecological risk assessment ESV ecological screening value EU exposure unit FGDC Federal Geographic Data Classification FS Feasibility Study GAF gastrointestinal absorption factor GSSL generic soil screening level HEAST Health Effects Assessment Summary Tables HHBRA human health baseline risk assessment HI hazard index HMX octahydro-1,3,5,7-tetranitro-1,3,5,7-tetrazocine HQ hazard quotient IARC International Agency for Research on Cancer ICP inductively coupled plasma IDW investigation-derived waste IEUBK Integrated Exposure Uptake Biokinetic ILCR Incremental Lifetime Cancer Risk IRIS Integrated Risk Information System JMC Joint Munitions Command
RVAAP Load Line 12 Final Phase II RI Report
01-133(doc)/030204 xvi
LOAEL lowest observed adverse effect level MCL maximum contaminant level MOA Memorandum of Agreement MOUT military operations in urban terrain MS matrix spike MSD matrix spike duplicate MUSLE Modified Universal Soil Loss Equation NCP National Oil and Hazardous Substances Pollution Contingency Plan NGB National Guard Bureau NIST National Institute of Standards and Technology nm nanometer NOAEL no observed adverse effect level NPL National Priorities List OAC Ohio Administrative Code ODNR Ohio Department of Natural Resources OE ordnance and explosives OHARNG Ohio Army National Guard Ohio EPA Ohio Environmental Protection Agency ONG Ohio National Guard OSC Operations Support Command OVA organic vapor analyzer PAH polycyclic aromatic hydrocarbon Pb lead PbB blood lead PBT persistent, bioaccumulative, and toxic PCB polychlorinated biphenyl PETN pentaerythritol tetranitrate ppm parts per million PRG preliminary remediation goal PVC polyvinyl chloride QA quality assurance QAPP Quality Assurance Project Plan QC quality control RAGS Risk Assessment Guidance for Superfund RCRA Resource Conservation and Recovery Act RDA recommended daily allowance RDI recommended daily intake RDX hexahydro-1,3,5-trinitro-1,3,5-triazine RfC reference concentration RfD reference dose RGO remedial goal option RI Remedial Investigation RME reasonable maximum exposure RTLS Ravenna Training and Logistics Site RUSLE2 Revised Universal Soil Loss Equation RVAAP Ravenna Army Ammunition Plant SAIC Science Applications International Corporation SAP Sampling and Analysis Plan SERA screening ecological risk assessment SRC site-related contaminant STL Severn Trent Laboratories, Inc.
RVAAP Load Line 12 Final Phase II RI Report
01-133(doc)/030204 xvii
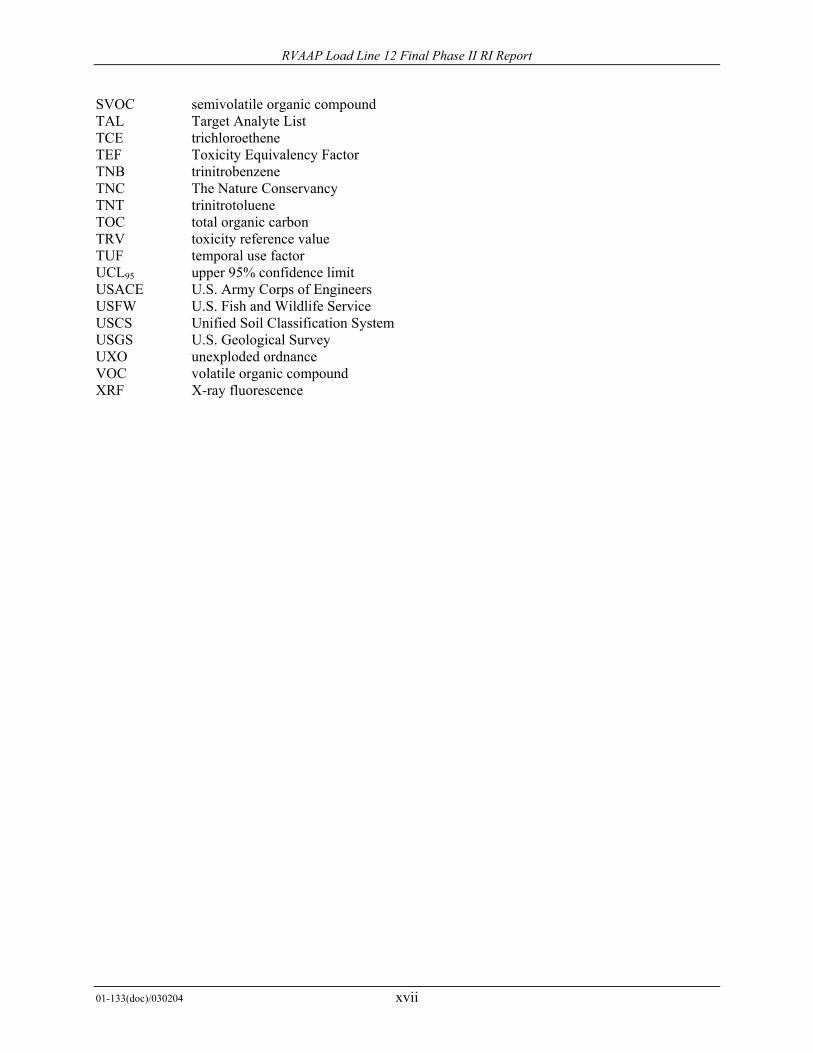
SVOC semivolatile organic compound TAL Target Analyte List TCE trichloroethene TEF Toxicity Equivalency Factor TNB trinitrobenzene TNC The Nature Conservancy TNT trinitrotoluene TOC total organic carbon TRV toxicity reference value TUF temporal use factor UCL95 upper 95% confidence limit USACE U.S. Army Corps of Engineers USFW U.S. Fish and Wildlife Service USCS Unified Soil Classification System USGS U.S. Geological Survey UXO unexploded ordnance VOC volatile organic compound XRF X-ray fluorescence
RVAAP Load Line 12 Final Phase II RI Report
01-133(doc)/030204 xviii
THIS PAGE INTENTIONALLY LEFT BLANK
RVAAP Load Line 12 Final Phase II RI Report
01-133(doc)/030204 xix
EXECUTIVE SUMMARY
This Phase II Remedial Investigation (RI) Report characterizes the nature and extent of contamination, evaluates the fate and transport of contaminants, and assesses potential risk to human health and the environment resulting from former operations at Load Line 12 at the Ravenna Army Ammunition Plant (RVAAP) in Ravenna, Ohio. Load Line 12, which consists of approximately 32.4 ha (80 acres), was an ammonium nitrate production facility from 1941 until 1943. Various production, renovation, and demilitarization operations were performed at a number of locations on the site after the termination of ammonium nitrate production in May 1943. Load Line 12 was declared inactive in 1992. All of the buildings at Load Line 12 were recently demolished and removed, with salvage and demolition activities completed as of June 2000.
The overall purpose of this Phase II RI Report is to describe the investigations conducted at Load Line 12 during summer and fall 2000 and to define the vertical and horizontal extent of contamination. The specific objectives of the Phase II RI are as follows:
• To characterize the physical environment at Load Line 12 and its surroundings to the extent necessary to define potential transport pathways and receptor populations.
• To characterize the sources, types, chemical properties, and quantities of contaminants; identify potential contaminant release mechanisms and contaminant fate and transport; obtain sufficient engineering data to develop a conceptual site model (CSM) suitable for use in a baseline risk assessment; and evaluate remedial action alternatives.
• To conduct baseline human health and screening ecological risk assessments using characterization data and the CSM to evaluate the potential threats and to develop remedial goal options (RGOs) for use in determining areas that may require remediation and in evaluating remedial alternatives.
• To assess the suitability of field-portable-X-ray fluorescence (XRF) spectrometry for performing in situ and ex situ analyses of metals in soil and sediment samples. Results of these tests will determine the suitability of metals field determinations for future environmental investigations and remedial activities at RVAAP.
This Phase II RI was conducted as part of the U.S. Army’s Installation Restoration Program approach to implement the Comprehensive Environmental Response, Compensation, and Liability Act (CERCLA) process at RVAAP, which prioritizes environmental restoration at Areas of Concern (AOCs) based on their relative potential threat to human health and the environment. The purpose of the Phase II RI is to determine the nature and extent of contamination in environmental media so that quantitative human health and ecological risk assessments can be performed. Results of the risk assessments will be used to determine whether an AOC requires no further action or will be the subject of a Feasibility Study (FS).
PREVIOUS INVESTIGATIONS
The Phase II RI at Load Line 12 was designed to collect data to supplement information obtained from two previous investigations at the site:
1. Preliminary Assessment for the Ravenna Army Ammunition Plant (USACE 1996); and
2. Phase I Remedial Investigation for High-Priority Areas of Concern at the Ravenna Army Ammunition Plant (USACE 1998).
RVAAP Load Line 12 Final Phase II RI Report
01-133(doc)/030204 xx
The Preliminary Assessment of Load Line 12 performed in 1996 included the site in the list of High Priority sites based on a relative risk ranking methodology. Re-evaluation of the Load Line 12 risk ranking performed at the completion of the Phase I RI resulted in the site retaining its “High Risk” rating.
The Phase I RI performed in 1996 included sampling and analysis of surface soil, ditch sediment, and sediment from the Building 904 settling basin. The Phase I results indicated concentrations of explosives, inorganics, and organic compounds occurring in soil and sediment throughout the production area above risk-based screening values.
PHASE II REMEDIAL INVESTIGATIVE APPROACH
The findings and data gaps identified during previous investigations guided the specific objectives and sampling design of the Phase II RI at Load Line 12. As detailed in the Sampling and Analysis Plan Addenda for the Phase II RI at Load Line 12 at RVAAP (USACE 2000), the Phase II RI sampling objectives, by medium, included the following.
Surface Soil and Sediment
1. Determining the nature and horizontal extent of contamination using biased sampling at each area within Load Line 12 having either explosives at concentrations ≥ 1 part per million (ppm), lead ≥ 100 ppm and/or chromium ≥ 35 ppm, or polychlorinated biphenyl (PCBs) ≥ 10 mg/kg in surface soil during the Phase I RI. Primary areas of interest include Buildings 900, 904, and FF-19 and the Building 905 settling basin and filter bed. Other areas of interest that were not characterized during the Phase I RI include Buildings FE-17, FN-54, 901, 902, 906, and 51; the water works; and the sewer system.
2. Comparing the surface soil and sediment data to the RVAAP facility-wide background dataset, which characterizes natural facility-wide variability for 23 Target Analyte List (TAL) metals.
3. Characterizing large non-production areas by random-grid sampling, using a statistical approach to ensure adequate area coverage and density.
4. Assessing the suitability of field-portable XRF spectrometry for performing in situ and ex situ analyses of metals in soil and field-based colorimetric analyses of trinitrotoluene (TNT) and hexahydro-1,3,5-trinitro-1,3,5-triazine (RDX) in soil and sediment samples. Results of these tests will determine the suitability of metals field data for future environmental investigations and remedial activities.
Subsurface Soil
1. Defining the vertical extent of contamination and studying transport pathways of contaminants.
Surface Water
1. Determining whether runoff from contaminated areas around the former production area may contribute contaminants in dissolved and suspended form to the surface water system at Load Line 12, which is unlined and untreated.
2. Determining whether drainages at Load Line 12 allow contaminants to migrate northward to the AOC boundary.
RVAAP Load Line 12 Final Phase II RI Report
01-133(doc)/030204 xxi
Groundwater
1. Characterizing the Load Line 12 hydrogeologic flow system and chemical groundwater quality, with emphasis on the water table zone upgradient and downgradient of the most concentrated areas of soil contamination identified in the Phase I RI.
2. Comparing groundwater results to the facility-wide background dataset.
These objectives were met through the field activities conducted in September and October 2000.
AVAILABLE DATA
The environmental database for the Load Line 12 Phase II RI includes only data obtained from the field activities conducted in 2000. Data from the Phase I RI are of limited use given the reworking and disturbance of soils at the site during demolition activities. Other historical data did not have sufficient data quality documentation for use in this Phase II RI. The data collected under this Phase II RI include
• 115 surface soil samples, • 60 subsurface soil samples, • 21 sediment samples, • 14 surface water samples, • 14 groundwater samples, • 3 sewer sediment samples, and • 4 sewer water samples.
Geological characterization was achieved through the collection of undisturbed and disturbed geotechnical samples from soil sampling stations, piezometer and monitoring well borings, and test pits.
NATURE AND EXTENT OF CONTAMINATION
The RI evaluated the nature and extent of contamination in surface soil [0 to 0.3 m (0 to 1 ft bgs)], subsurface soil to depths of 2.1 m (7 ft), sediment, surface water, and groundwater. The surface and subsurface soil, sediment, and surface water were divided into spatial aggregates based on former process operations and drainage areas. Surface soil and subsurface soil were divided into two aggregates: areas believed to be impacted by process-related activities (Western Soil Aggregate) and areas believed to be relatively non-contaminated (Eastern Soil Aggregate). Sediment and surface water were grouped by drainage areas into five aggregates to facilitate examination of contaminants spread by these media and to focus on the receptor exposure points for the baseline human health and screening ecological risk assessments. Groundwater was considered on an AOC-wide basis. The results of this evaluation are summarized by medium.
Surface Soils
The occurrence and distribution of contaminants in surface soil differ between the Eastern and Western Soil Aggregates. Explosives were not detected in surface soil of the Eastern Aggregate but were somewhat widespread in the Western Aggregate. Although some metals and semivolatile organic constituents (SVOCs), in particular polycyclic aromatic hydrocarbons (PAHs), were detected across both soil aggregates, the concentrations are substantially different between aggregates. Of the metals determined to be site-related contaminants (SRCs) in the Eastern Aggregate, none exceeded 3 times their respective background levels.
RVAAP Load Line 12 Final Phase II RI Report
01-133(doc)/030204 xxii
In contrast, nine inorganic SRCs identified for surface soil in the Western Aggregate exceeded their respective facility-wide background values by more than 10 times. The maximum concentrations of PAHs are generally 2 orders of magnitude higher in the Western Aggregate than PAH concentrations in the Eastern Aggregate. This pattern also holds true for pesticides and PCBs, which were not detected in Eastern Aggregate soils but occur in some areas within the Western Aggregate. Volatile organic constituents (VOCs) do not appear to be a significant contaminant in surface soil of either aggregate. The key results for contaminant nature and extent in soil are summarized below.
Eastern Aggregate
• Explosives and propellants are generally absent from surface soil of this aggregate. Only one propellant compound (nitroguanidine) was detected at a low estimated concentration in the northeastern portion of the aggregate.
• The metals exceeding background concentrations in the Eastern Aggregate included chromium, mercury, nickel, silver, thallium, vanadium, and zinc. Of the metals with background values, mercury was the metal most frequently detected above background. In general, metals occurring above background were primarily limited to the northern portion of the aggregate.
• The occurrence of SVOCs in surface soil is limited to the PAHs, which were only detected at the former transformer pad located east of Building 900.
• Pesticides and PCBs were not detected in surface soil in the Eastern Aggregate.
• Trichloroethene (TCE) and dichloroethene (DCE) were detected at low, often estimated, concentrations in surface soil of this aggregate.
Western Aggregate
• Explosives and propellants are present in surface soil of the Western Aggregate. These compounds primarily occur in the vicinity of Buildings FF-19, 900, 904, and 905 and the Team Track Area.
• The metals occurring most frequently above background concentrations include antimony, barium, chromium, copper, lead, mercury, nickel, and zinc. Metal concentrations above background were most prevalent in the Building FF-19 area, with fewer occurrences above background in the Buildings 901, 905, and 906 and the Team Track areas.
• SVOCs occurring in soils of the Western Aggregate primarily consist of PAHs, which were detected most frequently at Buildings FF-19, 901, 902, and 906 and the Team Track Area. The highest concentrations of PAHs occur at Building FF-19.
• Low concentrations of VOCs detected in surface soil of this aggregate included TCE, DCE, methylene chloride, and toluene. Methylene chloride and TCE were the most frequently occurring VOCs, with TCE primarily occurring at Buildings FF-19, 900, and 901.
• Pesticides were most frequently detected in the Team Track Area; other occurrences were reported for the Building FF-19 area. PCB-1260 was the most commonly detected PCB compound and was most prevalent in the Building FF-19 area.
RVAAP Load Line 12 Final Phase II RI Report
01-133(doc)/030204 xxiii
Subsurface Soil
• Explosives are present in subsurface soil in the vicinity of Buildings FF-19, 900, 904, and 905. The explosive 2,4,6-TNT is the most commonly occurring explosive, with the highest concentrations detected in the footprints of Buildings 904 and 905.
• Nitrocellulose was the only propellant detected in subsurface soil. This compound occurs in subsurface soil at Buildings FF-19, 900, 904, and 905.
• The metals detected at concentrations exceeding their respective background concentrations most frequently include antimony, copper, lead, mercury, and zinc. As with surface soil, metals above background are most prevalent in subsurface soil in the vicinity of Building FF-19. Additional occurrences of metals above background are also associated with Building 904 and the Team Track Area.
• PAHs occur in the Building FF-19 and the FE-17 Power House building areas. Isolated occurrences of PAHs are also associated with Building 904 and the Team Track Area.
• Methylene chloride and toluene were detected in seven subsurface soil samples collected in the vicinity of Buildings FF-19, FE-17, 52, and 904 and the Team Track Area.
• Pesticides are generally absent from subsurface soil at Load Line 12. Three pesticide compounds were detected at only two sampling stations at Load Line 12, one associated with Building FF-19 and one at Building 905. As with surface soil, PCB-1260 is the most common PCB compound in subsurface soil, occurring primarily in soil to depths of 1.5 m (5 ft) in the vicinity of Building FF-19.
Sediment
Sediment samples were divided into four aggregates based on drainage area: the Main Ditch, the Active Area Channel, the West Ditch, and the Channel North of the Active Area.
• The following SRCs occur in sediment across all aggregates: aluminum, antimony, beryllium, cadmium, chromium, cobalt, copper, mercury, nickel, benzo(a)anthracene, benzo(a)pyrene, benzo(b)fluoranthene, fluoranthene, phenanthrene, and pyrene.
• Explosives concentrations in sediment were < 1 mg/kg and limited to the West Ditch at Building 905 and the station furthest downstream of the process area near Upper Cobb’s Pond.
• In general, explosives in sediment were detected at much lower concentrations during the Phase II RI than during the Phase I RI. This could indicate that much of the contaminated sediment was buried or mixed with uncontaminated sediments over time, especially during building demolition and site grading conducted in 2000.
• Ditch sediment in the Main Ditch and West Ditch is mostly contaminated with metals. Cadmium, copper, and mercury were detected at concentrations exceeding their respective site background concentrations at every station near Buildings FF-19, FN-54, 902, and 905.
• The upgradient sampling location L12-228 is a “hot spot” for SVOCs, particularly PAHs. Thus, the presence of SVOCs in the Active Area Channel and stream channel North of the Active Area may not be due to activities at Load Line 12 but rather to inputs from the Atlas scrap yard or the roadway at the western AOC boundary. PAHs were also detected frequently in the Main Ditch and West Ditch aggregates.

RVAAP Load Line 12 Final Phase II RI Report
01-133(doc)/030204 xxiv
• The VOCs detected in sediment included acetone, 2-butanone, TCE, DCE, methylene chloride, and toluene. Methylene chloride and 2-butanone were the most frequently occurring VOCs, with the most detections occurring in the West Ditch aggregate near Buildings FN-54 and in the Channel North of the Active Area.
• PCB-1254 and PCB-1260 were the most frequently detected PCBs in sediment, occurring primarily in the West Ditch and Main Ditch. Pesticides and PCBs were absent from sediment in the Channel North of the Active Area.
• SRCs in sediment that have migrated to the downstream location (station L12-229) include 1,3-dinitrobenzene (DNB), antimony, cadmium, cobalt, mercury, nickel, silver, 2-butanone, acetone, benzo(b)fluoranthene, and fluoranthene.
Surface Water
Surface water samples were divided into the same aggregates as sediment samples: the Main Ditch, the Active Area Channel, the West Ditch, and the Channel North of the Active Area.
• The following SRCs occur in surface water across all aggregates: 2,4-dinitrotoluene (DNT), barium, cadmium, cobalt, copper, manganese, nickel, vanadium, and zinc.
• Explosives were detected in all surface water aggregates at low concentrations; surface water in the Active Area Channel contains the highest concentrations of explosives contamination. Explosives were not detected in surface water at the station furthest downstream (L12-229).
• Surface waters in the West Ditch aggregate are most contaminated with metals. Barium, cadmium, chromium, cobalt, copper, nickel, and zinc were detected at concentrations exceeding their respective background concentrations at every station in ditches near Buildings 900, 905, and FN-54.
• Nitrate was detected at 2.1 times the maximum contaminant level (MCL) for drinking water in the West Ditch, near Building 900.
• SVOCs and VOCs are not widespread in surface water. Detections of bis(2-ethylhexyl)phthalate and methylene chloride were limited to the West Ditch near Building 900 and the northern AOC boundary. Pesticides and PCBs are absent from surface water at Load Line 12.
• SRCs in surface water that have migrated to the downstream location (station L12-229) include cobalt, nickel, and vanadium. However, surface water has transported an additional nine SRCs in sediment from the process area to this station, which may reflect flux of additional contaminants in the past during load line operations.
Groundwater
Groundwater samples were collected from monitoring wells screened in unconsolidated glacial sediment to assess groundwater impacts and potential migration pathways.
• All monitoring wells contain detectable quantities of explosives. Wells in the northern half of the AOC, particularly near Building 900, the northern boundary, and the Team Track Area, are most contaminated.
RVAAP Load Line 12 Final Phase II RI Report
01-133(doc)/030204 xxv
• All monitoring wells contain detectable quantities of TAL metals. Wells in the northern half of the AOC are most contaminated. Filtered samples show exceedances of primary federal drinking water MCLs for the following metals:
– Arsenic at L12mw-128 and L12mw-154, – Thallium at L12mw-185.
• Nitrate concentrations exceed primary federal drinking water MCLs by factors of 1.6, 18.5, and 71.3 at stations L12mw-113, L12mw-185, and L12mw-187, respectively. The fact that nitrate was detected only in wells adjacent to primary ammonium nitrate production areas suggests that contaminants have not migrated far from source areas.
• SVOCs and PCBs/pesticides are minor contaminants in Load Line 12 groundwater. Occurrences of SVOCs in groundwater do not correspond to source areas for SVOCs in surface or subsurface soil.
Sanitary Sewer Water and Sediment
Surface water and sediment samples were collected from the sanitary sewer system during the Phase II RI to determine whether the system represents an accumulation point for contaminants introduced via building floor and sink drains during AOC operations.
• Explosives were detected at low concentrations in sewer water at all locations sampled. The most frequently detected compounds were RDX; 2,4-DNT; 2-amino-4,6-DNT; and 4-amino-2,6-DNT. Explosives were detected at low concentrations in sediment at the two sampling stations, L12-218 (Manhole 504A) and L12-219 (Manhole 505).
• Sediment and water at two stations, L12-218 and L12-219, are contaminated with metals. Mercury was detected in sediment at L12-219 at a concentration 267 times greater than its respective background criterion. The copper concentration in sediment at L12-218 were 31 times its background value.
• Nitrate was detected in sewer water at every station sampled, with a maximum concentration of 10,600 µg/L at L12-219. Nitrate was also detected once in sediment at station L12-219. Cyanide was not detected in water or sediment at any station sampled.
• Sediment at stations L12-218 and L12-219 is contaminated with SVOCs, particularly PAHs. Three PAHs were detected in sediment at station L12-220 but at much lower concentrations than at the upgradient stations. One VOC and several pesticides/PCBs were also detected in sediment at L12-219.
• One pesticide, heptachlor epoxide, was detected in sewer water at three stations. No SVOCs or VOCs were detected in sewer water.
FATE AND TRANSPORT ANALYSIS
Contaminant fate and transport modeling performed as part of the Phase II RI included leachate modeling (SESOIL) at selected source areas in the Western Soil Aggregate (i.e., Buildings 904, 905, FF-19, etc.) and groundwater modeling (ATD123) from the sources to selected receptors or exit points from the AOC. Average precipitation, evapotranspiration rates, and other hydrologic parameters for the northeast Ohio region were input for the analyses. For the Eastern Soil Aggregate, source areas were defined by the maximum concentrations at individual sampling stations. Fate and transport modeling indicates that metals and
RVAAP Load Line 12 Final Phase II RI Report
01-133(doc)/030204 xxvi
explosives may leach from contaminated soils into the groundwater beneath the source areas. Migration of many of the constituents, however, has been attenuated because of moderate to high retardation factors.
SESOIL Modeling
In the Eastern Soil Aggregate, SESOIL modeling results indicate that chromium and nickel are predicted to leach to groundwater with concentrations exceeding groundwater risk-based concentrations or MCLs beneath sampling points. For the purpose of numerical modeling comparisons, the EPA Region 9 Preliminary Remediation Goals (PRGs) are used for risk-based concentrations. In the Western Aggregate, groundwater concentrations from leachate loading predicted to exceed groundwater PRGs/MCLs include the following
• Five metals, seven explosives, one pesticide, and one VOC were identified as contaminant migration constituents of potential concern based on source loading predicted by the leachability analysis or on measured groundwater concentrations downgradient of the sources.
• Antimony, chromium, manganese, 1,3-DNB; 2,4-DNT; 2,6-DNT; 4-nitrotoluene; and RDX at Building 904. Measured groundwater concentrations exceeded PRGs/MCLs, and predicted concentrations for 2,4-DNT and the pesticide beta-benzene hexachloride (BHC), indicating that leaching processes have already occurred.
• Groundwater concentrations predicted by leachate modeling exceeds PRGs/MCLs beneath Building 905 for barium; chromium; 1,3-DNB; 2,4-DNT; and RDX. Groundwater concentrations downgradient of Building 905 exceed predicted groundwater concentrations and PRGs/MCLs for manganese, 2,4-DNT and beta-BHC, indicating that leaching processes have already occurred.
• Predicted groundwater concentrations beneath Building FF-19 exceed PRGs/MCLs for antimony, chromium, and manganese. Observed groundwater concentrations exceed predicted concentrations and PRGs/MCLs for 2,4-DNT; RDX; and beta-BHC, indicating that leaching processes have already occurred.
• In the Team Track Area, leachate modeling predicted groundwater concentrations that exceed PRGs/MCLs for antimony, chromium, manganese, nickel, 3-nitrotoluene, 4-nitrotoluene, and nitrobenzene. Downgradient concentrations of 2,4-DNT; RDX; and beta-BHC exceed PRGs/MCLs, and predicted concentrations beneath the Team Track Area indicate that leaching processes have already occurred.
ATD123 Modeling
AT123D modeling results indicate that off-site migration of some contaminants via groundwater pathways at Load Line 12 at concentrations above PRG/MCLs may occur in the future. Contaminants predicted to reach the Active Area Channel (groundwater baseflow discharge point within the AOC) at concentrations above PRGs/MCLs are:
• antimony; chromium; manganese; 2,4-DNT; RDX; and beta-BHC from Building FF-19; • RDX from Buildings 904 and 905; and • chromium; manganese; 3-nitrotoluene; 2,4-DNT; and RDX from the Team Track Area.
Peak concentrations for metals are predicted to occur on the order of hundreds of years from the point of release. Peak concentrations for RDX are predicted to occur from about 40 years (Team Track Area) to 150 years (Buildings 904 and 905) from the point of release.
RVAAP Load Line 12 Final Phase II RI Report
01-133(doc)/030204 xxvii
Modeling of groundwater transport from source areas to the AOC boundary shows that RDX is predicted to reach the AOC boundary at concentrations above MCLs/PRGs from Buildings 904 and 905, with peak concentrations occurring about 150 years following the release point.
BASELINE HUMAN HEALTH RISK ASSESSMENT
A Baseline Human Health Risk Assessment (BHHRA) was conducted to evaluate risks and hazards associated with contaminated media at Load Line 12 for four potential future land use scenarios: (1) National Guard/managed recreational, (2) open industrial, (3) open recreational, and (4) open residential. According to OSWER directive 9355.7-04 for considering land use for making remedy selection decisions under CERCLA at National Priorities List sites, future land use assumptions allow the BHHRA and FS to focus on developing practicable and cost-effective remedial alternatives. These alternatives should lead to site evaluation and remediation, consistent with the reasonably anticipated future land use. However, there may be reasons to analyze implications associated with additional land uses. The most likely future receptors at Load Line 12 are National Guard personnel, hunter/trappers, security guard/maintenance workers, and industrial workers. Although unlikely to occur at Load Line 12, the child trespasser receptor was evaluated to provide an indication of risks and hazards should such exposure circumstances occur (e.g., crossing the security fence and wading, swimming, or fishing within the AOC). To evaluate risks and hazards under a worst-case future exposure scenario, the open residential land use scenario was also evaluated. Direct exposure pathways (ingestion of contaminated media, inhalation, and skin contact), as well as indirect exposure pathways (ingestion of venison and fish by the hunter/trapper and ingestion of fish, venison, beef, milk, and vegetables by the resident farmer) were evaluated.
The calculated cancer risks for these receptors are compared to the range specified in the National Oil and Hazardous Substances Pollution Contingency Plan (NCP) of 1 in 1 million (10-6) to 1 in 10,000 (10-4) exposed persons developing cancer (EPA 1990). Individual lifetime cancer risks (ILCRs) below 10-6 are considered acceptable. ILCRs above 10-4 are considered unacceptable. The range between 10-6 and 10-4 is of potential concern, and any decisions to address ILCRs further in this range, either through additional study or engineered control measures, should account for the uncertainty in the risk estimates. The Clean Ohio Fund, written in January 2001, uses 10-5 as the official target risk goal for development of clean-up goals. Chemicals with a chemical hazard index (HI) ≥ 1.0 or an ILCR ≥ 1×10⁻⁶ were considered as chemicals of concern (COCs). Chemicals presenting HIs ≥ 1.0 and ICLR ≥ 1×10⁻⁴, which is the upper limit of the acceptable CERCLA risk ranges, are also highlighted.
Soil
Potential human health risks/hazards were evaluated for exposure to chemicals in soil for eight receptors: child trespasser (surface soil only), hunter/trapper (surface soil only), National Guard personnel, security guard/maintenance worker (surface soil only), recreator (surface soil only), industrial worker, and resident farmer (adult and child). Table ES-1 presents total risks and hazards for these receptors due to direct and indirect contact with soil.
• Eastern Soil Aggregate. No hazards ≥1, risks ≥10-4, or COCs were identified for exposure to soil (via direct exposure pathways) by the child trespasser, hunter/trapper, National Guard, security guard/maintenance worker, recreator, or industrial worker receptors. Benzo(a)pyrene was identified as a COC for direct contact by the resident farmer (adult only). Hazards ≥1 or risks ≥10-4 were identified for ingestion of foodstuffs by the resident farmer (adult and child).
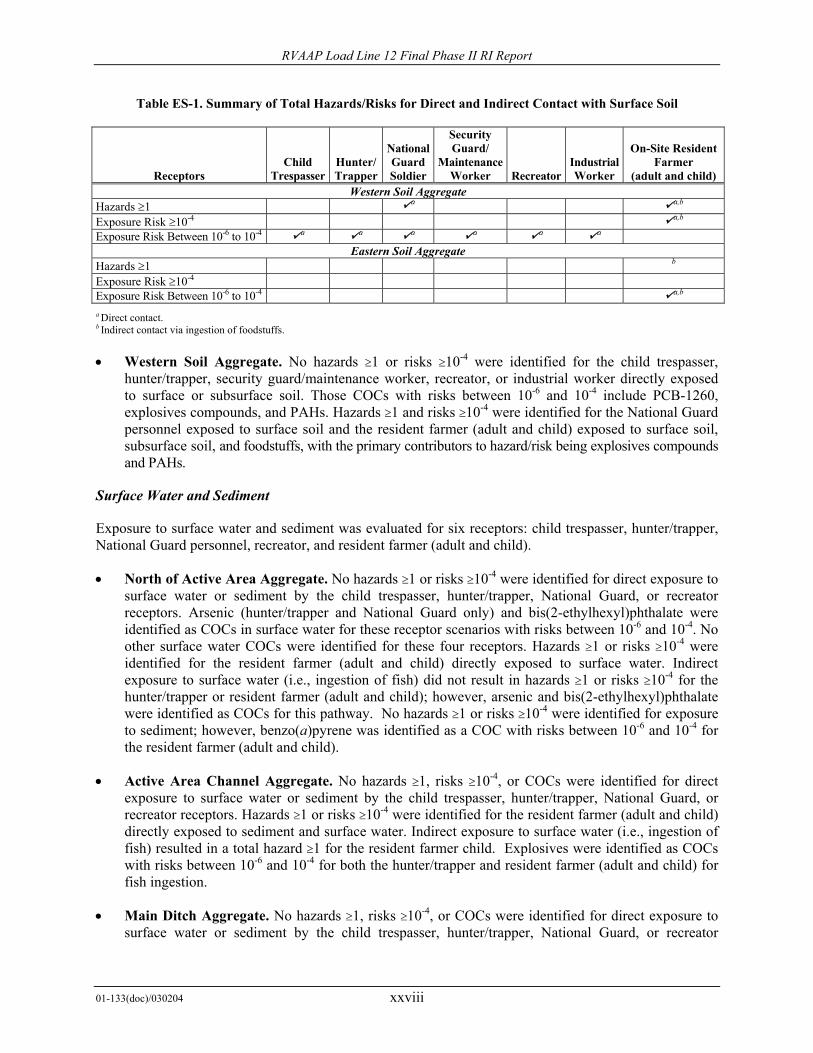
RVAAP Load Line 12 Final Phase II RI Report
01-133(doc)/030204 xxviii
Table ES-1. Summary of Total Hazards/Risks for Direct and Indirect Contact with Surface Soil
Receptors Child
Trespasser Hunter/ Trapper
National Guard Soldier
Security Guard/
Maintenance Worker Recreator
Industrial Worker
On-Site Resident Farmer
(adult and child) Western Soil Aggregate
Hazards ≥1 a a,b Exposure Risk ≥10-4 a,b Exposure Risk Between 10-6 to 10-4 a a a a a a
Eastern Soil Aggregate Hazards ≥1 b Exposure Risk ≥10-4 Exposure Risk Between 10-6 to 10-4 a,b a Direct contact. b Indirect contact via ingestion of foodstuffs.
• Western Soil Aggregate. No hazards ≥1 or risks ≥10-4 were identified for the child trespasser, hunter/trapper, security guard/maintenance worker, recreator, or industrial worker directly exposed to surface or subsurface soil. Those COCs with risks between 10-6 and 10-4 include PCB-1260, explosives compounds, and PAHs. Hazards ≥1 and risks ≥10-4 were identified for the National Guard personnel exposed to surface soil and the resident farmer (adult and child) exposed to surface soil, subsurface soil, and foodstuffs, with the primary contributors to hazard/risk being explosives compounds and PAHs.
Surface Water and Sediment
Exposure to surface water and sediment was evaluated for six receptors: child trespasser, hunter/trapper, National Guard personnel, recreator, and resident farmer (adult and child).
• North of Active Area Aggregate. No hazards ≥1 or risks ≥10-4 were identified for direct exposure to surface water or sediment by the child trespasser, hunter/trapper, National Guard, or recreator receptors. Arsenic (hunter/trapper and National Guard only) and bis(2-ethylhexyl)phthalate were identified as COCs in surface water for these receptor scenarios with risks between 10-6 and 10-4. No other surface water COCs were identified for these four receptors. Hazards ≥1 or risks ≥10-4 were identified for the resident farmer (adult and child) directly exposed to surface water. Indirect exposure to surface water (i.e., ingestion of fish) did not result in hazards ≥1 or risks ≥10-4 for the hunter/trapper or resident farmer (adult and child); however, arsenic and bis(2-ethylhexyl)phthalate were identified as COCs for this pathway. No hazards ≥1 or risks ≥10-4 were identified for exposure to sediment; however, benzo(a)pyrene was identified as a COC with risks between 10-6 and 10-4 for the resident farmer (adult and child).
• Active Area Channel Aggregate. No hazards ≥1, risks ≥10-4, or COCs were identified for direct exposure to surface water or sediment by the child trespasser, hunter/trapper, National Guard, or recreator receptors. Hazards ≥1 or risks ≥10-4 were identified for the resident farmer (adult and child) directly exposed to sediment and surface water. Indirect exposure to surface water (i.e., ingestion of fish) resulted in a total hazard ≥1 for the resident farmer child. Explosives were identified as COCs with risks between 10-6 and 10-4 for both the hunter/trapper and resident farmer (adult and child) for fish ingestion.
• Main Ditch Aggregate. No hazards ≥1, risks ≥10-4, or COCs were identified for direct exposure to surface water or sediment by the child trespasser, hunter/trapper, National Guard, or recreator
RVAAP Load Line 12 Final Phase II RI Report
01-133(doc)/030204 xxix
receptors. Arsenic and PCB-1254 were identified as COCs in sediment for all four receptors. Hazards ≥1 or risks ≥10-4 were identified for the resident farmer directly exposed to sediment and surface water. Indirect exposure to surface water (i.e., ingestion of fish) did not result in hazards ≥1, risks ≥10-4, or COCs for the hunter/trapper or resident farmer (adult and child).
• West Ditches Aggregate. No hazards >1, risks >10-4, or COCs were identified for direct exposure to surface water or sediment by the child trespasser, hunter/trapper, National Guard, or recreator receptors. Hazards ≥1 or risks ≥10-4 were identified for the resident farmer directly exposed to sediment and surface water. Indirect exposure to surface water (i.e., ingestion of fish) did not result in hazards ≥1, risks ≥10-4, or COCs for the hunter/trapper or resident farmer (adult and child).
• Ambient (Upgradient) Location. No hazards ≥1, risks ≥10-4, or COCs were identified for direct exposure to surface water or sediment by the child trespasser, hunter/trapper, National Guard, or recreator receptors at station L12-228, the upgradient location at the western AOC boundary. Hazards >1 or risks ≥10-4 were identified for the resident farmer directly exposed to surface water and sediment. Indirect exposure to surface water (i.e., ingestion of fish) did not result in hazards ≥1, risks ≥10-4, or COCs for the hunter/trapper or resident farmer (adult and child).
Groundwater
Risks and hazards were estimated for the National Guard and residential farmer scenarios for potable use of groundwater. These are hypothetical future scenarios; no receptors are currently using groundwater from the AOC for any purpose.
A total HI of 3 was estimated for monitoring wells at Load Line 12 for the National Guard receptor. This HI is associated primarily with arsenic. The total risk for this receptor (2E-04) falls above the range of 10-6 to 10-4 and is also associated primarily with arsenic.
The estimated HIs (10 for adult, 33 for child) and total risk (1E-03 for adult 7E-04 for child) exceed the target ranges for the resident farmer scenario. The primary contributors to the total hazard are arsenic and nitrate. The primary contributor to risk for both the National Guard and resident farmer scenarios is arsenic.
SCREENING ECOLOGICAL RISK ASSESSMENT
Load Line 12 contains sufficient terrestrial and aquatic (surface water and sediment) habitat to support various types of ecological receptors, such as vegetation, small and large mammals, and birds. Due to the presence of suitable habitat and observed receptors at the site, a screening ecological risk assessment (SERA) was performed in accordance with written guidance from the Ohio and Region 5 EPA and also considered Ohio’s water quality standards. Five terrestrial receptor classes (vegetation, soil-dwelling invertebrates, worm-eating and/or insectivorous mammals, mammalian herbivores, and terrestrial top predators) were evaluated. For aquatic receptor classes, sediment-dwelling organisms, aquatic organisms, and terrestrial top predators of aquatic organisms were evaluated. Groundwater was not evaluated because direct exposure to receptors would be expected to occur as a result of groundwater discharge to surface water features. Soil deeper than 0.3 m (1 ft) was also not evaluated because contaminant concentrations in surface soil represent the probable worst-case exposures for most contaminants. Table ES-2 presents a summary of constituents of potential ecological concern (COPECs) in soil, sediment, and surface water at Load Line 12.
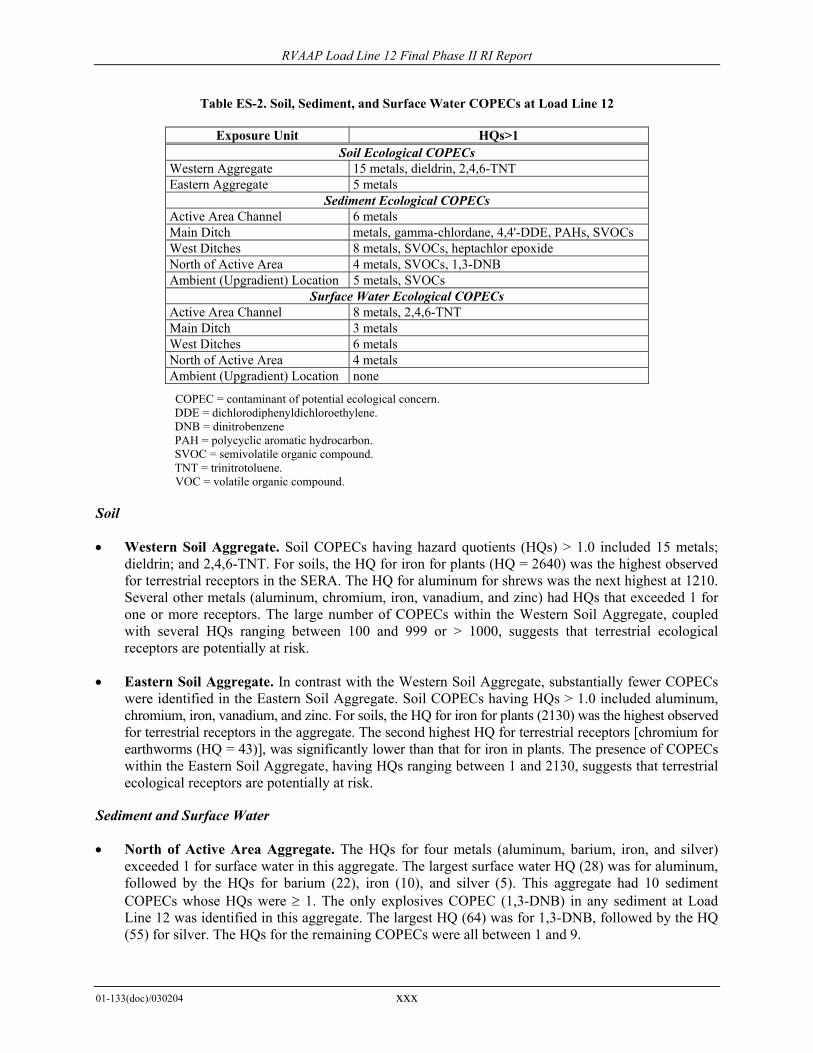
RVAAP Load Line 12 Final Phase II RI Report
01-133(doc)/030204 xxx
Table ES-2. Soil, Sediment, and Surface Water COPECs at Load Line 12
Exposure Unit HQs>1 Soil Ecological COPECs
Western Aggregate 15 metals, dieldrin, 2,4,6-TNT Eastern Aggregate 5 metals
Sediment Ecological COPECs Active Area Channel 6 metals Main Ditch metals, gamma-chlordane, 4,4'-DDE, PAHs, SVOCs West Ditches 8 metals, SVOCs, heptachlor epoxide North of Active Area 4 metals, SVOCs, 1,3-DNB Ambient (Upgradient) Location 5 metals, SVOCs
Surface Water Ecological COPECs Active Area Channel 8 metals, 2,4,6-TNT Main Ditch 3 metals West Ditches 6 metals North of Active Area 4 metals Ambient (Upgradient) Location none
COPEC = contaminant of potential ecological concern. DDE = dichlorodiphenyldichloroethylene. DNB = dinitrobenzene PAH = polycyclic aromatic hydrocarbon. SVOC = semivolatile organic compound. TNT = trinitrotoluene. VOC = volatile organic compound.
Soil
• Western Soil Aggregate. Soil COPECs having hazard quotients (HQs) > 1.0 included 15 metals; dieldrin; and 2,4,6-TNT. For soils, the HQ for iron for plants (HQ = 2640) was the highest observed for terrestrial receptors in the SERA. The HQ for aluminum for shrews was the next highest at 1210. Several other metals (aluminum, chromium, iron, vanadium, and zinc) had HQs that exceeded 1 for one or more receptors. The large number of COPECs within the Western Soil Aggregate, coupled with several HQs ranging between 100 and 999 or > 1000, suggests that terrestrial ecological receptors are potentially at risk.
• Eastern Soil Aggregate. In contrast with the Western Soil Aggregate, substantially fewer COPECs were identified in the Eastern Soil Aggregate. Soil COPECs having HQs > 1.0 included aluminum, chromium, iron, vanadium, and zinc. For soils, the HQ for iron for plants (2130) was the highest observed for terrestrial receptors in the aggregate. The second highest HQ for terrestrial receptors [chromium for earthworms (HQ = 43)], was significantly lower than that for iron in plants. The presence of COPECs within the Eastern Soil Aggregate, having HQs ranging between 1 and 2130, suggests that terrestrial ecological receptors are potentially at risk.
Sediment and Surface Water
• North of Active Area Aggregate. The HQs for four metals (aluminum, barium, iron, and silver) exceeded 1 for surface water in this aggregate. The largest surface water HQ (28) was for aluminum, followed by the HQs for barium (22), iron (10), and silver (5). This aggregate had 10 sediment COPECs whose HQs were ≥ 1. The only explosives COPEC (1,3-DNB) in any sediment at Load Line 12 was identified in this aggregate. The largest HQ (64) was for 1,3-DNB, followed by the HQ (55) for silver. The HQs for the remaining COPECs were all between 1 and 9.

RVAAP Load Line 12 Final Phase II RI Report
01-133(doc)/030204 xxxi
• Active Area Channel Aggregate. The HQs for eight metals (aluminum, barium, copper, iron, manganese, selenium, silver, and zinc) and one explosive (2,4,6-TNT) exceeded 1 for aquatic biota, mink, or herons exposed to surface water in this aggregate. The largest surface water HQ (79) was for aluminum, followed by those for silver (66), barium (28), and iron (10). The remaining surface water HQs ranged between 1 and 9. This aggregate contained the fewest sediment COPECs, with six compounds having HQs ≥ 1. The highest sediment HQ (28,000) was for cyanide, followed by silver (HQ = 794), which was the only HQ between 100 and 999. The remaining sediment HQs ranged between 1 and 10. No explosives were identified as COPECs in sediment.
• Main Ditch Aggregate. Surface water in this aggregate contained barium, manganese, and zinc at concentrations resulting in HQs of 28, 3, and 1, respectively, for aquatic biota. Sediment in this aggregate contained 13 COPECs whose HQs were ≥ 1.0. Arsenic had the largest sediment HQ (42), followed by gamma-chlordane (19), 4,4'-DDE (18), and copper (10). The remaining sediment COPECs had HQs ranging between 1 and 9. No explosives compounds were identified as COPECs in surface water or sediment.
• West Ditches Aggregate. This aggregate had the second largest number of surface water COPECs, including three HQs between 10 and 99 (aluminum, barium, and iron), four HQs between 1 and 9 (aluminum, copper, manganese, and zinc). The surface water HQ for aluminum for mink also exceeded 1.0. Sediment in the aggregate contained 12 COPECs with HQs ≥ 1.0. The largest sediment HQ (27) was for 2-methylnaphthalene, followed by those for copper (15) and heptachlor epoxide (13). All of the remaining sediment COPECs had HQs ranged between 1 and 9. No explosives compounds were identified as COPECs in surface water or sediment.
• Ambient (Upgradient) Location. No COPECs were identified for surface water in the ambient (upstream) location. However, the ambient location contained the most sediment COPECs, including 5 metals and 13 SVOCs having HQs ≥ 1.0. The highest HQ for sediments was for acenaphthene (107). Eleven other SVOCs had HQs ranging between 10 and 99. Five metals and one SVOC had HQs ranging between 1 and 9. No explosives compounds were identified as COPECs in surface water or sediment.
SITE-SPECIFIC CONCEPTUAL SITE MODEL
A revised site-specific CSM was developed using data obtained during the Phase II RI and computer models that assess the potential fate and transport of contaminants that leach from surface soil into the groundwater system and migrate to a potential receptor or exit point. Elements of the CSM include
• primary contaminant source areas and release mechanisms based on Phase II RI soil data;
• contaminant migration pathways and exit points based on Phase II RI surface water, sediment, and groundwater data; and
• data gaps and uncertainties.
Source-Term and Release Mechanisms
Results of Phase II RI soil sampling indicate that the Western Soil Aggregate, particularly areas surrounding Buildings FF-19, 900, 904, and 905 and the Team Track Area, contain the greatest numbers and concentrations of contaminants. Metals, explosives, SVOCs, and PCBs/pesticides are present in soil in these areas at concentrations greater than background or risk screening criteria. The majority of contamination is within
RVAAP Load Line 12 Final Phase II RI Report
01-133(doc)/030204 xxxii
the surface soil interval less than a depth of 0.3 m (1.0 ft), but some explosives, propellants, metals, and PAHs were detected in subsurface soil in areas of high surface soil contamination. The crushed slag used throughout RVAAP for roads, railroad beds, and driveways may also be an unrelated source of certain elevated metals throughout the AOC, particularly in the Team Track Area. Demolitions of some buildings in the 1970s involved open burning of combustible materials using dunnage and petroleum accelerants (i.e., fuel oil and kerosene) that may have contributed PAHs to soils. Soil in various portions of the Western Aggregate can be considered sources of PAHs. Soil contamination with benzo(a)pyrene at Building FF-19 poses potential risk in all exposure scenarios evaluated.
The areas surrounding Buildings 901, 902, and 906 also exhibited contamination, but to a lesser degree than the primary source areas mentioned above. Soil in the Eastern Aggregate and in the vicinity of Buildings 903, FN-54, and FE-17 and the Water Works area does not appear to be a significant source of contamination. Soil at a former transformer pad located in the Eastern Soil Aggregate does present potential health risks to the residential farmer through exposure to benzo(a)pyrene and benzo(b)fluoranthene; however, the source area is very small [less than 100 m2 (1,000 ft2)].
Sampling of drainage channels indicates that contaminant releases due to erosion of surface soil and overland transport to drainages is of concern. Sediment in these drainages, particularly those within the Main Ditch and Active Area Channel, can be considered a secondary source for metals, PAHs, and PCBs at levels that exceed risk-based criteria. Sampling of sediment and surface water within the sanitary sewer system indicates contamination is present, and thus these media are possible secondary sources of contamination. The sewer system could potentially transport contaminants from Load Lines 1, 2, and 3 to Load Line 12. However, contaminants detected at each sewer sampling location within Load Line 12 can be attributed to nearby source areas (buildings).
The primary mechanism for release of contaminants from the source areas is leaching of constituents via infiltration of rainwater through surface and subsurface soils. Modeling indicates that several metals and explosives are expected to leach from the contaminated surface soil into the groundwater in the future and reach concentrations exceeding PRGs/MCLs. The presence of three inorganics, two explosives, one pesticide, and one SVOC in groundwater at concentrations exceeding PRGs/MCLs confirms that some leaching of contaminants from soil to groundwater has already occurred.
Contaminant Migration Pathways and Exit Points
Modeling results indicate that off-site migration of some contaminants via groundwater at concentrations above PRGs/MCLs may occur. However, current groundwater data show that nitrate, which is highly soluble and very mobile in groundwater, has not migrated far from primary source areas.
Migration of contaminants from soil sources occurs primarily by (1) leaching through surface and subsurface soil to groundwater, (2) movement of particle-bound contaminants in surface water runoff, and (3) transport of dissolved constituents in surface water. Upon reaching quiescent portions of surface water conveyances, flow velocities decrease, and particle-bound contaminants settle out with sediment. Sediment-bound contaminants may be re-mobilized during storm events. Sediment-bound contaminants may also partition to surface water and be transported in dissolved phase. Several contaminants were present in sediment and surface water within drainage ditches at concentrations exceeding risk-based levels for all receptors considered. These contaminants can be essentially attributed or “traced” back to nearby source areas, particularly Buildings FF-19, 900, 904, and 905.
Another potential migration pathway is from the sewer system to groundwater, given that a large portion of the sewer system at Load Line 12 is flooded. Field data indicated that the amount of sediment accumulation within the former sanitary sewer system, which would serve as the source of any
RVAAP Load Line 12 Final Phase II RI Report
01-133(doc)/030204 xxxiii
contamination, was not substantial. Considering that nitrate was present in both groundwater and sewer system water samples, the sewer system is connected to shallow groundwater and may function as a preferential migration pathway.
The primary contaminant exit pathway from Load Line 12 is via surface water and groundwater flow to the north towards the Cobb’s Pond complex. Complex groundwater flow patterns exist within the AOC, but in general, flow is to the north where it is in direct contact with surface water in the headwaters of Upper Cobb’s Pond. The flat topography across the site, heavy aquatic vegetation, and beaver activity in the northern portions of the watershed greatly reduce surface water flow rates and maximize the potential for settling, sorption onto organic matter, and biological uptake. The low concentrations of the 12 SRCs detected in sediment and surface water at the furthest station downstream of L12-229 suggest that these processes are effective at attenuating constituents and restricting their migration beyond the AOC boundary. However, storm events may produce flushing of the surface water system and result in periodic transport beyond the AOC boundary. The migration of contaminants from Load Line 12 to off-AOC areas via groundwater was not confirmed by sampling during the Phase II RI.
Uncertainties
The CSM is developed using available site characterization and chemical data. Uncertainties are inherent in the CSM where selected data do not exist or are sparse. The uncertainties within the CSM for Load Line 12 include the following:
• Groundwater flow patterns indicate that flow converges toward the central portion of the former process area before moving north-northeast. Since most of the monitoring wells are clustered within and to the north of the AOC, chemical inputs from other AOCs to the east and west are unknown. Monitoring wells in these off-AOC areas would be needed to confirm whether groundwater contamination can be attributed solely to activities at Load Line 12.
• The exact source of PAHs at Load Line 12 is unknown, particularly in sediments within the Active Area Channel at the western AOC boundary (ambient station). Potential past uses or sources within Load Line 12 and areas draining to Load Line 12 from the west may include former demolition activities (open burning) and anthropogenic sources, such as fuel oil-fired steam plants. These sources may be identified more fully to assess the nature and extent of these contaminants should this information be required to adequately evaluate remedial actions.
• The amount of contaminant flux to Upper Cobb’s Pond attributable to Load Line 12 is an unknown element of the conceptual model at present. Other sources to the Cobb’s Pond complex include those at Load Line 3.
• Leachate and transport modeling is limited by uncertainties in the behavior and movement of contaminants in the presence of multiple solutes. In addition, heterogeneity, anisotropy, and spatial distributions of permeable zones (e.g., sand or gravel zones) could not be fully characterized during the field investigation nor addressed in the modeling. Therefore, effects of these features on contaminant transport at Load Line 12 are uncertain.
CONCLUSIONS
The conclusions presented below by medium combine the findings of the contaminant nature and extent evaluation, fate and transport modeling, and the BHHRA and SERA. To support remedial alternative selection and evaluation in future CERCLA documents (i.e., FS), the contaminant levels in surface soil,
RVAAP Load Line 12 Final Phase II RI Report
01-133(doc)/030204 xxxiv
subsurface soil, surface water, and sediment at Load Line 12 were compared to provisional RGOs for the most likely human exposure scenarios (National Guard use and recreational use) and the worst-case exposure scenario (residential/farmer). EPA has noted that, in general, RGOs should be developed in order to focus on alternatives that would achieve cleanup levels associated with the reasonably anticipated future land use over as much of the site as possible (OSWER Directive No. 9355.7-04).
The RGOs for the minimum endpoint of the acceptable CERCLA risk range (HI = 0.1 and risk = 1E-06) and the maximum endpoint (HI = 1.0 and risk 1E-04) were evaluated. Where the facility-wide background value for a constituent was greater than the RGO, only those values in excess the background criteria were evaluated.
Western Soil Aggregate
• The primary identified source areas in the Western Soil Aggregate include Buildings 900, 904, 905, and FF-19. Metals (Building FF-19), explosives (Buildings 900, 904, and 905), and PAHs represent the most pervasive SRCs in the former production area. The spatial distribution and concentrations of contaminants were highly variable in the vicinity of these source areas. With respect to vertical distribution, the numbers and concentrations of SRCs in subsurface soil at these source areas decreased significantly relative to surface soil.
• Sampling of locations around the AOC perimeter indicated a source area north of Load Line 12 in an apparent former staging area (Team Track Area). Other than the Team Track Area, perimeter sampling locations did not indicate substantial contamination outside of the former process area.
• Fate and transport modeling predict that leaching of metals and explosives compounds at Buildings 904, 905, and FF-19 will result in concentrations at the groundwater table in excess of PRGs in the future. The migration of metals and explosives constituents from the source areas to the closest groundwater discharge point at concentrations in excess of MCLs or PRGs is also predicted to occur within a time frame of 1,000 years from Building FF-19 and the Team Track Area. Modeling of groundwater transport from source areas to the AOC boundary shows that RDX is predicted to reach the AOC boundary at concentrations above PRGs/MCLs from Buildings 904 and 905. Migration of most of the constituents is attenuated because of moderate to high retardation factors, as well as degradation of organic compounds; these processes are not reflected in the conservative modeling results.
• Soil contamination in the vicinity of the identified source areas is currently at concentrations sufficient to result in chemical hazards and cancer risks for humans in excess of the minimum acceptable level under the most likely land use scenario (National Guard/managed recreational).
• Comparison of concentrations of COCs in surface soil to preliminary minimum RGOs (1E-06 risk and/or HI=0.1) shows that a total of 10 chemicals exceed their respective criteria for the National Guard, recreational, and residential land use scenarios. A number of the individual exceedances represent cases where the method reporting limit was greater than the minimum RGO. The locations where multiple sample stations had chemicals in excess of minimum RGOs include Buildings 900, 901, 902, 904, 905, and FF-19 and the Team Track Area. Areas having only single sample stations with at least one chemical above RGOs included Buildings 52, 903, and FN-54; two transformer pads; and two bare soil areas located east of Buildings 904 and 905. Building 906 had no chemicals above RGOs in surface soil.
• Fewer contaminants exceed minimum RGOs for subsurface soil, and almost all of the exceedances observed at specific sampling stations are associated with the residential receptor. The majority of exceedances of minimum RGOs in subsurface soil for the residential receptor occurred at sampling
RVAAP Load Line 12 Final Phase II RI Report
01-133(doc)/030204 xxxv
stations at Buildings FF-19, 901, 904, 905, and FE-17 (Power House). Four compounds [benzo(a)pyrene; dibenz(a,h)anthracene; 2,4,6-TNT; and RDX] exceeded minimum RGOs for the National Guard scenario at only nine sampling stations, although several of the exceedances represent method reporting limits in excess of RGOs.
• HQs for terrestrial and aquatic ecological receptors suggest that such receptors are potentially at risk from exposure to surface soil.
Eastern Soil Aggregate
• In the Eastern Soil Aggregate outside of the former production area, no contaminant source areas were identified in the contaminant nature and extent evaluation. Sporadic occurrences of metals may or may not be directly related to past AOC operations; these metals may represent residues from slag.
• Modeling results indicate that chromium and nickel are predicted to leach to groundwater with concentrations exceeding the groundwater PRGs/MCLs beneath sampling points. Groundwater transport modeling indicates that no constituent will migrate to receptors or the AOC boundary in excess of PRGs within a 1,000-year time frame.
• No COCs were identified for the most likely land use scenario, and only two compounds were identified as COCs under the most conservative potential future land use scenario. Benzo(a)pyrene was the only chemical reported above minimum RGOs at three sampling stations for the residential land use scenario; however, two of the reported concentrations represent method reporting limits.
• Some ecological receptors are at risk, but much less so than in the Western Soil Aggregate.
Surface Water and Sediment
• Explosives contamination in sediment is not widespread and occurs near Building 905 and at the station furthest downstream of the process area near Upper Cobb’s Pond.
• Ditch sediment near Buildings FF-19 and 905 is most contaminated with metals. The presence of SVOCs (primarily PAHs) was noted in the upgradient sample location (L12-228) and in sediment near Buildings FF-19, 901, 902, and FN-54. Thus, the presence of SVOCs in the Active Area Channel and North of the Active Area may not be due to activities at Load Line 12, but rather due to inputs from the Atlas scrap yard or the roadway at the western AOC boundary. Additionally, controlled open burning of several buildings during demolition work in the 1980s may have contributed to observed PAH contamination. Arochlor-1254 and Arochlor-1260 were detected in sediment near Buildings 902, 905, FF-19, and FN-54, but were absent from the stream channel in the North of the Active Area segment.
• At the exit point from the AOC, 1,3-DNB; antimony; cadmium; cobalt; mercury; nickel; silver; 2-butanone; acetone; benzo(b)fluoranthene; and fluoranthene were identified as SRCs, indicating previous migration and deposition of contaminants in the active area channel.
• Explosives were detected in all surface water aggregates; however, surface water in the Active Area Channel has been most impacted by explosives contamination. Explosives were not detected in surface water at the station furthest downstream near Upper Cobb’s Pond (L12-229).
• As with sediment, surface water in ditches just downstream of major source areas is most contaminated with metals. Barium, cadmium, chromium, cobalt, copper, nickel, and zinc were detected frequently
RVAAP Load Line 12 Final Phase II RI Report
01-133(doc)/030204 xxxvi
at concentrations exceeding their respective site background concentrations. Nitrate was detected at 2.1 times the MCL in surface water near Building 900.
• SVOCs and VOCs are not widespread, and pesticides/PCBs are absent from surface water at Load Line 12. At the AOC exit point, cobalt, nickel, and vanadium exceeded background criteria.
• Sediment and surface water present significantly lower risks than soil under the most likely land use scenarios. A total of nine chemicals exceeded minimum RGOs for sediment at 20 sampling stations. The majority of these exceedances for sediment were related to benzo(a)pyrene, and most were for the residential land use scenario. The notable exception was the Main Ditch Aggregate where arsenic and/or PCBs exceeded National Guard, recreational, and residential minimum RGOs at all four stations sampled in this aggregate. In addition, sediment at the upgradient station contained five PAHs in excess of minimum RGOs. For surface water, five chemicals exceeded minimum RGOs for the residential land use scenario only. A majority of these exceedances relate to bis(2-ethylhexyl)phthalate and 2,4-DNT and represent reporting limits in excess of the minimum residential RGO.
Groundwater
• Groundwater within the AOC contains explosives compounds and metals in excess of background values. Wells in the northern half of the AOC, particularly near Building 900, the northern boundary, and the Team Track Area, are most contaminated.
• Filtered samples show exceedances of primary federal drinking water MCLs for arsenic near Building 904 and for thallium near Building FF-19; these exceedances correspond to hot spots for these metals in either surface or subsurface soil. Nitrate concentrations much greater than federal drinking water MCLs were observed near Buildings 900, FF-19, and 901. The fact that nitrate was detected only in wells adjacent to primary ammonium nitrate production areas suggests that contaminants have not migrated far from source areas.
• SVOCs and PCBs/pesticides are minor contaminants in Load Line 12 groundwater.
• Chemical hazards and risks associated with arsenic and nitrate in groundwater under hypothetical future National Guard and residential land use scenarios exceed the upper bound of the CERCLA risk range.
• Nitrate; aldrin; bis(2-ethylhexyl)phthalate; 2,4-DNT; and RDX exceed minimum RGOs for the National Guard and residential land use scenarios. However, a majority of the exceedances reflect method reporting limits in excess of the minimum RGOs.
Sanitary Sewer Water and Sediment
• Explosive compounds were detected at low concentrations in water samples collected at all locations from the sanitary sewer.
• Sediment and water at stations L12-218 and L12-219 are also contaminated with metals (mercury in particular), SVOCs (primarily PAHs), and pesticides/PCBs. Nitrate was detected in water samples at every station sampled and was detected once in sediment at station L12-219. Cyanide was not detected in water or sediment at any station sampled. Only one pesticide, heptachlor epoxide, was detected in sewer water at 3 stations. No SVOCs or VOCs were detected in sewer water.
• Although the sanitary sewer system cannot be confirmed as a secondary source for contaminants to groundwater, the presence of nitrate in both sewer water and groundwater indicates some connection
RVAAP Load Line 12 Final Phase II RI Report
01-133(doc)/030204 xxxvii
via cracks or seepage points in the pipe system. Therefore, the sewer system may represent a preferential pathway for contaminant movement within the AOC.
LESSONS LEARNED
A key project quality objective for the Phase II RI at Load Line 12 is to document lessons learned so that future projects may benefit and constantly improve data quality and performance. Lessons learned are as follows.
• Several issues were encountered during large-scale application of the field analyses for TNT and RDX. A hand vacuum pump equipped with a filter membrane was originally used to filter sample extract, which was time consuming and the membranes contained nitrocellulose compounds that produced interferences in the analysis. The filtering devices were changed to syringes with disposable paper filter cartridges, which removed the interferences and greatly increased efficiency. Mixing vials were originally designated to be decontaminated and re-used. However, in large-volume jobs, such as Load Line 12, greater efficiency, elimination of a decontamination step, and labor cost savings were realized by disposing of the mixing vials. Interferences in color development were noted for some sediment samples containing a very high moisture content; this issue was not resolved during the Phase II RI. Air drying of samples with very high moisture content may be warranted to eliminate this concern. Color development was observed to be very slow in cold conditions. This issue should be taken into account when conducting the field analyses under cold weather conditions and the field laboratory should have heat whenever feasible.
• Analysis of field portable XRF data for metals shows that this method has the potential to be used to help guide placement of sampling locations during investigations or for remediation confirmation sampling. However, the EPA methods employed during the Load Line 12 Phase II RI have been refined. Re-evaluation of field XRF at RVAAP may be conducted to further evaluate its suitability for the intended applications, including more rigorous sample preparation techniques to minimize sample matrix variability, duplicate sample runs, replicate analyses to quantify and lessen variability, and cost-benefit analysis to determine its comparability to costs for fixed-based laboratory analyses.
• Incorporation of undesignated contingency samples into the project planning provides a useful tool and flexibility to sample additional locations based on field observations (e.g., Team Tracks area).
• The presence of Ohio EPA and U.S. Army Corps of Engineers staff on-site during field operations was beneficial in that potential changes to the project work plan due to field conditions could be quickly discussed, resolved, and implemented.
• The availability of on-site facilities for use as a central and secure field staging area and to house the field explosives laboratory was extremely beneficial for sample storage and management operations, equipment decontamination, and the field laboratory operations.
• Load Line 12 was the first RI project at RVAAP to use test pits for geologic characterization; this tool provided beneficial information on shallow subsurface conditions in the Load Line 12 vicinity.
• Due to the lack of potentiometric data for the Load Line 12 vicinity, Phase II RI planning included the use of piezometers in order to map the water table surface across the AOC in order to optimize the placement of monitoring wells. This process allowed for collection of better groundwater data and will help minimize the scope of any subsequent groundwater characterization.
RVAAP Load Line 12 Final Phase II RI Report
01-133(doc)/030204 xxxviii
• Integration of process knowledge information into the investigation data quality objective and planning process is critical to adequately identify and characterize key site-related contaminants. Because of a thorough review of Load Line 12 historical process information, nitrate was identified as a potential SRC during the Phase II RI planning stage. Phase II RI data confirmed the presence of nitrate in groundwater at levels well above federal and Ohio drinking water standards.
RECOMMENDATIONS
To provide decision makers with the information necessary to evaluate alternatives available to eliminate or reduce risks to receptors, it is recommended that an FS be performed for Load Line 12. The FS should evaluate a range of possible remedial actions, such as in situ treatment, excavation and ex-situ treatment, access restrictions and administrative controls, and the associated costs and risk reduction benefits. It is also recommended that the FS employ a streamlined approach with selected alternatives based on most likely land use assumptions. The intent of this strategy is to accelerate site-specific analysis of remedies by focusing the FS efforts to anticipated land use and appropriate remedies that have been tested and evaluated at other sites with similar operational histories as Load Line 12.
The future land uses and controls (if required) envisioned for Load Line 12 should be determined prior to preparation of the FS and selection of a remedy. Identification of the most likely future land use scenario(s) provides the basic information necessary to select the appropriate remedial response needed to achieve protection of human health and the environment, allows development of appropriate remedial action objectives, and allows finalization and application of RGOs for appropriate potential receptors. These factors directly determine the required extent and cost of remediation needed to achieve protectiveness. Identification of future land uses will also allow consideration of appropriate remedies and will be necessary for documentation in a Record of Decision and attendant Land Use Control Assurance Plan. Upon finalization of RGOs, any areas of Load Line 12 that exceed minimum RGOs (10-6 risk and/or HI = 0.1) will be addressed in the FS. The FS will determine the need and extent of any additional analysis for areas where RGOs are exceeded and for any areas where risk levels fall within the range considered protective under the NCP.
It is noted that areas within Load Line 12 with the same projected land use (and at other load lines at RVAAP) will incorporate the same RGOs into remedial alternative development. Also, the FS should integrate surface water systems and recognize the connection of surface water exit pathways among the four adjacent major melt-pour lines (Load Lines 1 through 4), as well as Load Line 12. The FS should apply results of the ecological field truthing effort at the Winklepeck Burning Grounds (pending agreement by Ohio EPA) to remedial goal development for Load Line 12 to the extent practicable.
Key data uncertainties have been identified in the RI to help guide any future sampling efforts. Details of additional nature and extent assessment needed to evaluate remedial alternatives are deferred to the FS planning stage. The following components may be necessary for a thorough evaluation of remedial alternatives in the FS:
1. Determination of the extent of vertical migration of explosives contamination in the vicinity of Building 904. Sampling data at this source area indicate levels of explosives compounds above risk-based criteria remain in subsurface soil at a depth of 0.9 m (3 ft). Such characterization may be performed either in advance of remediation or as part of remedial confirmation sampling.
2. Acquisition of additional groundwater characterization data within the AOC to identify the vertical and lateral extent of contamination, in particular nitrate near Buildings 900, FF-19, and 901, and metals and explosives contamination in the Team Track Area and Building 904 vicinity. Additional
RVAAP Load Line 12 Final Phase II RI Report
01-133(doc)/030204 xxxix
potentiometric data are needed to more accurately define groundwater flow patterns within the AOC and help identify potential groundwater exit points. Monitoring points for this purpose should include wells or piezometers located east and west of the AOC boundaries to better establish regional flow patterns. Such information would help validate fate and transport modeling results, help determine the likelihood of future contaminant migration to groundwater receptors and AOC exit points, and provide baseline data for future remedial effectiveness evaluations. Additionally, all Phase II RI monitoring wells were screened within the unconsolidated zone. The lack of bedrock groundwater data may constitute a data gap for FS planning. Additional bedrock wells may be added should FS planning require such data to adequately evaluate remedial alternatives.
3. Additional subsurface soil characterization for metals and SVOC contamination may be required in the vicinity of Buildings FF-19 (Neutral Liquor Building) and FE-17 (Power House). Phase II RI data were limited to depths of 1.5 m (5 ft) at Building FF-19 and 0.9 m (3 ft) at Building FE-17. Constituents modeled to reach the groundwater table at concentrations greater than PRGs through leaching include antimony, chromium, manganese, and beta-BHC. Due to site disturbances and placement of fill in certain areas during demolition activities, the vertical extent of contamination in soil beneath fill areas may not have been fully defined.
4. Characterization of sediment below a depth of 15 cm (6 in.) in the main ditch downstream of the primary source areas, particularly Building FF-19, may be needed to fully define the extent of sediment contamination within this medium. Sediment deposition over the long time period since AOC operations were conducted, combined with increased potential loading during demolition activities, may have resulted in accumulation of contaminated sediment at greater depths than were characterized during the Phase II RI. Should these media be addressed in an FS, a more accurate assessment of the volume of contaminated sediment will be required for evaluation of remedial alternatives. Because the main ditch, upstream of its confluence with the Active Area Channel, is dry much of the time, it may be addressed as soil media in the FS rather than part of the RVAAP facility-wide surface water investigation. If this management decision is made, human health and ecological risks for this exposure unit will require re-evaluation.
5. Surface water represents the primary contaminant exit pathway for the AOC based on current knowledge. The degree of contaminant loading from Load Line 12 to the extensive surface water system downstream (north), including Upper Cobb’s Pond, is an unknown element of the CSM at present. The potential degree of contaminant biouptake also has not been assessed in streams receiving Load Line 12 runoff. As such, potential impacts to downstream receptors in the Active Area Channel and North of Active Area Channel will be further addressed under the RVAAP facility-wide surface water investigation and associated remedial active objectives, because these conveyances contain water year round. Wetland areas and drainage conveyances on-site that are principally dry will be addressed as part of AOC-specific actions, as would any terrestrial contamination that exceeds remediation goals.

RVAAP Load Line 12 Final Phase II RI Report
01-133(doc)/030204 xl
THIS PAGE INTENTIONALLY LEFT BLANK.