PHASE 1A REMEDIAL INVESTIGATION OVERSIGHT · PDF fileSection 2 of Appendix A ... a...
172
PHASE 1A REMEDIAL INVESTIGATION OVERSIGHT QUALITY ASSURANCE PROJECT PLAN Revision 0 US MAGNESIUM NPL SITE EPA SITE IDENTIFICATION NO. UTN000802704 TOOELE COUNTY, UTAH October 2013 Prepared for: U.S. EPA Region 8 Denver, Colorado Prepared by:
Transcript of PHASE 1A REMEDIAL INVESTIGATION OVERSIGHT · PDF fileSection 2 of Appendix A ... a...

PHASE 1A REMEDIAL INVESTIGATION OVERSIGHT
QUALITY ASSURANCE PROJECT PLAN Revision 0
US MAGNESIUM NPL SITE
EPA SITE IDENTIFICATION NO. UTN000802704 TOOELE COUNTY, UTAH
October 2013
Prepared for:
U.S. EPA Region 8 Denver, Colorado
Prepared by:


Phase 1A RI Oversight QAPP Revision: 0 US Magnesium NPL Site October 2013
Page iii
PREFACE
The U.S. Environmental Protection Agency (EPA) placed the US Magnesium Site (Site) on the National Priorities List (NPL) for remedial response pursuant to the Comprehensive Environmental Response, Compensation, and Liability Act (CERCLA) in November 2009. The U.S. Court of Appeals for the Washington D.C. Circuit upheld the EPA’s action for the listing in August 2010.
Administrative Settlement Order on Consent for Remedial Investigation/Feasibility Study (RI/FS). In August 2011, the EPA and US Magnesium entered into an Administrative Order on Consent (AOC) for RI/FS, under which US Magnesium (supported by Environmental Resources Management [ERM]) is to carry out the work required for remedial investigations, data-management, risk assessment (RA), and feasibility study (FS) for consideration of remedial action. Section 2 of Appendix A, Statement of Work (SOW), of the AOC provides that the EPA will, as specified in CERCLA Section 104(a)(1), provide oversight of the Respondent’s activities throughout the RI/FS.
The EPA issued the Phase 1A Remedial Investigation Sampling and Analysis Plan to Identify Chemicals of Potential Concern in Soils, Sediment, Solid Waste, Water and Air, and Receptor Surveys; Revision 0 for PRI Areas 2 and 8 through 17 (Phase 1A RI SAP) (EPA 2013) on September 26, 2013 under which remedial investigations pursuant to CERCLA are beginning for this Site. US Magnesium/ERM is required to implement the work as specified in the Phase 1A RI SAP. The Phase 1A RI SAP is the foundation document for the EPA’s Oversight Quality Assurance Project Plan (QAPP). This Oversight QAPP is in accordance with the EPA’s responsibilities under the AOC SOW and the provisions of the Phase 1A RI SAP.
The EPA, as noted in the September 2013 transmittal letter (and the accompanying Attachment 5), has accommodated a request by US Magnesium/ERM to postpone implementation of Phase 1A sampling for the most contaminated areas of the Site until 2014, in order to consider alternative approaches to accomplishing RI objectives for these areas. The project schedule incorporated into the Phase 1A RI SAP provides a January-April 2014 timeline to complete development of any alternative to the Phase 1A RI SAP (subject to approval by the EPA) for the subject areas. If the EPA issues or approves modifications to the Phase1A RI SAP, appropriate modifications to this Oversight QAPP may become necessary.
The Phase 1A RI SAP also notes that the air investigations (PRI Area 18) will not commence pending the completion of air demonstration of methods applicability (DMA) studies. It is anticipated that the Air DMA studies will enable final specifications for sampling and analysis procedures for the Phase1A air investigations to be established. The EPA will incorporate such changes in a modification to the Phase 1A RI SAP (Revision 1). At that time, the EPA will amend this Oversight QAPP for the air sampling activities.
State and Federal Consultation. The EPA has a State Superfund Memorandum of Agreement with the Utah Department of Environmental Quality, Division of Environmental Response and Remediation (UDEQ-DERR) (per National Oil and Hazardous Substances Pollution Contingency Plan [NCP] Part 300.505). The State and the EPA agreed that EPA Region 8 would be the lead-agency for management and remedial response actions at the Site and the EPA maintains a close working partnership with UDEQ-DERR throughout the RI/FS planning process. The EPA also engages consultations with federal and state trustees for natural resources in accordance with NCP Parts 300.600 and .615.
Pursuant to the AOC SOW, the format of the EPA-issued Phase 1A RI SAP is generally consistent with specifications of the Intergovernmental Data Quality Task Force Uniform Federal Policy for Quality Assurance Project Plans, Evaluating, Assessing, and Documenting Environmental Data Collection and Use Programs, Part 1: UFP-QAPP Manual (UFP-QAPP) (EPA 2005). Accordingly, for efficiency and clarity, this Oversight QAPP has been prepared to parallel the RI/FS requirements of the Phase 1A RI SAP.

Phase 1A RI Oversight QAPP Revision: 0 US Magnesium NPL Site October 2013
Page iv
TABLE OF CONTENTS (QAPP WORKSHEETS)
TITLE AND APPROVAL PAGE (QAPP WORKSHEET #1) .................................................................... ii
SECTION A: PROJECT ORGANIZATION .............................................................................1
2.0 QAPP IDENTIFYING INFORMATION (QAPP WORKSHEET #2) ........................................... 2
2.1 INTRODUCTION ....................................................................................................................... 2 2.2 APPROVAL ENTITY, STAKEHOLDERS, AND DATA USERS ........................................... 2 2.3 OVERALL OBJECTIVES AND STRUCTURE OF THE REMEDIAL INVESTIGATION .... 2
3.0 DISTRIBUTION LIST (QAPP WORKSHEET #3) ........................................................................ 4
4.0 PERSONNEL SIGN-OFF SHEET (QAPP WORKSHEET #4) ...................................................... 5
5.0 PROJECT ORGANIZATIONAL CHART (QAPP WORKSHEET #5) ......................................... 6
6.0 COMMUNICATION PATHWAYS (QAPP WORKSHEET #6) ................................................... 7
7.0 PERSONNEL RESPONSIBILITIES AND QUALIFICATIONS TABLE (QAPP WORKSHEET #7)........................................................................................................................... 9
8.0 SPECIAL PERSONNEL TRAINING REQUIREMENTS (QAPP WORKSHEET #8) ............... 11
9.0 PROJECT PLANNING SESSION SUMMARY (QAPP WORKSHEET #9) .............................. 12
SECTION B: CONCEPTUAL SITE MODEL .........................................................................13
10.0 CONCEPTUAL SITE MODEL (QAPP WORKSHEET #10) ...................................................... 14
SECTION C: DATA QUALITY OBJECTIVES ......................................................................15
11.0 PROJECT QUALITY OBJECTIVES AND SAMPLING STRATEGY (QAPP WORKSHEET #11)....................................................................................................................... 16
SECTION D: SAMPLING AND ANALYSIS ...........................................................................20
12.0 MEASUREMENT PERFORMANCE CRITERIA (QAPP WORKSHEET #12) ......................... 21
13.0 SECONDARY DATA CRITERIA AND LIMITATIONS (QAPP WORKSHEET #13) ............. 25
14.0 SUMMARY OF PROJECT TASKS (QAPP WORKSHEET #14) ............................................... 26
14.1 PROJECT TASK OVERVIEW................................................................................................. 26 14.2 SAMPLE COLLECTION, PROCESSING, AND ANALYSES............................................... 27
14.2.1 Soil, Sediment, and Solid Waste Sampling ...................................................................... 27 14.2.2 Water Sampling ................................................................................................................ 28
14.3 SUMMARY OF SURVEYS, INVESTIGATION-DERIVED WASTE, AND EQUIPMENT DECONTAMINATION ........................................................................................................... 32
14.4 GEOPHYSICAL SURVEY OF THE LANDFILL ................................................................... 32

Phase 1A RI Oversight QAPP Revision: 0 US Magnesium NPL Site October 2013
Page v
14.5 DATA VALIDATION .............................................................................................................. 33 14.6 AUDITS .................................................................................................................................... 33
14.6.1 Field Performance and System Audits .............................................................................. 33 14.6.2 Laboratory Performance and System Audits .................................................................... 34
14.7 DOCUMENTS AND RECORDS ............................................................................................. 35 14.7.1 General Data Management Considerations....................................................................... 35 14.7.2 Field Documentation ......................................................................................................... 35 14.7.3 Full Data Package ............................................................................................................. 36 14.7.4 Lab Electronic Data Package Format ............................................................................... 36 14.7.5 Reports Generated ............................................................................................................. 36
15.0 REFERENCE LIMITS AND EVALUATION TABLES (QAPP WORKSHEET #15) ............... 37
16.0 PROJECT SCHEDULE / TIMELINE (QAPP WORKSHEET #16) ............................................ 38
17.0 SAMPLE COLLECTION (QAPP WORKSHEET #17) ............................................................... 40
17.1 SAMPLING PROCESS DESIGN ............................................................................................. 40 17.2 SAMPLE COLLECTION PROCEDURES .............................................................................. 40 17.3 SAMPLE PACKAGING AND SHIPPING .............................................................................. 41 17.4 DECONTAMINATION ............................................................................................................ 41 17.5 INVESTIGATION-DERIVED WASTE MANAGEMENT ..................................................... 41
18.0 SAMPLING LOCATIONS AND METHODS / SOP REQUIREMENTS (QAPP WORKSHEET #18)....................................................................................................................... 42
19.0 ANALYTICAL SOP REQUIREMENTS (QAPP WORKSHEET #19) ....................................... 43
20.0 FIELD QUALITY CONTROL SAMPLE SUMMARY (QAPP WORKSHEET #20) ................. 48
21.0 PROJECT SAMPLING SOP REFERENCES (QAPP WORKSHEET #21) ................................ 51
SECTION E: QUALITY ASSURANCE ...................................................................................52
22.0 FIELD EQUIPMENT CALIBRATION, MAINTENANCE, TESTING, AND INSPECTION (QAPP WORKSHEET #22) .......................................................................................................... 53
23.0 ANALYTICAL SOP REFERENCES (QAPP WORKSHEET #23) ............................................. 54
24.0 ANALYTICAL INSTRUMENT CALIBRATION (QAPP WORKSHEET #24) ......................... 63
25.0 ANALYTICAL INSTRUMENT AND EQUIPMENT MAINTENANCE, TESTING, AND INSPECTION (QAPP WORKSHEET #25) .................................................................................. 64
26.0 SAMPLE HANDLING SYSTEM (QAPP WORKSHEET #26)................................................... 65
27.0 SAMPLE CUSTODY REQUIREMENTS (QAPP WORKSHEET #27) ...................................... 66
27.1 SAMPLE IDENTIFICATION .................................................................................................. 66

Phase 1A RI Oversight QAPP Revision: 0 US Magnesium NPL Site October 2013
Page vi
27.1.2 Sample Labels ................................................................................................................... 66 27.1.3 Sample Documentation ..................................................................................................... 67 27.1.4 Chain of Custody .............................................................................................................. 67 27.1.5 Sample Packaging and Shipping ....................................................................................... 69
28.0 LABORATORY QC SAMPLES (QAPP WORKSHEET #28) .................................................... 71
29.0 PROJECT RECORDS AND DOCUMENTATION (QAPP WORKSHEET #29) ....................... 82
30.0 ANALYTICAL SERVICES (QAPP WORKSHEET #30) ........................................................... 85
31.0 PLANNED PROJECT ASSESSMENTS (QAPP WORKSHEET #31) ........................................ 87
32.0 ASSESSMENT FINDINGS AND CORRECTIVE ACTION RESPONSES (QAPP WORKSHEET #32)....................................................................................................................... 88
33.0 QA MANAGEMENT REPORTS (QAPP WORKSHEET #33) ................................................... 89
34.0 VERIFICATION PROCESS (QAPP WORKSHEET #34) ........................................................... 90
34.1 FIELD RECORDS/DOCUMENTATION VERIFICATION ................................................... 90 34.2 LABORATORY DATA VERIFICATION ............................................................................... 90 34.3 VERIFICATION PROCESS ..................................................................................................... 90
35.0 VALIDATION PROCESS (QAPP WORKSHEET #35) .............................................................. 92
36.0 ANALYTICAL DATA VALIDATION (QAPP WORKSHEET #36) ......................................... 94
36.1 ANALYTICAL DATA VALIDATION ............................................................................... 94 36.1.1 Cursory Data Validation ................................................................................................... 94 36.1.2 Full Data Validation .......................................................................................................... 94 36.1.3 Data Validation Criteria .................................................................................................... 95
37.0 USABILITY ASSESSMENT (QAPP WORKSHEET #37).......................................................... 96
37.1 MEASUREMENT QUALITY OBJECTIVES.......................................................................... 96 37.1.1 Precision............................................................................................................................ 96 37.1.2 Accuracy ........................................................................................................................... 96 37.1.3 Representativeness ............................................................................................................ 97 37.1.4 Completeness .................................................................................................................... 97 37.1.5 Comparability ................................................................................................................... 98 37.1.6 Detection And Quantitation Limits ................................................................................... 98
37.2 RECONCILIATION WITH USER REQUIREMENTS ........................................................... 98
REFERENCES ......................................................................................................................................... 100

Phase 1A RI Oversight QAPP Revision: 0 US Magnesium NPL Site October 2013
Page vii
LIST OF TABLES
WORKSHEET 3: DISTRIBUTION LIST
Table 3-1: QAPP Distribution List
WORKSHEET 4: PERSONNEL SIGN-OFF SHEET
Table 4-1: QAPP Sign-Off Sheet
WORKSHEET 6: COMMUNICATION PATHWAYS
Table 6-1: Communication Pathways
WORKSHEET 7: PERSONNEL RESPONSIBILITIES AND QUALIFICATIONS
Table 7-1: Responsibilities and Qualifications
WORKSHEET 11: PROJECT QUALITY OBJECTIVES AND SAMPLING STRATEGY
Table 11-1: Criteria for Evaluating Reproducibility Between ERM/US Magnesium Analytical Data and EPA Split Sample Analytical Data
WORKSHEET 12: MEASUREMENT PERFORMANCE CRITERIA
Table 12-1: Measurement Performance Criteria for Soil, Sediment, Solid Waste, and Water – Field and Lab QC Samples
WORKSHEET 14: SUMMARY OF PROJECT TASKS
Table 14-1: Subsurface Boring Depths
Table 14-2: Target Number of Split Samples per PRI
WORKSHEET 16: PROJECT SCHEDULE / TIMELINE
Table 16-1: Oversight Schedule for Phase 1A RI for PRI Areas 2 and 8 through 17
WORKSHEET 19: ANALYTICAL SOP REQUIREMENTS
Table 19-1: Analytical SOP Requirements for Solid and Aqueous Media
WORKSHEET 20: FIELD QUALITY CONTROL SAMPLE SUMMARY
Table 20-1: Field QC Requirements for Solid and Aqueous Media
WORKSHEET 21: PROJECT SAMPLING SOP REFERENCES
Table 21-1: Project Sampling SOP References
WORKSHEET 22: FIELD EQUIPMENT CALIBRATION, MAINTENANCE, TESTING, AND INSPECTION
Table 22-1: Oversight Field Equipment

Phase 1A RI Oversight QAPP Revision: 0 US Magnesium NPL Site October 2013
Page viii
WORKSHEET 23: ANALYTICAL SOP REFERENCES
Table 23-1: Analytical SOP References for Solid and Aqueous Media
WORKSHEET 26: SAMPLE HANDLING SYSTEM
Table 26-1: Sample Handling System for Solid and Aqueous Samples
WORKSHEET 28: LABORATORY QC SAMPLES
Table 28-1: Laboratory QC Samples
WORKSHEET 29: PROJECT DOCUMENTS AND RECORDS
Table 29-1: Storage of Project-Related Documents
Table 29-2: Requirements for Laboratory Data Packages
WORKSHEET 30: ANALYTICAL SERVICES
Table 30-1: Analytical Services
WORKSHEET 31: PLANNED PROJECT ASSESSMENTS
Table 31-1: Roles and Responsibilities for Project Assessments
WORKSHEET 32: ASSESSMENT FINDINGS AND CORRECTIVE ACTION RESPONSES
Table 32-1: Implementation Assessment and Follow-up Requirements
WORKSHEET 33: QA MANAGEMENT REPORTS
Table 33-1: Reporting Requirements
WORKSHEET 34: VERIFICATION PROCESS
Table 34-1: Verification Process
WORKSHEET 35: VALIDATION PROCESS
Table 35-1: Validation Process

Phase 1A RI Oversight QAPP Revision: 0 US Magnesium NPL Site October 2013
Page ix
LIST OF ATTACHMENTS
Attachments are labeled according to the Worksheet in which their content is most extensively discussed.
Attachment 9A: Access Agreement between BLM and EPA
Attachment 14A: Split Sampling Field Data Sheet
Attachment 14B: Oversight Data Management Plan
Attachment 14C: Field and QAPP Modification Forms
Attachment 15A: Reference Limits and Evaluation Tables
Attachment 17A: Field Standard Operating Procedures
Attachment 17B: Completed, Approved Modification Forms and QAPP Amendments
Attachment 19A: Laboratory Standard Operating Procedures

Phase 1A RI Oversight QAPP Revision: 0 US Magnesium NPL Site October 2013
Page x
ACRONYMS AND ABBREVIATIONS
Alk Alkalinity AOC Administrative Order on Consent ASTM ASTM International bgs Below ground surface BLM Bureau of Land Management CCC Calibration check compound CCV Continuing calibration verification CERCLA Comprehensive Environmental Response, Compensation, and Liability Act CFR Code of Federal Regulations Cl2 Chlorine gas CLP Contract Laboratory Program CO2 Carbon dioxide COPC Contaminant of potential concern CRQL Contract required quantitation limit CVAA Cold vapor atomic absorption DERR Division of Environmental Response and Remediation DMA Demonstration of methods applicability DO Dissolved oxygen DQA Data quality assessment DQI Data quality indicator DQO Data quality objective EPA U.S. Environmental Protection Agency ERM Environmental Resource Management ESAT Environmental Services Assistance Team ESI Electrospray Ionization FS Feasibility study GC Gas chromatography GC/EC Gas chromatography/electron capture GC/ECD Gas chromatography/electron capture device GC/MS Gas chromatography/mass spectrometry GC/MS/MS Gas chromatography/tandem mass spectrometry GIS Geographic information system HAA Halogenated acid HASP Health and Safety Plan HCB Hexachlorobenzene HCl Hydrochloric acid or hydrogen chloride (gas) HDPE High-density polyethylene

Phase 1A RI Oversight QAPP Revision: 0 US Magnesium NPL Site October 2013
Page xi
HPLC High Pressure Liquid Chromatography HRGC/HRMS High resolution gas chromatograph/high resolution mass spectrometer H2SO4 Sulfuric acid ICP Inductively coupled plasma IDW Investigation-derived waste LCS Laboratory control sample LCSD Laboratory control sample duplicate LIMS Laboratory Information Management System LOQ Limit of quantitation MB Method blank MDL Method detection limit mg/L Milligrams per liter MQO Measurement quality objective MRL Method reporting limit MS Mass spectrometry MSD Matrix spike duplicate MXS Matrix spike NA Not applicable NaAsO2 Sodium arsenite NCP National Oil and Hazardous Substances Pollution Contingency Plan NDMA N-nitrosodimethylamine NELAP National Environmental Laboratory Accreditation Conference NH4Cl Ammonium chloride NPL National Priority List OCDD Octachlorinated dibenzo-p-dioxin ORP Oxidation-reduction potential PAH Polynuclear aromatic hydrocarbon PARCC Precision, accuracy, representativeness, completeness, and comparability PCB Polychlorinated biphenyl PCDDs/PCDFs Polychlorinated dibenzo-p-dioxins/polychlorinated dibenzofurans PCE Tetrachloroethene or perchloroethylene PCDD Polychlorinated dibenzo-p-dioxin PCDF Polychlorinated dibenzofuran PID Photoionization detector PM10 Particulate matter less than 10 microns in average diameter PM2.5 Particulate matter less than 2.5 microns in average diameter PQL Practical quantitation limit PQO Project quality objective PRI Preliminary remedial investigation

Phase 1A RI Oversight QAPP Revision: 0 US Magnesium NPL Site October 2013
Page xii
PRRL Project-required reporting limit PWT3 Pacific Western Technologies/Tetra Tech, Inc. QA Quality assurance QAM Quality Assurance Manager QAPP Quality Assurance Project Plan QC Quality control QL Quantitation limit RA Risk assessment RI Remedial Investigation RL Reporting limit RPD Relative percent difference RPM Remedial Project Manager SAP Sampling and Analysis Plan SEDD Superfund staged electronic data deliverable Site US Magnesium Site SIM Selective ion monitoring SOP Standard operating procedure SOW Statement of work Study Area A 5-mile radius around the plant stack SVOC Semivolatile organic compound TBD To be determined TCA Trichloroethane TDS Total dissolved solids TOC Total organic carbon TQL Target quantitation limit TSS Total suspended solids UDEQ Utah Department of Environmental Quality UFP Uniform Federal Policy US Mag US Magnesium VOA Volatile organic analysis VOC Volatile organic compound WS Worksheet

Phase 1A RI Oversight QAPP Section A: Project Organization Revision: 0 US Magnesium NPL Site October 2013
Page 1 of 100
SECTION A: PROJECT ORGANIZATION
QAPP WORKSHEETS #2-9

Phase 1A RI Oversight QAPP Section A: Project Organization Worksheet #2 Revision: 0 US Magnesium NPL Site October 2013
Page 2 of 100
2.0 QAPP IDENTIFYING INFORMATION (QAPP WORKSHEET #2)
Site Name/Number: US Magnesium NPL Site, Tooele County, Utah EPA Site Identification No. UTN000802704
2.1 INTRODUCTION
This Phase 1A Remedial Investigation Oversight Quality Assurance Project Plan (QAPP) was prepared in accordance with the National Oil and Hazardous Substances Pollution Contingency Plan, 40 CFR 300.415(b)(4)(ii), the requirements of the Intergovernmental Data Quality Task Force Uniform Federal Policy for Quality Assurance Project Plans, Evaluating, Assessing, and Documenting Environmental Data Collection and Use Programs, Part 1: UFP-QAPP Manual (UFP-QAPP) (EPA 2005), and the EPA Requirements for Quality Assurance Project Plans, EPA QA/R-5 (EPA 2001). The format of this document is generally consistent with specifications of the UFP-QAPP manual. This Oversight QAPP is project-specific and pertains only to the U.S. Environmental Protection Agency, Region 8 (EPA) split sampling and oversight activities to be conducted during Phase 1A of the Remedial Investigation (RI) at the US Magnesium NPL Site in Tooele County, Utah (Site).
2.2 APPROVAL ENTITY, STAKEHOLDERS, AND DATA USERS
The EPA is the lead agency for the Site and the Utah Department of Environmental Quality, Division of Environmental Response and Remediation (UDEQ-DERR) is the support agency. US Magnesium and the EPA entered into an Administrative Settlement Agreement and Administrative Order on Consent (AOC) for a RI/Feasibility Study (FS) on August 4, 2011. The AOC and accompanying Statement of Work (SOW) defines the roles, responsibilities, schedule, and administration of the RI/FS to occur at the Site. The Responsible Party is US Magnesium and US Magnesium’s contractor, Environmental Resource Management (ERM) is responsible for implementing the Phase 1A RI in accordance with the Phase 1A Remedial Investigation Sampling and Analysis Plan to Identify Chemicals of Potential Concern in Soils, Sediment, Solid Waste, Water and Air, and Receptor Surveys; Revision 0 for PRI Areas 2 and 8 through 17 (Phase 1A RI SAP) (EPA 2013). The EPA will oversee all activities associated with the RI. The EPA oversight activities are being conducted pursuant to Article VIII, Section 31 of the AOC.
2.3 OVERALL OBJECTIVES AND STRUCTURE OF THE REMEDIAL INVESTIGATION
The RI/FS and Risk Assessment (RA) Study Area is defined as the 5-mile radius around the plant stack. The EPA anticipates the need to implement the RI, RA, and FS of the Study Area in phases at respectively appropriate paces. The EPA’s RA work is ongoing, and will proceed concurrent with each phase of the RI/FS. As outlined in WS#2 of the Phase 1A RI SAP, the broadly stated objectives for the RI/FS phases are anticipated to include, but not be limited to the following:
• Phase 1A: Contaminants of Potential Concern (COPC) and Receptor-Exposure Investigation
• Phase 1B: Preliminary Nature and Extent Investigation
• Phase 2: Detailed RI, FS Screening, and RA
• Phase 3: Feasibility Studies
• Phase 4: Remedial Response Decision

Phase 1A RI Oversight QAPP Section A: Project Organization Worksheet #2 Revision: 0 US Magnesium NPL Site October 2013
Page 3 of 100
The EPA has issued a Phase 1A RI SAP that presents the objectives, approach, evaluation criteria, and scope of work to be conducted by US Magnesium/ERM for Phase 1A of the RI for the Site. Phase 1A activities will include acquisition of data allowing development of an expanded list of chemicals in order to select COPCs; these acquired data also will be necessary to prepare a plan for more complete investigations of the Site.
In an effort to move forward with sampling and data collection activities in 2013 for preliminary remedial investigation (PRI) Areas 2 and 8 through 17 at this Site and to reduce the need for multiple sampling plan documents, the EPA issued the Phase 1A RI SAP as Revision 0, with certain components for the air sampling plans of PRI Area 18 awaiting completion of the air demonstration of methods applicability (DMA) investigations that will be underway through 2013. The EPA intends to issue an approved revision to the Phase 1A RI SAP after completion of the Air DMA which will provide the basis for finalizing standard operating procedures and worksheets pertinent to the PRI Area 18 investigations. Revisions to this Oversight QAPP with regard to the Phase 1A air investigations are anticipated in order to carry out appropriate oversight.
The implementation of Phase 1A sampling for the most contaminated areas of the Site (PRI Areas 1 and 3 through 7) has been postponed until 2014, in order to consider alternative approaches to accomplishing RI/FS objectives for these areas.
If Phase 1B (nature and extent) investigations are planned and commence for any of the PRI areas, this Oversight QAPP will be amended accordingly.
Conduct of the EPA’s oversight is being carried out through this Oversight QAPP by Pacific Western Technologies, Ltd. (PWT), under EPA Contract No. EP-W-06-006, Work Assignment No. 130-RDSB-08PU. Accordingly, PWT, as the EPA’s contractor, will provide oversight of the ERM/US Magnesium field programs as well as collect split samples of soils, sediment, solid waste, and water for independent laboratory analysis. PWT will work with their team contractor, Tetra Tech, Inc (TT). The PWT/TT Team will herein be referred to as PWT3.
Laboratories obtained under the EPA Analytical Program and at least one commercial laboratory will analyze the split samples. Sample analysis will be by the same or generally equivalent analytical method undertaken by ERM/US Magnesium as specified in the Phase 1A RI SAP. This Oversight QAPP is intended to guide the EPA’s split sampling and oversight of ERM/US Magnesium’s sampling and analysis activities during Phase 1A of the RI. This Oversight QAPP will be amended as necessary concurrent with subsequent revisions to the Phase 1A RI SAP or subsequent RI phases as appropriate. This Oversight QAPP will frequently reference the Phase 1A RI SAP in order to avoid duplication and inconsistency.
Phase IA RI Oversight QAPP Section A: Project Organization Worksheet #3 Revision: 0 US Magnesium NPL Site October 2013
Page 4 of 100
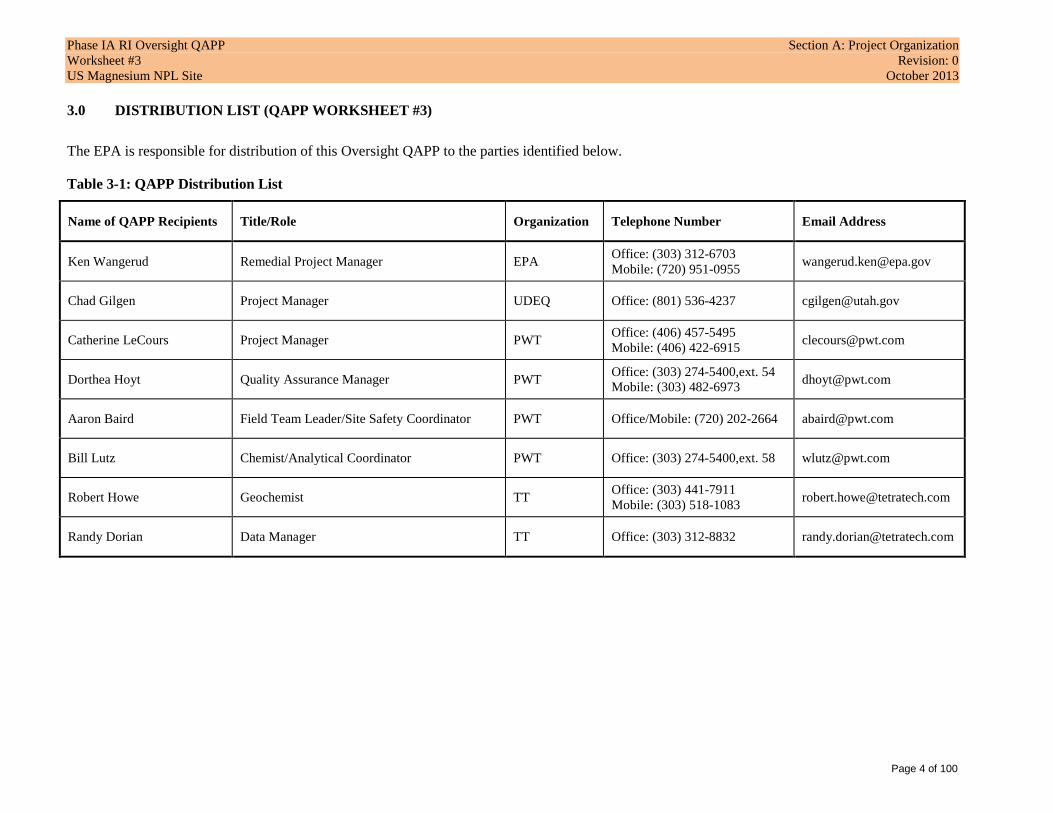
3.0 DISTRIBUTION LIST (QAPP WORKSHEET #3)
The EPA is responsible for distribution of this Oversight QAPP to the parties identified below.
Table 3-1: QAPP Distribution List
Name of QAPP Recipients Title/Role Organization Telephone Number Email Address
Ken Wangerud Remedial Project Manager EPA Office: (303) 312-6703 Mobile: (720) 951-0955 [email protected]
Chad Gilgen Project Manager UDEQ Office: (801) 536-4237 [email protected]
Catherine LeCours Project Manager PWT Office: (406) 457-5495 Mobile: (406) 422-6915 [email protected]
Dorthea Hoyt Quality Assurance Manager PWT Office: (303) 274-5400,ext. 54 Mobile: (303) 482-6973 [email protected]
Aaron Baird Field Team Leader/Site Safety Coordinator PWT Office/Mobile: (720) 202-2664 [email protected]
Bill Lutz Chemist/Analytical Coordinator PWT Office: (303) 274-5400,ext. 58 [email protected]
Robert Howe Geochemist TT Office: (303) 441-7911 Mobile: (303) 518-1083 [email protected]
Randy Dorian Data Manager TT Office: (303) 312-8832 [email protected]

Phase IA RI Oversight QAPP Section A: Project Organization Worksheet #4 Revision: 0 US Magnesium NPL Site October 2013
Page 5 of 100
4.0 PERSONNEL SIGN-OFF SHEET (QAPP WORKSHEET #4)
The Project Personnel Sign-Off Sheet (Table 4-1) documents that project personnel performing work have read this Oversight QAPP and will carry out the tasks as described. The PWT3 Project Manager, PWT3 Field Team Leader/Site Safety Coordinator, and other oversight personnel are responsible for communicating the requirements of the applicable portions of this Oversight QAPP to field personnel. To ensure that Site field personnel have read and understood this Oversight QAPP, the supervisory personnel will meet with each and review this Oversight QAPP before any work is conducted on the Site. The sign-off sheet, which will be included in the central project file, will be signed by all on-site personnel after they have read this Oversight QAPP. However, if only a portion of this Oversight QAPP was reviewed, then personnel will note which sections were reviewed on the sign-off sheet.
Table 4-1: QAPP Sign-Off Sheet
Name Organization and Title/Role Signature/Email Receipt QAPP Section(s) Reviewed Date QAPP Read
Catherine LeCours PWT3 Project Manager
Dorthea Hoyt PWT3 Quality Assurance Manager
Aaron Baird PWT3 Field Team Leader/Site Safety Coordinator
Bill Lutz PWT3 Chemist/Analytical Coordinator
Robert Howe PWT3 Geochemist
Randy Dorian PWT3 Data Manager

Phase IA RI Oversight QAPP Section A: Project Organization Worksheet #5 Revision: 0 US Magnesium NPL Site October 2013
Page 6 of 100
5.0 PROJECT ORGANIZATIONAL CHART (QAPP WORKSHEET #5)
The Project Organizational Chart identifies reporting relationships for the lead organizations and all contractor and subcontractor organizations, including the organizations providing field sampling, Site-related analysis, and data review services.
Approval Authority: EPA, Region VIII
PWT3 Subcontractors: Analytical Laboratories Name Title Project Role TBD * EPA Analytical Program laboratories will be providing analytical services, however are directed by and contracted directly through the EPA Analytical Program Manager (or HQ-OSRTI designee) identified above.
PWT3 Field Team Name Title Project Role Aaron Baird Env Scientist PWT3 Field Team Leader Aaron Baird Env Scientist PWT3 Site Safety Coordinator Robert Howe Senior Geochemist PWT3 Geochemist
Lead Organization: EPA, Region VIII Lead Organization Project Manager: Ken Wangerud
Investigative Organization: PWT3 Investigative Organization Project Manager: Catherine LeCours Quality Assurance Manager:
Dorthea Hoyt
Field Team Leader/Site Safety Coordinator: Aaron Baird
Supporting Organization: Utah Department of Environmental Quality Supporting Organization Project Manager: Chad Gilgen
EPA Analytical Program Manager: Don Goodrich (or HQ-OSRTI designee) * EPA Data Manager: Jeff Mosal EPA Health and Safety Coordinators: Charlie Partridge/Shun-Ping Chau
Chemist/Analytical Coordinator: Bill Lutz
Geochemist: Robert Howe
Data Manager: Randy Dorian

Phase 1A RI Oversight QAPP Section A: Project Organization Worksheet #6 Revision: 0 US Magnesium NPL Site October 2013
Page 7 of 100
6.0 COMMUNICATION PATHWAYS (QAPP WORKSHEET #6)
This Worksheet (WS) identifies lines of communication that will be used during the Phase 1A investigation oversight (Table 6-1).
Table 6-1: Communication Pathways
Communication Drivers Responsible Affiliation Name Phone Number(s) and Email Procedure
Project Management PWT3 Project Manager Catherine LeCours
Office: (406) 457-5495 Mobile: (406) 422-6915 Email: [email protected]
• manage field and project personnel • serve as liaison to the EPA, team members, and all
subcontractors
Quality Assurance Management
PWT3 Quality Assurance Manager Dorthea Hoyt
Office: (303) 274-5400, ext 54 Mobile: (303) 482-6973 Email: [email protected]
• remain independent of direct project involvement and day-to-day operations
• ensure implementation of the quality assurance elements outlined in this Oversight QAPP
• review plans and procedures • perform/oversee on-site field quality control audits,
as appropriate • be the point of contact with the PWT3 Project
Manager for quality matters
Coordination and communication of fieldwork activities related to sampling PWT3 Field Team
Leader / Site Safety Coordinator PWT3 Geochemist
Aaron Baird and/or Robert Howe
Office/Mobile: (720) 202-2664 Email: [email protected]
• communicate relevant field information to the PWT3 Project Manager and PWT3 Chemist/ Analytical Coordinator
• report all drilling or sampling equipment problems to the PWT3 Project Manager immediately via phone or email
Field data and quality control reports
• generate and report data and documents as required by the Oversight Data Management Plan
• generate quality control reports to the EPA RPM as directed by the PWT3 Project Manager
Coordination of laboratory supplies for field activities
Office: (303) 441-7911 Mobile: (303) 518-1083 Email: [email protected]
• contact the laboratory to provide all necessary sample containers and appropriate shipping materials (such as coolers and bubble wrap) to be delivered on Site before field sampling begins and throughout the project
Submittal of samples to the laboratory
• package and ship samples in accordance with this Oversight QAPP

Phase 1A RI Oversight QAPP Section A: Project Organization Worksheet #6 Revision: 0 US Magnesium NPL Site October 2013
Page 8 of 100
Communication Drivers Responsible Affiliation Name Phone Number(s) and Email Procedure
Daily chain-of-custody records and shipping documentation
• submit chain-of-custody records and shipping documentation via fax or email to the PWT3 Chemist/Analytical Coordinator at the end of each day that samples are collected
Sample shipping/receipt issues
Laboratory Project Manager See WS#30 See WS#30
• report all sample shipping and receipt issues associated with the investigation to PWT3 Chemist/ Analytical Coordinator within 2 business days
Reporting laboratory data and quality issues
Laboratory Project Manager See WS#30 See WS#30
• report documents and data in an electronic format as required by the Oversight Data Management Plan
• report quality assurance and quality control issues
Field and analytical corrective actions
PWT3 Geochemist PWT3 Chemist/ Analytical Coordinator
Robert Howe and/or Bill Lutz
Office: (303) 441-7911 Mobile: (303) 518-1083 Email: [email protected] Office: (303) 274-5400,ext. 58 Email: [email protected]
• immediately notify the PWT3 QAM in writing of any field or analytical procedures that were not performed in accordance with this Oversight QAPP
• complete documentation of the non-conformance and corrective actions to be taken
• verify that the corrective actions have been implemented.
Minor deviations from Oversight QAPP procedures identified during field activities
PWT3 Field Team Leader Aaron Baird
Office/Mobile: (720) 202-2664 Email: [email protected]
• prepare a Field Modification Approval Form (Attachment 14C) for field change requests for any changes in sampling procedures that occur as a result of conditions in the field to be submitted to the PWT3 QAM for approval before the change is initiated. All completed and approved documentation will be placed in Attachment 17B.
Oversight QAPP amendments
PWT3 Project Manager and EPA RPM
Catherine LeCours Ken Wangerud
Office: (406) 457-5495 Mobile: (406) 422-6915 Email: [email protected] Office: (303) 312-6703 Mobile: (720) 951-0955 Email: [email protected]
• the PWT3 QAM will prepare a Record of QAPP Modification form to be approved by the PWT3 Project Manager and the EPA RPM before the change is initiated. All completed and approved documentation will be placed in Attachment 17B.

Phase 1A RI Oversight QAPP Section A: Project Organization Worksheet #7 Revision: 0 US Magnesium NPL Site October 2013
Page 9 of 100
7.0 PERSONNEL RESPONSIBILITIES AND QUALIFICATIONS TABLE (QAPP WORKSHEET #7)
Personnel responsibilities and qualifications are defined in Table 7-1. This table provides a list of personnel (and accompanying qualifications) with appropriate experience to perform the necessary activities outlined in this Oversight QAPP. Contact information is provided in Table 3-1.
Table 7-1: Responsibilities and Qualifications
Name Title/Role Organization Responsibilities
Catherine LeCours
Project Manager PWT3
• responsible for providing management and technical oversight during data collection efforts • actively participates in project data quality objective process • provides oversight of the quality assurance program, including review and sign-off on QAPPs and any future
modifications to the plans • responsible for maintaining the most current revision to this Oversight QAPP and support the EPA in its
distribution pursuant to WS#3 • provides quality-related direction to the PWT3 QAM • has authority to suspend PWT3-related project or Site activities if approved quality requirements are not
adequately met • reports to the EPA RPM situations that warrant the EPA’s consideration of suspending or modifying Phase 1A
RI SAP and/or Oversight QAPP activities • maintains communication with the EPA RPM regarding issue resolution and project status
Dorthea Hoyt
Quality Assurance Manager
PWT3
• responsible for overall quality assurance and quality control of technical work at the Site • remains independent of field team generating the data • develops and maintains a comprehensive quality assurance program • responsible for audits, reviews of work performed, and recommendations to project personnel regarding quality • provides quality assurance and quality control of technical work carried out at the Site • works closely with and reviews work carried out by the project team • reviews deliverables to verify conformance with quality assurance and quality control procedures
Aaron Baird
Site Safety Coordinator PWT3
• responsible for implementing the health and safety plan and accident prevention plan • responsible for ensuring personnel have current training and documentation • has authority to correct and change Site control measures and the required level of health and safety protection • primary on-site enforcement authority for the policies and provisions of the health and safety program and health
and safety plan • conducts safety briefings for Site and subcontractor personnel and Site visitors • has authority to suspend operations that threaten health and safety of PWT3 workers

Phase 1A RI Oversight QAPP Section A: Project Organization Worksheet #7 Revision: 0 US Magnesium NPL Site October 2013
Page 10 of 100
Name Title/Role Organization Responsibilities
Aaron Baird
Field Team Leader PWT3
• directs the day-to-day field activities and oversees all subcontractors • verifies that field measurement and sampling procedures are conducted in accordance with this Oversight QAPP
and the Phase 1A RI SAP • orders, inspects, and tracks field consumable supplies • responsible for sample handling and custody information • coordinates analytical tests with the information required from the field activity • sets up contracts with laboratories to conduct required analyses • coordinates pickup and delivery schedules with laboratories
Robert Howe Geochemist PWT3
• supports the PWT3 Field Team Leader in field oversight activities and provides direct oversight activities as appropriate
• documenting compliance of field and laboratory activities with project requirements • supports review of and performs data verification/validation of split sampling results • document compliance with and revisions to the laboratory requirements of this Oversight QAPP and the Phase
1A RI SAP
Bill Lutz Chemist / Analytical Coordinator
PWT3
• coordinates analytical tests with the information required from the field activity • coordinates with laboratories to conduct required analyses • verifies that the laboratories implement the requirements of this Oversight QAPP • ensures that laboratory data are validated in accordance with this Oversight QAPP (and attached Oversight Data
Management Plan) and the Phase 1A RI SAP (and attached Data Management Plan) • responsible for immediately notifying the PWT3 QAM, PWT3 Field Team Leader, and PWT3 Geochemist in
writing of any field quality control or laboratory analytical procedures, beyond any deviations identified by the PWT3 Field Team Leader, that were not performed in accordance with this Oversight QAPP
• completes documentation of any non-conformance and corrective actions to be taken, in coordination with the PWT3 QAM
• verifies that required corrective actions have been implemented
Randy Dorian
Data Manager PWT3
• responsible for developing, monitoring, and maintaining project database under guidance of PWT3 Project Manager
• supports preparation of QAPPs, specifically Data Management Plan revisions as needed

Phase 1A RI Oversight QAPP Section A: Project Organization Worksheet #8 Revision: 0 US Magnesium NPL Site October 2013
Page 11 of 100
8.0 SPECIAL PERSONNEL TRAINING REQUIREMENTS (QAPP WORKSHEET #8)
The Special Personnel Training Requirements identifies the training that personnel who implement Site-related work must meet. All staff associated with this project will have sufficient training to safely, effectively, and efficiently perform their assigned tasks. Health and safety-related training is identified in PWT’s Site-Specific Health and Safety Plan (HASP) (PWT 2013). Training will be provided to the PWT3 team project personnel for compliance with the HASP and technical competence in performing the work. Minimum training for all on-site personnel will include the Occupational Safety and Health Administration training requirements defined in Title 29 Code of Federal Regulations Part 1910.120(e). These requirements include:
1. 40 hours of formal off-site instruction; 2. a minimum of three days of actual on-site field experience under the supervision of a
trained and experienced field supervisor; and 3. eight hours of annual refresher training.
Field personnel who directly supervise employees engaged in hazardous waste operations also shall have at least eight additional hours of specialized supervisor training. All on-site personnel will maintain current certification in the American Red Cross “First Aid” and “Cardiopulmonary Resuscitation Modular,” or equivalent. A copy of the HASP and copies of training certificates for on-site personnel will be kept at the Site in the possession of the PWT3 Field Team Leader/Site Safety Coordinator during the performance of field activities. The PWT3 Field Team Leader/Site Safety Coordinator is responsible for ensuring all PWT3 team members working on the project have the appropriate and current training and the documentation is present.
In addition, field team members must attend the US Magnesium Contractor training prior to the start of field work and on an annual basis thereafter. Attendance will be recorded by the PWT3 Field Team Leader in the field logbook.
Field sampling personnel must be familiar with the sampling and sample processing procedures outlined in the attached PWT standard operating procedures (SOP) (Attachment A) and in the EPA Contract Laboratory Program Guidance for Field Samplers (EPA 540-R-09-03) (EPA 2011a). Field sampling and data management personnel must also be trained in the use of the EPA’s Scribe software.

Phase 1A RI Oversight QAPP Section A: Project Organization Worksheet #9 Revision: 0 US Magnesium NPL Site October 2013
Page 12 of 100
9.0 PROJECT PLANNING SESSION SUMMARY (QAPP WORKSHEET #9)
Development of this Oversight QAPP occurred through consultations between the EPA RPM and PWT3.
Subsequent discussions were held between PWT3 and ERM regarding field coordination, mobilization, scheduling, and implementation of both the Phase 1A RI SAP and this Oversight QAPP.
The EPA considered potential locations for a base-of-operations to accommodate the EPA and PWT3 staff for this oversight project. The EPA deemed it appropriate, and reviewed location options that were sufficiently distant from the operating plant to assure no potential risk from Site-releases (principally airborne) and to minimize ‘infrastructure’ requirements and costs. Accordingly, the Bureau of Land Management (BLM) West Desert District (owner of a significant portion of lands within the RI study area) and the EPA have entered into a Consent for Access agreement that enables the EPA and PWT3 to utilize the Muskrat Fire Station as a base-of-operations. This agreement is included for reference as Attachment 9A.

Phase 1A RI Oversight QAPP Section B: Conceptual Site Model Revision: 0 US Magnesium NPL Site October 2013
Page 13 of 100
SECTION B: CONCEPTUAL SITE MODEL
QAPP WORKSHEET #10

Phase 1A RI Oversight QAPP Section B: Conceptual Site Model Worksheet #10 Revision: 0 US Magnesium NPL Site October 2013
Page 14 of 100
10.0 CONCEPTUAL SITE MODEL (QAPP WORKSHEET #10)
The Conceptual Site Model provided in WS#10 of the Phase 1A RI SAP encompasses the entire Site and is consistent with and applicable to the activities in this Oversight QAPP. Therefore, it is not being included in this Oversight QAPP.

Phase 1A RI Oversight QAPP Section C: Data Quality Objectives Revision: 0 US Magnesium NPL Site October 2013
Page 15 of 100
SECTION C: DATA QUALITY OBJECTIVES
QAPP WORKSHEET #11

Phase 1A RI Oversight QAPP Section C: Data Quality Objectives Worksheet #11 Revision: 0 US Magnesium NPL Site October 2013
Page 16 of 100
11.0 PROJECT QUALITY OBJECTIVES AND SAMPLING STRATEGY (QAPP WORKSHEET #11)
The data quality objectives (DQOs) and associated sampling strategies and rationale for the Phase 1A RI are outlined in WS#11 of the Phase 1A RI SAP. In summary, available data are insufficient to fully characterize contaminant types and to support identification of COPCs for assessments of risk to human and ecological receptors. The purpose of the Phase 1A RI being conducted by US Magnesium/ERM is to sample soil, sediment, solid and liquid waste, water, and air to support identification of COPCs for human and ecological receptors.
The DQOs and sampling strategy presented in this WS are specific to the EPA oversight and split sampling program.
11.1 Overall Objectives for the Phase 1A RI Oversight and Split Sampling Program
During Phase 1A of the RI, the EPA (through PWT3) will substantively oversee ERM/US Magnesium’s field activities and collect splits of a minimum of 10 percent of the samples collected by ERM/US Magnesium for the solid and aqueous media. As previously noted this Oversight QAPP, Revision 0, does not include oversight of air sampling or fully address the oversight requirements associated with specific sampling requirements of certain portions of PRI Areas 1 and 3 through 7 to be conducted during the Phase 1A RI.
The objective of the EPA field oversight program is to confirm that ERM/US Magnesium implemented the field activities pursuant to the EPA-approved plans and that the results of the activities (e.g., sample data) are representative and appropriate for decision making, identification of COPCs, application in risk assessment, and use in future remedial design/remedial action decisions. The objective of the EPA split sampling program is to confirm that the ERM/US Magnesium sample analytical results are reproducible and that the data is of acceptable quality.
11.2 DQOs for Soil, Sediment, Solid Waste and Water Split Samples
DQOs define the type, quality, quantity, purpose, and intended uses of data to be collected (EPA 2006b). The design of a study is closely tied to its DQOs, which serve as the basis for important decisions regarding key design features such as the number and location of samples to be collected and the analyses to be performed. The DQO process typically follows a seven-step procedure that is intended to help ensure that the project plan is carefully thought out and that the data collected will provide sufficient information to support the key decisions which must be made.
Step 1: State the Problem
Available data are insufficient to fully characterize contaminant types at the Site and to support identification of COPCs for completing assessments of risk to human and ecological receptors. The EPA requires documentation and confidence that the sampling and analytical data being collected by ERM/US Magnesium are collected in accordance with requirements of the Phase 1A RI SAP for its use in making future decisions.

Phase 1A RI Oversight QAPP Section C: Data Quality Objectives Worksheet #11 Revision: 0 US Magnesium NPL Site October 2013
Page 17 of 100
Step 2: Identify the Goal of the Study
The goal of the EPA field oversight and split sampling program is to evaluate the reproducibility of the analytical results produced by ERM/US Magnesium and provide certainty about the quality of data collected so that the EPA may have confidence in decisions based on the data.
Step 3: Identify Information Inputs
The EPA’s split sampling program will be used to evaluate the reproducibility and data quality of the analytical results from the ERM/US Magnesium Phase 1 RI sampling. In order to produce results that can be used to evaluate reproducibility, the EPA oversight will verify that the sampling strategy to be performed by ERM/US Magnesium is conducted so that:
• representative samples are collected of select media from a specified sampling horizon at specified sampling locations using specified methods.
• sufficient sample volume is collected such that investigative, quality control (QC), and split samples can be collected from each location.
• sample processing in the field provides representative samples.
• split samples provided to the EPA are representative of ERM/US Magnesium samples.
Comparable analytical methods with equivalent quantitation limits (QL) are required to produce a reproducible and defensible set of ERM/US Magnesium and EPA analytical data. The inputs needed to evaluate whether the analytical results are reproducible are:
• The split sampling analytical strategy must utilize comparable analytical methods to the extent practicable as the ERM/US Magnesium proposed analytical methods.
• Split sample laboratory analytical data must meet applicable criteria for definitive data as defined under EPA guidance (EPA 2006b), the requirements of the EPA’s Contract Laboratory Program (CLP) SOWs, and the measurement performance criteria for sampling and analysis that are defined in this Oversight QAPP (WS#12 and WS#15).
Step 4: Define the Boundaries of the Study
Spatial Boundaries
The horizontal and vertical boundaries of this Oversight QAPP are the same as those detailed in WS#11 of the Phase 1A RI SAP.
Temporal Boundaries
The temporal boundaries of the split samples are the single time the sample is collected. The concurrent collection of split samples with the ERM/US Magnesium samples is necessary to fully evaluate the data reproducibility.
Step 5: Develop the Analytical Approach
The decision rule for the oversight observations is defined as:
• Null Hypothesis: ERM/US Magnesium implemented the field activities pursuant to the EPA-approved plans.

Phase 1A RI Oversight QAPP Section C: Data Quality Objectives Worksheet #11 Revision: 0 US Magnesium NPL Site October 2013
Page 18 of 100
• Alternate Hypothesis: ERM/US Magnesium did not satisfactorily implement the field activities pursuant to the EPA-approved plans.
• The implementation of the EPA-approved plans will be evaluated based on field observations and field documentation as compared to the written plans.
• Once the adequacy of ERM/US Magnesium’s field activities has been established, a decision can be made whether the results of the field activities are representative and appropriate.
The decision rule for the split sample data is defined as: • Null Hypothesis: Sample analytical results are reproducible. The results are representative and
appropriate for identification of COPCs, application in risk assessment, and use in future remedial response decisions.
• Alternate Hypothesis: Sample analytical results are not reproducible such that they are not representative and appropriate for identification of COPCs, application in risk assessment, and use in future remedial response decisions.
• Once the relative reproducibility of the data has been established, a decision can be made whether the data is representative and appropriate for decision making, identification of COPCs, application in risk assessment, and use in future remedial response decisions.
Step 6: Specify Performance or Acceptance Criteria
Laboratory analytical data used for risk screening will meet applicable criteria for definitive data as defined under EPA guidance (EPA 2006b), requirements of the CLP SOWs, and the measurement performance criteria for sampling and analysis defined in the Phase 1A RI SAP (WS#12 and WS#15). The reproducibility of ERM/US Magnesium sample analytical results will be evaluated by calculating the mean relative percent difference (RPD) between the ERM/US Magnesium and corresponding EPA split samples, and applying the criteria below.
Standard reference materials analyses and field duplicate samples collected by ERM/US Magnesium for the EPA will be used to estimate precision and accuracy for each independent program. A comparison of sample results will be used to evaluate if one laboratory consistently reports higher or lower results than the other.
Table 11-1: Criteria for Evaluating Reproducibility Between ERM/US Magnesium Analytical Data and EPA Split Sample Analytical Data
Bin Laboratory Replicate Results Detection Filter Project-Specific Measurement Performance
Criteria
1 Both Results > 5x the QL Both results detected Metals and TOC: RPD ≤ 35; All other analyses: RPD ≤ 50
2 Both Results < the QL Both results not detected Both results < the QL
3 Both Results < 5x the QL Both results detected Results within ± 2x the QL
4 One Result < the QL One result not detected Detected Result ≤ 2x the QL
5 Both Results > QL Both results detected One Result < 5x the QL and One Result > 5x the QL

Phase 1A RI Oversight QAPP Section C: Data Quality Objectives Worksheet #11 Revision: 0 US Magnesium NPL Site October 2013
Page 19 of 100
Consideration of other statistical techniques or sampling activities moving forward may be required if the data collected do not meet the above decision criteria. The need for corrective action and the nature of the required corrective action will be evaluated once the data are available such that the nature and scope of the sampling and analytical issues can be further evaluated.
The potential for decision errors exists because analytical measurements inherently contain sampling and analytical sources of measurement errors. Decision errors can occur when a data collection scheme does not adequately address the sources of variability in contaminant estimation at a site. Contaminant concentration estimation errors can occur as a result of spatial heterogeneity or variability on many scales from large to small and on a micro-scale. The ERM/US Magnesium sampling and analytical methods outlined in the SOPs attached to the Phase 1A RI SAP are designed to reduce the impacts of micro-scale heterogeneity through the use of homogenization during sample processing both in the field and in the laboratory.
Step 7: Develop the Plan for Obtaining the Data
In accordance with the Phase 1A RI SAP, the basic plan for collecting samples of surficial soils, sediments, and other solid wastes is to identify approximately 14 unbiased locations where samples will be collected in each PRI area, as well as some biased samples at locations considered most likely be at the high end of the distribution of concentration values in a PRI area. PWT3 will collect split samples from a minimum of 10 percent of the sample locations in each PRI area. The plan to collect split samples from a minimum of 10 percent of the total ERM/US Magnesium samples proposed for the Phase 1A RI is expected to provide sufficient data upon which to apply the decision rule on the soil, sediment, solid waste and water analytical results for Phase 1A of the RI. Following evaluation of data generated during the Phase 1A RI, appropriate modifications to the split sampling program may be considered for future RI activities.
The proposed Phase 1A RI sampling locations are presented on the figures included with WS#14 of the Phase 1A RI SAP. In general, PWT3 will accept splits at the sample processing location, rather than the sample collection location; however, collection of solid media splits for volatile organic compounds (VOC) analyses will occur at the sampling location. Samples will be collected and processed as detailed in the applicable ERM SOPs. In accordance with the DQOs, the general plan for obtaining split samples of soils, sediments, solid wastes and water is to provide a PWT3 sample container to ERM/US Magnesium and have them fill the container after all field sample processing has been completed. For VOCs in saturated sediments, PWT3 will provide EnCore® sampling devices to ERM/US Magnesium for them to fill at the point of sample collection. For VOCs in water, PWT3 will provide sample containers to ERM/US Magnesium for them to fill at the point of sample collection. PWT3 will not enter the ditches or surface water. PWT3 will notify ERM/US Magnesium no later than the time of sample collection of PWT3’s intent to request a split sample from that location. This will ensure that ERM/US Magnesium collects sufficient volume to provide the split at the sample processing location.
The EPA split samples will be submitted to the EPA’s Analytical Program’s laboratories and commercial laboratories to be analyzed for the full suites of target analytes by the standard methods that have been identified for the Phase 1A RI (see WS#15).

Phase 1A RI Oversight QAPP Section D: Sampling and Analysis Revision: 0 US Magnesium NPL Site October 2013
Page 20 of 100
SECTION D: SAMPLING AND ANALYSIS
QAPP WORKSHEETS #12-21

Phase 1A RI Oversight QAPP Section D: Sampling and Analysis Worksheet #12 Revision: 0 US Magnesium NPL Site October 2013
Page 21 of 100
12.0 MEASUREMENT PERFORMANCE CRITERIA (QAPP WORKSHEET #12)
The data quality indicators, measurement performance criteria, and QC sample and/or activity used to assess the measurement performance for the sampling or analytical procedure is described in the table below.
Table 12-1: Measurement Performance Criteria for Soil, Sediment, Solid Waste, and Water Split Samples – Field and Lab QC Samples
QC Sample Analytical Groupa Minimum Frequency
Data Quality Indicators
Measurement Performance Criteria
QC Sample Assesses Error for
Sampling (S), Analytical (A) or
Both (S&A) Soil, Sediment, and Solid Waste
Field Duplicate PCBs, PCDDs/PCDFs, SVOCs, PAHs, VOCs, Perchlorate, Metals, TOC, pH 10% Precision-Overall
Metals, TOC: RPD ≤ 35% if results > 5 x PQL ±2 x PQL if results < 5 x PQL
Organics: RPD ≤ 50% if results > 5 x PQL ±2 x PQL if results < 5 x PQL
S & A
Matrix Spike/Matrix Spike Duplicate
(MXS/MSD)
PCBs, PCDDs/PCDFs, SVOCs, PAHs, VOCs, Perchlorate, Metals, TOC 1 per analysis Precision and
Accuracy
Metals, SVOCs, PAHs, VOCs, Perchlorate, TOC:
per Method PCBs, PCDDs/PCDFs, HCB: 50% – 150% percent recovery
RPDs are identified in the laboratory SOPs. If no RPD is
specified, a default RPD of ≤ 50% shall be used
S & A
Lab Duplicate PCBs, PCDDs/PCDFs, SVOCs, PAHs, VOCs, Perchlorate, Metals, TOC, pH 1 per analysis Precision
Metals, TOC: RPD ≤ 35% if one or both results
> 5 x PQL ±2 x PQL if both results < 5 x PQL
Organics: RPD ≤ 50% if one or both results
> 5 x PQL ±2 x PQL if both results < 5 x PQL
A

Phase 1A RI Oversight QAPP Section D: Sampling and Analysis Worksheet #12 Revision: 0 US Magnesium NPL Site October 2013
Page 22 of 100
QC Sample Analytical Groupa Minimum Frequency
Data Quality Indicators
Measurement Performance Criteria
QC Sample Assesses Error for
Sampling (S), Analytical (A) or
Both (S&A)
Lab Control Sample (LCS)
PCBs, PCDDs/PCDFs, SVOCs, PAHs, VOCs, Perchlorate, Metals, TOC 1 per analysis Precision and
Accuracy
Metals, SVOCs, PAHs, VOCs, TOC, Perchlorate:
per Method (MXS/MSD criteria) PCBs, PCDDs/PCDFs, HCB: Percent recovery 50%-150%
A
Method Blank PCBs, PCDDs/PCDFs, SVOCs, PAH, VOCs, Perchlorate, Metals, TOC, pH
1 per laboratory batch
Accuracy/ Contamination
No target compounds > PQL, except for methylene chloride, acetone, and 2-butanone, which
must be < 2x their respective PQLs and bis(2-ethylhexyl)phthalate,
which must be < 5x its PQL
A
Trip Blank VOCs 1 per cooler Accuracy/ Contamination
No target compounds > PQL, except for methylene chloride, acetone, and 2-butanone, which
must be < 2x their respective PQLs and bis(2-ethylhexyl)phthalate,
which must be < 5x its PQL
S
Groundwater, Surface Water, and Wastewater
Field Duplicate
PCBs, PCDDs/PCDFs, SVOCs, PAHs, VOCs, Metals, Anions, Alk., HAA, Perchlorate, Hexavalent Chromium,
TOC, TDS
10% Precision
VOCs, Metals, Anions, Perchlorate, Hexavalent Chromium, TOC, TDS,
HAA, Alk: RPD ≤ 20% if one or both results
> 5 x PQL ±PQL if both results < 5 x PQL
PCB, PCDD/PCDF, SVOC, PAH: RPD ≤ 50% if one or both results
> 5 x PQL ±2 x PQL if both results < 5 x PQL
S & A

Phase 1A RI Oversight QAPP Section D: Sampling and Analysis Worksheet #12 Revision: 0 US Magnesium NPL Site October 2013
Page 23 of 100
QC Sample Analytical Groupa Minimum Frequency
Data Quality Indicators
Measurement Performance Criteria
QC Sample Assesses Error for
Sampling (S), Analytical (A) or
Both (S&A)
MXS/MSD
PCBs, PCDDs/PCDFs, SVOCs, PAHs, VOCs, Metals, Anions, Alk., HAA, Perchlorate, Hexavalent Chromium
1 per analysis Precision and Accuracy
SVOCs, PAHs, VOCs, Metals, Anions, HAA, Perchlorate,
Hexavalent Chromium, TOC, Alk: Per Method
PCBs, PCDDs/PCDFs: RPDs are identified in the
laboratory SOPs. If no RPD is specified, a default RPD of ≤ 50%
shall be used Percent recovery 50%-150%
S & A
Lab Duplicate
PCBs, PCDDs/PCDFs, SVOCs, PAHs, VOCs, Metals, Anions, Alk., HAA, Perchlorate, Hexavalent Chromium,
TOC, TDS
1 per analysis Precision
VOCs, Metals, Anions, Perchlorate, Hexavalent Chromium, TOC, TDS,
Alk: RPD ≤ 20% if results > 5 x PQL
±PQL if results < 5 x PQL PCBs, PCDDs/PCDFs, SVOCs,
PAHs: RPD ≤ 50% if results > 5 x PQL ±2 x PQL if results < 5 x PQL
A
LCS PCBs, PCDDs/PCDFs, SVOCs, PAHs,
VOCs, Metals, Anions, Alk., HAA, Perchlorate, Hexavalent Chromium
1 per analysis Precision and Accuracy
SVOCs, PAHs, VOCs, Metals, Anions, HAA, Perchlorate,
Hexavalent Chromium, TOC, Alk: Per Method (MXS/MSD criteria)
PCBs, PCDDs/PCDFs: Percent recovery 50% to 150%
A
Method Blank PCBs, PCDDs/PCDFs, SVOCs, PAHs,
VOCs, Metals, Anions, Alk., HAA, Perchlorate, Hexavalent Chromium
1 per laboratory batch
Accuracy/ Contamination
No target compounds > PQL, except for methylene chloride, acetone, and 2-butanone, which
must be < 2x their respective PQLs and bis(2-ethylhexyl)phthalate,
which must be < 5x its PQL
A

Phase 1A RI Oversight QAPP Section D: Sampling and Analysis Worksheet #12 Revision: 0 US Magnesium NPL Site October 2013
Page 24 of 100
QC Sample Analytical Groupa Minimum Frequency
Data Quality Indicators
Measurement Performance Criteria
QC Sample Assesses Error for
Sampling (S), Analytical (A) or
Both (S&A)
Trip Blank VOCs 1 per cooler Accuracy/ Contamination
No target compounds > PQL, except for methylene chloride, acetone, and 2-butanone, which
must be < 2x their respective PQLs and bis(2-ethylhexyl)phthalate,
which must be < 5x its PQL
S
Notes: a. Metals for both soil and water samples include cyanide, mercury, and molybdenum. Metals in surface water refer to total and dissolved metals; these
two separate analyses for metals in surface water are not reflected in this WS.

Phase 1A RI Oversight QAPP Section D: Sampling and Analysis Worksheet #13 Revision: 0 US Magnesium NPL Site October 2013
Page 25 of 100
13.0 SECONDARY DATA CRITERIA AND LIMITATIONS (QAPP WORKSHEET #13)
Secondary data is that information generated historically at the Site by past investigators or data from other sources that are relevant to the attainment of project objectives for which complete documentation may not be available. Secondary data considered in the development of the Phase 1A study design are discussed in WS#13 of the Phase 1A RI SAP.

Phase 1A RI Oversight QAPP Section D: Sampling and Analysis Worksheet #14 Revision: 0 US Magnesium NPL Site October 2013
Page 26 of 100
14.0 SUMMARY OF PROJECT TASKS (QAPP WORKSHEET #14)
The EPA, through PWT3, will conduct field oversight to confirm that ERM/US Magnesium is implementing the field activities pursuant to the EPA-approved plans, collecting samples pursuant to approved methods and without bias in the field, and that the field sampling activities are representative of the media being sampled. PWT3 will collect splits of a minimum of 10 percent (depending on the media and PRI area) of the samples collected by ERM/US Magnesium to evaluate if the ERM/US Magnesium sample analytical results are reproducible and that the data is of acceptable quality. ERM/US Magnesium intends to complete the Phase 1A RI field activities with three separate field teams working concurrently. The ERM/US Magnesium field teams will consist of a groundwater well installation/development team, a water sampling team, and a soil sampling team. During Phase 1A of the RI, the EPA intends to have one to two oversight personnel onsite every day (or otherwise available to respond to inquiries by ERM/US Magnesium regarding potential field modification considerations) with the intent of providing oversight for as much of the field activities as possible. The specific oversight activities anticipated by the EPA during the Phase 1A RI in order to achieve the objectives are summarized below.
The protocol for any changes to the Phase 1A RI SAP will be done in accordance with WS#14 of the Phase 1A RI SAP. Any field modifications to this Oversight QAPP will be documented and approved with a Field Modification Approval Form (Attachment 14C). All completed and approved documentation will be placed in Attachment 17B.
14.1 PROJECT TASK OVERVIEW
The following is a list of oversight project tasks, which will be conducted by PWT3 during the Phase 1A RI:
• Oversee field activities for adherence to EPA-approved project planning documents • Oversee the on-site recon/sieving events (BLM land, non-BLM land) and approve any minor
modifications of the sampling locations identified in the Phase 1A RI SAP • Oversee the geophysical survey of the Landfill • Observe and document ERM/US Magnesium sample collection and processing activities • Oversee drilling, borehole logging, and well installation and development activities • Accept split samples of soil, sediment, solid waste and water • Oversee sample labeling and sample location documentation • Collect oversight photographic documentation • Consult with ERM/US Magnesium field staff regarding potential field modifications that
ERM/US Magnesium may seek from the EPA, in order to advise the EPA regarding actions on such requests
• Consult with and advise the EPA RPM regarding field/Site situations that may warrant the EPA considerations for issuing appropriate Phase 1A RI SAP and/or Oversight QAPP modification(s)
• Analyze split samples of soil, sediment, solid waste and water • Audit up to two ERM/US Magnesium-contracted laboratories to evaluate the compliance with
requirements of the Phase 1A RI SAP • Verify and validate split sample data • Manage split sample data and the associated documentation

Phase 1A RI Oversight QAPP Section D: Sampling and Analysis Worksheet #14 Revision: 0 US Magnesium NPL Site October 2013
Page 27 of 100
The following sections briefly describe these tasks to be performed by the EPA, through PWT3, during the Phase 1A RI.
14.2 SAMPLE COLLECTION, PROCESSING, AND ANALYSES
The general approach for characterizing the contaminants present in solids at the Site has been organized by PRI areas. PRI areas are grouped based on geographic location, expected waste characteristics, and potential forces that may have acted to redistribute contaminants. The EPA has developed a PRI area- and task-specific split sampling approach to address specific data needs.
A field data sheet has been developed for sampling activities and is included in Attachment 14A. A split sampling field data sheet will be completed for each sample collected by PWT3.
The EPA split-samples will be analyzed through the EPA’s Analytical Program laboratories and commercial laboratories for the comprehensive list of chemicals identified in WS#15. Multiple laboratories may be used under the EPA’s Analytical Program.
14.2.1 Soil, Sediment, and Solid Waste Sampling
PWT3 will collect split samples from a minimum of 10 percent of the sample locations in each PRI area and will collect at least one split sample from one of the 2-foot intervals in each subsurface boring. The EPA split sampling approach and location selection criteria is presented in WS#18.
During Phase 1A of the RI, subsurface borings will be advanced at PRI Areas 1 through 8, 10, and 14; coring is not planned in PRI Areas 9, 11, 12, 15, and 16. The following table provides criteria for subsurface boring depths
Table 14-1: Subsurface Boring Depths
PRI Area Sample Intervals and Boring Depth Notes
PRI 1, Ditches PRI 2, Landfill PRI 3 Sanitary Lagoon PRI 4, Gypsum Pile PRI 10, Barium Sulfate Area
0 inches – 6 inches 6 inches – 2 feet 2 feet – 4 feet 4 feet – 6 feet 6 feet – 8 feet, etc. Continue sampling of 2-foot interval to native material
Within these PRI areas, visible contact between the waste and the native material is expected. The boring should be extended until the native material is encountered.
PRI 5, Southeast Ponded Waste Lagoon PRI 6, Northwest Ponded Waste Lagoon PRI 7, Northeast Ponded Waste Lagoon PRI 8, Northwest Ponded Waste lagoon Overflow PRI 14, Buffer Area South
0 inches – 6 inches 6 inches – 2 feet 2 feet – 4 feet 4 feet – 6 feet
Within these PRI areas, surface water contamination may have impacted the underlying soil or sediment. Borings shall be extended to 6 feet below ground surface (bgs).
PWT3 will oversee borehole drilling and review ERM/US Magnesium’s boring logs in the field. PWT3 will take note of any observed discrepancies in soil type interpretations, but will not independently perform geophysical logging for each boring. During borehole advancement, samples representative of the materials encountered will be collected by ERM/US Magnesium at discrete 2-foot intervals and processed in the field. PWT3 will collect at least one split-sample from one of the 2-foot intervals in each subsurface boring.

Phase 1A RI Oversight QAPP Section D: Sampling and Analysis Worksheet #14 Revision: 0 US Magnesium NPL Site October 2013
Page 28 of 100
Soil, sediment, and solid waste samples will be sieved, homogenized, and processed by ERM/US Magnesium in accordance with the procedures identified in the Phase 1A RI SAP. PWT3 will accept split-samples in the field from the post-processed sample volume. The PWT3 samples for VOCs will be collected by ERM/US Magnesium at the point of sample collection, and will not be processed. Soil, sediment, and solid waste samples will be analyzed for the list of chemicals identified in WS#15.
14.2.2 Water Sampling
Groundwater and surface water (including both wastewater and surface water) will be sampled and monitored during the Phase 1A RI. Surface water samples will be collected by ERM/US Magnesium as shown in the WS#14 Figures associated with the Phase 1A RI SAP. PWT3 will observe and document the surface water and groundwater sample collection methods. Observations of surface water sampling may be from the nearest and best observation point rather than accompany ERM/US Magnesium at the sample collection point for health and safety considerations. The SOPs attached to the Phase 1A RI SAP indicate that ERM/US Magnesium will use tubing connected to a peristaltic pump to pump water from the surface water sample location and then process (containerize, filter, etc.) the samples on solid ground. PWT3 will provide ERM/US Magnesium with sample containers for the split samples and ERM/US Magnesium will fill the sample containers and conduct field-filtration for dissolved constituent analyses. ERM/US Magnesium will measure chlorine in the field pursuant to the Phase 1A RI SAP. PWT3 will record field measurements on the split sampling field data sheet (Attachment 14A).
During the Phase 1A RI, new groundwater wells will be installed, groundwater samples will be collected from new and existing wells, and groundwater elevations will be monitored. ERM/US Magnesium will conduct sampling at 27 groundwater wells (19 existing wells and eight new wells). Six of the new wells will allow sampling and monitoring of the shallow aquifer to augment the existing network of shallow and intermediate water bearing zone piezometers (small gauge 2-inch wells). Two of the new wells will be nested pairs. Each well will be purged with a peristaltic pump prior to sampling, and while the well is being purged, groundwater parameters including, pH, specific conductivity, dissolved oxygen (DO), turbidity, and oxidation reduction potential (ORP) will be monitored using an in-line flow cell and multi-parameter water quality meter. When these parameters have stabilized, the well will be sampled. PWT3 will document the final, stabilized, water quality paramter measurements as well as the depth to water measurement taken prior to sampling. These measurements will be recorded on the split sampling field data sheet.
Groundwater samples will be collected following low-flow, minimal drawdown methodology using a peristaltic pump. PWT3 will provide ERM/US Magnesium with sample containers for the split samples and ERM/US Magnesium will fill the sample containers and conduct field-filtration for dissolved constituent analyses. ERM/US Magnesium will measure chlorine in the field pursuant to the Phase 1A RI SAP. PWT3 will record field measurements on the split sampling field data sheet (Attachment 14A).
ERM/US Magnesium will measure and record groundwater and surface water elevations during the initial field effort of the Phase 1A RI and on a regular monthly schedule thereafter. Groundwater level measurements will be taken at all groundwater monitoring wells and surface water level measurements will be taken at established gauging stations. PWT3 will oversee the groundwater and surface water level measurements when possible during the Phase 1A RI, but does not plan to oversee the regular monthly measurements thereafter.
Groundwater and surface water samples will be analyzed for the list of chemicals as identified in WS#15.

Phase 1A RI Oversight QAPP Section D: Sampling and Analysis Worksheet #14 Revision: 0 US Magnesium NPL Site October 2013
Page 29 of 100
The table below indicates the target number of EPA split samples per sample type within each PRI area, and the analyses that will be requested for each sample. The media, number of samples and sample locations per PRI area, the number split samples to be collected, and the analytical tests to be performed on each of the split samples collected are summarized in the table below. The number of samples collected may be revised as field conditions warrant (e.g., waste or other material types encountered during subsurface drilling).
Table 14-2: Target Number of Split Samples per PRI
Sample Type
Number of Sample Locations
Number of Samples per Location
Total Number of Samples (estimated for some subsurface samples)
Target Number of EPA Split Samples
Analytical Group per Methods Identified in WS#15
PRI Area 1, Ditches Surface soil/sediment/solid waste
17 1 17 3 VOCs in saturated sediments, Metals, TOC, SVOCs, PAHs, PCBs, PCDDs/PCDFs, Perchlorate, pH
Subsurface soil/sediment/solid waste
3
5 (native material expected at 10 ft bgs)
15 3 VOCs, Metals, TOC, SVOCs, PAHs, PCBs, PCDDs/PCDFs, Perchlorate, pH
PRI Area 2, Landfill Surface soil/sediment/solid waste
14 1 14 2 VOCs in saturated sediments, Metals, TOC, SVOCs, PAHs, PCBs, PCDDs/PCDFs, Perchlorate, pH
Subsurface soil/sediment/solid waste
3
8 (native material expected at 16.5 ft bgs)
24 3 VOCs, Metals, TOC, SVOCs, PAHs, PCBs, PCDDs/PCDFs, Perchlorate, pH
PRI Area 3, Sanitary Lagoon Surface soil/sediment/solid waste samples
12 1 12 2 VOCs in saturated sediments, Metals, TOC, SVOCs, PAHs, PCBs, PCDDs/PCDFs, Perchlorate, pH
Subsurface soil/sediment/solid waste
1
4 (native material expected at 8.5 ft bgs)
4 1 VOCs, Metals, TOC, SVOCs, PAHs, PCBs, PCDDs/PCDFs, Perchlorate, pH
PRI Area 4, Gypsum Pile Surface soil/sediment/solid waste
14 1 14 2 VOCs in saturated sediments, Metals, TOC, SVOCs, PAHs, PCBs, PCDDs/PCDFs, Perchlorate, pH
Subsurface soil/sediment/solid waste
1
8 (native material expected at 16.5 ft bgs)
8 1 VOCs, Metals, TOC, SVOCs, PAHs, PCBs, PCDDs/PCDFs, Perchlorate, pH

Phase 1A RI Oversight QAPP Section D: Sampling and Analysis Worksheet #14 Revision: 0 US Magnesium NPL Site October 2013
Page 30 of 100
Sample Type
Number of Sample Locations
Number of Samples per Location
Total Number of Samples (estimated for some subsurface samples)
Target Number of EPA Split Samples
Analytical Group per Methods Identified in WS#15
PRI Area 5, Southeast Ponded Waste Lagoon Surface soil/sediment/solid waste
16 1 16 3 VOCs in saturated sediments, Metals, TOC, SVOCs, PAHs, PCBs, PCDDs/PCDFs, Perchlorate, pH
Subsurface soil/sediment/solid waste
2 3 (boring extended to 6 ft bgs)
6 2 VOCs, Metals, TOC, SVOCs, PAHs, PCBs, PCDDs/PCDFs, Perchlorate, pH
PRI Area 6, Northwest Ponded Waste Lagoon Surface soil/sediment/solid waste
17 1 17 3 VOCs in saturated sediments, Metals, TOC, SVOCs, PAHs, PCBs, PCDDs/PCDFs, Perchlorate, pH
Subsurface soil/sediment/solid waste
1 3 (boring extended to 6 ft bgs)
3 1 VOCs, Metals, TOC, SVOCs, PAHs, PCBs, PCDDs/PCDFs, Perchlorate, pH
PRI Area 7, Northeast Ponded Waste Lagoon Surface soil/sediment/solid waste on grid nodes
17 1 17 3 VOCs in saturated sediments, Metals, TOC, SVOCs, PAHs, PCBs, PCDDs/PCDFs, Perchlorate, pH
Subsurface soil on grid nodes 1
3 (boring extended to 6 ft bgs)
3 1 VOCs, Metals, TOC, SVOCs, PAHs, PCBs, PCDDs/PCDFs, Perchlorate, pH
PRI Area 8, Northwest Lagoon Overflow Surface soil/sediment/solid waste on grid nodes
17 1 17 3 VOCs in saturated sediments, Metals, TOC, SVOCs, PAHs, PCBs, PCDDs/PCDFs, Perchlorate, pH
Subsurface soil/sediment/solid waste on grid nodes
1 3 (boring extended to 6 ft bgs)
3 1 VOCs, Metals, TOC, SVOCs, PAHs, PCBs, PCDDs/PCDFs, Perchlorate, pH
PRI Area 9, Smut Area Surface soil/sediment/solid waste on grid nodes
14 1 14 3 VOCs in saturated sediments, Metals, TOC, SVOCs, PAHs, PCBs, PCDDs/PCDFs, Perchlorate, pH

Phase 1A RI Oversight QAPP Section D: Sampling and Analysis Worksheet #14 Revision: 0 US Magnesium NPL Site October 2013
Page 31 of 100
Sample Type
Number of Sample Locations
Number of Samples per Location
Total Number of Samples (estimated for some subsurface samples)
Target Number of EPA Split Samples
Analytical Group per Methods Identified in WS#15
PRI Area 10, Barium Sulfate Area
Surface soil/sediment/waste 14 1 14 2
VOCs in saturated sediments, Metals, TOC, SVOCs, PAHs, PCBs, PCDDs/PCDFs, Perchlorate, pH
Subsurface soil/sediment/solid waste
1
5 (native material expected at 10 ft below the 3 ft cap)
5 1 VOCs, Metals, TOC, SVOCs, PAHs, PCBs, PCDDs/PCDFs, Perchlorate, pH
PRI Area 11, ATI Titanium Plant and US Magnesium Parking Lots Surface soil/sediment/solid waste
14 1 14 2 VOCs in saturated sediments, Metals, TOC, SVOCs, PAHs, PCBs, PCDDs/PCDFs, Perchlorate, pH
PRI Area 12, Ancillary Worker Exposure Area Surface soil/sediment/solid waste
14 1 14 2 VOCs in saturated sediments, Metals, TOC, SVOCs, PAHs, PCBs, PCDDs/PCDFs, Perchlorate, pH
PRI Area 13, Buffer Area North and East Surface soil/sediment/solid waste
14 1 14 2 VOCs in saturated sediments, Metals, TOC, SVOCs, PAHs, PCBs, PCDDs/PCDFs, Perchlorate, pH
PRI Area 14, Buffer Area South Surface soil/sediment/solid waste on grid nodes
15 1 15 2 VOCs in saturated sediments, Metals, TOC, SVOCs, PAHs, PCBs, PCDDs/PCDFs, Perchlorate, pH
Subsurface soil/sediment/solid waste on grid nodes
1 3 (boring extended to 6 ft bgs)
3 1 VOCs, Metals, TOC, SVOCs, PAHs, PCBs, PCDDs/PCDFs, Perchlorate, pH
PRI Area 15, Buffer Area West Surface soil/sediment/solid waste on grid nodes
14 1 14 2 VOCs in saturated sediments, Metals, TOC, SVOCs, PAHs, PCBs, PCDDs/PCDFs, Perchlorate, pH
PRI Area 16, Lakeside Mountain Buffer Area Surface soil/sediment/solid waste
14 1 14 2 VOCs in saturated sediments, Metals, TOC, SVOCs, PAHs, PCBs, PCDDs/PCDFs, Perchlorate, pH

Phase 1A RI Oversight QAPP Section D: Sampling and Analysis Worksheet #14 Revision: 0 US Magnesium NPL Site October 2013
Page 32 of 100
Sample Type
Number of Sample Locations
Number of Samples per Location
Total Number of Samples (estimated for some subsurface samples)
Target Number of EPA Split Samples
Analytical Group per Methods Identified in WS#15
PRI Area 17, Site-Wide Water
Surface water and wastewater 32 1 32 6
VOCs, Metals, Hexavalent Chromium, TOC, SVOCs, PAHs, PCBs, PCDDs/PCDFs, HAA, Perchlorate, Chlorine, Anions, TDS, Alkalinity
Groundwater
19 existing 9 new wells (includes 2 new nested pairs of wells)
1 sampling event
28 6 VOCs, Metals, TOC, SVOCs, PAHs , PCBs, PCDDs/PCDFs, HAA, Perchlorate, Chlorine, Anions, TDS, Alkalinity
Notes: • Metals for both soil and water samples include cyanide, mercury, and molybdenum. Metals in surface water
refer to total and dissolved metals; these two separate analyses for metals in surface water are not reflected in this WS.
• See WS#18 for rationale of sample locations planned for collection by ERM/US Magnesium. • The actual number of EPA split samples may vary depending on available sample quantities.
14.3 SUMMARY OF SURVEYS, INVESTIGATION-DERIVED WASTE, AND EQUIPMENT DECONTAMINATION
ERM/US Magnesium will be responsible for utility clearance and sample location surveys, equipment decontamination procedures, and management of investigation-derived waste (IDW) during this investigation. These tasks will be conducted by ERM/US Magnesium in accordance with the procedures identified in the Phase 1A RI SAP. PWT3 will provide oversight of these activities as needed to ensure that they are conducted according to the approved plan.
14.4 GEOPHYSICAL SURVEY OF THE LANDFILL
A geophysical survey of the Landfill (PRI Area 2) will be conducted during Phase 1A RI activities to identify large metal objects and evaluate trenching versus drilling methods for the investigation of depth and nature of wastes that have been placed into the Landfill. The survey will be designed to help locate subsurface boring locations where subsurface borings most likely will be able to fully penetrate the waste without encountering any large metal objects. Prior to implementation of a geophysical survey of the Landfill, ERM/US Magnesium will prepare a geophysical survey test plan for inclusion into the Phase 1A RI SAP. The test plan will detail the rationale, methods, and limitations of a geophysical survey of the Landfill.
PWT3 will provide onsite oversight of the geophysical survey implementation and document findings.

Phase 1A RI Oversight QAPP Section D: Sampling and Analysis Worksheet #14 Revision: 0 US Magnesium NPL Site October 2013
Page 33 of 100
14.5 DATA VALIDATION
Analytical data will be validated in accordance with current EPA National Functional Guidelines (EPA 2008, 2009, 2010, 2011b). Validation procedures are detailed in WS#36. External data validators, specifically the laboratories, will generate and submit data validation electronic data deliverables (EDD) to PWT3 in accordance with the EPA-approved Oversight Data Management Plan.
14.6 AUDITS
Audits may be used to help assess whether data meet the project-specific requirements and to identify the need for corrective action.
14.6.1 Field Performance and System Audits
PWT3 does not anticipate conducting a QA audit of PWT3 Team field activities and procedures during the initial part of the Phase 1A RI. However, this section is provided as an outline of audit activities should they prove necessary.
The PWT3 Project Manager will have overall responsibility to ensure that the objectives of the project are met. The PWT3 Project Manager may conduct an informal QA review of PWT3 field activities and procedures during the two-day visit proposed for the initial part of the Phase 1A RI. PWT3 will notify the EPA RPM in advance of the planned date for this visit, so that the EPA may choose to attend. The PWT3 Field Team Leader will have direct responsibility for the field procedures to ensure they are conducted in accordance with this Oversight QAPP.
Internal audits of field activities to assess the performance and effectiveness of the existing quality management system in accordance with this Oversight QAPP would be conducted by the PWT3 Quality Assurance Manager (QAM), or their designee. The intent of these audits is to identify, correct, and prevent problems that hinder the achievement of the project DQOs. If, during an assessment, the PWT3 QAM determines that non-conformances are occurring that will seriously impact the usability of the data being collected, the PWT3 QAM has the authority to stop work until the issues are resolved. If the PWT3 QAM issues a stop work order to the PWT3 Field Team Leader, the PWT3 Project Manager and the EPA RPM will be notified immediately so that the deficiencies may be resolved and work can recommence.
The audits may include examining field sampling records, log books and field sampling forms; sample collection, handling, storage, and transportation procedures, including organization and minimization of potential contamination sources; and chain-of-custody records and procedures.
After an internal audit is completed, a debriefing session will be held for participants to discuss the preliminary audit results. The auditor will prepare an audit evaluation report that includes observations of the deficiencies and the necessary recommendations for corrective actions. A draft audit evaluation report will be provided to the PWT3 Project Manager and the PWT RAC2 Program Manager within 10 days after the field or system performance audit is completed, and will be finalized no later than 30 days after the audit was performed. Conformance with the requirements presented in PWT’s SOPs and this Oversight QAPP will be noted and nonconformance or deviations will be addressed through corrective or preventative actions identified by the PWT3 QAM and the project team and approved by the PWT3 Project Manager and the RAC2 Program Manager. Upon request, the audit evaluation report and any associated proposed corrective or preventative actions will be forwarded to the EPA RPM along with a time frame for implementation of corrective actions. Follow-up audits may be performed prior to

Phase 1A RI Oversight QAPP Section D: Sampling and Analysis Worksheet #14 Revision: 0 US Magnesium NPL Site October 2013
Page 34 of 100
completion of the project to ensure that corrective actions have been implemented appropriately and completely by the field team.
External field audits are the responsibility of the EPA Region 8. Field audits may be conducted at any time during the field operations and will be based upon the information presented in this Oversight QAPP. The audits may or may not be announced, at the discretion of the auditing agency.
14.6.2 Laboratory Performance and System Audits
This Oversight QAPP includes analyses of samples by both the EPA’s Analytical Program laboratories and commercial laboratories.
The performance of laboratories under the EPA’s Analytical Program are monitored using a variety of QA/QC monitoring and evaluation reviews including but not limited to on-site audits, tape audits, and Performance Evaluation (PE) samples. To verify proper implementation of laboratory procedures and adherence to this Oversight QAPP, the EPA Region 8 may perform an audit of an EPA Analytical Program laboratory during this project. These audits may or may not be announced and will be conducted at the discretion of the auditing agency.
Commercial laboratories are required to have QA programs that meet the EPA requirements specified in both the Phase 1A RI SAP and this Oversight QAPP and follow the EPA CLP SOW requirements and laboratory-specific SOPs (Attachment 19A). Laboratory-specific requirements are discussed in Section 14.6 and throughout this Oversight QAPP. Audits may include review of method startup documentation and performance maintenance practices, including review of sample preparation, custody and data documentation, and analytical laboratory practices. Some examples of the types of laboratory-specific information that may be reviewed include, but may not be limited to:
• Sample processing procedures • Sample custody procedures • Sample disposal procedures and documentation • Calibration procedures and documentation • Detail regarding the analyses • Completeness of data forms, notebooks, and other reporting requirements • Data review and validation procedures • Data reporting integrity and archiving, data storage, filing, and record keeping procedures • QC procedures, tolerances, and documentation • Operating conditions of facilities and equipment • Documentation of training and maintenance activities • Systems and operations overview • Security of laboratory automated systems
Deficiencies and corrective action procedures will be reported to the EPA Analytical Program Manager, the PWT3 Project Manager, and the EPA RPM. Any audit report will be included in the final project deliverables.

Phase 1A RI Oversight QAPP Section D: Sampling and Analysis Worksheet #14 Revision: 0 US Magnesium NPL Site October 2013
Page 35 of 100
14.7 DOCUMENTS AND RECORDS
Documentation and consistent reporting is critical for evaluating the success of any environmental data collection activity. The information provided below is intended to provide a general overview of the data management process that PWT3 will follow as well as identify the documents and data that will be managed as part of the EPA split sampling program. More specific details regarding how these deliverables must be formatted and reported are provided in the CLP SOWs and the Oversight Data Management Plan, included in this Oversight QAPP as Attachment 14A.
14.7.1 General Data Management Considerations
Field and analytical data collected from this project are critical to the EPA oversight and split sampling program. An effective information management system is necessary to ensure efficient access to high quality data so that decisions can be made in a timely manner.
PWT3 will use field data sheets, logbooks and other forms to document ERM/US Magnesium and EPA split sample locations, field observations, monitoring results, events that occur during field activities and deviations from the Phase 1A RI SAP and this Oversight QAPP. PWT3 will manage all data and documents associated with monitoring, sampling and analytical split sampling activities in accordance with the EPA-approved Oversight Data Management Plan (Attachment 14B). PWT3 will verify and enter these data and documents into a database and document management system for the Site. These systems will also contain information for (1) summarizing observations on ERM/US Magnesium’s sample collection and processing activities, (2) preparing reports and graphics, and (3) distributing data to project personnel and stakeholders.
Split sampling analytical laboratory data deliverables and reports will be sent directly from the laboratories to PWT3. The laboratory data and documents will document sample custody, analytical responsibility, analytical results, adherence to prescribed protocols and methods, nonconformity events, corrective measures, and/or data deficiencies. All laboratory data and documents will be reported to both PWT3 and subsequently to the EPA in accordance with the EPA’s Oversight Data Management Plan.
14.7.2 Field Documentation
Complete and accurate documentation is essential to demonstrate that field measurement and sampling procedures are carried out as described in the Phase 1A RI SAP and this Oversight QAPP. PWT3 and ERM/US Magnesium field activities and mesurements observed will be documented by the PWT3 field team. Field personnel will use permanently bound field logbooks with sequentially numbered pages to record and document field activities. Each logbook will be assigned a unique identifier.
Logbooks will include, but may not be limited to, the following information.
• Name and affiliation of all on-site personnel or visitors • Weather conditions during the field activity • Summary of daily activities and significant events • Notes of conversations with coordinating officials • References to other field logbooks or forms that contain specific information • Discussions of problems encountered and their resolution • Discussions of deviations from this Oversight QAPP or other governing documents

Phase 1A RI Oversight QAPP Section D: Sampling and Analysis Worksheet #14 Revision: 0 US Magnesium NPL Site October 2013
Page 36 of 100
Specific data recording formats and parameters for logbooks are identified in the EPA-approved Oversight Data Management Plan. The field team will also use the split sampling data sheet (Attachment 14A) as specified in the Oversight Data Management Plan to record sample data.
Photographs will be taken to document ERM/US Magnesium field activities. At a minimum, each type of field activity and each sample location will be photographed. Each photograph will include a date and time stamp.
14.7.3 Full Data Package
Full data packages are required from both the EPA Analytical Program laboratories and commercial laboratories. Laboratory reports shall document sample custody, analytical responsibility, analytical results, adherence to prescribed protocols, non-conformity events, corrective measures, and/or data deficiencies. Each data report will contain a case narrative that briefly describes the number of samples, the analyses, and any analytical difficulties or QA/QC issues associated with the submitted samples. The laboratory shall prepare data packages in accordance with those required in the EPA CLP SOW. Full data package requirements are outlined in WS#29. The full data package shall include raw data (EPA “CLP-type” Level IV data package) sufficient to perform an EPA Stage 4 data validation and an EDD.
Analytical results shall be provided by the laboratory electronically by the end of the standard turn-around-time period, and a full data package will be provided within 35 days after the last sample in the sample delivery group is received. Electronic and hard-copy data must be retained by the laboratory for a minimum of 10 years, after final data have been submitted. Data shall be retained on an electronic storage device capable of recording data for long-term, off-line storage and on an electronic data archival system. The EPA Region 8 Administrative Record will also retain a copy of raw data.
14.7.4 Lab Electronic Data Package Format
Laboratories will provide an EDD for analytical results in Microsoft Excel format compatible with the Superfund Staged Environmental Data Delivery (SEDD) format for import into the EPA’s official site information management system (http://www.epa.gov/superfund/programs/clp/sedd.htm, i.e., EPA Scribe-compatible format). The minimum level of detail required in the SEDD will be consistent with Stage 2a deliverable requirements. An automated Laboratory Information Management System (LIMS) will be used by all laboratories to produce the EDDs. Manual creation of the deliverable (data entry by hand) is unacceptable. The laboratory will verify EDDs internally before they are issued. The EDDs will correspond exactly to the hard-copy data. No duplicate data will be submitted.
14.7.5 Reports Generated
Results from the EPA’s oversight and split sampling program will be incorporated into an EPA split sampling data report. The report will evaluate ERM/US Magnesium’s compliance with the approved plans and include new analytical data collected under the oversight program, comparison to ERM/US Magnesium collected data, and evaluation of the reproducibility of the ERM/US Magnesium data.

Phase 1A RI Oversight QAPP Section D: Sampling and Analysis Worksheet #15 Revision: 0 US Magnesium NPL Site October 2013
Page 37 of 100
15.0 REFERENCE LIMITS AND EVALUATION TABLES (QAPP WORKSHEET #15)
This WS identifies the project-required Target Quantitation Limit (TQL) for each analyte in each medium based on risk-based concentration levels. The process for identifying the risk-based concentration levels and the project-required TQLs is provided in WS#15 of the Phase 1A RI SAP. This WS provides the anticipated reference limits [Contract Required Quantitation Limit (CRQL), the laboratory-specific quantitation limit, and the Method Detection Limit (MDL)] for each analyte in each medium for comparison of the TQL to the reference limits in order to judge whether the analytical method selected for use is sufficiently sensitive to measure each analyte at concentration levels of potential concern.
For EPA split-sample analysis, the CLP laboratories will report detections at or above the CRQL and the non-CLP laboratories will report detections at or above the laboratory-specific quantitation limit. The EPA split-sample analytical methods and quantitation limits are provided in separate tables for each matrix, concentration level, and analytical group in Attachment 15A. To the extent possible, the EPA split-sample preparation methods, analytical methods, and quantitation limits will match those established in the Phase 1A RI SAP for ERM/US Magnesium sample analysis. Attachment 15A presents a cross-check between analytical methods and quantitation limits to be used for EPA split samples, and analytical methods and quantitation limits to be used for ERM/US Magnesium samples. This Oversight QAPP presents analytical method grouping according to CLP SOWs for those methods to be provided through the CLP. For those methods to be performed by non-CLP laboratories and yet to be identified, this Oversight QAPP references similar methods as those in Phase 1A RI SAP.

Phase 1A RI Oversight QAPP Section D: Sampling and Analysis Worksheet #16 Revision: 0 US Magnesium NPL Site October 2013
Page 38 of 100
16.0 PROJECT SCHEDULE / TIMELINE (QAPP WORKSHEET #16)
WS#16 in the Phase 1A RI SAP includes the overall schedule for Phase 1A of the RI. The critical subtasks and deliverables and preliminary general schedule for completing the oversight and split sampling support for the Phase 1A RI for PRI Areas 2 and 8 through 17 is provided in Table 16-1 of this Oversight QAPP. Detailed schedules for oversight and split sampling of PRI Areas 1, 3 through 7, and 18 will be prepared at a later date and incorporated into this Oversight QAPP as a revision.
Table 16-1: Oversight Schedule for Phase 1A RI for PRI Areas 2 and 8 through 17
Activities Responsible Party
Anticipated Date of Initiation
Anticipated Date of Completion Deliverable Deliverable Due
Date Coordinate laboratory analyses with the EPA Analytical Program
PWT3 Field Team Leader 09/17/13 10/11/13 Lab assignment
and case # 10/11/13
Procure commercial lab(s) to analyze those analytes not being performed through the EPA Analytical Program
PWT3 Project Manager 09/19/13 10/14/13 Purchase Order 10/21/13
Finalize Oversight QAPP PWT3 09/30/13 10/16/13 Final QAPP 10/18/13 Prepare the Oversight HASP (revise existing HASP) PWT3 09/23/13 10/16/13 Final HASP 10/18/13 Review the Phase 1A RI SAP, ERM’s SOPs, and ERM’s HASP PWT3 10/14/13 10/18/13 None prior to start of
field activities Field review and consult with the EPA for approval of modified Phase 1A RI sampling locations in PRI Areas 2 and 8 through 17 consistent with protocol in Phase 1A RI SAP
PWT3 Field Team Leader 09/30/13 10/04/13
Field Modification Forms as needed
10/04/13
Coordinate and take delivery of field trailer and have electrician connect electrical power
PWT3 Field Team Leader 09/23/13 10/18/13 Field Office prior to start of
field activities
Procure field supplies, PPE, and sampling supplies PWT3 Field Team Leader 10/07/13 10/18/13 None prior to start of
field activities Set up sampling event in Scribe and print out sample labels
PWT3 Field Team Leader 10/14/13 10/18/13 Sample labels 10/18/13
Oversee the Landfill geophysical survey PWT3 Field Team Leader TBD TBD Field
documentation NA

Phase 1A RI Oversight QAPP Section D: Sampling and Analysis Worksheet #16 Revision: 0 US Magnesium NPL Site October 2013
Page 39 of 100
Activities Responsible Party
Anticipated Date of Initiation
Anticipated Date of Completion Deliverable Deliverable Due
Date Oversee the Phase 1A RI field work for PRI Areas 2 and 8 through 17 and collect split samples
PWT3 Field Team Leader 10/21/13 11/15/13 Field
documentation 11/22/13
Analyze split-samples Laboratories 10/22/13 12/06/13 Sample receipt acknowledgement
Within 24 hours of sample receipt
Conduct audits at up to two ERM/US Magnesium laboratory locations
PWT3 Geochemist 11/11/13 11/29/13 Audit findings
report 12/31/13
Submit split-sample analytical result deliverables Laboratories 11/04/13 12/13/13 Lab reports and EDDs 12/13/13
Conduct data verification/validation
PWT3 Chemist /Analytical Coordinator, PWT3 Geochemist
receipt of analytical results from laboratories
NA Data verification and validation report
01/17/14
Upload data to the Scribe database PWT3
receipt of analtyial results from laboratories and updated with validation qualifiers
NA Publish data on Scribe.net as completed
Report field oversight observations and split-sample results PWT3 TBD
30 days after the EPA and ERM/US Magnesium analytical results have been validated and uploaded into the database
TBD TBD

Phase 1A RI Oversight QAPP Section D: Sampling and Analysis Worksheet #17 Revision: 0 US Magnesium NPL Site October 2013
Page 40 of 100
17.0 SAMPLE COLLECTION (QAPP WORKSHEET #17)
This WS describes the oversight and split sampling field activities and data collection for conducting soil, sediment, solid waste, and water sampling for the Phase 1A RI. The EPA’s Contract Laboratory Program Guidance for Field Samplers (EPA 2011) was consulted frequently during preparation of this Oversight QAPP and has been incorporated, as applicable.
17.1 SAMPLING PROCESS DESIGN
WS#11, WS#14, and WS#18 describe the sampling design and rationale in terms of the media that will be sampled, the analytical groups that will make up the analytical suite, the sampling methods and locations, and the number of samples to be collected.
The following sections describe sample collection, packaging, and shipping procedures. General considerations pertaining to decontamination and IDW are also described. PWT SOPs for the Phase 1A oversight and split sampling conform to the requirements and guidelines of the EPA quality system, as established in EPA QA/G-6: Guidance for Preparing Standard Operating Procedures (EPA 2007).
17.2 SAMPLE COLLECTION PROCEDURES
The ERM/US Magnesium field team will collect and process all samples and measure all field parameters according to the procedures outlined in the Phase 1A RI SAP and associated SOPs. PWT3 will conduct oversight of the field sampling procedures for consistency with the sampling procedures identified in the Phase 1A RI SAP and the associated SOPs.
PWT’s field SOPs are included in Attachment 17A of this Oversight QAPP. These SOPs provide technical guidance and methods for field activities (for example, handling environmental samples from initial collection to shipping/delivery to the labs). The PWT3 Project Manager has signed the SOPs, confirming they are appropriate for use in conjunction with this Oversight QAPP. The SOPs may require review, revision, and reauthorization on an as-needed basis. Each SOP will be assigned an identification number, which will be included on the Title Page and all subsequent page headers along with the revision number and approval date. Consistent with the Phase 1A RI SAP, any PWT3 field modifications to the SOPs for this Oversight QAPP will require completion and signing of a Field Modification Approval Form (Attachment 14C). All completed and approved documentation will be placed in Attachment 17B.
The general plan for obtaining split samples of soil, sediment, solid waste and water is to provide a PWT3 sample container to ERM/US Magnesium and have them fill the sample container after all field sample processing has been completed. ERM/US Magnesium will perform any sample testing and balancing/preservation procedure needed for the EPA split samples. PWT3 will classify and log all split samples of solids according to the Unified Soil Classification System.
For saturated sediment samples intended for VOCs analysis, an EnCore® sampler will be used to collect samples for analysis of VOCs according to EPA Method 5035. PWT3 will provide the EnCore® sampling devices to ERM/US Magnesium for them to use at the point of sample collection. The EnCore® sampler will be deployed into undisturbed or minimally disturbed surface soil at each required sample location, or from a core sampling sleeve, and submitted for analysis.
PWT3 will accept the filled sample containers from ERM/US Magnesium and prepare them for shipping.
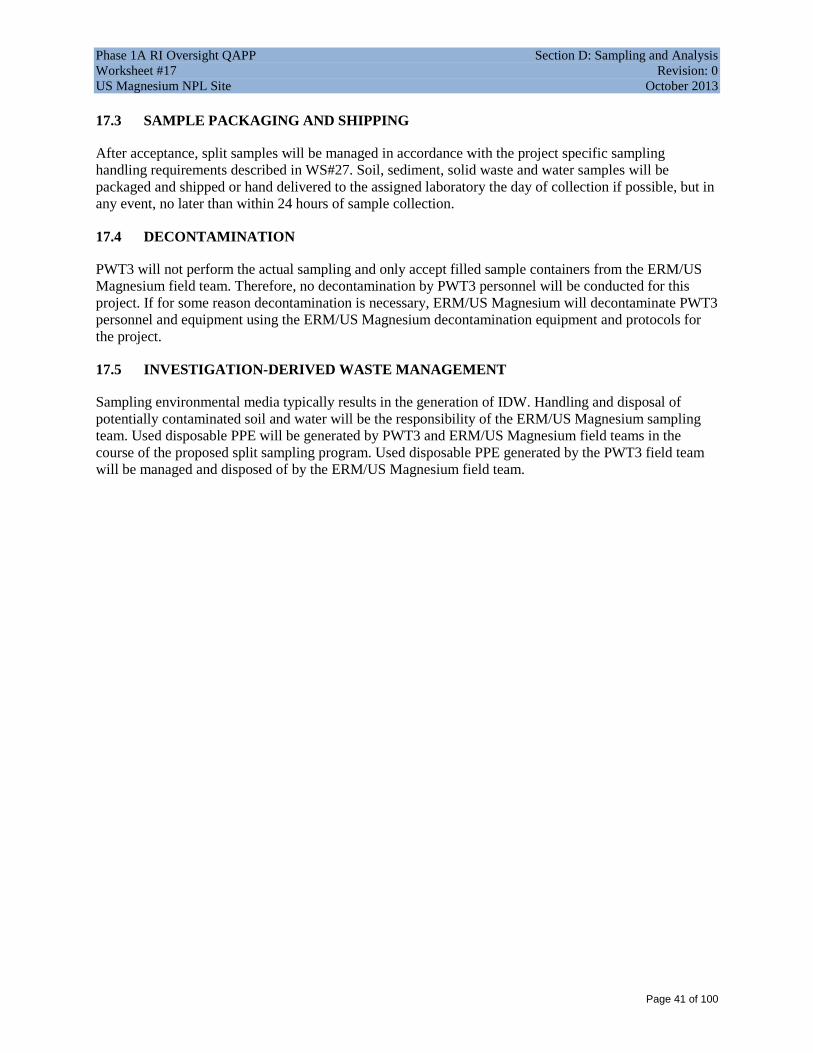
Phase 1A RI Oversight QAPP Section D: Sampling and Analysis Worksheet #17 Revision: 0 US Magnesium NPL Site October 2013
Page 41 of 100
17.3 SAMPLE PACKAGING AND SHIPPING
After acceptance, split samples will be managed in accordance with the project specific sampling handling requirements described in WS#27. Soil, sediment, solid waste and water samples will be packaged and shipped or hand delivered to the assigned laboratory the day of collection if possible, but in any event, no later than within 24 hours of sample collection.
17.4 DECONTAMINATION
PWT3 will not perform the actual sampling and only accept filled sample containers from the ERM/US Magnesium field team. Therefore, no decontamination by PWT3 personnel will be conducted for this project. If for some reason decontamination is necessary, ERM/US Magnesium will decontaminate PWT3 personnel and equipment using the ERM/US Magnesium decontamination equipment and protocols for the project.
17.5 INVESTIGATION-DERIVED WASTE MANAGEMENT
Sampling environmental media typically results in the generation of IDW. Handling and disposal of potentially contaminated soil and water will be the responsibility of the ERM/US Magnesium sampling team. Used disposable PPE will be generated by PWT3 and ERM/US Magnesium field teams in the course of the proposed split sampling program. Used disposable PPE generated by the PWT3 field team will be managed and disposed of by the ERM/US Magnesium field team.

Phase 1A RI Oversight QAPP Section D: Sampling and Analysis Worksheet #18 Revision: 0 US Magnesium NPL Site October 2013
Page 42 of 100
18.0 SAMPLING LOCATIONS AND METHODS / SOP REQUIREMENTS (QAPP WORKSHEET #18)
The sampling locations and specific rationale for each sample location is provided in the figures and tables corresponding to WS#14 of the Phase 1A RI SAP.
The general approach for selecting locations for the split samples has been organized by PRI areas because COPCs selection will be on a PRI area basis. For surface soil, sediment, and solid waste samples, the locations where the split samples will be collected will be based on a minimum percentage per PRI and matrix, and will also be based on professional judgment. Professional judgment in the field will consider split sampling locations based on odors, sample discoloration, elevated photo-ionization detector (PID) readings, or other reasons. PWT3 will target areas within each PRI area expected to be at the higher end of the distribution of contaminant concentration values. A higher percentage of split samples (approximately 20 percent) will be collected from surface solid media samples in the inner, more contaminated PRI areas (PRI Areas 1 through 9). A lower percentage of split samples will be collected for surface solid media samples in the outer, less contaminated PRI areas (PRI Areas 10 through 16). However, a minimum of two split samples will be collected from each PRI to adequately assess reproducibility.
At least one subsurface solid media split sample will be collected from the 2-foot intervals in each subsurface boring. The subsurface split sample will be collected from sampling intervals based on professional judgment. If there is not sufficient recovery in any of the boring sampling intervals to collect a split sample from that boring location and interval, PWT3 will immediately advise ERM/US Magnesium and the EPA of the need for consultation and direction from the EPA.
The EPA split samples will be collected from approximately 20 percent of the surface water and groundwater sample locations. A minimum of two split samples will be collected from water sample locations in each PRI to adequately assess reproducibility, with the exception of PRI Area 8 where only one surface water sampling location is proposed. The split sampling locations within each PRI area will be selected based on proximity to contaminant sources and based on professional judgment.
For the initial round of sampling at PRI Areas 2 and 8 through 17, the estimated number of split samples is 38, which constitutes approximately 11 percent of the 346 samples estimated for collection based on the Phase 1A RI SAP. The target number of EPA split samples per sample type within each PRI area is identified in Table 14-2 in WS#14 of this Oversight QAPP. Specific sample locations will be identified in the field.

Phase 1A RI Oversight QAPP Section D: Sampling and Analysis Worksheet #19 Revision: 0 US Magnesium NPL Site October 2013
Page 43 of 100
19.0 ANALYTICAL SOP REQUIREMENTS (QAPP WORKSHEET #19)
Table 19-1 lists the requirements for analytical methods and SOPs for solid and aqueous media. The requirements for the CLP analytical methods were compiled based on the CLP Statement of Work and the EPA Contract Laboratory Program Guidance for Field Samplers (EPA 2011a). The CLP Statement of Work for each analytical group can be found at http://www.epa.gov/superfund/programs/clp/analytic.htm. The non-CLP laboratories were not selected at the time this Oversight QAPP was prepared; therefore, laboratory-specific SOPs were not available to populate this table. Non-CLP laboratory SOPs will be included in Attachment 19A when/as they become available. The preservation and holding time requirements for the analytical methods conducted by the non-CLP laboratories are based on the requirements of the analytical methods and are not expected to change. The sample containers and sample volume however, may be modified based on the preference of the individual laboratory performing the analyses.
Table 19-1: Analytical SOP Requirements for Solid and Aqueous Media
Matrix Analytical Group
Analytical and Preparation Method/SOP Reference1
Sample Container Size and
Type
Number of Sample Containers / Required Sample Volume
Preservation Requirements
Maximum Holding Time1
(preparation / analysis)
Soil, Sediment, and Solid Waste
Solids PCBs CLP SOW CBC01.2
4 oz glass jar with
Teflon®-lined lid
One 4oz glass jar (incl. one additional 4 oz glass jar
for MXS/MSD sample)
Cool sample to 4°C (±2°C) immediately
after collection 45 days
Solids PCDD/PCDF CLP SOW DLM02.2
4 oz amber glass jar
with Teflon®-lined lid
One 4 oz amber glass jar (incl. one additional 4 oz amber glass jar for MXS/MSD sample)
Cool sample to 4°C (±2°C)
immediately after collection
30 days for extraction and 45 days for analysis
Solids PAHs CLP SOW SOM01.2/02.1 SIM
8 oz glass jar with
Teflon®-lined lid
One 8 oz glass jar (incl. one additional 8 oz glass jar
for MXS/MSD sample)
Cool sample to 4°C (±2°C) immediately
after collection 14 days
Solids SVOCs CLP SOW SOM01.2/02.1
8 oz glass jar with
Teflon®-lined lid
One 8 oz glass jar (incl. one additional 8 oz glass jar
for MXS/MSD sample)
Cool sample to 4°C (±2°C)
immediately after collection
14 days
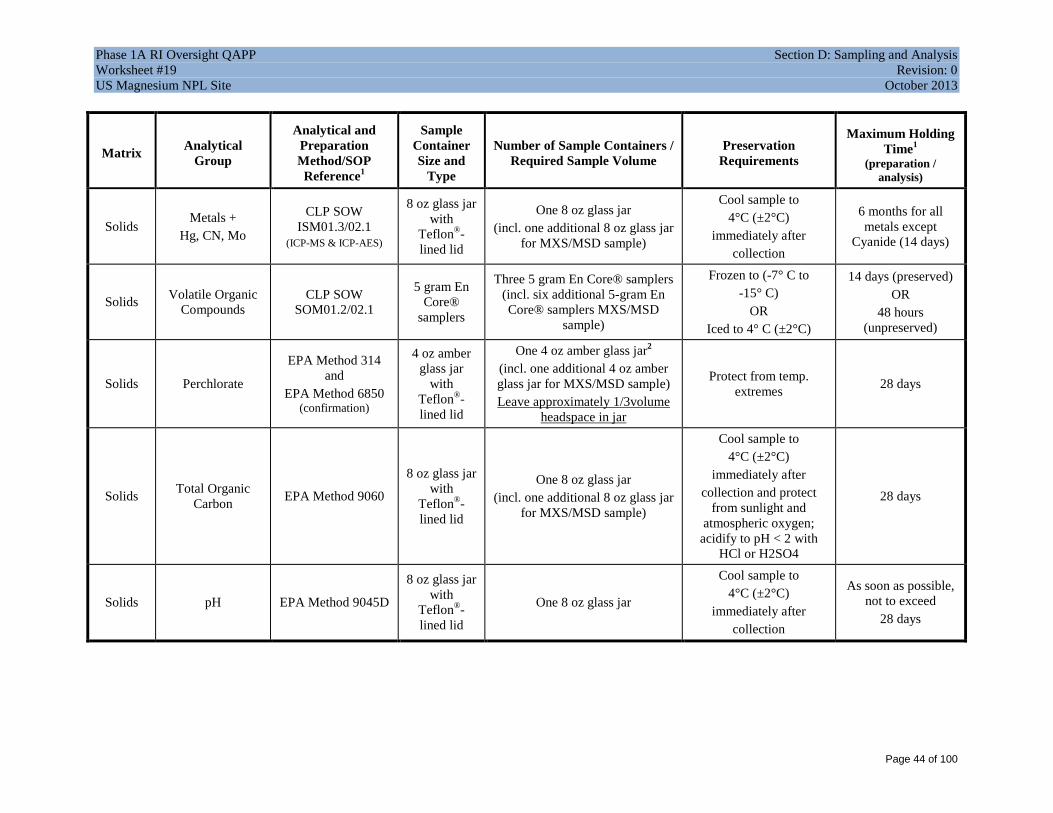
Phase 1A RI Oversight QAPP Section D: Sampling and Analysis Worksheet #19 Revision: 0 US Magnesium NPL Site October 2013
Page 44 of 100
Matrix Analytical Group
Analytical and Preparation Method/SOP Reference1
Sample Container Size and
Type
Number of Sample Containers / Required Sample Volume
Preservation Requirements
Maximum Holding Time1
(preparation / analysis)
Solids Metals + Hg, CN, Mo
CLP SOW ISM01.3/02.1
(ICP-MS & ICP-AES)
8 oz glass jar with
Teflon®-lined lid
One 8 oz glass jar (incl. one additional 8 oz glass jar
for MXS/MSD sample)
Cool sample to 4°C (±2°C)
immediately after collection
6 months for all metals except
Cyanide (14 days)
Solids Volatile Organic Compounds
CLP SOW SOM01.2/02.1
5 gram En Core®
samplers
Three 5 gram En Core® samplers (incl. six additional 5-gram En Core® samplers MXS/MSD
sample)
Frozen to (-7° C to -15° C)
OR Iced to 4° C (±2°C)
14 days (preserved) OR
48 hours (unpreserved)
Solids Perchlorate
EPA Method 314 and
EPA Method 6850 (confirmation)
4 oz amber glass jar
with Teflon®-lined lid
One 4 oz amber glass jar2 (incl. one additional 4 oz amber glass jar for MXS/MSD sample) Leave approximately 1/3volume
headspace in jar
Protect from temp. extremes 28 days
Solids Total Organic Carbon EPA Method 9060
8 oz glass jar with
Teflon®-lined lid
One 8 oz glass jar (incl. one additional 8 oz glass jar
for MXS/MSD sample)
Cool sample to 4°C (±2°C)
immediately after collection and protect
from sunlight and atmospheric oxygen;
acidify to pH < 2 with HCl or H2SO4
28 days
Solids pH EPA Method 9045D
8 oz glass jar with
Teflon®-lined lid
One 8 oz glass jar
Cool sample to 4°C (±2°C)
immediately after collection
As soon as possible, not to exceed
28 days

Phase 1A RI Oversight QAPP Section D: Sampling and Analysis Worksheet #19 Revision: 0 US Magnesium NPL Site October 2013
Page 45 of 100
Matrix Analytical Group Analytical and
Preparation Method
Sample Container Size
and Type
Number of Sample Containers / Required
Sample Volume
Preservation Requirements
Maximum Holding Time (preparation /
analysis) Water
Water PCB CLP SOW CBC01.2
1 L amber glass bottle
One 1 L amber glass bottle and one additional 1 L amber glass bottle for MXS/MSD
sample
Cool sample to 4°C (±2°C) immediately after
collection. 45 days
Water PCDD/PCDF CLP SOW DLM02.2
1 L amber glass bottle
One 1 L amber glass bottle and one additional 1 L amber glass bottle for MXS/MSD
sample
Cool sample to 4°C (±2°C) immediately after
collection.
30 days for extraction and 45 days for analysis
Water PAHs CLP SOW SOM01.2/02.1 SIM
1 L amber glass bottle
Two 1 L amber glass bottles (incl. 4 additional 1 L amber
glass bottles MXS/MSD sample)
Cool sample to 4°C (±2°C) immediately after
collection. 7 days
Water SVOCs CLP SOW SOM01.2/02.1
1 L amber glass bottle
Two 1 L amber glass bottles (incl. 4 additional 1 L amber glass bottles for MXS/MSD
sample)
Cool sample to 4°C (±2°C) immediately after
collection. 7 days
Water VOCs CLP SOW SOM01.2/02.1 40 mL glass vial
Three 40 mL vials (incl. 6 additional 40 ml vials
for MXS/MSD sample)
Acidify to a pH of 2 with HCl and cool sample to 4°C (±2ºC) immediately
after collection
14 days
Water Metals (Total) + Hg, CN, Mo
CLP SOW ISM01.3/02.1
(ICP-MS)
1 L HDPE bottle for metals, Hg,
Mo; 1 liter HDPE bottle for
CN
One 1 L HDPE bottle for metals, Hg, Mo (incl. one
additional 1 L HDPE bottle for MXS/MSD sample);
One 1 L HDPE bottle CN (incl. one additional 1 L
HDPE bottle for MXS/MSD sample)
Acidify to pH < 2 with HNO3 and cool sample to 4°C (±2°C) immediately
after collection (NaOH for CN3)
6 months for all metals except
Mercury (28 days) and Cyanide (14
days)

Phase 1A RI Oversight QAPP Section D: Sampling and Analysis Worksheet #19 Revision: 0 US Magnesium NPL Site October 2013
Page 46 of 100
Matrix Analytical Group Analytical and
Preparation Method
Sample Container Size
and Type
Number of Sample Containers / Required
Sample Volume
Preservation Requirements
Maximum Holding Time (preparation /
analysis)
Water Metals (Dissolved) + Hg, CN, Mo
CLP SOW ISM02.1 (ICP-MS)
1 L HDPE bottle for metals, Hg,
Mo; 1 liter HDPE bottle for
CN
One 1 L HDPE bottle for metals, Hg, Mo (incl. one
additional 1 L HDPE bottle for MXS/MSD sample);
One 1 L HDPE bottle CN (incl. one additional 1 L
HDPE bottle for MXS/MSD sample)
Acidify to pH < 2 with HNO3 and cool sample to 4°C (±2°C) immediately
after collection
6 months for all metals except
Mercury (28 days) and Cyanide (14
days)
Water Haloacetic Acids EPA Method 552.2 250 mL amber glass bottle
One 250 mL amber glass bottle (incl. one additional 250 mL amber glass bottle
for MXS/MSD sample)
Acidify to pH < 2 with NH4Cl3, and cool sample
to 4°C (±2°C) immediately after
collection
14 days
Water Perchlorate EPA Method 6850 125 mL HDPE bottle
Two 125 mL polyethylene bottles (incl. two additional 125 mL polyethylene bottles
for MXS/MSD sample)
Filter; Protect from temp. extremes 28 days
Water Anions EPA Method 300.0 500 mL HDPE bottle
One 500 mL HDPE bottle (incl. one additional 500 mL HDPE bottle for MXS/MSD
sample)
Cool sample to 4°C (±2°C) immediately after
collection.
48 hours (nitrate and nitrite);
28 days (others)
Water Alkalinity SM 2320B 250 mL HDPE bottle
One 250 mL HDPE bottle (incl. one additional 250 mL HDPE bottle for MXS/MSD
sample)
Cool sample to 4°C (±2°C) immediately after
collection. 14 days
Water Total Dissolved Solids SM 2540C 250 mL HDPE
bottle
One 250 mL polyethylene bottle (incl. one additional
250 mL polyethylene bottle for MXS/MSD sample)
Cool sample to 4°C (±2°C) immediately after
collection. 7 days

Phase 1A RI Oversight QAPP Section D: Sampling and Analysis Worksheet #19 Revision: 0 US Magnesium NPL Site October 2013
Page 47 of 100
Matrix Analytical Group Analytical and
Preparation Method
Sample Container Size
and Type
Number of Sample Containers / Required
Sample Volume
Preservation Requirements
Maximum Holding Time (preparation /
analysis)
Water Total Organic Carbon EPA Method 9060 500 mL HDPE
bottle
One 500 mL HDPE bottle (incl. one additional 500 mL HDPE bottle for MXS/MSD
sample)
Cool sample to 4°C (±2°C)
immediately after collection and protect
from sunlight and atmospheric oxygen;
acidify to pH < 2 with HCl or H2SO4.
28 days
Water Hexavalent Chromium
EPA Method 7199 Modified (ASC-
083.1 Equivalent)
250 mL HDPE bottle
One 250 mL HDPE bottle (incl. one additional 250 mL HDPE bottle for MXS/MSD
sample)
Cool sample to 4°C (±2°C) immediately after
collection. 24 hours
Notes: 1. Maximum holding time is calculated from the time the sample is collected to the time the sample is prepared/extracted (not VTSR). 2. One 4-ounce jar should be collected for perchlorate analysis of solids; both analytical methods can be performed using the same sample
container. 3. Sufficient ammonium chloride (NH4Cl) and sodium arsenite (NaAsO2) must be added for HAA and cyanide analyses, respectively, to
remove chlorine. Chlorine removal must be verified at the time of sample collection using a test strip or test kit.

Phase 1A RI Oversight QAPP Section D: Sampling and Analysis Worksheet #20 Revision: 0 US Magnesium NPL Site October 2013
Page 48 of 100
20.0 FIELD QUALITY CONTROL SAMPLE SUMMARY (QAPP WORKSHEET #20)
Field QC samples to be collected by PWT3 during the Phase 1A RI split sampling will include field duplicates, MXS/MSD, and trip blanks. Field duplicates indicate precision of field collection methods, laboratory processing and analysis methods. An MXS/MSD is a representative sample that is spiked with target analytes of interest in the laboratory prior to being taken through the entire analytical process in order to evaluate analytical bias for an actual matrix and to evaluate overall precision. MXS/MSD results are examined to evaluate the impact of matrix effects on overall analytical performance and the potential usability of the data. Extra sample volume will be submitted for MXS/MSD analysis on project-specific samples for each analysis of each matrix (solids and water); however, MXS/MSDs will be run on every batch of typically 20 samples or less for each analysis. The MXS/MSD sample volume will be collected from PRI areas excepted to be on the higher end of the contaminant concentration range amongst PRI areas based on historical data.
A trip blank demonstrates that volatile contamination is not originating from sample containers or from any factor during sample transport. A trip blank originates at the laboratory as a 40-milliliter vial filled at the laboratory with reagent-grade, organic-free water. The trip blanks are then transported to the Site with the empty containers/coolers that will be used for sample collection. The trip blanks will be stored in the empty containers/coolers until the proposed field samples have been collected. One trip blank will accompany each sample transport container that holds samples for analysis of VOCs back to the laboratory. The trip blank will not be opened until it is returned to the laboratory for analysis of VOCs.
The EPA split sampling program will not include split samples of equipment rinsate samples or source water blanks because those samples will be provided by ERM/US Magnesium. Table 20-1 identifies the number and type of QC samples to be collected by PWT3 during the Phase 1A RI split sampling field effort for PRI Areas 2 and 8 through 17. Table 20-1 will be updated to estimate the number of split samples for PRI Areas 1, 3 through 7, and 18 prior to initiation of those phases of sampling.
Table 20-1: Field QC Requirements for Solid and Aqueous Media
Matrix Analytical Groupa No. of Split Samples Collected
No. of Field Duplicatesd
No. of MXS/MSDsb
No. of Equip. Blanks
No. of Trip Blanksc
Total No. of Samples
PRI Area 1, Ditches Soil/sediment/solid waste All Analytical Groups 6 1 0/0 0 1 8
PRI Area 2, Landfill Soil/sediment/solid waste All Analytical Groups 5 0 9/9 0 1 24
PRI Area 3, Sanitary Lagoon Soil/sediment/solid waste All Analytical Groups 3 1 0/0 0 1 5

Phase 1A RI Oversight QAPP Section D: Sampling and Analysis Worksheet #20 Revision: 0 US Magnesium NPL Site October 2013
Page 49 of 100
Matrix Analytical Groupa No. of Split Samples Collected
No. of Field Duplicatesd
No. of MXS/MSDsb
No. of Equip. Blanks
No. of Trip Blanksc
Total No. of Samples
PRI Area 4, Gypsum Pile Soil/sediment/solid waste All Analytical Groups 3 0 0/0 0 1 4
PRI Area 5, Southeast Ponded Waste Lagoon Soil/sediment/solid waste All Analytical Groups 5 0 9/9 0 1 24
PRI Area 6, Northwest Ponded Waste Lagoon Soil/sediment/solid waste All Analytical Groups 4 1 0/0 0 1 6
PRI Area 7, Northeast Ponded Waste Lagoon Soil/sediment/solid waste All Analytical Groups 4 0 0/0 0 1 5
PRI Area 8, Northwest Lagoon Overflow Soil/sediment/solid waste All Analytical Groups 4 0 0/0 0 1 5
PRI Area 9, Smut Area Soil/sediment/solid waste All Analytical Groups 3 0 0/0 0 0 3
PRI Area 10, Barium Sulfate Area Soil/sediment/solid waste All Analytical Groups 3 1 0/0 0 0 4
PRI Area 11, ATI Titanium Plant and US Magnesium Parking Lots Soil/sediment/solid waste All Analytical Groups 2 0 0/0 0 0 2
PRI Area 12, Ancillary Worker Exposure Area Soil/sediment/solid waste All Analytical Groups 2 0 0/0 0 0 2
PRI Area 13, Buffer Area North and East Soil/sediment All Analytical Groups 2 0 0/0 0 0 2 PRI Area 14, Buffer Area South Soil/sediment All Analytical Groups 3 0 0/0 0 1 4 PRI Area 15, Buffer Area West

Phase 1A RI Oversight QAPP Section D: Sampling and Analysis Worksheet #20 Revision: 0 US Magnesium NPL Site October 2013
Page 50 of 100
Matrix Analytical Groupa No. of Split Samples Collected
No. of Field Duplicatesd
No. of MXS/MSDsb
No. of Equip. Blanks
No. of Trip Blanksc
Total No. of Samples
Soil/sediment All Analytical Groups 2 1 0/0 0 0 3 PRI Area 16, Lakeside Mountain Buffer Area Soil/sediment All Analytical Groups 2 0 0/0 0 0 2 PRI Area 17, Site-Wide Water Water All Analytical Groups 12 1 14/14 0 6 47
Notes: a. Refer to WS#12. b. This table shows the number of MXS and MSD samples to be collected for MXS/MSDs to be run on project-specific samples; however, MXS/MSDs
will be run on every batch for each analyses (there are 9 analyses for solids and up to 14 analyses for water). c. The number of trip blanks is estimated; and is determined as one per cooler containing samples for VOC analysis, as indicated in WS#12. d. Field duplicates do not have to be collected at the PRI’s indicated. The overall approach is that they will be collected at a frequency of 10 percent, and
the locations may vary depending on Site conditions and available sample volumes. .

Phase 1A RI Oversight QAPP Section D: Sampling and Analysis Worksheet #21 Revision: 0 US Magnesium NPL Site October 2013
Page 51 of 100
21.0 PROJECT SAMPLING SOP REFERENCES (QAPP WORKSHEET #21)
See the Phase 1A RI SAP for ERM’s sampling SOPs. The following is a reference list of all relevant SOPs to be used by PWT3 in support of oversight activities at the Site. The SOPs are included in Attachment 17A.
Table 21-1: Project Sampling SOP References SOP Reference Number
Title, Revision Date and/or Number
Originating Organization
Equipment Type Modified for Project Work? (Y/N)
Comments
PWT-130-406 Sample Handling, Rev. 2.1, dated 10/8/13 PWT Refer to SOP Yes
Minor modifications for project-specific
instructions consistent with this QAPP

Phase 1A RI Oversight QAPP Section E: Quality Assurance Revision: 0 US Magnesium NPL Site October 2013
Page 52 of 100
SECTION E: QUALITY ASSURANCE
QAPP WORKSHEETS #22-37

Phase 1A RI Oversight QAPP Section E: Quality Assurance Worksheet #22 Revision: 0 US Magnesium NPL Site October 2013
Page 53 of 100
22.0 FIELD EQUIPMENT CALIBRATION, MAINTENANCE, TESTING, AND INSPECTION (QAPP WORKSHEET #22)
The following table summarizes the calibration, maintenance, testing, and inspection of all field equipment to be used by the PWT3 field team during the Phase 1A RI. The majority of field equipment that will be used during the Phase 1A RI will be used and maintained by the ERM/US Magnesium field team.
Table 22-1: Oversight Field Equipment
Field Equipment Parameters Measured Activity Frequency Acceptance
Criteria Corrective
Action Responsible Person SOP Reference
Industrial Scientific MX6 iBrid™ Multi-Gas Monitor
VOCs / CO / 02 / Cl2 / HCl Calibration Once per
month Per manufacturer’s
instructions
Recalibrate, recharge battery
Equipment rental company and PWT3 Field Team Leader
Manufacturer’s SOP
TSI DUSTTRAK II Aerosol Monitor 8520 Aerosol (dust) Calibration Annually Per manufacturer’s
instructions
Recalibrate, recharge battery
Equipment rental company and PWT3 Field Team Leader
Manufacturer’s SOP

Phase 1A RI Oversight QAPP Section E: Quality Assurance Worksheet #23 Revision: 0 US Magnesium NPL Site October 2013
Page 54 of 100
23.0 ANALYTICAL SOP REFERENCES (QAPP WORKSHEET #23)
The analytical SOPs for solid and aqueous media are presented in the table below. The CLP Statement of Work for each analytical group can be found at http://www.epa.gov/superfund/programs/clp/analytic.htm. The non-CLP laboratories were not selected at the time this Oversight QAPP was prepared; therefore, laboratory-specific SOPs are not available to reference. Non-CLP laboratory SOPs will be provided in Attachment 19A when they become available.

Phase 1A RI Oversight QAPP Section E: Quality Assurance Worksheet #23 Revision: 0 US Magnesium NPL Site October 2013
Page 55 of 100
Table 23-1: Analytical SOP References for Solid and Aqueous Media
Laboratory SOP
Number
Title, Revision Date, and Numbera
Definitive or
Screening Data
Analytical Group
and Matrix
Instrument Organization Performing
Analysis Modifications for Project Workb
NA
Multi-Media, Multi-Concentration
Chlorinated Biphenyl Congeners Analysis,
December 2009, CLP SOW CBC01.2
Definitive
PCBs in
Solids and Water
HRGC / HRMS
CLP
• Log sample for high-level or low-level analysis as indicated on the associated chain-of-custody, which is based on criteria discussed in WS-WI-0037, Attachment 2.
• As appropriate for high-level samples, some reduction of sample volume or mass of sample to be extracted is allowed so as to reduce the mass of the target analytes in the initial extracts. However, multiple dilutions and analyses may be required to meet project specific requirements. Dilutions should be prepared as described in WS-WI-0037, Attachment 2. As appropriate for high-level samples, dilute extracts to the degree necessary, provided the analyses still meet project data use requirements and retaining quantitation by isotope dilution.
• For high-level results greater than the calibration range or the linear response range of the detector, reanalyze the samples at a more appropriate dilution as described in WS-WI-0037, Attachment 2. If results from high-level sample analyses are less than the sample specific practical quantitation limits, the analysis should be performed using a lower-level approach as described in WS-WI-0037, Attachment 2. If dilutions result in data that do not meet the project required TQLs or the laboratory specific MRLs approved by the EPA and listed in WS#15 of the Phase 1A RI SAP, multiple dilutions or corrective action may be needed. The laboratory should contact the EPA’s Analytical Program Manager immediately such that appropriate action can be implemented.

Phase 1A RI Oversight QAPP Section E: Quality Assurance Worksheet #23 Revision: 0 US Magnesium NPL Site October 2013
Page 56 of 100
Laboratory SOP
Number
Title, Revision Date, and Numbera
Definitive or
Screening Data
Analytical Group
and Matrix
Instrument Organization Performing
Analysis Modifications for Project Workb
NA
Multi-Media, Multi-Concentration Dioxins and Furans Analysis,
December 2009, CLP SOW DLM02.2
Definitive
PCDDs / PCDFs
in Solids and
Water
HRGC / HRMS CLP
• Log sample for high-level or low-level analysis as indicated on the associated chain-of-custody, which is based on criteria discussed in WS-WI-0037, Attachment 1.
• As appropriate for high-level samples, some reduction of sample volume or mass of sample to be extracted is allowed so as to reduce the mass of the target analytes in the initial extracts. However, multiple dilutions and analyses may be required to meet project specific requirements. Dilutions should be prepared as described in WS-WI-0037, Attachment 1. As appropriate for high-level samples, dilute extracts to the degree necessary, provided the analyses still meet project data use requirements and retaining quantitation by isotope dilution.
• For high-level results greater than the calibration range or the linear response range of the detector, reanalyze the samples at a more appropriate dilution as described in WS-WI-0037, Attachment 1. If results from high-level sample analyses are less than the sample specific PQLs, the analysis should be performed using a lower-level approach as described in WS-WI-0037, Attachment 1. If dilutions result in data that do not meet the project required TQLs or the laboratory specific MRLs approved by the EPA and listed in WS#15 of the Phase 1A RI SAP, multiple dilutions or corrective action may be needed. The laboratory should contact the EPA’s Analytical Program Manager immediately such that appropriate action can be implemented.

Phase 1A RI Oversight QAPP Section E: Quality Assurance Worksheet #23 Revision: 0 US Magnesium NPL Site October 2013
Page 57 of 100
Laboratory SOP
Number
Title, Revision Date, and Numbera
Definitive or
Screening Data
Analytical Group
and Matrix
Instrument Organization Performing
Analysis Modifications for Project Workb
NA
Multi-Media, Multi-Concentration
Organics Analysis, September 2013,
CLP SOW SOM01.2/02.1
Definitive SVOCs in Solids and
Water GC/MS CLP
• Log sample for high-level or low-level analysis as indicated on the associated chain-of-custody.
• As appropriate for high-level samples, dilute extracts as described in WS-WI-0037, Attachment 3.
• Apply silica gel cleanup to samples including MXS/MSDs and other appropriate sample extraction cleanup techniques (cleanups may also include, but not necessarily limited to the following: polymeric reversed-phase cartridge and gel permeation chromatography cleanup).
• Use MXS/MSD results to verify cleanup method performance for samples.
• If select SVOCs are not detected above sample specific adjusted PQLs or MRLs during analysis in Full Scan mode, perform confirmation analysis using SIM for the following SVOCs: 2,4,6-trichlorophenol, HCB, hexachlorobutadiene, NDMA, and pentachlorophenol.
• For high-level results greater than the calibration range or the linear response range of the detector, reanalyze the samples at a more appropriate dilution.
• If results from high-level sample analysis are less than the sample specific PQLs, the analysis should be performed using a lower-level approach. If dilutions result in data that do not meet the project required TQLs or the laboratory specific MRLs approved by the EPA and listed in WS#15 of the Phase 1A RI SAP, additional analyses or corrective actions should be implemented. The laboratory should contact the EPA’s Analytical Program Manager immediately such that the appropriate action is taken.

Phase 1A RI Oversight QAPP Section E: Quality Assurance Worksheet #23 Revision: 0 US Magnesium NPL Site October 2013
Page 58 of 100
Laboratory SOP
Number
Title, Revision Date, and Numbera
Definitive or
Screening Data
Analytical Group
and Matrix
Instrument Organization Performing
Analysis Modifications for Project Workb
NA
Multi-Media, Multi-Concentration
Organics Analysis, September 2013,
CLP SOW SOM01.2/02.1
Definitive
PAHs in
Solids and Water
GC/MS CLP
• Apply silica gel cleanup to samples including MXS/MSDs and other appropriate sample extraction cleanup techniques (cleanups may also include, but not necessarily limited to the following: polymeric reversed-phase cartridge and gel permeation chromatography cleanup) as described in WS-WI-0037, Attachment 8.
• Use MXS/MSD results to verify cleanup method performance for samples.
• For high-level results greater than the calibration range or the linear response range of the detector, reanalyze the samples at a more appropriate dilution.
• If results from high-level sample analysis are less than the sample specific PQLs, the analysis should be performed using a lower-level approach. If dilutions result in data that do not meet the project required TQLs or the laboratory specific MRLs approved by the EPA and listed in WS#15 of the Phase 1A RI SAP, additional analyses or corrective action should be implemented. The laboratory should contact the EPA’s Analytical Program Manager immediately such that the appropriate action is taken.
NA
Multi-Media, Multi-Concentration
Organics Analysis, September 2013,
CLP SOW SOM01.2/02.1
Definitive
VOCs in
Solids and Water
GC/MS CLP
• Note any indications of sample reactivity or off-gassing, such as pressurized containers or missing EnCore® sampler caps.
• Use methanol field extracted sample when concentration in samples warrant a medium level preparation.

Phase 1A RI Oversight QAPP Section E: Quality Assurance Worksheet #23 Revision: 0 US Magnesium NPL Site October 2013
Page 59 of 100
Laboratory SOP
Number
Title, Revision Date, and Numbera
Definitive or
Screening Data
Analytical Group
and Matrix
Instrument Organization Performing
Analysis Modifications for Project Workb
NA
Multi-Media, Multi-Concentration
Inorganics Analysis, September 2013,
CLP SOW ISM01.3/02.1
Definitive
Metals in
Solids and Water
ICP / ICP MS CLP
• All samples will be considered high level for select analytes as described in WS-WI-0037, Attachment 4.
• Samples will be diluted as described in WS-WI-0037, Attachment 4.
• Perform all ICPMS analyses using Collision Cell Technology.
• If dilutions result in data that do not meet the project required TQLs or the laboratory specific MRLs approved by the EPA and listed in WS#15 of the Phase 1A RI SAP, additional low level analyses or other corrective action should be implemented. The laboratory should contact the EPA’s Analytical Program Manager as soon as possible such that the appropriate action can be taken.
NA
Multi-Media, Multi-Concentration
Inorganics Analysis, September 2013,
CLP SOW ISM01.3/02.1
Definitive
Mercury in
Solids and Water
CVAA CLP
• If dilutions result in data that do not meet the project required TQLs or the laboratory specific MRLs approved by the EPA and listed in WS#15 of the Phase 1A RI SAP, additional low level analyses or other corrective action should be implemented. The laboratory should contact the EPA’s Analytical Program Manager as soon as possible such that the appropriate action can be taken.
NA
Multi-Media, Multi-Concentration
Inorganics Analysis, September 2013,
CLP SOW ISM01.3/02.1
Definitive
Cyanide in
Solids and Water
Lachat Auto-
analyzer CLP
• Lab should verify pH upon sample receipt is greater than 12 pH units and if not should readjust using sodium hydroxide as required by the method and note pH measured upon receipt in case narrative.

Phase 1A RI Oversight QAPP Section E: Quality Assurance Worksheet #23 Revision: 0 US Magnesium NPL Site October 2013
Page 60 of 100
Laboratory SOP
Number
Title, Revision Date, and Numbera
Definitive or
Screening Data
Analytical Group
and Matrix
Instrument Organization Performing
Analysis Modifications for Project Workb
TBD
Perchlorate in Water and Solid samples
Wastes Using High Performance Liquid Chromatography /
Electrospray Ionization /
Mass Spectrometry (HPLC/ESI/MS or
HPLC/ESI/MS/MS), Rev. 0, January 2007,
EPA Method 6850
Determination of Perchlorate in Soil by Ion Chromatography
[Method 314.0], Revision 5,
December 19, 2012
Definitive
Perchlorate in
Solids and Water
HPLC/ESI/MS or
HPLC/ESI/MS/MS for solids and water with screening using IC for solid samples
TBD
• Perform analysis of all water samples using EPA Method 6850.
• Confirm all positive detections using Method 314.0 greater than and above the MDL in soil with Method 6850 as described in WS-WI-0037, Attachment 5.
• Apply cleanup using Ba/Ag/H cartridge up to two times. • Use MXS/MSD aliquots to verify cleanup method
performance. • Apply dilutions as appropriate to comply with maximum
conductivity requirements. • If dilutions result in data that do not meet the project
required TQLs or the laboratory specific MRLs approved by the EPA and listed in WS#15 of the Phase 1A RI SAP, additional low level analyses or other corrective action should be implemented. The laboratory should contact the EPA’s Analytical Program Manager as soon as possible such that the appropriate action can be taken.
TBD
Total Organic Carbon, Rev. 0,
September 1986, EPA Method 9060
Definitive TOC
in Solids and Water
Carbon-aceous
Analyzer
TBD for solids ESAT for
water
• None
TBD
Soil and Waste pH, Rev. 4,
November 2004, EPA Method 9045D
Definitive pH
in Solids pH meter ESAT
• None
TBD Determination of Percent Moisture
ASTM D2216 Definitive
Physical Parameters
in Soil Balance All Labs
• None

Phase 1A RI Oversight QAPP Section E: Quality Assurance Worksheet #23 Revision: 0 US Magnesium NPL Site October 2013
Page 61 of 100
Laboratory SOP
Number
Title, Revision Date, and Numbera
Definitive or
Screening Data
Analytical Group
and Matrix
Instrument Organization Performing
Analysis Modifications for Project Workb
TBD
Determination of Haloacetic Acids and Dalapon in Drinking
Water by Liquid-Liquid Extraction, Derivatization and
Gas Chromatography with
Electron Capture Detection, Rev. 1,
1995, EPA Method 552.2
Definitive
Haloacetic Acids
in Water
GC/ECD TBD
• None
TBD
Determination of Inorganic Anions by Ion Chromatography,
Rev. 2.1, August 1993,
EPA Method 300.0
Definitive Anions
in Water
IC ESAT
• Carry out dual anion analyses for all Site related samples. • Analyze first for chloride, bromide, and sulfate as
described in WS-WI-0037, Attachment 7. • After ion cartridge removal of chloride/ bromide/sulfate,
analyze samples for fluoride, nitrite, nitrate, and phosphate. • Use MXS/MSD aliquots to verify cleanup method
performance.
TBD Alkalinity
(Titrimetric, pH 4.5), Method SM 2320B
Definitive Alkalinity
in Water
Autotitrator TBD • None
TBD
Residue, Filterable (Gravimetric, Dried at
180°C), 1971, EPA Method 160.1
Definitive
Total Dissolved
Solids in Water
Gravimetric ESAT
• Apply a standard 24-hour drying period and follow instruction provided inWS-WI-0037, Attachment 6.
TBD
Determination of Hexavalent
Chromium, EPA Method 7199
Modified
Definitive
Hexavalent Chromium
in Water
IC/ICP /DRC/MS TBD
• None

Phase 1A RI Oversight QAPP Section E: Quality Assurance Worksheet #23 Revision: 0 US Magnesium NPL Site October 2013
Page 62 of 100
Notes: a. This column lists EPA reference methods that will be the basis for the methods and analytical SOPs applied in the Phase 1A RI. Laboratory SOPs
should provide data that are equivalent in quality and defensibility to the listed methods. b. Specific citations to laboratory SOPs (e.g., WS-WI-0037) reference those listed in Attachment 19A of the Phase 1A RI SAP. Copies of those laboratory
SOPs will be provided to the EPA Analytical Program and PWT3 subcontracted laboratories for consistency with ERM/US Magnesium analytical processes. Non-EPA laboratory SOPs provided herein offer a more detailed description of project specific requirements that may or may not agree with EPA CLP program protocols. The non-EPA laboratory is responsible for obtaining and applying all project SOPs referenced in this table even when they conflict with EPA CLP protocols. The EPA Analytical Program laboratory must contact the EPA Region 8 CLP laboratory coordinator before proceeding with any analyses where project requirements may differ from those provided in the related EPA CLP SOWs.

Phase 1A RI Oversight QAPP Section E: Quality Assurance Worksheet #24 Revision: 0 US Magnesium NPL Site October 2013
Page 63 of 100
24.0 ANALYTICAL INSTRUMENT CALIBRATION (QAPP WORKSHEET #24)
The calibration requirements for analytical instruments used for non-CLP methods are provided in WS#24 of the Phase 1A RI SAP. For analyses through the EPA CLP, instrument calibration will be in accordance with the applicable CLP SOW.
Phase 1A RI Oversight QAPP Section E: Quality Assurance Worksheet #25 Revision: 0 US Magnesium NPL Site October 2013
Page 64 of 100
25.0 ANALYTICAL INSTRUMENT AND EQUIPMENT MAINTENANCE, TESTING, AND INSPECTION (QAPP WORKSHEET #25)
The analytical instrument and equipment maintenance, testing, and inspection requirements for non-CLP methods are provided in WS#25 of the Phase 1A RI SAP. For analyses through the EPA CLP, instrument and equipment maintenance, testing, and inspection requirements will be in accordance with the applicable CLP SOW.

Phase 1A RI Oversight QAPP Section E: Quality Assurance Worksheet #26 Revision: 0 US Magnesium NPL Site October 2013
Page 65 of 100
26.0 SAMPLE HANDLING SYSTEM (QAPP WORKSHEET #26)
The sample handling system requirements for solid and aqueous media are provided in the table below, and are also summarized in PWT’s Sample Handling SOP (Attachment 17A). All samples and associated laboratory sample extracts will be archived and may be re-analyzed any time up to a year after collection depending on the analytical suite. Table 3-1 contains full contact information for personnel listed in Table 26-1.
Table 26-1: Sampling Handling System for Solid and Aqueous Samples
SAMPLE COLLECTION, PACKAGING, AND SHIPMENT Sample Collection (Personnel/Organization): Pacific Western Technologies, Ltd; Aaron Baird
Sample Packaging (Personnel/Organization): Pacific Western Technologies, Ltd; Aaron Baird
Coordination of Shipment (Personnel/Organization): Pacific Western Technologies, Ltd; Aaron Baird
Type of Shipment/Carrier: Overnight Carrier/FedEx
SAMPLE RECEIPT AND ANALYSIS Sample Receipt (Personnel/Organization): Laboratory Sample Custodian (TBD)
Sample Custody and Storage (Personnel/Organization): Laboratory Sample Custodian (TBD)
Sample Preparation (Personnel/Organization): Laboratory Analyst (TBD)
Sample Determinative Analysis (Personnel/Organization): Laboratory Analyst (TBD)
SAMPLE ARCHIVING Field Sample Storage (No. of days from sample collection): 365 days
Sample Extract/Digestate Storage (No. of days from extraction/digestion): Dependent on analyses
Biological Sample Storage (No. of days from sample collection): NA
SAMPLE DISPOSAL Personnel/Organization: Laboratory
Number of Days from Analysis: 365 days

Phases 1A RI Oversight QAPP Section E: Quality Assurance Worksheet #27 Revision: 0 US Magnesium NPL Site October 2013
Page 66 of 100
27.0 SAMPLE CUSTODY REQUIREMENTS (QAPP WORKSHEET #27)
The following sections describe sample handling procedures, including sample identification and labeling, documentation, chain of custody, and shipping. Detailed field sample management procedures are described in PWT’s Sample Handling SOP (Attachment 17A).
27.1 SAMPLE IDENTIFICATION
Samples will be identified through the use of a coding system to identify sample locations and sample types. The coding system will ensure that samples are uniquely identified by sample number and provide tracking numbers to facilitate data retrieval. The sample naming convention for the EPA split samples will use the same root name of the investigative sample that is used by ERM/US Magnesium and identified in WS#27 of the Phase 1A RI SAP. For the EPA split samples, “-ES” will be added to the end of the ERM/US Magnesium sample ID to indicate EPA (E) split sample (S). The “-ES” will be followed by a two digit sequential sample number assigned to each sample. The two digit number for the primary split sample will be 01, and field duplicates will be represented as 02. An example of an EPA split sample identification is presented below for a surface solids sample:
PRI##-xx-SSyy-MMDDYY-ES01
In addition, for samples being analyzed through the CLP program, unique CLP sample identification numbers will be assigned to each sample. Sample numbers will be recorded on field sampling data sheets, in the field log book(s), on the field sample location map, and on the chain-of-custody form.
MXS/MSD samples will not be identified in the sample number, but extra volume will be collected and the chain of custody provided to the laboratory will indicate the samples which should be used for MXS/MSD analysis. No field duplicate, source water, or equipment rinsate samples will be collected as part of the EPA split sampling program; therefore, trip blanks will be the only QC sample collected / analyzed during the Phase 1A RI that will be assigned specific sample IDs. The following identification numbering scheme will be used for each trip blank sample:
Trip Blank: TB01 through TBxx
The sequential trip blank sample number will continue where it left off from the previous sampling event.
27.1.2 Sample Labels
Sample labeling will be completed in accordance with PWT’s Sample Handling SOP (Attachment 17A). Sample labels will be completed using waterproof ink and attached to the sample containers at the time each sample is collected. The following information will be included on the sample label:
• Project name • PWT sample identification numbers, and for CLP samples, CLP-assigned identification numbers • CLP case number (if applicable) • Date and time of sample collection • Preservative used (if applicable) • Analyses required • MXS/MSD required • Sampler’s name or initials
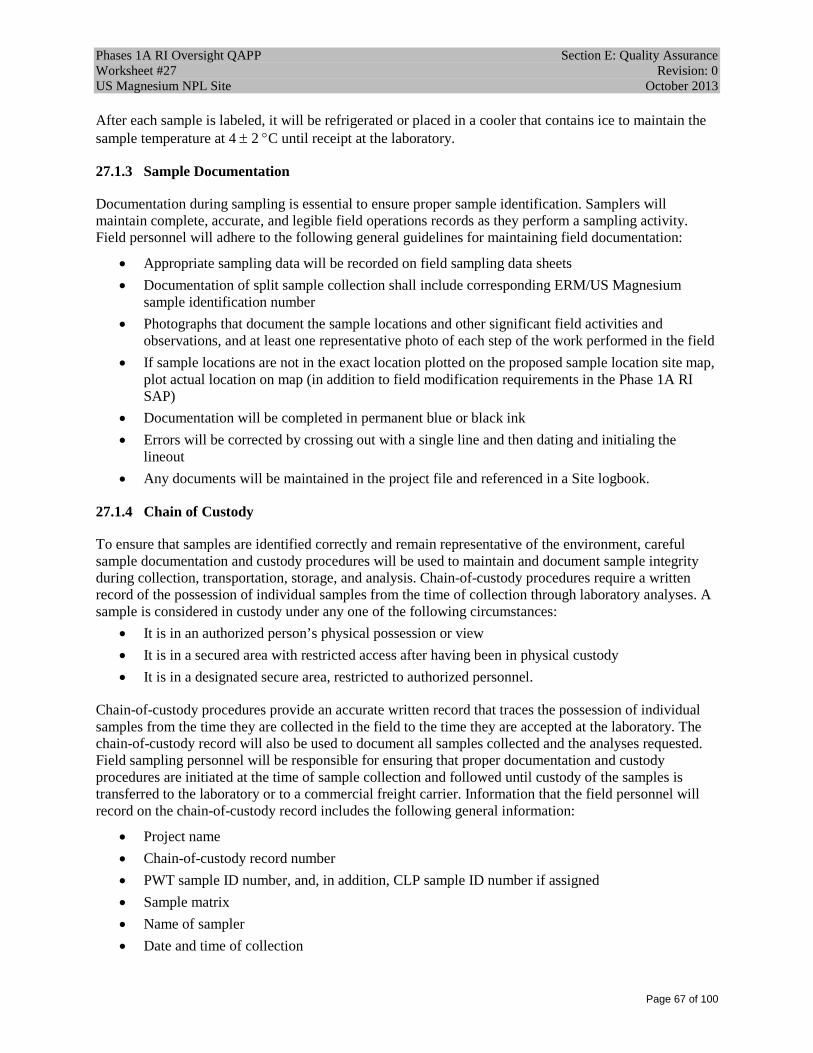
Phases 1A RI Oversight QAPP Section E: Quality Assurance Worksheet #27 Revision: 0 US Magnesium NPL Site October 2013
Page 67 of 100
After each sample is labeled, it will be refrigerated or placed in a cooler that contains ice to maintain the sample temperature at 4 ± 2 °C until receipt at the laboratory.
27.1.3 Sample Documentation
Documentation during sampling is essential to ensure proper sample identification. Samplers will maintain complete, accurate, and legible field operations records as they perform a sampling activity. Field personnel will adhere to the following general guidelines for maintaining field documentation:
• Appropriate sampling data will be recorded on field sampling data sheets • Documentation of split sample collection shall include corresponding ERM/US Magnesium
sample identification number • Photographs that document the sample locations and other significant field activities and
observations, and at least one representative photo of each step of the work performed in the field • If sample locations are not in the exact location plotted on the proposed sample location site map,
plot actual location on map (in addition to field modification requirements in the Phase 1A RI SAP)
• Documentation will be completed in permanent blue or black ink • Errors will be corrected by crossing out with a single line and then dating and initialing the
lineout • Any documents will be maintained in the project file and referenced in a Site logbook.
27.1.4 Chain of Custody
To ensure that samples are identified correctly and remain representative of the environment, careful sample documentation and custody procedures will be used to maintain and document sample integrity during collection, transportation, storage, and analysis. Chain-of-custody procedures require a written record of the possession of individual samples from the time of collection through laboratory analyses. A sample is considered in custody under any one of the following circumstances:
• It is in an authorized person’s physical possession or view • It is in a secured area with restricted access after having been in physical custody • It is in a designated secure area, restricted to authorized personnel.
Chain-of-custody procedures provide an accurate written record that traces the possession of individual samples from the time they are collected in the field to the time they are accepted at the laboratory. The chain-of-custody record will also be used to document all samples collected and the analyses requested. Field sampling personnel will be responsible for ensuring that proper documentation and custody procedures are initiated at the time of sample collection and followed until custody of the samples is transferred to the laboratory or to a commercial freight carrier. Information that the field personnel will record on the chain-of-custody record includes the following general information:
• Project name • Chain-of-custody record number • PWT sample ID number, and, in addition, CLP sample ID number if assigned • Sample matrix • Name of sampler • Date and time of collection

Phases 1A RI Oversight QAPP Section E: Quality Assurance Worksheet #27 Revision: 0 US Magnesium NPL Site October 2013
Page 68 of 100
• Number and type of sample containers filled • Analysis requested • Turnaround time requested • Preservatives used (if applicable) • Field filtration (if applicable) • Sample collection method (grab or composite) • Notes and additional information regarding individual samples that may be helpful to the lab • Project contact and phone number • Signatures of individuals involved in custody transfer, including the date and time of transfer
The chain-of-custody records generated in Scribe for CLP laboratories will include the following additional information:
• CLP case number • Name of lab and lab contact, and lab contact phone number • Sequential cooler number • Date sample cooler was shipped • Carrier name and airbill number (if applicable) • Sample tag number • Sample type (field sample, trip blank, etc.)
When completing a chain-of-custody record for a CLP laboratory using Scribe, the sampler will identify any samples that will be analyzed using a CLP Modified Analysis. Samplers should indicate use of a Modified Analysis (MA) by creating a new analysis within the Scribe Analyses table or at the time of entering the Analyses for the sample. This newly-created analysis should contain the Modification Reference Number within the name assigned to the analysis. For example, if a Region submits a MA for an additional analyte, and SMO assigns the Modification Reference Number 1301.0, the Scribe Analyses could be named "CLP VOA by M.A. 1301.0". The associated abbreviation for this analysis could be "VOA M.A.".
Field sampling personnel will sign chain-of-custody records that are initiated in the field, and, if applicable, the airbill number will be recorded. The chain-of-custody record will be inserted in a waterproof plastic bag and taped to the inside of the shipping container used to transport the samples. Signed airbills will serve as evidence of custody transfer between field personnel and the courier, and between the courier and the laboratory. Copies of the chain-of-custody record and the airbill will be retained and filed by field personnel before the containers are shipped. For CLP laboratories, an electronic export of the chain-of-custody record must be sent as soon as possible after sample shipment via the Electronic Sample Documentation System to transmit Scribe chain-of-custody files to SMO via the SMO Portal located at: http://epasmoweb.fedcsc.com. Per CLP requirements, the chain-of-custody records will be uploaded to the SMO Portal within three days of the ship date.
Laboratory chain of custody begins when samples are received and continues until samples are discarded. Laboratories analyzing samples for the EPA must follow custody procedures at least as stringent as those required by the EPA CLP SOWs. The laboratory should designate a specific individual as the sample custodian. The custodian will receive all incoming samples, sign the accompanying custody forms, and retain copies of the forms as permanent records. Each chain-of-custody will be verified for accuracy and

Phases 1A RI Oversight QAPP Section E: Quality Assurance Worksheet #27 Revision: 0 US Magnesium NPL Site October 2013
Page 69 of 100
completeness, and any discrepancies will be brought to the attention of the EPA/PWT3. The laboratory sample custodian will record all pertinent information on the samples, including the persons who delivered the samples, the date and time received, sample condition at the time of receipt (sealed, unsealed, or broken container; temperature, or other relevant remarks), the sample ID numbers, and any unique laboratory ID numbers for the samples. This information should be entered into a computerized laboratory information management system (LIMS). When the sample transfer process is complete, the custodian is responsible for maintaining internal logbooks, tracking reports, and other records necessary to maintain custody throughout sample preparation and analysis.
The laboratory will provide a secure storage area for all samples. Access to this area will be restricted to authorized personnel. The custodian will ensure that samples that require special handling, including samples that are heat- or light-sensitive, radioactive, or have other unusual physical characteristics, will be properly stored and maintained prior to analysis. Following sample analysis, any remaining sample material for all samples (100 percent) will be archived by the laboratory until instructed to dispose of the sample. The laboratory will be responsible for sample disposal, which will be conducted in accordance with all applicable local, state, and federal regulations. Disposal of all samples will be documented. The laboratory will maintain records in the project file.
27.1.5 Sample Packaging and Shipping
The following procedures will be implemented when samples collected during this project are shipped.
• Sample containers will be placed in plastic re-sealable bags and placed upright in coolers. • The cooler will be filled with bubble wrap, sample bottles, and packing material. Sufficient
packing material will be used to prevent sample containers from shifting or breaking during shipment.
• Enough ice will be added to maintain the sample temperature at 4 ± 2 °C. The laboratory will measure the temperature upon receipt. A temperature blank will be included in each sample cooler if requested by the laboratory.
• The signed original copy of the completed chain-of-custody records will be placed inside a plastic bag. The bag will be sealed and taped to the inside of the cooler lid.
• The airbill, if required, will be filled out before the samples are handed over to the carrier. The laboratory will be notified if the sampler suspects that the sample contains any substance that would require laboratory personnel to take safety precautions.
• The cooler will be closed and taped shut with strapping tape around both ends. If the cooler has a drain, it will be taped shut both inside and outside of the cooler.
• Signed and dated custody seals will be affixed on the front and side of each cooler. Wide clear tape will be placed over the seals to prevent accidental breakage.
• When the cooler is received at the analytical laboratory, laboratory personnel will open the cooler and sign the chain-of-custody record to document transfer of samples.
• A copy of the signed chain-of-custody record and the completed airbill will be retained for the project files.

Phases 1A RI Oversight QAPP Section E: Quality Assurance Worksheet #27 Revision: 0 US Magnesium NPL Site October 2013
Page 70 of 100
Sample coolers will be delivered to the laboratory or a FedEx shipping center on a daily basis. Samples will be shipped via overnight delivery. The sampler will notify the non-CLP laboratories when samples have been shipped and will also communicate any sample specific information that the laboratory should be aware of, such as if the samples are expected to be highly contaminated. When samples are shipped to CLP laboratories, samplers may be required to report all sample shipments to the RSCC (or designee) or to SMO; but for shipping samples for Saturday delivery, the sampler must notify the RSCC (or their designee) and SMO as soon as possible so that SMO will receive the delivery information by 3:00 PM ET on the Friday prior to delivery. Under no circumstances should the sampler contact the CLP laboratory directly.
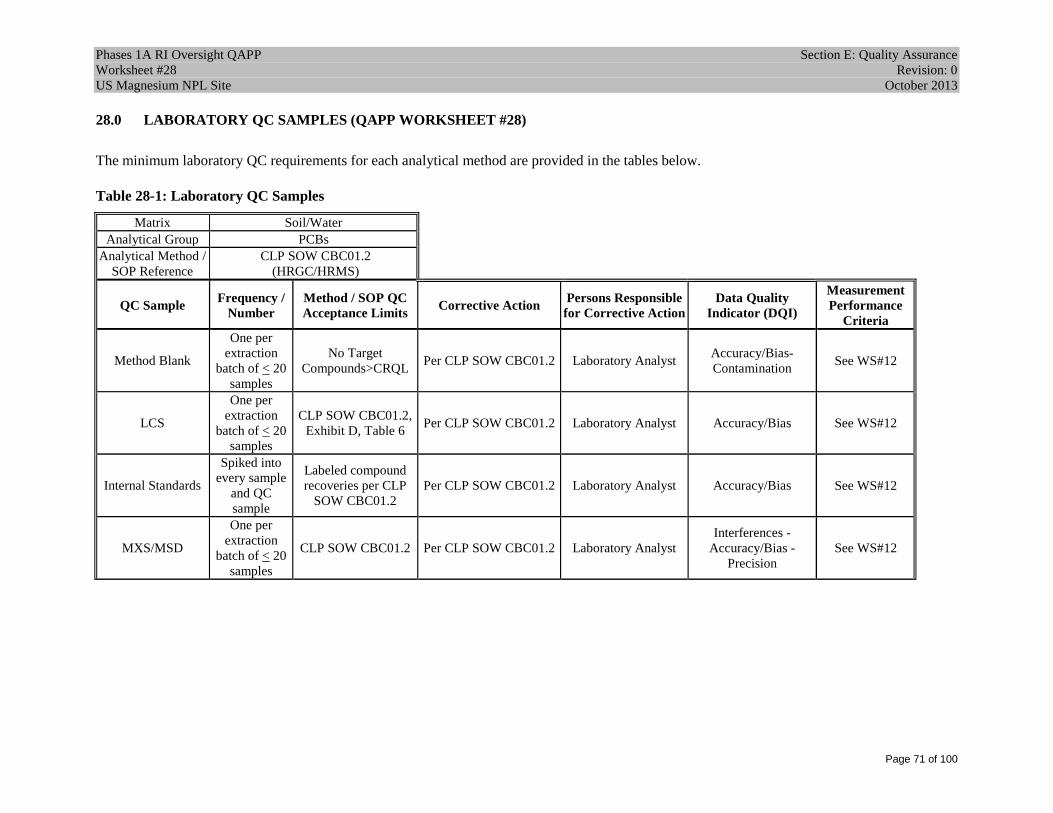
Phases 1A RI Oversight QAPP Section E: Quality Assurance Worksheet #28 Revision: 0 US Magnesium NPL Site October 2013
Page 71 of 100
28.0 LABORATORY QC SAMPLES (QAPP WORKSHEET #28)
The minimum laboratory QC requirements for each analytical method are provided in the tables below.
Table 28-1: Laboratory QC Samples
Matrix Soil/Water
Analytical Group PCBs Analytical Method /
SOP Reference CLP SOW CBC01.2
(HRGC/HRMS)
QC Sample Frequency / Number
Method / SOP QC Acceptance Limits Corrective Action Persons Responsible
for Corrective Action Data Quality
Indicator (DQI)
Measurement Performance
Criteria
Method Blank
One per extraction
batch of < 20 samples
No Target Compounds>CRQL Per CLP SOW CBC01.2 Laboratory Analyst Accuracy/Bias-
Contamination See WS#12
LCS
One per extraction
batch of < 20 samples
CLP SOW CBC01.2, Exhibit D, Table 6 Per CLP SOW CBC01.2 Laboratory Analyst Accuracy/Bias See WS#12
Internal Standards
Spiked into every sample
and QC sample
Labeled compound recoveries per CLP
SOW CBC01.2 Per CLP SOW CBC01.2 Laboratory Analyst Accuracy/Bias See WS#12
MXS/MSD
One per extraction
batch of < 20 samples
CLP SOW CBC01.2 Per CLP SOW CBC01.2 Laboratory Analyst Interferences -
Accuracy/Bias - Precision
See WS#12

Phases 1A RI Oversight QAPP Section E: Quality Assurance Worksheet #28 Revision: 0 US Magnesium NPL Site October 2013
Page 72 of 100
Matrix Soil/Water
Analytical Group PCDDs/PCDFs
Analytical Method /
SOP Reference
CLP SOWs DLM02.2 (HRGC/HRMS)
QC Sample Frequency / Number
Method / SOP QC Acceptance Limits Corrective Action Persons Responsible for
Corrective Action Data Quality Indicator
(DQI) Measurement
Performance Criteria
Method Blank One per extraction
batch of < 20 samples
No Target Compounds>CRQL
(>3XCRQL for OCDD) Per CLP SOW DLM02.2 Laboratory Analyst Accuracy/Bias-
Contamination See WS#12
LCS One per extraction
batch of < 20 samples
CLP SOW DLM02.2, Exhibit D, Table 6 Per CLP SOW DLM02.2 Laboratory Analyst Accuracy/Bias See WS#12
Internal Standards Spiked into every sample and QC
sample
Labeled compound recoveries per CLP SOW
DLM02.2, Exhibit D, Table 7
Per CLP SOW DLM02.2 Laboratory Analyst Accuracy/Bias See WS#12
MXS/MSD One per extraction
batch of < 20 samples
Per CLP SOW DLM02.2 Per CLP SOW DLM02.2 Laboratory Analyst Interferences - Accuracy/Bias - Precision See WS#12

Phases 1A RI Oversight QAPP Section E: Quality Assurance Worksheet #28 Revision: 0 US Magnesium NPL Site October 2013
Page 73 of 100
Matrix Soil/Water
Analytical Group
SVOCs SVOCs-SIM
PAH SVOC-SIM Analytical
Method / SOP Reference
CLP SOW SOM01.2
QC Sample Frequency / Number Method / SOP QC Acceptance Limits
Corrective Action
Person(s) Responsible for
Corrective Action
Data Quality Indicator (DQI)
Measurement Performance
Criteria
Method Blank One per preparation batch All analytes <CRQLs Per CLP SOW SOM01.2 Laboratory Analyst Accuracy/Bias -
Contamination See WS#12
CCVs opening/closing
One per extraction batch of < 20 samples
Per CLP SOW SOM01.2 SVOC Exhibit D Exhibit
D, Table 4 CCV opening = +/- 25-
40% CCV closing = +/- 50%
Per CLP SOW SOM01.2 Laboratory Analyst Accuracy/Bias See WS#12
Internal Standards
Spiked into every sample and QC
sample
AREA UPPER LIMIT = 200% of internal standard
area in CCV AREA LOWER LIMIT = 50% of internal standard
area in CCV
Per CLP SOW SOM01.2 Laboratory Analyst Accuracy/Bias
AREA UPPER LIMIT = 200% of internal standard
area in CCV AREA LOWER LIMIT = 50% of internal standard
area in CCV
Surrogates Spiked into every sample and QC
sample
CLP SOW SOM01.2, SVOC Exhibit D, Table 6 Per CLP SOW SOM01.2 Laboratory Analyst Accuracy/Bias
CLP SOW SOM01.2, Exhibit
D, Table 6
MXS/MSD One per extraction batch of < 20 samples
CLP SOW SOM01.2, SVOC Exhibit D Exhibit
D, Table 5 Per CLP SOW SOM01.2 Laboratory Analyst
Interferences - Accuracy/Bias -
Precision See WS#12

Phases 1A RI Oversight QAPP Section E: Quality Assurance Worksheet #28 Revision: 0 US Magnesium NPL Site October 2013
Page 74 of 100
Matrix Soil/Water
Analytical Group VOCs
Analytical Method / SOP
Reference
CLP SOW SOM01.2/2.1
QC Sample Frequency /
Number Method / SOP QC Acceptance Limits
Corrective Action
Person(s) Responsible for Corrective Action
Data Quality Indicator (DQI)
Measurement Performance
Criteria
Method Blank One per preparation batch All analytes <CRQLs Per CLP SOW
SOM01.2/2.1 Laboratory Analyst Accuracy/Bias - Contamination See WS#12
CCVs opening/closing
One per extraction batch of < 20
samples
Per CLP SOW SOM01.2/2.1 SOM01.2SVOC Exhibit D,
Table 4 CCV opening = +/- 25-40%
CCV closing = +/- 50%
Per CLP SOW SOM01.2/2.1 Laboratory Analyst Accuracy/Bias See WS#12
Internal Standards
Spiked into every sample and QC
sample
AREA UPPER LIMIT = 200% of internal standard area in
CCV AREA LOWER LIMIT = 50%
of internal standard area in CCV
Per CLP SOW SOM01.2/2.1 Laboratory Analyst Accuracy/Bias
AREA UPPER LIMIT = 200% of internal standard
area in CCV AREA LOWER LIMIT = 50% of internal standard
area in CCV
Surrogates Spiked into every sample and QC
sample
CLP SOW SOM01.2, VOC Exhibit D, Table 6
Per CLP SOW SOM01.2/2.1 Laboratory Analyst Accuracy/Bias
CLP SOW SOM01.2/2.1,
VOC Exhibit D, Table 6
MXS/MSD One per extraction
batch of < 20 samples
CLP SOW SOM01.2, VOC Exhibit D, Table 5
Per CLP SOW SOM01.2/2.1 Laboratory Analyst
Interferences - Accuracy/Bias -
Precision See WS#12

Phases 1A RI Oversight QAPP Section E: Quality Assurance Worksheet #28 Revision: 0 US Magnesium NPL Site October 2013
Page 75 of 100
Matrix Water/Soil
Analytical Group Metals
Analytical Method / SOP
Reference
CLP SOW ISM002.0/02.1
QC Sample Frequency / Number
Method / SOP QC Acceptance Limits
Corrective Action
Person(s) Responsible for Corrective Action
Data Quality Indicator (DQI)
Measurement Performance
Criteria Method
(preparation) Blank
One per extraction batch of < 20
samples All analytes < CRQL Per CLP SOW ISM002.0/02.1 Laboratory Analyst Accuracy/Bias-
Contamination See WS#12
LCS One per extraction
batch of < 20 samples
All analytes 80-120% Per CLP SOW ISM002.0/02.1 Laboratory Analyst Accuracy/Bias See WS#12
MXS/MSD One per extraction
batch of < 20 samples
All analytes 75-125% Per CLP SOW ISM002.0/02.1 Laboratory Analyst Interferences -
Accuracy/Bias - Precision
See WS#12
Dilution Test One per extraction
batch of < 20 samples
1:5 dilution must agree within + 10% of
the original determination
Per CLP SOW ISM002.0/02.1 Laboratory Analyst Accuracy/Bias (matrix interference)
1:5 dilution must agree within +
10% of the original
determination
Instrument QC checks (ICS, CRQL check, linear range
check)
Per ISM002.0/02.1, Exhibit D, Section
12
Per ISM002.0/02.1, Exhibit D, Section 12 Per CLP SOW ISM002.0/02.1 Laboratory Analyst Accuracy/Bias -
Precision
Per ISM002.0/02.1,
Exhibit D, Section 12
Calibration Verifications
One per extraction batch of < 20
samples All analytes 90-100%, Per CLP SOW ISM002.0/02.1 Laboratory Analyst Accuracy/Bias
Per ISM002.0/02.1,
Exhibit D, Section 12

Phases 1A RI Oversight QAPP Section E: Quality Assurance Worksheet #28 Revision: 0 US Magnesium NPL Site October 2013
Page 76 of 100
Matrix Water
Analytical Group Hexavalent Chromium
Analytical Method /
SOP Reference
ASC-083.1 equivalent (SOP to be provided)
QC Sample Frequency / Number
Method / SOP QC Acceptance Limits Corrective Action
Persons Responsible for
Corrective Action
Data Quality Indicator (DQI)
Measurement Performance
Criteria
Method Blank One per
extraction batch of < 20 samples
No contamination >RL
Re-run if still contaminated re-extract all samples associated with
the blank Laboratory analyst Contamination No Target
Compounds>RL
LCS One per
extraction batch of < 20 samples
Per method/SOP
If the recovery is out high and no positive results in the sample no
corrective action is required. If the recovery is low then re-run the LCS; if still low re-extract all
samples associated with the LCS
Laboratory analyst Accuracy/Bias-Contamination See WS#12
LCSD One per
extraction batch of < 20 samples
Per method/SOP
If the recovery is out high and no positive results in the sample no
corrective action is required. If the recovery is low then re-run the LCS; if still low re-extract all
samples associated with the LCS
Laboratory analyst Accuracy/Bias-Contamination See WS#12
MXS/MSD
One per extraction batch of < 20 samples
whichever is fewer
Per method/SOP If LCS/LCSD meets the criteria
then no corrective action is required
Laboratory analyst Accuracy/Bias-Contamination See WS#12

Phases 1A RI Oversight QAPP Section E: Quality Assurance Worksheet #28 Revision: 0 US Magnesium NPL Site October 2013
Page 77 of 100
Matrix Water/Soil
Analytical Group Perchlorate
Analytical Method /
SOP Reference
EPA Method 314.1 (soil) EPA Method 6850 (water and soil for any positive detections in soil above
314.1) (SOP to be provided)
QC Sample Frequency / Number
Method / SOP QC Acceptance
Limits Corrective Action
Persons Responsible for
Corrective Action
Data Quality Indicator (DQI)
Measurement Performance
Criteria
Method Blank One per
extraction batch of < 20 samples
No contamination >RL
1) Run an instrument blank (or system blank).
2) Assess impact on data. 3) Reanalyze method blank
4) Reprep batch as necessary
Laboratory Analyst Accuracy/Bias-Contamination See WS#12
LCS One per
extraction batch of < 20 samples
80-120% or laboratory control
limits
1) Check calculations. 2) If sufficient sample is available, re-extract and reanalyze samples.
3) If insufficient sample is available, reanalyze extracts. Qualify data as
needed.
Laboratory Analyst Accuracy/Bias See WS#12
Synthetic Matrix Control
Sample
One per extraction batch of < 20 samples
80-120% 1) Evaluate system and correct
problem. 2) Reanalyze associated samples.
Laboratory Analyst Accuracy/Bias-Contamination See WS#12
MXS/MSD One per
extraction batch of < 20 samples
water 80-120%, soil 70-130%
1) Check calculations. 2) Evaluate all data.
3) Assess impact and qualify data. 4) Reanalyze once and include in the
narrative.
Laboratory Analyst Interferences -
Accuracy/Bias - Precision
See WS#12
CCV One per
extraction batch of < 20 samples
Low range +/-50%, med range +/- 15%
1) Evaluate system and correct problem.
2) Reanalyze associated samples. Laboratory Analyst Accuracy/Bias See WS#12
LLOQ One per
extraction batch of < 20 samples
+/-50% 1) Evaluate system and correct
problem. 2) Reanalyze associated samples.
Laboratory Analyst Accuracy/Bias See WS#12

Phases 1A RI Oversight QAPP Section E: Quality Assurance Worksheet #28 Revision: 0 US Magnesium NPL Site October 2013
Page 78 of 100
Matrix Water
Analytical Group HAA
Analytical Method / SOP
Reference
EPA Method 552.2
(SOP to be provided)
QC Sample Frequency / Number
Method / SOP QC Acceptance Limits Corrective Action
Persons Responsible for
Corrective Action
Data Quality Indicator (DQI)
Measurement Performance
Criteria
Method Blank One per
preparation batch
All analytes < RLs Reprep and reanalyze MB and all samples processed with the non-
conforming MB. Laboratory Analyst Accuracy/Bias -
Contamination See WS#12
LCS (LFB) (QCS)
One per sample preparation
batch
Per method SOP, nominally +/-30%
Reprep and reanalyze LCS and all samples processed with the non-
conforming LCS. Laboratory Analyst Accuracy/Bias See WS#12
Surrogates Spiked into
every sample and QC sample
Per method SOP, nominally 70-130%
Reprep and reanalyze samples, or assess the effects of interferences or
dilution Laboratory Analyst Accuracy/Bias See WS#12
MXS/MSD
As per client request (See
chain of custody)
Per method SOP, nominally 70-130%
If result indicates matrix interference, discuss in case narrative. Otherwise,
check for possible source of error, and re-extract/reanalyze the sample.
Laboratory Analyst Interferences -
Accuracy/Bias - Precision
See WS#12
Internal Standards Spiked into
every sample and QC sample
Per method/SOP, nominally +/-50%
If result indicates matrix interference, discuss in case narrative. Otherwise,
check for possible source of error, and re-extract/reanalyze the sample.
Laboratory Analyst Interferences -
Accuracy/Bias - Precision
See WS#12
Field Duplicates As requested +/-30%
If result indicates matrix interference, discuss in case narrative. Otherwise,
check for possible source of error, and re-extract/reanalyze the sample.
Laboratory Analyst Accuracy/Bias See WS#12
Calibration check
compound (CCC)
One per analytical run
Mid/high 70-130% Low 50-150%
If CCC results and samples are low, note in narrative. If CCC is below the range, rerun CCC and rerun samples if
sufficient sample exists.
Laboratory Analyst Accuracy/Bias See WS#12

Phases 1A RI Oversight QAPP Section E: Quality Assurance Worksheet #28 Revision: 0 US Magnesium NPL Site October 2013
Page 79 of 100
Matrix Water
Analytical Group Major Anions
Analytical Method / SOP
Reference
EPA 3001
(SOP to be provided)
QC Sample Frequency / Number
Method / SOP QC Acceptance Limits
Corrective Action
Person(s) Responsible for
Corrective Action
Data Quality Indicator (DQI)
Measurement Performance
Criteria
Method Blank One per extraction
batch of < 20 samples
All analytes <RLs
Reprep and reanalyze MB, LCS and all samples processed with the non-conforming blank unless it has no impact on high
value samples
Laboratory Analyst Accuracy/bias-contamination See WS#12
LCS (LFB) (IPC)
One per extraction batch of < 20
samples
% Recovery 90-110 or laboratory control
limits
Reprep and reanalyze LCS and all samples processed with non-
conforming LCS Laboratory Analyst Accuracy/bias See WS#12
MXS/MSD One per extraction
batch of < 20 samples
% Recovery 75-125 or laboratory control
limits. For MS/MSD, RPD + 20%
Discuss in case narrative Laboratory Analyst Interferences-
Accuracy/bias- precision
See WS#12
Field Duplicates
Will be designated in the field RPD + 20% Discuss in case narrative Laboratory Analyst
Interferences- Accuracy/bias-
precision See WS#12
1 Work instructions may require additional QC or analyses.

Phases 1A RI Oversight QAPP Section E: Quality Assurance Worksheet #28 Revision: 0 US Magnesium NPL Site October 2013
Page 80 of 100
Matrix Water
Analytical Group Alkalinity
Analytical Method / SOP
Reference
EPA Method 310.1 (SOP to be provided)
QC Sample Frequency / Number
Method / SOP QC Acceptance Limits
Corrective Action
Person(s) Responsible for
Corrective Action
Data Quality Indicator (DQI)
Measurement Performance
Criteria
Method Blank One per extraction
batch of < 20 samples
All analytes <RLs Reprep and reanalyze MB, LCS and all samples processed with
the non-conforming MB Laboratory Analyst Accuracy/bias-
contamination See WS#12
LCS One in absence of MXS/MSD
% Recovery 80-120 or laboratory generated
control limits
Reprep and reanalyze LCS and all samples processed with
non-conforming LCS Laboratory Analyst Accuracy/bias See WS#12
MXS/MSD Will be designated in the field
% Recovery 75-125 RPD + 20%
Discuss in case narrative Laboratory Analyst Interferences-
Accuracy/bias - precision
See WS#12
Field duplicates
Will be designated in the field RPD + 20% Discuss in case narrative Laboratory Analyst
Interferences- Accuracy/bias -
precision See WS#12

Phases 1A RI Oversight QAPP Section E: Quality Assurance Worksheet #28 Revision: 0 US Magnesium NPL Site October 2013
Page 81 of 100
Matrix Water
Analytical Group TSS
Analytical Method /
SOP Reference
EPA Method 160.1-2 (SOP to be provided)
QC Sample Frequency / Number
Method / SOP QC Acceptance Limits
Corrective Action
Person(s) Responsible for
Corrective Action
Data Quality Indicator (DQI)
Measurement Performance
Criteria
Method Blank
One per extraction batch of < 20
samples <10 mg/L
Reprep and reanalyze MB and all samples processed with the non-conforming MB if >10%
of the lowest sample concentration
Laboratory Analyst Accuracy/Bias - Contamination See WS#12
LCS One per extraction
batch of < 20 samples
+/-15% of the expected concentration
Reprep and reanalyze LCS and all samples processed with the
non-conforming LCS. Laboratory Analyst Accuracy/Bias See WS#12
MD As per client request
(See chain of custody)
RPD < 20%
If result indicates matrix interference, discuss in case
narrative. Otherwise, check for possible source of error, and
re-extract/reanalyze the sample.
Laboratory Analyst Interferences -
Accuracy/Bias -Precision
See WS#12
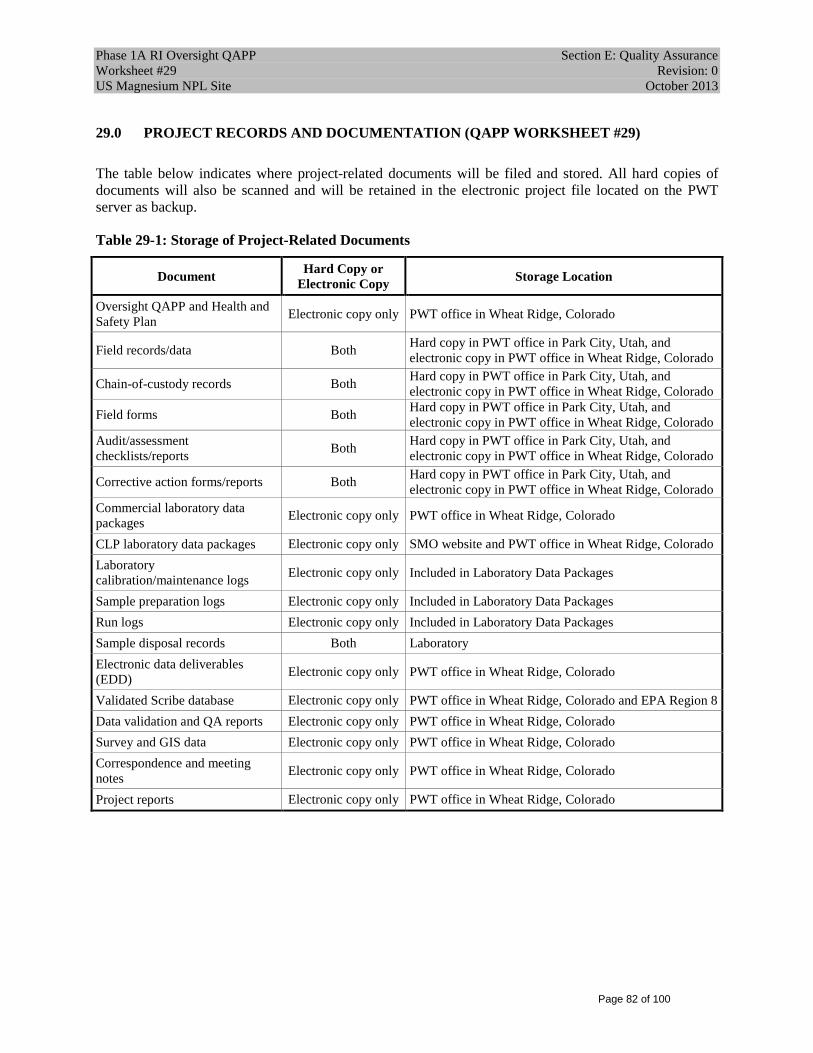
Phase 1A RI Oversight QAPP Section E: Quality Assurance Worksheet #29 Revision: 0 US Magnesium NPL Site October 2013
Page 82 of 100
29.0 PROJECT RECORDS AND DOCUMENTATION (QAPP WORKSHEET #29)
The table below indicates where project-related documents will be filed and stored. All hard copies of documents will also be scanned and will be retained in the electronic project file located on the PWT server as backup.
Table 29-1: Storage of Project-Related Documents
Document Hard Copy or Electronic Copy Storage Location
Oversight QAPP and Health and Safety Plan Electronic copy only PWT office in Wheat Ridge, Colorado
Field records/data Both Hard copy in PWT office in Park City, Utah, and electronic copy in PWT office in Wheat Ridge, Colorado
Chain-of-custody records Both Hard copy in PWT office in Park City, Utah, and electronic copy in PWT office in Wheat Ridge, Colorado
Field forms Both Hard copy in PWT office in Park City, Utah, and electronic copy in PWT office in Wheat Ridge, Colorado
Audit/assessment checklists/reports Both Hard copy in PWT office in Park City, Utah, and
electronic copy in PWT office in Wheat Ridge, Colorado
Corrective action forms/reports Both Hard copy in PWT office in Park City, Utah, and electronic copy in PWT office in Wheat Ridge, Colorado
Commercial laboratory data packages Electronic copy only PWT office in Wheat Ridge, Colorado
CLP laboratory data packages Electronic copy only SMO website and PWT office in Wheat Ridge, Colorado Laboratory calibration/maintenance logs Electronic copy only Included in Laboratory Data Packages
Sample preparation logs Electronic copy only Included in Laboratory Data Packages Run logs Electronic copy only Included in Laboratory Data Packages Sample disposal records Both Laboratory Electronic data deliverables (EDD) Electronic copy only PWT office in Wheat Ridge, Colorado
Validated Scribe database Electronic copy only PWT office in Wheat Ridge, Colorado and EPA Region 8 Data validation and QA reports Electronic copy only PWT office in Wheat Ridge, Colorado Survey and GIS data Electronic copy only PWT office in Wheat Ridge, Colorado Correspondence and meeting notes Electronic copy only PWT office in Wheat Ridge, Colorado
Project reports Electronic copy only PWT office in Wheat Ridge, Colorado

Phase 1A RI Oversight QAPP Section E: Quality Assurance Worksheet #29 Revision: 0 US Magnesium NPL Site October 2013
Page 83 of 100
Full (Level IV) data packages, including raw data, will be provided by the laboratories for all analyses performed for the Phase 1A RI. The table below identifies the general requirements for laboratory data packages for organic and inorganic analyses. Specific reporting and deliverables requirements for the CLP labs are specified in the applicable CLP Statement of Work. Not all items listed in the table are applicable for all analytical methods to be used for the Phase 1A RI.
Table 29-2: Requirements for Laboratory Data Packages
Requirements for Data Packages – Organic Analysis
(as appropriate per method)
Requirements for Data Packages – Inorganic Analysis
(as appropriate per method) 1. Case narrative 1. Case narrative 2. Copies of nonconformance and corrective action
forms 2. Copies of nonconformance and corrective action
forms 3. Chain-of-custody forms 3. Chain-of-custody forms 4. Copies of sample receipt notices 4. Copies of sample receipt notices 5. Internal tracking documents, as applicable 5. Internal tracking documents, as applicable 6. Sample results for environmental samples,
including dilutions and re-analysis, reported on a dry-weight basis
6. Sample results for environmental samples, including dilutions and re-analysis, reported on a dry-weight basis
7. System monitoring compound and surrogate recoveries
7. Initial and continuing calibration verifications
8. MXS/MSD recoveries and RPD 8. Method blanks, continuing calibration blanks, and preparation blanks
9. Blank spike or LCS recoveries 9. Inductively coupled plasma (ICP) interference-check samples
10. Method blanks 10. MXS and post-digestion spikes 11. Performance check 11. Sample duplicates 12. Initial calibrations with retention time
information 12. LCSs
13. Continuing calibrations with retention time information
13. Method of standard additions
14. Internal standard areas and retention times 14. ICP serial dilution 15. Analytical sequence 15. ICP inter-element correction factors 16. Single component analyte identification 16. ICP linear working range 17. Multicomponent analyte identification 17. Raw Data for the following, where applicable: 18. Raw data for the following, where applicable: a. Environmental samples, including dilutions and
re-analysis a. Analytical results, including dilutions and
re-analysis b. Initial calibration
b. Method blanks c. Initial and continuing calibration verifications c. MXS/MSD samples d. Detection limit standards d. Blank spikes or LCSs e. Method blanks, continuing calibration blanks, and
preparation blanks e. Performance check f. ICP interference check samples f. Initial calibrations, with retention-time
information g. MXS and post-digestion spikes
g. Continuing calibrations, with retention-time information
h. Sample duplicates
h. Quantitation-limit standard i. LCSs i. Percent moisture for soil j. Method of standard additions j. Sample extraction and cleanup logs k. ICP serial dilution

Phase 1A RI Oversight QAPP Section E: Quality Assurance Worksheet #29 Revision: 0 US Magnesium NPL Site October 2013
Page 84 of 100
Requirements for Data Packages – Organic Analysis
(as appropriate per method)
Requirements for Data Packages – Inorganic Analysis
(as appropriate per method) k. Instrument analysis log for each instrument
used l. Percent moisture for soil samples
l. Standard preparation logs, including initial and final concentrations for each standard used
m. Sample digestion, distillation, and preparation logs, as necessary
m. Formula and a sample calculation for the initial calibration
n. Instrument analysis logs for each instrument used
n. Formula and a sample calculation for soil sample results
o. Standard preparation logs, including initial and final concentrations for each standard used
p. Formula and a sample calculation for the initial calibration
q. Formula and a sample calculations for soil sample results

Phase 1A RI Oversight QAPP Section E: Quality Assurance Worksheet #30 Revision: 0 US Magnesium NPL Site October 2013
Page 85 of 100
30.0 ANALYTICAL SERVICES (QAPP WORKSHEET #30)
The laboratories contracted to provide analytical services must have the appropriate accreditation or certification (National Environmental Laboratory Accreditation Program [NELAP] or State of Utah) for each analytical method and matrix. Selected analytical laboratories that conduct analyses under the EPA Contract Laboratory Program (CLP) will be required to comply with all performance requirements established in the CLP SOW and methods specified in this Oversight QAPP. The selected laboratories are active, commercial laboratories with current demonstration of proficiency in the analytical methods identified for analysis of Site samples, in the appropriate matrix. Backup laboratories are not available.
Table 30-1: Analytical Services
Matrix Analytical Group Sample Locations/ ID Number Analytical Method
Data Package Turnaround
Time
Laboratory / Organization (name and address, contact person, and telephone number)
Solid/ Water PCBs Refer to WS#18 Refer to WS#15 21 days TBD
Solid/ Water PCDDs/PCDFs Refer to WS#18 Refer to WS#15 21 days TBD
Solid/ Water Volatiles Refer to WS#18 Refer to WS#15 21 days TBD
Solid/ Water Semi-volatiles Refer to WS#18 Refer to WS#15 21 days TBD
Solid/ Water PAHs Refer to WS#18 Refer to WS#15 21 days TBD
Solid/ Water Metals Refer to WS#18 Refer to WS#15 21 days TBD
Solid pH Refer to WS#18 Refer to WS#15 21 days TBD Solid/ Water TOC Refer to WS#18 Refer to WS#15 21 days TBD
Solid/ Water Perchlorate Refer to WS#18 Refer to WS#15 21 days TBD
Water Anions Refer to WS#18 Refer to WS#15 21 days TBD Water Alkalinity Refer to WS#18 Refer to WS#15 21 days TBD

Phase 1A RI Oversight QAPP Section E: Quality Assurance Worksheet #30 Revision: 0 US Magnesium NPL Site October 2013
Page 86 of 100
Matrix Analytical Group Sample Locations/ ID Number Analytical Method
Data Package Turnaround
Time
Laboratory / Organization (name and address, contact person, and telephone number)
Water TDS Refer to WS#18 Refer to WS#15 21 days TBD Water Haloacetic Acids Refer to WS#18 Refer to WS#15 21 days TBD
Water Hexavalent Chromium Refer to WS#18 Refer to WS#15 21 days TBD

Phase 1A RI Oversight QAPP Section E: Quality Assurance Worksheet #31 Revision: 0 US Magnesium NPL Site October 2013
Page 87 of 100
31.0 PLANNED PROJECT ASSESSMENTS (QAPP WORKSHEET #31)
The roles and responsibilities of those conducting assessments or audits during the implementation of the Phase 1A RI are described below.
Table 31-1: Roles and Responsibilities for Project Assessments
Assessment Type Frequency
Internal or
External
Organization Performing Assessment
Person(s) Responsible for
Performing Assessment
Person(s) Responsible for Responding to
Assessment Findings
Person(s) Responsible for Identifying and Implementing
Corrective Action
Person(s) Responsible for
Monitoring Effectiveness of
Corrective Action
Audit of ERM/US
Magnesium’s subcontracted laboratory(s)
Twice during initial portion of Phase 1A External PWT3
PWT3 Chemist/Analytical Coordinator, PWT3
Geochemist
ERM/US Magnesium QAM,
ERM/US Magnesium
Subcontracted Laboratory Project
Manager
ERM/US Magnesium QAM,
ERM/US Magnesium
Subcontracted Laboratory Project
Manager
ERM/US Magnesium QAM,
ERM/US Magnesium
Subcontracted Laboratory Project Manager, PWT3
Chemist/Analytical Coordinator, PWT3
Geochemist

Phase 1A RI Oversight QAPP Section E: Quality Assurance Worksheet #32 Revision: 0 US Magnesium NPL Site October 2013
Page 88 of 100
32.0 ASSESSMENT FINDINGS AND CORRECTIVE ACTION RESPONSES (QAPP WORKSHEET #32)
Corrective actions will be managed in a manner similar to that shown below.
Table 32-1: Implementation Assessment and Follow-up Requirements
Assessment Type Nature of Deficiencies Documentation
Individual(s) Notified of Findings
Timeframe of Notification
Nature of Corrective Action
Response Documentation
Individual(s) Receiving
Corrective Action Response
Timeframe for Response
Audit of ERM/US Magnesium’s subcontracted laboratory(s)
Audit Report (Email and follow-up
technical memorandum notification of critical
issues if identified)
EPA RPM, PWT3 QAM, ERM/US
Magnesium QAM, PWT3 Project
Manager
5 days - Audit Report 24 hours - critical issues
Written
EPA RPM, PWT3 QAM,
ERM/US Magnesium QAM,
PWT3 Project Manager
5 days (or expedited as
necessary for critical issues)

Phase 1A RI Oversight QAPP Section E: Quality Assurance Worksheet #33 Revision: 0 US Magnesium NPL Site October 2013
Page 89 of 100
33.0 QA MANAGEMENT REPORTS (QAPP WORKSHEET #33)
QA management reports and field activity summaries will be provided according to the schedule provided below.
Table 33-1: Reporting Requirements
Type of Report Frequency Projected Delivery Date(s) Person(s) Responsible for Report Preparation Report Recipient(s)
Daily Progress Report Daily At the end of each field day PWT3 Field Team Leader PWT3 Project Manager
(and other PWT3 team members as appropriate)
Weekly Status Report Weekly At the end of each week PWT3 Project Manager EPA RPM, PWT3 QAM, PWT3 Field Team Leader, PWT3 Geochemist
Monthly Status Report Monthly At the end of each month PWT3 Project Manager EPA RPM, PWT3 QAM, PWT3 Field Team Leader, PWT3 Geochemist
QA Summary Report Once with
report submittal
Submitted in final report following completion of
Phase 1A
PWT3 Project Manager, PWT3 QAM,
PWT3 Field Team Leader, PWT3 Geochemist
EPA RPM

Phase 1A RI Oversight QAPP Se Worksheet #34 US Magnesium NPL Site
Page 90 of 100
34.0 VERIFICATION PROCESS (QAPP WORKSHEET #34)
Validation and verification of the data generated during field and laboratory activities are essential to obtaining defensible data of acceptable quality. Verification of field and laboratory activities is presented below. The quality of data obtained during field oversight and split sampling will be verified by performing the actions and documentation procedures described in the table below. The validation process is described in WS#35 and WS#36.
34.1 FIELD RECORDS/DOCUMENTATION VERIFICATION
Project personnel will verify field data through reviews of records/documentation generated during field oversight sampling to identify inconsistencies or anomalous values. Any inconsistencies discovered will be resolved as soon as possible by seeking clarification from field personnel responsible for data collection. All the PWT3 field personnel will be responsible for following the sampling and documentation procedures described in this Oversight QAPP.
Data values that are significantly different from the population are called “outliers.” A systematic effort will be made to identify any outliers or errors before field data is reported. Outliers can result from improper sampling or measurement methodology, data transcription errors, calculation errors, or natural causes. Outliers that result from errors found during field data verification will be identified and corrected. Outliers that cannot be attributed to errors in sampling, measurement, transcription, or calculation will be clearly identified in project reports.
34.2 LABORATORY DATA VERIFICATION
Laboratory personnel will verify analytical data at the time of analysis and reporting and through subsequent reviews of the raw data for any non-conformances to the requirements of the analytical method. Laboratory personnel will make a systematic effort to identify any outliers or errors before they report the data. Outliers that result from errors found during data verification will be identified and corrected; outliers that cannot be attributed to errors in analysis, transcription, or calculation will be clearly identified in the case narrative section of the analytical data package.
34.3 VERIFICATION PROCESS
Table 34-1 describes the verification process that will be used for the EPA/PWT3-generated field and laboratory data. This table also identified the personnel responsible for different verification steps and identifies whether the verification step is internal or external.

Phase 1A RI Oversight QAPP Section E: Quality Assurance Worksheet #34 Revision: 0 US Magnesium NPL Site October 2013
Page 91 of 100
Table 34-1: Verification Process
Verification Input Description Internal/ External
Role Responsible for Verification
Audit Reports
When the report is complete, a copy of all audit reports will be placed in the project file. If corrective actions are required, audit reports will be reviewed internally to ensure that all appropriate corrective actions have been taken and that a copy of the documented corrective action taken is attached to the appropriate audit report in the project file. If corrective actions have not been taken, the PWT3 Project Manager will be notified to ensure action is taken.
I PWT3 Project Manager
Field Notes/Logbooks Field notes will be reviewed internally and placed in the project file. A copy of the field notes will be attached to the final report. I PWT3 Field Team Leader
Chain-of-Custody Records
Chain-of-custody forms will be reviewed internally when they are completed and verified against the packed sample coolers they represent. The shipper shall sign the chain-of-custody form and a copy of the chain-of-custody form will be retained in the project file and the original will be taped inside the cooler for shipment.
I PWT3 Field Team Leader
Sample Receipts For samples shipped via commercial carrier, the PWT3 Field Team Leader will verify receipt of samples by the laboratory the day following shipment. I PWT3 Field Team Leader
Sample Logins Sample login information will be reviewed and verified for completeness in accordance with the chain-of-custody forms. I, E I: PWT3 Field Team Leader
E: Laboratory Project Manager Laboratory data prior to
release to PWT3 Laboratory data will be reviewed and verified for completeness against analyses requested on the chain-of-custody forms. E Laboratory Project Manager
Laboratory data released to PWT3 at turnaround time listed on chain of custody
Laboratory data will be verified that the analyses reported are consistent with the analytical suite requested on the chain-of-custody forms. I PWT3 Field Team Leader
(or designee)
Laboratory Data Packages
All laboratory data packages will be verified for completeness and technical accuracy by the laboratory performing the work. Data packages will then be reviewed for completeness. The verification will compare the Form 1’s with qualifiers to the EDD reported by the laboratories.
I, E I: Laboratory Project Manager, E: PWT3 Geochemist1, PWT3
Chemist/Analytical Coordinator2
Electronic data 100 percent of manual entries will be reviewed against the hardcopy information. I PWT3 Field Team Leader (or designee)
Notes: 1. The PWT3 Geochemist is responsible for verification of PCBs, PCDDs/PCDFs data 2. The PWT3 Chemist/Analytical Coordinator is responsible for verification of the remaining analytical data including SVOCs, PAHs,
VOCs, metals, perchlorate, TOC, anions, alkalinity, TDS, and hexavalent chromium.
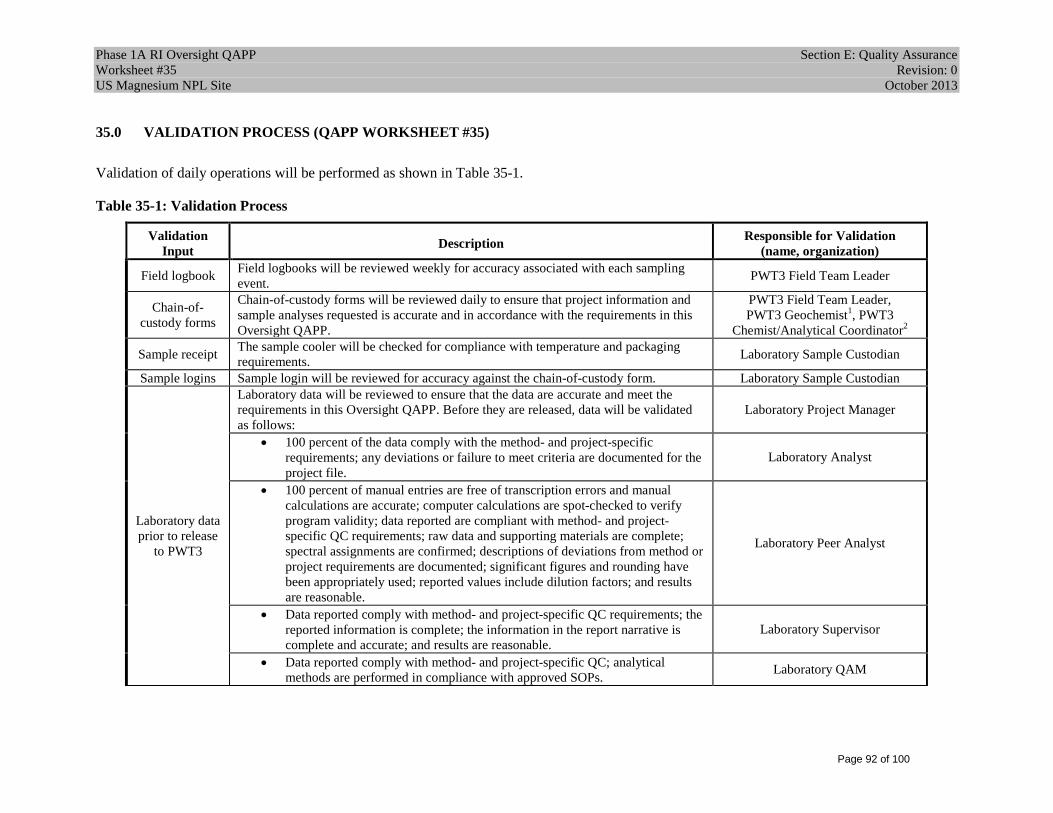
Phase 1A RI Oversight QAPP Section E: Quality Assurance Worksheet #35 Revision: 0 US Magnesium NPL Site October 2013
Page 92 of 100
35.0 VALIDATION PROCESS (QAPP WORKSHEET #35)
Validation of daily operations will be performed as shown in Table 35-1.
Table 35-1: Validation Process
Validation Input Description Responsible for Validation
(name, organization)
Field logbook Field logbooks will be reviewed weekly for accuracy associated with each sampling event. PWT3 Field Team Leader
Chain-of-custody forms
Chain-of-custody forms will be reviewed daily to ensure that project information and sample analyses requested is accurate and in accordance with the requirements in this Oversight QAPP.
PWT3 Field Team Leader, PWT3 Geochemist1, PWT3
Chemist/Analytical Coordinator2
Sample receipt The sample cooler will be checked for compliance with temperature and packaging requirements. Laboratory Sample Custodian
Sample logins Sample login will be reviewed for accuracy against the chain-of-custody form. Laboratory Sample Custodian
Laboratory data prior to release
to PWT3
Laboratory data will be reviewed to ensure that the data are accurate and meet the requirements in this Oversight QAPP. Before they are released, data will be validated as follows:
Laboratory Project Manager
• 100 percent of the data comply with the method- and project-specific requirements; any deviations or failure to meet criteria are documented for the project file.
Laboratory Analyst
• 100 percent of manual entries are free of transcription errors and manual calculations are accurate; computer calculations are spot-checked to verify program validity; data reported are compliant with method- and project-specific QC requirements; raw data and supporting materials are complete; spectral assignments are confirmed; descriptions of deviations from method or project requirements are documented; significant figures and rounding have been appropriately used; reported values include dilution factors; and results are reasonable.
Laboratory Peer Analyst
• Data reported comply with method- and project-specific QC requirements; the reported information is complete; the information in the report narrative is complete and accurate; and results are reasonable.
Laboratory Supervisor
• Data reported comply with method- and project-specific QC; analytical methods are performed in compliance with approved SOPs. Laboratory QAM
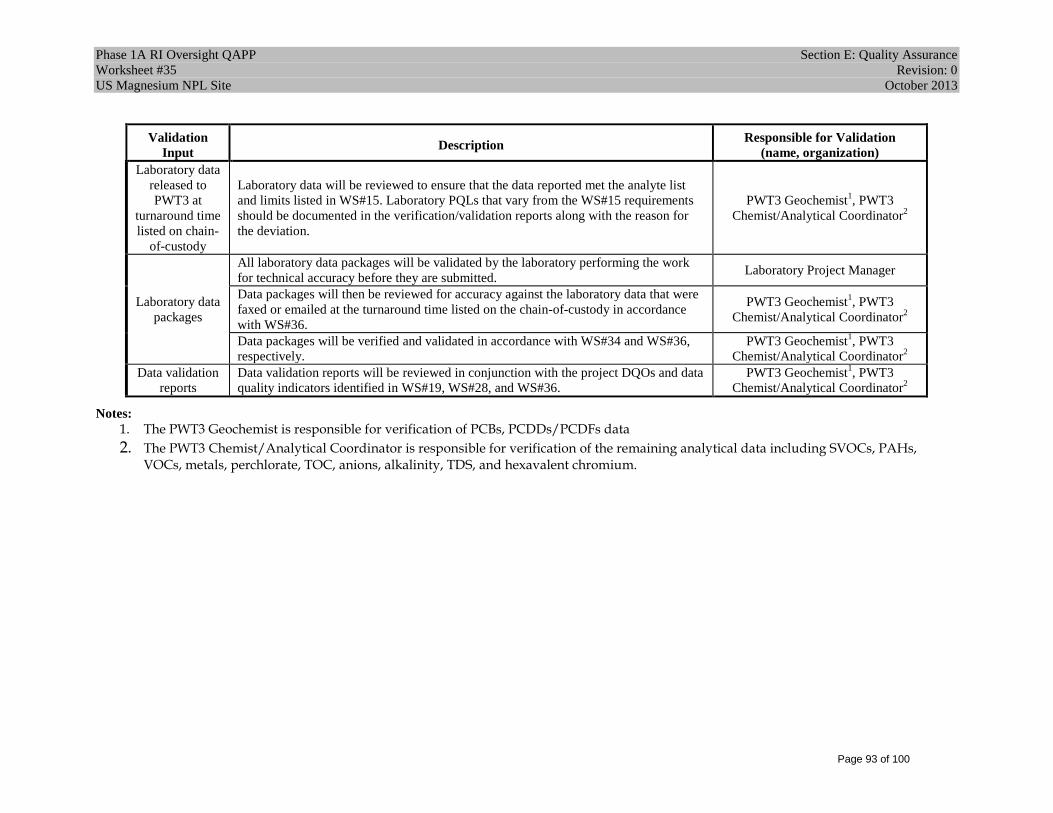
Phase 1A RI Oversight QAPP Section E: Quality Assurance Worksheet #35 Revision: 0 US Magnesium NPL Site October 2013
Page 93 of 100
Validation Input Description Responsible for Validation
(name, organization) Laboratory data
released to PWT3 at
turnaround time listed on chain-
of-custody
Laboratory data will be reviewed to ensure that the data reported met the analyte list and limits listed in WS#15. Laboratory PQLs that vary from the WS#15 requirements should be documented in the verification/validation reports along with the reason for the deviation.
PWT3 Geochemist1, PWT3 Chemist/Analytical Coordinator2
Laboratory data packages
All laboratory data packages will be validated by the laboratory performing the work for technical accuracy before they are submitted. Laboratory Project Manager
Data packages will then be reviewed for accuracy against the laboratory data that were faxed or emailed at the turnaround time listed on the chain-of-custody in accordance with WS#36.
PWT3 Geochemist1, PWT3 Chemist/Analytical Coordinator2
Data packages will be verified and validated in accordance with WS#34 and WS#36, respectively.
PWT3 Geochemist1, PWT3 Chemist/Analytical Coordinator2
Data validation reports
Data validation reports will be reviewed in conjunction with the project DQOs and data quality indicators identified in WS#19, WS#28, and WS#36.
PWT3 Geochemist1, PWT3 Chemist/Analytical Coordinator2
Notes: 1. The PWT3 Geochemist is responsible for verification of PCBs, PCDDs/PCDFs data 2. The PWT3 Chemist/Analytical Coordinator is responsible for verification of the remaining analytical data including SVOCs, PAHs,
VOCs, metals, perchlorate, TOC, anions, alkalinity, TDS, and hexavalent chromium.

Phase 1A RI Oversight QAPP Section E: Quality Assurance Worksheet #36 Revision: 0 US Magnesium NPL Site October 2013
Page 94 of 100
36.0 ANALYTICAL DATA VALIDATION (QAPP WORKSHEET #36)
Data validation is implemented to provide a quality check on the laboratory system generating the data. The validity of field measurements and analytical data will be evaluated using the precision and accuracy parameters, which are quantitative and qualitative statements that describe data quality. Data validation techniques include accepting, rejecting, or qualifying the data on the basis of acceptance criteria defined in this Oversight QAPP. Data verification will be performed by an independent data reviewer from the PWT3 team in accordance with the following guidance:
• U.S. EPA Contract Laboratory Program National Functional Guidelines for Superfund Organic Methods Data Review (EPA 2008)
• U.S. EPA Contract Laboratory Program National Functional Guidelines for Inorganic Superfund Data Review (EPA 2010)
• U.S. EPA Contract Laboratory Program National Functional Guidelines for Chlorinated Dioxin/Furan Data Review (EPA 2011b)
• Guidance for Labeling Externally Validated Laboratory Analytical Data for Superfund Use (EPA 2009).
This section describes the minimum procedures that will be used to validate laboratory data. This section also discusses procedures for verifying that the data are adequate to meet project quality objectives (PQOs) and measurement quality objectives (MQOs) for the project.
36.1 ANALYTICAL DATA VALIDATION
PWT3 will validate all laboratory data in accordance with current EPA National Functional Guidelines (EPA 2008, 2009, 2010, 2011b). Ninety percent of the data for COPCs will undergo cursory validation and 10 percent of the data for COPCs will undergo full validation for this project. Requirements for cursory and full validation are listed below. The performing laboratories are required to supply verified data and packages fully complete for systematic National Functional Guideline validation by PWT3.
36.1.1 Cursory Data Validation
Cursory validation (classified by the EPA as a Stage 2a validation) will be completed on 90 percent of the summary data packages for analysis of COPCs. The remaining 10 percent of the packages will be subjected to full validation. The data reviewer is required to notify the EPA and request any missing information needed from the laboratory. Elimination of the data from the review process is not allowed. All data will be qualified as necessary in accordance with established criteria. Data summary packages will consist of sample results and QC summaries, including calibration and internal standard data.
36.1.2 Full Data Validation
Full validation (classified by the EPA as a Stage 3VME validation) will be completed on 10 percent of the full data packages for analysis of COPCs. Stage 3 validation builds on a Stage 2b validation which will be conducted following the Stage 2a validation. The data reviewer is required to notify the EPA and request any missing information needed from the laboratory. Elimination of data from the review process is not allowed. All data will continue through the validation process and will be qualified in accordance with established criteria. Data summary packages will consist of sample results, QC summaries, and all raw data associated with the sample results and QC summaries. Quantitative calculations will be conducted by PWT3 to verify laboratory calculations, based on the raw instrumental data provided by the laboratory.

Phase 1A RI Oversight QAPP Section E: Quality Assurance Worksheet #36 Revision: 0 US Magnesium NPL Site October 2013
Page 95 of 100
36.1.3 Data Validation Criteria
The data validation criteria are defined in both project-specific documents and EPA National Functional Guidelines. Data validation criteria are defined in the following documents:
• Worksheets #12, #19, #24, #25, #28, and #36 define project-specific validation criteria. • The analytical methods and laboratory SOPs identify criteria analytical-specific validation criteria
The current EPA National Functional Guidelines (EPA 2008, 2009, 2010, 2011b) define validation criteria and practices that are applicable for Superfund projects. Validation of PCBs, PCDDs/PCDFs, SVOCs, PAHs, VOCs, metals, perchlorate, TOC, anions, alkalinity, TDS, and hexavalent chromium will be conducted in accordance with the documents listed above. Validation will first be conducted by the Laboratory QAM, as identified in WS#35 then by members of the PWT3 team. The PWT3 Geochemist has expertise in validation in PCBs and PCDDs/PCDFs. The PWT3 Chemist/Analytical Coordinator has expertise in validation of the remaining analytical data that will be collected at the Site.

Phase 1A RI Oversight QAPP Section E: Quality Assurance Worksheet #37 Revision: 0 US Magnesium NPL Site October 2013
Page 96 of 100
37.0 USABILITY ASSESSMENT (QAPP WORKSHEET #37)
Refer to the Phase 1A RI SAP for the useability assessment of the ERM/US Magnesium collected data. For this Oversight QAPP, the following elements will be considered in the useability assessment of the split sampling data.
37.1 MEASUREMENT QUALITY OBJECTIVES
All analytical results will be evaluated in accordance with PARCC parameters to document the quality of the data and to ensure that the data are of sufficient quality to meet the project objectives. Of these PARCC parameters, precision and accuracy will be evaluated quantitatively by collecting the QC samples listed in WS#12.
The following subsections describe each of the PARCC parameters and how they will be assessed within this project.
37.1.1 Precision
Precision is the degree of mutual agreement between individual measurements of the same property under similar conditions. Usually, combined field and laboratory precision are evaluated by collecting and analyzing field duplicates and then calculating the variance between the samples, typically as a relative percent difference (RPD):
( ) %1002/
xBA
BARPD
+−
=
where:
A = First duplicate concentration B = Second duplicate concentration
Field sampling precision is evaluated by analyzing field duplicate samples. Laboratory analytical precision is evaluated by comparing analytical results of field samples with those of field duplicates, laboratory matrix duplicates, or by analyzing MXS of field samples along with MSD. For this project, MXS/MSD samples will be generated for all organic analytes. MXS/MSDs or matrix duplicates will be used to assess precision for inorganic analytes. The results of the analysis of each MXS/MSD or duplicate pair will be used to calculate an RPD for evaluating precision. WS#28 presents the precision goals for this project.
37.1.2 Accuracy
Field accuracy will be assessed by collecting and analyzing equipment rinsate and source water blank QC samples. These QC samples will be used to evaluate the potential for target analytes to enter samples as a result of sampling processes.
A program of sample spiking will be conducted to evaluate laboratory accuracy. This program includes analysis of the MXS/MSD samples, LCS or blank spikes, surrogate standards, and method blanks. MS samples will be prepared and analyzed at a frequency of 5 percent for samples that will require analysis for inorganic chemicals. LCS or blank spikes are also analyzed at a frequency of 5 percent or per

Phase 1A RI Oversight QAPP Section E: Quality Assurance Worksheet #37 Revision: 0 US Magnesium NPL Site October 2013
Page 97 of 100
extraction batch, whichever is most frequent. Surrogate standards, where available, are added to every sample analyzed for organic constituents. The results of the spiked samples are used to calculate the percent recovery (%R) for evaluating accuracy.
100covRe xT
CSeryPercent −=
where:
S = Measured concentration in the spiked water or soil sample
C = Unspiked water or soil sample concentration T = True or actual concentration of the spike
A similar calculation may be expressed for air as:
100covRe xT
MSeryPercent −=
where:
S = Measured mass in sample M = Unspiked air sample mass T = True or actual mass of the spike
WS#28 presents accuracy goals for this investigation based on the %R of laboratory, matrix, and surrogate spikes. Results that fall outside the accuracy goals will be evaluated further on the basis of the results of other QC samples.
37.1.3 Representativeness
Representativeness expresses the degree to which sample data accurately and precisely represent the characteristics of a population, variations in a parameter at a sampling point, or an environmental condition that they are intended to represent. For this project, representative data will be obtained through careful selection of sampling locations and analytical parameters. Representative data will also be obtained through proper collection and handling of samples to avoid interference and minimize contamination.
Representativeness of data will also be ensured through consistent application of established field and laboratory procedures. Laboratory blank samples will be evaluated for the presence of contaminants to aid in evaluating the representativeness of sample results. Data determined to be nonrepresentative, by comparison with existing data, will be used only if accompanied by appropriate qualifiers and limits of uncertainty.
37.1.4 Completeness
Completeness is a measure of the percentage of project-specific data that are valid. Valid data are obtained when samples are collected and analyzed in accordance with QC procedures outlined in this Oversight QAPP, and when none of the QC criteria that affect data usability are exceeded. When all data validation is
Phase 1A RI Oversight QAPP Section E: Quality Assurance Worksheet #37 Revision: 0 US Magnesium NPL Site October 2013
Page 98 of 100
completed, the percent completeness value will be calculated by dividing the number of useable sample results by the total number of sample results planned for this investigation.
As discussed further in Section 37.2, completeness will also be evaluated as part of the data quality assessment (DQA) process (EPA 2006a). This evaluation will help determine whether any limitations are associated with the decisions to be made based on the data collected.
37.1.5 Comparability
Comparability expresses the confidence with which one data set can be compared with another. Comparability of data will be achieved by consistently following standard field and laboratory procedures and by using standard measurement units in reporting analytical data. Field procedures will be standardized to ensure comparability. The comparability of laboratory data will be assured by use of established and approved analytical methods, consistency in the basis of analysis (wet weight, volume, or similar units), and consistency in reporting units (parts per million, parts per billion, and so forth).
37.1.6 Detection and Quantitation Limits
The MDL and IDL are the minimum concentrations of an analyte that can be reliably distinguished from background noise for a specific analytical method. The quantitation limit represents the lowest concentration of an analyte that can be accurately and reproducibly quantified in a specific sample matrix. Project-required reporting limits (PRRLs) are CRQLs for specific analytical methods and sample matrices, such as soil or water, and are typically several times higher than the MDL to allow for matrix effects. PRRLs/CRQLs, which are established by the EPA in the scope of work for subcontract laboratories, are set to establish minimum criteria for laboratory performance; actual laboratory quantitation limits may be substantially lower.
Analytical methods have been selected for this project so that the CRQL for each target analyte is below the applicable comparison criteria wherever practical. WS#15 in the Final DMA Work Plan (EPA 2012) compares the target quantitation limits (TQLs) for the selected analytical methods with comparison criteria. This comparison shows that the analytical methods selected and the associated CRQLs and MRLs are capable of quantifying the CPOCs at concentrations below the applicable screening criteria, in most cases. The listed methods will be used unless reasonable grounds are established for pursuing non-routine methods. All analytes will be reported as estimated values if concentrations are less than CRQLs/MRLs but greater than MDLs or IDLs, as appropriate. This procedure is being adopted to help ensure that analytical results can effectively be compared with comparison criteria for certain compounds where the screening criteria are near or below the CRQLs/MRLs. This procedure also will help to ensure that subsequent statistical evaluations of the data will not be biased by high-value nondetect results.
37.2 RECONCILIATION WITH USER REQUIREMENTS
After environmental data have been reviewed, verified, and validated in accordance with the procedures, the data must be further evaluated to determine whether DQOs have been met. To the extent possible, PWT3 will follow the DQA process to verify that the type, quality, and quantity of data collected are appropriate for their intended use. DQA methods and procedures are outlined in EPA’s Data Quality Assessment: A Reviewer’s Guide (EPA 2006a). The DQA process includes five steps: (1) review the PQOs and sampling design; (2) conduct a preliminary data review; (3) select a statistical test; (4) verify the assumptions of the statistical test; and (5) draw conclusions from the data.

Phase 1A RI Oversight QAPP Section E: Quality Assurance Worksheet #37 Revision: 0 US Magnesium NPL Site October 2013
Page 99 of 100
The EPA project team will systematically assess data quality and data usability when the five-step DQA process is not completely followed because the PQOs are qualitative. This assessment will include the following:
• A review of the sampling design and sampling methods to verify that these were implemented as planned and are adequate to support project objectives
• A review of project-specific data quality indicators for PARCC and quantitation limits to evaluate whether acceptance criteria have been met
• A review of project-specific PQOs to determine whether they have been achieved by the data collected
• An evaluation of any limitations associated with the decisions to be made based on the data collected.
The final report for the project will discuss any potential impacts of these reviews on data usability and will clearly define any limitations associated with the data.

Phase 1A RI Oversight QAPP References Revision: 0 US Magnesium NPL Site October 2013
Page 100 of 100
REFERENCES
U.S. Environmental Protection Agency (EPA). 2001. EPA Requirements for Quality Assurance Project Plans, EPA QA/R-5. Office of Environmental Information. Washington, DC. EPA/240/B-01/003. March.
EPA. 2005. Uniform Federal Policy for Quality Assurance Project Plans, Evaluating, Assessing, and Documenting Environmental Data Collection and Use Programs, Part 1: UFP-QAPP Manual. Final. Version 1. Intergovernmental Data Quality Task Force. EPA-505-B-04-900A. March.
EPA. 2006a. Data Quality Assessment: A Reviewer’s Guide, (QA/G-9R) EPA/240/B-06/002. February.
EPA. 2006b. Guidance on Systematic Planning using the Data Quality Objectives Process, QA/G-4. EPA/240/B-06/001. February.
EPA. 2007. Guidance for Preparing Standard Operating Procedures, QA/G-6. Office of Environmental Information. Washington, D.C. EPA/600/B-07/001, April.
EPA. 2008. U.S. EPA Contract Laboratory Program National Functional Guidelines for Superfund Organic Methods Data Review. EPA-540-R-08-01. June.
EPA. 2009. Guidance for Labeling Externally Validated Laboratory Analytical Data for Superfund Use. EPA 540-R-08-005. January.
EPA. 2010. U.S. EPA Contract Laboratory Program National Functional Guidelines for Inorganic Superfund Data Review. EPA-540-R-10-011. January.
EPA. 2011a. Contract Laboratory Program Guidance for Field Samplers. EPA 540-R-09-03. January.
EPA. 2011b. U.S. EPA Contract Laboratory Program National Functional Guidelines for Chlorinated Dioxin/Furan Data Review. EPA-540-R-11-016. September.
EPA. 2012. Final Demonstration of Method Applicability Work Plan for Soil, Sediment, Waste, and Water, Preparatory to Phase-1A Remedial Investigation. US Magnesium NPL Site. September.
EPA. 2013. Phase 1A Remedial Investigation Sampling and Analysis Plan to Identify Chemicals of Potential Concern in Soils, Sediment, Solid Waste, Water and Air, and Receptor Surveys; Revision 0 for PRI Areas 2 and 8 through 17. US Magnesium NPL Site. September.
Pacific Western Technologies, Ltd. (PWT) 2013. Oversight Site-Specific Health and Safety Plan. US Magnesium NPL Site. September 2013.

Phase 1A RI Oversight QAPP Attachments Revision: 0 US Magnesium NPL Site October 2013
ATTACHMENTS

Phase 1A RI Oversight QAPP Attachments Revision: 0 US Magnesium NPL Site October 2013
ATTACHMENT 9A: ACCESS AGREEMENT BETWEEN BLM AND EPA


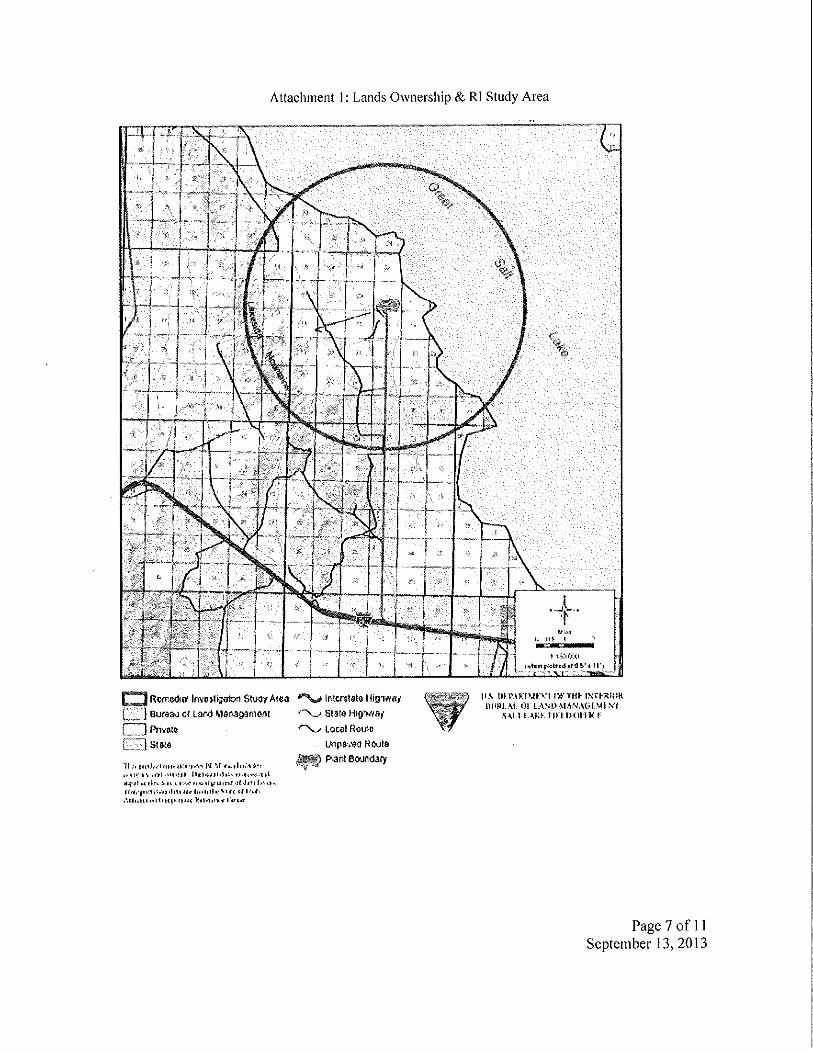


Phase 1A RI Oversight QAPP Attachments Revision: 0 US Magnesium NPL Site October 2013
ATTACHMENT 14A: SPLIT SAMPLING FIELD DATA SHEET

Page 1 of 1
SPLIT SAMPLING FIELD DATA SHEET
US Magnesium NPL Site
Phase 1A Remedial Investigation
Date: ____________________ Sample Time: ____________________
EPA Split Sample ID: ___________________________ ___
US Mag Paired Sample ID: Sample Interval: _ _
Split Accepted By: ________ _ Split Accepted From: _______ __ _
Sample GPS Coordinates: ______________ ______
Sample Matrix: Soil Sed., Exposed Sed., Saturated Solid Waste Surface Water Wastewater Groundwater
Sampling Method: ______________ ______ ________ Sample Type: Grab Bulk Composite
Sampling Equipment Used: ___________ ____________
Sample Location Description: ______________ __________________________ __ _ ___
________________________________________________________________________________________________________ ___
Sample Observations: Sample Odor: No Odor Slight Odor Strong Odor Sample Color: ____ __ __ _
Foreign Material Present: ____ _____________ _ Other: ______ ________ ___
Water Sample: Filtered: Yes [ 0.45µm 0.2µm] No Water Clarity: Clear Slightly Turbid Turbid
Temp (°F): __ ____ DO (mg/L): ___ ___ pH (pH units): _ _____ ORP (mV): ___ _ __
Conductivity (S/cm): __ ____ Turbidity (FNU): ______ Total Chlorine (mg/L): __________
Soil Sample: Moisture Content: Dry Moist Wet Description: ____ ___ _____
Notes:________________________________________________________________________________________________________ ___
_______________________________________________________________________________________________________ ____
_______________________________________________________________________________________________________ ____
Analyses Requested (see COC): VOCs (CLP SOM01.2) SVOCs (CLP SOM01.2) PAHs-SIM (CLP SOM01.2)
Total Metals (CLP ISM01.3) Diss. Metals (CLP ISM01.3) Alkalinity (SM2320B) pH (EPA 9045D) TOC (EPA 9060)
Anions (EPA 300.0) TDS (SM2540C) Haloacetic Acids (EPA 552.2) Hexavalent Chromium (EPA 7199)
Perchlorate (EPA 314/6850) PCBs (CLP CBC01.2) PCDDs/PCDFs (CLP DLM02.2) Other: ___
QC Samples: MS/MSD: ___________ ____ _ __ _ _ _ Other: __ ______ ____ _ __ _ _
Chain of Custody Number(s): _ ___
Shipment Via: FedEx Hand Deliver Other: ___________ ____ _ __ __ _
Split Sampling Field Data Sheet Completion (Sampler Signature / Date):
Signature: _________________________________ __________________ Date: ______________
Split Sampling Field Data Sheet QC Review Completion (Independent QC Reviewer Signature / Date):
Signature: _________________________________ __________________ Date: ______________

Phase 1A RI Oversight QAPP Attachments Revision: 0 US Magnesium NPL Site October 2013
ATTACHMENT 14B: OVERSIGHT DATA MANAGEMENT PLAN

OVERSIGHT
US MAGNESIUM NPL SITEEPA SITE IDENTIFICATION NO. UTN000802704
TOOELE COUNTY, UTAH
Pacific Western Technologies, Ltd.
OVERSIGHT DATA MANAGEMENT PLAN
US MAGNESIUM NPL SITEEPA SITE IDENTIFICATION NO. UTN000802704
TOOELE COUNTY, UTAH
October 2013
REVISION 0
Prepared by:
Pacific Western Technologies, Ltd.3000 Youngfield, Suite 300
Wheat Ridge, CO 80215
EPA SITE IDENTIFICATION NO. UTN000802704

Revision 0 i US Magnesium Oversight DMP
TABLE OF CONTENTS
LIST OF ACRONYMS...................................................................................................................I
1.0 INTRODUCTION .............................................................................................................1
2.0 DATA MANAGEMENT TEAM .........................................................................................1
3.0 DATABASE MANAGEMENT GOALS ..............................................................................2
4.0 DATA TYPES AND STORAGE .........................................................................................24.1 DATA TYPES .........................................................................................................24.2 DATA STORAGE/SCRIBE DATABASE...................................................................3
5.0 DATA MANAGEMENT PROCESS....................................................................................45.1 FIELD DATA MANAGEMENT................................................................................45.2 LABORATORY DATA MANAGEMENT..................................................................45.3 DATA ANALYSIS AND REPORTING .....................................................................55.4 DATA EXCHANGE.................................................................................................5
6.0 SYSTEM MANAGEMENT AND ADMINISTRATION........................................................56.1 DATABASE ADMINISTRATION ............................................................................56.2 QUALITY ASSURANCE AND QUALITY CONTROL...............................................66.3 DATABASE SECURITY AND BACKUPS ................................................................6
LIST OF ACRONYMSDMP Data Management PlanEDD electronic data deliverableEPA U.S. Environmental Protection AgencyERM Environmental Resource ManagementESRI Environmental Systems Research Institute, Inc.GIS geographic information systemPDF Portable Document FormatPWT Pacific Western TechnologiesPWT3 Team Pacific Western Technologies, Ltd. and Tetra Tech, Inc.QA Quality assuranceQAPP Quality Assurance Project PlanQC Quality controlSAP Sampling and Analysis PlanSite US Magnesium NPL SiteTT Tetra Tech, Inc.
LIST OF ATTACHMENTSAttachment 1 Split Sampling Field Data SheetAttachment 2 Scribe EDD TemplateAttachment 3 U.S. EPA Region 8 GIS Deliverable Guidance (January 2010)

Revision 0 1 US Magnesium Oversight DMP
1.0 INTRODUCTION
A variety of oversight data may be collected at the US Magnesium Site (Site) through a range oftechniques including, but not limited to: field observations, measurements and sampling, air monitoring,and laboratory analyses. This wide range of work will generate data that will need to be managedproperly. This Oversight Data Management Plan (DMP) was developed to provide a general descriptionof the data management practices and procedures to be implemented during oversight of the soil,sediment, solid waste, water, and air sampling activities.
The objective of the U.S. Environmental Protection Agency (EPA) field oversight is to confirm thatEnvironmental Resource Management (ERM)/US Magnesium implemented the field activities pursuantto the EPA-approved plans and that the results of the activities are representative and appropriate. Theobjective of the EPA split sampling is to confirm that the ERM/US Magnesium sample analytical resultsare reproducible and that the data are of acceptable quality for decision making.
The objectives of this Oversight DMP are to:
1. Outline database management goals and required functionality.
2. Describe the data management system and procedures.
3. Describe quality assurance (QA)/quality control (QC) methodologies and practices to ensure dataintegrity.
This Oversight DMP documents the various methods of collection, storage, and use of data that may becollected during the EPA oversight and the transmittal of data between the EPA and oversight contractors.This Oversight DMP also specifies how information will be managed, stored, transmitted, anddocumented to maintain the required level of information quality specified for the project.
2.0 DATA MANAGEMENT TEAM
Overall project organization and responsibilities for the PWT3 Team (Pacific Western Technologies[PWT] and Tetra Tech, Inc. [TT]) are defined in each activity-specific Oversight Quality AssuranceProject Plan (QAPP). All project staff will have some level of responsibility in implementing thisOversight DMP. The following are the key EPA and PWT3 Team personnel responsible forimplementing this Oversight DMP.
Ken Wangerud, EPA Remedial Project Manager, is responsible for overall implementation of the projectto ensure that data quality objectives are met.
Jeff Mosal, EPA Region 8 Data Lead for the US Magnesium Project, is responsible for implementing theEPA data management for the project and will act as the primary contact for data management issues.
Joe Schaefer, EPA Environmental Response Team Scribe Lead, will assist the EPA with Scribe andScribe.NET implementations for the administrative record.
Catherine LeCours, PWT Project Manager, is responsible for: overall implementation of the project for PWT3, management of field and project personnel, and
serves as liaison to the EPA, team members, and all subcontractors oversight of the data management program.

Revision 0 2 US Magnesium Oversight DMP
Randy Dorian, TT Data Manager, has primary responsibility for: management of the EPA split-sampling Scribe database coordination with PWT3, EPA, and ERM/US Magnesium database participants obtaining and integrating ERM/US Magnesium-collected data for use in the split-sampling
program publishing the EPA-generated data contained in the EPA’s Scribe database to Scribe.NET.
Aaron Baird, PWT Field Team Leader, is responsible for: providing notification to laboratory of upcoming sampling activity and arranges for a sufficient
supply of sample containers and sample coolers generating sample labels and initiates trip report/chain-of-custody form preparing, reviewing and approving the sampling forms to insure that all samples were collected
appropriately compiling field forms, field notes, chain-of-custody forms and other field documentation and
updates the project files to provide a traceable record for data collection activities saving laboratory electronic data deliverables (EDDs) into appropriate locations on the PWT
server and verifying the accuracy of EDD import to Scribe or other electronic databases loading laboratory data into Scribe.
Robert Howe, TT Project Manager and Geochemist, is responsible for inspecting laboratory data deliverables (EDDs and data packages) for completeness ensuring proper data verification/validation by PWT3 validator(s) participating in the data assessment activities.
3.0 DATABASE MANAGEMENT GOALS
The EPA split-sampling and oversight program database structures and database administrationprocedures presented in this document are designed to accommodate the following goals, concepts, andfunctional requirements:
store attribute data, such as analytical results and sample collection information in Scribe implement QC procedures and applicable review rules. Additionally, database queries, macros,
Visual Basic for Applications, validation rules, and data entry procedures to promote dataintegrity and completeness may be used
automate data management and QC procedures to the greatest extent possible without sacrificingthe quality of data. Develop database check queries to promote data integrity and completeness
implement database security measures to maintain data integrity. This will include limitingread/write access and ensuring the stability of source data when used in conjunction with othermeans of accessing the data.
4.0 DATA TYPES AND STORAGE
4.1 DATA TYPES
The following are anticipated types of data that will be managed according to specific workflows in orderto assure ensure data quality and accuracy are preserved.
laboratory analytical data (e.g., soil, sediment, water, air) field-generated parameters (e.g., health and safety monitoring results, groundwater field
parameters) sample identification and sample characteristics (e.g. field forms of Attachment 1) sample collection field observations (e.g. field logbooks)

Revision 0 3 US Magnesium Oversight DMP
sample processing field observations (e.g. laboratory reports, validation reports) photographic documentation.
Information pertaining to the creation and verification of these data (i.e., metadata) will also be stored inScribe, to the extent applicable.
The EPA does not anticipate collecting spatial data during oversight activities because ERM/USMagnesium is responsible for collecting and managing that data, and providing it to the EPA.
Electronic and hard-copy data will be generated during split sampling activities. Anticipated electronicdata includes laboratory EDDs that can be loaded into Scribe. EDDs from non-EPA Analytical Programlaboratories will be formatted as specified in Attachment 2. The non-EPA Analytical Program laboratoryEDD (Attachment 2) is based on the EPA Analytical Program laboratory EDD to ensure consistency.Both non-EPA and EPA Analytical Program laboratories will submit electronic data packages in PortableDocument Format (PDF) files.
Anticipated hard-copy data include field notes and logbooks, field sampling forms, chain-of-custodyforms, phone logs, hard-copy laboratory reports, and verification/validations worksheets. Some or all ofthis hard copy data may be scanned into electronic PDFs. Electronic scanned versions (e.g., PDF) of field-generated documents will be provided to the EPA on as requested and, at a minimum, at the end of eachsampling event.
Additional documents may be created through the analysis of existing data that may be exported directlyfrom the creation software into a PDF. As applicable, PDF documents will be provided to EPA to ensurethe EPA and other project participants have access to these data.
4.2 DATA STORAGE/SCRIBE DATABASE
The EPA’s Scribe database will be used as the primary management and storage tool for the EPAoversight field and laboratory data collected during oversight activities. Scribe is an Access databasedesigned to manage environmental data. The system has the flexibility to store sampling, observational,monitoring field, and chemical data. Scribe.NET is a management and publishing system that allows fortracking changes to project databases and for distributing the data to interested parties.
If needed, geographic information system (GIS) software developed by Environmental Systems ResearchInstitute, Inc. (ESRI) will be the primary software used for GIS coverages. Open database connectivitydrivers enable ArcGIS to link directly to attribute data stored in MS Access (and Scribe). Other softwarethat will be used for certain data maintenance, conversion, and spatial analysis functions may includeESRI’s ArcGIS and 3D Analyst, and AutoCAD, developed by Autodesk, Inc.
ERM/US Magnesium-collected and generated data will be electronically transferred by ERM/USMagnesium from EQuIS into a Scribe database. Data will be retained in a formal Scribe database for useby the EPA. The EPA anticipates using ERM/US Magensium’s laboratory and spatial data in Scribe foruse in the evaluation of the reproducibility of the data and for preparation of reports.
The spatial data collected by ERM/US Magnesium and used by the EPA will comply with the EPARegion 8 GIS requirements (see Attachment 3).
A document repository, the Superfund Document Management System, maintained by the EPA may alsobe used to store and facilitate transmission of PDFs and other documents.

Revision 0 4 US Magnesium Oversight DMP
5.0 DATA MANAGEMENT PROCESS
The following subsections document the general data management process for the anticipated types ofoversight and split-sampling data generated by the EPA.
5.1 FIELD DATA MANAGEMENT
Sample locations for oversight activities are identified in the activity-specific Sampling and AnalysisPlans (SAP). All locations will be field confirmed by ERM/US Magnesium prior to each sampling event,and re-confirmed by the EPA prior to sampling. Sample location data will be collected and managed byERM/US Magnesium. The EPA split sample information, including type, analytical methods, analytes,bottles, and laboratories, are identified in the EPA’s activity-specific Oversight QAPPs.
As indicated in Section 4.1, the EPA will observe and record relevant field sample collection andprocessing data. ERM/US Magnesium has primary responsibility for sample collection and sampleprocessing observation data and the EPA’s responsibility is limited to oversight and acceptance of splitsamples. The EPA will record split-sample identification numbers on split-sampling forms included asAttachment 1.
Relevant field data will be entered into Scribe and 100 percent verified for accuracy and completenessagainst original field notes.
5.2 LABORATORY DATA MANAGEMENT
Split-sampling laboratory-generated analytical data will be created for all major media types at the Site,including soil, sediment, surface water, groundwater, solid waste, and air. All laboratories have beenprovided with the specifications of the EDD format required for direct loading into Scribe (as a conditionof the subcontract). A copy of the non-EPA EDD laboratory format and its specifications is included inAttachment 2. Management of laboratory data will follow the steps described below:
1. The Field Team Leader will load relevant field data into Scribe.
2. The EPA Contract Laboratory Program Support System laboratories will report analytical data inEDDs provided in Scribe format. The EPA Analytical Program will load the EDD for the sample tothe Sample Management Office Portal. The PWT3 Team will retrieve the EDD from the Portal andload the data into Scribe.
3. Non-EPA laboratories (those subcontracted directly to the PWT3 Team) have been instructed toprovide EDDs in Scribe format, as well, and have been provided the instructions and template foundin Attachment 2. These EDDs will be imported into Scribe; however, some manual manipulation ofthese EDDs may be required for Scribe compatibility.
4. Once the data have been uploaded into Scribe, the Data Manager will coordinate with PWT3validator(s) to generate database exports for use during the verification/validation process.
5. The PWT3 validator(s) will oversee QA/QC verification of the draft electronic data by pulling theinformation from the database and comparing it against field notes and laboratory data packagereports to verify accuracy of EDDs. Verification will be conducted on 100% of the data. This willensure that all data being reported electronically accurately reflect data reported in other forms.
6. Laboratory data will be validated per the details specified in the activity-specific SAPs and QAPPs,under the direction of the QA/QC Manager.

Revision 0 5 US Magnesium Oversight DMP
7. The EPA’s contractor will internally track the review and verification/validation processes, alongwith any issues identified. Any issues identified that require correction will be communicated to theProject Manager. Any corrections or modifications to the data will be officially recorded in thevarious comments or notes fields in the applicable tables.
8. Once data from each sampling event have been verified/validated, the Data Manager will upload andpublish these data to a Scribe project via Scribe.NET.
9. Post-validation data modifications will be incorporated using standard validation qualifiers, changesin status based on qualification, and updated approval codes.
It is understood that ERM/US Magnesium will provide analytical data to the EPA in a Scribe database inwhich ERM/US Magnesium’s analytical data have been verified and validated, and all required relationalinformation is included. In addition, the EPA may request individual EDDs from ERM/US Magnesium’sanalytical laboratory as needed. The EPA will compare the ERM/US Magnesium data to the splitsampling data to evaluate the reproducibility of ERM/US Magnesium’s program.
5.3 DATA ANALYSIS AND REPORTING
Standard reporting formats in Scribe, or custom report formats, may be used to create tables, shape files,or data files for visualization, document production, or further data analysis. Standardized reports mayalso be developed to mimic data entry forms that can then be used for QA checking of the data entryprocess. Data retrieval reports will be developed to provide data displays in formats as requested byproject managers and technical staff. The Data Manager will work closely with the Project Manager toensure appropriate queries and reporting formats are used consistent with the specific reportingrequirements.
Spatial data is expected to be generated by ERM/US Magnesium for the Site project during field samplingactivities. The EPA will use the ERM/US Magnesium-collected spatial data through the ERM/USMagnesium-provided Scribe database, as discussed elsewhere in this Oversight DMP and in ERM/USMagnesium’s DMP, as attached to the activity-specific SAPs.
5.4 DATA EXCHANGE
Once it is published via Scibe.NET, all project staff, the EPA, the EPA’s oversight contractors, andERM/US Magnesium will have access to the database through a Scribe subscription. Scribe subscriptiondatabases are a copy of the published databases, ensuring the master copy is not modified. The publisheddatabase is considered to be the master copy, and only the database owner can modify data. Once thedatabase owner publishes the data, the subscribers can view the latest modifications after updating theirScribe.NET subscription.
6.0 SYSTEM MANAGEMENT AND ADMINISTRATION
This section describes the database administration, general database configuration, and QA/QCprocedures that will be used for data related to split sampling.
6.1 DATABASE ADMINISTRATION
The split sample database will have a single Data Manager who is responsible for the following: determining the scope of data and acceptable data sources designing or modifying electronic database structures to accommodate new data and data users determining or modifying database entry procedure

Revision 0 6 US Magnesium Oversight DMP
determining and implementing QA/QC procedures providing mechanisms for timely data retrieval establishing security measures that allow only authorized personnel to add, modify, or delete data establishing procedures for maintaining adequate database performance during data entry and
retrieval (for instance, defragmenting the database, building “queries” or “views” that link two ormore tables, creating data reporting templates, and upgrading software and hardware as needed).
Typically, the Data Manager will conduct the following activities: design the database and incorporatedata integrity constraints on specific fields; develop electronic data entry forms; create automated dataconversion routines; develop and automate any data processing steps; create data retrieval tools such asstandardized reports; and ensure periodic database backups.
6.2 QUALITY ASSURANCE AND QUALITY CONTROL
PWT’s corporate QA/QC procedures will be followed. The goal is to provide a methodology map tofacilitate PWT’s ability to provide products and services that meet or exceed applicable requirements.QA/QC procedures shall be implemented to effectively administer and control data integrity. Wherenecessary, QA/QC procedures may be updated and revised to improve data quality.
The primary data that will be generated are analytical results from split samples sent to the non-EPA andEPA Analytical Program laboratories. The laboratories will be responsible for laboratory data entry andperforming error checking routines (both record and batch group checking) prior to reporting results. Thelaboratory is responsible for analysis and internal QA/QC procedures.
If errors are identified in the laboratory EDDs, the Data Manager will indicate those errors, return theEDD to the laboratory and the laboratory shall submit a corrected EDD.
Specific QA/QC checks on the data in the database have been described as part of the process in Sections5.1 and 5.2.
6.3 DATABASE SECURITY AND BACKUPS
Database security will be implemented and maintained throughout the project duration. Read/write accessto each database is restricted to the Data Manager and any other staff designated by the Data Manager.All project staff have read-only access to the databases, so that the databases can be accessed but cannotbe changed. If changes to the database structure affecting information content are required, the DataManager must notify and involve the various project investigators and data users to verify that importantinformation is not inadvertently removed or made inaccessible.
The Site-specific Scribe database will be maintained on the PWT local area network and stored separatelyon a database-specific network share. PWT creates and controls user level access to defined networkshares. These shares are setup operationally on a network attached storage device which is physicallyseparate from the local servers. The network attached storage device is backed up using weekly full anddaily differential schemas. Backups are made to removable tapes and removable external storage deviceswith storage media removed from the office on daily basis.

Page 1 of 1
SPLIT SAMPLING FIELD DATA SHEET
US Magnesium NPL Site
Phase 1A Remedial Investigation
Date: ____________________ Sample Time: ____________________
EPA Split Sample ID: ___________________________ ___
US Mag Paired Sample ID: Sample Interval: _ _
Split Accepted By: ________ _ Split Accepted From: _______ __ _
Sample GPS Coordinates: ______________ ______
Sample Matrix: Soil Sed., Exposed Sed., Saturated Solid Waste Surface Water Wastewater Groundwater
Sampling Method: ______________ ______ ________ Sample Type: Grab Bulk Composite
Sampling Equipment Used: ___________ ____________
Sample Location Description: ______________ __________________________ __ _ ___
________________________________________________________________________________________________________ ___
Sample Observations: Sample Odor: No Odor Slight Odor Strong Odor Sample Color: ____ __ __ _
Foreign Material Present: ____ _____________ _ Other: ______ ________ ___
Water Sample: Filtered: Yes [ 0.45µm 0.2µm] No Water Clarity: Clear Slightly Turbid Turbid
Temp (°F): __ ____ DO (mg/L): ___ ___ pH (pH units): _ _____ ORP (mV): ___ _ __
Conductivity (S/cm): __ ____ Turbidity (FNU): ______ Total Chlorine (mg/L): __________
Soil Sample: Moisture Content: Dry Moist Wet Description: ____ ___ _____
Notes:________________________________________________________________________________________________________ ___
_______________________________________________________________________________________________________ ____
_______________________________________________________________________________________________________ ____
Analyses Requested (see COC): VOCs (CLP SOM01.2) SVOCs (CLP SOM01.2) PAHs-SIM (CLP SOM01.2)
Total Metals (CLP ISM01.3) Diss. Metals (CLP ISM01.3) Alkalinity (SM2320B) pH (EPA 9045D) TOC (EPA 9060)
Anions (EPA 300.0) TDS (SM2540C) Haloacetic Acids (EPA 552.2) Hexavalent Chromium (EPA 7199)
Perchlorate (EPA 314/6850) PCBs (CLP CBC01.2) PCDDs/PCDFs (CLP DLM02.2) Other: ___
QC Samples: MS/MSD: ___________ ____ _ __ _ _ _ Other: __ ______ ____ _ __ _ _
Chain of Custody Number(s): _ ___
Shipment Via: FedEx Hand Deliver Other: ___________ ____ _ __ __ _
Split Sampling Field Data Sheet Completion (Sampler Signature / Date):
Signature: _________________________________ __________________ Date: ______________
Split Sampling Field Data Sheet QC Review Completion (Independent QC Reviewer Signature / Date):
Signature: _________________________________ __________________ Date: ______________

Lab Results EDD Field Descriptions
PROVIDE TO PWT IN EXCEL FORMAT WITH HEADERS AS NOTED ON FIRST TAB OF THIS WORKSHEET
Scribe Fields Description Data Type Field Size
Samp_No Field Sample Number Text 25Analysis Lab Analysis ( i.e VOCs) Text 100Analyte Analyte/Paramater name (i.e. Lead; Arsenic; etc.) Text 60Result_Units Result Unit of measurement Text 20Analytical_Method Lab Analytical Method (i.e. 8270M) Text 100Basis "Wet" for wet_weight basis reporting; "Dry" for dry_weight reporting Text 10
Cas_no Chemical Abstract Number (CAS) (Use NA if no CAS is assigned ) Text 50Comments Result Comments Text 250Date_Analyzed Date Analysis was performed by Lab DateTime 0Date_Collected Date Sample Collected as reported by the Lab DateTime 0Date_Extracted Date Samples Extracted by Lab DateTime 0Date_Received Date Samples Received by Lab DateTime 0Detected Detected or Not Detected. i.e. "Y" for detected analytes or "N" for non_detects. Text 20Dilution_Factor Effective test dilution factor. Numeric 0Extraction_Method Lab Extraction Method (i.e. MEP; TCLP; SPLP; EP) Text 100Final_Volume The final volume of the sample after sample prepartion. Include all dilution factors. Numeric 0Final_Volume_Unit The unit of measurement that corresponds to the final_amount. Text 20Lab_Batch_No Lab Batch Number Text 30Lab_Coc_No Chain of Custody Number as reported by the Lab Text 50Lab_Location_ID Sample Location ID reported by the lab Text 30Lab_Name Laboratory that performed the analysis Text 50
Lab_Result_Qualifier Result Qualifier as Reported by the Lab (USE: J; U; E; and/or D. DO NOT USE ND or < > for not detected, instead use U and Reporting Limit as RESULT
number/value .) Text 10Lab_Samp_No Lab Sample Number Text 25Matrix_ID Matrix ID reported by Lab. (i.e. Soil; Water; Air; etc.) Text 20MDL Method Detection Limit (MDL) Numeric 0MDL_Units MDL Units Text 20Percent_Lipids Percent Lipids Numeric 0Percent_Moisture Percent Moisture of the sample portion used in the test Numeric 0Percent_Recovery Percent Recovery Numeric 0Percent_Solids Percent Solids Numeric 0QA_Comment QA Comment Text 250QA_Date QA Date DateTime 0QA_UserName QA Username Text 50QAFlag QAFlag (Values: 0 = Not QAed 1=QAed) Numeric 0QC_Type Laboratory_Control_Sample; Method_Blank Text 40Quantitation_Limit Quantitation Limits as determined by the lab. Numeric 0Quantitation_Limit_Units Quantitation Limit Units Text 20Reportable_Result "Yes" for results which are considered to be reportable; or "No" for other results Text 5Reporting_Limit Reporting Limits as determined by the lab. Numeric 0Reporting_Limit_Units Reporting Limit Units Text 20Result Result (number) returned from lab Numeric 0Result_Type_Code "TRG" for a target or regular result; "TIC" for tentatively identifed compounds; "SUR" for surrogates; "IS" for internal standards; or "SC" for spiked compounds. Text 10Sample_Type_Code Code which distinguishes between different types of samples. For example normal samples must be distinguished from lab method blank samples Text 10SubSample_Amount Amount of sample used for test. Numeric 0SubSample_Amount_Unit Unit of measurement for subsample amount. Text 20Test_Type Type of test (i.e. "initial"; "reextract1"; "reextract2"; "reextract3"; "reanalysis"; "dilution1"; "dilution2"; and "dilution3") Text 10Total_Or_Disolved "D" for dissolved or filtered (metal) concentration; or "T" for everything else Text 1
(first tab of worksheet not in PDF format for DMP however will be provided to laboratories in Excel format)
Attachment 2
Scribe EDD Template
Oversight Data Management Plan - US Magnesium Site

U.S. EPA Region 8 GIS Deliverable Guidance
(January 2010) Introduction and Scope This document is intended to specify GIS file delivery formats for all materials developed in support of CERCLA related site work within EPA Region 8. It is the intent of EPA Region 8 to acquire, catalog and manage all site specific GIS files comprehensively across all active CERCLA sites to: 1) ensure future use and access to EPA, 2) provide an archive of work accomplished, 3) maintain and serve files that spatially represent all sites, and 4) provide a basis for on-going and future activities such as Five Year Review. While the initial emphasis will be to ensure all GIS files for NPL sites are captured and managed, we consider capturing all GIS materials developed that support any of the Superfund Pipeline process under the requirements of this standard. These include GIS and imagery files that support Site Assessment, NPL Listing, Removal, Remedial, Enforcement, and Five Year Review. GIS Data Files All final version spatially enabled files acquired or developed to support mapping and/or spatial analysis at a site are considered property of the EPA Region 8 Superfund Program and are required to be submitted to EPA. This includes but is not limited to all GIS, CAD, and image formatted files used to develop maps for any scoping or decision document developed for EPA, as well as any spatial file used to inform a decision on site management or development. Only final versions of each layer are required for delivery to EPA, and must be in an approved format as specified in this document. In addition, all electronic geospatial data, whether vector or raster, must be project defined (have a projection defined and embedded in or associated with the data file), and in the case of CAD data must NOT be in page space or a custom site-specific projection. All CAD data should be in known real world coordinate space, ideally in geographic/decimal degrees/NAD83. Should tabular data be appropriate to connect location information with attribute information, then documentation specifying the primary and foreign keys is required. Should coordinate information be provided in tabular format it should contain at minimum the following fields:
ID – a unique identifier given to each feature Latitude – the Y coordinate in decimal degrees Longitude – the X coordinate in decimal degrees Horizontal Datum – the datum of the coordinates.
Additionally all static maps that appear in a Superfund document should be in an electronic Adobe PDF format with fonts embedded and at a resolution of 300 dots per inch (dpi) or greater. Finally, all ArcMap documents (.mxd) or equivalent map document formats used in final map production are also required for delivery to EPA with accompanying data in a stand-alone directory structure. Map document formats also need to be configured to use relative paths and not be set to use a printer-specific paper setting. Metadata and Projection Requirements All GIS files developed for EPA are required by Executive Order 12906 to have associated metadata. EPA requires FGDC compliant metadata on all GIS files developed for site support. Region 8 also requires that all dynamic maps (ArcMap documents) have metadata completed. The Content Standard
Page 1 of 4

for Digital Geospatial Metadata can be found at www.fgdc.gov. Metadata, including information about the data’s projection, can be developed using one of several built-in or add on tools within a GIS, and typically is associated with the geometry file as an XML file. EPA region 8 Program Support staff will be happy to consult and advise on development of required metadata. All GIS files submitted to EPA must have spatial reference information that describes the projection, datum, and where applicable the collection methods. The EPA requests that all vector data be submitted in geographic coordinate system, decimal degree units, and NAD83 datum. Raster data, such as aerial photographs may be submitted in their native projection, and maps should be in the appropriate projection/coordinate system for the area depicted. Delivery Requirements and Standard Organizational Structures EPA will accept data delivered on CD-Rom, DVD, or external hard drive, as well as direct electronic submission via email or FTP site. Other delivery methods may be allowed if those requirements present a significant burden or as technology changes. If the project is complex, a directory structure and readme text file in the upper level directory that describes the structure are required. Because EPA will be managing data across many sites, it is important to make your submittals as understandable as possible. A recommended directory structure is as follows: <Project_Name> |_ Docs (reports, SOPs, correspondence, and other such documents) |_ Images (aerial photos, satellite imagery, logos, DEMs, and other raster type data) |_ Maps (MXDs and PDFs. Map names should use the project name as a prefix) |_ Shapes (geodatabases, shape files, and other approved vector data formats) |_ Source (original unmodified data that may have been acquired from external/internal sources) |_ Tables (MS-Access databases, spreadsheets, delimited text files, or other such tabular data not
stored in a geodatabase) File naming conventions should be logical, consistent, and contain no spaces or special characters. An underscore may be used in lieu of a space.
Page 2 of 4

EPA Acceptable Data Formats The following file formats are considered acceptable and all maps and data must include an associated metadata document:
DATA Vector - projected to geographic, decimal degrees, NAD83 Shape File (.shp, .shx, .dbf, .prj, .sbx, .sbn) File Geodatabase (.gdb) Personal Geodatabase (.mdb) Oracle Dump (.dmp) XML Workspace Document with dependencies clearly documented (.xml) Raster – native projection acceptable TIFF image with world reference file or as a GeoTIFF (.tif, .tfw) JPEG image with world reference file (.jpg, .jpw) ERDAS Imagine image with pyramid file (.img, .rrd) MrSid image (.sid) ESRI Grid DEM TINs – appropriate projection/coordinate system for the area depicted ESRI TIN CAD - projected to geographic, decimal degrees, NAD83 DXF layer separates (.dxf) Tabular – primary keys should be clearly identified/documented MS-Access database (.mdb) MS-Excel spreadsheet (.xls) Delimited text file (.txt, .csv)
MAPS Static Adobe PDF at 300 dpi or better with embedded fonts (.pdf) Dynamic ArcMap document with associated data files in a stand-alone directory structure using relative paths (.mxd)
FGDC Compliant METADATA XML (.xml) FGDC CSDGM XML (.xml) FGDC CSDGM SGML (.sgml) FGDC CSDGM TXT (.txt)
U.S. EPA Region 8 GIS Contact John Wieber [email protected] (303) 312-6118
Page 3 of 4

Page 4 of 4
CHECKLIST The following checklist may be used to assist in complying with these standards: DATA
Is each vector file, CAD included, in geographic, decimal degrees, NAD83? Is each raster file in its native projection? Is each data file one of the EPA acceptable formats? Does each data file have FGDC compliant metadata in an associated file? Are the primary and foreign keys documented for tabular data? Is a README text file included with a directory structure explaining how the structure is organized? MAPS
Is each static map provided in an electronic format at a resolution of 300 dpi or higher? Does each static map have fonts embedded? Has the page and print setup for map documents been configured to NOT use printer-specific paper
settings? Are map documents set to use relative paths? Are map names prefixed with the project name? Are map documents accompanied with their relevant data in a stand-alone directory structure? Does each map have FGDC compliant metadata in an associated file?

Phase 1A RI Oversight QAPP Attachments Revision: 0 US Magnesium NPL Site October 2013
ATTACHMENT 14C: FIELD AND QAPP MODIFICATION FORMS

Oversight QAPP Attachment 14C-1 Section D: Sampling and AnalysisRevision 0
US Magnesium NPL Site October 2013
Page 1 of 1
Document Tracking Number: 14C-1-_______
Requested by: Date:
Description of Deviation:________________________________________________________________________________________________________________________________________________________________________________________________________________________________________________________________________________________________________________________________________________________________________________________________________________________________________________________________________________________________________________________________________________________________________________
EPA Region 8 has reviewed this field modification approves as proposed.
EPA Region 8 has reviewed this field modification and approves with the following exceptions:
________________________________________________________________________________________________________________________________________________________________________________________________________________________________________________________________________________________________________________________________________________________________________________________________________________________________________________________________________________________________________________________________________________________________________________
EPA Region 8 has reviewed this field modification and does not agree with the proposed approach forthe following reasons:
________________________________________________________________________________________________________________________________________________________________________________________________________________________________________________________________________________________________________________________________________________________________________________________________________________________________________________________________________________________________
______________________________________ _____________________EPA RPM or Designee Date
Each approved Field Modification Form will become part of Attachment 17B in the OversightQAPP and also incorporated into the appropriate Oversight Results Report. A copy is to beprovided to all recipients identified on QAPP Worksheet #3.
FIELD MODIFICATION APPROVAL FORMEPA Site Identification Number UTN000802704
US Magnesium Phase 1A Oversight QAPP
Oversight QAPP Attachment 14C-1 Section D: Sampling and AnalysisRevision 0
US Magnesium NPL Site October 2013
Page 1 of 1
Document Tracking Number: 14C-2-_______
RECORD OF OVERSIGHT QAPP MODIFICATION
INSTRUCTIONS: This form is required anytime a modification is being made to any worksheets or sectionsfor any portion of the Oversight QAPP, including attachments, tables, figures, and/or SOPs.
Requestor:
Title:
Name of Site/Field Event:
Date of Proposed Modification:
Modified QAPP Section(s):
Describe the Modification:
Justification or Reason for the Modification:
EPA Review/Approval: ________________________________________Date: ________________(RPM or designee)
Each approved Oversight QAPP Modification Form will become part of Attachment 17B in theOversight QAPP and also incorporated into the appropriate Oversight Results Report. A copy is tobe provided to all recipients identified on QAPP Worksheet #3.

Phase 1A RI Oversight QAPP Attachments Revision: 0 US Magnesium NPL Site October 2013
ATTACHMENT 15A: REFERENCE LIMITS AND EVALUATION TABLES (Excel Workbook)

Phase 1A RI Oversight QAPPWorksheet #15US Magnesium NPL Site
Section D: Sampling and AnalysisRevision 0
October 2013
Page 1 of 14
QAPP Worksheet #15 - Reference Limits and Evaluation Table
Analytical Group:Matrix: SolidsERM/US Magnesium Analytical Method: EPA Methods 6010B/6020/7471AEPA Split Sample Analytical Method: CLP SOW ISM01.3 Concentration Level: StandardLaboratory: CLP
Analyte CAS Number ERM/US Magnesium Analytical Method
EPA Split Sample Analytical Method 4
Target Quantitation Limit (a)
(mg/kg) Basis 1
Contract Required Quantitation Limit
(mg/kg)
Laboratory-Specific Quantitation Limit 2
(mg/kg)
Laboratory-Specific Detection Limit 2, 3
(mg/kg)
Aluminum 7429-90-5 EPA 6020 CLP SOW ISM01.3 1.8E-05 Marine Sediment - AET 2.00E+01 5.00E+00 3.00E+00Antimony 7440-36-0 EPA 6020 CLP SOW ISM01.3 1.4E-01 EPA Region 5 Soil ESLs 1.00E+00 2.00E-01 1.00E-01Arsenic 7440-38-2 EPA 6020 CLP SOW ISM01.3 7.2E-01 Fresh Water Sediment TDL 5.00E-01 2.00E-01 1.50E-01Barium 7440-39-3 EPA 6020 CLP SOW ISM01.3 1.0E+00 EPA Region 5 Soil ESLs 5.00E+00 1.00E-01 9.00E-02Beryllium 7440-41-7 EPA 6020 CLP SOW ISM01.3 1.1E+00 EPA Region 5 Soil ESLs 5.00E-01 1.00E-01 1.00E-02Cadmium 7440-43-9 EPA 6020 CLP SOW ISM01.3 2.2E-03 EPA Region 5 Soil ESLs 5.00E-01 1.00E-01 5.00E-02Calcium 7440-70-2 EPA 6010B CLP SOW ISM01.3 NSV NSV 5.00E+02 3.00E+01 1.50E+01Chromium 7440-47-3 EPA 6020 CLP SOW ISM01.3 4.0E-01 ORNL Soil PRGs 1.00E+00 2.00E-01 1.00E-01Cobalt 7440-48-4 EPA 6020 CLP SOW ISM01.3 1.4E-01 EPA Region 5 Soil ESLs 1.00E+00 1.00E-01 1.00E-02Copper 7440-50-8 EPA 6020 CLP SOW ISM01.3 2.5E+00 Fresh Water Sediment TDL 5.00E-01 2.00E-01 1.00E-01Iron 7439-89-6 EPA 6010B CLP SOW ISM01.3 2.0E+04 Freshwater Sediment - LEL 1.00E+01 5.00E+00 2.50E+00Lead 7439-92-1 EPA 6020 CLP SOW ISM01.3 5.4E-02 EPA Region 5 Soil ESLs 5.00E-01 1.00E-01 6.00E-02Magnesium 7439-95-4 EPA 6010B CLP SOW ISM01.3 NSV NSV 5.00E+02 5.00E+00 2.50E+00Manganese 7439-96-5 EPA 6020 CLP SOW ISM01.3 4.6E+01 Freshwater Sediment - LEL 5.00E-01 2.00E-01 1.00E-01Mercury 7439-97-6 EPA 7471A CLP SOW ISM01.3 5.1E-04 ORNL Soil PRGs 1.00E-01 4.00E-02 8.60E-03Potassium 7440-09-7 EPA 6010B CLP SOW ISM01.3 NSV NSV 5.00E+02 5.00E+00 4.00E+00Molybdenum 7439-98-7 EPA 6020 CLP SOW ISM01.3 2.0E+00 ORNL Soil PRGs 2.0E+00 5.00E-01 2.00E-02Nickel 7440-02-0 EPA 6020 CLP SOW ISM01.3 1.9E+00 Fresh Water Sediment TDL 5.00E-01 2.00E-01 1.00E-01Selenium 7782-49-2 EPA 6020 CLP SOW ISM01.3 2.8E-02 EPA Region 5 Soil ESLs 2.50E+00 2.00E-01 1.00E-01Silver 7440-22-4 EPA 6020 CLP SOW ISM01.3 2.3E-01 Marine Sediment - T20 5.00E-01 1.00E-01 3.00E-02Sodium 7440-23-5 EPA 6010B CLP SOW ISM01.3 NSV NSV 5.00E+02 5.00E+01 2.50E+01Thallium 7440-28-0 EPA 6020 CLP SOW ISM01.3 5.7E-02 EPA Region 5 Soil ESLs 5.00E-01 1.00E-01 5.00E-02Vanadium 7440-62-2 EPA 6020 CLP SOW ISM01.3 1.6E+00 EPA Region 5 Soil ESLs 2.50E+00 1.00E+00 3.00E-01Zinc 7440-66-6 EPA 6020 CLP SOW ISM01.3 6.6E+00 EPA Region 5 Soil ESLs 1.00E+00 1.00E+00 6.00E-01Notes:mg/kg - milligrams per kilogram 1 References for Target Quantitation Limits (TQLs) are presented in the WS-15 TQL references table at the end of this collection of worksheets.NSV - No Screening Value Available 2 Values were provided by TestAmerica. NA - Not Available 3 Laboratory results will be reported to the MDL
4 Aluminum, calcium, iron, magnesium, potassium, sodium to be run by ICP AES. Remainder of the ICP metals to be run by ICP MS. (a) Color codes indicate relation between TQL and DL or QL:
Gray - No contract required quantitation limit (CRQL) for this analyte.
Metals
Yellow – The TQL falls between the QL and the DL. Non-detects present some uncertainty as to whether the analyte is present at a level that poses potentially unacceptable risk to human health or the environment. However, results for such analytes may be adequate for the intended risk assessment use, depending on the frequency of non-detects and on the degree by which the QL exceeds the TQL.
Orange – The QL and DL both exceed the TQL. Non-detected analytical results for these analytes have a higher degree of uncertainty as to whether they are potentially present at the site at a concentration that may pose potentially unacceptable risk. Values that fall into the orange category may necessitate additional consideration to determine if: (1) lower detection limits can be achieved; (2) if TQLs should be revised to be more representative of site conditions; or (3) if uncertainty is unavoidable as currently available analytical methods cannot achieve low enough DLs.Green – The contract required quantitation limit (CRQL) exceeds the TQL.
No color – The QL and DL both are lower than the TQL. Non-detect results for these analytes carry a high degree of certainty that the non-detected concentrations will not pose a potentially unacceptable risk to human health or the environment.

Phase 1A RI Oversight QAPPWorksheet #15US Magnesium NPL Site
Section D: Sampling and AnalysisRevision 0
October 2013
Page 2 of 14
Analytical Group:Matrix: AqueousERM/US Magnesium Analytical Method: EPA Methods 6020/6010/7471EPA Split Sample Analytical Method: CLP SOW ISM01.3; EPA Method 7199 Modified (ASC-083.1 Equivalent) for Hexavalent ChromiumConcentration Level: StandardLaboratory: CLP and Subcontract Laboratory for Hexavalent Chromium
Analyte CAS Number ERM/US Magnesium Analytical Method
EPA Split Sample Analytical Method 4
Target Quantitation Limit (a)
(mg/L) Basis 1
Contract Required Quantitation Limit
(mg/L)
Laboratory-Specific Quantitation Limit 2
(mg/L)
Laboratory-Specific Detection Limit 2, 3
(mg/L)
Aluminum 7429-90-5 EPA 6020 CLP SOW ISM01.3 8.8E-03 Fresh Water TDL 2.00E-02 1.00E-01 2.50E-02Antimony 7440-36-0 EPA 6020 CLP SOW ISM01.3 6.0E-04 Tap Water RSL 2.00E-03 6.00E-03 2.00E-03Arsenic 7440-38-2 EPA 6020 CLP SOW ISM01.3 4.5E-05 Tap Water RSL 1.00E-03 3.00E-03 1.00E-03Barium 7440-39-3 EPA 6020 CLP SOW ISM01.3 3.9E-03 ORNL Aquatic Biota - OSWER Tier II 1.00E-02 1.50E-03 5.00E-04Beryllium 7440-41-7 EPA 6020 CLP SOW ISM01.3 6.6E-04 ORNL Water PRGs 1.00E-03 1.00E-03 1.00E-04Cadmium 7440-43-9 EPA 6020 CLP SOW ISM01.3 1.3E-05 ORNL Aquatic Biota - Sensitive Species Test EC20 1.00E-03 1.50E-03 5.00E-04Calcium 7440-70-2 EPA 6010B CLP SOW ISM01.3 1.2E+02 ORNL Aquatic Biota - Lowest Chronic Value - All Organisms 5.00E-01 5.00E-01 5.00E-02Chromium 7440-47-3 EPA 6020 CLP SOW ISM01.3 7.9E-03 Fresh Water TDL 2.00E-03 5.00E-03 1.50E-03
Chromium, Hexavalent 18540-29-9 ASC-083.1(EPA 7199 Modified)
EPA 7199 Modified(ASC-083.1 Equivalent) 3.1E-05 Tap Water RSL -- 1.00E-05 2.00E-06
Cobalt 7440-48-4 EPA 6020 CLP SOW ISM01.3 4.7E-04 Tap Water RSL 1.00E-03 3.00E-03 1.00E-03Copper 7440-50-8 EPA 6020 CLP SOW ISM01.3 2.1E-04 ORNL Aquatic Biota - Daphnid Lowest EC20 2.00E-03 3.00E-03 1.00E-03Iron 7439-89-6 EPA 6020 CLP SOW ISM01.3 1.6E-02 Salt Water TDL 2.00E-01 1.00E-01 2.00E-02Lead 7439-92-1 EPA 6020 CLP SOW ISM01.3 1.2E-04 Fresh Water TDL 1.00E-03 2.50E-03 6.00E-04Magnesium 7439-95-4 EPA 6010B CLP SOW ISM01.3 8.0E-02 ORNL Aquatic Biota - OSWER Tier II 5.00E-01 1.00E-01 2.50E-02Manganese 7439-96-5 EPA 6020 CLP SOW ISM01.3 1.1E-01 ORNL Aquatic Biota - Sensitive Population EC20 1.00E-03 6.00E-03 2.00E-03Mercury 7439-97-6 EPA 7471A CLP SOW ISM01.3 1.3E-06 EPA Region 5 Water ESLs 2.00E-04 1.00E-04 3.40E-05Potassium 7440-09-7 EPA 6010B CLP SOW ISM01.3 5.3E+01 ORNL Aquatic Biota - Lowest Chronic Value - All Organisms 5.00E-01 1.00E-01 2.50E-02Molybdenum 7439-98-7 EPA 6020 CLP SOW ISM01.3 7.8E-03 Tap Water RSL 7.80E-03 3.00E-03 1.00E-03Nickel 7440-02-0 EPA 6020 CLP SOW ISM01.3 8.7E-04 Salt Water TDL 1.00E-03 3.00E-03 1.00E-03Selenium 7782-49-2 EPA 6020 CLP SOW ISM01.3 3.9E-04 ORNL Water PRGs 5.00E-03 3.00E-03 1.00E-03Silver 7440-22-4 EPA 6020 CLP SOW ISM01.3 9.8E-06 Fresh Water TDL 1.00E-03 1.00E-03 3.00E-04Sodium 7440-23-5 EPA 6010B CLP SOW ISM01.3 6.8E+02 ORNL Aquatic Biota - Lowest Chronic Value - All Organisms 5.00E-01 1.00E-01 2.50E-02Thallium 7440-28-0 EPA 6020 CLP SOW ISM01.3 1.6E-05 Tap Water RSL 1.00E-03 1.50E-03 5.00E-04Vanadium 7440-62-2 EPA 6020 CLP SOW ISM01.3 1.8E-03 Fresh Water TDL 5.00E-03 1.20E-02 4.00E-03Zinc 7440-66-6 EPA 6020 CLP SOW ISM01.3 6.1E-03 Fresh Water TDL 2.00E-03 1.20E-02 4.00E-03Notes:mg/L - milligrams per liter 1 References for Target Quantitation Limits (TQLs) are presented in the WS-15 TQL references table at the end of this collection of worksheets.NSV - No Screening Value Available 2 Values were provided by TestAmerica or Applied Speciation. NA - Not Available 3 Laboratory results will be reported to the MDL -- = Contract Required Quantitation Limit not applicable to non-CLP laboratory analysis 4 Aquesous samples, all ICP metals to be run by ICP MS(a) Color codes indicate relation between TQL and DL or QL:
Gray - No contract required quantitation limit (CRQL) for this analyte
QAPP Worksheet #15 - Reference Limits and Evaluation Table
Green – The contract required quantitation limit (CRQL) exceeds the TQL.
No color – The QL and DL both are lower than the TQL. Non-detect results for these analytes carry a high degree of certainty that the non-detected concentrations will not pose a potentially unacceptable risk to human health or the environment. Yellow – The TQL falls between the QL and the DL. Non-detects present some uncertainty as to whether the analyte is present at a level that poses potentially unacceptable risk to human health or the environment. However, results for such analytes may be adequate for the intended risk assessment use, depending on the frequency of non-detects and on the degree by which the QL exceeds the TQL.Orange – The QL and DL both exceed the TQL. Non-detected analytical results for these analytes have a higher degree of uncertainty as to whether they are potentially present at the site at a concentration that may pose potentially unacceptable risk.Values that fall into the orange category may necessitate additional consideration to determine if: (1) lower detection limits can be achieved; (2) if TQLs should be revised to be more representative of site conditions; or (3) if uncertainty is unavoidable as currently available analytical methods cannot achieve low enough DLs.
Metals (total and dissolved)

Phase 1A RI Oversight QAPPWorksheet #15US Magnesium NPL Site
Section D: Sampling and AnalysisRevision 0
October 2013
Page 3 of 14
Analytical Group: PAHsMatrix: SolidsERM/US Magnesium Analytical Method: EPA Method SW846 8270C SIMEPA Split Sample Analytical Method: CLP SOW SOM01.2 SIMConcentration Level: LowLaboratory: CLP
Analyte CAS NumberTarget Quantitation
Limit (a) (µg/kg)
Basis 1Contract Required Quantitation Limit
(µg/kg)
Laboratory-Specific Quantitation Limit 2
(µg/kg)
Laboratory-Specific Detection Limit 2, 3
(µg/kg)2-Methylnaphthalene 91-57-6 7.3E+00 Salt Water Sediment TDL 3.30E+00 5.00E+00 4.30E-01Acenaphthene 83-32-9 3.6E+00 Salt Water Sediment TDL 3.30E+00 5.00E+00 4.70E-01Acenaphthylene 208-96-8 4.4E+00 Salt Water Sediment TDL 3.30E+00 5.00E+00 3.30E-01Anthracene 120-12-7 1.0E+01 Freshwater Sediment - ARCS 3.30E+00 5.00E+00 4.00E-01Benzo(a)anthracene 56-55-3 1.3E+01 Fresh Water Sediment TDL 3.30E+00 5.00E+00 3.00E-01Benzo(a)pyrene 50-32-8 2.1E+01 Fresh Water Sediment TDL 3.30E+00 5.00E+00 4.00E-01Benzo(b)fluoranthene 205-99-2 1.0E+02 CCME Agricultural SQGs 3.30E+00 5.00E+00 5.00E-01Benzo(g,h,i)perylene 191-24-2 2.5E+01 Fresh Water Sediment TDL 3.30E+00 5.00E+00 1.00E+00Benzo(k)fluoranthene 207-08-9 1.4E+01 Fresh Water Sediment TDL 3.30E+00 5.00E+00 7.60E-01Chrysene 218-01-9 2.0E+01 Fresh Water Sediment TDL 3.30E+00 5.00E+00 3.50E-01Dibenzo(a,h)anthracene 53-70-3 6.0E+00 Fresh Water Sediment TDL 3.30E+00 5.00E+00 1.20E+00Fluoranthene 206-44-0 3.1E+01 Freshwater Sediment - ARCS 3.30E+00 5.00E+00 2.90E-01Fluorene 86-73-7 4.1E+00 Salt Water Sediment TDL 3.30E+00 5.00E+00 4.90E-01Indeno(1,2,3-cd)pyrene 193-39-5 1.7E+01 Freshwater Sediment - ARCS 3.30E+00 5.00E+00 4.80E-01Naphthalene 91-20-3 1.3E+01 CCME Agricultural SQGs 3.30E+00 5.00E+00 3.10E-01Phenanthrene 85-01-8 1.9E+01 Freshwater Sediment - ARCS 3.30E+00 5.00E+00 3.50E-01Pyrene 129-00-0 3.6E+01 Fresh Water Sediment TDL 3.30E+00 5.00E+00 3.50E-01
Notes:
µg/kg - micrograms per kilogram 1 References for Target Quantitation Limits (TQLs) are presented in the WS-15 TQL references table at the end of this collection of worksheets.NSV - No Screening Value Available 2 Values were provided by Test America.
3 Laboratory results will be reported to the MDL(a) Color codes indicate relation between TQL and DL or QL:
Gray - No contract required quantitation limit (CRQL) for this analyte
QAPP Worksheet #15 - Reference Limits and Evaluation Table
Green – The contract required quantitation limit (CRQL) exceeds the TQL.
No color – The QL and DL both are lower than the TQL. Non-detect results for these analytes carry a high degree of certainty that the non-detected concentrations will not pose a potentially unacceptable risk to human health or the environment. Yellow – The TQL falls between the QL and the DL. Non-detects present some uncertainty as to whether the analyte is present at a level that poses potentially unacceptable risk to human health or the environment. However, results for such analytes may be adequate for the intended risk assessment use, depending on the frequency of non-detects and on the degree by which the QL exceeds the TQL.Orange – The QL and DL both exceed the TQL. Non-detected analytical results for these analytes have a higher degree of uncertainty as to whether they are potentially present at the site at a concentration that may pose potentially unacceptable risk.Values that fall into the orange category may necessitate additional consideration to determine if: (1) lower detection limits can be achieved; (2) if TQLs should be revised to be more representative of site conditions; or (3) if uncertainty is unavoidable as currently available analytical methods cannot achieve low enough DLs.

Phase 1A RI Oversight QAPPWorksheet #15US Magnesium NPL Site
Section D: Sampling and AnalysisRevision 0
October 2013
Page4 of 14
Analytical Group: PAHsMatrix: AqueousERM/US Magnesium Analytical Method: EPA Method SW846 8270C SIMEPA Split Sample Analytical Method: CLP SOW SOM01.2 SIMConcentration Level: LowLaboratory: CLP
Analyte CAS NumberTarget Quantitation
Limit (a) (µg/L)
Basis 1Contract Required Quantitation Limit
(µg/L)
Laboratory-Specific Quantitation Limit 2
(µg/L)
Laboratory-Specific Detection Limit 2, 3
(µg/L)
2-Methylnaphthalene 91-57-6 2.7E+00 Tap Water RSL 1.00E-01 5.00E-02 5.50E-03Acenaphthene 83-32-9 2.2E+00 Fresh Water TDL 1.00E-01 5.00E-02 3.17E-03Acenaphthylene 208-96-8 1.7E+01 Fresh Water TDL 1.00E-01 5.00E-02 3.07E-03Anthracene 120-12-7 3.5E-02 EPA Region 5 Water ESLs 1.00E-01 5.00E-02 4.44E-03Benzo(a)anthracene 56-55-3 7.5E-03 Fresh Water TDL 1.00E-01 5.00E-02 4.60E-03Benzo(a)pyrene 50-32-8 1.4E-03 Fresh Water TDL 1.00E-01 5.00E-02 4.40E-03Benzo(b)fluoranthene 205-99-2 2.9E-02 Tap Water RSL 1.00E-01 5.00E-02 1.20E-02Benzo(g,h,i)perylene 191-24-2 7.6E-01 Fresh Water TDL 1.00E-01 5.00E-02 5.50E-03Benzo(k)fluoranthene 207-08-9 2.7E-03 Fresh Water TDL 1.00E-01 5.00E-02 7.80E-03Chrysene 218-01-9 1.7E-02 Fresh Water TDL 1.00E-01 5.00E-02 4.00E-03Dibenzo(a,h)anthracene 53-70-3 2.9E-03 Tap Water RSL 1.00E-01 5.00E-02 1.40E-02Fluoranthene 206-44-0 7.7E-01 Salt Water TDL 1.00E-01 5.00E-02 4.30E-03Fluorene 86-73-7 4.2E-01 Fresh Water TDL 1.00E-01 5.00E-02 4.04E-03Indeno(1,2,3-cd)pyrene 193-39-5 2.9E-02 Tap Water RSL 1.00E-01 5.00E-02 1.40E-03Naphthalene 91-20-3 1.4E-01 Tap Water RSL 1.00E-01 5.00E-02 3.70E-03Phenanthrene 85-01-8 7.9E-01 Salt Water TDL 1.00E-01 5.00E-02 6.32E-03Pyrene 129-00-0 1.3E-01 Fresh Water TDL 1.00E-01 5.00E-02 4.20E-03Notes:µg/L - micrograms per liter 1 References for Target Quantitation Limits (TQLs) are presented in the WS-15 TQL references table at the end of this collection of worksheets.NSV - No Screening Value Available 2 Values were provided by Test America.
3 Laboratory results will be reported to the MDL(a) Color codes indicate relation between TQL and DL or QL:
Gray - No contract required quantitation limit (CRQL) for this analyte
QAPP Worksheet #15 - Reference Limits and Evaluation Table
Green – The contract required quantitation limit (CRQL) exceeds the TQL.
Orange – The QL and DL both exceed the TQL. Non-detected analytical results for these analytes have a higher degree of uncertainty as to whether they are potentially present at the site at a concentration that may pose potentially unacceptable risk.Values that fall into the orange category may necessitate additional consideration to determine if: (1) lower detection limits can be achieved; (2) if TQLs should be revised to be more representative of site conditions; or (3) if uncertainty is unavoidable as currently available analytical methods cannot achieve low enough DLs.
No color – The QL and DL both are lower than the TQL. Non-detect results for these analytes carry a high degree of certainty that the non-detected concentrations will not pose a potentially unacceptable risk to human health or the environment. Yellow – The TQL falls between the QL and the DL. Non-detects present some uncertainty as to whether the analyte is present at a level that poses potentially unacceptable risk to human health or the environment. However, results for such analytes may be adequate for the intended risk assessment use, depending on the frequency of non-detects and on the degree by which the QL exceeds the TQL.

Phase 1A RI Oversight QAPPWorksheet #15US Magnesium NPL Site
Section D: Sampling and AnalysisRevision 0
October 2013
Page 5 of 14
Analytical Group: SVOCsMatrix: SolidsERM/US Magnesium Analytical Method: EPA Method 8270CEPA Split Sample Analytical Method: CLP SOW SOM01.2Concentration Level: LowLaboratory: CLP
Analyte CAS NumberTarget Quantitation
Limit (a) (µg/kg)
Basis 1Contract Required Quantitation Limit
(µg/kg)
Laboratory-Specific Quantitation Limit 2
(µg/kg)
Laboratory-Specific Detection Limit 2, 3
(µg/kg)
2-Chloronaphthalene 91-58-7 1.2E+01 EPA Region 5 Soil ESLs 1.70E+02 3.30E+02 8.10E+011,1'-Biphenyl 92-52-4 1.7E+01 Marine Sediment - T20 1.70E+02 3.30E+02 1.70E+021,2,4,5-Tetrachlorobenzene 95-94-3 1.0E+01 Freshwater Sediment - Dutch Target 1.70E+02 3.30E+02 1.70E+022-Chlorophenol 95-57-8 3.3E-01 Marine Sediment - AET 1.70E+02 3.30E+02 8.80E+012-Methylphenol 95-48-7 2.8E+00 Salt Water Sediment TDL 1.70E+02 3.30E+02 5.80E+012-Nitroaniline 88-74-4 7.4E+04 EPA Region 5 Soil ESLs 3.30E+02 1.60E+03 8.40E+012-Nitrophenol 88-75-5 1.6E+03 EPA Region 5 Soil ESLs 1.70E+02 3.30E+02 8.20E+012,2'Oxybis(1-chloropropane) (b) 108-60-1 2.0E+04 EPA Region 5 Soil ESLs 1.70E+02 3.30E+02 1.70E+022,4-Dimethylphenol 105-67-9 1.0E+01 EPA Region 5 Soil ESLs 1.70E+02 5.00E+02 1.67E+022,4-Dinitrophenol 51-28-5 6.2E+00 EPA Region 5 Sediment ESLs 3.30E+02 2.00E+03 2.14E+022,4-Dinitrotoluene 121-14-2 1.4E+01 EPA Region 5 Sediment ESLs 1.70E+02 3.30E+02 8.90E+012,4-Dichlorophenol 120-83-2 2.1E-01 Marine Sediment - AET 1.70E+02 3.30E+02 8.90E+012,6-Dinitrotoluene 606-20-2 3.3E+01 EPA Region 5 Soil ESLs 1.70E+02 3.30E+02 9.90E+012,4,5-Trichlorophenol 95-95-4 3.0E-01 Salt Water Sediment TDL 1.70E+02 3.30E+02 8.30E+012,4,6-Trichlorophenol4 88-06-2 6.0E+00 Marine Sediment - AET 1.70E+02 3.30E+02 8.40E+013-Nitroaniline 99-09-2 3.2E+03 EPA Region 5 Soil ESLs 3.30E+02 1.60E+03 1.67E+023,3'-Dichlorobenzidine 91-94-1 1.3E+02 EPA Region 5 Sediment ESLs 1.70E+02 1.60E+03 9.40E+014-Bromophenyl-phenylether 101-55-3 1.6E+06 EPA Region 5 Sediment ESLs 1.70E+02 3.30E+02 8.50E+014-Chloro-3-methylphenol 59-50-7 3.9E+02 EPA Region 5 Sediment ESLs 1.70E+02 3.30E+02 9.20E+014-Chloroaniline 106-47-8 1.1E+03 EPA Region 5 Soil ESLs 1.70E+02 3.30E+02 5.80E+014-Chlorophenyl-phenylether 7005-72-3 NSV NSV 1.70E+02 3.30E+02 9.30E+014-Methylphenol (as 3&4 methyl phenol) 106-44-5 5.1E+00 Freshwater Sediment - Dutch Target 1.70E+02 6.60E+02 3.30E+024-Nitroaniline 100-01-6 2.2E+04 EPA Region 5 Soil ESLs 3.30E+02 1.60E+03 8.80E+014-Nitrophenol 100-02-7 1.3E+01 EPA Region 5 Sediment ESLs 3.30E+02 2.00E+03 2.80E+024,6-Dinitro-2-methylphenol 534-52-1 1.0E+02 EPA Region 5 Sediment ESLs 3.30E+02 2.00E+03 8.10E+01Acetophenone 98-86-2 3.0E+05 EPA Region 5 Soil ESLs 1.70E+02 3.30E+02 1.70E+02Atrazine 1912-24-9 2.0E-01 Freshwater Sediment - Dutch Target 1.70E+02 3.30E+02 1.70E+02Benzaldehyde 100-52-7 1.0E+07 Industrial RSL 1.70E+02 3.30E+02 1.70E+02bis(2-Chloroethoxy) methane 111-91-1 3.0E+02 EPA Region 5 Soil ESLs 1.70E+02 3.30E+02 8.80E+01bis(2-Chloroethyl) ether 111-44-4 1.0E+03 Industrial RSL 1.70E+02 3.30E+02 8.10E+01bis(2-Ethylhexyl) phthalate 117-81-7 1.0E+02 Freshwater Sediment - Dutch Target 1.70E+02 3.30E+02 9.80E+01Butylbenzylphthalate 85-68-7 6.3E+01 Marine Sediment - AET 1.70E+02 3.30E+02 9.50E+01Carbazole 86-74-8 NSV NSV 1.70E+02 3.30E+02 9.50E+01Dibenzofuran 132-64-9 1.1E+02 Marine Sediment - AET 1.70E+02 3.30E+02 8.60E+01Diethylphthalate 84-66-2 6.0E+00 Marine Sediment - AET 1.70E+02 3.30E+02 9.00E+01Dimethylphthalate 131-11-3 6.0E+00 Marine Sediment - AET 1.70E+02 3.30E+02 8.70E+01Di-n-butylphthalate 84-74-2 1.5E+02 EPA Region 5 Soil ESLs 1.70E+02 3.30E+02 9.70E+01Di-n-octylphthalate 117-84-0 4.1E+04 EPA Region 5 Sediment ESLs 1.70E+02 3.30E+02 9.70E+01Hexachlorobenzene4 118-74-1 1.4E+00 Freshwater Sediment - Dutch Target 1.70E+02 3.30E+02 8.90E+01Hexachlorobutadiene4 87-68-3 1.3E+00 Marine Sediment - AET 1.70E+02 3.30E+02 8.20E+01Hexachlorocyclopentadiene 77-47-4 7.6E+02 EPA Region 5 Soil ESLs 1.70E+02 3.30E+02 1.00E+02Hexachloroethane 67-72-1 7.3E+01 Marine Sediment - AET 1.70E+02 3.30E+02 8.10E+01Isophorone 78-59-1 4.3E+02 EPA Region 5 Sediment ESLs 1.70E+02 3.30E+02 9.30E+01N-Nitroso-dimethylamine4 62-75-9 3.2E-02 EPA Region 5 Soil ESLs 1.70E+02 3.30E+02 9.60E+01N-Nitroso-diphenylamine 86-30-6 2.8E+01 Marine Sediment - AET 1.70E+02 3.30E+02 8.60E+01N-Nitroso-di-n-propylamine 621-64-7 2.5E+02 Industrial RSL 1.70E+02 3.30E+02 8.40E+01Nitrobenzene 98-95-3 2.1E+01 Marine Sediment - AET 1.70E+02 3.30E+02 7.60E+01Pentachlorophenol4 87-86-5 1.0E+01 Freshwater Sediment - Dutch Target 3.30E+02 3.30E+02 5.10E+01Phenol 108-95-2 6.7E+00 Fresh Water Sediment TDL 1.70E+02 3.30E+02 8.30E+012,3,4,6-Tetrachlorophenol 58-90-2 1.0E+01 Freshwater Sediment - Dutch Target 1.70E+02 1.60E+03 8.00E+02
Notes:µg/kg - micrograms per kilogram 1 References for Target Quantitation Limits (TQLs) are presented in the WS-15 TQL references table at the end of this collection of worksheets.NSV - No Screening Value Available 2 Values were provided by Test America. TBD - To Be Determined 3 Laboratory results will be reported to the MDL
(a) Color codes indicate relation between TQL and DL or QL:
Gray - No contract required quantitation limit (CRQL) for this analyte(b) Also known as bis(2-chloroisopropyl)ether
QAPP Worksheet #15 - Reference Limits and Evaluation Table
Green – The contract required quantitation limit (CRQL) exceeds the TQL.
Values that fall into the orange category may necessitate additional consideration to determine if: (1) lower detection limits can be achieved; (2) if TQLs should be revised to be more representative of site conditions; or (3) if uncertainty is unavoidable as currently available analytical methods cannot achieve low enough DLs.
No color – The QL and DL both are lower than the TQL. Non-detect results for these analytes carry a high degree of certainty that the non-detected concentrations will not pose a potentially unacceptable risk to human health or the environment. Yellow – The TQL falls between the QL and the DL. Non-detects present some uncertainty as to whether the analyte is present at a level that poses potentially unacceptable risk to human health or the environment. However, results for such analytes may be adequate for the intended risk assessment use, depending on the frequency of non-detects and on the degree by which the QL exceeds the TQL.Orange – The QL and DL both exceed the TQL. Non-detected analytical results for these analytes have a higher degree of uncertainty as to whether they are potentially present at the site at a concentration that may pose potentially unacceptable risk.
4 If not detected during analysis in SCAN mode above the quantitation and/or detection limits, perform confirmation analysis using Selective Ion Monitoring (SIM) for the following SVOCs: 2,4,6-trichlorophenol, hexachlorobenzene, hexachlorobutadiene, N-nitrosodimethylamine, and pentachlorophenol.

Phase 1A RI Oversight QAPPWorksheet #15US Magnesium NPL Site
Section D: Sampling and AnalysisRevision 0
October 2013
Page 6 of 14
Analytical Group: SVOCsMatrix: AqueousERM/US Magnesium Analytical Method: EPA Method 8270CEPA Split Sample Analytical Method: CLP SOW SOM01.2Concentration Level: LowLaboratory: CLP
Analyte CAS NumberTarget Quantitation
Limit (a) (µg/L)
Basis 1Contract Required Quantitation Limit
(µg/L)
Laboratory-Specific Quantitation Limit 2
(µg/L)
Laboratory-Specific Detection Limit 2, 3
(µg/L)
2-Chloronaphthalene 91-58-7 4.0E-01 EPA Region 5 Water ESLs 5.00E+00 1.00E+01 1.30E+001,1'-Biphenyl 92-52-4 8.3E-02 Tap Water RSL 5.00E+00 1.00E+01 5.00E-011,2,4,5-Tetrachlorobenzene 95-94-3 1.2E-01 Tap Water RSL 5.00E+00 1.00E+01 5.00E-012-Chlorophenol 95-57-8 4.3E+00 Fresh Water TDL 5.00E+00 1.00E+01 1.60E+002-Methylphenol 95-48-7 3.6E+00 Fresh Water TDL 5.00E+00 1.00E+01 9.30E-012-Nitroaniline 88-74-4 1.5E+01 Tap Water RSL 1.00E+01 5.00E+01 2.00E+002-Nitrophenol 88-75-5 3.5E+03 ORNL Aquatic Biota - Region IV Values Chronic 5.00E+00 1.00E+01 1.90E+002,2'Oxybis(1-chloropropane) (b) 108-60-1 3.1E-01 Tap Water RSL 5.00E+00 1.00E+01 5.00E-012,4-Dimethylphenol 105-67-9 2.1E+01 ORNL Aquatic Biota - Region IV Values Chronic 5.00E+00 1.00E+01 2.20E+002,4-Dinitrophenol 51-28-5 3.0E+00 Tap Water RSL 1.00E+01 6.00E+01 2.00E+012,4-Dinitrotoluene 121-14-2 2.0E-01 Tap Water RSL 5.00E+00 1.00E+01 2.00E+002,4-Dichlorophenol 120-83-2 3.4E+00 Fresh Water TDL 5.00E+00 1.00E+01 2.60E+002,6-Dinitrotoluene 606-20-2 1.5E+00 Tap Water RSL 5.00E+00 1.00E+01 2.00E+002,4,5-Trichlorophenol 95-95-4 1.1E+00 Salt Water TDL 5.00E+00 1.00E+01 2.00E+002,4,6-Trichlorophenol4 88-06-2 9.0E-01 Tap Water RSL 5.00E+00 1.00E+01 2.00E+003-Nitroaniline 99-09-2 NSV NSV 1.00E+01 5.00E+01 1.40E+003,3'-Dichlorobenzidine 91-94-1 1.1E-01 Tap Water RSL 5.00E+00 5.00E+01 9.60E-014-Bromophenyl-phenylether 101-55-3 1.5E+00 EPA Region 5 Water ESLs 5.00E+00 1.00E+01 1.10E+004-Chloro-3-methylphenol 59-50-7 3.0E-01 ORNL Aquatic Biota - Region IV Values Chronic 5.00E+00 1.00E+01 2.00E+004-Chloroaniline 106-47-8 3.2E-01 Tap Water RSL 5.00E+00 1.00E+01 2.00E+004-Chlorophenyl-phenylether 7005-72-3 NSV NSV 5.00E+00 1.00E+01 1.10E+004-Methylphenol 106-44-5 2.0E+01 Fresh Water TDL 5.00E+00 1.00E+01 1.00E-014-Nitroaniline 100-01-6 3.3E+00 Tap Water RSL 1.00E+01 5.00E+01 1.50E+004-Nitrophenol 100-02-7 6.0E+01 EPA Region 5 Water ESLs 1.00E+01 6.00E+01 6.10E+004,6-Dinitro-2-methylphenol 534-52-1 1.2E-01 Tap Water RSL 1.00E+01 6.00E+01 2.20E+00Acetophenone 98-86-2 1.5E+02 Tap Water RSL 5.00E+00 1.00E+01 5.00E-01Atrazine 1912-24-9 2.6E-01 Fresh Water TDL 5.00E+00 1.00E+01 5.00E-01Benzaldehyde 100-52-7 1.5E+02 Tap Water RSL 5.00E+00 1.00E+01 5.00E-01bis(2-Chloroethoxy) methane 111-91-1 4.6E+00 Tap Water RSL 5.00E+00 1.00E+01 1.00E+00bis(2-Chloroethyl) ether 111-44-4 1.2E-02 Tap Water RSL 5.00E+00 1.00E+01 1.50E+00bis(2-Ethylhexyl) phthalate 117-81-7 1.2E-01 ORNL Water PRGs 5.00E+00 1.00E+01 1.00E+00Butylbenzylphthalate 85-68-7 1.6E+00 Salt Water TDL 5.00E+00 1.00E+01 1.40E+00Carbazole 86-74-8 NSV NSV 5.00E+00 1.00E+01 1.20E+00Dibenzofuran 132-64-9 5.8E-01 Tap Water RSL 5.00E+00 1.00E+01 1.10E+00Diethylphthalate 84-66-2 5.7E+00 Salt Water TDL 5.00E+00 1.00E+01 9.30E-01Dimethylphthalate 131-11-3 4.4E+00 Salt Water TDL 5.00E+00 1.00E+01 8.80E-01Di-n-butylphthalate 84-74-2 7.8E-01 Salt Water TDL 5.00E+00 1.00E+01 1.10E+00Di-n-octylphthalate 117-84-0 2.0E+00 Salt Water TDL 5.00E+00 1.00E+01 1.50E+00Hexachlorobenzene4 118-74-1 3.0E-04 EPA Region 5 Water ESLs 5.00E+00 1.00E+01 1.40E+00Hexachlorobutadiene4 87-68-3 5.3E-02 EPA Region 5 Water ESLs 5.00E+00 1.00E+01 1.30E+00Hexachlorocyclopentadiene 77-47-4 7.0E-02 ORNL Aquatic Biota - Region IV Values Chronic 5.00E+00 1.00E+01 5.00E-01Hexachloroethane 67-72-1 5.1E-01 Tap Water RSL 5.00E+00 1.00E+01 1.40E+00Isophorone 78-59-1 6.7E+01 Tap Water RSL 5.00E+00 1.00E+01 1.00E+00N-Nitroso-dimethylamine4 62-75-9 4.2E-04 Tap Water RSL 5.00E+00 1.50E+01 9.60E-01N-Nitroso-diphenylamine 86-30-6 1.0E+01 Tap Water RSL 5.00E+00 1.00E+01 5.40E-01N-Nitroso-di-n-propylamine 621-64-7 9.3E-03 Tap Water RSL 5.00E+00 1.00E+01 1.40E+00Nitrobenzene 98-95-3 1.2E-01 Tap Water RSL 5.00E+00 1.00E+01 1.60E+00Pentachlorophenol4 87-86-5 3.5E-02 Tap Water RSL 1.00E+01 6.00E+01 2.00E+00Phenol 108-95-2 1.8E+01 Fresh Water TDL 5.00E+00 1.00E+01 1.10E+002,3,4,6-Tetrachlorophenol 58-90-2 1.2E-01 Fresh Water TDL 5.00E+00 5.00E+01 2.50E+00Notes:µg/L - micrograms per liter 1 References for Target Quantitation Limits (TQLs) are presented in the WS-15 TQL references table at the end of this collection of worksheets.NSV - No Screening Value Available 2 Values were provided by Test America. TBD - To Be Determined 3 Laboratory results will be reported to the MDL
(a) Color codes indicate relation between TQL and DL or QL:
Gray - No contract required quantitation limit (CRQL) for this analyte(b) Also known as bis(2-chloroisopropyl)ether
QAPP Worksheet #15 - Reference Limits and Evaluation Table
Values that fall into the orange category may necessitate additional consideration to determine if: (1) lower detection limits can be achieved; (2) if TQLs should be revised to be more representative of site conditions; or (3) if uncertainty is unavoidable as currently available analytical methods cannot achieve low enough DLs.Green – The contract required quantitation limit (CRQL) exceeds the TQL.
No color – The QL and DL both are lower than the TQL. Non-detect results for these analytes carry a high degree of certainty that the non-detected concentrations will not pose a potentially unacceptable risk to human health or the environment.
Yellow – The TQL falls between the QL and the DL. Non-detects present some uncertainty as to whether the analyte is present at a level that poses potentially unacceptable risk to human health or the environment. However, results for such analytes may be adequate for the intended risk assessment use, depending on the frequency of non-detects and on the degree by which the QL exceeds the TQL.
Orange – The QL and DL both exceed the TQL. Non-detected analytical results for these analytes have a higher degree of uncertainty as to whether they are potentially present at the site at a concentration that may pose potentially unacceptable risk.
4 If not detected during analysis in SCAN mode above the quantitation and/or detection limits, perform confirmation analysis using Selective Ion Monitoring (SIM) for the following SVOCs: 2,4,6-trichlorophenol, hexachlorobenzene, hexachlorobutadiene, N-nitrosodimethylamine, and pentachlorophenol.

Phase 1A RI Oversight QAPPWorksheet #15US Magnesium NPL Site
Section D: Sampling and AnalysisRevision 0
October 2013
Page 7 of 14
QAPP Worksheet #15 - Reference Limits and Evaluation Table
Analytical Group: PCBsMatrix: SolidsERM/US Magnesium Analytical Method: EPA Method 1668AEPA Split Sample Analytical Method: CLP SOW CBC01.2Concentration Level: LowLaboratory: CLP
Analyte CAS NumberTarget Quantitation
Limit (a) (µg/kg)
Basis 1Contract Required Quantitation Limit
(µg/kg)
Laboratory-Specific Quantitation Limit 2
(µg/kg)
Laboratory-Specific Detection Limit 2
(µg/kg)
Monochlorobiphenyls, Total 27323-18-8 3.3E-02 Freshwater Sediment - Dutch Target divided by the number of PCB homologues NA 2.00E-02 NADichlorobiphenyls, Total 25512-42-9 3.3E-02 Freshwater Sediment - Dutch Target divided by the number of PCB homologues NA 2.00E-02 NATrichlorobiphenyls, Total 25323-68-6 3.3E-02 Freshwater Sediment - Dutch Target divided by the number of PCB homologues NA 2.00E-02 NATetrachlorobiphenyls, Total 26914-33-0 3.3E-02 Freshwater Sediment - Dutch Target divided by the number of PCB homologues NA 2.00E-02 NAPentachlorobiphenyls, Total 25429-29-2 3.3E-02 Freshwater Sediment - Dutch Target divided by the number of PCB homologues NA 2.00E-02 NAHexachlorobiphenyls, Total 26601-64-9 3.3E-02 Freshwater Sediment - Dutch Target divided by the number of PCB homologues NA 2.00E-02 NAHeptachlorobiphenyls, Total 28655-71-2 3.3E-02 Freshwater Sediment - Dutch Target divided by the number of PCB homologues NA 2.00E-02 NAOctachlorobiphenyls, Total 55722-26-4 3.3E-02 Freshwater Sediment - Dutch Target divided by the number of PCB homologues NA 2.00E-02 NANonachlorobiphenyls, Total 53742-07-7 3.3E-02 Freshwater Sediment - Dutch Target divided by the number of PCB homologues NA 2.00E-02 NADecachlorobiphenyl (PCB-209) 2051-24-3 3.3E-02 Freshwater Sediment - Dutch Target divided by the number of PCB homologues NA 2.00E-02 NATotal PCB Homologues NA 3.3E-02 NA NA 2.00E-02 NAPCB-77 32598-13-3 2.5E-02 Freshwater Sediment - Dutch Target divided by the number of coplanar PCB congeners 2.00E-03 2.00E-03 2.00E-04PCB-81 70362-50-4 2.5E-02 Freshwater Sediment - Dutch Target divided by the number of coplanar PCB congeners 2.00E-03 2.00E-03 2.00E-04PCB-105 32598-14-4 2.5E-02 Freshwater Sediment - Dutch Target divided by the number of coplanar PCB congeners 2.00E-03 2.00E-03 2.00E-04PCB-114 74472-37-0 2.5E-02 Freshwater Sediment - Dutch Target divided by the number of coplanar PCB congeners 2.00E-03 2.00E-03 2.00E-04PCB-118 31508-00-6 2.5E-02 Freshwater Sediment - Dutch Target divided by the number of coplanar PCB congeners 2.00E-03 2.00E-03 2.00E-04PCB-123 65510-44-3 2.5E-02 Freshwater Sediment - Dutch Target divided by the number of coplanar PCB congeners 2.00E-03 2.00E-03 2.00E-04PCB-126 57465-28-8 2.5E-02 Freshwater Sediment - Dutch Target divided by the number of coplanar PCB congeners 2.00E-03 2.00E-03 2.00E-04PCB-156 38380-08-4 2.5E-02 Freshwater Sediment - Dutch Target divided by the number of coplanar PCB congeners 2.00E-03 2.00E-03 2.00E-04PCB-157 69782-90-7 2.5E-02 Freshwater Sediment - Dutch Target divided by the number of coplanar PCB congeners 2.00E-03 2.00E-03 2.00E-04PCB-167 52663-72-6 2.5E-02 Freshwater Sediment - Dutch Target divided by the number of coplanar PCB congeners 2.00E-03 2.00E-03 2.00E-04PCB-169 32774-16-6 2.5E-02 Freshwater Sediment - Dutch Target divided by the number of coplanar PCB congeners 2.00E-03 2.00E-03 2.00E-04PCB-189 39635-31-9 2.5E-02 Freshwater Sediment - Dutch Target divided by the number of coplanar PCB congeners 2.00E-03 2.00E-03 2.00E-04Notes:µg/kg - micrograms per kilogramNA - Not Available1 References for Target Quantitation Limits (TQLs) are presented in the WS-15 TQL references table at the end of this collection of worksheets.
(a) Color codes indicate relation between TQL and DL or QL:
Gray - No contract required quantitation limit (CRQL) for this analyte
2 Values provided by TestAmerica. Laboratory results will be reported to the estimated detection limit (EDL). EDLs are sample-specific values calculated from each sample analysis. These values are representative of those achieved in clean samples without matrix interferences or elevated target analyte concentrations. Toxic PCB congeners for which TEQ values are established are highlighted in yellow. These are the specific individual congeners that would be reported in a combined analysis for toxic PCB congeners (WHO List) plus homolog totals.
Green – The contract required quantitation limit (CRQL) exceeds the TQL.
No color – The QL and DL both are lower than the TQL. Non-detect results for these analytes carry a high degree of certainty that the non-detected concentrations will not pose a potentially unacceptable risk to human health or the environment. Yellow – The TQL falls between the QL and the DL. Non-detects present some uncertainty as to whether the analyte is present at a level that poses potentially unacceptable risk to human health or the environment. However, results for such analytes may be adequate for the intended risk assessment use, depending on the frequency of non-detects and on the degree by which the QL exceeds the TQL.Orange – The QL and DL both exceed the TQL. Non-detected analytical results for these analytes have a higher degree of uncertainty as to whether they are potentially present at the site at a concentration that may pose potentially unacceptable risk.Values that fall into the orange category may necessitate additional consideration to determine if: (1) lower detection limits can be achieved; (2) if TQLs should be revised to be more representative of site conditions; or (3) if uncertainty is unavoidable as currently available analytical methods cannot achieve low enough DLs.

Phase 1A RI Oversight QAPPWorksheet #15US Magnesium NPL Site
Section D: Sampling and AnalysisRevision 0
October 2013
Worksheet 15 Page 8 of 14
QAPP Worksheet #15 - Reference Limits and Evaluation Table
Analytical Group: PCBsMatrix: AqueousERM/US Magnesium Analytical Method: EPA Method 1668AEPA Split Sample Analytical Method: CLP SOW CBC01.2Concentration Level: LowLaboratory: CLP
Analyte CAS NumberTarget Quantitation
Limit (a) (µg/L)
Basis 1Contract Required Quantitation Limit
(µg/L)
Laboratory-Specific Quantitation Limit 2
(µg/L)
Laboratory-Specific Detection Limit 2
(µg/L)
Monochlorobiphenyls, Total 27323-18-8 1.3E-05 EPA Region 5 Water ESLs divided by the number of PCB homologues NA 2.00E-04 NA◊
Dichlorobiphenyls, Total 25512-42-9 1.3E-05 EPA Region 5 Water ESLs divided by the number of PCB homologues NA 2.00E-04 NA◊
Trichlorobiphenyls, Total 25323-68-6 1.3E-05 EPA Region 5 Water ESLs divided by the number of PCB homologues NA 2.00E-04 NA◊
Tetrachlorobiphenyls, Total 26914-33-0 1.3E-05 EPA Region 5 Water ESLs divided by the number of PCB homologues NA 2.00E-04 NA◊
Pentachlorobiphenyls, Total 25429-29-2 1.3E-05 EPA Region 5 Water ESLs divided by the number of PCB homologues NA 2.00E-04 NA◊
Hexachlorobiphenyls, Total 26601-64-9 1.3E-05 EPA Region 5 Water ESLs divided by the number of PCB homologues NA 2.00E-04 NA◊
Heptachlorobiphenyls, Total 28655-71-2 1.3E-05 EPA Region 5 Water ESLs divided by the number of PCB homologues NA 2.00E-04 NA◊
Octachlorobiphenyls, Total 55722-26-4 1.3E-05 EPA Region 5 Water ESLs divided by the number of PCB homologues NA 2.00E-04 NA◊
Nonachlorobiphenyls, Total 53742-07-7 1.3E-05 EPA Region 5 Water ESLs divided by the number of PCB homologues NA 2.00E-04 NA◊
Decachlorobiphenyl (PCB-209) 2051-24-3 1.3E-05 EPA Region 5 Water ESLs divided by the number of PCB homologues NA 2.00E-04 NA◊
Total PCB Homologues NA 1.3E-05 NA NA 2.00E-04 NA◊
PCB-77 32598-13-3 1.0E-05 EPA Region 5 Water ESLs divided by the number of coplanar PCB congeners 2.00E-05 2.00E-05 2.00E-06PCB-81 70362-50-4 1.0E-05 EPA Region 5 Water ESLs divided by the number of coplanar PCB congeners 2.00E-05 2.00E-05 2.00E-06PCB-105 32598-14-4 1.0E-05 EPA Region 5 Water ESLs divided by the number of coplanar PCB congeners 2.00E-05 2.00E-05 2.00E-06PCB-114 74472-37-0 1.0E-05 EPA Region 5 Water ESLs divided by the number of coplanar PCB congeners 2.00E-05 2.00E-05 2.00E-06PCB-118 31508-00-6 1.0E-05 EPA Region 5 Water ESLs divided by the number of coplanar PCB congeners 2.00E-05 2.00E-05 2.00E-06PCB-123 65510-44-3 1.0E-05 EPA Region 5 Water ESLs divided by the number of coplanar PCB congeners 2.00E-05 2.00E-05 2.00E-06PCB-126 57465-28-8 1.0E-05 EPA Region 5 Water ESLs divided by the number of coplanar PCB congeners 2.00E-05 2.00E-05 2.00E-06PCB-156 38380-08-4 1.0E-05 EPA Region 5 Water ESLs divided by the number of coplanar PCB congeners 2.00E-05 2.00E-05 2.00E-06PCB-157 69782-90-7 1.0E-05 EPA Region 5 Water ESLs divided by the number of coplanar PCB congeners 2.00E-05 2.00E-05 2.00E-06PCB-167 52663-72-6 1.0E-05 EPA Region 5 Water ESLs divided by the number of coplanar PCB congeners 2.00E-05 2.00E-05 2.00E-06PCB-169 32774-16-6 1.0E-05 EPA Region 5 Water ESLs divided by the number of coplanar PCB congeners 2.00E-05 2.00E-05 2.00E-06PCB-189 39635-31-9 1.0E-05 EPA Region 5 Water ESLs divided by the number of coplanar PCB congeners 2.00E-05 2.00E-05 2.00E-06Notes:µg/L - micrograms per literNA - Not Available1 References for Target Quantitation Limits (TQLs) are presented in the WS-15 TQL references table at the end of this collection of worksheets.
(a) Color codes indicate relation between TQL and DL or QL:
Gray - No contract required quantitation limit (CRQL) for this analyte
2 Values provided by Test America. Laboratory results will be reported to the estimated detection limit (EDL). EDLs are sample-specific values calculated from each sample analysis. These values are representative of those achieved in clean samples without matrix interferences or elevated target analyte concentrations. Toxic PCB congeners for which TEQ values are established are highlighted in yellow. These are the specific individual congeners that would be reported in a combined analysis for toxic PCB congeners (WHO List) plus homolog totals.
Green – The contract required quantitation limit (CRQL) exceeds the TQL.
No color – The QL and DL both are lower than the TQL. Non-detect results for these analytes carry a high degree of certainty that the non-detected concentrations will not pose a potentially unacceptable risk to human health or the environment. Yellow – The TQL falls between the QL and the DL. Non-detects present some uncertainty as to whether the analyte is present at a level that poses potentially unacceptable risk to human health or the environment. However, results for such analytes may be adequate for the intended risk assessment use, depending on the frequency of non-detects and on the degree by which the QL exceeds the TQL. Orange – The QL and DL both exceed the TQL. Non-detected analytical results for these analytes have a higher degree of uncertainty as to whether they are potentially present at the site at a concentration that may pose potentially unacceptable risk.Values that fall into the orange category may necessitate additional consideration to determine if: (1) lower detection limits can be achieved; (2) if TQLs should be revised to be more representative of site conditions; or (3) if uncertainty is unavoidable as currently available analytical methods cannot achieve low enough DLs.
NA◊ denotes that a comparison cannot be performed between the TEQ and the DL until EDLs are established for the sample analysis.

Phase 1A RI Oversight QAPPWorksheet #15US Magnesium NPL Site
Section D: Sampling and AnalysisRevision 0
October 2013
Page 9 of 14
Analytical Group: VOCsMatrix: SolidsERM/US Magnesium Analytical Method: EPA Method SW846 8260BEPA Split Sample Analytical Method: CLP SOW SOM01.2Concentration Level: LowLaboratory: CLP
Analyte CAS NumberTarget Quantitation
Limit (a) (µg/kg)
Basis 1Contract Required Quantitation Limit
(µg/kg)
Laboratory-Specific Quantitation Limit 2
(µg/kg)
Laboratory-Specific Detection Limit 2, 3
(µg/kg)
1,4-Dioxane 123-91-1 1.2E+01 Fresh Water Sediment TDL 1.00E+02 2.50E+02 3.90E+011,1-Dichloroethane 75-34-3 5.8E-01 EPA Region 5 Sediment ESLs 5.00E+00 5.00E+00 2.90E-011,1-Dichloroethene 75-35-4 1.9E+01 EPA Region 5 Sediment ESLs 5.00E+00 5.00E+00 2.60E-011,2-Dibromo-3-chloropropane 96-12-8 3.5E+01 EPA Region 5 Soil ESLs 5.00E+00 1.00E+01 8.80E-011,2-Dibromoethane 106-93-4 1.7E+02 Industrial RSL 5.00E+00 1.00E+01 2.70E-011,2-Dichlorobenzene 95-50-1 1.3E+01 Marine Sediment - AET 5.00E+00 5.00E+00 6.40E-011,2-Dichloroethane 107-06-2 2.0E+01 Freshwater Sediment - Dutch Target 5.00E+00 5.00E+00 7.30E-01cis-1,2-Dichloroethene 156-59-2 2.0E+05 Industrial RSL 5.00E+00 5.00E+00 8.90E-01trans-1,2-Dichloroethene 156-60-5 6.5E+02 EPA Region 5 Sediment ESLs 5.00E+00 5.00E+00 3.80E-011,2-Dichloropropane 78-87-5 2.0E+00 Freshwater Sediment - Dutch Target 5.00E+00 5.00E+00 6.00E-011,3-Dichlorobenzene 541-73-1 3.0E+01 Freshwater Sediment - Dutch Target 5.00E+00 5.00E+00 3.00E-01cis-1,3-Dichloropropene 10061-01-5 1.0E+02 CCME Agricultural SQGs 5.00E+00 5.00E+00 6.40E-01trans-1,3-Dichloropropene 10061-02-6 1.0E+02 CCME Agricultural SQGs 5.00E+00 5.00E+00 7.50E-011,4-Dichlorobenzene 106-46-7 2.5E+01 Fresh Water Sediment TDL 5.00E+00 5.00E+00 7.80E-011,1,1-Trichloroethane 71-55-6 9.5E+00 Salt Water Sediment TDL 5.00E+00 5.00E+00 3.60E-011,1,2-Trichloroethane 79-00-5 1.0E+02 CCME Agricultural SQGs 5.00E+00 5.00E+00 4.40E-011,1,2-Trichloro-1,2,2-trifluoroethane (Freon-113) 76-13-1 1.8E+07 Industrial RSL 5.00E+00 1.00E+01 5.30E-011,2,3-Trichlorobenzene 87-61-6 1.1E+01 Freshwater Sediment - Dutch Target 5.00E+00 5.00E+00 7.50E-011,2,4-Trichlorobenzene 120-82-1 4.8E+00 Marine Sediment - AET 5.00E+00 5.00E+00 7.50E-011,1,2,2-Tetrachloroethane 79-34-5 9.2E+01 Fresh Water Sediment TDL 5.00E+00 5.00E+00 6.80E-012-Butanone 78-93-3 1.5E+01 Fresh Water Sediment TDL 1.00E+01 1.00E+01 1.40E+002-Hexanone 591-78-6 5.8E+01 EPA Region 5 Sediment ESLs 1.00E+01 1.00E+01 7.40E-014-Methyl-2-pentanone 108-10-1 2.5E+01 EPA Region 5 Sediment ESLs 1.00E+01 1.00E+01 9.20E-01Acetone 67-64-1 8.7E-01 Salt Water Sediment TDL 1.00E+01 2.00E+01 1.40E+00Benzene 71-43-2 1.0E+01 Freshwater Sediment - Dutch Target 5.00E+00 5.00E+00 2.60E-01Bromochloromethane 74-97-5 6.8E+04 Industrial RSL 5.00E+00 5.00E+00 9.40E-01Bromodichloromethane 75-27-4 5.4E+02 EPA Region 5 Soil ESLs 5.00E+00 5.00E+00 5.30E-01Bromoform 75-25-2 6.5E+02 Marine Sediment - EqP (ecotox) 5.00E+00 5.00E+00 4.00E-01Bromomethane 74-83-9 2.4E+02 EPA Region 5 Soil ESLs 5.00E+00 5.00E+00 8.60E-01Carbon disulfide 75-15-0 9.4E+01 EPA Region 5 Soil ESLs 5.00E+00 1.00E+01 4.90E-01Carbon tetrachloride 56-23-5 4.1E+01 Salt Water Sediment TDL 5.00E+00 5.00E+00 5.30E-01Chlorobenzene 108-90-7 3.1E+01 Salt Water Sediment TDL 5.00E+00 5.00E+00 2.90E-01Cyclohexane 110-82-7 2.9E+06 Industrial RSL 5.00E+00 1.00E+01 2.63E+00Dibromochloromethane 124-48-1 2.1E+03 EPA Region 5 Soil ESLs 5.00E+00 5.00E+00 2.10E-01Chloroethane 75-00-3 6.1E+06 Industrial RSL 5.00E+00 5.00E+00 4.50E-01Chloroform 67-66-3 2.2E+00 Salt Water Sediment TDL 5.00E+00 5.00E+00 2.60E-01Chloromethane 74-87-3 1.0E+04 EPA Region 5 Soil ESLs 5.00E+00 5.00E+00 5.00E-01Dichlorodifluoromethane (Freon-12) 75-71-8 4.0E+04 EPA Region 5 Soil ESLs 5.00E+00 5.00E+00 8.90E-01Ethyl benzene 100-41-4 4.0E+00 Marine Sediment - AET 5.00E+00 5.00E+00 3.40E-01Isopropylbenzene 98-82-8 1.1E+06 Industrial RSL 5.00E+00 5.00E+00 5.20E-01Methyl tertiary butyl ether (MTBE) 1634-04-4 1.0E+05 Freshwater Sediment - Dutch Intervention 5.00E+00 1.00E+01 6.00E-01Dichloromethane (Methylene chloride) 75-09-2 1.8E+01 Freshwater Sediment - Dutch Target 5.00E+00 5.00E+00 8.40E-01Styrene 100-42-5 2.5E+01 Fresh Water Sediment TDL 5.00E+00 5.00E+00 3.10E-01Tetrachloroethene 127-18-4 2.0E+00 Freshwater Sediment - Dutch Target 5.00E+00 5.00E+00 6.10E-01Toluene 108-88-3 1.0E+01 Freshwater Sediment - Dutch Target 1.00E+01 5.00E+00 6.10E-01Trichloroethene 79-01-6 1.0E+01 CCME Agricultural SQGs 5.00E+00 5.00E+00 6.00E-01Trichlorofluoromethane (Freon-11) 75-69-4 1.6E+04 EPA Region 5 Soil ESLs 5.00E+00 1.00E+01 3.40E-01Vinyl chloride 75-01-4 1.0E+01 Freshwater Sediment - Dutch Target 5.00E+00 5.00E+00 3.60E-01o-Xylene 95-47-6 8.9E+01 Freshwater Sediment - Dutch Target 5.00E+00 5.00E+00 3.30E-01m,p-Xylene 179601-23-1 4.0E+00 Marine Sediment - AET (Xylene mixture) 5.00E+00 5.00E+00 8.10E-01Notes:µg/kg - micrograms per kilogram 1 References for Target Quantitation Limits (TQLs) are presented in the WS-15 TQL references table at the end of this collection of worksheets.NSV - No Screening Value Available 2 Values were provided by Test America. TBD - To Be Determined 3 Laboratory results will be reported to the MDLNA - Not Available(a) Color codes indicate relation between TQL and DL or QL:
Gray - No contract required quantitation limit (CRQL) for this analyte
QAPP Worksheet #15 - Reference Limits and Evaluation Table
Green – The contract required quantitation limit (CRQL) exceeds the TQL.
No color – The QL and DL both are lower than the TQL. Non-detect results for these analytes carry a high degree of certainty that the non-detected concentrations will not pose a potentially unacceptable risk to human health or the environment. Yellow – The TQL falls between the QL and the DL. Non-detects present some uncertainty as to whether the analyte is present at a level that poses potentially unacceptable risk to human health or the environment. However, results for such analytes may be adequate for the intended risk assessment use, depending on the frequency of non-detects and on the degree by which the QL exceeds the TQL.Orange – The QL and DL both exceed the TQL. Non-detected analytical results for these analytes have a higher degree of uncertainty as to whether they are potentially present at the site at a concentration that may pose potentially unacceptable risk. Values that fall into the orange category may necessitate additional consideration to determine if: (1) lower detection limits can be achieved; (2) if TQLs should be revised to be more representative of site conditions; or (3) if uncertainty is unavoidable as currently available analytical methods cannot achieve low enough DLs.

Phase 1A RI Oversight QAPPWorksheet #15US Magnesium NPL Site
Section D: Sampling and AnalysisRevision 0
October 2013
Page 10 of 14
Analytical Group: VOCsMatrix: AqueousERM/US Magnesium Analytical Method: EPA Method SW846 8260BEPA Split Sample Analytical Method: CLP SOW SOM01.2Concentration Level: TraceLaboratory: CLP
Analyte CAS NumberTarget Quantitation
Limit (a) (µg/L)
Basis 1Contract Required Quantitation Limit
(µg/L)
Laboratory-Specific Quantitation Limit 2
(µg/L)
Laboratory-Specific Detection Limit 2, 3
(µg/L)
1,4-Dioxane 123-91-1 6.7E-01 Tap Water RSL 2.00E+01 5.00E+01 2.50E-011,1-Dichloroethane 75-34-3 2.4E+00 Tap Water RSL 5.00E-01 1.00E+00 1.00E-011,1-Dichloroethene 75-35-4 2.5E+01 ORNL Water PRGs 5.00E-01 1.00E+00 1.40E-011,2-Dibromo-3-chloropropane 96-12-8 3.2E-04 Tap Water RSL 5.00E-01 2.00E+00 3.20E-011,2-Dibromoethane 106-93-4 6.5E-03 Tap Water RSL 5.00E-01 2.00E+00 2.20E-011,2-Dichlorobenzene 95-50-1 1.8E+00 Fresh Water TDL 5.00E-01 1.00E+00 1.40E-011,2-Dichloroethane 107-06-2 1.5E-01 Tap Water RSL 5.00E-01 1.00E+00 2.20E-01cis-1,2-Dichloroethene 156-59-2 2.8E+00 Tap Water RSL 5.00E-01 1.00E+00 1.00E-01trans-1,2-Dichloroethene 156-60-5 8.6E+00 Tap Water RSL 5.00E-01 1.00E+00 1.10E-011,2-Dichloropropane 78-87-5 3.8E-01 Tap Water RSL 5.00E-01 1.00E+00 1.50E-011,3-Dichlorobenzene 541-73-1 5.9E+00 Fresh Water TDL 5.00E-01 1.00E+00 1.10E-01cis-1,3-Dichloropropene 10061-01-5 NSV NSV 5.00E-01 1.00E+00 2.20E-01trans-1,3-Dichloropropene 10061-02-6 NSV NSV 5.00E-01 1.00E+00 8.00E-021,4-Dichlorobenzene 106-46-7 4.2E-01 Tap Water RSL 5.00E-01 1.00E+00 1.30E-011,1,1-Trichloroethane 71-55-6 6.1E+00 Fresh Water TDL 5.00E-01 1.00E+00 1.90E-011,1,2-Trichloroethane 79-00-5 4.1E-02 Tap Water RSL 5.00E-01 1.00E+00 3.10E-011,1,2-Trichloro-1,2,2-trifluoroethane (Freon-113) 76-13-1 5.3E+03 Tap Water RSL 5.00E-01 2.00E+00 2.50E-011,2,3-Trichlorobenzene 87-61-6 5.2E-01 Tap Water RSL 5.00E-01 1.00E+00 1.40E-011,2,4-Trichlorobenzene 120-82-1 3.9E-01 Tap Water RSL 5.00E-01 1.00E+00 1.00E-011,1,2,2-Tetrachloroethane 79-34-5 6.6E-02 Tap Water RSL 5.00E-01 1.00E+00 9.00E-022-Butanone 78-93-3 4.9E+02 Tap Water RSL 5.00E+00 2.00E+00 5.00E-012-Hexanone 591-78-6 3.4E+00 Tap Water RSL 5.00E+00 2.00E+00 1.70E-014-Methyl-2-Pentanone 108-10-1 1.0E+02 EPA Region 5 Water ESLs 5.00E+00 2.00E+00 5.00E-01Acetone 67-64-1 3.5E+02 Fresh Water TDL 5.00E+00 1.00E+01 5.00E-01Benzene 71-43-2 3.9E-01 Tap Water RSL 5.00E-01 1.00E+00 1.30E-01Bromochloromethane 74-97-5 8.3E+00 Tap Water RSL 5.00E-01 1.00E+00 1.40E-01Bromodichloromethane 75-27-4 1.2E-01 Tap Water RSL 5.00E-01 1.00E+00 1.40E-01Bromoform 75-25-2 7.9E+00 Tap Water RSL 5.00E-01 1.00E+00 1.00E-01Bromomethane 74-83-9 7.0E-01 Tap Water RSL 5.00E-01 1.00E+00 2.90E-01Carbon disulfide 75-15-0 9.2E-01 ORNL Water PRGs 5.00E-01 2.00E+00 1.60E-01Carbon tetrachloride 56-23-5 3.9E-01 Tap Water RSL 5.00E-01 1.00E+00 1.50E-01Chlorobenzene 108-90-7 5.7E+00 Fresh Water TDL 5.00E-01 1.00E+00 1.20E-01Cyclohexane 110-82-7 1.3E+03 Tap Water RSL 5.00E-01 2.00E+00 5.00E-01Dibromochloromethane 124-48-1 1.5E-01 Tap Water RSL 5.00E-01 1.00E+00 1.30E-01Chloroethane 75-00-3 2.1E+03 Tap Water RSL 5.00E-01 1.00E+00 3.40E-01Chloroform 67-66-3 1.9E-01 Tap Water RSL 5.00E-01 1.00E+00 1.20E-01Chloromethane 74-87-3 1.9E+01 Tap Water RSL 5.00E-01 1.00E+00 2.50E-01Dichlorodifluoromethane (Freon-12) 75-71-8 1.9E+01 Tap Water RSL 5.00E-01 1.00E+00 1.60E-01Ethyl benzene 100-41-4 1.3E+00 Tap Water RSL 5.00E-01 1.00E+00 1.00E-01Isopropylbenzene 98-82-8 3.9E+01 Tap Water RSL 5.00E-01 1.00E+00 1.20E-01Methyl tertiary butyl ether (MTBE) 1634-04-4 1.2E+01 Tap Water RSL 5.00E-01 2.00E+00 1.90E-01Dichloromethane (Methylene chloride) 75-09-2 8.4E+00 Tap Water RSL 5.00E-01 1.00E+00 3.50E-01Styrene 100-42-5 1.4E+01 Fresh Water TDL 5.00E-01 1.00E+00 1.50E-01Tetrachloroethene 127-18-4 3.5E+00 Tap Water RSL 5.00E-01 1.00E+00 1.00E-01Toluene 108-88-3 6.3E+00 Fresh Water TDL 5.00E-01 1.00E+00 2.50E-01Trichloroethene 79-01-6 2.6E-01 Tap Water RSL 5.00E-01 1.00E+00 1.30E-01Trichlorofluoromethane (Freon-11) 75-69-4 1.1E+02 Tap Water RSL 5.00E-01 1.00E+00 2.30E-01Vinyl chloride 75-01-4 1.5E-02 Tap Water RSL 5.00E-01 1.00E+00 2.20E-01o-Xylene 95-47-6 1.9E+01 Tap Water RSL 5.00E-01 1.00E+00 1.00E-01m,p-Xylene 179601-23-1 1.3E+01 ORNL Water PRGs (Xylene mixture) 5.00E-01 1.00E+00 1.80E-01Notes:µg/L - micrograms per liter 1 References for Target Quantitation Limits (TQLs) are presented in the WS-15 TQL references table at the end of this collection of worksheets.NSV - No Screening Value Available 2 Values were provided by Test America. TBD - To Be Determined 3 Laboratory results will be reported to the MDLNA - Not Available(a) Color codes indicate relation between TQL and DL or QL:
Gray - No contract required quantitation limit (CRQL) for this analyte
QAPP Worksheet #15 - Reference Limits and Evaluation Table
Green – The contract required quantitation limit (CRQL) exceeds the TQL.
No color – The QL and DL both are lower than the TQL. Non-detect results for these analytes carry a high degree of certainty that the non-detected concentrations will not pose a potentially unacceptable risk to human health or the environment Yellow – The TQL falls between the QL and the DL. Non-detects present some uncertainty as to whether the analyte is present at a level that poses potentially unacceptable risk to human health or the environment. However, results for such analytes may be adequate for the intended risk assessment use, depending on the frequency of non-detects and on the degree by which the QL exceeds the TQL.Orange – The QL and DL both exceed the TQL. Non-detected analytical results for these analytes have a higher degree of uncertainty as to whether they are potentially present at the site at a concentration that may pose potentially unacceptable risk.Values that fall into the orange category may necessitate additional consideration to determine if: (1) lower detection limits can be achieved; (2) if TQLs should be revised to be more representative of site conditions; or (3) if uncertainty is unavoidable as currently available analytical methods cannot achieve low enough DLs.

Phase 1A RI Oversight QAPPWorksheet #15US Magnesium NPL Site
Section D: Sampling and AnalysisRevision 0
October 2013
Page 11 of 14
Analytical Group: Dioxins and FuransMatrix: SolidsERM/US Magnesium Analytical Method: EPA Method SW846 8290EPA Split Sample Analytical Method: CLP SOW DLM02.2Concentration Level: LowLaboratory: CLP
Analyte CAS NumberTarget Quantitation
Limit (a) (µg/kg)
Basis 1Contract Required Quantitation Limit
(µg/kg)
Laboratory-Specific Quantitation Limit 2
(µg/kg)
Laboratory-Specific Detection Limit 2
(µg/kg)
1,2,3,7,8-PeCDD 40321-76-4 1.2E-04 EPA Region 5 Sediment ESLs for 2,3,7,8-TCDD 5.00E-03 5.00E-03 5.00E-051,2,3,7,8-PeCDF 57117-41-6 1.2E-04 EPA Region 5 Sediment ESLs for 2,3,7,8-TCDD 5.00E-03 5.00E-03 8.00E-051,2,3,4,7,8-HxCDF 70648-26-9 1.2E-04 EPA Region 5 Sediment ESLs for 2,3,7,8-TCDD 5.00E-03 5.00E-03 5.00E-051,2,3,4,7,8-HxCDD 39227-28-6 1.2E-04 EPA Region 5 Sediment ESLs for 2,3,7,8-TCDD 5.00E-03 5.00E-03 5.00E-051,2,3,6,7,8-HxCDD 57653-85-7 1.2E-04 EPA Region 5 Sediment ESLs for 2,3,7,8-TCDD 5.00E-03 5.00E-03 5.00E-051,2,3,7,8,9,-HxCDD 19408-74-3 1.2E-04 EPA Region 5 Sediment ESLs for 2,3,7,8-TCDD 5.00E-03 5.00E-03 5.00E-051,2,3,6,7,8,-HxCDF 57117-44-9 1.2E-04 EPA Region 5 Sediment ESLs for 2,3,7,8-TCDD 5.00E-03 5.00E-03 5.00E-051,2,3,7,8,9,-HxCDF 72918-21-9 1.2E-04 EPA Region 5 Sediment ESLs for 2,3,7,8-TCDD 5.00E-03 5.00E-03 5.00E-051,2,3,4,6,7,8-HpCDD 35822-46-9 1.2E-04 EPA Region 5 Sediment ESLs for 2,3,7,8-TCDD 5.00E-03 5.00E-03 5.00E-051,2,3,4,6,7,8-HpCDF 67562-39-4 1.2E-04 EPA Region 5 Sediment ESLs for 2,3,7,8-TCDD 5.00E-03 5.00E-03 5.00E-051,2,3,4,7,8,9-HpCDF 55673-89-7 1.2E-04 EPA Region 5 Sediment ESLs for 2,3,7,8-TCDD 5.00E-03 5.00E-03 5.00E-052,3,7,8-TCDD 1746-01-6 1.2E-04 EPA Region 5 Sediment ESLs 1.00E-03 1.00E-03 5.00E-052,3,7,8-TCDF 51207-31-9 1.2E-04 EPA Region 5 Sediment ESLs for 2,3,7,8-TCDD 1.00E-03 1.00E-03 5.00E-052,3,4,7,8-PeCDF 57117-31-4 1.2E-04 EPA Region 5 Sediment ESLs for 2,3,7,8-TCDD 5.00E-03 5.00E-03 8.00E-052,3,4,6,7,8,-HxCDF 60851-34-5 1.2E-04 EPA Region 5 Sediment ESLs for 2,3,7,8-TCDD 5.00E-03 5.00E-03 5.00E-05OCDD 3268-87-9 1.2E-04 EPA Region 5 Sediment ESLs for 2,3,7,8-TCDD 1.00E-02 1.00E-02 5.00E-04OCDF 39001-02-0 1.2E-04 EPA Region 5 Sediment ESLs for 2,3,7,8-TCDD 1.00E-02 1.00E-02 5.00E-04
Notes:
µg/kg - micrograms per kilogramNSV - No Screening Value Available1 References for Target Quantitation Limits (TQLs) are presented in the WS-15 TQL references table at the end of this collection of worksheets.
(a) Color codes indicate relation between TQL and DL or QL:
Gray - No contract required quantitation limit (CRQL) for this analyte
QAPP Workseet #15 - Reference Limits and Evaluation Table
2 Values provided by Test America. Laboratory results will be reported to the estimated detection limit (EDL). EDLs are sample-specific values calculated from each sample analysis. These values are representative of those achieved in clean samples without matrix interferences or elevated target analyte concentrations.
Green – The contract required quantitation limit (CRQL) exceeds the TQL.
No color – The QL and DL both are lower than the TQL. Non-detect results for these analytes carry a high degree of certainty that the non-detected concentrations will not pose a potentially unacceptable risk to human health or the environment. Yellow – The TQL falls between the QL and the DL. Non-detects present some uncertainty as to whether the analyte is present at a level that poses potentially unacceptable risk to human health or the environment. However, results for such analytes may be adequate for the intended risk assessment use, depending on the frequency of non-detects and on the degree by which the QL exceeds the TQL.Orange – The QL and DL both exceed the TQL. Non-detected analytical results for these analytes have a higher degree of uncertainty as to whether they are potentially present at the site at a concentration that may pose potentially unacceptable risk.Values that fall into the orange category may necessitate additional consideration to determine if: (1) lower detection limits can be achieved; (2) if TQLs should be revised to be more representative of site conditions; or (3) if uncertainty is unavoidable as currently available analytical methods cannot achieve low enough DLs.

Phase 1A RI Oversight QAPPWorksheet #15US Magnesium NPL Site
Section D: Sampling and AnalysisRevision 0
October 2013
Page 12 of 14
Analytical Group: Dioxins and FuransMatrix: AqueousERM/US Magnesium Analytical Method: EPA Method SW846 8290EPA Split Sample Analytical Method: CLP SOW DLM02.2Concentration Level: LowLaboratory: CLP
Analyte CAS NumberTarget Quantitation
Limit (a) (µg/L)
Basis 1Contract Required Quantitation Limit
(µg/L)
Laboratory-Specific Quantitation Limit 2
(µg/L)
Laboratory-Specific Detection Limit 2
(µg/L)
1,2,3,7,8-PeCDD 40321-76-4 3.0E-09 EPA Region 5 Water ESLs for 2,3,7,8-TCDD 5.00E-05 5.00E-05 5.00E-061,2,3,7,8-PeCDF 57117-41-6 3.0E-09 EPA Region 5 Water ESLs for 2,3,7,8-TCDD 5.00E-05 5.00E-05 2.50E-061,2,3,4,7,8-HxCDF 70648-26-9 3.0E-09 EPA Region 5 Water ESLs for 2,3,7,8-TCDD 5.00E-05 5.00E-05 2.50E-061,2,3,4,7,8-HxCDD 39227-28-6 3.0E-09 EPA Region 5 Water ESLs for 2,3,7,8-TCDD 5.00E-05 5.00E-05 8.00E-061,2,3,6,7,8-HxCDD 57653-85-7 3.0E-09 EPA Region 5 Water ESLs for 2,3,7,8-TCDD 5.00E-05 5.00E-05 8.00E-061,2,3,7,8,9,-HxCDD 19408-74-3 3.0E-09 EPA Region 5 Water ESLs for 2,3,7,8-TCDD 5.00E-05 5.00E-05 8.00E-061,2,3,6,7,8,-HxCDF 57117-44-9 3.0E-09 EPA Region 5 Water ESLs for 2,3,7,8-TCDD 5.00E-05 5.00E-05 2.50E-061,2,3,7,8,9,-HxCDF 72918-21-9 3.0E-09 EPA Region 5 Water ESLs for 2,3,7,8-TCDD 5.00E-05 5.00E-05 2.50E-061,2,3,4,6,7,8-HpCDD 35822-46-9 3.0E-09 EPA Region 5 Water ESLs for 2,3,7,8-TCDD 5.00E-05 5.00E-05 5.00E-061,2,3,4,6,7,8-HpCDF 67562-39-4 3.0E-09 EPA Region 5 Water ESLs for 2,3,7,8-TCDD 5.00E-05 5.00E-05 5.00E-061,2,3,4,7,8,9-HpCDF 55673-89-7 3.0E-09 EPA Region 5 Water ESLs for 2,3,7,8-TCDD 5.00E-05 5.00E-05 5.00E-062,3,7,8-TCDD 1746-01-6 3.0E-09 EPA Region 5 Water ESLs for 2,3,7,8-TCDD 1.00E-05 1.00E-05 2.00E-062,3,7,8-TCDF 51207-31-9 3.0E-09 EPA Region 5 Water ESLs 1.00E-05 1.00E-05 2.00E-062,3,4,7,8-PeCDF 57117-31-4 3.0E-09 EPA Region 5 Water ESLs for 2,3,7,8-TCDD 5.00E-05 5.00E-05 2.50E-062,3,4,6,7,8,-HxCDF 60851-34-5 3.0E-09 EPA Region 5 Water ESLs for 2,3,7,8-TCDD 5.00E-05 5.00E-05 2.50E-06OCDD 3268-87-9 3.0E-09 EPA Region 5 Water ESLs for 2,3,7,8-TCDD 1.00E-04 1.00E-04 1.00E-05OCDF 39001-02-0 3.0E-09 EPA Region 5 Water ESLs for 2,3,7,8-TCDD 1.00E-04 1.00E-04 1.00E-05Notes:µg/L - micrograms per literNSV - No Screening Value Available1 References for Target Quantitation Limits (TQLs) are presented in the WS-15 TQL references table at the end of this collection of worksheets.
(a) Color codes indicate relation between TQL and DL or QL:
Gray - No contract required quantitation limit (CRQL) for this analyte
QAPP Workseet #15 - Reference Limits and Evaluation Table
2 Values provided by Test America. Laboratory results will be reported to the estimated detection limit (EDL). EDLs are sample-specific values calculated from each sample analysis. These values are representative of those achieved in clean samples without matrix interferences or elevated target analyte concentrations.
Green – The contract required quantitation limit (CRQL) exceeds the TQL.
No color – The QL and DL both are lower than the TQL. Non-detect results for these analytes carry a high degree of certainty that the non-detected concentrations will not pose a potentially unacceptable risk to human health or the environment. Yellow – The TQL falls between the QL and the DL. Non-detects present some uncertainty as to whether the analyte is present at a level that poses potentially unacceptable risk to human health or the environment. However, results for such analytes may be adequate for the intended risk assessment use, depending on the frequency of non-detects and on the degree by which the QL exceeds the TQL.Orange – The QL and DL both exceed the TQL. Non-detected analytical results for these analytes have a higher degree of uncertainty as to whether they are potentially present at the site at a concentration that may pose potentially unacceptable risk.Values that fall into the orange category may necessitate additional consideration to determine if: (1) lower detection limits can be achieved; (2) if TQLs should be revised to be more representative of site conditions; or (3) if uncertainty is unavoidable as currently available analytical methods cannot achieve low enough DLs.

Phase 1A RI Oversight QAPPWorksheet #15US Magnesium NPL Site
Section D: Sampling and AnalysisRevision 0
October 2013
Page 13 of 14
Analytical Group:Matrix: SolidsERM/US Magnesium Analytical Methods: EPA 9012 for Cyanide, EPA 314 and 6850 for Perchlorate, EPA 9045D for pH, and EPA 9060 for TOCEPA Split Sample Analytical Methods: CLP SOW ISM01.3 for Cyanide, EPA 314 and 6850 for Perchlorate, EPA 9045D for pH, and EPA 9060 for TOCConcentration Level: StandardLaboratories: CLP for Cyanide; ESAT for pH; Subcontract lab(s) (TBD) for Perchlorate and TOC
Analyte CAS Number ERM/US Magnesium Analytical Method
EPA Split Sample Analytical Method 4
Target Quantitation Limit (a)
(µg/kg) Basis 1
Contract Required Quantitation Limit
(µg/kg)
Laboratory-Specific Quantitation Limit 2
(µg/kg)
Laboratory-Specific Detection Limit 2, 3
(µg/kg)
Cyanide 57-12-5 EPA 9012 CLP SOW ISM01.3 1E-01 EPA Region 5 Sediment ESLs 5.00E+02 5.00E+02 2.10E+02
Perchlorate5 14797-73-0 EPA 314 EPA 314 7.20E+04 Industrial RSL -- 4.00E+01 2.00E+01
Perchlorate (Confirmation) 14797-73-0 EPA 6850 EPA 6850 7.20E+04 Industrial RSL -- 5.00E+00 2.60E-01
pH NA EPA 9045D EPA 9045D NSV NSV -- NA4 NA
Total Organic Carbon (TOC) 7440-44-0 EPA 9060 EPA 9060 NSV NSV -- 4.00E+06 1.70E+06
Notes:µg/kg - micrograms per kilogramNSV - No Screening Value Available -- = Contract Required Quantitation Limit not applicable to non-CLP laboratory analysis1 References for Target Quantitation Limits (TQLs) are presented in the WS-15 TQL references table at the end of this collection of worksheets.2 Values were provided by Test America. 3 Laboratory results will be reported to the MDL4 Soil pH will reported to the nearest 0.1 standard pH unit.5 Confirm all detections using EPA Method 6850(a) Color codes indicate relation between TQL and DL or QL:
Yellow – The TQL falls between the QL and the DL. Non-detects present some uncertainty as to whether the analyte is present at a level that poses potentially unacceptable risk to human health or the environment. However, results for such analytes may be adequate for the intended risk assessment use, depending on the frequency of non-detects and on the degree by which the QL exceeds the TQL.Orange – The QL and DL both exceed the TQL. Non-detected analytical results for these analytes have a higher degree of uncertainty as to whether they are potentially present at the site at a concentration that may pose potentially unacceptable risk.Values that fall into the orange category may necessitate additional consideration to determine if: (1) lower detection limits can be achieved; (2) if TQLs should be revised to be more representative of site conditions; or (3) if uncertainty is unavoidable as currently available analytical methods cannot achieve low enough DLs.
QAPP Worksheet #15 - Reference Limits and Evaluation Table
No color – The QL and DL both are lower than the TQL. Non-detect results for these analytes carry a high degree of certainty that the non-detected concentrations will not pose a potentially unacceptable risk to human health or the environment.
General Chemistry (Cyanide, Perchlorate, pH, TOC)

Phase 1A RI Oversight QAPPWorksheet #15US Magnesium NPL Site
Section D: Sampling and AnalysisRevision 0
October 2013
Page 14 of 14
QAPP Worksheet #15 - Reference Limits and Evaluation Table
Analytical Group:Matrix: AqueousERM/US Magnesium Analytical Methods: EPA 9012 for Cyanide, EPA 6850 for Perchlorate, EPA 552.2 for Haloacetic Acids, EPA 300.0 for Anions, SM 2320B for Alkalinity, SM 2540C for TDS, and EPA 9060 for TOCEPA Split Sample Analytical Methods: CLP SOW ISM01.3 for Cyanide, EPA 6850 for Perchlorate, EPA 552.2 for Haloacetic Acids, EPA 300.0 for Anions, SM 2320B for Alkalinity, SM 2540C for TDS, and EPA 9060 for TOCConcentration Level: StandardLaboratories: CLP for Cyanide; ESAT for TDS and TOC; Subcontract lab(s) (TBD) for Alkalinity, Anions, Perchlorate, Haloacetic Acids
Analyte CAS Number ERM/US Magnesium Analytical Method
EPA Split Sample Analytical Method 4
Target Quantitation Limit (a)
(mg/L) Basis 1
Contract Required Quantitation Limit
(mg/L)
Laboratory-Specific Quantitation Limit 2
(mg/L)
Laboratory-Specific Detection Limit 2, 3
(mg/L)
Alkalinity NA SM 2320B SM 2320B NSV NSV -- 5.00E+00 NATotal Dissolved Solids NA SM 2540C SM 2540C NSV NSV -- 1.00E+01 5.40E+00Bromide 7726-95-6 EPA 300.0 EPA 300.0 NSV NSV -- 5.00E-01 8.80E-02Chloride 16887-00-6 EPA 300.0 EPA 300.0 2.30E+01 Fresh Water TDL -- 1.00E+00 3.70E-02Chlorine4 7782-50-5 Hach 8167 NA 7.50E-04 Salt Water TDL -- NA 2.00E-02Cyanide 57-12-5 EPA 9012 CLP SOW ISM01.3 1.21E-04 Salt Water TDL 1.00E-02 1.00E-02 5.00E-03Fluoride 7782-41-4 EPA 300.0 EPA 300.0 9.30E-02 Tap Water RSL -- 5.00E-01 5.90E-02Nitrogen, Nitrate 14797-55-8 EPA 300.0 EPA 300.0 2.50E+00 Tap Water RSL -- 5.00E-02 2.20E-02Nitrogen, Nitrite 14797-65-0 EPA 300.0 EPA 300.0 6.00E-02 Fresh Water TDL -- 5.00E-02 1.60E-02Sulfate (as SO4) 18785-72-3 EPA 300.0 EPA 300.0 NSV NSV -- 1.00E+00 4.90E-02Orthophosphate NA EPA 300.0 EPA 300.0 NSV NSV -- 2.00E-01 7.70E-02Perchlorate 14797-73-0 EPA 6850 EPA 6850 1.10E-03 Tap Water RSL -- 5.00E-04 8.20E-05Monochloroacetic acid 79-11-8 EPA 552.2 EPA 552.2 3.10E-03 Tap Water RSL -- 2.00E-02 4.00E-03Monobromoacetic acid 79-08-3 EPA 552.2 EPA 552.2 NSV NSV -- 1.00E-02 7.50E-03Dichloroacetic acid 79-43-6 EPA 552.2 EPA 552.2 1.30E-03 Tap Water RSL -- 1.00E-02 9.80E-03Dibromoacetic acid 631-64-1 EPA 552.2 EPA 552.2 NSV NSV -- 1.00E-02 3.80E-03Trichloroacetic acid 76-03-9 EPA 552.2 EPA 552.2 9.40E-04 Tap Water RSL -- 1.00E-02 3.80E-03Total Organic Carbon NA EPA 9060 EPA 9060 NSV NSV -- NA NANotes:mg/L - milligrams per liter 1 References for Target Quantitation Limits (TQLs) are presented in the WS-15 TQL references table at the end of this collection of worksheets.NA - Not Available 2 Values were provided by Test America. NSV - No Screening Value Available 3 Laboratory results will be reported to the MDL -- = Contract Required Quantitation Limit not applicable to non-CLP laboratory analysis 4 Due to the short holding time for chlorine, samples will be field-analyzed for total chlorine.(a) Color codes indicate relation between TQL and DL or QL:
No color – The QL and DL both are lower than the TQL. Non-detect results for these analytes carry a high degree of certainty that the non-detected concentrations will not pose a potentially unacceptable risk to human health or the environment. Yellow – The TQL falls between the QL and the DL. Non-detects present some uncertainty as to whether the analyte is present at a level that poses potentially unacceptable risk to human health or the environment. However, results for such analytes may be adequate for the intended risk assessment use, depending on the frequency of non-detects and on the degree by which the QL exceeds the TQL.Orange – The QL and DL both exceed the TQL. Non-detected analytical results for these analytes have a higher degree of uncertainty as to whether they are potentially present at the site at a concentration that may pose potentially unacceptable risk.Values that fall into the orange category may necessitate additional consideration to determine if: (1) lower detection limits can be achieved; (2) if TQLs should be revised to be more representative of site conditions; or (3) if uncertainty is unavoidable as currently available analytical methods cannot achieve low enough DLs.
Cyanide, Percholorate, Haloacetic Acids, Anions, Alkalinity, TDS, TOC

Phase 1A RI Oversight QAPP Attachments Revision: 0 US Magnesium NPL Site October 2013
ATTACHMENT 17A: FIELD STANDARD OPERATING PROCEDURES

PWT STANDARD OPERATING PROCEDURE
SAMPLE HANDLING Procedure No. PWT-130-406, Rev. 2.1
(This procedure is a modification of Standard Operating Procedure PWT-ENSE-406 and should only be used at the US Magnesium NPL Site)
Date effective: 10/08/13
APPROVED: 10/09/2013 Page i of 6
PWT Project Manager, Catherine LeCours Date
This SOP is approved for use in conjunction with the US Magnesium Oversight QAPP. The QAPP is the
governing document as noted in this SOP and will override this SOP in instances of discrepancies.
TABLE OF CONTENTS
Section Page No.
TABLE OF CONTENTS ............................................................................................................................. i
List of Attachments ........................................................................................................................................ i
1.0 PURPOSE AND SCOPE .................................................................................................................. 1
2.0 REQUIREMENTS ............................................................................................................................ 1
2.1. Quality Assurance / Quality Control ................................................................................................. 1
2.2. Health and Safety ………………………………………………………………………………….1
2.3. Personnel Qualifications ...………………………………………………………………………...1
3.0 MATERIALS AND EQUIPMENT .................................................................................................. 1
4.0 PROCEDURES ................................................................................................................................. 2
4.1 Sample Identification .................................................................................................................... 2
4.2 Sample Labeling ........................................................................................................................... 2
4.3 Sample Handling ........................................................................................................................... 2
4.3.1 Sample Containers ................................................................................................................ 2
4.3.2 Sample Preservation .............................................................................................................. 2
4.3.3 Sample Handling and Shipping ............................................................................................. 3
4.3.4 Sample Container Tampering ............................................................................................... 4
4.3.5 Holding Times and Analyses ................................................................................................ 4
5.0 DOCUMENTATION ....................................................................................................................... 4
5.1 Sample Management Logbook ..................................................................................................... 4
5.2 Chain of Custody .......................................................................................................................... 5
List of Attachments
Attachment A Example Chain of Custody Form
Attachment B Example Custody Seal
REVISION LOG
Revision Number Description Date
1.0 Original SOP July 2011
2.0 QA Review and Update March 2012
2.1 Project-Specific for US Magnesium October 2013

SAMPLE HANDLING
Procedure No. PWT-130-406
Revision 2.1
Page 1 of 6
1.0 PURPOSE AND SCOPE
This Standard Operating Procedure (SOP) provides technical guidance and methods that will be used to
handle environmental samples (such as: soil, groundwater, surface water, sediment, waste, and air
samples) during environmental investigations. This SOP serves as a supplement to site-wide and
investigation area specific workplans and the site-specific Quality Assurance Project Plan (QAPP) and may
be used in conjunction with other SOPs.
2.0 REQUIREMENTS
The following sections identify the requirements for Quality Assurance / Quality Control (QA/QC),
health and safety, and personnel qualifications for sample handling.
2.1. Quality Assurance / Quality Control
Follow all QA/QC requirements identified for the project as identified in approved project planning
document(s).
2.2. Health and Safety
Follow health and safety requirements identified in the Site-Specific Health and Safety Plan, Job Safety
Analyses (JSAs), any applicable Task-Specific Health and Safety Plans prepared by PWT Subcontractors,
and the associated Activity Hazard Analyses (AHAs).
2.3. Personnel Qualifications
Personnel performing sample handling activities will have knowledge and experience in the equipment
and procedures used, or will work under the direct field supervision of knowledgeable and experienced
personnel. Sample handling will be directed by a PWT field sample manager responsible for ensuring
proper handling and shipment of samples. The field sample manager will be knowledgeable and
experienced in handling and shipping of environmental samples.
3.0 MATERIALS AND EQUIPMENT
The following materials and equipment may be needed for sample handling, packaging, and shipping:
Monitoring equipment and personal protective equipment (PPE) as specified in the HASP.
Appropriate clean sample containers as specified for each analytical method being tested. Sample
containers will contain appropriate preservatives, according to method specifications. Sample
containers will be provided by the analytical laboratory, unless otherwise specified in the QAPP.
Decontamination equipment and supplies (e.g., wash/rinse tubs, brushes, Alconox, plastic
sheeting, paper towels, sponges, baby wipes, garden-type water sprayers, large plastic bags,
potable water, distilled water and/or deionized water).
Sample handling supplies (e.g., recloseable plastic bags, waterproof markers and sample labels,
cooler for sample storage, ice or ice substitute).
Sample management supplies (e.g., soil sample field data sheets, chain-of-custody [COC] forms).
An example COC form is included as Attachment A.
Sample shipping supplies (shipping coolers, recloseable plastic bags, shipping labels, shipping
forms [provided by shipping courier], bubble wrap, tape [e.g., clear tape, packing tape, and
custody seal tape]).

SAMPLE HANDLING
Procedure No. PWT-130-406
Revision 2.1
Page 2 of 6
Other materials and equipment may be needed based on field conditions.
4.0 PROCEDURES
4.1 Sample Identification
Samples collected during investigation activities will be identified using a pre-determined sample
identification (ID) scheme described in the project or investigation –specific sampling plan.
Typically, sample ID numbers consist of two main components:
The investigation location site identifier, which may include numbers, letters, or a combination of
the two, and which corresponds to the investigation location at which the sample was collected
Sample-specific information, such as the sample collection method, sample depth interval, sample
type and sequential sample number
4.2 Sample Labeling
Sample labels will be filled out to the extent possible before field sampling activities begin. However, the
date, time, sample depth, and sampler's initials or signature will typically not be completed until the time
of sample collection. Sample labels will be filled out using waterproof ink. At a minimum, each label
will contain the following information:
Project name
Sample ID
Date and time of sample collection
Method of preservation (if any) used
Analyses required
Sampler initials
4.3 Sample Handling
This section discusses proper sample containers, preservatives, and handling and shipping procedures.
4.3.1 Sample Containers
Unless otherwise specified in the QAPP, clean sample containers will be obtained from the subcontracted
analytical laboratory performing the analyses. Extra containers will be ordered to account for the
possibility of breakage during shipment or sample collection. To the extent possible, required
preservatives will be prepared and placed in the bottles at the laboratory before shipment to the site.
Project-specific sample containers will be identified in the site-specific QAPP.
4.3.2 Sample Preservation
Samples will be preserved in accordance with the site-specific QAPP. Chemical preservatives, if
necessary, will be added to the sample containers by the laboratory (or vendor) before shipment to the
field. Samples will be stored at appropriate temperatures as specified in the site-specific QAPP.

SAMPLE HANDLING
Procedure No. PWT-130-406
Revision 2.1
Page 3 of 6
4.3.3 Sample Handling and Shipping
Sample containers will be packaged properly to prevent breakage of containers and leakage of contents.
The following procedures will be followed during the packaging and shipping process:
1. Place sample containers in recloseable plastic bags.
2. If sample container is glass, wrap individual sample containers with bubble wrap.
3. Place sufficient amounts of bubble wrap in the bottom and sides of the shipping cooler to prevent
movement of contents.
4. Add enough ice (in double bags) or ice substitute to the cooler to maintain proper preservation
temperature in accordance with the QAPP.
5. Fill any void space in the cooler with packing material (e.g., bubble wrap) to prevent movement
of sample containers.
6. Place the original COC form inside a recloseable plastic bag, and tape the bag to the inside of the
cooler lid.
7. Close the cooler lid, and seal the cooler and the cooler drain spout with appropriate packaging
tape.
8. Place two custody seals (tampering seals) on the cooler in separate areas over (across) the seal
between the lid and the cooler base. Example custody seals are included as Attachment B.
A shipping bill should be completed for the shipper and taped to the top of the cooler using the envelope
provided by the shipper. The following markings may also be placed on the top of the cooler:
This end up
Fragile
Laboratory delivery address
Sender's return address
A copy of the shipping bill will be retained by the field sample manager for attachment to the
corresponding COC form. Samples will be hand delivered or shipped by express courier for delivery to
the analytical laboratory.
The field sample manager or field team leader is responsible for verifying that samples collected by the
field team(s) have been properly identified, preserved, and packaged, and for verifying the accuracy and
completeness of sample labels, COC forms, and applicable sample field data sheets and logbook entries.
The following is a summary of steps to be performed by the field sample manager:
Verify sample labels.
Verify samples were collected and preserved in accordance with the site-specific FSP and QAPP.
Check or complete the COC form, photocopy, and retain a copy for the project files.
Pack samples in shipping containers and verify labels and shipping forms meet shipping
requirements.
Send original COC form to the laboratory.
Retain a copy of the shipping bill and staple it to the corresponding COC copy.
Send copies of sample field data sheets and photocopied pages of field logbooks to the project
manager.

SAMPLE HANDLING
Procedure No. PWT-130-406
Revision 2.1
Page 4 of 6
Close coordination will be maintained between the field sample manager and the analytical laboratory
during sample collection and shipment. The laboratory will be instructed to report any handling or
preservation issues immediately to the field sample manager (or other designated person) so that
corrections can be made to field procedures, if necessary.
4.3.4 Sample Container Tampering
If, at any time after samples have been secured, custody seals on the cooler are identified as having been
tampered with, the following procedures will be conducted to ensure that sample integrity has not been
compromised:
Check with personnel having access to sample coolers to assess the possibility of inadvertent
breakage of custody seals.
Inspect sample containers for signs of tampering, such as loose lids, foreign objects in containers,
or broken or leaking containers.
Review sample packaging and handling procedures.
Document findings of the incident in the sample management logbook.
If it is determined that intentional tampering of samples has occurred, or it is believed that sample
integrity has been compromised in any way, the Quality Assurance Officer and appropriate project
managers will be notified.
4.3.5 Holding Times and Analyses
Samples will be shipped to the analytical laboratory for analysis as soon as practical following collection.
At a minimum, samples will be shipped daily with the following exception. For small projects, samples
may be collected over a period of several days at the discretion of the project managers, and then
collectively shipped. No samples will be shipped on Friday for weekend delivery unless receipt and
analysis procedures are pre-coordinated with the analytical laboratory. Allowable holding times for
specific samples will be specified in the site-specific QAPP.
5.0 DOCUMENTATION
Documentation of sample handling is critical to project defensibility. The field sample manager will be
responsible for ensuring all sample collection and handling documentation is complete and accurate.
5.1 Sample Management Logbook
The field sample manager will maintain a complete and accurate sample management logbook
documenting sample handling procedures and observations. The logbook will be a permanently bound
weatherproof field logbook with consecutively numbered pages. The field sample manager will also
maintain a complete and accurate sample management file containing copies of all sample field data
sheets, sampling crew logbooks, COC forms, shipping documentation, and written logs of
correspondence or communications with the laboratory and other pertinent correspondence and
communications. The sample management logbook will contain sufficiently detailed information to
allow all significant sampling issues to be reconstructed without relying on the memory of sampling
personnel.

SAMPLE HANDLING
Procedure No. PWT-130-406
Revision 2.1
Page 5 of 6
The sample management logbook will contain daily entries for the following information:
Project name
Sampling activities performed that day
Sampling crews and affiliations
Sample location identifications
List of samples collected, including sample IDs, collection time/date, media, analysis methods,
and associated COC and shipping documentation
QA/QC samples collected and submitted for analysis
Field observations
Instrument calibration information
Correspondence and communications
Field sample manager’s signature
Changes or deletions in the logbook will be lined out with a single strike mark, initialed and dated by the
person making the change. Sufficient information should be recorded to allow the reason for the change
to be reconstructed without relying on the memory of field personnel.
The field sample manager will prepare copies of the sample management logbook, sample field data
sheets, and field crew logbooks for the project manager and client. The field sample manager will
coordinate with the project manager on the required frequency of transmittal of this information. The
client will expect this information to be available, accurate, and complete on a daily basis for possible
inspection by the client, quality assurance personnel, the project manager or the regulatory agency.
5.2 Chain of Custody
Written documentation of the proper and secure handling of samples from the time samples are collected
until laboratory data are issued is critical to project defensibility. The chain of custody of the physical
sample and its corresponding documentation will be maintained throughout the handling of the sample.
Sample custody applies to both the field and laboratory operations. Information on the custody, transfer,
handling, and shipping of samples will be recorded on a COC form. An example COC form is provided
as Attachment A. The COC form may consist of a triplicate, pressure-sensitive form or other form
prepared by the contract laboratory, or the COC form may be electronically generated in the SCRIBE
software. The COC form may vary depending on investigation activities. The investigation contractor
will select an appropriate COC form subject to approval by the client.
A sample is under custody if it is in:
The possession of the sampler/analyst.
The view, after being in the possession, of the sampler/analyst.
A sealed shipping container being carried by a designated commercial carrier.
A designated secure area.
The sampling team will be responsible for initiating the original COC form and will sign and date the
COC form when relinquishing sample custody to another person (e.g., the field sample manager) or to the
analytical laboratory. The COC form and sample labels will be checked by the field sample manager to
verify that samples are accounted for and in good condition, and that no errors were made.

SAMPLE HANDLING
Procedure No. PWT-130-406
Revision 2.1
Page 6 of 6
The COC form will include the following information:
COC number (unique, sequential number on the upper right corner of the form)
Project name
Sample ID number
Sample preservatives
Number of containers
Sample collection date and time
Sample matrix
Requested analyses
Signature and date blocks for personnel relinquishing or receiving sample custody
Name and phone number of contractor contact person
Transfer of samples to the analytical laboratory may be via commercial carrier. The field sample
manager will verify the proper packaging and shipment of samples. Prior to shipping, the field sample
manager will officially transfer sample custody to the commercial carrier or analytical laboratory and
secure the COC form inside the shipping container. Shipping containers transferred via commercial
carrier will be sealed with strapping tape and with two custody seals. An example custody seal format is
provided as Attachment B. Receipts of bills of lading from the carrier will be maintained as part of the
custody record. Commercial carriers are not required to sign the COC form as long as the COC form is
sealed inside the shipping container and the custody seals remain intact.
Upon receipt at the laboratory, the person receiving the samples will sign the COC form accepting
transfer of custody to the laboratory. The laboratory will return a copy of the signed COC form to the
designated investigation contractor personnel (i.e., project chemist, field sample manager, or project
manager), and will retain a copy on file at the laboratory. The original COC form will remain with the
samples until final disposition of the samples by the laboratory in accordance with the site-specific
QAPP. After sample disposal, a copy of the original COC will be sent by the analytical laboratory to the
investigation contractor.

ATTACHMENT A
EXAMPLE CHAIN OF CUSTODY FORM

ATTACHMENT B
EXAMPLE CUSTODY SEAL

Phase 1A RI Oversight QAPP Attachments Revision: 0 US Magnesium NPL Site October 2013
ATTACHMENT 17B: COMPLETED, APPROVED MODIFICATION FORMS AND QAPP AMENDMENTS
(AMENDMENTS WILL BE COMPILED IN THIS ATTACHMENT AS GENERATED)
EPA-approved modification forms will be maintained and distributed through the Distribution List in WS#3.
Document Tracking Number
Modified Section / WS /
Table / Attachment
Date Received Date Approved
Date Distributed

Phase 1A RI Oversight QAPP Attachments Revision: 0 US Magnesium NPL Site October 2013
ATTACHMENT 19A: LABORATORY STANDARD OPERATING PROCEDURES
The CLP Statement of Work for each analytical group can be found at
http://www.epa.gov/superfund/programs/clp/analytic.htm.