
Perception of Indian Investors Towards Indian and Foreign...
14
IJER © Serials Publications 11(3), July-Dec. 2014: 627-639 ISSN: 0972-9380 Perception of Indian Investors Towards Indian and Foreign Mutual Funds Abstract: Mutual funds have facilitated many investors with a simple and efficient way of investing with the unique value chain, where investors may otherwise be deprived of the opportunity to invest in the capital markets. The under-penetrated capital market in India provides huge opportunities for market players to sell their products. Not only do Mutual funds have an significant role to play in catering to individual customers across sections of society, but the sector is also going a long way to support the India growth story overall. As of now the big challenge for the mutual fund industry is to mount on investor awareness and to spread further to the semi urban and rural areas. Analysing the perception of the investors becomes all the more important for mutual fund product designers and fund managers to make the mutual fund the strongest and most preferred investment option in Indian capital market for the coming years. Key words: Mutual Funds, capital market, investor awareness, perception, preferred investment option. 1. INTRODUCTION In India, mutual funds have turned out to be a well established source of wealth creation and customary investment avenue for middle income section of the economy. Investors are no longer content with the nominal returns they obtain out of conventional investment avenues like post office savings and bank deposits. Though the interest rates have increased compared to the last decade, the increase is disproportionate with the inflation. Political uncertainty, continued policy paralysis (both at the political and bureaucratic level), poor global and domestic macro economic factors impacted the confidence of the institutional investors as well as the retail in the Indian markets especially poor fiscal health and the high current account deficit besides a hugely underperforming currency. Inherent attitude of Indian retail investors to steer clear of risk along with the above-mentioned factors makes the ordinary investor to stay out of the market or forced to go for very minimum investment. * Associate Professor, Department of Management Studies, Sri Ramakrishna Engineering College, Coimbatore, India ** Director, Department of Management Studies, Sri Nehru Institute of Technology, Coimbatore, India
Transcript of Perception of Indian Investors Towards Indian and Foreign...
IJER © Serials Publications11(3), July-Dec. 2014: 627-639
ISSN: 0972-9380
Perception of Indian Investors TowardsIndian and Foreign Mutual Funds
Abstract: Mutual funds have facilitated many investors with a simple and efficient way ofinvesting with the unique value chain, where investors may otherwise be deprived of theopportunity to invest in the capital markets. The under-penetrated capital market in Indiaprovides huge opportunities for market players to sell their products. Not only do Mutualfunds have an significant role to play in catering to individual customers across sections ofsociety, but the sector is also going a long way to support the India growth story overall. Asof now the big challenge for the mutual fund industry is to mount on investor awarenessand to spread further to the semi urban and rural areas. Analysing the perception of theinvestors becomes all the more important for mutual fund product designers and fundmanagers to make the mutual fund the strongest and most preferred investment option inIndian capital market for the coming years.
Key words: Mutual Funds, capital market, investor awareness, perception, preferredinvestment option.
1. INTRODUCTION
In India, mutual funds have turned out to be a well established source of wealth creationand customary investment avenue for middle income section of the economy. Investorsare no longer content with the nominal returns they obtain out of conventionalinvestment avenues like post office savings and bank deposits. Though the interestrates have increased compared to the last decade, the increase is disproportionatewith the inflation. Political uncertainty, continued policy paralysis (both at the politicaland bureaucratic level), poor global and domestic macro economic factors impactedthe confidence of the institutional investors as well as the retail in the Indian marketsespecially poor fiscal health and the high current account deficit besides a hugelyunderperforming currency. Inherent attitude of Indian retail investors to steer clearof risk along with the above-mentioned factors makes the ordinary investor to stayout of the market or forced to go for very minimum investment.
* Associate Professor, Department of Management Studies, Sri Ramakrishna Engineering College,Coimbatore, India
** Director, Department of Management Studies, Sri Nehru Institute of Technology, Coimbatore, India

628 V. Vanaja and R. Karrupasamy
Mutual fund is the only option available for individual investors particularly formiddle class section of the economy. Mutual funds have enabled many investors witha simple and efficient way of investing with the unique value chain, where investorsmay otherwise be deprived of the opportunity to invest in the capital markets.
In this milieu, it becomes imperative on the part of fund managers and mutualfund product designers to combine various essentials of liquidity, return and securityin building mutual fund merchandise the unsurpassed potential option for the retailinvestors in Indian market. As of now big challenge for the under penetrated Indianmutual fund industry is to mount on investor awareness and to spread further to thesemi urban and rural areas. These initiatives would facilitate towards building theIndian mutual fund industry more vivacious and competitive.
2. THEORETICAL BACKGROUND
2.1. Concept of Mutual Fund
A Mutual Fund is a trust that pools the savings of a number of investors who share acommon financial goal. The money thus collected is then invested in capital marketand money market instruments such as shares, debentures and other securities. Theincome earned through these investments and the capital appreciation realised areshared by its unit holders in proportion to the number of units owned by them. Thusa Mutual Fund is the most suitable investment for the common man as it offers anopportunity to invest in a diversified, professionally managed basket of securities at arelatively low cost.
Chart 2.1: Function of Mutual Fund Industry

Perception of Indian Investors towards Indian and Foreign Mutual Funds 629
2.2. Organisation of a Mutual Fund
There are many entities involved and chart 2 illustrates the organisational set up of amutual fund Industry.
Chart 2.2: Organisation of Mutual Fund Industry
A mutual fund is set up in the form of a trust, which has sponsor, trustees, assetManagement Company (AMC) and custodian. The trust is established by a sponsoror more than one sponsor who is like promoter of a company. The trustees of themutual fund hold its property for the benefit of the unit holders. Asset ManagementCompany (AMC) approved by SEBI manages the funds by making investments invarious types of securities. Custodian, who is registered with SEBI, holds the securitiesof various schemes of the fund in its custody. The trustees are vested with the generalpower of superintendent and direction over AMC. They monitor the performanceand compliance of SEBI Regulations of the mutual fund.
SEBI Regulations require that at least two thirds of the directors of trustee companyor board of trustees must be independent i.e., they should not be associated with thesponsors. Also, 50% of the directors of AMC must be independent. All mutual fundsare required to be registered with SEBI before they launch any scheme.
2.3. Benefits of Investing in Mutual Funds
Investing in mutual funds has various benefits, which make it an ideal investmentavenue. Mutual fund offers benefits such as Professional Management, Convenientadministration, Potentiality of returns, low costs, diversification, liquidity,transparency, flexibility, affordability to invest in high-grade stocks, wide choice ofschemes, access to global markets etc.,
2.4. Drawbacks of Mutual Funds
Like many investments, mutual funds offer advantages and disadvantages, which areimportant for the investors to consider and understand before making investments.

630 V. Vanaja and R. Karrupasamy
Some of the drawbacks of mutual funds are no guarantee for returns like any otherinvestment avenue, fees and commissions or loads, Tax liability, fund manager’s abilityetc.,
3. STATEMENT OF THE PROBLEM
The under-penetrated capital market in India provides huge opportunities for marketplayers to sell their products. Not only do Mutual funds have an significant role toplay in catering to individual customers across sections of society, but the sector isalso going a long way to support the India growth story overall. The Mutual Fundsector has great potential indeed. It has progressed tremendously in the past, and yes,in a profitable manner. The future of Mutual Fund industry cannot be segregatedfrom the future of the economy of India. India as a whole as a country has enoughpotential. Due to the demographic advantage, expected growth of the economy, lowercost of transaction services, reach of stock market intermediaries, higher levels offinancial literacy, improved regulations etc., the domestic investor population investingin capital markets, directly or indirectly, to grow from about 22 million (less than 2per cent of India’s population) to more than 250 million (about 20 per cent ) by 2030.Analysing the perception of the investors becomes all the more important for fundmanagers to make the mutual fund the strongest and most preferred instrument inIndian capital market for the coming years.
4. OBJECTIVES OF THE STUDY
• To identify the factors that influence investment in mutual funds• To determine the perception of investors towards public sector and private sector
mutual fund schemes.• To determine the perception of investors towards Indian and foreign mutual fund
schemes in India.• To understand the role of demographics in mutual fund investment.
5. REVIEW OF LITERATURE
Lenard et al. (2003) concluded that the decision to switch funds within a fund family isaffected by investor’s attitude towards risk, current asset allocation, investment losses,investment mix, capital base of the fund age, initial fund performance, investmentmix, fund and portfolio diversification.
Bollen (2006) revealed that the extra-financial SR attribute serves to dampen therate at which SR investors trade mutual funds. The study noted that the differencesbetween SR funds and their conventional counterparts are robust over time and persistas funds age.
Walia and Kiran (2010) found out that majority of individual investors rank mutualfunds on higher side on a ranking scale and consider it as less risky investment when

Perception of Indian Investors towards Indian and Foreign Mutual Funds 631
compared to other investment avenues. The study also reported that significantrelationship of interdependence exists between income level of investors and theirperception for investment returns from mutual funds investment.
Saini et al. (2011) concluded that investors look for liquidity, simplicity in offerdocuments, online trading, regular updates through SMS and stringent follow up ofprovisions laid by AMFI.
Singh (2012) found out that most of the investors do not have much awarenessabout the various function of mutual funds. The study found that some demographicfactors like gender, income and level of education have a significant impact over theattitude towards mutual funds. On the contrary age and occupation have not beenfound influencing the investor’s attitude.
Bernadette d’silva (2013) revealed the influence of demographics of investors andconcluded that Mutual fund companies should promote financial awareness amongstthe respondents so as to channelize their income and savings towards Mutual Funds.
6. RESEARCH METHODOLOGY
A questionnaire was designed to accomplish the objective of analysing the perceptionof Indian investors towards mutual funds, their preference and the role ofdemographics in the choice of the schemes. Questionnaires were distributed to 500individual investors of Coimbatore region, which included selective investors whowere assumed to be having basic knowledge of financial environment. 350 filled inquestionnaires were received out of 13 are not filled in fully. Hence, the sampleconsidered for this study is 327. For analyzing primary data percentage method, Chi-square analysis is used to find out the relationship between two independent variablesand Mean score analysis is used to rank the factors according to the respondent’spreference.
7. ANALYSIS AND INTERPRETATION
7.1. Demographic Profile of the Investors
Table 7.1Demographic Profile of the Respondents
Gender No. of respondents Percentage
Male 271 82.57Female 56 17.13
Age (in years) No. of respondents Percentage
Less than 35 57 17.4335-45 171 52.2946-55 84 25.69Above 55 15 4.59
contd. table 7.1

632 V. Vanaja and R. Karrupasamy
Marital status No. of respondents Percentage
Married 263 80.43Unmarried 64 19.57
Educational Qualification No. of respondents Percentage
Up to class XII 24 7.33Diploma 46 14.07Graduate 168 51.38Post graduate 68 20.80Others 21 6.42
Occupation No. of respondents Percentage
Business 34 10.39Professional 39 11.93Private sector employee 83 25.38Government employee 122 37.31Retired 22 6.73Others 27 8.26
Majority (82.57%) of the respondents are male; most (52.29%) of the respondentsbelong to the age group of 35 to 45 years;. majority (80.43%) of the respondents aremarried; majority (51.38%) of the respondents are graduates and most (62.69%) of therespondents are employed either in public sector or private sector.
Table 7.2Preference of Respondents towards Mutual Fund
Knowledge about mutual fund No. of respondents Percentage
Mutual funds 96 29.36Equity Shares 28 8.56Fixed Deposits 113 34.56Gold 56 17.13Real Estate 21 6.42Others 13 3.98Total 327 100
Most (34.56%) of the respondents prefer fixed deposits followed by 26.36% of therespondents who prefer mutual funds.
Table 7.3Features Attracted Investment in Mutual Fund
Features No. of respondents Percentage
Diversification 47 14.37Liquidity 63 19.27Better return and safety 31 9.48Low risk and low transaction cost 28 8.56Regular income 58 17.74Tax benefit 82 25.08Professional management 18 5.50Total 327 100.00

Perception of Indian Investors towards Indian and Foreign Mutual Funds 633
Respondents are attracted by tax benefit, liquidity, regular income, diversificationof investments etc.
Table 7.4Knowledge about Proportion of Investment in Different Securities
Knowledge No. of respondents Percentage
Yes 119 36.39No 208 63.61Total 327 100
Majority (63.69%) of the respondents do not have knowledge about the proportionof investment made by Asset Management Companies in different securities.
7.2. Level of Satisfaction of Mutual Fund Investors
Table 7.5Level of Satisfaction of Mutual Fund Investors with Regard to Foreign Mutual Funds
(HS – Highly Satisfied, S – Satisfied, N –Neutral, DS – Dissatisfied & HDS – Highly Dissatisfied)
S. No. Features of mutual funds HS S N DS HDS
1 Return from investments 87(26.61%) 101(30.89%) 55(16.82%) 56(17.13%) 28(8.56%)2 Liquidity of investment 94(28.75%) 99(30.28%) 44(13.46%) 61(18.65%) 29(8.87%)3 Safety of Investment 104(31.80%) 102(31.19%) 49(14.98%) 46(14.07%) 26(7.95%)4 Full Disclosure of Information 98(29.97%) 114(34.86%) 59(18.04%) 35(10.70%) 21(6.42%)
regarding Scheme / Fund (likeobjective, periodicity ofvaluation, scheme’s sale/repurchase etc.)
5 Capital Appreciation 92(28.13%) 68(20.80%) 39(11.93%) 85(25.99%) 43(13.15%)6 Reputation of Sponsor 97(29.66%) 126(38.53%) 35(10.70%) 49(14.98%) 20(6.12%)7 Sponsor’s Expertise 73(22.32%) 96(29.36%) 88(26.91%) 57(17.43%) 13(3.98%)
(in managing money)8 Favourable Credit Rating 59(18.04%) 99(30.28%) 43(13.15%) 73(22.32%) 53(16.21%)
of Scheme / Fund9 Fringe Benefits (like Tax 98(29.97%) 114(34.86%) 59(18.04%) 35(10.70%) 21(6.42%)
Benefits, Free Insurance,Free Credit Card, Loans onCollateral etc.)
10 Regular Updates on every 89(27.22%) 105(32.11%) 81(24.77%) 41(12.54%) 11(3.36%)trading day (regardinginvestment, NAV etc.)
11 Promptness in Service 107(32.72%) 96(29.36%) 39(11.93%) 43(13.15%) 42(12.84%)12 Charges (Expense Ratio, 92(28.13%) 91(27.83%) 74(22.63%) 59(18.04%) 11(3.36%)
Entry Load and Exit Load)13 Retaliation of Investor’s 87(26.61%) 96(29.36%) 71(21.71%) 54(16.51%) 19(5.81%)
Grievances14 Early Bird Incentives 114(34.86%) 98(29.97%) 35(10.70%) 59(18.04%) 21(6.42%)15 Diversification of investments 88(26.91%) 96(29.36%) 73(22.32%) 57(17.43%) 13(3.98%)
634 V. Vanaja and R. Karrupasamy
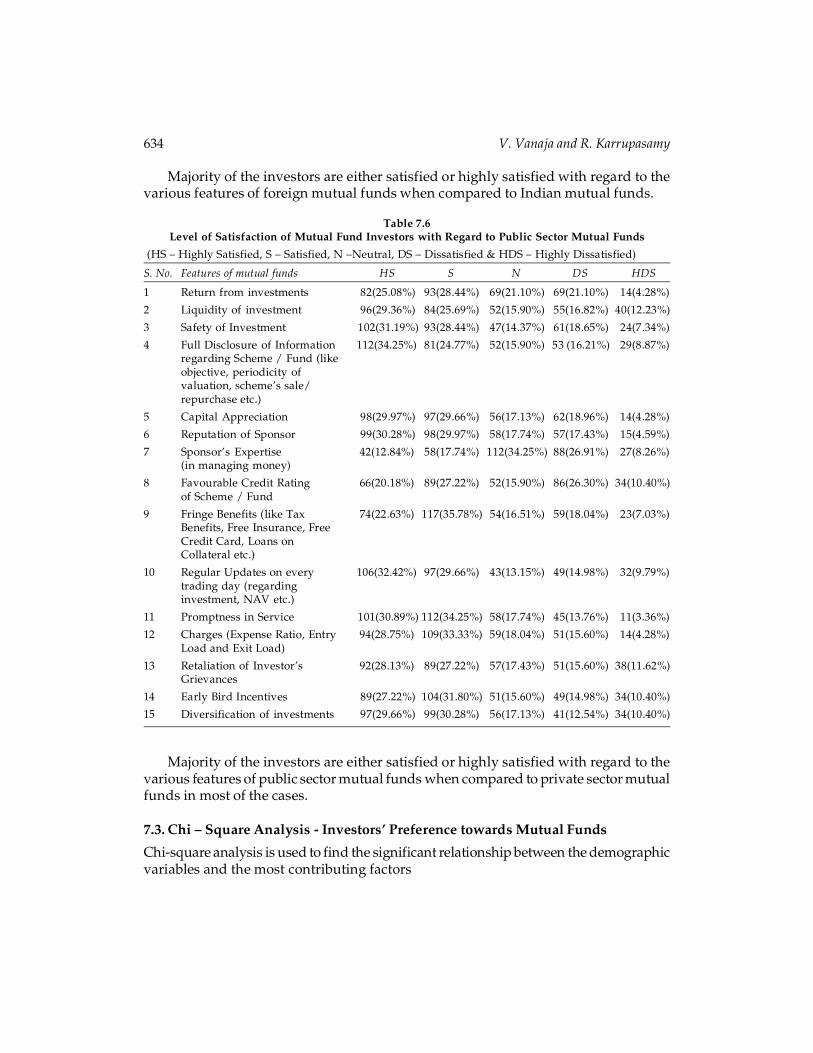
Majority of the investors are either satisfied or highly satisfied with regard to thevarious features of foreign mutual funds when compared to Indian mutual funds.
Table 7.6Level of Satisfaction of Mutual Fund Investors with Regard to Public Sector Mutual Funds
(HS – Highly Satisfied, S – Satisfied, N –Neutral, DS – Dissatisfied & HDS – Highly Dissatisfied)
S. No. Features of mutual funds HS S N DS HDS
1 Return from investments 82(25.08%) 93(28.44%) 69(21.10%) 69(21.10%) 14(4.28%)
2 Liquidity of investment 96(29.36%) 84(25.69%) 52(15.90%) 55(16.82%) 40(12.23%)
3 Safety of Investment 102(31.19%) 93(28.44%) 47(14.37%) 61(18.65%) 24(7.34%)
4 Full Disclosure of Information 112(34.25%) 81(24.77%) 52(15.90%) 53 (16.21%) 29(8.87%)regarding Scheme / Fund (likeobjective, periodicity ofvaluation, scheme’s sale/repurchase etc.)
5 Capital Appreciation 98(29.97%) 97(29.66%) 56(17.13%) 62(18.96%) 14(4.28%)
6 Reputation of Sponsor 99(30.28%) 98(29.97%) 58(17.74%) 57(17.43%) 15(4.59%)
7 Sponsor’s Expertise 42(12.84%) 58(17.74%) 112(34.25%) 88(26.91%) 27(8.26%)(in managing money)
8 Favourable Credit Rating 66(20.18%) 89(27.22%) 52(15.90%) 86(26.30%) 34(10.40%)of Scheme / Fund
9 Fringe Benefits (like Tax 74(22.63%) 117(35.78%) 54(16.51%) 59(18.04%) 23(7.03%)Benefits, Free Insurance, FreeCredit Card, Loans onCollateral etc.)
10 Regular Updates on every 106(32.42%) 97(29.66%) 43(13.15%) 49(14.98%) 32(9.79%)trading day (regardinginvestment, NAV etc.)
11 Promptness in Service 101(30.89%) 112(34.25%) 58(17.74%) 45(13.76%) 11(3.36%)
12 Charges (Expense Ratio, Entry 94(28.75%) 109(33.33%) 59(18.04%) 51(15.60%) 14(4.28%)Load and Exit Load)
13 Retaliation of Investor’s 92(28.13%) 89(27.22%) 57(17.43%) 51(15.60%) 38(11.62%)Grievances
14 Early Bird Incentives 89(27.22%) 104(31.80%) 51(15.60%) 49(14.98%) 34(10.40%)
15 Diversification of investments 97(29.66%) 99(30.28%) 56(17.13%) 41(12.54%) 34(10.40%)
Majority of the investors are either satisfied or highly satisfied with regard to thevarious features of public sector mutual funds when compared to private sector mutualfunds in most of the cases.
7.3. Chi – Square Analysis - Investors’ Preference towards Mutual Funds
Chi-square analysis is used to find the significant relationship between the demographicvariables and the most contributing factors

Perception of Indian Investors towards Indian and Foreign Mutual Funds 635
Table 7.7Gender of the Investors and their Preference towards Mutual Funds
Gender Public Sector Private Sector Total Foreign Indian TotalMutual funds Mutual funds Mutual Funds Mutual funds
Male 157 (57.93%) 114(42.07%) 271 198(73.06%) 73(26.94%) 271
Female 39(69.64%) 17(30.36%) 56 41(73.21%) 1526.79%) 56
Total 196 131 327 239 88 327
Majority of the investors both in male as well as female category prefer publicsector mutual funds and also foreign mutual funds.
Table 7.8Age of the Investors and their Preference towards Mutual Funds
Age (in Public Sector Private Sector Total Foreign Indian Totalyears) Mutual funds Mutual funds Mutual Funds Mutual funds
Less than 36(63.16%) 21(36.84%) 57 29(50.88) 28(49.12%) 5735 years
35 – 45 129(75.44%) 42(24.56%) 171 132(77.19%) 39(22.81%) 171
46 – 55 49(58.33%) 35(41.67%) 84 62(73.81%) 22(26.19%) 84
Above 55 11(73.33%) 4(26.67%) 15 10(66.67%) 5(33.33%) 18
Total 225 102 327 233 94 327
Majority of the investors irrespective of the age group prefer public sector mutualfunds and also foreign mutual funds.
Table 7.9Marital Status of the Investors and their Preference towards Mutual Funds
Marital Public Sector Private Sector Total Foreign Indian Totalstatus Mutual funds Mutual funds Mutual Funds Mutual funds
Married 211(80.23%) 52(19.77%) 263 198(75.29%) 65(24.71%) 263
Unmarried 30(46.88%) 34(53.12%) 64 37(57.81%) 27(42.19%) 64
Total 241 86 327 235 92 327
Majority of the investors both in married and unmarried prefer public sector mutualfunds and also foreign mutual funds.

636 V. Vanaja and R. Karrupasamy
Table 7.10Educational Qualification of the Investors and their Preference Towards Mutual Funds
Educational Public Sector Private Sector Total Foreign Indian Totalqualification Mutual funds Mutual funds Mutual Funds Mutual funds
Up to class XII 17(70.83%) 7(29.17%) 24 14(58.33%) 10(41.67%) 24Diploma 28(60.87%) 18(39.13%) 46 22(47.83%) 24(52.17%) 46Graduate 121(72.02%) 47(27.98) 168 79(47.02%) 89(52.98%) 168Post graduate 35(51.47%) 33(48.53%) 68 41(60.29%) 27(39.71%) 68Others 14(66.67%) 7(33.33%) 21 18(85.71%) 3(14.29%) 21Total 215 112 327 174 153 327
Majority of the investors from all most all the category of educational qualificationprefer public sector mutual funds and also foreign mutual funds.
Table 7.11Occupation of the Investors and their Preference Towards Mutual Funds
Occupation Public Sector Private Sector Total Foreign Indian TotalMutual funds Mutual funds Mutual Funds Mutual funds
Business 21(61.76%) 13(38.24%) 34 18(52.94%) 16(47.06%) 34Professional 24(61.54%) 15(38.46%) 39 22(56.41%) 17(43.59%) 39Private Sector 52(62.65%) 31(37.35%) 83 49(59.04%) 34(40.96%) 83EmployeeGovernment 98(80.33%) 24(19.67%) 122 76(62.30%) 46(37.70%) 122EmployeeRetired 11(50.00%) 11(50.00%) 22 14(63.64%) 8(36.36%) 22Others 14(51.85%) 13(48.15%) 27 14(51.85%) 13(48.15%) 27Total 220 107 327 193 134 327
Majority of the investors from all most all the category of occupation prefer publicsector mutual funds and also foreign mutual funds.
7.4. Relationship Between Investors’ Demographic Profile and their PrefernceTowards Mutual Funds
Ho : There is no significant relationship between the demographic profile of therespondents such as gender, age, marital status, educational qualification andoccupation and their preference towards public sector mutual funds.
Table 7.12Relationship between Demographic Profile of the Respondents and Preference towards
Public Sector Mutual Funds
Demographic variables Degrees of Calculated Table value Resultfreedom value
Gender 1 4.441 3.84 RejectedAge 3 7.987 7.82 RejectedMarital Status 1 8.931 3.84 RejectedEducational Qualification 4 14.365 9.49 RejectedOccupation 5 17.851 11.07 Rejected
Perception of Indian Investors towards Indian and Foreign Mutual Funds 637
There is significant relationship between demographic profile of the investors andtheir preference towards the type of mutual funds.
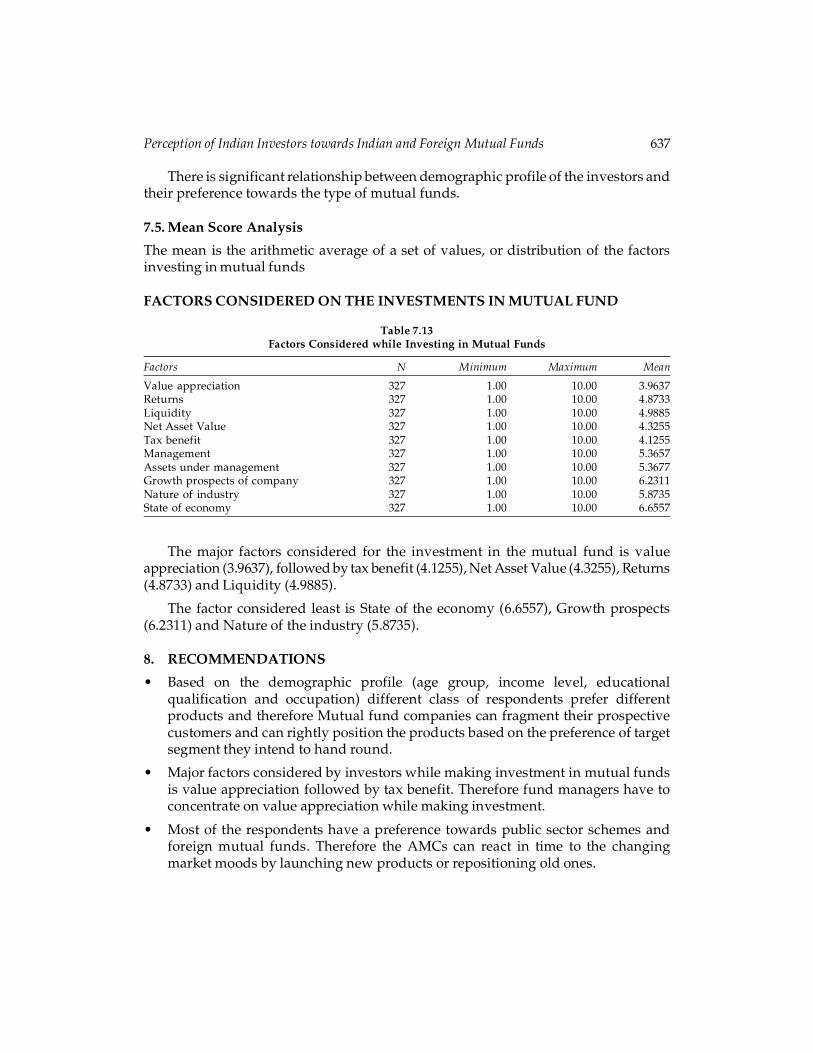
7.5. Mean Score Analysis
The mean is the arithmetic average of a set of values, or distribution of the factorsinvesting in mutual funds
FACTORS CONSIDERED ON THE INVESTMENTS IN MUTUAL FUND
Table 7.13Factors Considered while Investing in Mutual Funds
Factors N Minimum Maximum Mean
Value appreciation 327 1.00 10.00 3.9637Returns 327 1.00 10.00 4.8733Liquidity 327 1.00 10.00 4.9885Net Asset Value 327 1.00 10.00 4.3255Tax benefit 327 1.00 10.00 4.1255Management 327 1.00 10.00 5.3657Assets under management 327 1.00 10.00 5.3677Growth prospects of company 327 1.00 10.00 6.2311Nature of industry 327 1.00 10.00 5.8735State of economy 327 1.00 10.00 6.6557
The major factors considered for the investment in the mutual fund is valueappreciation (3.9637), followed by tax benefit (4.1255), Net Asset Value (4.3255), Returns(4.8733) and Liquidity (4.9885).
The factor considered least is State of the economy (6.6557), Growth prospects(6.2311) and Nature of the industry (5.8735).
8. RECOMMENDATIONS
• Based on the demographic profile (age group, income level, educationalqualification and occupation) different class of respondents prefer differentproducts and therefore Mutual fund companies can fragment their prospectivecustomers and can rightly position the products based on the preference of targetsegment they intend to hand round.
• Major factors considered by investors while making investment in mutual fundsis value appreciation followed by tax benefit. Therefore fund managers have toconcentrate on value appreciation while making investment.
• Most of the respondents have a preference towards public sector schemes andforeign mutual funds. Therefore the AMCs can react in time to the changingmarket moods by launching new products or repositioning old ones.

638 V. Vanaja and R. Karrupasamy
References
Aman Srivastava (2007), An Analysis of Behaviour of Investors in India, ICFAI Journal ofBehavioural Finance, June, Vol. 4, No. 2, 43-52.
Bhagaban Das (2008), Mutual Fund Vs. Life Insurance Behavioural Analysis of RetailInvestors, International Journal of Business and Management, Vol. 3, No. 10, 89-95.
Bollen, N.P.B (2006), Mutual Fund Attributes and Investor Behaviour, Journal of Financial andQuantitative Analysis, 1-40.
Gilker, N.A (2002), Investors’ Perceptions of Mutual Funds: An Investigation, The BusinessReview, Vol.9, No.1, September, 26-35.
Hayat M.Awan Shanza Arshad (2012), Factors valued by investors while investing in MutualFunds-A Behavioral Context, Interdisciplinary Journal of Contemporary Research in Business,May 2012 Vol 4, No 1, 503 – 514.
Kandavel. D (2011), Factors influencing the retail investors to prefer investment in mutualfunds in Puducherry: An Empirical study, December 2011-Vol 1 Issue 7, 46-75.
King, J.S. (2002), Mutual Funds: Investment of Choice for Individual Investors?, Review ofBusiness, Vol. 23, No. 3, 35-39.
Lenard, M. J, Akhter, S.H and Alamc, P. (2003), Mapping Mutual Fund InvestorCharacteristics and Modelling Switching Behaviour”, Financial Services Review, Vol. 12,No. 1, 39-59.
Nandagopal (2011), A study on investors perception towards investment in mutual funds,SSRN volume no. 1 (2011), issue no. 4, 43-48.
Nishi Sharma (2012), “Indian Investor’s Perception towards Mutual Funds”, BusinessManagement Dynamics, Vol.2, No. 2, Aug 2012, 01-09.
Pei-Gi Shu, Yin-Hua Yeh, Takeshi Yamada (2002), The Behaviour of Taiwan Mutual FundInvestors: Performance and Fund Flows, Pacific-Basin Finance Journal, Vol.10, No. 5,November, 583-600.
Rajarajan, V., (2000), Predictors of Expected Rate of Return by Individual, Investors, The IndianJournal of Commerce, Vol.53 (4), 65-70.
Rajarajan (2003), Determinants of Portfolio choice of Individual Investors, The Indian EconomicJournal, Vol. 50(1), 81-84.
Ram Singh Meena (2011), Mutual funds: An empirical analysis of Perceptions of investors inwestern Rajasthan, Volume 19, No. 2, July - December 2011, 68–83.
Saini, S., Anjum, B., and Saini, R. (2011), Investors’ Awareness And Perception About MutualFunds, International Journal of Multidisciplinary Research, Vol. 1 No. 1, pp. 14-29.
Singh, B.K., (2012), A study on investors’ attitude towards mutual funds as an investmentoption, International Journal of Research in Management, Vol. 2, No. 2, pp. 61-70.
Singh Jaspal and Chander Subhash (2004), An Empirical Analysis of Perceptions of Investorstowards Mutual Funds, Finance India, December, Vol. 18, No.4, 1673-1692.
Singh, Y.P., and Vanita (2002), Mutual Fund Investors’ Perceptions and Preferences-A Survey,The Indian Journal of Commerce, Vol. 55, No. 3, 8-20.

Perception of Indian Investors towards Indian and Foreign Mutual Funds 639
Sudalaimuthu and P. Senthil Kumar (2008), A study on Investors perception towards MutualFund Investments, Journal of Management Trends, Vol. 5, No. 1, September 2007 – March2008, pp. 106-117.
Walia, N., and Kiran, R. (2009), An Analysis of Investor’s Risk Perception towards MutualFunds Services, International Journal of business Management, Vol. 4, No. 5, 106-120.
Yesh Pal Davar and Suveera Gill (2007), Investment Decision Making: An empirical study ofperceptual view of Investors, Indian Institute of Management, Lucknow Journal, Vol. 6,No. 2, 2007, 115-135.
Zeithaml, V.A., Parasuraman, A. and Berry, L.L. (2001), Delivering quality service: BalancingCustomer perceptions and expectations, Free Press, New York, NY.
Zheng, Lu (1999), Is Money Smart? A Study of Mutual Fund Investors’ Fund Selection Ability,Journal of Finance, June, Vol. 54, No.3, 901- 933.
Books
Keith C. Brown, Frank K. Reilly, (2012), Analysis of Investments and Management ofPortfolios, 10th Edition, India: South Western.
Alice C. (San Francisco State University) Lee, Cheng F. Lee, (2008), Advances in InvestmentAnalysis and Portfolio Management, New Series 2008, Taiwan: Airiti Press.
Robert A. Weigand, (2014), Applied Equity Analysis and Portfolio Management, ImportedEdition, India: John Wiley & Sons.
Websites
www.amfiindia.comwww.cic.comwww.indiainfoline.comwww.mutualfundindia.comwww.rbi.comwww.sebi.comwww.moneycontrol.comwww.icraindia.com


