INVESTORS PERCEPTION ON DIFFERENT INVESTMENT AVENUES...
17
Page | 1 Navajyoti, International Journal of Multi-Disciplinary Research Volume 4, Issue 1, August 2019 INVESTORS PERCEPTION ON DIFFERENT INVESTMENT AVENUES BY WORKING PROFESSIONALS IN BANGALORE Akshaya Babu, Anbu Selvi, Benadicta Felci Louis, 2 nd Year M.Com (FA), JNC PG Centre Abstract: This study is an evaluation to understand "The Investment Perception towards Different Investment Avenues by Working Professionals in Bangalore. The sample selected is 60 working professionals from the city of Bangalore to measure the investment perception. Here in this research study, we have identified, the preferred investment avenues among individual investors using questionnaire and analysed that majority of the respondents are moderate risk takers and most of them prefer to invest in traditional investment rather than investing in financial investments. Keywords: Investment, Risk, Perception and Avenues 1. INTRODUCTION Investment is the employment of funds with the aim of achieving additional income or growth in value. The essential quality of investment is that, it involves ‘waiting’ for a reward. It involves the commitment of resources which have been saved or put away from current consumption in the hope that some benefits will accrue in future. Investment is the allocation of monetary resources to assets that are expected to yield some gain or positive return over a given period of time. These assets range from safety investment to risky investments.
Transcript of INVESTORS PERCEPTION ON DIFFERENT INVESTMENT AVENUES...
P a g e | 1
Navajyoti, International Journal of Multi-Disciplinary Research
Volume 4, Issue 1, August 2019
INVESTORS PERCEPTION ON DIFFERENT INVESTMENT
AVENUES BY WORKING PROFESSIONALS IN BANGALORE
Akshaya Babu, Anbu Selvi, Benadicta Felci Louis,
2nd Year M.Com (FA), JNC PG Centre
Abstract: This study is an evaluation to understand "The Investment Perception towards
Different Investment Avenues by Working Professionals in Bangalore. The sample selected is
60 working professionals from the city of Bangalore to measure the investment perception.
Here in this research study, we have identified, the preferred investment avenues among
individual investors using questionnaire and analysed that majority of the respondents are
moderate risk takers and most of them prefer to invest in traditional investment rather than
investing in financial investments.
Keywords: Investment, Risk, Perception and Avenues
1. INTRODUCTION
Investment is the employment of funds with the aim of achieving additional income or growth
in value. The essential quality of investment is that, it involves ‘waiting’ for a reward. It
involves the commitment of resources which have been saved or put away from current
consumption in the hope that some benefits will accrue in future. Investment is the allocation
of monetary resources to assets that are expected to yield some gain or positive return over a
given period of time. These assets range from safety investment to risky investments.

P a g e | 2
Investments in this form are also called financial investments. Most investments are considered
as transfer of financial assets from one person to another. To the economists, investment means
the net additions to the economy’s capital stock which consists of goods and services that are
used in the production of other goods and services.
Investments are important and useful in the context of present-day conditions. Some factors
that have made investment decision increasingly important are longer life expectancy or
planning for retirement, increasing rates of taxes, high interest rates of inflation, larger incomes
and availability of a complex number of investment outlets. Investors have different investment
avenues based on his/her risk tolerance level. They are real and financial assets. Real assets
refer to tangible assets ie., land and buildings, furniture, gold, silver, diamonds or artefacts. A
financial asset is a claim represented by securities. These assets are popularly called paper
securities - Shares, bonds, debentures, bills, loans, derivatives and fixed deposits.
Investors are classified into different groups depending on their attitude towards risk. Each
investor also has an indifference point at which his own expectations of return match with the
risk that he can take. Broadly, he should be able whether he is a risk averter, risk neutral or risk
deposits (G. C. Venkataiah, 2018).
2. REVIEW OF LITERATURE
As per Shukla investor’s preference towards investment avenues depends on salary earned by
different individuals. The researcher concluded that majority of the respondents’ investment
P a g e | 3
decisions depend on their educational background and the reason behind their investments is
for purchasing home and long-term investment.
Vanish Kumar Singh (2015) - study provides suggestions to the investors to make investment.
There are many investment avenues such as shares, debentures, fixed deposits, gold, silver,
commercial papers and certificate of deposits. Depending upon each investor’s attitude, they
are categorised into different groups. As per this study, people like to invest in stock market
even if they face losses because they need higher returns in short span.
Rastogi – analysed the behaviour features in the investment choice. Behavioural finance
provides solution to many problems until now answered suitably by the usual finance theory.
The study concluded that behavioural biases not affected by the combined categories of gender
and occupation.
Kumar (2015) - brings out that income played a significant role in terms of trading decisions
in the stock market with respect to mode of selection for trading and market segment selection.
The investor analyses the prevailing prices of investments and takes the decision about the
investment he/she should invest.
Prof. Sanket Charkha and Dr. Jagdeesh Lanjekar Sanket (2018) - analysed savings and
investment patterns of salaried people with special reference to Pune city, India. After analysis
and interpretation, the researcher concluded that investors consider safety and good return on
investments on a regular basis.

P a g e | 4
Awasi ET - explored the factors which influence the decision-making process of investors.
According to the research, the decision of the investors depends upon the degree of the risk
factors. Finally, they found that increased level of knowledge about financial information could
improve investor’s decisions which leads to earn higher returns by managing the risk
efficiently.
Sunil Gupta (2008) - talks about the preferences and analyses the importance of demography
that leads to the investor’s decision towards making investment. Demographic factors include
gender, age, education, occupation, saving and family size. This study found that all the age
groups gives more importance to invest in equity and except people who are above 50years of
age who gives importance to insurance, fixed deposits and tax saving benefits.
Amudha - analysed the performance of investment behaviour concerned with choice of
investment in small amounts in securities, deposits, mutual fund, insurance, and chit funds. The
results described that investment offers to a person to gain future income in the form of interest,
dividend, premium, pension, and profit or appreciated value of their standard capital.
According to Jitha Thomas - investors are aware about investment avenues that are available
in India, but still investors preferred to invest in bank deposit, insurance, tax saving schemes
etc, as safety is important factor while doing investment. He concluded that most of the
investors prefer secured regular income on investment.
Avinash Kumar Singh (2006) - analysed the investment pattern of people in Bangalore city
and Bhubaneswar, which concluded that investors are more aware about various investment
avenues and the risks associated with it.
P a g e | 5
Dr. S. Mathivannan and Dr. M. Selvakumar (2011) - revealed that majority of the
respondents are regular investors and the main avenues of investments for the teachers were
bank deposits, insurance and government securities. The factors influencing their decision in
investment are safety and tax concession. The investors are risk averse and prefer small but
regular returns on their investment.
Sudalaimuthu and Senthil Kumar (2008) - researchers revealed that investors consider
mutual funds as flexible investment options as mutual fund companies efficiently manage
assets while investing directly in stock market is very risky.
3. RESEARCH METHODOLOGY
3.1. Research Design:
This study is based on the sample survey method. This study mainly assesses the level of
awareness of various investment avenues and also to know the perceived investors’ opinion
and to measure investors’ attitude (college lecturers). The research provides the knowledge and
information to solve the problems and to meet the decision-making challenges.
3.2. Statement of Problem:
In our country, individuals tend to invest more in traditional investments rather than in financial
investments which has resulted in lower allocation of capital to the required sectors of our
economy. In addition to this, the return on traditional investments is also very less.
P a g e | 6
The research attempts to know the preference of investors, percentage of savings, risk appetite
and significant demographic factors that affects investment decisions. The study will help us
to know the awareness and exposure of college lecturers on various investment avenues
available.
3.3.Objectives of the Study:
To find out the various investment avenues available.
To determine the factors considered by the investors while investing.
To know the level of awareness about the financial instruments.
To find out the risk appetite of different type of investors.
3.4. Scope of the Study:
The topic is selected to analyse investors’ perception towards different investment avenues in
which the study focuses on the college lecturers of Bangalore. The study covers the information
which will help to know the investors perception towards various investment avenues and
understand the decision-making power of investors over the various available investment
avenues. The study will help to gather feedback and suggestions from investors.
3.5. Type of Research:
3.5.1. Source of Data Collection:
P a g e | 7
• Primary Data: Survey method will be used for gathering primary data.
The information will be collected using questionnaire.
• Secondary Data:Data is collected from magazines, journals ,
newspapers etc.,
3.5.2. Sample Plan:
Sample unit: The sample units selected for the study are college lecturers.
Sample size: The sample size is 60.
Sampling technique: Convenience sampling technique is used for collecting data from
investors.
3.5.3. Tools for Data Collection: The tool for data collection is questionnaire.
4. DATA ANALYSIS and INTERPRETATION
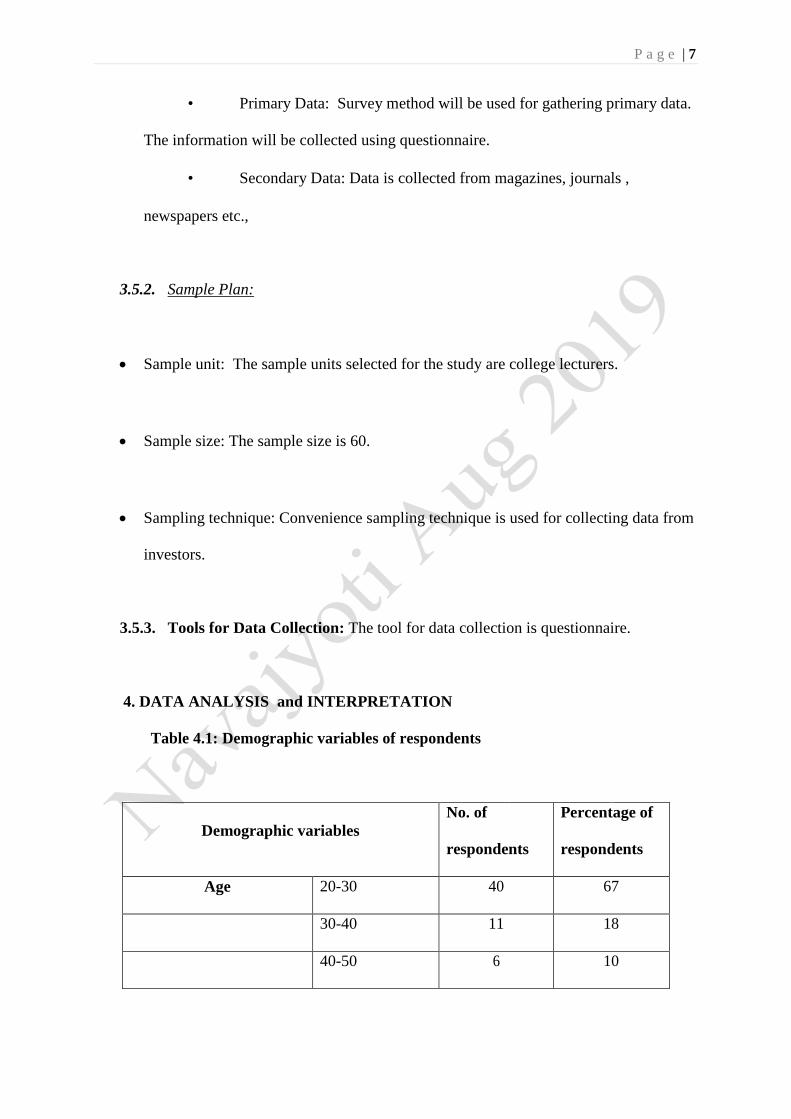
Table 4.1: Demographic variables of respondents
Demographic variables
No. of
respondents
Percentage of
respondents
Age 20-30 40 67
30-40 11 18
40-50 6 10
P a g e | 8
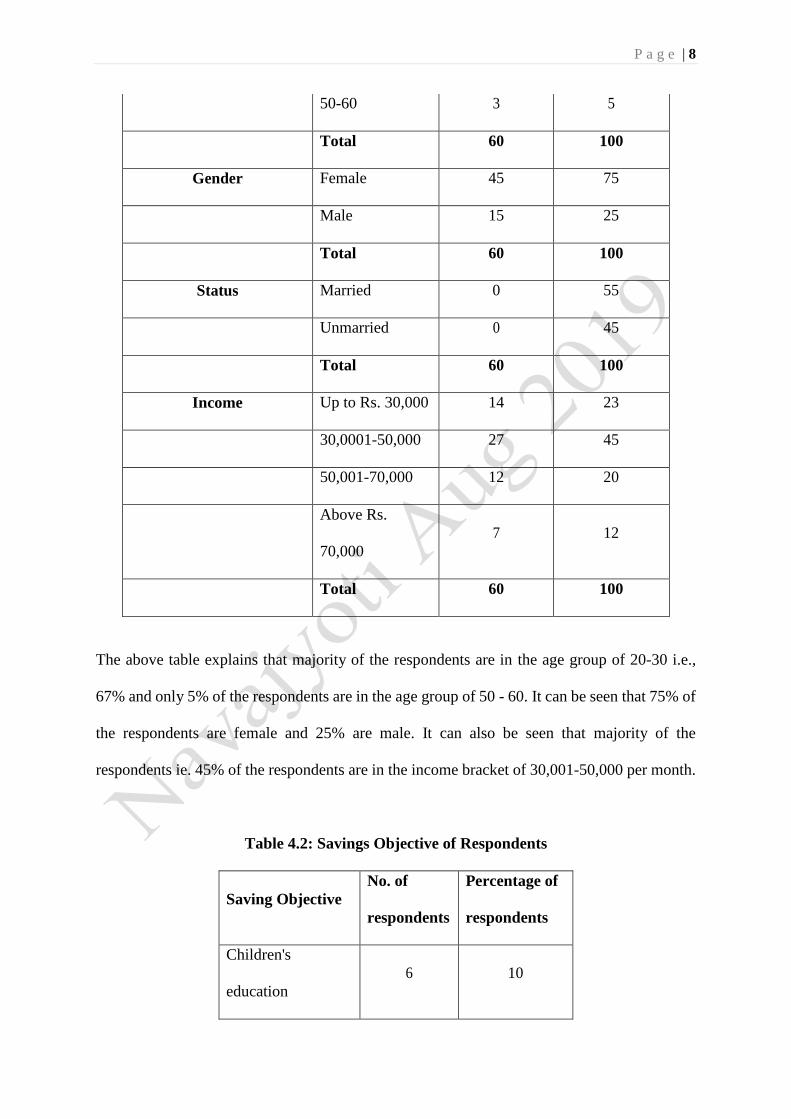
50-60 3 5
Total 60 100
Gender Female 45 75
Male 15 25
Total 60 100
Status Married 0 55
Unmarried 0 45
Total 60 100
Income Up to Rs. 30,000 14 23
30,0001-50,000 27 45
50,001-70,000 12 20
Above Rs.
70,000
7 12
Total 60 100
The above table explains that majority of the respondents are in the age group of 20-30 i.e.,
67% and only 5% of the respondents are in the age group of 50 - 60. It can be seen that 75% of
the respondents are female and 25% are male. It can also be seen that majority of the
respondents ie. 45% of the respondents are in the income bracket of 30,001-50,000 per month.
Table 4.2: Savings Objective of Respondents
Saving Objective
No. of
respondents
Percentage of
respondents
Children's
education
6 10
P a g e | 9
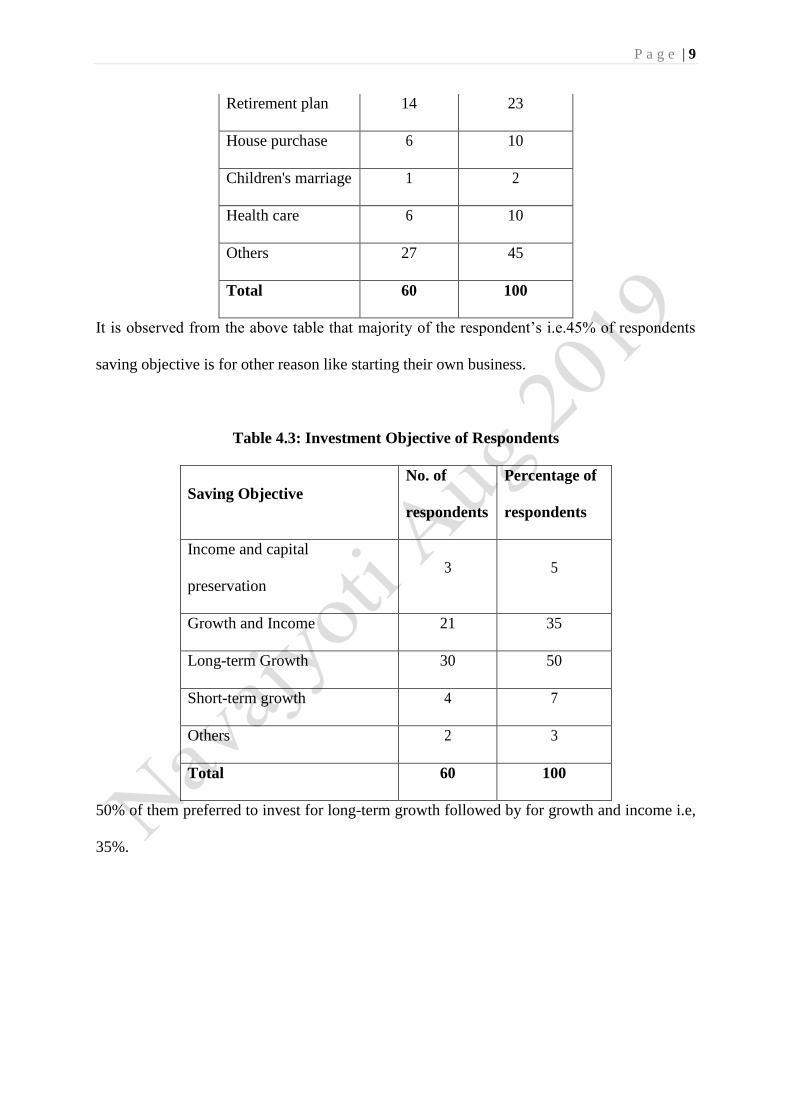
Retirement plan 14 23
House purchase 6 10
Children's marriage 1 2
Health care 6 10
Others 27 45
Total 60 100
It is observed from the above table that majority of the respondent’s i.e.45% of respondents
saving objective is for other reason like starting their own business.
Table 4.3: Investment Objective of Respondents
Saving Objective
No. of
respondents
Percentage of
respondents
Income and capital
preservation
3 5
Growth and Income 21 35
Long-term Growth 30 50
Short-term growth 4 7
Others 2 3
Total 60 100
50% of them preferred to invest for long-term growth followed by for growth and income i.e,
35%.
P a g e | 10
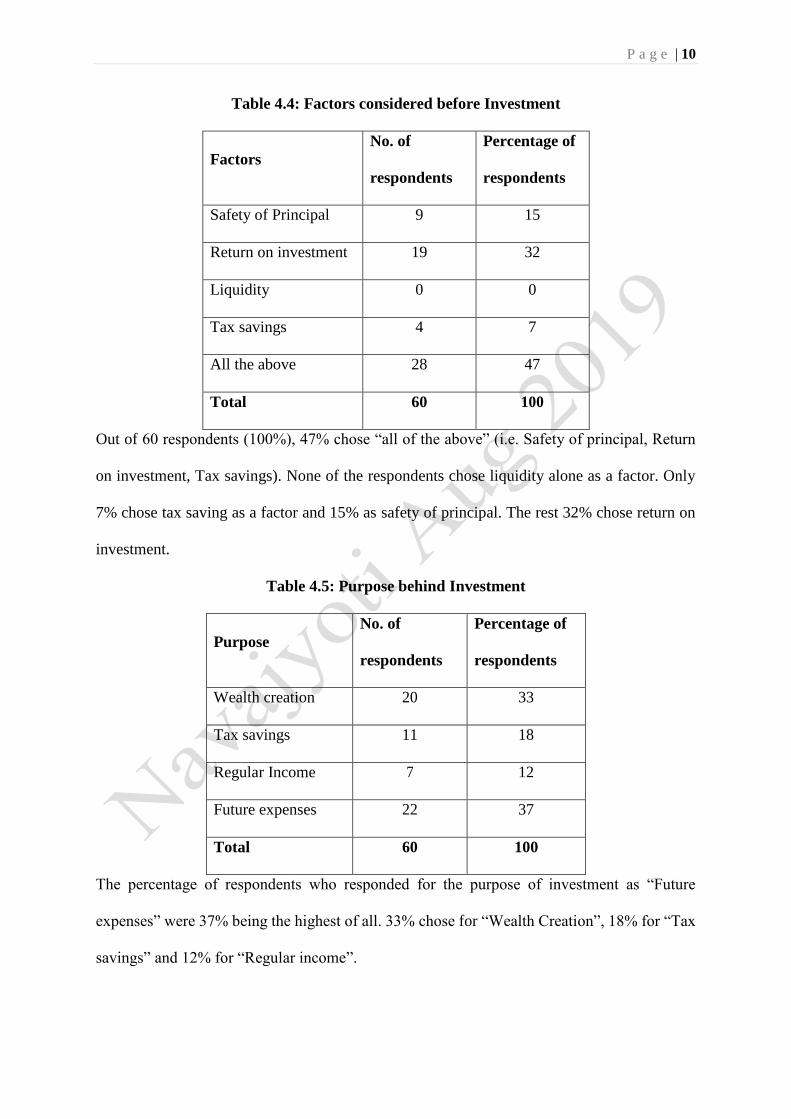
Table 4.4: Factors considered before Investment
Factors
No. of
respondents
Percentage of
respondents
Safety of Principal 9 15
Return on investment 19 32
Liquidity 0 0
Tax savings 4 7
All the above 28 47
Total 60 100
Out of 60 respondents (100%), 47% chose “all of the above” (i.e. Safety of principal, Return
on investment, Tax savings). None of the respondents chose liquidity alone as a factor. Only
7% chose tax saving as a factor and 15% as safety of principal. The rest 32% chose return on
investment.
Table 4.5: Purpose behind Investment
Purpose
No. of
respondents
Percentage of
respondents
Wealth creation 20 33
Tax savings 11 18
Regular Income 7 12
Future expenses 22 37
Total 60 100
The percentage of respondents who responded for the purpose of investment as “Future
expenses” were 37% being the highest of all. 33% chose for “Wealth Creation”, 18% for “Tax
savings” and 12% for “Regular income”.
P a g e | 11
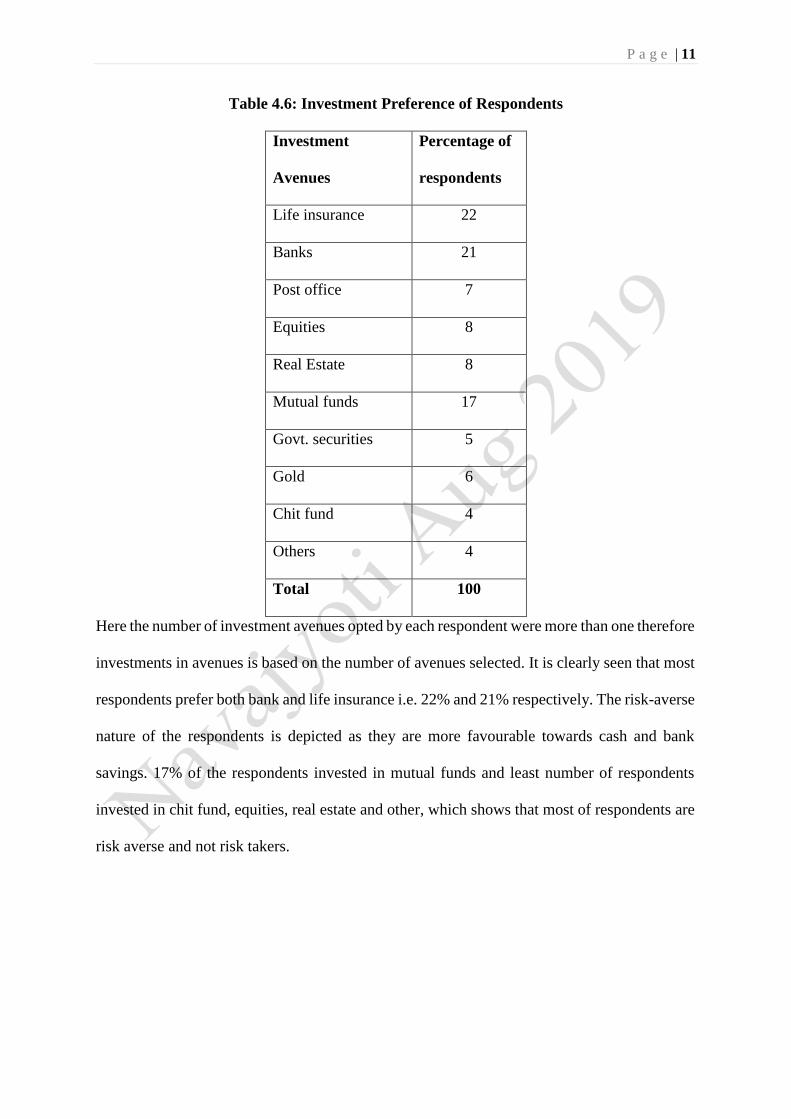
Table 4.6: Investment Preference of Respondents
Investment
Avenues
Percentage of
respondents
Life insurance 22
Banks 21
Post office 7
Equities 8
Real Estate 8
Mutual funds 17
Govt. securities 5
Gold 6
Chit fund 4
Others 4
Total 100
Here the number of investment avenues opted by each respondent were more than one therefore
investments in avenues is based on the number of avenues selected. It is clearly seen that most
respondents prefer both bank and life insurance i.e. 22% and 21% respectively. The risk-averse
nature of the respondents is depicted as they are more favourable towards cash and bank
savings. 17% of the respondents invested in mutual funds and least number of respondents
invested in chit fund, equities, real estate and other, which shows that most of respondents are
risk averse and not risk takers.
P a g e | 12
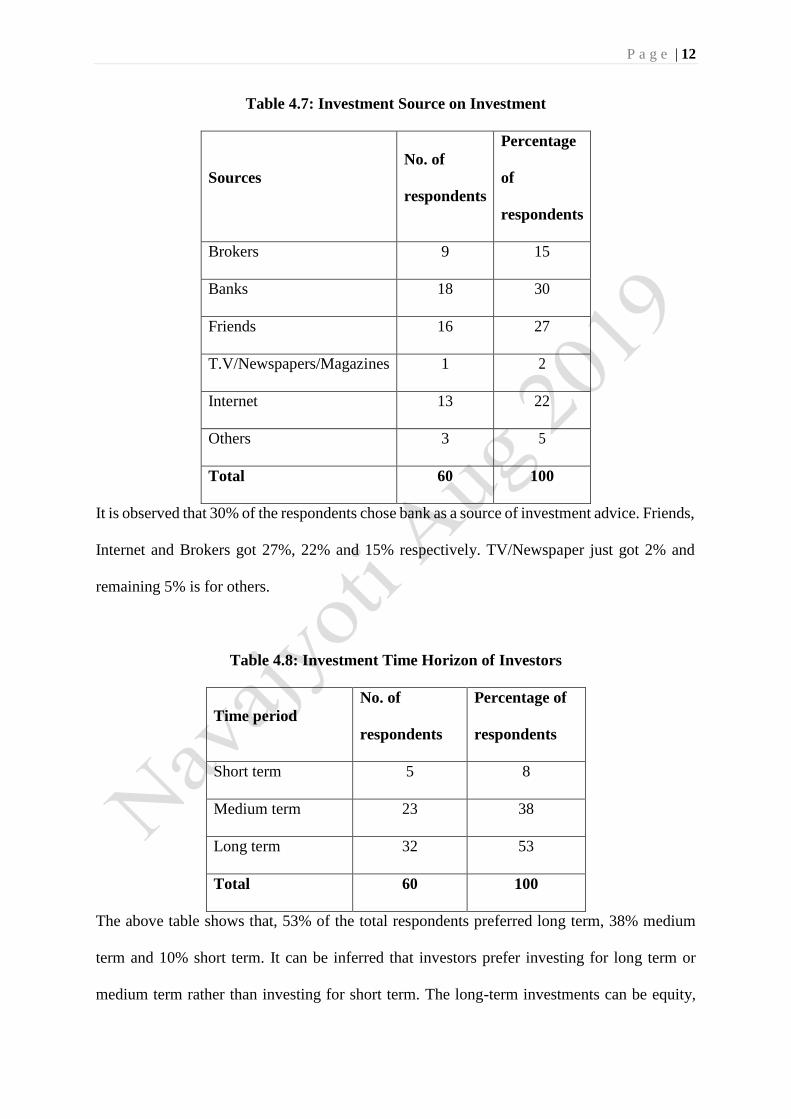
Table 4.7: Investment Source on Investment
Sources
No. of
respondents
Percentage
of
respondents
Brokers 9 15
Banks 18 30
Friends 16 27
T.V/Newspapers/Magazines 1 2
Internet 13 22
Others 3 5
Total 60 100
It is observed that 30% of the respondents chose bank as a source of investment advice. Friends,
Internet and Brokers got 27%, 22% and 15% respectively. TV/Newspaper just got 2% and
remaining 5% is for others.
Table 4.8: Investment Time Horizon of Investors
Time period
No. of
respondents
Percentage of
respondents
Short term 5 8
Medium term 23 38
Long term 32 53
Total 60 100
The above table shows that, 53% of the total respondents preferred long term, 38% medium
term and 10% short term. It can be inferred that investors prefer investing for long term or
medium term rather than investing for short term. The long-term investments can be equity,
P a g e | 13
mutual funds, PF/PPF, life insurance, real estate, and gold etc. Short-term or Medium-term
investments can be fixed deposits, equities, mutual funds, chit funds etc.
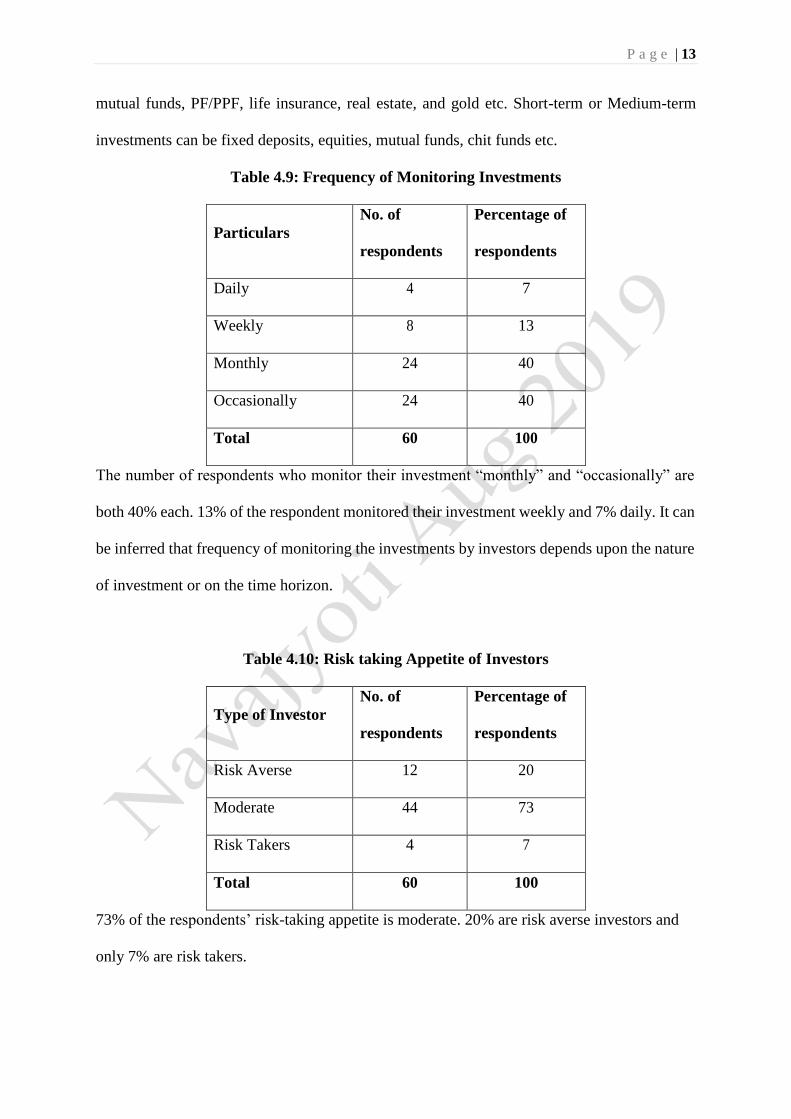
Table 4.9: Frequency of Monitoring Investments
Particulars
No. of
respondents
Percentage of
respondents
Daily 4 7
Weekly 8 13
Monthly 24 40
Occasionally 24 40
Total 60 100
The number of respondents who monitor their investment “monthly” and “occasionally” are
both 40% each. 13% of the respondent monitored their investment weekly and 7% daily. It can
be inferred that frequency of monitoring the investments by investors depends upon the nature
of investment or on the time horizon.
Table 4.10: Risk taking Appetite of Investors
Type of Investor
No. of
respondents
Percentage of
respondents
Risk Averse 12 20
Moderate 44 73
Risk Takers 4 7
Total 60 100
73% of the respondents’ risk-taking appetite is moderate. 20% are risk averse investors and
only 7% are risk takers.
P a g e | 14
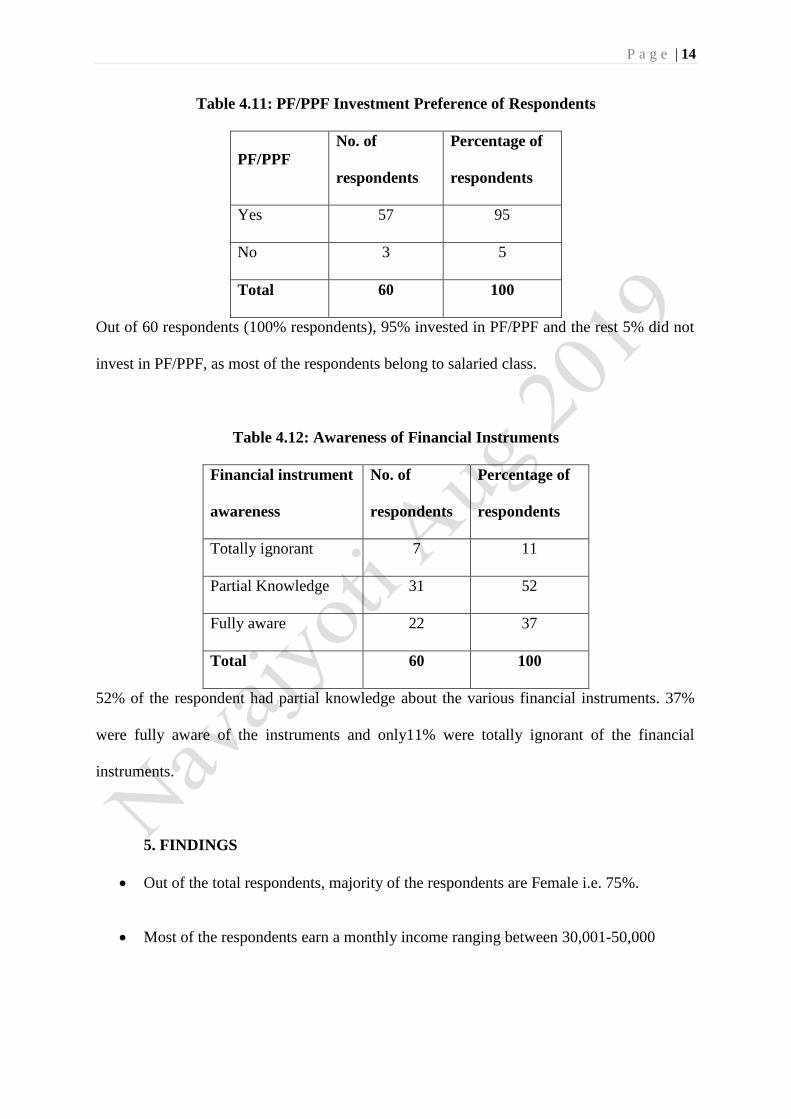
Table 4.11: PF/PPF Investment Preference of Respondents
PF/PPF
No. of
respondents
Percentage of
respondents
Yes 57 95
No 3 5
Total 60 100
Out of 60 respondents (100% respondents), 95% invested in PF/PPF and the rest 5% did not
invest in PF/PPF, as most of the respondents belong to salaried class.
Table 4.12: Awareness of Financial Instruments
Financial instrument
awareness
No. of
respondents
Percentage of
respondents
Totally ignorant 7 11
Partial Knowledge 31 52
Fully aware 22 37
Total 60 100
52% of the respondent had partial knowledge about the various financial instruments. 37%
were fully aware of the instruments and only11% were totally ignorant of the financial
instruments.
5. FINDINGS
Out of the total respondents, majority of the respondents are Female i.e. 75%.
Most of the respondents earn a monthly income ranging between 30,001-50,000

P a g e | 15
Majority of the respondents (i.e. 45%) savings objective is other than Children’s
education, Retirement plan, House purchase, children’s marriage and Healthcare.
50% of the respondents investing objective is long-term growth.
47% of the respondents consider all the factors before investing i.e. safety of principal,
return on investment, liquidity and tax savings.
Most of the respondents’ purpose behind investment is to meet their future expenses
and wealth creation i.e. 37% and 33% respectively.
Around 43% of the respondents have opted for life insurance and Banks as their
investment avenues.
Out of the total respondents, 30% of the respondents get the source of investment
advice from brokers
53% of the respondents prefer to invest their savings for long period of time.
Around 80% of the respondents monitor their investment monthly and occasionally.
Around 73% of the respondents manage their investment alone and with family.
From the study it is inferred that 73% of the respondents are moderate risk takers.
95% of the respondents invest in PF/PPF, as it is mandatory for most of the salaried
class people.
Out of total respondents, 53% of them are partially aware about the financial
instruments and 37% of them are fully aware about the financial instruments available
for investments.
P a g e | 16
6. SUGGESTION
Around 20% of the respondents are only invested in Equities, Government securities,
Real estate etc., it is suggested to investors to diversify their investment in both
traditional and modern financial instrument as they can earn more return and it will also
be helpful for the growth of our economy.
Many respondents manage their investment alone and with family. This will not help
them to manage risk or gather information about the investments, which will help to
increase return. It is suggested to the respondents to take suggestions from other sources
like financial advisors and chartered accountants to control and manage future
uncertainty.
Majority of respondents monitor their investments occasionally and on monthly basis
even though investing in financial instruments like mutual funds. It is suggested to the
respondents to start monitoring the investments especially financial investments, at
least on a weekly basis to control risk.
Even though majority of the respondents have partial and full knowledge about
financial instruments, only a least percentage of the respondents are invested in such
instruments. Therefore, it is suggested to the investors to apply their knowledge and
invest in financial instruments where they can earn high returns on investment.
7. CONCLUSION
This study is done so as to know the Investment perception over different investment by
working professionals of Bangalore city. The major part of the analysis is based upon the
P a g e | 17
percentage analysis. Thus, the study conclude that investors consider safety for selecting the
mode of savings and insurance was considered as the main option of the investment followed
by bank deposits.
References:
1. G.C. Venkataiah, Prof.B.K.Surya Prakasha Rao, Investors’ perception towards various
investment avenues, International Journal of Research in Finance and Marketing, Vol.8
Issue 8, August 2018.
2. Jitha Thomas, A Study on preferred investment avenues among salaried people, The
Research Journal of Commerce, E-ISSN, Volume 1, Issue 1, 2017.
3. S. Mathivannan, M. Selvakumar, Savings and Investment pattern of school teachers,
Indian Journal of Finance, Volume 5, Issue 4, April 2011.
4. Avinashi Kumar Singh, Demographic change and Household savings behaviour in
India, Indian Journal of Economics, Vol.65, 2006.