
P&E Mining Consultants Inc. · Dr. Wayne D. Ewert, P.Geo. Ms. Tracy Armstrong, P.Geo. Mr. Fred H....
129
TECHNICAL REPORT AND RESOURCE ESTIMATES ON THE WEST, BRIDGE, GALENA HILL, SHORE, SG & GOSSAN HILL GOLD & SILVER ZONES OF THE BRUCEJACK PROPERTY NORTHERN BRITISH COLUMBIA CANADA LATITUDE 56° 28’ 20” N: LONGITUDE 130° 11’ 31” W For SILVER STANDARD RESOURCES INC. By P&E Mining Consultants Inc. NI 43-101F1 TECHNICAL REPORT No 173 Dr. Wayne D. Ewert, P.Geo. Ms. Tracy Armstrong, P.Geo. Mr. Fred H. Brown, CPG, Pr.Sci.Nat. Mr. Eugene Puritch, P.Eng. Effective Date: Dec 1, 2009 Signing Date: Jan 14, 2010
Transcript of P&E Mining Consultants Inc. · Dr. Wayne D. Ewert, P.Geo. Ms. Tracy Armstrong, P.Geo. Mr. Fred H....

TECHNICAL REPORT AND RESOURCE ESTIMATES
ON THE WEST, BRIDGE, GALENA HILL, SHORE, SG &
GOSSAN HILL GOLD & SILVER ZONES OF THE
BRUCEJACK PROPERTY NORTHERN BRITISH COLUMBIA
CANADA
LATITUDE 56° 28’ 20” N: LONGITUDE 130° 11’ 31” W
For
SILVER STANDARD RESOURCES INC.
By
P&E Mining Consultants Inc.
NI 43-101F1 TECHNICAL REPORT No 173 Dr. Wayne D. Ewert, P.Geo. Ms. Tracy Armstrong, P.Geo. Mr. Fred H. Brown, CPG, Pr.Sci.Nat. Mr. Eugene Puritch, P.Eng. Effective Date: Dec 1, 2009 Signing Date: Jan 14, 2010

TABLE OF CONTENTS
1.0 INTRODUCTION AND TERMS OF REFERENCE ......................................................... 1
1.1 TERMS OF REFERENCE ....................................................................................... 1
1.2 SOURCES OF INFORMATION ............................................................................. 2
1.3 UNITS AND CURRENCY ........................................................................................ 2
1.4 GLOSSARY AND ABBREVIATION OF TERMS ................................................ 2
1.5 ACKNOWLEDGMENTS ......................................................................................... 4
2.0 RELIANCE ON OTHER EXPERTS ................................................................................... 5
3.0. PROPERTY DESCRIPTION AND LOCATION .............................................................. 6
3.1 PROPERTY DESCRIPTION AND TENURE ....................................................... 6
3.2 LOCATION ................................................................................................................ 7
4.0 ACCESSIBILITY, CLIMATE, LOCAL RESOURCES, INFRASTRUCTURE, AND PHYSIOGRAPHY ............................................................................................................... 12
4.1 ACCESS .................................................................................................................... 12
4.2 CLIMATE ................................................................................................................ 12
4.3 LOCAL RESOURCES AND INFRASTRUCTURE ............................................ 13
4.4 PHYSIOGRAPHY ................................................................................................... 15
5.0 HISTORY AND PREVIOUS EXPLORATION ............................................................... 16
5.1 EARLY REGIONAL HISTORY ........................................................................... 16
5.2 RECENT PROPERTY HISTORY ........................................................................ 20
5.3 HISTORICAL RESOURCE ESTIMATES .......................................................... 22
5.4 HISTORICAL FEASIBILITY STUDY ................................................................. 23
5.5 HISTORICAL MINERAL PROCESSING & METALLURGY ........................ 23
6.0 GEOLOGICAL SETTING ................................................................................................. 24
6.1 REGIONAL GEOLOGY ........................................................................................ 24
6.2 PROPERTY GEOLOGY ........................................................................................ 30
7.0 DEPOSIT TYPES ................................................................................................................ 34
7.1 INTRODUCTION.................................................................................................... 34
7.2 EPITHERMAL GENETIC MODEL ..................................................................... 35
7.2.1 INTRODUCTION........................................................................................ 35
7.2.2 EPITHERMAL MINERALIZATION CHARACTERISTICS ............... 35
7.2.3 DIAGNOSTIC CHARACTERISTICS OF EPITHERMAL SUBTYPES ................................................................................................... 36
7.3 SUMMARY - EPITHERMAL MINERALIZING SYSTEMS ............................ 43
8.0 MINERALIZATION ........................................................................................................... 45
8.1 INTRODUCTION.................................................................................................... 45
8.2 BRUCEJACK PROPERTY .................................................................................... 45
8.3 WEST ZONE ............................................................................................................ 49
8.4 BRIDGE ZONE ....................................................................................................... 51
8.5 GALENA HILL ZONE ........................................................................................... 53
8.6 SHORE ZONE ......................................................................................................... 55
8.7 SG ZONE .................................................................................................................. 57
8.8 GOSSAN HILL ZONE ............................................................................................ 59

9.0 EXPLORATION .................................................................................................................. 60
10.0 DRILLING ........................................................................................................................... 61
10.1 INTRODUCTION.................................................................................................... 61
10.2 WEST ZONE ............................................................................................................ 62
10.3 BRIDGE ZONE ....................................................................................................... 64
10.4 GALENA HILL ZONE ........................................................................................... 65
10.5 SHORE ZONE ......................................................................................................... 67
10.6 SG ZONE .................................................................................................................. 67
10.7 GOSSAN HILL ZONE ............................................................................................ 67
10.8 MAMMOTH ZONE ................................................................................................ 67
11.0 SAMPLING METHOD AND APPROACH ...................................................................... 69
12.0 SAMPLE PREPARATION, ANALYSES AND SECURITY .......................................... 70
12.1 ALS CHEMEX LAB................................................................................................ 70
13.0 DATA VERIFICATION ..................................................................................................... 71
13.1 SITE VISIT AND INDEPENDENT SAMPLING ................................................ 71
13.2 PRE-SILVER STANDARD HISTORICAL DATA & QC .................................. 72
13.3 P&E INDEPENDENT DATA REVIEW ............................................................... 73
13.4 2009 DATA VERIFICATION RESULTS ............................................................. 73
13.4.1 PERFORMANCE OF CERTIFIED REFERENCE MATERIAL.......... 73
13.4.2 PERFORMANCE OF BLANK MATERIAL ........................................... 73
13.4.3 2009 DUPLICATE STATISTICS .............................................................. 74
13.4.4 2009 EXTERNAL CHECKS ...................................................................... 74
14.0 ADJACENT PROPERTIES ............................................................................................... 75
14.1 KERR-SULPHURETS-MITCHELL PROPERTY .............................................. 75
14.2 IRON CAP ZONE.................................................................................................... 77
15.0 MINERAL PROCESSING AND METALLURGICAL TESTING ................................ 79
16.0 MINERAL RESOURCE ESTIMATES ............................................................................. 80
16.1 INTRODUCTION.................................................................................................... 80
16.2 PREVIOUS RESOURCE ESTIMATES ............................................................... 80
16.3 SAMPLE DATABASE ............................................................................................ 81
16.4 DATABASE VALIDATION ................................................................................... 81
16.5 TOPOGRAPHIC CONTROL ................................................................................ 83
16.6 DENSITY .................................................................................................................. 83
16.7 DOMAIN MODELING ........................................................................................... 83
16.8 COMPOSITING ...................................................................................................... 85
16.9 EXPLORATORY DATA ANALYSIS ................................................................... 85
16.10 TREATMENT OF EXTREME VALUES ............................................................. 88
16.11 VARIOGRAPHY ..................................................................................................... 88
16.12 BLOCK MODELS ................................................................................................... 90
16.13 ESTIMATION & CLASSIFICATION .................................................................. 90
16.14 RESOURCE ESTIMATE ....................................................................................... 91
16.15 VALIDATION.......................................................................................................... 95
17.0 OTHER RELEVANT DATA AND INFORMATION ..................................................... 98
18.0 INTERPRETATION AND CONCLUSIONS ................................................................... 99

18.1 INTERPRETATION ............................................................................................... 99
18.2 CONCLUSIONS .................................................................................................... 101
19.0 RECOMMENDATIONS ................................................................................................... 102
19.1 RECOMMENDATIONS AND PROPOSED BUDGET .................................... 102
19.1.1 BRUCEJACK PROPERTY 2010 PROPOSED BUDGET .................... 102
20.0 REFERENCES ................................................................................................................... 105
21.0 CERTIFICATES ................................................................................................................ 114
LIST OF FIGURES
Figure 3-1: Regional Location Map for the Brucejack Property .............................................. 8
Figure 3-2: Brucejack Property Mineral Claim Map ................................................................. 9
Figure 3-3: Mineralized Zones of the Brucejack Property. ..................................................... 11
Figure 4-1: KSM Project Planned Road Access ........................................................................ 13
Figure 4-2: Proposed High-Voltage Northwest Transmission Line ........................................ 14
Figure 6-1: Regional Tectonic Map ............................................................................................ 25
Figure 6-2: Map of Regional Geology ........................................................................................ 27 Figure 6-3: Regional Stratigraphic Column .............................................................................. 28 Figure 6-4: Regional Trendline Map .......................................................................................... 29
Figure 6-5: Brucejack Property Geology Map .......................................................................... 31
Figure 7-1: Plot of Au grade (g/t) Versus Tonnage for Selected Canadian Epithermal Au Deposits and Prominent Examples Elsewhere in the World ................................ 39
Figure 7-2: Geological Cross-Section of a Representative Canadian Epithermal Deposit Illustrating Alteration Mineral Zoning and Selected Features ............................ 40
Figure 7-3: Schematic Cross-Section Illustrating General Geological and Hydrological Settings of Quartz-(Kaolinite)-Alunite and Adularia-Sericite Deposits .............. 44
Figure 8-1: Historical Map with Mineral Deposits and Occurrences ..................................... 46
Figure 8-2: Section 5160N of the West Zone – Looking Northwest ......................................... 50
Figure 8-3: Section 426775E of the Bridge Zone – Looking West ........................................... 52
Figure 8-4: Section 426925E of the Galena Hill Zone – Looking West ................................... 54
Figure 8-5: Section 427250E of the Shore Zone – Looking West-Northwest ......................... 56
Figure 8-6: Section 426125E of the SG Zone – Looking West ................................................. 58
Figure 10-1: 2009 Brucejack Property Drilling Program Drill Hole Layout Map .................. 63
Figure 13-1: P&E Independent Site Visit Sample Results for Gold. ......................................... 71

Figure 13-2: P&E Independent Site Visit Sample Results for Silver. ....................................... 72
Figure 14-1: Kerr-Sulphurets-Mitchell Property Geology Map ................................................ 76
Figure 14-2: Plan Map of the KSM Property PEA 2008 Pit Perimeters .................................. 78
Figure 16-1: Surface Drillhole Orientations. ............................................................................... 82
Figure 16-2: Isometric View of the Brucejack Domains. ............................................................ 84
Figure 16-3: Box and Whisker Plots of Composite Statistics by Domain. ................................ 87
Figure 16-4: Conceptual Optimized Pit Shells. ........................................................................... 93
Figure 16-5: Section Swath Plots. ................................................................................................. 97
LIST OF TABLES Table 3.1: Brucejack Property Mineral Claims ........................................................................ 6 Table 3.2: Brucejack Property Mineralized Zones ................................................................. 10 Table 5.1: Early Regional History ............................................................................................ 16 Table 5.2: Recent Property History .......................................................................................... 20 Table 5.3: Summary of Historical Resource and Reserve Estimates .................................... 22 Table 5.4: Corona Estimated Gold and Silver Recoveries ..................................................... 23 Table 6.1: Summary of Regional Stratigraphy ........................................................................ 26 Table 7.1: Summary of Geological Setting, Definitive Characteristics and Examples of
Typical Epithermal Au Deposit Subtypes .............................................................. 37 Table 10.1: 2009 West Zone Mineralized Intersections ............................................................ 62 Table 10.2: 2009 Bridge Zone Mineralized Intersections ......................................................... 64 Table 10.3: 2009 Galena Hill Zone Mineralized Intersections ................................................. 66 Table 10.4: 2009 SG Zone Mineralized Intersections ............................................................... 67 Table 10.5: 2009 Mammoth Zone Mineralized Intersections ................................................... 68 Table 13.1: Historical Drill Holes by Zone ................................................................................. 72 Table 14.1: Seabridge Gold 2009 Kerr-Sulphurets-Mitchell Resources ................................. 75 Table 15.1: Brucejack Property Composite Sample Locations ............................................... 80 Table 16.1: Pincock Allen & Holt Ltd. Mineral Resource Estimate. ...................................... 80 Table 16.2: Drilling Database Records. ...................................................................................... 81 Table 16.3: Bulk Density Statistics ............................................................................................. 83 Table 16.4: Au-Equivalent Parameters ...................................................................................... 84 Table 16.5: Summary Assay Statistics by Domain .................................................................... 85 Table 16.6: Summary Composite Statistics by Domain ............................................................ 86

Table 16.7: Capping and Threshold Values ............................................................................... 88 Table 16.8: Domain Anisotropy Definitions ............................................................................... 89 Table 16.9: Brucejack Block Model Setup. ................................................................................ 90 Table 16.10: West Zone Block Model Setup ................................................................................ 90 Table 16.11: Optimized Pit-Shell Parameters ............................................................................. 92 Table 16.12: Combined Mineral Resource Estimate at a 0.35g/t AuEq cutoff ......................... 93 Table 16.13: Mineral Resource Estimates by Domain at a AuEq 0.35g/t Cutoff ..................... 94 Table 16.14: Mineral Resource Sensitivity Demonstrated at a 1.0g/t AuEq Cutoff ................ 95 Table 16.15: Block Grades and Average Composite Grades ..................................................... 96 Table 19.1: Proposed 2010 Exploration Budget for the Brucejack Property ....................... 110
P&E Mining Consultants Inc., Rpt No. 173 i Brucejack Property Silver Standard Resources Inc.
EXECUTIVE SUMMARY The following report was prepared to provide an NI-43-101 compliant Technical Report and Resource Estimates of the gold and silver mineralization contained in the West, Bridge, Galena Hill, Shore, SG and Gossan Hill gold and silver deposits of the Brucejack Property, Northern British Columbia, Canada. The Brucejack Property is held 100% by Silver Standard Resources Inc (“Silver Standard”). This report was prepared by P&E Mining Consultants Inc., (“P&E”) at the request of Mr. Kenneth C. McNaughton, Vice President, Exploration, Silver Standard, which is a Vancouver, based resource company trading on the Toronto Exchange. The Brucejack Property comprises six mineral claims, with the total area of these six claims equalling 3,199.28 ha. All claims are in good standing until January 31, 2017. Claim ownership is registered to 0777666 B.C. Ltd., a wholly owned subsidiary of Silver Standard. The Brucejack Property is situated at an approximate latitude of 56° 28‟ 20” N by Longitude 130° 11‟ 31” W, a position approximately 950 kilometres northwest of Vancouver, 65 kilometres north-northwest of Stewart, and 21 kilometres south-southeast of the Eskay Creek Mine. The current technical report is focussed on the six highest priority mineralized zones of the Brucejack Property; the West, Bridge, Galena Hill, Shore, SG and Gossan Hill Zones. Travel to the Brucejack Property is presently limited to access by helicopter from either Stewart or Bell II, British Columbia. The trip is approximately 30 minutes from Stewart and slightly less from Bell II, but Stewart is preferred as it has an established year-round helicopter base. Heavy equipment, fuel and camp provisions can be driven along the well maintained Granduc gravel road to the Tide Lake airstrip, 35 kilometres to the south or flown by fixed wing to the Knipple airstrip 15 kilometres to the southeast. Access from these points is then by helicopter. The Brucejack Property lies immediately east of Seabridge Gold Inc.‟s (“Seabridge”) Kerr-Sulphurets-Mitchell (“KSM”) property and could be influenced by future access plans for that area. The proposed development activities for the KSM property call for a combined 28 kilometre tunnel for slurry delivery to the processing plant site located at the upper reaches of the Tiegen Creek Valley and a 14 kilometre gravel road that would allow material to be trucked to the paved Cassiar highway (Hwy 37). The Brucejack Property lies in the rugged Coastal Mountains of northwest BC, with elevations ranging from 520 m in Sulphurets Creek valley to over 2,300 m at the highest peaks. Vegetation is sparse with only some scrub spruce and fir at lower elevations along creeks, and juniper and alpine grasses at higher elevations. The climate is that of a temperate or northern coastal rainforest, with subarctic conditions at high elevations. The winters are long and cold, with heavy snowfall and high winds. Summers are cool and wet. The length of the snow-free season varies from about May through November at lower elevations and from July through September at higher elevations. There are no local resources other than abundant water for any drilling work. The nearest infrastructure is the town of Stewart, approximately 70 kilometres to the south, which has a

P&E Mining Consultants Inc., Rpt No. 173 ii Brucejack Property Silver Standard Resources Inc.
minimum of supplies and personnel. The towns of Terrace and Smithers are also located in the same general region as the Brucejack Property. Both are directly accessible by daily air service from Vancouver. As noted in the 2009 Seabridge Preliminary Economic Assessment, the proposed high voltage power line, which is planned to run parallel with existing lines along Highway 37, is currently under review. The proposed power line would provide sufficient high voltage feed to sustain a mining operation. The Brucejack Property, as it is presently known, previously formed part of a larger property, historically termed the Sulphurets property. The Sulphurets property and the surrounding region has a history rich in exploration for precious and base metals dating back to the late 1800‟s. The original Sulphurets property, which was to later incorporate the region now known as the Brucejack claims, was staked in 1960 by Granduc Mines Limited and Alaskan prospectors to cover the known copper and gold-silver occurrences. Since this time, various owners and operators have explored and developed the historical Sulphurets property. These companies include Granduc Mines Limited (who were later to become Black Hawk Mining Inc.), Newmont Mining Corporation, Esso Minerals Canada Limited (“Esso”), Newhawk Gold Mines Ltd. (“Newhawk”), Lacana Mining Corp. and more recently, Silver Standard. The exploration work carried out by Esso between the period from 1980 until 1985 resulted in the discovery of the Shore, West, Electrum (which now forms the northern extension of the Bridge Zone) and Galena Hill Zones of the Brucejack Property. The Gossan Hill, Bridge and SG Zones were later discovered as a result of Newhawk‟s exploration of the area between 1985 and 1992. The Bridge Zone was first drilled by Silver Standard in the 2009 drill program, based on Newhawk‟s previous work, resulting in the discovery of potentially bulk-mineable gold. The Brucejack Property is situated along the western margin of British Columbia‟s Intermontane Belt which extends from the Alaska-Yukon border southwards to the Chilcotin region in the southern part of the province and is underlain by rocks belonging to the allocthonous litho-tectonic terrane of Stikinia. The region is underlain by Upper Triassic and Lower to Middle Jurassic Hazelton Group volcanic, volcaniclastic and sedimentary rocks, which have been intruded by Mesozoic intermediate to felsic plutons and minor Tertiary mafic dykes and sills. In terms of economic geology, the Brucejack Property lies within the Iskut River mineral district which is a particularly prolific part of the Canadian Cordillera. The approximately 6,000 square kilometre region is host to several metallic deposits of various genetic classifications, including porphyry Cu-Au (Kerr, Mitchell, Snowfield North), shear zone-controlled Au-Ag veins (West Zone), epithermal Au-Ag veins (Silbak-Premier), intrusion-related Au-Ag(-Cu) veins (Snip, Johnny Mountain) and submarine exhalative massive sulphide-sulphosalt copper and precious metal deposits (Granduc, Eskay Creek). The Brucejack Property is underlain by Upper Triassic volcaniclastic and epiclastic sedimentary rocks of the Stuhini Group and Lower to Middle Jurassic volcanic, volcaniclastic and sedimentary rocks of the Hazelton Group.

P&E Mining Consultants Inc., Rpt No. 173 iii Brucejack Property Silver Standard Resources Inc.
The andesites of the Unuk River Member of the Betty Creek Formation are the most important host rocks to Au- and Ag-bearing quartz veins discovered in the Brucejack Property and have been affected by widespread hydrothermal alteration, mainly quartz-sericite-pyrite (eg. Gossan Hill, Galena Hill). U-Pb geochronology and biochronology done by MDRU geoscientists has determined the age of the Unuk River Member volcanics to be in the range of 196 to 194 Ma. The most common intrusive rock in the area consist of plagioclase- and hornblende-phyric to porphyritic rock of diorite to tonalite composition that forms two stocks (approximately 700 m east-west by 700-1000 m north-south) found in the southern half of the claim group. These intrusions have been referred to as “Sulphurets-type” intrusions and are considered to be broadly coeval with the andesite volcanics of the Unuk River Member in the Hazelton Group. A second type of intrusive rock forms, which forms a north-south elongate body of about 700 m length along the western margin of one of the Sulphurets stocks. This intrusion is best described as potassium feldspar-plagioclase-hornblende porphyry and earlier workers have referred to it as a “two-feldspar” or “Premier-type” porphyry. Based on contact relationships it would appear that this intrusion is younger than the Sulphurets-type intrusions. Most, if not all of the mineralization in the Brucejack Property have been classified as Epithermal Au-Ag-Cu, Low-Sulphidation Deposits (UBC deposit model No. H04): It is possible that some of the mineralization also displays characteristics of intrusion related vein systems that fall within the Intermediate-Sulphidation epithermal subtype. Amongst the Brucejack Property gold and silver deposits, the West Zone has received the most exploration work to-date and accordingly can be considered somewhat typical of the general style of mineralization displayed by the various mineralizing systems comprising the area. The mineralization at the West Zone has been characterized as a structurally controlled, complex vein/breccia system related to the Brucejack Fault lying to the immediate west. Like the other Brucejack Property deposits it is considered to fit the epithermal high-grade, intermediate to low-sulphidation, Au-Ag model. Other examples in B.C. include the Blackdome and Silbak-Premier Mines. The West Zone: The West Zone gold-silver deposit is hosted by a north-westerly trending band of lower Jurassic andesitic and lesser sedimentary rocks, 400 to 500 m wide, that passes between two intrusive bodies of plagioclase-hornblende porphyry. The supracrustal rocks display varying degrees of brittle-ductile deformation and moderate to intense hydrothermal alteration, particularly where the precious metal deposit has been outlined. Hydrothermal alteration takes the form of a central silicified zone that passes outwards to a zone of sericite ± quartz ± carbonate and then an outer zone of chlorite ± sericite ± carbonate. The combined width of these alteration zones across the central part of the deposit is 100 m to 150 m. The deposit itself comprises at least 10 quartz veins and quartz stockwork shoots, the longest of which has a strike length of 250 m and a maximum thickness of about 6 m. Most mineralized shoots have vertical extents that are greater than their strike lengths. It appears that ductile shearing generated the dilatant structures that served as conduits for the hydrothermal fluids which deposited silica and precious metals.

P&E Mining Consultants Inc., Rpt No. 173 iv Brucejack Property Silver Standard Resources Inc.
Bridge Zone: Drilling has determined that the bulk of the gold mineralization at the Bridge Zone is hosted by plagioclase-hornblende porphyry intrusive rock that in general is moderately sericite-chlorite altered, with disseminated and stringer pyrite making up a few percent of the rock by volume. Quartz ± chlorite ± sericite veins, 20-200 cm in thickness, were intermittently intersected by the drill holes, and these commonly contain minor to trace amounts of pyrite, sphalerite, galena, molybdenite and unknown dark grey, silver-bearing sulfosalt(s). Galena Hill Zone The prospect area known as Galena Hill is marked by widespread iron oxide staining of altered meta-andesites. Drilling, detailed geological mapping and channel rock-sampling, indicate that there is a system of east-west and NE-SW trending quartz veins and quartz stockworks which, as a whole, define a zone of hydrothermal alteration and mineralization that is at least 400 m long and 200 m wide. As in the West Zone, gold mineralization at the Galena Hill Zone is preferentially associated with quartz veins, although the sericite-altered, andesitic host rocks are typically mineralized with disseminated pyrite and have geochemically anomalous gold contents, generally in the 100-500 ppb Au range. In some veins, trace amounts of native gold and electrum are accompanied by minor to occasionally substantial amounts of sphalerite, chalcopyrite and galena. Two of the drill holes drilled in Silver Standard‟s 2009 drill program intersected spectacularly rich gold mineralization; a 1.5 m long intercept in SU-012 gave impressive assays of 16.95 kilograms Au/tonne and 8.95 kg Ag/t, where the precious metals occurred as a centimetre wide band of electrum within a quartz vein only a few centimetres wide itself. Shore Zone The Shore Zone is a zone of quartz veining hosted by foliated, sericite-altered andesites with a strike length of roughly 500 m and a maximum width of 50 m. The NW-SE trend of the zone is coincident with a pronounced structural lineament, likely a shear fault, which extends from the Brucejack Fault south-eastwards beneath Brucejack Lake. The veins occur as „stacked‟, en echelon, sigmoidal lenses up to 100 m in length and 1.5 m wide, although they are typically 20-40 m long. Predominantly composed of quartz with minor carbonate and barite, the veins contain podiform sulphide mineralization consisting of varying amounts of pyrite, tetrahedrite, sphalerite, galena and arsenopyrite. Electrum has been observed in trace amounts. Silver is present in some of the highest concentrations observed in the Brucejack area. SG Zone The SG Zone is represented by an area of iron oxide-stained, sericite-altered rocks that occur adjacent to the northerly striking Brucejack Fault. Channel rock sampling done by Silver Standard and earlier workers tested a restricted zone of quartz stockwork veining close to the major fault as well as an east-striking, 150 m long and 20-80 cm wide quartz vein that extends westwards from the stockwork.

P&E Mining Consultants Inc., Rpt No. 173 v Brucejack Property Silver Standard Resources Inc.
Drilling by Silver Standard has determined a sequence of mainly clastic andesitic rocks, likely redeposited tuffs and lapilli tuffs, that are intercalated with quartzo-feldspathic sandstones and minor siltstone units. Some of the better mineralization at the SG Zone contains surprisingly minor quartz veining; instead, the mineralized lapilli tuff hosts minor quartz-carbonate stockwork veinlets and trace amounts of fine, acicular arsenopyrite in addition to 1-3% disseminated pyrite. Gossan Hill Zone The mineralized zone known as Gossan Hill is a circular area, about 300 m in diameter, of intense quartz-sericite-pyrite alteration developed in Jurassic andesites of the Unuk River member of the Betty Creek formation. This visually impressive alteration zone is host to at least eleven quartz vein and quartz stockwork structures most of which trend east-west and dip steeply to the north. Individual structures are up to 250 m long and 20 m wide. Precious metal mineralization at the Gossan Hill Zone is sporadic but generally best developed in the larger quartz lenses, particularly where these contain minor aggregates of pyrite, tetrahedrite, sphalerite and galena. Electrum is rarely observed, while silver also occurs in tetrehedrite, pyrargyrite and polybasite. Silver Standard‟s 2009 Brucejack Property drilling program, comprised 37 diamond drill holes, totalling 17,845.71 m in length which all intersected gold-silver mineralization. The drill program included drilling undertaken at the West, Bridge, Galena Hill, SG and Mammoth Zones and succeeded in identifying and defining previously undefined gold targets, as well as intersecting gold mineralization over significant intervals, with some intersections exceeding 500 m. Out of these 37 holes, 35 have been used in P&E‟s current Resource Estimates. More than 900 surface and underground diamond drill holes were drilled in the Brucejack Property prior to Silver Standard‟s involvement commencing September of 1999. Of these historical drilled holes, 432 underground and 333 surface drill holes have been incorporated into the current P&E Resource Estimates.
P&E December 1, 2009 Brucejack Property Combined Mineral Resource Estimate at a
0.35g/t AuEq cutoff1,2,3
.
Class Tonnes x M Au g/t Ag g/t Au ozs
x M Ag ozs
x M Measured 9.9 2.06 75.0 0.66 23.8 Indicated 110.7 0.95 11.7 3.38 41.6 Measured + Indicated 120.5 1.04 16.9 4.04 65.4 Inferred 198 0.76 11.2 4.87 71.5
(1) Resource sensitivities are accumulated within an optimized pit shell. (2) Mineral Resources which are not Mineral Reserves do not have demonstrated economic viability. The Estimate of Mineral Resources may be materially affected by environmental, permitting, legal, title, taxation, socio-political, marketing, or other relevant issues. (3) The quantity and grade of reported Inferred Resources in this estimation are conceptual in nature. There is no guarantee that all or any part of the Mineral Resource will be converted into Mineral Reserve. The 2009 Measured and Indicated precious metals Resources for the Brucejack Property as prepared by P&E, increased to 4.04 million ounces of gold and 65.4 million ounces of silver and Inferred Resources are 4.87 million ounces of gold and 71.5 million ounces of silver.

P&E Mining Consultants Inc., Rpt No. 173 vi Brucejack Property Silver Standard Resources Inc.
The previous Sulphurets Resource undertaken by Pincock Allen & Holt was focused on the higher grade underground mining potential while the current P&E Resource expands those parameters to include surface bulk mining opportunities in light of higher precious metals prices. The Brucejack deposits for which Resource Estimates were prepared all remain open in at least one direction and it is the opinion of the authors of this report that the Mineral Resources outlined are of sufficient merit to warrant further drill delineation and Resource updating prior to undertaking more advanced scoping or feasibility level studies. It is therefore recommended that a results-driven diamond drilling program totalling approximately 24,000 metres of NQ sized coring be undertaken to both expand existing Resources (potentially by a total of 3 to 4 million ounces gold) through a program of step-out drilling and to further define the mineralized zones, through a program of in-fill drilling. This will allow in the upgrading of existing Inferred category mineralization to the Indicated category. This program should be priority-based according to the exploration potential of the existing mineralization and should also include the testing of new targets within the Brucejack Property. It is also recommended that continued drilling include a limited program of confirmation drilling on the Shore Zone, additional drilling at the Bridge Zone (oriented perpendicular to the known structural trends) and select historical drill holes within the West Zone to be twinned in order to verify previous data. It is also advised that metallurgical test work on composite samples, initiated last year, be completed and geotechnical and metallurgical holes be carried out in several areas to provide data which would help facilitate advanced scoping level studies The above recommended work programs have a proposed budget of approximately $10 million as shown in the table below.
Proposed 2010 Exploration Budget for the Brucejack Property.
Item Cost (CDN$)
Drilling 24,000 metres $ 4,200,000 Supplies $ 850,000 Labour, fuel, expediting $ 750,000 Assaying $ 850,000 Helicopter and fixed wing $ 2,500,000 Geological consulting $ 300,000 Contingency (6%) $ 550,000 TOTAL $ 10,000,000

P&E Mining Consultants Inc., Rpt No. 173 Page 1 of 117 Brucejack Property Silver Standard Resources Inc.
1.0 INTRODUCTION AND TERMS OF REFERENCE
1.1 TERMS OF REFERENCE
The following report was prepared to provide an NI-43-101 compliant Technical Report and Resource Estimates of the gold and silver mineralization contained in the West, Bridge, Galena Hill, Shore, SG and Gossan Hill gold and silver deposits of the Brucejack Property, Northern British Columbia, Canada. The Brucejack Property is held 100% by Silver Standard Resources Inc. (“SSR” or “Silver Standard”). This report was prepared by P&E Mining Consultants Inc., (“P&E”) at the request of Mr. Kenneth C. McNaughton, P.Eng. Vice President, Exploration, Silver Standard Resources Inc., which is a Vancouver, based resource company, with its corporate office at: #1400 – 999 West Hastings Street Vancouver, B.C. V6C 2W2 Tel: 604-689-3846 Fax: 604-689-3847 This report has an effective date of December 1, 2009. Mr. Fred H. Brown, a qualified person under the regulations of NI 43-101, conducted a site visit to the Brucejack Project during the period September 8 – 13, 2009. An independent verification sampling program was conducted at that time. In addition to the site visit, P&E carried out a study of all relevant parts of the available literature and documented results concerning the project and held discussions with technical personnel from the Company regarding all pertinent aspects of the project. The reader is referred to these data sources, which are outlined in the “References” section of this report, for further details. This Technical Report is prepared in compliance with the requirements of form NI 43-101F1 of the Ontario Securities Commission (OSC) and the Canadian Securities Administrators (CSA). The Mineral Resources in the Estimate are considered compliant with the Canadian Institute of Mining, Metallurgy and Petroleum (CIM), CIM Standards on Mineral Resources and Reserves, Definitions and Guidelines prepared by the CIM Standing Committee on Reserve Definitions and adopted by CIM Council December 11, 2005. The purpose of the current report is to provide an independent, NI 43-101 compliant, Technical Report and Resource Estimates on the West, Bridge, Galena Hill, Shore, SG and Gossan Hill gold and silver deposits contained within the Brucejack Property. P&E understands that this report will be used for internal decision making purposes and maybe filed as required under TMX regulations. The report may also be used to support public equity financings.

P&E Mining Consultants Inc., Rpt No. 173 Page 2 of 117 Brucejack Property Silver Standard Resources Inc.
1.2 SOURCES OF INFORMATION
This report is based, in part, on internal company technical reports, and maps, published government reports, company letters and memoranda, and public information as listed in the "References” section 20.0. Several sections from reports authored by other consultants have been directly quoted or summarized in this report, and are so indicated where appropriate. 1.3 UNITS AND CURRENCY
Unless otherwise stated all units used in this report are metric. Gold and silver assay values are reported in grams per tonne (“g/t”) unless some other unit is specifically stated. The CDN$ is used throughout this report. 1.4 GLOSSARY AND ABBREVIATION OF TERMS
In this document, in addition to the definitions contained heretofore and hereinafter, unless the context otherwise requires, the following terms have the meanings set forth below. “$” and “CDN$” means the currency of Canada. “AA” is an acronym for Atomic Absorption, a technique used to measure metal
content subsequent to fire assay. “Ag” means silver. “asl” means above sea level. “Au” means gold. “Black Hawk” means Black Hawk Mining Inc. “Corona” means Corona Corporation “CIM” means the “Canadian Institute of Mining, Metallurgy and Petroleum.” “CSA” means the Canadian Securities Administrators. “DDH” means diamond drillhole. “E” means east. “el” means elevation level. “Esso” means Esso Minerals Canada Limited “Granduc” means Granduc Mines Limited “g/t” means grams per tonne. “g/t Au” means grams of gold per tonne of rock “g/t Ag” means grams of silver per tonne of rock “ha” means Hectare. “km” means kilometre equal to 1,000 metres or approx. 0.62 statute miles. “KSM” means the Kerr-Sulphurets-Mitchell Property adjacent to the west
boundaries of the Brucejack and Snowfield Properties, 100% owned by Seabridge Gold Inc.
“Lacana” means Lacana Mining Corp. “LRMP” means the Cassiar-Iskut-Stikine Land and Resource Management Plan “m” means metric distance measurement equivalent to approximately 3.27 feet “M” means million. “Ma” means millions of years. “mL” means meter level. “MDRU” means the Mineral Deposits Research Unit.

P&E Mining Consultants Inc., Rpt No. 173 Page 3 of 117 Brucejack Property Silver Standard Resources Inc.
“Mt” means millions of tonnes. “MTO” means the Mineral Titles Branch of the B.C. Ministry of Energy, Mines
and Petroleum Resources Mineral Titles Online (“MTO”) land tenure database.
“N” means north. “NE” means northeast. “Newcana JV” means the three-way joint venture between Granduc Mines Limited
(40%), Newhawk Gold Mines Ltd. (30%) and Lacana Mining Corp. (30%).
“Newhawk” means Newhawk Gold Mines Ltd. “Newmont” means Newmont Mining Corporation “NI” means National Instrument. “NN” means Nearest Neighbour. “NTS” means National Topographic System. “NW” means northwest. “NSR” is an acronym for “Net Smelter Return”, which means the amount actually
paid to the mine or mill owner from the sale of ore, minerals and other materials or concentrates mined and removed from mineral properties, after deducting certain expenditures as defined in the underlying smelting agreements.
“oz/T” means ounces per ton. “P&E” means P&E Mining Consultants Inc. “PAH” means Pincock Allen & Holt, a firm of independent mining consultants; “PEA” means a Preliminary Economic Assessment study; “Placer Dome” means Placer Dome Inc. “ppm” means parts per million. “RMI” means Resource Modeling Inc. “S” means south. “SE” means southeast. “Seabridge” means Seabridge Gold Inc., who owns a 100% interest in the KSM
property located adjacent to the west boundaries of the Brucejack and Snowfield Properties.
“SEDAR” means the System for Electronic Document Analysis and Retrieval. “Silver Standard” means Silver Standard Resources Inc. “SW” means southwest. “t” means metric tonnes equivalent to 1,000 kilograms or approximately
2,204.62 pounds “T” means Short Ton (standard measurement), equivalent to 2,000 pounds. “t/a” means tonnes per year. “tpd” means tonnes per day “URZ” means the Unuk River Zone within the Cassiar-Iskut-Stikine Land and
Resource Management Plan (“LRMP”) area. “US$” means the currency of the United States. “UTM” means Universal Transverse Mercator. “W” means west. “Westmin” means Westmin Resources. “WGM” means Watts, Griffis and McOuat, a firm of Consulting Geologists and
Engineers

P&E Mining Consultants Inc., Rpt No. 173 Page 4 of 117 Brucejack Property Silver Standard Resources Inc.
1.5 ACKNOWLEDGMENTS
Certain portions of this report were structured and compiled by Ms. Jarita Barry B.Sc. under the supervision of Dr. Wayne D. Ewert P.Geo who, acting as a QP as defined by NI 43-101, takes full responsibility for those sections of the report prepared by Ms. Barry, as outlined in the “Certificate of Author” attached to this report.

P&E Mining Consultants Inc., Rpt No. 173 Page 5 of 117 Brucejack Property Silver Standard Resources Inc.
2.0 RELIANCE ON OTHER EXPERTS
P&E has assumed, and relied on the fact, that all the information and existing technical documents listed in the Sources of Information section of this report are accurate and complete in all material aspects. While we carefully reviewed all the available information presented to us, we cannot guarantee its accuracy and completeness. We reserve the right, but will not be obligated to revise our report and conclusions if additional information becomes known to us subsequent to the date of this report. Although copies of the tenure documents, operating licenses, permits, and work contracts were reviewed, an independent verification of land title and tenure was not performed. P&E has not verified the legality of any underlying agreement(s) that may exist concerning the licenses or other agreement(s) between third parties but has relied on information provided by Mr Max Holtby, Silver Standard‟s Senior Geologist, and public information available from the Mineral Titles Branch of the B.C. Ministry of Energy, Mines and Petroleum Resources Mineral Titles Online (“MTO”) land tenure database. A draft copy of the report has been reviewed for factual errors by the Silver Standard and P&E has relied on their historical and current knowledge of the Brucejack Property in this regard. Any changes made as a result of these reviews did not involve any alteration to the conclusions made. Hence, the statement and opinions expressed in this document are given in good faith and in the belief that such statements and opinions are not false and misleading at the date of this report.
P&E Mining Consultants Inc., Rpt No. 173 Page 6 of 117 Brucejack Property Silver Standard Resources Inc.
3.0. PROPERTY DESCRIPTION AND LOCATION
3.1 PROPERTY DESCRIPTION AND TENURE
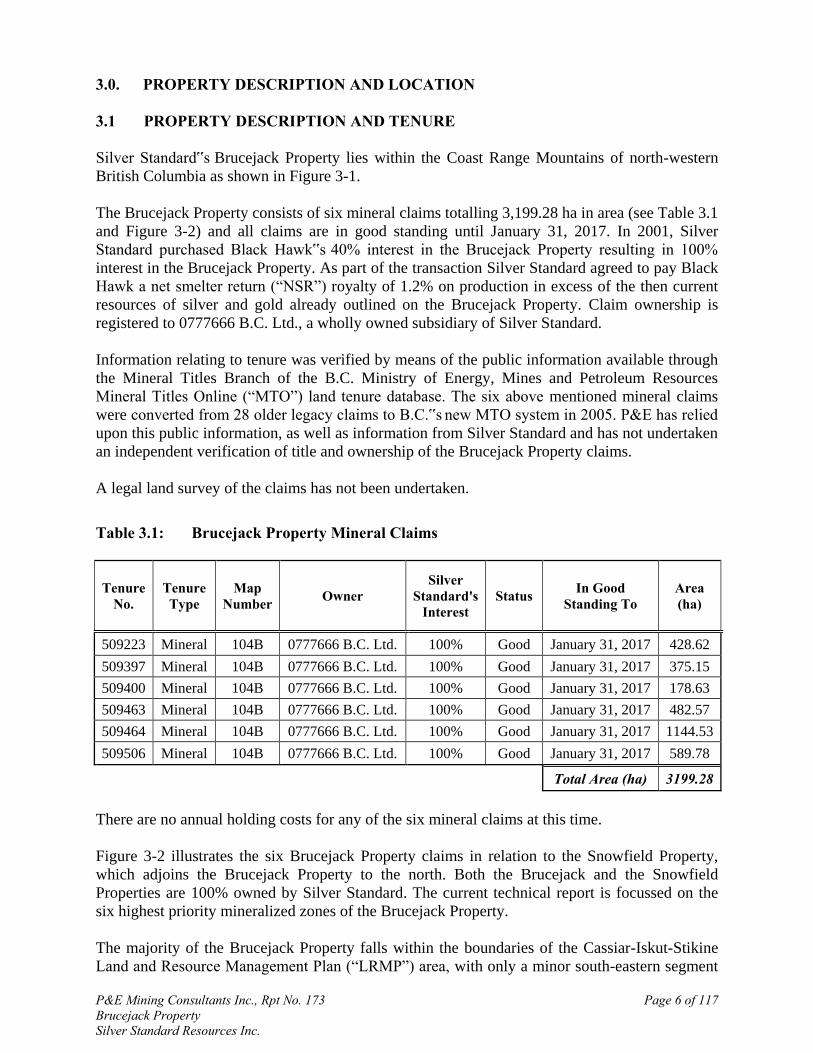
Silver Standard‟s Brucejack Property lies within the Coast Range Mountains of north-western British Columbia as shown in Figure 3-1. The Brucejack Property consists of six mineral claims totalling 3,199.28 ha in area (see Table 3.1 and Figure 3-2) and all claims are in good standing until January 31, 2017. In 2001, Silver Standard purchased Black Hawk‟s 40% interest in the Brucejack Property resulting in 100% interest in the Brucejack Property. As part of the transaction Silver Standard agreed to pay Black Hawk a net smelter return (“NSR”) royalty of 1.2% on production in excess of the then current resources of silver and gold already outlined on the Brucejack Property. Claim ownership is registered to 0777666 B.C. Ltd., a wholly owned subsidiary of Silver Standard. Information relating to tenure was verified by means of the public information available through the Mineral Titles Branch of the B.C. Ministry of Energy, Mines and Petroleum Resources Mineral Titles Online (“MTO”) land tenure database. The six above mentioned mineral claims were converted from 28 older legacy claims to B.C.‟s new MTO system in 2005. P&E has relied upon this public information, as well as information from Silver Standard and has not undertaken an independent verification of title and ownership of the Brucejack Property claims. A legal land survey of the claims has not been undertaken.
Table 3.1: Brucejack Property Mineral Claims
Tenure No.
Tenure Type
Map Number Owner
Silver Standard's
Interest Status In Good
Standing To Area (ha)
509223 Mineral 104B 0777666 B.C. Ltd. 100% Good January 31, 2017 428.62 509397 Mineral 104B 0777666 B.C. Ltd. 100% Good January 31, 2017 375.15 509400 Mineral 104B 0777666 B.C. Ltd. 100% Good January 31, 2017 178.63 509463 Mineral 104B 0777666 B.C. Ltd. 100% Good January 31, 2017 482.57 509464 Mineral 104B 0777666 B.C. Ltd. 100% Good January 31, 2017 1144.53 509506 Mineral 104B 0777666 B.C. Ltd. 100% Good January 31, 2017 589.78
Total Area (ha) 3199.28 There are no annual holding costs for any of the six mineral claims at this time. Figure 3-2 illustrates the six Brucejack Property claims in relation to the Snowfield Property, which adjoins the Brucejack Property to the north. Both the Brucejack and the Snowfield Properties are 100% owned by Silver Standard. The current technical report is focussed on the six highest priority mineralized zones of the Brucejack Property. The majority of the Brucejack Property falls within the boundaries of the Cassiar-Iskut-Stikine Land and Resource Management Plan (“LRMP”) area, with only a minor south-eastern segment

P&E Mining Consultants Inc., Rpt No. 173 Page 7 of 117 Brucejack Property Silver Standard Resources Inc.
of mineral claim number 509506 falling outside this area. All claims located within the boundaries of the LRMP are considered as areas of General Management Direction, with none of the claims falling inside any Protected or Special Management Areas. There is one zone within the LRMP, the Unuk River Zone (“URZ”) located to the south-west of the Brucejack Property (see Figure 4-1), which may have some impact on road access to the region. The URZ, comprising that portion of the Unuk River watershed south of Sulphurets Creek, has been classified for Area Specific Direction within the LRMP due to the importance of maintaining the salmon and grizzly bear habitat inside this region. The LRMP strongly encourages air or water access for mineral exploration activities within this zone. Although this does not presently affect projects within the Brucejack Property it may influence road access plans through this zone for the nearby Kerr-Sulphurets-Mitchell (“KSM”) property. The authors consider this noteworthy as implementation of Seabridge‟s road access plans would also greatly improve road access to the Brucejack project area. It is also worth mentioning that the LRMP supports mineral exploration and development, including road accessed resource development, in all zones outside of Protected Areas. The objective of the LRMP with regards to the URZ is to maintain the high quality and quantity of grizzly bear habitat as well as the view from the Unuk River, while allowing mineral exploration and development to occur (Government of B.C., 2000). At present the land claims in the area are in review and subject to ongoing discussions between various native groups and the B.C. Government. Silver Standard has specified that it maintains good relationships with all native groups. 3.2 LOCATION
The Brucejack Property is situated at an approximate latitude of 56° 28‟ 20” N by Longitude 130° 11‟ 31” W, a position approximately 950 kilometres northwest of Vancouver, approximately 70 kilometres north-northwest of Stewart, and 21 kilometres south-southeast of the Eskay Creek Mine. The Brucejack Property co-ordinates used in this report are located relative to the NAD83 UTM coordinate system.

P&E Mining Consultants Inc., Rpt No. 173 Page 8 of 117 Brucejack Property Silver Standard Resources Inc.
Figure 3-1: Regional map of British Columbia showing location of the Brucejack
Property (modified after Blanchflower, 2008)

P&E Mining Consultants Inc., Rpt No. 173 Page 9 of 117 Brucejack Property Silver Standard Resources Inc.
Figure 3-2: Brucejack Property Mineral Claim Map (modified after Blanchflower, 2008)
P&E Mining Consultants Inc., Rpt No. 173 Page 10 of 117 Brucejack Property Silver Standard Resources Inc.
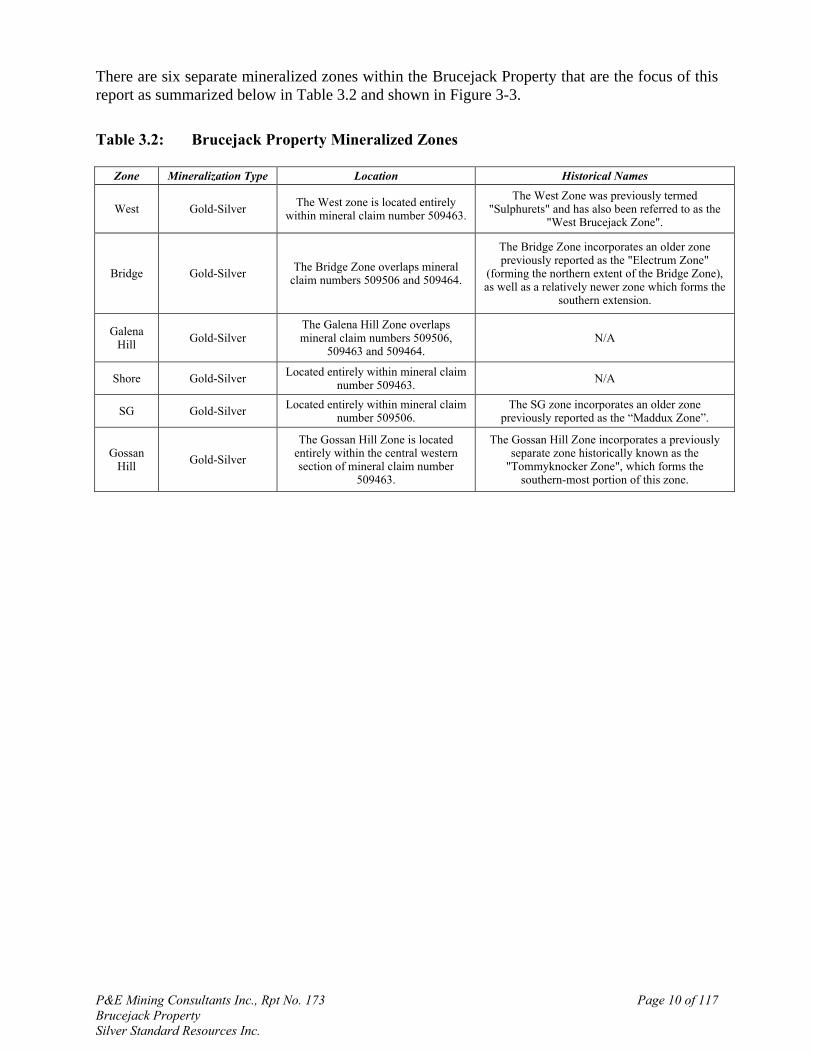
There are six separate mineralized zones within the Brucejack Property that are the focus of this report as summarized below in Table 3.2 and shown in Figure 3-3.
Table 3.2: Brucejack Property Mineralized Zones
Zone Mineralization Type Location Historical Names
West Gold-Silver The West zone is located entirely
within mineral claim number 509463.
The West Zone was previously termed "Sulphurets" and has also been referred to as the
"West Brucejack Zone".
Bridge Gold-Silver The Bridge Zone overlaps mineral
claim numbers 509506 and 509464.
The Bridge Zone incorporates an older zone previously reported as the "Electrum Zone"
(forming the northern extent of the Bridge Zone), as well as a relatively newer zone which forms the
southern extension.
Galena Hill
Gold-Silver The Galena Hill Zone overlaps mineral claim numbers 509506,
509463 and 509464. N/A
Shore Gold-Silver Located entirely within mineral claim
number 509463. N/A
SG Gold-Silver Located entirely within mineral claim
number 509506. The SG zone incorporates an older zone
previously reported as the “Maddux Zone”.
Gossan Hill
Gold-Silver
The Gossan Hill Zone is located entirely within the central western section of mineral claim number
509463.
The Gossan Hill Zone incorporates a previously separate zone historically known as the
"Tommyknocker Zone", which forms the southern-most portion of this zone.

P&E Mining Consultants Inc., Rpt No. 173 Page 11 of 117 Brucejack Property Silver Standard Resources Inc.,
Figure 3-3: Mineralized Zones of the Brucejack Property (Source: P&E).

P&E Mining Consultants Inc., Rpt No. 173 Page 12 of 117 Brucejack Property Silver Standard Resources Inc.
4.0 ACCESSIBILITY, CLIMATE, LOCAL RESOURCES, INFRASTRUCTURE, AND
PHYSIOGRAPHY
4.1 ACCESS
Travel to the Brucejack Property is presently limited to access by helicopter from either Stewart or Bell II, British Columbia. The trip is approximately 30 minutes from Stewart and slightly less from Bell II, but Stewart is preferred as it has an established year-round helicopter base. Heavy equipment, fuel and camp provisions can be driven along the well maintained Granduc gravel road to the Tide Lake airstrip, 35 kilometres to the south or flown by fixed wing to the Knipple airstrip 15 kilometres to the southeast. Access from these points is then by helicopter. During the underground exploration period in the late 1980s, freight, supplies and personnel were transported from Stewart overland via paved Highway 37, then by gravel road to Bowser Lake, then by barge along Bowser Lake (25 kilometres) then by road along Bowser River and finally by tracked vehicle up the Knipple Glacier (15 kilometres) and then by a further 3.0 kilometres of gravel roads to the camp site. During the early 1990‟s, an exploration road was pushed north from the Brucejack Lake camp to the southern edge of Hanging Glacier, terminating less than three kilometres from the Snowfield Zone. Since then, the Brucejack Camp and equipment including the landing-craft was sold and removed. All that remains at Brucejack Lake is drill core from the years of previous diamond drill programs. Currently exploration work is being conducted from a camp established on a ridge located south of Brucejack Lake (UTM coordinates: 427,030 mE, 6,258,360 mN). The camp has the support capacity for approximately 50 persons. Access around the Brucejack Property is by four wheel drive quad vehicles, helicopter or by foot. The Brucejack Property lies immediately east of Seabridge Gold Inc.‟s KSM property and could be influenced by future access plans for that area, as outlined within the Preliminary Economic Assessment (“PEA”) study by Seabridge Gold (McElhanney, 2008; Wardrop, 2009a). The proposed development activities for the KSM property call for a combined 28 kilometre tunnel for slurry delivery to the processing plant site located at the upper reaches of the Tiegen Creek Valley and a 14 kilometre gravel road that would allow material to be trucked to the paved Cassiar highway (Hwy 37). In addition road access to Mitchell Creek itself would be provided by a 34 kilometre continuation of the Eskay Creek Mine access road (Figure 4-1). 4.2 CLIMATE
The climate in the Skeena region of B.C. is generally that of a temperate or northern coastal rainforest, with subarctic conditions at high elevations. Precipitation is high with an annual total precipitation (rainfall and snow equivalents) estimated to be somewhere between the historical average of 1,373 mm for the Eskay Creek Mine and 2,393 mm (data to 2005) for nearby Stewart, BC. The length of the snow-free season varies from about May through November at lower elevations and from July through September at higher elevations. The Brucejack Property is characteristically harsh and forbidding in the long and cold winters which are marked by heavy snowfall and high winds. Summers are cool and wet. Vegetation is sparse with only some scrub spruce and fir at lower elevations along creeks, and juniper and alpine grasses at higher elevations.

P&E Mining Consultants Inc., Rpt No. 173 Page 13 of 117 Brucejack Property Silver Standard Resources Inc.
Figure 4-1: KSM project planned road access (after Seabridge Gold: Wardrop, 2009a) 4.3 LOCAL RESOURCES AND INFRASTRUCTURE There are no local resources other than abundant water for any drilling work. The nearest infrastructure is the town of Stewart, approximately 70 kilometres to the south, which has a minimum of supplies and personnel. The towns of Terrace and Smithers are also located in the same general region as the Brucejack Property. Both are directly accessible by daily air service from Vancouver. The nearest railway is the CNR Yellowhead route, which is located approximately 220 kilometres to the southeast. This line runs east-west and terminates at the deep water port of Prince Rupert on the west coast of BC. The Brucejack Property lies on Crown land thus all surface and access rights are granted by the Mineral Tenure Act and the Mining Right of Way Act. There are no settlements or privately owned land in this area and no commercial activity, but there is limited recreational activity in the form of helicopter skiing and guided fishing adventures. Other specialized services available in the region are briefly discussed below (Wardrop, 2009a):
Stewart Bulk Terminal
The most northerly ice-free shipping port in North America is accessible to store and ship concentrates. Such material from the Eskay Creek and Huckleberry mines is currently being shipped via this terminal.
P&E Mining Consultants Inc., Rpt No. 173 Page 14 of 117 Brucejack Property Silver Standard Resources Inc.
Power
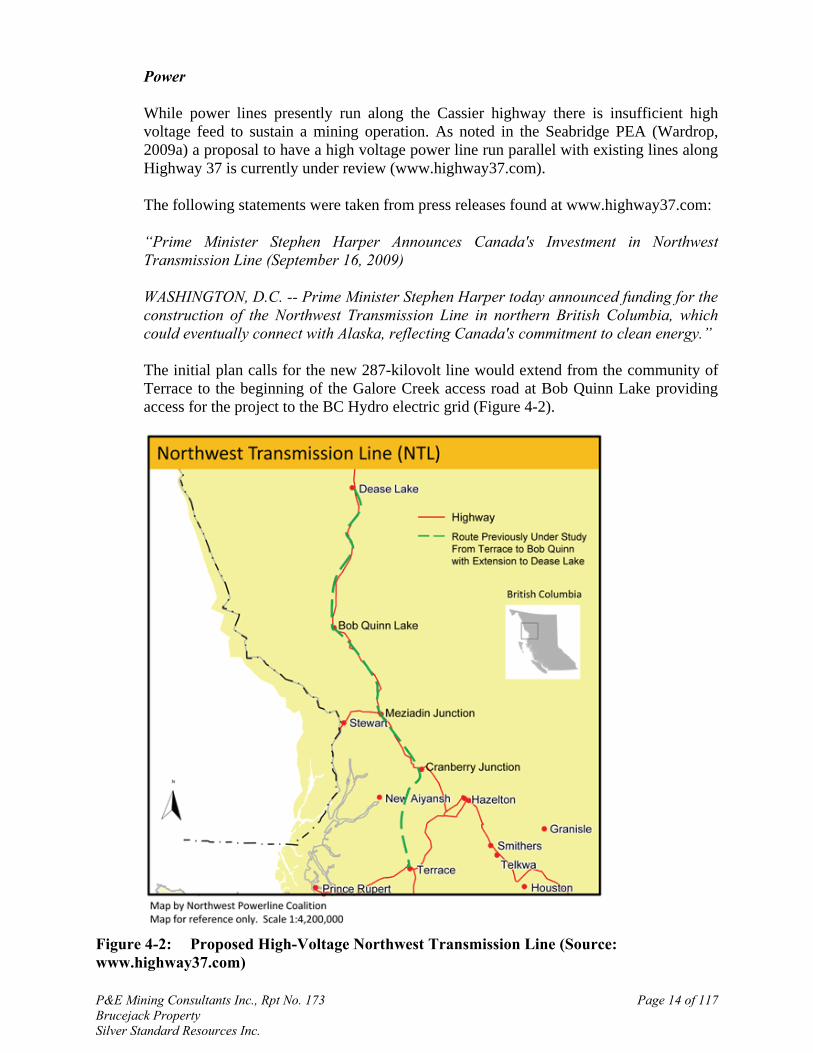
While power lines presently run along the Cassier highway there is insufficient high voltage feed to sustain a mining operation. As noted in the Seabridge PEA (Wardrop, 2009a) a proposal to have a high voltage power line run parallel with existing lines along Highway 37 is currently under review (www.highway37.com).
The following statements were taken from press releases found at www.highway37.com:
“Prime Minister Stephen Harper Announces Canada's Investment in Northwest Transmission Line (September 16, 2009)
WASHINGTON, D.C. -- Prime Minister Stephen Harper today announced funding for the construction of the Northwest Transmission Line in northern British Columbia, which could eventually connect with Alaska, reflecting Canada's commitment to clean energy.”
The initial plan calls for the new 287-kilovolt line would extend from the community of Terrace to the beginning of the Galore Creek access road at Bob Quinn Lake providing access for the project to the BC Hydro electric grid (Figure 4-2).
Figure 4-2: Proposed High-Voltage Northwest Transmission Line (Source:
www.highway37.com)

P&E Mining Consultants Inc., Rpt No. 173 Page 15 of 117 Brucejack Property Silver Standard Resources Inc.
4.4 PHYSIOGRAPHY
The Brucejack Property lies in the rugged Coastal Mountains of northwest BC, with elevations ranging from 520 m in Sulphurets Creek valley to over 2,300 m at the highest peaks. Characteristically, the rocky and rugged terrain is notable for the permanent ice fields which fill the upper reaches of most of the valleys. The glaciers have been retreating for at least the last several decades as shown in 1990 to 2008 air photos. Rough calculations suggest the Mitchell Glacier, for example, has retreated approximately one kilometre over the last two decades. The former Brucejack exploration camp was at 1,375 m elevation on a high plateau above the timberline and the lake is ice-bound most of the year. An underground mine portal formerly used for underground access and sampling of the West Zone is located near the campsite at 1,382 m elevation. The Sulphurets and Mitchell watersheds drain the Brucejack Property through the Unuk River, which flows westward through Alaska to the Pacific Ocean. The tree line lies at about 1,240 m above sea level (masl), below which a mature forest of mostly hemlock and balsam fir abruptly develops. Fish are not known to inhabit the Sulphurets and Mitchell watersheds. Large wildlife such as deer, moose, and caribou are rare due to the rugged topography and restricted access; however, bears and mountain goats are relatively common.
P&E Mining Consultants Inc., Rpt No. 173 Page 16 of 117 Brucejack Property Silver Standard Resources Inc.
5.0 HISTORY AND PREVIOUS EXPLORATION
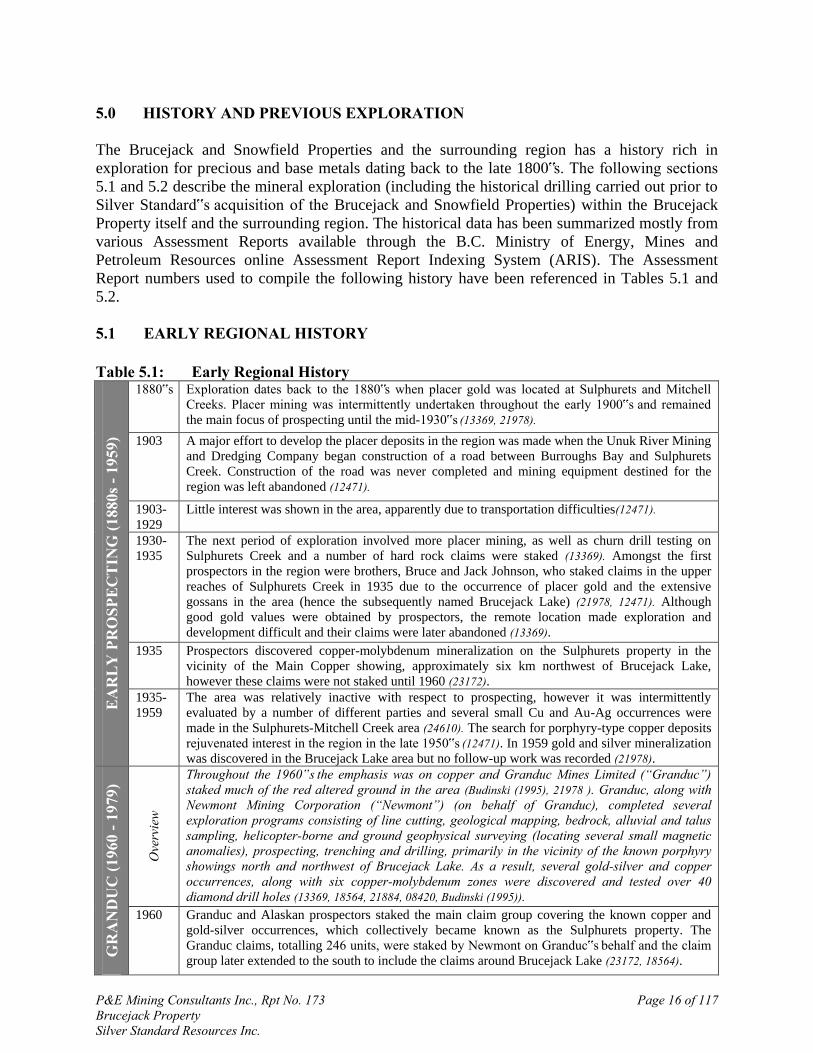
The Brucejack and Snowfield Properties and the surrounding region has a history rich in exploration for precious and base metals dating back to the late 1800‟s. The following sections 5.1 and 5.2 describe the mineral exploration (including the historical drilling carried out prior to Silver Standard‟s acquisition of the Brucejack and Snowfield Properties) within the Brucejack Property itself and the surrounding region. The historical data has been summarized mostly from various Assessment Reports available through the B.C. Ministry of Energy, Mines and Petroleum Resources online Assessment Report Indexing System (ARIS). The Assessment Report numbers used to compile the following history have been referenced in Tables 5.1 and 5.2. 5.1 EARLY REGIONAL HISTORY
Table 5.1: Early Regional History
EA
RL
Y P
RO
SPE
CT
ING
(188
0s -
1959
)
1880‟s Exploration dates back to the 1880‟s when placer gold was located at Sulphurets and Mitchell Creeks. Placer mining was intermittently undertaken throughout the early 1900‟s and remained the main focus of prospecting until the mid-1930‟s (13369, 21978).
1903 A major effort to develop the placer deposits in the region was made when the Unuk River Mining and Dredging Company began construction of a road between Burroughs Bay and Sulphurets Creek. Construction of the road was never completed and mining equipment destined for the region was left abandoned (12471).
1903-1929
Little interest was shown in the area, apparently due to transportation difficulties(12471).
1930-1935
The next period of exploration involved more placer mining, as well as churn drill testing on Sulphurets Creek and a number of hard rock claims were staked (13369). Amongst the first prospectors in the region were brothers, Bruce and Jack Johnson, who staked claims in the upper reaches of Sulphurets Creek in 1935 due to the occurrence of placer gold and the extensive gossans in the area (hence the subsequently named Brucejack Lake) (21978, 12471). Although good gold values were obtained by prospectors, the remote location made exploration and development difficult and their claims were later abandoned (13369).
1935 Prospectors discovered copper-molybdenum mineralization on the Sulphurets property in the vicinity of the Main Copper showing, approximately six km northwest of Brucejack Lake, however these claims were not staked until 1960 (23172).
1935-1959
The area was relatively inactive with respect to prospecting, however it was intermittently evaluated by a number of different parties and several small Cu and Au-Ag occurrences were made in the Sulphurets-Mitchell Creek area (24610). The search for porphyry-type copper deposits rejuvenated interest in the region in the late 1950‟s (12471). In 1959 gold and silver mineralization was discovered in the Brucejack Lake area but no follow-up work was recorded (21978).
GR
AN
DU
C (1
960
- 197
9)
Ove
rvie
w
Throughout the 1960‟s the emphasis was on copper and Granduc Mines Limited (“Granduc”) staked much of the red altered ground in the area (Budinski (1995), 21978 ). Granduc, along with Newmont Mining Corporation (“Newmont”) (on behalf of Granduc), completed several exploration programs consisting of line cutting, geological mapping, bedrock, alluvial and talus sampling, helicopter-borne and ground geophysical surveying (locating several small magnetic anomalies), prospecting, trenching and drilling, primarily in the vicinity of the known porphyry showings north and northwest of Brucejack Lake. As a result, several gold-silver and copper occurrences, along with six copper-molybdenum zones were discovered and tested over 40 diamond drill holes (13369, 18564, 21884, 08420, Budinski (1995)).
1960 Granduc and Alaskan prospectors staked the main claim group covering the known copper and gold-silver occurrences, which collectively became known as the Sulphurets property. The Granduc claims, totalling 246 units, were staked by Newmont on Granduc‟s behalf and the claim group later extended to the south to include the claims around Brucejack Lake (23172, 18564).

P&E Mining Consultants Inc., Rpt No. 173 Page 17 of 117 Brucejack Property Silver Standard Resources Inc.
GR
AN
DU
C (1
960
- 197
9)
1961 Granduc drilled 224 m of packsack core in 32 holes at four locations to test the extent of the known Cu showings. Additional prospecting resulted in the discovery of Au-Ag mineralization in the Hanging Glacier area and moly on the south side of Mitchell Glacier (21884).
1963 R.V. Kirkham completed a M.Sc. thesis on the geology of the region (13369, 14614). 1968 E.W. Grove compiled a regional geological study of the area (13369, 14614).
Bondar-Clegg & Company Ltd. carried out an orientation geochemical survey over part of the Sulphurets property, including bedrock, stream sediment and talus fines samples. Samples were analysed for copper, lead, zinc, silver and molybdenum and results suggested that geochemical techniques could be used to indicate the presence of ore grade mineralization (05416).
Granduc drilled 1016 m over six holes on the Main Copper Zone and mapped the area below the Hanging Glacier (21884). Two drill holes totalling 711.12 m were drilled on the Quartz Stockwork Zone, a low-grade porphyry type moly showing in the centre of the Snowfield Property. Results revealed extensive anomalous but low grade Au values with no significant base metal values (23172).
1970s Granduc continued exploration, conducting further geological mapping, lithogeochemical sampling, trenching and diamond drilling on known base and precious metal targets north and northwest of Brucejack Lake. The emphasis was on molybdenum from 1975 to 1977 (Budinski (2001), 13369).
1973 E.W. Grove completed a graduate thesis on the region (13369, 14614). 1974-1975
Granduc carried out bedrock geochemical sampling and geological reconnaissance and prospecting throughout much of the property (08420). Program of bedrock sampling found to reliably reflect major fault structures and, less reliably, the occurrence of copper minerals (05416). An expanded rock geochemistry grid indicated high values in precious metals south of the Hanging Glacier and along the Brucejack Fault zone (15370).
1976 The 14 unit Red River claim group located northwest of Brucejack Lake, was staked to cover the Brucejack Fault zone and adjacent areas was explored by soil and rock sampling, trenching, prospecting and geological mapping. Zones of shearing and sericite-pyrite-quartz alteration were shown to contain anomalous silver and gold and two samples (one bedrock and one float) of native gold were found by E.R. Kruchkowski (06255, 15370 ).
Granduc expanded its rock geochemistry survey grid south of Brucejack Lake and in the north-eastern portion of the Sulphurets Creek project area (15370). Granduc completed petrographic analysis of rocks in the Mitchell and Sulphurets Creek areas (05958). Seven bedrock trenches were excavated in the vicinity of the south side of Mitchell Glacier (06066). The Iron Cap 1, 2 and 3 claims were staked to assure adequate coverage of the possible north and east extensions of the potentially mineralized zone (06066).
ESS
O (1
980
- 198
5)
Ove
rvie
w
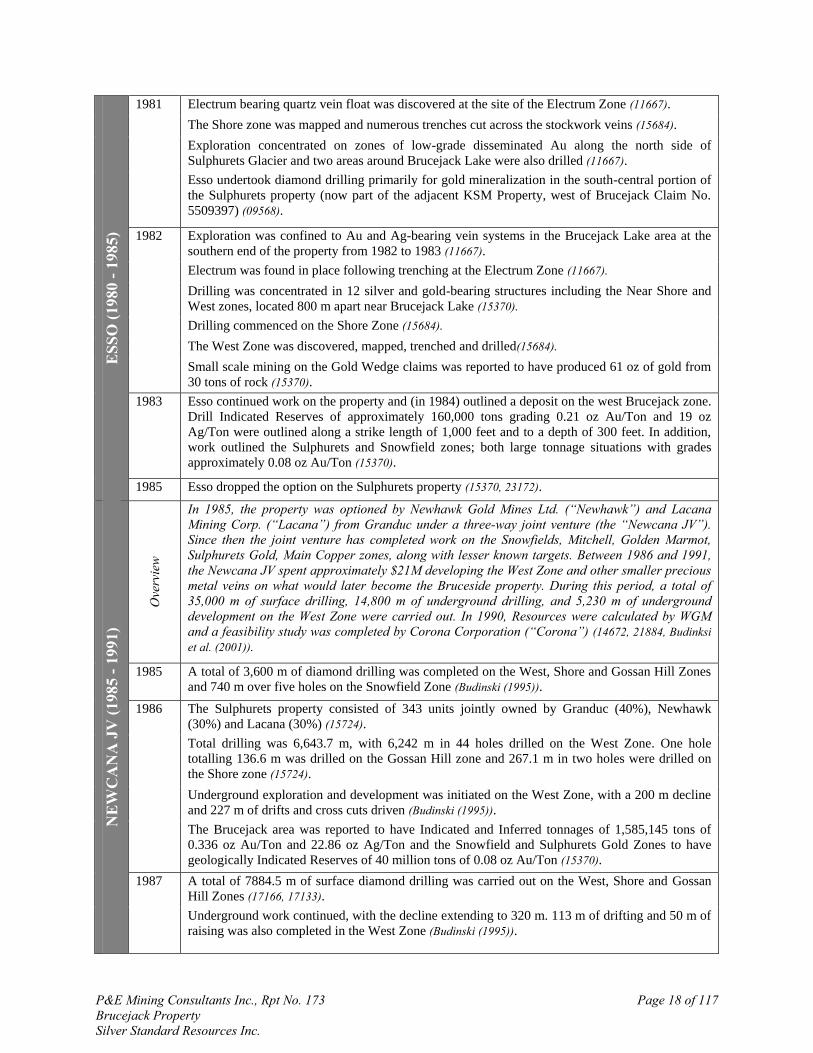
Esso Minerals Canada Limited (“Esso”) optioned the property from Granduc in 1980 and subsequently completed an extensive program consisting of mapping, trenching and geochemical sampling that resulted in the discovery of several showings including the Snowfields, Shore, West and Galena zones. Total expenditure on exploration for large porphyry copper-molybdenum, copper-gold and bulk mineable gold deposits between 1980 and 1985, before Esso surrendered its interest, exceeded two million dollars. A total of 8,230 m of diamond drilling was carried out on the property to the end of 1984 (21884, 12471, Budinski (1995)).
1980 Esso optioned the entire Sulphurets property from Granduc (21884). The Gold Wedge claim was staked between Tedray 12 and Red River claims(15370). Gold was discovered on the peninsula at Brucejack Lake near the Shore Zone (14672). Esso flew an air photo survey of the property (08420). Exploration concentrated on Mo and Mo-Cu-Au-Ag areas and quartz-pyrite-Au-Ag veins in the north-eastern portion of the property (11667).
P&E Mining Consultants Inc., Rpt No. 173 Page 18 of 117 Brucejack Property Silver Standard Resources Inc.
ESS
O (1
980
- 198
5)
1981 Electrum bearing quartz vein float was discovered at the site of the Electrum Zone (11667). The Shore zone was mapped and numerous trenches cut across the stockwork veins (15684). Exploration concentrated on zones of low-grade disseminated Au along the north side of Sulphurets Glacier and two areas around Brucejack Lake were also drilled (11667). Esso undertook diamond drilling primarily for gold mineralization in the south-central portion of the Sulphurets property (now part of the adjacent KSM Property, west of Brucejack Claim No. 5509397) (09568).
1982 Exploration was confined to Au and Ag-bearing vein systems in the Brucejack Lake area at the southern end of the property from 1982 to 1983 (11667). Electrum was found in place following trenching at the Electrum Zone (11667). Drilling was concentrated in 12 silver and gold-bearing structures including the Near Shore and West zones, located 800 m apart near Brucejack Lake (15370). Drilling commenced on the Shore Zone (15684). The West Zone was discovered, mapped, trenched and drilled(15684). Small scale mining on the Gold Wedge claims was reported to have produced 61 oz of gold from 30 tons of rock (15370).
1983 Esso continued work on the property and (in 1984) outlined a deposit on the west Brucejack zone. Drill Indicated Reserves of approximately 160,000 tons grading 0.21 oz Au/Ton and 19 oz Ag/Ton were outlined along a strike length of 1,000 feet and to a depth of 300 feet. In addition, work outlined the Sulphurets and Snowfield zones; both large tonnage situations with grades approximately 0.08 oz Au/Ton (15370).
1985 Esso dropped the option on the Sulphurets property (15370, 23172).
NE
WC
AN
A J
V (1
985
- 199
1)
Ove
rvie
w
In 1985, the property was optioned by Newhawk Gold Mines Ltd. (“Newhawk”) and Lacana Mining Corp. (“Lacana”) from Granduc under a three-way joint venture (the “Newcana JV”). Since then the joint venture has completed work on the Snowfields, Mitchell, Golden Marmot, Sulphurets Gold, Main Copper zones, along with lesser known targets. Between 1986 and 1991, the Newcana JV spent approximately $21M developing the West Zone and other smaller precious metal veins on what would later become the Bruceside property. During this period, a total of 35,000 m of surface drilling, 14,800 m of underground drilling, and 5,230 m of underground development on the West Zone were carried out. In 1990, Resources were calculated by WGM and a feasibility study was completed by Corona Corporation (“Corona”) (14672, 21884, Budinksi et al. (2001)).
1985 A total of 3,600 m of diamond drilling was completed on the West, Shore and Gossan Hill Zones and 740 m over five holes on the Snowfield Zone (Budinski (1995)).
1986 The Sulphurets property consisted of 343 units jointly owned by Granduc (40%), Newhawk (30%) and Lacana (30%) (15724). Total drilling was 6,643.7 m, with 6,242 m in 44 holes drilled on the West Zone. One hole totalling 136.6 m was drilled on the Gossan Hill zone and 267.1 m in two holes were drilled on the Shore zone (15724). Underground exploration and development was initiated on the West Zone, with a 200 m decline and 227 m of drifts and cross cuts driven (Budinski (1995)). The Brucejack area was reported to have Indicated and Inferred tonnages of 1,585,145 tons of 0.336 oz Au/Ton and 22.86 oz Ag/Ton and the Snowfield and Sulphurets Gold Zones to have geologically Indicated Reserves of 40 million tons of 0.08 oz Au/Ton (15370).
1987 A total of 7884.5 m of surface diamond drilling was carried out on the West, Shore and Gossan Hill Zones (17166, 17133). Underground work continued, with the decline extending to 320 m. 113 m of drifting and 50 m of raising was also completed in the West Zone (Budinski (1995)).

P&E Mining Consultants Inc., Rpt No. 173 Page 19 of 117 Brucejack Property Silver Standard Resources Inc.
NE
WC
AN
A J
V (1
985
- 199
1)
1987 A total of 10,670 m of surface drilling was carried out on the West, Shore and Gossan Hill zones and a total of 7,900 m of underground diamond drilling was completed on the West Zone (Budinski (1995)). Other activities carried out in the Brucejack Lake area included the building of a temporary winter access road, metallurgical testing, environmental baseline studies and preliminary mineral inventory estimates, along with the submittal of a Prospectus to the British Columbia Government (Budinski (1995)).
1988 Reverse takeover resulting in Newhawk acquiring Lacana's 30% interest in the Sulphurets project (The Northern Miner (November 16, 1987)). The decline at the West Zone was advanced 540 m and approximately 1,200 m of drifting and 780 m of raising were completed (Budinski (1995)). 7,500 m of surface and underground diamond drilling was carried out on the West Zone and 1,950 m of surface drilling at the Shore and Gossan Hill zones (Budinski (1995)). The road was improved from Bowser Lake to the Knipple and Brucejack Camps (Budinski (1995)). Geological Reserves were estimated for the West Zone (Budinski (1995)). Newhawk considered an overall evaluation necessary for the systematic development of the Sulphurets property. Consequently, the field program returned to as many areas of known mineralization and geochemical anomalies as possible in order to establish evaluation priorities (18564). Prospecting was successful in relocating most of the gold showings reported in the old reports (18564). A new area called the Golden Marmot Area was also discovered, containing at least five prospective mineralized quartz stockwork zones, four with high silver values (18564).
1989 Underground development continued at the West Zone with a total of 1,800 m of underground workings. The decline was extended down to 1,150 m elevation and 4,880 m of surface and 14,000 m of underground drilling was carried out (Budinski (1995)). Other work on the property included detailed surface mapping, sampling on other mineral occurrences and condemnation drilling for mill site and dam site (Budinski (1995)). Geological Reserves were estimated and reviewed by consultants and a Stage 1 Environmental and Socioeconomic Impact Assessment report was submitted to Provincial agencies (Budinski (1995)). Newhawk and Corona (Newhawk‟s largest shareholder) completed a program consisting of grid emplacement and rock sampling over the Snowfield Gold Zone to further define the zone. This led to the discovery of the Coffee Pot Zone; a gold-silver bearing quartz vein system of limited size located 800 m northwest of the Gold Zone (23172).
Placer Dome Inc. (“Placer Dome”) acquired 99% of the outstanding shares of Sulphurets Gold Corporation (19541).
1990 Based on the favourable West Zone underground drifting and drill results, Corona completed a feasibility study in 1990. This study established a Reserve Estimate containing Proven and Probable Reserves of 826,000 Tons grading 0.450 opt Au and 18.80 opt Ag with an additional 92.276 Tons grading 0.371 opt Au, and 4.63 opt Ag outlined on the nearby Shore Zone (Watts, Griffis and McOuat, 1990).
5,500 m of underground diamond drilling completed on the West Zone. Computerized Reserves calculated by Gemcom and conventional Mineral Reserve Estimate by Watts, Griffis and McOuat. Updated Mineral Reserve Estimate by Newhawk based on new drilling (Budinski (1995)).
1991 Grab samples from the Bridge zone returned values of up to 0.114 opt Au and 0.122 opt for the Quartz Hill Zone (22636). Trenching, sampling and mapping was carried out on several targets north of the West Zone and 1,200 m over six surface diamond drillholes were completed on the Shore Zone (www.infomine.com). A combined helicopter-borne magnetic, electromagnetic, VLF and radiometric survey was carried out over the entire Sulphurets property (Budinski (1995)).

P&E Mining Consultants Inc., Rpt No. 173 Page 20 of 117 Brucejack Property Silver Standard Resources Inc.
5.2 RECENT PROPERTY HISTORY
Table 5.2: Recent Property History
NE
WH
AW
K -
GR
AN
DU
C (B
LAC
K H
AW
K) J
V (1
991-
1996
)
Ove
rvie
w
From 1991 to 1992, Newhawk officially subdivided the Suphurets claim group into the Sulphside and Bruceside properties and optioned the Sulphside property (including Sulphurets and Mitchell Zones) to Placer Dome. Throughout the period from 1991 to 1994, joint venture exploration continued on the Sulphurets-Bruceside property, including property-wide scaled trenching, mapping, airborne surveys, and surface drilling evaluating various surface targets including the Shore, Gossan Hill, Galena Hill, Maddux and SG Zones. 57 drill holes were completed on the property, totalling 12,974 m (23609, Budinski et al. (2001)).
1991 Six holes were drilled at the Shore zone, totalling 1,200 m, to test its continuity and to determine its relationship to the West and R-8 Zones. Results varied from 37 g/t Au over 1.5 m to 13 g/t Au over 4.9 m (www.infomine.com).
1992 Newhawk purchased Granduc‟s interest in the Snowfield Property in early 1992 (23172). Prospecting, mapping, trenching, geochemical surveys were carried out on 13 known targets, as well as on a regional scale, with 17 new mineral occurrences discovered (Budinski (1995)). Mapping and sampling was undertaken at the Quartz Hill and Bridge Zones, including 22 hand sawn trenches (totalling 68.3 m) at the Quartz Hill Zone (22636). North Bruce group exploration was successful in discovering the SG zone (22657). Follow up evaluation of the SG Zone consisted of mapping, backhoe trenching (275.16 m over 18 trenches) and sampling (319 trench and 20 grab samples). Channel samples from 10 trenches along a 130 m strike averaged 20.7 g/t Au and 38.4 g/t Ag over 3 m (22657). The Tommy Knocker Zone was discovered with a grab sample from one vein returning up to 410 g/t Au and 4,050 g/t Ag (www.infomine.com). Preliminary engineering evaluation by Westmin Resources (“Westmin”) determined the feasibility of processing West Zone ore through Westmin's Premier Mill (www.infomine.com).
1993 Exploration was carried out on 17 zones, including mapping, prospecting, channel sampling and drilling (on five of the zones) in order to evaluate zones of known gold-silver mineralization with the potential for near surface Reserves (Budinski (1995)). A total of 4,120 m was drilled over 31 holes and geological Resources were calculated for four of the five drilled zones, including the Gossen Hill, SG and Galena Hill Zones. Values ranged from 4.7 g/t Au to 374.8 g/t Au and 6.5 g/t Ag to 640.2 g/t Ag (Budinski (1995), www.infomine.com)). 11 BQ-sized drill holes, totalling 1,626 m in length, were completed at Galena Hill (23170). Seven holes, totalling 874 m, were drilled at the SG Zone to test an 80 m channel-sampled segment of the zone at down-dip depths ranging from 25-120 m (23169).
1994 Exploration in the Brucejack area consisted of detailed mapping and sampling in the vicinity of the Gossan Hill zone, and 7351.5 m of diamond drilling (over 20 holes), primarily on the West, R8, Shore and Gossan Hill zones. Mapping, trenching and drilling of the highest priority targets was conducted on ten of the best deposits (including the West Zone). Significant mineralization was intersected at the Tommy Knocker, West and R8 Zones, whereas drilling at depth in the Gossan Hill, Big Sheep, Grace, Coogan's Bluff, Bielecki and Shore zones failed to intersect significant mineralization (23613, www.infomine.com). A total of 2,790 m was drilled on the West Zone over eight holes and a total of 4,564 m over 12 holes was drilled on six other zones (Budinski (1995)).
1995 No exploration or development work was conducted in the Brucejack Property (Budinski et al. 2001)). Environmental monitoring, road reclamation and seeding was undertaken (Budinski (1995)).
1996 Granduc merged with Black Hawk Mining Inc. to form the new Black Hawk Mining Inc. (“Black Hawk”) (The Northern Miner (February 26, 1996).
1997 - 1998
No exploration or development work was carried out in the Brucejack Property from 1997 – 1998 (Budinski et al. (2001)).

P&E Mining Consultants Inc., Rpt No. 173 Page 21 of 117 Brucejack Property Silver Standard Resources Inc.
SIL
VE
R S
TAN
DA
RD
(199
9-20
08)
Ove
rvie
w No exploration or development work was carried out in the Brucejack Property during the
period from 1999 to 2008 (Budinksi et al. (2001), Silver Standard Annual Reports (1999 – 2008)).
1999 Silver Standard acquired Newhawk and with it Newhawk's 60% interest and control of the Brucejack Property (www.infomine.com).
The camp and waste-rock dumps were reclaimed (Budinski et al. (2001)). 2001 Silver Standard entered into an agreement with Black Hawk whereby Silver Standard acquired
Black Hawk‟s 40% direct interest in the Brucejack Property, resulting in 100% interest in the Property. In addition, Silver Standard agreed to pay Black Hawk a net smelter return royalty of 1.2% on production in excess of the then current Resources of silver and gold already outlined on the Property (Silver Standard News Release, dated May 2, 2001).

P&E Mining Consultants Inc., Rpt No. 173 Page 22 of 117 Brucejack Property Silver Standard Resources Inc.
5.3 HISTORICAL RESOURCE ESTIMATES Since the early 1980‟s, various preliminary Resource and Reserve Estimates have been completed for the Brucejack Property deposits and subsequently referred to in assorted property reports. Table 5.3 below summarizes these historical Estimates. It should be noted that the Resource Estimates dated prior to the enactment of NI 43-101 in 2001 do not comply with the regulations set forth by that act and should not be relied upon.
Table 5.3: Summary of Historical Resource and Reserve Estimates
Year Mineralized
Zone Stated Category Ton Millions
Au oz
Ag oz
Au oz Millions
Ag oz Millions
Carried Out By
Source of Information
1984 West
Brucejack Zone
Ind. Reserves 0.16 0.21 19.00 0.03 3.0 Not stated AR# 15370
1986 Brucejack area Ind. + Inf. Reserves 1.59 0.34 22.86 0.53 36.2 Not stated AR# 15370
1989 West Zone Prov. + Prob. Reserves 0.22 0.33 22.77 0.07 4.9 Cominco
Eng. PAH (2001)
1989 West Zone Prov. + Prob. Reserves 0.72 0.43 19.70 0.31 14.1 WGM Burk (2009)
1990 West Zone Prov. + Prob.
Reserves 0.83 0.45 18.80 0.37 15.5 Corona WGM (1990)
Shore Zone Prov. + Prob. Reserves 0.00 0.37 4.63 0.00 0.0
1991 West Zone Not Stated 0.55 0.42 18.00 0.23 9.9 Not stated The Northern Miner (1990)
1995 5 Satellite Zones Resource 0.20 0.57 3.95 0.11 0.8 Not stated Budinski (1995)
1996 Sulphurets Resource 0.92 0.44 17.38 0.41 16.0 Not stated Black Hawk (1996)
1997 West Zone Resource 0.83 0.45 18.78 0.37 15.5
Not stated Black Hawk (1997) Satellite Zones Resource 0.20 0.57 3.94 0.11 0.8
1999 West Zone Resource 0.83 0.45 18.80 0.37 15.5
Not stated Silver Standard (1999) 4 Satellite
Zones Resource 0.20 0.57 3.95 0.11 0.8
2000 Sulphurets
Meas. + Ind. Resources 1.14 0.37 15.10 0.42 17.2
PAH Silver Standard (2000) Inferred
Resources 0.15 0.54 5.00 0.08 0.8
2004* Sulphurets
Meas. + Ind. Resources 1.14 0.84 33.59 0.42 17.2
PAH Silver Standard (2004) Inferred
Resources 0.15 0.54 5.00 0.08 0.8
2006* Sulphurets
Meas. + Ind. Resources 1.14 0.84 33.59 0.42 17.2
PAH Silver Standard (2006) Inferred
Resources 0.15 0.54 5.00 0.08 0.8
The reader is cautioned that the above listed Reserve and Resource Estimates dated prior to 2001 are not NI 43-101 compliant and that all Estimates (including those subsequent to 2001) have since been superseded by the 2009 P&E NI 43-101 compliant Resource Estimates for the Brucejack Property, as described in Section 16 of this report. * Although these Resource Estimates were reported as being in compliance with NI 43-101 regulations, the reader is cautioned that P&E has not completed sufficient work to verify their status as being NI 43-101 compliant.
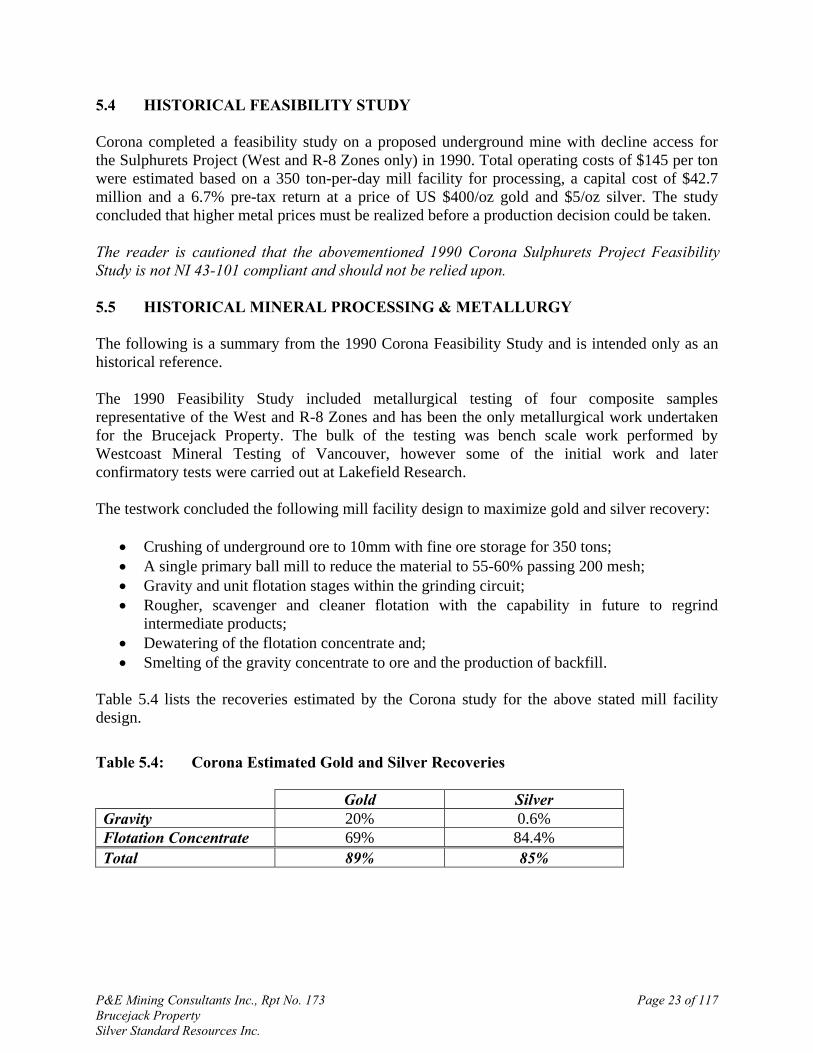
P&E Mining Consultants Inc., Rpt No. 173 Page 23 of 117 Brucejack Property Silver Standard Resources Inc.
5.4 HISTORICAL FEASIBILITY STUDY
Corona completed a feasibility study on a proposed underground mine with decline access for the Sulphurets Project (West and R-8 Zones only) in 1990. Total operating costs of $145 per ton were estimated based on a 350 ton-per-day mill facility for processing, a capital cost of $42.7 million and a 6.7% pre-tax return at a price of US $400/oz gold and $5/oz silver. The study concluded that higher metal prices must be realized before a production decision could be taken. The reader is cautioned that the abovementioned 1990 Corona Sulphurets Project Feasibility Study is not NI 43-101 compliant and should not be relied upon. 5.5 HISTORICAL MINERAL PROCESSING & METALLURGY
The following is a summary from the 1990 Corona Feasibility Study and is intended only as an historical reference. The 1990 Feasibility Study included metallurgical testing of four composite samples representative of the West and R-8 Zones and has been the only metallurgical work undertaken for the Brucejack Property. The bulk of the testing was bench scale work performed by Westcoast Mineral Testing of Vancouver, however some of the initial work and later confirmatory tests were carried out at Lakefield Research. The testwork concluded the following mill facility design to maximize gold and silver recovery:
Crushing of underground ore to 10mm with fine ore storage for 350 tons; A single primary ball mill to reduce the material to 55-60% passing 200 mesh; Gravity and unit flotation stages within the grinding circuit; Rougher, scavenger and cleaner flotation with the capability in future to regrind
intermediate products; Dewatering of the flotation concentrate and; Smelting of the gravity concentrate to ore and the production of backfill.
Table 5.4 lists the recoveries estimated by the Corona study for the above stated mill facility design.
Table 5.4: Corona Estimated Gold and Silver Recoveries
Gold Silver Gravity 20% 0.6% Flotation Concentrate 69% 84.4% Total 89% 85%

P&E Mining Consultants Inc., Rpt No. 173 Page 24 of 117 Brucejack Property Silver Standard Resources Inc.
6.0 GEOLOGICAL SETTING
6.1 REGIONAL GEOLOGY
The regional geology of the area has previously been described by Grove (1971, 1986), Alldrick (1989), Britton and Alldrick (1987), Alldrick and Britton (1988), Britton (1989), Roach and MacDonald (1992), McPherson, et al., (1994) and Savell (2008) and has been summarized as follows. Silver Standard‟s Brucejack Property is situated along the western margin of British Columbia‟s Intermontane Belt which extends from the Alaska-Yukon border southwards to the Chilcotin region in the southern part of the province and is underlain by rocks belonging to the allocthonous litho-tectonic terrane of Stikinia (Figure 6-1). Stikinia is composed of volcano-sedimentary oceanic island arc terranes that likely evolved in the east Pacific of the northern hemisphere from Carboniferous to Early Jurassic time (320-190 Ma). It is the largest of several fault bounded, allochthonous terranes within the Intermontane Belt that lies between the post-accretionary, Tertiary intrusives of the Coast Belt and the continental margin sedimentary prisms of the Rocky Mountain Belt. Mesozoic plate tectonics resulted in the arc being transported northeastwards and eventually accreted to the Paleozoic basement of the ancestral North American continent sometime during the Middle Jurassic. Arc-related magmatic activity in the terrane then continued from the Middle Jurassic into the Tertiary. During the Late Jurassic and Cretaceous, a broad sedimentary basin formed east of the Brucejack Property where a thick sequence of epiclastic sediments accumulated, giving rise to the Bowser Group rock package. Regional compressional tectonism resulted in the formation of regional folds with arcuate, north- to northwest-trending traces. The Brucejack Property lies on the eastern limb of one of these major folds, the McTagg Anticlinorium. Folding is widespread throughout the region with the degree of folding ranging from the gently warped Hazelton Group andesitic tuffs and flows southeast of Brucejack Lake, to the more tightly folded sediments of the Salmon River Formation and Bowser Lake Group. Thrust faults cut the flanks of the regional folds resulting in large-scale stratigraphic repetition and inversion. One such thrust fault, the Sulphurets Fault has been mapped immediately northwest of the Silver Standard‟s Snowfield Property. This thrust fault dips gently to the west and is interpreted to be southeast-verging. Thrust faulting likely overlapped in time with the regional folding and together these structures represent products of the accretionary tectonism that occurred from the Late Triassic to at least the Late Jurassic. Britton and Alldrick (1988) described metamorphic conditions within the region to have been of at least of greenschist-grade, creating propylitic assemblages that include chloritized mafic minerals and saussuritized plagioclase. Alteration facies are described as being most pronounced in intermediate and mafic volcanic rocks. The region is underlain by Upper Triassic and Lower to Middle Jurassic Hazelton Group volcanic, volcaniclastic and sedimentary rocks, which have been intruded by Mesozoic

P&E Mining Consultants Inc., Rpt No. 173 Page 25 of 117 Brucejack Property Silver Standard Resources Inc.
Figure 6-1: Regional Tectonic Map (Source: Wardrop, 2009b)
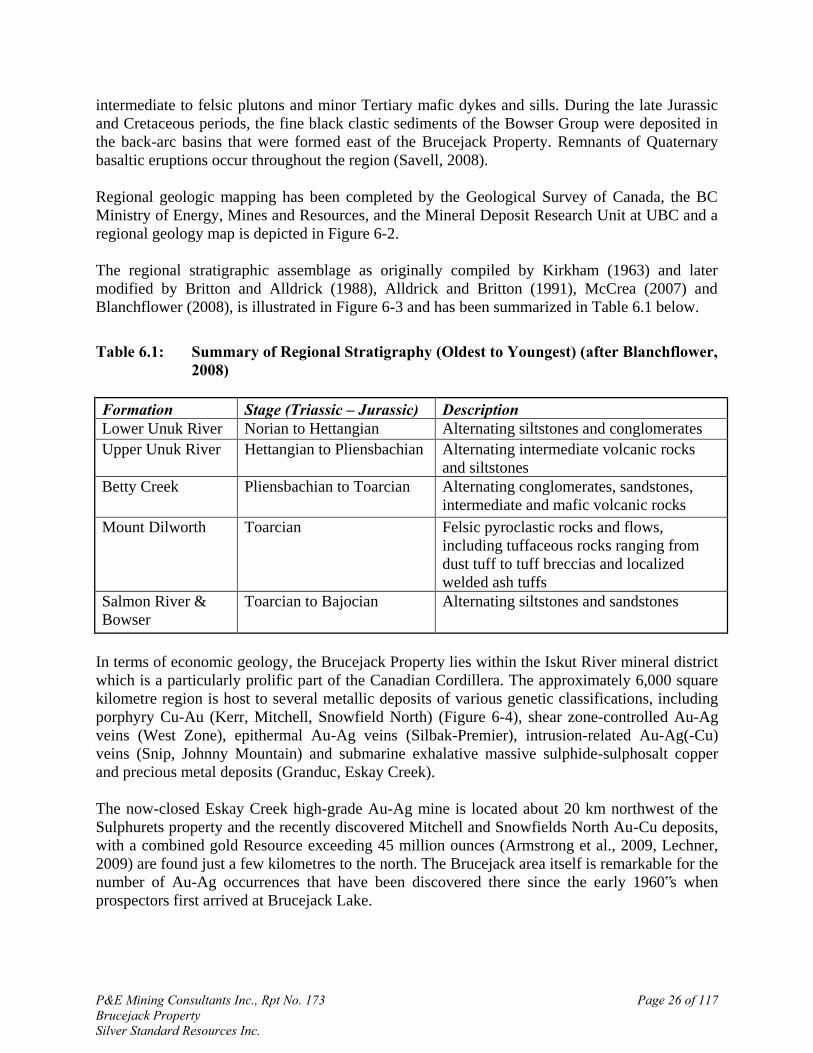
P&E Mining Consultants Inc., Rpt No. 173 Page 26 of 117 Brucejack Property Silver Standard Resources Inc.
intermediate to felsic plutons and minor Tertiary mafic dykes and sills. During the late Jurassic and Cretaceous periods, the fine black clastic sediments of the Bowser Group were deposited in the back-arc basins that were formed east of the Brucejack Property. Remnants of Quaternary basaltic eruptions occur throughout the region (Savell, 2008). Regional geologic mapping has been completed by the Geological Survey of Canada, the BC Ministry of Energy, Mines and Resources, and the Mineral Deposit Research Unit at UBC and a regional geology map is depicted in Figure 6-2. The regional stratigraphic assemblage as originally compiled by Kirkham (1963) and later modified by Britton and Alldrick (1988), Alldrick and Britton (1991), McCrea (2007) and Blanchflower (2008), is illustrated in Figure 6-3 and has been summarized in Table 6.1 below.
Table 6.1: Summary of Regional Stratigraphy (Oldest to Youngest) (after Blanchflower,
2008)
Formation Stage (Triassic – Jurassic) Description Lower Unuk River Norian to Hettangian Alternating siltstones and conglomerates Upper Unuk River Hettangian to Pliensbachian Alternating intermediate volcanic rocks
and siltstones Betty Creek Pliensbachian to Toarcian Alternating conglomerates, sandstones,
intermediate and mafic volcanic rocks Mount Dilworth Toarcian Felsic pyroclastic rocks and flows,
including tuffaceous rocks ranging from dust tuff to tuff breccias and localized welded ash tuffs
Salmon River & Bowser
Toarcian to Bajocian Alternating siltstones and sandstones
In terms of economic geology, the Brucejack Property lies within the Iskut River mineral district which is a particularly prolific part of the Canadian Cordillera. The approximately 6,000 square kilometre region is host to several metallic deposits of various genetic classifications, including porphyry Cu-Au (Kerr, Mitchell, Snowfield North) (Figure 6-4), shear zone-controlled Au-Ag veins (West Zone), epithermal Au-Ag veins (Silbak-Premier), intrusion-related Au-Ag(-Cu) veins (Snip, Johnny Mountain) and submarine exhalative massive sulphide-sulphosalt copper and precious metal deposits (Granduc, Eskay Creek). The now-closed Eskay Creek high-grade Au-Ag mine is located about 20 km northwest of the Sulphurets property and the recently discovered Mitchell and Snowfields North Au-Cu deposits, with a combined gold Resource exceeding 45 million ounces (Armstrong et al., 2009, Lechner, 2009) are found just a few kilometres to the north. The Brucejack area itself is remarkable for the number of Au-Ag occurrences that have been discovered there since the early 1960‟s when prospectors first arrived at Brucejack Lake.

P&E Mining Consultants Inc., Rpt No. 173 Page 27 of 117 Brucejack Property Silver Standard Resources Inc.
Figure 6-2: Map of Regional Geology (Source: Silver Standard)

P&E Mining Consultants Inc., Rpt No. 173 Page 28 of 117 Brucejack Property Silver Standard Resources Inc.
Figure 6-3: Regional Stratigraphic Column (after Blanchflower, 2008)

P&E Mining Consultants Inc., Rpt No. 173 Page 29 of 117 Brucejack Property Silver Standard Resources Inc.
Figure 6-4: Regional Trendline Showing the Seabridge and American Creek Resources Properties in relation to the Brucejack
Property (Note: figure refers to the Bruceside Property, which is an historical term for the Brucejack Property) (Souce:
http://www.americancreek.com/images/trendline%208.jpg)

P&E Mining Consultants Inc., Rpt No. 173 Page 30 of 117 Brucejack Property Silver Standard Resources Inc.
6.2 PROPERTY GEOLOGY
The following description of the geology of the Brucejack Property was provided by Mr Ron Burk, Chief Geologist of Silver Standard in the form of an internal company report, dated December 9, 2009. Published descriptions of the regional geology of the Sulphurets Creek-Brucejack Lake area have been presented by the Geological Survey of Canada (Henderson et al., 1992; Kirkham, 1991; Anderson, 1989), geologists working for the British Columbia government (Britten and Alldrick, 1988; Alldrick et al., 1987; Grove, 1986) and by the Mineral Deposits Research Unit (“MDRU”) at the University of British Columbia (Lewis et al., 2001; Lewis, 2001). This body of work shows that the Brucejack Property is underlain by Upper Triassic volcaniclastic and epiclastic sedimentary rocks of the Stuhini Group and Lower to Middle Jurassic volcanic, volcaniclastic and sedimentary rocks of the Hazelton Group. Since the Brucejack Property occurs within the eastern limb of the McTagg anticlinorium, the stratigraphic sequences recognized on the Brucejack and Snowfield Properties overall become younger to the east (Figure 6-5). The oldest rocks, found at lower elevations immediately east of the Sulphurets glacier, consist of heterolithic volcaniclastic conglomerate which is conformably overlain by a sequence of interbedded mudstone, sandstone and thin limestone units of the Stuhini Group. An angular unconformity marks the contact between the Stuhini Group sedimentary rocks and medium- to coarse-grained sandstones of the Jack Formation which is the basal formation of the Hazelton Group roughly and is dated at about 196 Ma. Open folding and probable thrust faulting has also placed a wedge of Jack Formation sandstones and conglomerates at the western end of Brucejack Lake where these rocks are well exposed on a peninsula known as Windy Point. Using the revised Hazelton Group stratigraphy presented in MDRU‟s Special Publication Number 1 (Lewis et al., 2001), the Jack Formation sedimentary rocks are overlain by a 10-50 m thick unit of mudstone/argillite and cherty argillite that belongs to the Unuk River Member of the Betty Creek Formation. This argillaceous unit is exposed along the southwest side of the West Zone deposit of shear-hosted, Au-Ag quartz veins and stockworks and has been traced southwards through the western part of the Galena Hill Au-Ag prospect. Overlying the argillite unit is a greater than 500 meter-thick package of hornblende and plagioclase-phyric andesitic flows, flow breccias and intermediate tuffaceous rocks intercalated with volcaniclastic conglomerates, sandstones and siltstones. These rocks form the bulk of the Unuk River Member in the Brucejack Property and outcrop extensively within a northwest-trending belt that passes beneath Brucejack Lake. The andesites of the Unuk River Member are the most important host rocks to Au- and Ag-bearing quartz veins discovered in the Brucejack area and have been affected by widespread hydrothermal alteration, mainly quartz-sericite-pyrite (eg. Gossan Hill, Galena Hill). U-Pb geochronology and biochronology done by MDRU geoscientists has determined the age of the Unuk River Member volcanics to be in the range of 196 to 194 Ma. Still higher in the Hazelton Group stratigraphy is a thick sequence of mainly dacitic pyroclastic rocks (tuff-breccia, lapilli tuff, crystal-lithic tuffs, minor ash tuff) and flows with thin argillite interbeds that are well exposed on the mountainside north of Brucejack Lake. Based on MDRU‟s

P&E Mining Consultants Inc., Rpt No. 173 Page 31 of 117 Brucejack Property Silver Standard Resources Inc.
Figure 6-5: Brucejack Property Geology Map Showing Simplified Geology & Mineralized Zones (Source: Silver Standard)

P&E Mining Consultants Inc., Rpt No. 173 Page 32 of 117 Brucejack Property Silver Standard Resources Inc.
studies and mapping, this predominantly felsic to intermediate volcanic package has been assigned to the Brucejack Lake Member of the Betty Creek Formation. (Prior to MDRU‟s project in the Iskut River region, these rocks were mapped as belonging to the Betty Creek Formation). A possible vent area for the tuffs and flows is a flow-dome complex identified just south of the east end of Brucejack Lake (Macdonald, 2001). Here, well developed subvertical flow-banding can be observed along with megacrystic flow-banded dacite, autobrecciated dacite and clast-supported blocky breccia with a hematitic mudstone matrix. Two U-Pb age dates have been obtained from flow-banded dacite and these show the flow-dome was emplaced 185.7 Ma. Several other U-Pb age dates obtained during the MDRU Iskut River project for rocks assigned to the Brucejack Lake Member indicate that the episode of intermediate to felsic volcanism in the Hazelton Group spanned 8-10 million years. Supracrustal rock units younger than the Brucejack Lake Member have not been reported from the Brucejack Property, although they could exist at the top of Mount John Walker on the north side of Brucejack Lake. In the area of the Eskay Creek Au-Ag mine, the youngest member of the Betty Creek Formation is the Treaty Creek Member which is a mixed sequence of sedimentary strata including sandstone, conglomerate, turbiditic siltstone and limestone. More importantly, the high-grade exhalative Au-Ag sulphide-sulphosalt deposits are associated with or hosted by units belonging to the Salmon River Formation which directly overlies the Treaty Creek Member. To date, rhyolite flows and carbonaceous mudstones that characterize the Salmon River Formation have not been identified in the Brucejack Property but should be explored for at the highest elevations of Mount John Walker. Apart from the high-level, synvolcanic intrusive dacite of the flow-dome complex mapped southeast of Brucejack Lake, there are three types of intrusions recognized in the Brucejack Property. The most common intrusive rock in the area consists of plagioclase- and hornblende-phyric to porphyritic rock of diorite to tonalite composition that forms two stocks found in the southern half of the claim group. Each intrusion has surface dimensions of roughly 700 m east-west by 700-1000 m north-south. A number of smaller bodies of the same rock are scattered around these two main intrusions. These intrusions have been referred to as “Sulphurets-type” intrusions and are considered to be broadly coeval with the andesite volcanics of the Unuk River Member in the Hazelton Group. A second type of intrusive rock forms an elongate body of about 700 m length, aligned north-south, that was emplaced along the western margin of one of the Sulphurets stocks. This intrusion is best described as potassium feldspar-plagioclase-hornblende porphyry and earlier workers have referred to it as a “two-feldspar” or “Premier-type” porphyry. Based on contact relationships it would appear that this intrusion is younger than the Sulphurets-type intrusions. The youngest intrusive rocks observed consist of medium to dark green, fine-grained andesite to basaltic andesite dikes that are generally less than two m in the thickness. These dikes tend to be north to northeast striking. In terms of structural geology, the lithologies found in the Brucejack Property display evidence of both ductile and brittle deformation. The oldest rocks, belonging to the Stuhini Group, are well exposed along the steep ravine of Brucejack Creek and are strongly folded with axial traces trending just west of north.
P&E Mining Consultants Inc., Rpt No. 173 Page 33 of 117 Brucejack Property Silver Standard Resources Inc.
The overlying Jack Formation epiclastic units are less intensely folded, with an open syncline being the dominant fold to have affected these rocks. A second syncline defined by units of the Jack Formation lies further to the east, with its NNW-SSE axial trace passing through the West Zone Au-Ag deposit. The Unuk River and Brucejack Lake Member lithologies of the Hazelton Group predominate in the eastern half of the Brucejack and Snowfield Properties and form a homoclinal rock package that dips moderately to steeply in an east to northeast direction. Penetrative fabrics are commonly developed in most lithologies. Rocks that appear to have experienced hydrothermal alteration prior to folding are generally the most intensely foliated. Shearing also appears to have occurred along structures that developed at relatively low angles to stratigraphic layering, with one example being the 140°-trending shear zone that hosts the mineralized quartz veins and stockworks of the West Zone deposit. Post-dating the folds and the development of penetrative fabrics are numerous brittle-ductile faults with different strike orientations and variable displacements. These structures can be readily observed as lineaments in aerial photographs of the Brucejack and Snowfield Properties. One of the most prominent of these late structures is the northerly trending Brucejack Fault which bisects the two main Sulphurets-type intrusions and continues for kilometres to the north crossing the entire Brucejack and Snowfield Properties. Mapping of contact displacements suggests that right-lateral movement of about 150 m has occurred along this major structure; an unknown but probably minor amount of vertical displacement has likely also occurred. Other well-defined lineaments/faults tend to strike northwest or, as seen on the southern slope of Mount John Walker, have north-easterly alignments.

P&E Mining Consultants Inc., Rpt No. 173 Page 34 of 117 Brucejack Property Silver Standard Resources Inc.
7.0 DEPOSIT TYPES
7.1 INTRODUCTION
A detailed description of epithermal mineralizing systems is provided by Taylor (2007) as his contribution to the most recent edition of the “Mineral Deposits of Canada”, Special Volume 5 published jointly by the Geological Association of Canada-Mineral Deposits Division and the Geological Survey of Canada. Much of the following material in this report section provides a brief overview of the subject that is synthesized from that publication.
Lindgren (1933) divided hydrothermal ore deposits, including those of gold and silver, into thermal types such as epithermal, mesothermal, and hypothermal. Lindgren fully recognized that his scheme also applied in a qualitative way to the depths in the Earth's crust at which various types of deposits form and it is this aspect of his classification scheme which has persisted to the present day. Thus, epithermal gold deposits are those for which there is evidence of a shallow crustal origin (less than 1 or 2 km), mesothermal deposits are those inferred to have formed at 1 to 3 km, and hypothermal deposits at 3 km to more than 5 km. The depth ranges implied for each of the three types are not firmly fixed but are guidelines that reflect variations in lithostatic pressure, fluid pressure, crustal temperature and metamorphic facies transitions, availability of meteoric fluids, and the vertical extent of brittle and ductile fields of deformation and seismicity (Poulsen, 1995). Deep epithermal (or shallow mesothermal) veins ("transitional" deposits of Panteleyev, 1986) provide an example of the extended depth of formation currently included in the broad sense of epithermal. These transitional deposits are often referred to as intrusion-related vein deposits and occur in the Sulphurets, Mt. Washington, and Zeballos camps, all in British Columbia. (Anon., 1992 B.C. MINFILE; Margolis, 1993). The Brucejack and Snowfield Properties and surrounding properties in the Kerr-Sulphurets region host extensive mineralization and associated alteration systems that were undoubtedly developed as a result of hydrothermal activity focused on hypabyssal, Early Jurassic intermediate, porphyritic intrusions. While deposits such as Snowfield, Kerr and Mitchell are probably best described as gold-enriched copper porphyry systems, most if not all of the mineralization in the Brucejack Property (West, Bridge, Galena Hill, Shore, SG, Gossan Hill and Mammoth Zones) have been classified as Epithermal Au-Ag-Cu, Low-Sulphidation Deposits (UBC deposit model No. H04): It is possible that some of the mineralization also displays characteristics of intrusion related vein systems that fall within the Intermediate-Sulphidation epithermal subtype of Hedenquist et al. (2000). Amongst the Brucejack gold and silver deposits, the West Zone has received the most exploration work to-date and accordingly can be considered somewhat typical of the general style of mineralization displayed by the various mineralizing systems comprising the Brucejack Property. Budinski et al., (2001) characterize the mineralization in the West Zone as a structurally controlled, complex vein/breccia system related to the Brucejack Fault lying to the immediate west. Like the other Brucejack Property deposits it is considered to fit the epithermal high-grade, intermediate to low-sulphidation, Au-Ag model. Other examples in B.C. include the Blackdome and Silbak-Premier Mines.

P&E Mining Consultants Inc., Rpt No. 173 Page 35 of 117 Brucejack Property Silver Standard Resources Inc.
7.2 EPITHERMAL GENETIC MODEL
7.2.1 INTRODUCTION
Simplified Definition Epithermal deposits of Au (+/- Ag) are a type of lode gold deposit that comprises veins and disseminations near the Earth‟s surface (≤1.5 km), in volcanic and volcaniclastic sedimentary rocks, sediments, and, in some cases, also in metamorphic rocks. The deposits may be found in association with hot springs and frequently occur at centres of young volcanism. The ores are dominated primarily by precious metals (Au, Ag) but some deposits may also contain variable amounts of base metals such as Cu, Pb and Zn. Epithermal Sub-Systems Epithermal Au deposits are distinguished on the basis of the sulphidation state of the sulphide mineralogy as belonging to one of three subtypes Hedenquist et al. (2000):
high sulphidation: previously called quartz-(kaolinite)-alunite, alunite-kaolinite, enargite-Au, or high-sulphur deposits: (Ashley, 1982; Hedenquist, 1987; Bonham, 1988) these highly acidic deposits usually occur close to magmatic sources of heat and volatiles and form from acidic hydrothermal fluids containing magmatic S, C, and Cl;
intermediate sulphidation: Some deposits with mostly low-sulphidation characteristics have sulphide ore mineral assemblages that represent a sulphidation state between that of high-sulphidation and low-sulphidation deposits. Such deposits tend to be more closely spatially associated with intrusions and Hedenquist et al. (2000) suggest the term „intermediate sulphidation‟ for these deposits; and
low sulphidation previously called adularia- sericite these low-sulphidation subtype deposits are thought to have a near-neutral pH as a result of being dominated by meteoric waters but containing some magmatic C and S.
7.2.2 EPITHERMAL MINERALIZATION CHARACTERISTICS
Lindgren (1922, 1933) suggested that degassing magmas are sources of many ore-forming constituents in epithermal Au deposits, and this supposition appears to be essentially correct for magmatic-hydrothermal high-sulphidation deposits (Stoffregen, 1987; Rye et al., 1992). However, for many deposits (e.g. the majority of low-sulphidation subtypes) O and H-isotope data permit only a very small fraction (i.e. <10%) of the hydrothermal water to be of magmatic origin, despite the close association of some deposits with cooling magmatic rocks, whereas C and S isotope studies indicate a significant magmatic contribution in many cases. Thus, a mineralizing fluid can have a complex origin, one involving links to degassing magmas as well as the dominance of local recharge waters to fuel the hydrothermal system.

P&E Mining Consultants Inc., Rpt No. 173 Page 36 of 117 Brucejack Property Silver Standard Resources Inc.
The two principal (end-member) geochemical environments of epithermal mineralization and alteration are determined largely by the dominance in each case of two different fluids. On the one hand, magmatic-hydrothermal environments that are dominated (buffered) by acidic, magmatic fluids produce high-sulphidation mineral assemblages characterized by base leaching of wall rocks leaving marked (residual) silica enrichment. This environment may overlie porphyry systems (Sillitoe and Bonham, 1984). On the other hand, near neutral, more reduced, meteoric-dominated waters containing Cl, H2S, and CO2, yield low-sulphidation (adularia/sericite) mineral assemblages through hydrolysis reactions involving feldspar in the wall rocks. The chemical state of these fluids becomes largely wall-rock buffered. Sources of Gold Two fundamentally different hypotheses regarding the source of Au in epithermal deposits are
1. metals are supplied directly by actively or passively degassing magma (e.g. Taylor, 1987; 1988) that also provides heat to the paleo-hydrothermal system, and
2. the metals are leached from the rocks that host the geothermal system. On the one hand, isotopic confirmation of the importance of meteoric waters has encouraged proponents of the second hypothesis. On the other hand, isotopic data also indicate that S and C are of magmatic origin in certain deposits. Alteration mineral assemblages are characteristic of two end-member chemical environments of alteration and mineralization: low to very low pH, oxidized fluids (high-sulphidation subtype) and near neutral, more reduced fluids (low and intermediate-sulphidation subtypes). Boiling and chemical fractionation of the hydrothermal fluid provides an explanation for the separation of precious and base metals. This separation results in a vertical zoning where fluids are upwardly flowing (Clark and Williams-Jones, 1990), or in relative temporal stages, such as at Silbak-Premier, British Columbia, and EI Indio, Chile. Geological, mineralogical and geochemical features of epithermal Au deposits are listed for each of three deposit subtypes in Table 7.1. 7.2.3 DIAGNOSTIC CHARACTERISTICS OF EPITHERMAL SUBTYPES
Grade and Tonnage Characteristics The size and grade of the principal Canadian epithermal Au vein deposits and selected „type‟ deposits elsewhere are shown in Figure 7-1. The estimated sizes (ca. 0.05 to 42 Mt of ore) give an order of magnitude basis for comparison; definition of size depends on cut-off grades and economics. Canadian epithermal Au deposits are comparable in size and grade to many global deposits (Taylor, 2007) although the largest epithermal deposits (in tonnes of ore) and the richest deposits (in g/t) are found outside of Canada.

P&E Mining Consultants Inc., Rpt No. 173 Page 37 of 117 Brucejack Property Silver Standard Resources Inc.
Table 7.1: Summary of geological setting, definitive characteristics1 and examples of typical epithermal Au deposit
subtypes (after Taylor, 2007)

P&E Mining Consultants Inc., Rpt No. 173 Page 38 of 117 Brucejack Property Silver Standard Resources Inc.
In the Sulphurets district, British Columbia epithermal mineralization tends to comprise disseminated Au in silicified and/or finely veined rocks. Here, grades are typically lower, but tonnages larger, than in other, more typical vein-type, epithermal deposits. Physical Characteristics
The mineralogy, textural features, host rocks, morphology, and selected chemical properties found typically in epithermal Au deposits are summarized below and shown in Table 7.1 (Taylor, 2007).
1. Mineralogy
Quartz is the predominant gangue mineral in all epithermal Au deposits, whereas distinctive ore and gangue minerals characterize high-sulphidation and low- sulphidation deposit subtypes. Mineralogical zoning around veins or replacement zones may be present in both subtypes, recording chemical and/or thermal gradients.
Low-sulphidation
Native Au and electrum occur in low-sulphidation subtype vein deposits that often contain only a few percent or less of sulphides (usually pyrite; e.g., Blackdome, British Columbia). In deposits in which sulphide minerals are abundant (e.g. Venus; Silbak-Premier: sulphide-rich stage), sulphides commonly include chalcopyrite, tetrahedrite, galena, sphalerite, and arsenopyrite in addition to pyrite. The principal gangue minerals include calcite, chlorite, adularia, barite, rhodochrosite, fluorite, and sericite.
In sediment-hosted low-sulphidation deposits, the characteristic assemblage of gangue minerals commonly includes cinnabar, orpiment-realgar, and stibnite, in addition to jasperoid, quartz, dolomite, and calcite. Chalcedonic quartz veins and jasperoid are typically associated with ore, whereas calcite veins are often more common further from ore, or are paragenetically late. High Sulphidation
In high-sulphidation subtype deposits, native Au and electrum are typically associated with pyrite, enargite, covellite, bornite and chalcocite. In addition to sulphosalts and base metal sulphides, tellurides and bismuthinite are present in some deposits. Total sulphide contents are generally higher in high-sulphidation than low-sulphidation subtype deposits but high sulphide contents may also characterize transitional polymetallic low- sulphidation deposits (e.g. Silbak Premier, British Columbia). Where base metals are present in high-sulphidation deposits, the Cu abundance can vary significantly (Sillitoe, 1993) and typically dominate that of Zn. Principal gangue minerals include quartz (“vuggy silica”), alunite, barite (especially associated with Au). Calcite is not characteristic of high-sulphidation subtype deposits due to the high acidity of the hydrothermal fluids.

P&E Mining Consultants Inc., Rpt No. 173 Page 39 of 117 Brucejack Property Silver Standard Resources Inc.
Figure 7-1: Plot of Au grade (g/t) versus tonnage (economic, or reserves + production) for
selected Canadian epithermal Au deposits and prominent examples elsewhere in the world
(after Taylor, 2007):
Canadian epithermal deposits (filled circles) include Al = Al; B = Baker; BD = Blackdome; C = Cinola; DM = Dusty Mac; EQ = Equity Silver; L = Lawyers; LAF = Laforma; N = Mt. Nansen; SK = Mt. Skukum; SP = Silbak Premier; S = Sulphurets; and V = Venus. Hydrothermal vein deposits of a possible „transitional‟ or „deep epithermal‟ deposits are represented by open circles, sediment-hosted deposits by a green square with cross, and Au-bearing VMS deposits („marine epithermal‟) by open red squares. The median grades and tonnages for several comparable types of deposits (yellow-filled circles) from Cox and Singer (1986) include porphyry Cu-Au [P]; low-sulphidation Creede-type [C]; and high-sulphidation: Summitville deposit [S]; and Lawyers deposit, Toodoggone River district, British Columbia [L; similar to the „Comstock-type‟, Nevada (no symbol) of Cox and Singer, 1986]. Median values for the low-sulphidation Hishikari, Japan vein deposit [H], and for the high-sulphidation El Indio, Chile, deposit [I] are from Hedenquist et al. (2000). Fields for prominent low-sulphidation (blue shading) and high-sulphidation (dashed line) epithermal Au deposits worldwide (global) are based on data in Hedenquist et al. (1996; 2000).

P&E Mining Consultants Inc., Rpt No. 173 Page 40 of 117 Brucejack Property Silver Standard Resources Inc.
2. System Dimensions
High-sulphidation deposits of magmatic hydrothermal origin are typically of smaller dimension than low-sulphidation subtype deposits, and are found in close proximity to and often topographically above, a related source of magmatic heat and volatiles.
Low-sulphidation subtype deposits in most cases cover larger areas than typical high-sulphidation deposits, even though alteration mineral assemblages are restricted to generally narrow zones enclosing veins and breccias. At the Blackdome mine, British Columbia quartz veins are contained within an area approximately 2 by 5 km. Veins and breccia zones as wide as 40 m and as long as 1200 m comprise the Main zone of the Silbak-Premier deposit (Figure 7-2) (McDonald, 1990).
Figure 7-2: Geological cross-section of a representative Canadian epithermal deposit
illustrating alteration mineral zoning and selected features (after Taylor, 1996).
This cross-section is through a portion of the Silbak-Premier deposit (intermediate sulphidation; after McDonald, 1990) illustrates hydrothermal propylitic, sericitic, and potassic alteration mineral assemblages in relation to fault-controlled vein stockwork and breccia, and to porphyritic dacite.
3. Morphology
The morphology of epithermal vein-style deposits can be quite variable. Deposits may consist of roughly tabular lodes controlled by the geometry of the principal faults they occupy (e.g. Cirque vein, Mt. Skukum), or comprise a host of interrelated fracture fillings in stockwork, breccia, lesser fractures, or, when formed by replacement of rock or void space, they may take on the morphology of the lithologic unit or body of porous rock (e.g. irregular breccia pipes and lenses) replaced. Brecciation of previously emplaced veins (e.g. Mt. Skukum, Yukon) can form permeable zones along irregularities in fault planes: vertically plunging ore zones in faults with strike-slip motion and horizontal ore zones in dip-slip faults. Topographic (i.e.
P&E Mining Consultants Inc., Rpt No. 173 Page 41 of 117 Brucejack Property Silver Standard Resources Inc.
paleosurface) control of boiling by hydrostatic pressure can also result in horizontal or sub-horizontal mineralized zones, limiting the vertical distribution of ore.
4. Host Rocks
Nearly any rock type, even metamorphic rocks, may host epithermal Au deposits, although volcanic, volcaniclastic and sedimentary rocks tend to be more common. Typically, epithermal deposits are younger than their enclosing rocks, except in the cases where deposits form in active volcanic settings and hot springs. Here, the host rocks and epithermal deposits can be essentially synchronous with spatially associated intrusive or extrusive rocks, within the uncertainty of the determined ages in some cases.
Chemical Characteristics
1. Ore Chemistry
Gold:silver ratios of epithermal Au deposits may vary widely both between and within deposits ranging from lows of around 0.5 for the high-sulphidation type deposit as typified by the Kasuga deposit in Japan (Hedenquist et al., 1994) to >>500 in the Cerro Rico de Potosi deposit in Peru (Erickson and Cunningham, 1993). Differing magmatic metal budgets (Sillitoe, 1993) and depths of formation (Hayba et al., 1985) have been suggested to influence this ratio. Typically, Ag:Au ratios for epithermal deposits, though variable, tend to be higher in low-sulphidation subtype deposits than in high-sulphidation subtype deposits. The deep epithermal (mesothermal) Equity Silver deposit, British Columbia (e.g. Cyr et al., 1984; Wojdak and Sinclair, 1984) has the highest Ag:Au ratio (approximately 128) among Canadian epithermal deposits.
2. Alteration Mineralogy and Chemistry
Hydrothermal alteration mineral assemblages are commonly regularly zoned about vein- or breccia-filled fluid conduits in both high and low-sulphidation deposit subtypes. Characteristic alteration mineral assemblages in both deposit subtypes can give way to propylitically altered rocks containing quartz + chlorite + albite + carbonate - sericite, epidote, and pyrite. The distribution and formation of the earlier formed propylitic mineral assemblages generally bears no obvious direct relationship to ore-related alteration mineral assemblages.
Altered rocks in low-sulphidation deposits generally comprise two mineralogical zones: an inner zone of silicification (replacement of wall rocks by quartz or chalcedonic
silica); and an outer zone of potassic - sericitic (phyllic) alteration. Adularia is the typical K-
feldspar, but its prominence varies greatly; it may be absent altogether. Argillic alteration (kaolinite and smectite) occurs still farther from the vein.

P&E Mining Consultants Inc., Rpt No. 173 Page 42 of 117 Brucejack Property Silver Standard Resources Inc.
Silicified rocks are common in epithermal deposits, as is quartz gangue in veins. The silicified and decarbonatized host rocks that characterize Carlin type Au deposits in Nevada (e.g. Bagby and Berger, 1986) was apparently controlled by available primary permeability of bedding planes or rock fabric. Secondary permeability can also be produced by physical and chemical processes involving the hydrothermal fluids themselves. The sudden release of pressure on hydrothermal fluid (e.g. by faulting) can cause brecciation, creating pore space permeability. Dissolution of carbonate upon reaction between hydrothermal fluids and wall rocks also can produce secondary permeability. Advanced argillic alteration mineral assemblages that characterize high-sulphidation deposits include quartz + kaolinite + alunite + dickite + pyrite in and adjacent to veins or zones of replacement in the magmatic-hydrothermal environment. Pyrophyllite occurs in place of kaolinite at the higher temperatures and pressures of deeper deposits. These alteration minerals indicate a very low pH hydrothermal environment of high oxidation state. Zones of silica replacement and „vuggy silica‟ are characteristic, and carbonates are absent. Topaz and tourmaline in high-temperature zones indicate the presence of F and B in the acidic hydrothermal fluids.
Acid-sulphate (high-sulphidation) type alteration fluids form by the dissolution of large amounts of magmatic SO2 in high-temperature hydrothermal systems, and also by reaction of host rocks with steam-heated meteoric waters acidified by oxidation of H2S (probably of magmatic origin: e.g., Rye et al., 1992; Bethke et al., 2005), or by dissolution of CO2. Lower acidity, highly saline fluids are thought responsible for intermediate sulphidation deposits typically rich in base metal and Fe sulphide minerals (Hedenquist et al., 2000).
Fluids attributed to low-sulphidation hydrothermal systems are typically less saline than those in high-sulphidation systems, although fluids of two different salinities are also common. The primary fluids in low-sulphidation subtype deposits are commonly inferred to have largely evolved from meteoric rather than magmatic water, or comprise some mixture of the two (e.g. Hishikari, Japan: Faure et al., 2002).
The hydrothermal fluids responsible for alteration and mineralization largely represent altered or „evolved‟ meteoric waters whose isotopic compositions have been shifted to higher 18O/16O and D/H (deuterium-to hydrogen) ratios than those of pure local meteoric waters (compare with present day meteoric water). Such isotopic alteration or evolution of the fluids occurs during chemical, isotopic, and mineralogical hydrothermal alteration of the host rocks.
Margolis (1993) inferred progressive mixing of magmatic water and seawater during potassic, sericitic, and advanced argillic alteration at Sulphurets, British Columbia, on the basis of isotopic data and water-rock reaction modeling.
Fluid inclusions typically have been shown to contain predominantly fluids of low salinity and have filling temperatures of 150 to 300oC, with maxima in the range of approximately 260 to 280°C. Vapour -dominated systems at or near a boiling water table

P&E Mining Consultants Inc., Rpt No. 173 Page 43 of 117 Brucejack Property Silver Standard Resources Inc.
tend to evolve toward a rather uniform temperature of about 240°C due to the limitation imposed by a maximum in the enthalpy of steam+liquid (e.g. White et al., 1971).
Some deep epithermal (transitional) environments close to genetically related intrusions are characterized by higher temperatures, salinities, and CO2 contents (e.g. Baker, 2002).
7.3 SUMMARY - EPITHERMAL MINERALIZING SYSTEMS
The geological settings of low-, intermediate- and high-sulphidation subtype epithermal deposits are illustrated schematically in Figure 7-3. The locations of epithermal Au deposits are typically determined by those features that define the hydrothermal system „plumbing. Extensional faults are especially important, whether due to local, volcanic-related features or to regional tectonism (e.g. rifting zones, or pull-apart basins associated with strike-slip faults). Fault intersections and fault plane inflections provide zones for vein thickening and zones of brecciation during synchronous movement and vein growth. High-Sulphidation Epithermal Deposit Characteristics High-sulphidation deposits are typically associated with andesitic to rhyolitic rocks and with geologic features associated with sites of active volcanic venting and doming, including among others ring fractures, caldera fill breccias, hot springs, and acidic crater lakes. It is the dominance of directly derived or evolved magmatic fluids that buffer the hydrothermal fluids to low pH and result in the distinct character of the high-sulphidation subtype. Orebodies primarily consist of zones of silica-rich replacement. Bodies of massive „vuggy silica‟ and marked advanced argillic alteration mineral assemblages are typical. Low-Sulphidation Epithermal Deposit Characteristics Low-sulphidation deposits that occur further removed from active magmatic vents may be more apparently controlled by structural components, zones of fluid mixing, and emplacement of smaller magmatic bodies (e.g. dykes). Meteoric waters dominate the hydrothermal systems, which are more nearly pH neutral in character. Low-sulphidation related geothermal systems are more closely linked to passive rather than to active magmatic degassing (if at all), and sustained by the energy provided by cooling, sub-volcanic intrusions or deeper sub-volcanic magma chambers. Transitional-Sulphidation Epithermal Deposit Characteristics Some deposits with mostly low-sulphidation characteristics with respect to their alteration mineral assemblages have sulphide ore mineral assemblages that represent a sulphidation state between that of high-sulphidation and low-sulphidation deposits. Such deposits tend to be more closely spatially associated with intrusions, and Hedenquist et al. (2000) suggest the term „intermediate sulphidation‟ for these deposits. The various Brucejack Property mineralized zones that are the subjects of the current report, are considered similar to the Silbak-Premier Mine which as shown in Figure 7-3 is classified as a Transitional to Low Sulphidation Epithermal Deposit.

P&E Mining Consultants Inc., Rpt No. 173 Page 44 of 117 Brucejack Property Silver Standard Resources Inc.
Figure 7-3: Schematic cross-section illustrating the general geological and hydrological
settings of quartz-(kaolinite)-alunite and adularia-sericite deposits (from Taylor, 1996;
partially adapted from Henley and Ellis, 1983, and Rye et al., 1992).
Characteristics shown evolve with time; all features illustrated are not implied to be synchronous. Local environments and examples of low-sulphidation deposits include: (A) basin margin faults: Dusty Mac; (B) disseminated ore in sedimentary rocks: Cinola; (C) veins in degassing, CO2-rich, low sulphide content, low-sulphidation systems: Blackdome, Mt. Skukum; (E) porphyry-associated vein-stockwork, sulphide-rich (intermediate sulphidation) and sulphide-poor stages: Silbak-Premier; and (H) disseminated replacement associated with porphyry-type and stockwork deposits, involving seawater: Sulphurets. Examples of high-sulphidation environments include: (D and G) steam-heated advanced argillic alteration (quartz-kaolinite-alunite) zone: Toodoggone River district, British Columbia; (F) magmatic-hydrothermal, high-sulphidation vuggy quartz zone (± aluminosilicates, corundum, alunite) Summitville, Colorado, or Nansatsu district, Japan. Fluid flow parallels isotherms. Up-flow zones are shown schematically by arrowhead-shaped isotherms. Volcanic degassing refers to magmatic degassing driven by depressurization during emplacement („first boiling‟). Non-volcanic degassing refers to vapour exsolution during crystallization („second boiling‟). The SO2 disproportionates to H2S and H2S04 during ascent beneath environment (F). Note that free circulation occurs only in crust above about 400ºC. All shown temperatures are in Celsius degrees.

P&E Mining Consultants Inc., Rpt No. 173 Page 45 of 117 Brucejack Property Silver Standard Resources Inc.
8.0 MINERALIZATION
8.1 INTRODUCTION
There are more than seventy documented mineral occurrences and showings in the Sulphurets area. Copper, molybdenum, gold and silver mineralization found within gossans have affinities to both porphyry and mesothermal to epithermal types of vein deposits. Most mineral deposits occur in the upper members of Unuk River Formation or the lower members of the Betty Creek Formation (Britton and Alldrick, 1988). Early Jurassic sub-volcanic intrusive complexes are common in the Stikinia terrane, and several host well-known precious and base metal rich hydrothermal systems. These include copper-gold porphyry deposits such as Galore Creek, Red Chris, Kemess, Mt. Milligan and KSM. In addition, there are a number of related polymetallic deposits including skarns at Premier, epithermal veins and subaqueous vein and replacement sulphide deposits at Eskay Creek, Snip, Brucejack, and Granduc (Savell, 2008). Within the Kerr-Sulphurets area two basic styles of mineralization have been documented:
Porphyry type gold mineralization associated with fine grained syenite to syenodiorite intrusive rocks intrusive breccias and pyritization.
Silver-gold-base metal epithermal veins occurring within or adjacent to fine grained
syenodiorite intrusions and associated with large area of intense sericite, quartz, pyrite alteration. These structurally controlled veins may or may not have significant sulphide contents.
The Brucejack area is dominated by structurally controlled silver-gold-base metal bearing epithermal veins as described by Alldrick and Britton (1991). 8.2 BRUCEJACK PROPERTY
The Brucejack area has been the focus of periodic exploration over the past several decades resulting in the discovery of at least 40 gossanous zones of gold, silver, copper and molybdenum –bearing quartz/carbonate veining, stockwork and breccia hosted mineralization (Figure 8-1). Typically, these gossanous showings reflect the weathering of disseminated pyrite in argillic and phyllic alteration zones. The size of these gossans, their tectonic fabric, intensity of alteration and metallogenesis make them attractive exploration targets (Alldrick and Britton, 1991) and most have been extensively sampled and/or drill tested. The mineralization on the Brucejack Property typically consists of structurally controlled, intrusive related quartz-carbonate, gold-silver bearing veins, stockwork and breccia zones. The veins are hosted within a broad zone of potassium feldspar alteration, overprinted by sericite-quartz-pyrite +/- clay. Structural style and alteration geochemistry indicates the deposits were formed in a near surface epithermal style environment.

P&E Mining Consultants Inc., Rpt No. 173 Page 46 of 117 Brucejack Property Silver Standard Resources Inc.
Figure 8-1: Historical Map with Mineral Deposits and Occurrences (modified after
Budinksi, 1995)

P&E Mining Consultants Inc., Rpt No. 173 Page 47 of 117 Brucejack Property Silver Standard Resources Inc.
Mineralization was likely a three-stage process as envisioned by Lewis (1994) in the summary below:
Stage 1 is interpreted as an initial episode of fault-development and ground preparation. Pre-cursor structures to the West, Shore and Electrum zones likely formed at this time, as steep northwest trending normal faults with limited displacement, cutting all rock types.
Stage 2 involved development of syntectonic mineralization and alteration. Massive and stockwork vein systems were emplaced within an east-west compressional stress field. The main vein orientations resulting from this stress are i) east-west dilational veins and ii) northwest trending veins localized along pre-existing structures such as the West, Shore and Bridge (Electrum) Zones. Underground mapping at the West Zone indicates that the northwest trending structures have been brecciated, while east-west trending structures have not. This would support the theory of reactivation along pre-existing northwest structures. Reactivation was probably sinistral in movement. The localization of major vein systems within the volcanic rocks as opposed to the sedimentary rocks is likely the results of preferential ground preparation.
Stage 3 was marked by the development of northwest trending cleavage and local warping of smaller veins as a result of northeast-southwest shortening.
Silver Standard has reviewed all of the historical and on-going exploration results allowing it to identify seven zones of potentially near term economically viable mineralization. This, in addition to the Snowfield Zone of porphyry-type mineralization to the north. The seven high–priority zones of mineralization noted below, presently comprise the Brucejack Property (see Figure 3-3). The six zones highlighted in italics below (excluding the Mammoth Zone) are the focus of Mineral Resource Estimates outlined in Section 16 of this report and are discussed individually in Sections 8.3 through 8.8. Further drilling to increase the density of holes on the Mammoth showing, and thus allow definition of a Mineral Resource, is planned.
1. West Zone; 2. Bridge Zone; 3. Galena Hill Zone; 4. Shore Zone; 5. SG Zone; 6. Gossan Hill Zone; 7. Mammoth Zone.
Vein Mineralization The zones of gold-silver-copper-molybdenum mineralization comprising the Brucejack area are for the most part considered the product of fault and fracture-controlled hydrothermal activity related to local intrusive activity.

P&E Mining Consultants Inc., Rpt No. 173 Page 48 of 117 Brucejack Property Silver Standard Resources Inc.
In general, the vein mineralization appears to represent a complex system of structurally controlled overprinting of ore types and multiple generations of alteration and vein assemblages. Veins can be classified on the basis of metal content and gangue mineralogy. Typically the exposed veins are thin (1 m) and short (< 50 m). Individual veins may coalesce into more densely packed vein systems, especially in more intensely altered areas, and locally often represent in excess of 25% of the outcrop. Such vein systems typically grade imperceptibly into the strongly silicified host rocks. Base metal bearing quartz veins consist primarily of thin stringers of quartz +/- carbonate which locally contain zones of disseminated to massive sulphides with varying amounts of pyrite, galena, and/or sphalerite. They are found locally around the Brucejack Plateau outside the main areas of alteration. Individual veins may be strongly gossanous. Precious and base metal veins (eg: West Zone) are polymetallic stockworks of thin veins and fracture fillings. Tension gash structures are common. The veins show complex crosscutting relationships that indicate repeated fracturing and filling as the host rocks underwent brittle deformation. Precious metal mineralization may be confined to one particular episode of veining, which is not necessarily the same episode as base metal mineralization. The gold is associated with pyrite + electrum in quartz +/- calcite veins. Arsenopyrite may occur peripherally in the host rocks. Barite veins were first discovered by Bruce and Jack Johnson in 1935 near the outflow of Brucejack Lake. They consist of coarsely crystalline barite with minor quartz, carbonate and sulphides Porphyry-type Mineralization Porphyry-type disseminated pyrite-chalcopyrite-molybdenite mineralization occurs on the Snowfield and KSM properties immediately adjacent to the north and west of the Brucejack Property. Such mineralization occurs within sub alkaline porphyritic intrusions, including monzodiorite, monzonite, syenite and granite. The porphyry type gold and copper deposits (ex: Mitchell, Sulphurets and Snowfield Zone) usually have a higher-grade central or core area surrounded by lower-grade mineralization that is dispersed over a very large area and is related to very fine grained disseminated chalcopyrite. Within the higher grade core area, gold and copper grades correlate closely with one another. The Cu /Au ratio tends to be slightly higher closer to the phyllic-propylitic transitional areas. In the low-grade peripheral shells, the Cu /Au grades tend to be the highest. The gold and copper distribution is remarkably smooth and continuous with grades decreasing very gradually outwards from the higher grade core. These observations suggest that the deposit was generated by a large, stable hydrothermal system with a low thermal gradient within homogeneous host rocks. The distribution was minimally disrupted by late faulting with only minor offsets.

P&E Mining Consultants Inc., Rpt No. 173 Page 49 of 117 Brucejack Property Silver Standard Resources Inc.
8.3 WEST ZONE
The following descriptions of the mineralization of the West, Bridge, Galena Hill, Shore, SG and Gossan Hill Zones of the Brucejack Property (Sections 8.3 through 8.8) were provided by Mr Ron Burk, Chief Geologist at Silver Standard in the form of an internal company report, dated December 9, 2009. The West Zone gold-silver deposit is hosted by a north-westerly trending band of lower Jurassic (Unuk River member, Hazelton Group) andesitic and lesser sedimentary rocks (Figure 8-2), 400 to 500 m wide, that passes between two intrusive bodies of plagioclase-hornblende porphyry. The supracrustal rocks are steeply inclined to the northeast and display varying degrees of brittle-ductile deformation and moderate to intense hydrothermal alteration, particularly where the precious metal deposit has been outlined. The deposit itself comprises at least 10 quartz veins and quartz stockwork shoots, the longest of which has a strike length of 250 m and a maximum thickness of about 6 m. Most mineralized shoots have vertical extents that are greater than their strike lengths. Geometries of the main veins suggest they represent central and oblique shear veins which developed in response to transpressional strain and resulting sinistral, mainly ductile deformation (Roach and Macdonald, 1991). Crack-seal features shown by most of the veins are evidence of brittle deformation overlapping with some crystallization of gangue minerals. Thus, at the West Zone it appears that ductile shearing generated the dilatant structures that served as conduits for the hydrothermal fluids which deposited silica and precious metals but hydrostatic overpressures within the conduits intermittently caused brittle failure along these structures. In terms of hydrothermal alteration, the West Zone is marked by a central silicified zone that passes outwards to a zone of sericite ± quartz ± carbonate and then an outer zone of chlorite ± sericite ± carbonate. The combined width of these alteration zones across the central part of the deposit is 100 m to 150 m. Gold in the West Zone occurs principally as electrum and in quartz veins and is associated with, in decreasing order of abundance, pyrite, sphalerite, chalcopyrite and galena. Besides being found with gold in electrum, silver occurs in tetrahedrite, pyrargyrite, polybasite and rarely stephanite and acanthtite. Gangue mineralogy of the veins is dominated by quartz, with accessory K-feldspar, albite, sericite, and minor carbonate and barite.

P&E Mining Consultants Inc., Rpt No. 173 Page 50 of 117 Brucejack Property Silver Standard Resources Inc.
Figure 8-2: Section 5160N of the West Zone, Brucejack Property – Looking Northwest (Source: Silver Standard).

P&E Mining Consultants Inc., Rpt No. 173 Page 51 of 117 Brucejack Property Silver Standard Resources Inc.
8.4 BRIDGE ZONE
The Bridge Zone is located about 1,500 m north of the southern Brucejack Property boundary and is centered on a 3-hectare nunatak outcrop that is surrounded by ice of the eastern arm of the Sulphurets glacier. Geologists working for Newhawk and the Geological Survey of Canada had previously mapped and sampled this outcrop, recognizing that it displayed strong sericite-pyrite alteration and was transected by a number of discontinuous mineralized quartz veins. Based on the encouraging gold assays obtained in these historical rock-chip samples, Silver Standard decided to test the prospect with a single drill hole, SU-10 (Figure 8-3). Assay results for this drill hole showed that it intersected a broad zone of low-grade gold mineralization of possible economic significance. The mineralized intercept in SU-10 was reported as being 483 m averaging 0.70 g Au/t and extended from surface. The discovery of potentially bulk-mineable gold at the Bridge Zone prompted Silver Standard to drill another 12 diamond bore holes to probe for the limits of this mineralization. These drill holes determined that the bulk of the gold mineralization is hosted by plagioclase-hornblende porphyry intrusive rock that in general is moderately sericite-chlorite altered, with disseminated and stringer pyrite making up a few percent of the rock by volume. Quartz ± chlorite ± sericite veins, 20-200 cm in thickness, were intermittently intersected by the drill holes, and these commonly contain minor to trace amounts of pyrite, sphalerite, galena, molybdenite and unknown dark grey, silver-bearing sulfosalt(s).

P&E Mining Consultants Inc., Rpt No. 173 Page 52 of 117 Brucejack Property Silver Standard Resources Inc.
Figure 8-3: Section 426775E of the Bridge Zone, Brucejack Property – Looking West (Source: Silver Standard)

P&E Mining Consultants Inc., Rpt No. 173 Page 53 of 117 Brucejack Property Silver Standard Resources Inc.
8.5 GALENA HILL ZONE
The prospect area known as Galena Hill is situated between the West Zone and Bridge Zone gold deposits on a prominent hill marked by widespread iron oxide staining of altered meta-andesites. The Galena Hill Zone had been previously tested with 27 bore holes belonging to a number of different drilling campaigns, with half of the holes being less than 100 m in length. Assays from these holes, together with detailed geological mapping and channel rock-sampling, indicate that at Galena Hill there is a system of east-west and NE-SW trending quartz veins and quartz stockworks which as a whole define a zone of hydrothermal alteration and mineralization that is at least 400 m long and 200 m wide. Rather than target the larger quartz veins, which locally contain high-grade gold + silver mineralization on surface, Silver Standard decided to test for the potential of a low-grade, bulk-mineable deposit. This was done with eight relatively long (>400 m) drill holes completed during the 2009 exploration program. The majority of these bore holes passed through amygdaloidal and massive andesite flows, volcaniclastic deposits rich in lapilli-sized andesitic clasts and thin units of carbonaceous and cherty mudstones. A few holes intersected rhyolitic dikes and one hole, SU-005, yielded a 50 meter-long quartz vein intercept enriched in gold and silver along its margins, though it is likely that this intercept is at a low angle to the dip of the vein. As in the West Zone, gold mineralization at the Galena Hill Zone is preferentially associated with quartz veins (Figure 8-4), although the sericite-altered, andesitic host rocks are typically mineralized with disseminated pyrite and have geochemically anomalous gold contents, generally in the 100-500 ppb Au range. In some veins, trace amounts of native gold and electrum are accompanied by minor to occasionally substantial amounts of sphalerite, chalcopyrite and galena. Two of the drill holes drilled in the 2009 drill program intersected spectacularly rich gold mineralization; a 1.5 m long intercept in SU-012 gave impressive assays of 16.95 kilograms Au/tonne and 8.95 kg Ag/t, where the precious metals occurred as a centimetre wide band of electrum within a quartz vein only a few centimetres wide itself.

P&E Mining Consultants Inc., Rpt No. 173 Page 54 of 117 Brucejack Property Silver Standard Resources Inc.
Figure 8-4: Section 426925E of the Galena Hill Zone, Brucejack Property – Looking West (Source: Silver Standard)

P&E Mining Consultants Inc., Rpt No. 173 Page 55 of 117 Brucejack Property Silver Standard Resources Inc.
8.6 SHORE ZONE
A small gold-silver Resource was identified by Newhawk along the north-eastern shore of the peninsula that extends into the west end of Brucejack Lake. Referred to as the Shore Zone, it is a zone of quartz veining hosted by foliated, sericite-altered andesites with a strike length of roughly 500 m and a maximum width of 50 m (Figure 8-5). The NW-SE trend of the zone is coincident with a pronounced structural lineament, likely a shear fault, that extends from the Brucejack Fault south-eastwards beneath Brucejack Lake. Several discrete quartz veins and quartz stockworks were traced along the zone, with historical drilling being concentrated on the southern end of the zone. The veins occur as „stacked‟, en echelon, sigmoidal lenses up to 100 m in length and 1.5 m wide, although they are typically 20-40 m long. Predominantly composed of quartz with minor carbonate and barite, the veins contain podiform sulphide mineralization consisting of varying amounts of pyrite, tetrahedrite, sphalerite, galena and arsenopyrite. Electrum has been observed in trace amounts. Silver is present in some of the highest concentrations observed in the Brucejack area. Silver Standard has not drill-tested the Shore Zone since acquiring the Brucejack Property; the gold and silver Resources calculated in 2009 for this zone were based on historical assay data from approximately 50 diamond bore holes drilled by the previous property owners.

P&E Mining Consultants Inc., Rpt No. 173 Page 56 of 117 Brucejack Property Silver Standard Resources Inc.
Figure 8-5: Section 427250E of the Shore Zone, Brucejack Property – Looking West-Northwest (Source: Silver Standard)

P&E Mining Consultants Inc., Rpt No. 173 Page 57 of 117 Brucejack Property Silver Standard Resources Inc.
8.7 SG ZONE
The SG Zone is located in the north-central part of the Brucejack Property and is represented by an area of iron oxide-stained, sericite-altered rocks that occur adjacent to the northerly striking Brucejack Fault. Channel rock sampling done by Silver Standard and earlier workers tested a restricted zone of quartz stockwork veining close to the major fault as well as an east-striking, 150 m long and 20-80 cm wide quartz vein that extends westwards from the stockwork. In addition, seven historic and four Silver Standard diamond drill holes tested for gold mineralization in this area. The Silver Standard bore holes passed through a sequence of mainly clastic andesitic rocks (Figure 8-6), likely redeposited tuffs and lapilli tuffs, that are intercalated with quartzo-feldspathic sandstones and minor siltstone units. SU-004 yielded the best mineralized intersection of the four Silver Standard drillholes; 75 m averaging 1.62 g Au/t, including 27 m at 2.57 g Au/t. This intersection contains surprisingly minor quartz veining; instead, the mineralized lapilli tuff hosts minor quartz-carbonate stockwork veinlets and trace amounts of fine, acicular arsenopyrite in addition to 1-3% disseminated pyrite.

P&E Mining Consultants Inc., Rpt No. 173 Page 58 of 117 Brucejack Property Silver Standard Resources Inc.
Figure 8-6: Section 426125E of the SG Zone, Brucejack Property – Looking West (Source: Silver Standard)

P&E Mining Consultants Inc., Rpt No. 173 Page 59 of 117 Brucejack Property Silver Standard Resources Inc.
8.8 GOSSAN HILL ZONE
The mineralized zone known as Gossan Hill is a circular area, about 300 m in diameter, of intense quartz-sericite-pyrite alteration developed in Jurassic andesites of the Unuk River member of the Betty Creek formation. This visually impressive alteration zone is host to at least eleven quartz vein and quartz stockwork structures most of which trend east-west and dip steeply to the north. Individual structures are up to 250 m long and 20 m wide. Historical work done at Gossan Hill consisted of rock-chip sampling, hand trenching and diamond drilling, with a few +400-meter holes passing through the central part of the mineralized area. Precious metal mineralization at the Gossan Hill Zone is sporadic but generally best developed in the larger quartz lenses, particularly where these contain minor aggregates of pyrite, tetrahedrite, sphalerite and galena. Electrum is rarely observed, while silver also occurs in tetrehedrite, pyrargyrite and polybasite. Silver Standard only drilled two holes at the Gossan Hill Zone, with the objective of finding a broad zone of low-grade gold mineralization that may enclose or exist between a few of the more discrete structures tested by the historical surface sampling and drilling.

P&E Mining Consultants Inc., Rpt No. 173 Page 60 of 117 Brucejack Property Silver Standard Resources Inc.
9.0 EXPLORATION
Silver Standard has not undertaken any exploration or development work in the Brucejack Property since acquiring the Snowfield and Brucejack Properties in 1999 until June of 2009, when it commenced its 2009 field program. The 2009 program included drilling, rock-chip and channel sampling and re-sampling of historical drill core. All drilling completed by Silver Standard has been outlined in Section 10 of this report and all other exploration work carried out by Silver Standard has been outlined below. All historical exploration work carried out by previous owners and/or operators prior to Silver Standard‟s acquisition of the Brucejack Property (including drilling) has been summarized in Sections 5.1 and 5.2 of this report. During the 2009 Brucejack Property field program, Silver Standard collected a total of 1,940 drill core samples from 25 historical drill holes stored onsite and sent them for analysis to ALS Chemex Laboratories. The samples were sent to the ALS Chemex assay laboratory in Terrace for preparation and then forwarded to the Chemex facility in Vancouver for analysis. Samples were analyzed for gold (fire assay with atomic absorption finish) as well as 33 other elements by ICP analysis. The 2009 program also included re-analysis of 941 „pulp‟ samples derived from historical drill core samples. These samples were also analyzed for gold, plus 33 other elements at the Chemex facility in Vancouver. Field work undertaken throughout the 2009 program included the collection of 2,739 rock-chip and channel samples from surface outcrops. This sampling work was mostly done at target areas that were drilled by the company in 2009, with samples generally collected along north-south oriented lines that corresponded to the surface traces of some of the 2009 drill holes. Specifically, rock-chip and channel sampling was completed at the Galena Hill, Bridge, SG and Mammoth Zones (where drilling was carried out in 2009), as well as at the Hanging Glacier Zone, where historical surface sampling had identified rocks enriched in gold and silver. The surface samples were analyzed for gold plus 33 other elements. 430 quality control samples were also included (on top of the 2,739 field samples) in the field sampling program to ensure the integrity of the analytical data (Burk, 2009b).

P&E Mining Consultants Inc., Rpt No. 173 Page 61 of 117 Brucejack Property Silver Standard Resources Inc.
10.0 DRILLING
10.1 INTRODUCTION
More than 900 surface and underground diamond drill holes were drilled in the Brucejack area prior to Silver Standard‟s involvement commencing September of 1999. Drilling within the Brucejack Property prior to this date has been summarized in Section 5.1 and 5.2 of this report. Of these historical drilled holes, 432 underground and 333 surface drill holes have been incorporated into the current P&E Resource Estimates, which have been detailed in Section 16.0 of this report. No drilling was carried out on the Brucejack Property by Silver Standard from the time of acquisition in September 1999 until October of 2009. In 2009, Silver Standard opted to focus its drilling program at the Galena Hill Zone, as well as on the newly discovered Bridge Zone, located in the southern part of the Brucejack Property. Other targets tested by the 2009 campaign include the previously drilled Gossan Hill and SG Zones as well as two areas of hydrothermal alteration and sporadic gold mineralization situated west and north of the Bridge Zone (Mammoth and Electrum prospects). Matrix Diamond Drilling of Kimberly, B.C., was commissioned to drill a minimum of 8,000 m of diamond drilling to test several gold-silver targets within the Brucejack area. Helicopter supported drilling commenced in July of 2009 with two drills in the area. The number of drills later increased to three in August of 2009 after continued success of the program and the discovery of the Bridge Zone (an expansion of previously defined gold mineralization known as the “Electrum Zone”). The 2009 Brucejack Property drilling program comprises 37 surface diamond drill holes (mainly HQ- and some NQ-diameter), SU-01 to SU-37, totalling 17,845.71 m in length, all of which intersected gold-silver mineralization. Out of these 37 holes, 35 have been used in P&E‟s current Resource Estimates. The 2009 drill program succeeded in identifying and defining previously undefined gold targets, as well as intersecting gold mineralization over significant intervals, with some intersections exceeding 500 m. Drilling results have been summarized by zone in Sections 10.2 to 10.8. From the 37 drill holes, 14,085 drill core samples were sent to ALS Chemex Laboratories for analytical testing. The samples were sent to the ALS Chemex assay laboratory in Terrace for preparation and then forwarded to the Chemex facility in Vancouver for analysis. Samples were analyzed for gold by fire assay method with an atomic absorption finish and the samples were also analyzed for 33 other elements by ICP analysis. There were also 80 samples analyzed by metallics methodology (to test for the presence and amount of coarser grained gold) and 584 samples analyzed for specific gravity values. The sampling program also included an additional 2,544 quality control samples made up of 823 standards, 888 blanks and 833 duplicate samples (Burk, 2009b). Silver Standard‟s quality control program for the 2009 drill program is discussed in Sections 11 through 13.

P&E Mining Consultants Inc., Rpt No. 173 Page 62 of 117 Brucejack Property Silver Standard Resources Inc.
Drill hole collars were surveyed by McElhanney Consulting Services Ltd., based in Smithers, British Columbia, using a Leica 500 G.P.S. Down hole digital core orientation surveys were undertaken at the end of all holes and at approximate 50-metre intervals on the trip out of the hole using a Reflex E-Z Shot instrument. See Figures 10-1 for the locations of the Brucejack Property diamond drill holes. 10.2 WEST ZONE
The West Zone, previously termed “Sulphurets”, is located entirely within the south-western portion of mineral claim number 509463, approximately 500 m northwest of the Galena Hill Zone (see Figure 3-3). Historically, it is the most important zone within the Brucejack Property and has an extensive history of exploration and underground development. A plan map of the drill hole layout can be viewed in Figure 10-1 A total of 1253.94 m was drilled over two holes at the West Zone deposit during the 2009 Brucejack Property drilling program (holes SU-32 and SU-36). These holes tested the southwest-trending structurally controlled vein system for extensions to the north and to depth. Drilling extended the historically defined mineralized zone by approximately 80 m to the north-west and defined an area approximately 500 m long, 75 m wide and 450 m deep. Of the two holes, SU-32 contained numerous intersections, the best of which was 147.5 m of 1.32 g Au/t, including 64.5 m of 2.03 g Au/t. Hole SU-32 also ended in mineralization. Select intersections from the West Zone drilling program have been summarized in Table 10.1 below.
Table 10.1: 2009 West Zone Mineralized Intersections (average grades shown)
Hole No. From (m) To (m) Interval (m)
Gold (g/tonne)
Silver (g/tonne)
SU-32(1) (2) 138.5 161.0 22.5 0.58 7.2 194.0 214.0 20.0 0.70 22.4 327.0 474.5 147.5 1.32 37.4
Incl. 336.5 401.0 64.5 2.03 19.3 526.5 566.5 40.0 3.00 9.1 SU-36 49.5 69.5 20.0 1.57 12.9 89.0 114.5 25.5 0.97 4.5 153.5 338.0 184.5 0.65 5.9 630.5 650.0 19.5 1.65 7.3 True thickness to be determined. (1) Ended in mineralization. (2) For the quoted average gold assays, any assay in excess of 31.1 grams of gold per tonne was cut to 31.1 grams of gold per tonne.

P&E Mining Consultants Inc., Rpt No. 173 Page 63 of 117 Brucejack Property Silver Standard Resources Inc.
Figure 10-1: 2009 Brucejack Property Drilling Program Drill Hole Layout Map (Source:
Silver Standard)

P&E Mining Consultants Inc., Rpt No. 173 Page 64 of 117 Brucejack Property Silver Standard Resources Inc.
10.3 BRIDGE ZONE
The Bridge Zone is located approximately 1,200 m south of the West Zone, overlapping mineral claim numbers 509506 and 509464 (see Figure 3-3). This zone incorporates the older known "Electrum Zone", forming its northern extent, plus the newly discerned southern extension, recently discovered by Silver Standard during the 2009 Brucejack Property drilling program. A total of 8616.13 m of drilling was carried out in the Bridge Zone over 16 drill holes, with the majority of holes being drilled to the north. Drilling was designed at approximately 100 m centres to help define mineralization within the zone. The 16 mineralized drill intercepts have identified a 780 m long, 400 m wide and 800 m deep zone of gold-silver mineralization primarily associated with moderate sericite-chlorite alteration of the plagioclase hornblende intrusive host rock. This zone is open to the south and to the east. Overall average grades are in the order of +1.0 g Au/t and +15 g Ag/t, with higher grade intervals in the range of +3.0 g Au/t. Drill holes SU-10, SU-19, SU-21 and SU-30 intercepted mineralization over several hundreds of metres and these holes, as well as holes SU-24 and SU-28, ended in mineralization. SU-10 intercepted 483 m of 0.70 g Au/t, including two higher grade intervals of 50 m of 1.26 g Au/t and 33 m of 1.25 g Au/t. SU-19 intercepted 552 m of 0.87 g Au/t, including 260 m of 1.19 g Au/t. SU-21 intercepted 589 m of 0.99 g Au/t, including 235 m of 1.43 g Au/t, and SU-30 intersected 513 m of 0.99 g Au/t, including 77 m of 1.38 g Au/t. Select intersections from the 2009 Bridge Zone drilling program have been summarized in Table 10.2 below.
Table 10.2: 2009 Bridge Zone Mineralized Intersections (average grades shown)
Hole No. From (m) To (m) Interval (m)
Gold (g/tonne)
Silver (g/tonne)
SU-10(1) 7.0 489.8 482.8 0.70 8.0 Incl. 346.0 395.5 49.5 1.26 16.1 Incl. 457.0 489.8 32.8 1.25 7.8
SU-11 18.0 72.0 54.0 1.51 11.1 108.0 124.5 16.5 1.05 13.3 345.0 387.0 42.0 0.52 3.4 SU-19(1) 4.0 556.3 552.3 0.87 5.7 296.5 556.3 259.8 1.19 6.8 SU-20 0.0 93.0 93.0 0.99 35.8 145.5 360.5 215.0 0.76 10.9 441.0 590.4 149.4 0.63 7.9 SU-21(1) (2) 22.2 611.4 589.2 0.99 12.4
Incl. 356.7 591.9 235.2 1.43 12.0 SU-22 31.5 368.6 337.1 0.78 19.7
Incl. 267.5 279.5 12.0 2.25 164.5 396.5 456.5 60.0 0.80 13.3 SU-23 190.5 268.5 78.0 0.85 9.5 308.5 536.0 227.5 1.12 9.3 SU-24(1) 146.0 350.5 204.5 0.58 10.9 389.5 508.5 119.0 0.75 15.5

P&E Mining Consultants Inc., Rpt No. 173 Page 65 of 117 Brucejack Property Silver Standard Resources Inc.
Hole No. From (m) To (m) Interval (m)
Gold (g/tonne)
Silver (g/tonne)
SU-25 0.0 161.0 161.0 1.26 12.1 Incl. 101.1 128.1 27.0 3.09 20.6
296.0 400.5 104.5 0.73 11.3 SU-26 38.5 108.5 70.0 0.52 7.0 220.8 269.7 48.9 0.63 9.4 SU-27 0.9 58.0 57.1 0.86 4.2 119.0 168.0 49.0 0.49 4.5 226.7 411.0 184.3 0.67 4.0 SU-28(1) 0.0 23.5 23.5 3.92 71.1 164.0 512.0 348.0 0.70 3.3
Incl. 222.5 512.0 289.5 0.76 3.5 557.0 595.9 38.9 0.74 5.8 SU-29(2) 0.0 28.5 28.5 1.55 3.0 211.5 270.5 59.0 1.58 14.1 SU-30(1) 0.9 514.0 513.0 0.99 4.1
Incl. 10.5 49.7 39.2 1.40 7.9 Incl. 401.1 478.5 77.4 1.38 5.0
607.0 661.6 54.6 0.52 5.3 SU-31 52.0 77.5 25.5 1.08 4.4 123.6 140.5 16.9 0.83 21.5 True thickness to be determined. (1) Ended in mineralization. (2) For the quoted average gold assays, any assay in excess of 31.1 grams of gold per tonne was cut to 31.1 grams of gold per tonne.
10.4 GALENA HILL ZONE
This previously identified 200 m wide by 400 m long, north-east to south-west striking zone of mineralization hosts a series of at least eight steeply dipping sulphide-bearing quartz veins up to 285 m in length and up to eight metres wide. The objective of the 2009 Brucejack Property drilling program undertaken at the Galena Hill Zone was to test for gold mineralization and further define this zone. A total of 5238.27 m of drilling was carried out in the Galena Hill Zone over a total of 12 drill holes, with all holes being drilled either in a northerly or southerly direction. All 12 drill holes intercepted significant gold-silver mineralization with some holes intersecting quartz veins containing visible gold. Three of the 12 final holes ended in mineralization. Bonanza grades were intersected in drill holes SU-12 and SU-29 (SU-29 is a scissor hole collared approximately 100 m east of SU-12) and, as at the date of this report, geologic analysis is currently being undertaken to determine if the intersections in SU-12 and SU-29 are related. SU-12 intersected four bands of mineralization, with the best intersection including 1.5 m with uncut grades of 16.95 kg Au/t and 8.7 kg Ag/t. This intersection occurred within a wider interval of 20.6 m with cut grades of 5.33 g Au/t and 159 g Ag/t (for the quoted average gold assays, any assay in excess of 31.1 grams of gold per tonne was cut to 31.1 grams of gold per tonne). Drill

P&E Mining Consultants Inc., Rpt No. 173 Page 66 of 117 Brucejack Property Silver Standard Resources Inc.
hole SU-29 also intersected four bands of mineralization, the best of which included 0.5 m with uncut grades of 5.34 kg Au/t and 3.7 kg Ag/t. This intersection occurred within a wider interval of 41.5 m with cut grades of 1.72 g Au/t and 56.5 g Ag/t. Other significant results also include drill hole SU-05, which intersected 155 m of 1.26 g Au/t, including 12 m of 5.37 g Au/t. SU-06 intersected 45 m of 1.83 g Au/t, including 11 m of 4.65 g Au/t. SU-08 intersected two intervals of mineralization, the first with 34 m of 0.85 g Au/t, the second interval with 83 m of 0.76 g Au/t. SU-33 intersected two bands of mineralization, 71 m of 2.17 g Au/t and 15 m of 6.27 g Au/t. Select intersections from the drilling carried out at the Galena Hill Zone have been summarized in Table 10.3 below.
Table 10.3: 2009 Galena Hill Zone Mineralized Intersections (average grades shown)
Hole No. From (m) To (m) Interval (m)
Gold (g/tonne)
Silver (g/tonne)
SU-05 39.2 51.5 12.3 0.61 13.3 323.5 478.5 155.0 1.26 20.4
Incl. 466.5 478.5 12.0 5.37 26.3 SU-06 40.0 84.5 44.5 1.83 20.3
Incl. 56.7 68.0 11.3 4.65 55.2 146.0 225.5 79.5 1.01 10.5 278.9 356.5 77.6 1.01 5.5 SU-07 162.5 207.5 45.0 0.61 6.1 SU-08 100.0 133.5 33.5 0.85 6.6 202.5 286.0 83.5 0.76 11.5 SU-09 106.5 124.5 18.0 1.04 34.0 250.5 262.5 12.0 0.67 19.7 363.5 384.5 21.0 0.85 20.6 SU-12(2) 258.0 278.6 20.6 5.33 158.8
Incl. 273.0 274.5 1.5 16949.00 8696.0 301.0 323.8 22.8 1.02 10.2 354.4 373.5 19.1 2.64 9.7 460.0 502.0 42.0 1.59 8.4 SU-17(1) 113.0 203.4 90.4 1.13 12.6 SU-29(2) 430.1 473.0 42.9 0.80 9.2 530.0 571.5 41.5 1.72 56.5
Incl. 560.8 561.3 0.5 5344.00 3740.0 SU-33 57.1 128.1 71 2.17 25.2 95 110 15 6.27 66.4 SU-34(1) 269.5 290.5 21 0.89 7.6 312.5 350 37.5 1.23 5.6 SU-35(1) 247 261 14 1.69 38.8 282.5 305.1 22.6 2.11 5.4
Incl. 292.4 305.1 12.7 3.26 6.23 SU-37 12.9 141 128.1 0.64 8.3
True thickness to be determined. (1) Ended in mineralization. (2) For the quoted average gold assays, any assay in excess of 31.1 grams of gold per tonne was cut to 31.1 grams of gold per tonne.

P&E Mining Consultants Inc., Rpt No. 173 Page 67 of 117 Brucejack Property Silver Standard Resources Inc.
10.5 SHORE ZONE
No drilling was carried out at the Shore Zone during 2009; all drilling within this zone was undertaken prior to Silver Standard‟s involvement in the Brucejack Property. 10.6 SG ZONE
The SG Zone, which is located approximately 1,200 m north of the West Zone, was also tested with four drill holes over 1271.97 m. Highlights from the SG Zone include: SU-01, which intersected 39 m of 1.06 g Au/t and SU-04, which intersected 75 m of 1.62 g Au/t, including 27 m of 2.57 g Au/t. Select intersections from the 2009 drilling at the Galena Hill Zone have been summarized in Table 10.4.
Table 10.4: 2009 SG Zone Mineralized Intersections (average grades shown)
Hole No. From (m) To (m) Interval (m)
Gold (g/tonne)
Silver (g/tonne)
SU-01 1.5 40.5 39.0 1.06 3.5 150.0 178.5 28.5 0.88 1.5
Incl. 150.0 162.0 12.0 1.28 2.2 SU-03 1.3 15.0 13.7 0.92 3.6 73.5 115.5 42.0 0.58 4.6 144.0 175.0 31.0 1.02 8.8 SU-04 11.0 18.5 7.5 1.07 9.3 45.5 56.0 10.5 0.82 3.2 137.0 161.5 24.5 0.53 6.5 215.0 290.0 75.0 1.62 4.8
Incl. 228.0 255.5 27.0 2.57 6.2 True thickness to be determined.
10.7 GOSSAN HILL ZONE
No drilling was carried out at the Gossan Hill Zone during 2009; all drilling within this zone was undertaken prior to Silver Standard‟s involvement in the Brucejack Property. 10.8 MAMMOTH ZONE
The 2009 Brucejack Property drilling program also included three drill holes (totalling 1543.57 m) testing for mineralization at the Mammoth Zone, located on the western side of the Brucejack Fault at approximately the same northing as the Bridge Zone (see Figure 3-3). Highlights from the Mammoth Zone include: SU-13, which intersected 57 m of 1.21 g Au/t and SU-15, which intersected 41.5 m of 1.01 g Au/t and19.1 g Ag/t. See Table 10.5 for select mineralized intersections from the 2009 drilling program at the Mammoth Zone.

P&E Mining Consultants Inc., Rpt No. 173 Page 68 of 117 Brucejack Property Silver Standard Resources Inc.
Table 10.5: 2009 Mammoth Zone Mineralized Intersections (average grades shown)
Hole No. From (m) To (m) Interval (m)
Gold (g/tonne)
Silver (g/tonne)
SU-13 147.0 161.0 14.0 0.98 1.7 238.5 295.5 57.0 1.21 3.0 SU-14 41.0 45.5 4.5 5.42 5.8 304.4 323.0 18.6 1.98 2.0 SU-15 407.5 449.0 41.5 1.01 19.1 493.0 518.0 25.0 1.24 4.1 True thickness to be determined.

P&E Mining Consultants Inc., Rpt No. 173 Page 69 of 117 Brucejack Property Silver Standard Resources Inc.
11.0 SAMPLING METHOD AND APPROACH
All drill core was transported by helicopter to the core handling, logging and storage facility on site at the end of each drill shift. Prior to any geotechnical and geological logging, the entire drill core was photographed in detail. Digital colour photographs were taken and the images were uploaded daily to the on-site computer. The best images for each interval of core were later filed with the digital geological logs. Core boxes were placed on the logging tables in chronologic order and a trained geotechnician recorded the core recovery and rock quality data for each measured drill run. Each piece of drill core was measured between consecutive depth blocks. The cumulative length measured by the geotechnical person divided by the length of core between two consecutive blocks recorded by the drillers gives the percentage recovery of each interval. The process was repeated for all depth intervals in each core box. The first few metres of overburden were not considered in the recovery calculations. All lithological, structural, alteration and mineralogical features of the drill core were observed and recorded during the geological logging procedure. This information was later transcribed into the computer using a program that was compatible with Gemcom software. The geologist responsible for logging assigned drill core sample intervals with the criteria that the intervals did not cross geologic contacts and the maximum sample length was 2 metres. Within any geologic unit sample intervals of 1.5 metres long could be extended or reduced to coincide with any geologic contact. Sample lengths were rarely greater than 2 metres or less than 0.5 metre, averaging 1.52 metres long. Once the logging was complete the samples were sawn in half lengthwise. One-half of the drill core was placed in a plastic sample bag and the other half was returned to its original position in the core box. The individual sample bags were tied with plastic tie-wraps. Several sample bags were placed into large woven nylon „rice‟ bags, their contents were marked on each bag, and each bag was securely sealed. These bags were stored in the core storage facility until they were shipped to the assay laboratory. Drill core was kept on-site in an outdoor storage area. Due to the remote location of the site, no additional security measures were deemed necessary. It is the author‟s opinion that the core logging procedures employed are thorough and provide sufficient geotechnical and geological information. There are no apparent drilling or recovery factors that would materially impact the accuracy and reliability of the drilling results.

P&E Mining Consultants Inc., Rpt No. 173 Page 70 of 117 Brucejack Property Silver Standard Resources Inc.
12.0 SAMPLE PREPARATION, ANALYSES AND SECURITY
The drill core samples were flown by helicopter directly to the Granduc staging site where they were transferred to a truck for transport to Stewart. From Stewart, the samples were trucked to the ALS Chemex assay laboratory in Terrace for preparation, and forwarded to the Chemex facility in Vancouver for analysis. 12.1 ALS CHEMEX LAB
ALS Chemex Laboratories is an internationally recognized minerals testing laboratory operating in 16 countries and has an ISO 9001:2000 certification. The laboratory in Vancouver has also been accredited to ISO 17025 standards for specific laboratory procedures by the Standards Council of Canada (SCC). Samples at ALS Chemex were crushed to 70% passing two millimetres. They were riffle split and 1000 grams were pulverized to 85% passing 75 microns. The remaining coarse reject material was returned to Silver Standard for storage in their Smithers warehouse for possible future use. Gold was determined using fire assay on a 30 gram aliquot with an AA finish. Silver was determined using four acid digest with ICP-AES analysis, and was also analyzed using fire assay with a gravimetric finish for very high grade samples. In addition, a 33 element package was completed using a four acid digest and ICP-AES analysis. In the author‟s opinion the sample preparation, security and analytical procedures are adequate.

P&E Mining Consultants Inc., Rpt No. 173 Page 71 of 117 Brucejack Property Silver Standard Resources Inc.
13.0 DATA VERIFICATION
13.1 SITE VISIT AND INDEPENDENT SAMPLING
The Brucejack Property was visited by Mr. Fred Brown, CPG from September 9 to September 13, 2009. Independent verification sampling was done on diamond drill core for the current 2009 program, with eight samples distributed in eight holes collected for analysis. An attempt was made to sample intervals around a reported grade of 0.50 g/t Au in each of the defined zones. The chosen sample intervals were then sampled by taking quarter splits of the remaining half-split core. The samples were then documented, bagged, and sealed with packing tape and were brought by Mr. Brown to the ALS Chemex laboratory in Terrace, British Columbia. At no time, prior to the time of sampling, were any employees or other associates of Silver Standard advised as to the location or identification of any of the samples to be collected. A comparison of the P&E independent sample verification results versus the original assay results can be seen in Figures 13-1 and 13-2.
Figure 13-1: P&E Independent Site Visit Sample Results for Gold.
0.000.100.200.300.400.500.600.700.800.90
Au (g/t)
Zone
Brucejack Lake Site VisitVerification Sample Results for Gold: September 2009
SSO Au
P&E Site Visit Au

P&E Mining Consultants Inc., Rpt No. 173 Page 72 of 117 Brucejack Property Silver Standard Resources Inc.
Figure 13-2: P&E Independent Site Visit Sample Results for Silver.
13.2 PRE-SILVER STANDARD HISTORICAL DATA & QUALITY CONTROL
The Brucejack area has been the subject of intense exploration from surface and underground from 1962 through 1994, though work was not continuous throughout this period. Four different companies explored the Brucejack Property, and an underground development program was completed on the West Zone by Newhawk Gold Mines Ltd. The total number of surface drill holes is 458, while an additional 443 holes were drilled from underground. The number of holes drilled per zone is shown in Table 13.1.
Table 13.1: Historical Drill Holes by Zone
Silver Standard retained the services of Geospark Consulting, (“Geospark”) for the purposes of verifying all historical data to ensure its integrity for use in the Resource Estimate. All hard copies of drill logs and analytical certificates were entered in digital format in a database, and a thorough verification with respect to collar coordinates, down hole surveys, azimuths, dips, sampling, analytical methods and results was completed. Historical drill core was stored on site, however it was impossible to resample due to distance markers in the boxes no longer being legible. All the pulps from the historical drilling were available and intact and it was therefore decided to reanalyze approximately 10% of them, pro-rata to the number of holes per zone. A
0.0
5.0
10.0
15.0
20.0
25.0
Ag (g/t)
Zone
Brucejack Lake Site VisitVerification Sample Results for Silver: September 2009
SSO Ag
P&E Site Visit Ag
Zone Number of drill holesWest 736Galena Hill 28SG 9Shore 56General exploration 72TOTAL 901

P&E Mining Consultants Inc., Rpt No. 173 Page 73 of 117 Brucejack Property Silver Standard Resources Inc.
total of 936 pulps were sent to ALS Chemex in Vancouver, British Columbia for Au and Ag analysis. Geospark ran a series of statistics on the historic versus 2009 pulp reruns in order to determine the precision between the pairs, and therefore the integrity of the historical data. Of the 901 holes drilled, 849 passed the QC review and were deemed acceptable for use in the Resource Estimate; the remaining 52 holes were excluded from the database. Complete results are presented in a report prepared by Geospark and listed in the reference section of this report. 13.3 P&E INDEPENDENT DATA REVIEW
The author of this section obtained the database from Geospark and completed an independent data verification which included employing essentially the same statistical methods used by Geospark. Keeping in mind that data from two different labs cannot be expected to demonstrate ideal precision, the author agrees with Geospark‟s conclusions regarding the use of 849 historical drill holes in the Resource database. 13.4 2009 DATA VERIFICATION RESULTS
The QC program for the current 2009 drilling was monitored on a real-time basis by Silver Standard throughout 2009 and any standards failing the Silver Standard QC protocols were re-run. The author received all the data for the 2009 drilling and verified the performance of the standards, blanks and duplicates. 13.4.1 PERFORMANCE OF CERTIFIED REFERENCE MATERIAL
For the Brucejack area drill program, two certified reference materials were purchased from CDN Resource Labs, which were both certified for Au, Ag, Cu, Pb and Zn. Both the standards performed very well for Au and Ag, (the other metals were not monitored). The occasional very rare failure was noted by Silver Standard, and a re-run of the samples surrounding the failed standard was made. All data used for the Resource Estimation have passed the QC protocol. 13.4.2 PERFORMANCE OF BLANK MATERIAL
The blank material used for the 2009 drill program was ¾” crushed granite sold by Imasco Minerals as landscape material. There were 879 blank sample results for both gold and silver. For gold, the blanks were generally below three times detection limit, with 29 values (3%) greater than this threshold. The highest value was 0.072 g/t Au. For silver, there were nine values (1%) greater than three times detection limit, with a high value of 8.5 g/t Ag. All of the failures were investigated, and many of them turned out to be misallocations, (not blank samples). The actual blank failures were reviewed for their impact to the Resource and no action was necessary.

P&E Mining Consultants Inc., Rpt No. 173 Page 74 of 117 Brucejack Property Silver Standard Resources Inc.
13.4.3 2009 DUPLICATE STATISTICS
For the 2009 drill program, there were 446 field core duplicate pairs and 341 pulp duplicate pairs graphed for gold, and 446 field and 231 pulp duplicate pairs graphed for silver. There were no coarse reject duplicates done. Data for the two duplicate types were graphed and three types of graphs were created. Scatter plots were made, as well as a graph of the sample pair mean versus the Absolute Relative Difference of the sample pairs (ARD), and a Thompson-Howarth (T-H) Precision Plot. The ARD and the T-H precision were in close agreement for the gold field and pulp duplicates. The ARD for the field duplicates yielded a value of approximately 30%, and the T-H value was also 30%. The ARD for the pulp duplicates was approximately 8%, and the T-H also yielded a value of 8%. The ARD and the T-H precision were in close agreement for the silver field and pulp duplicates. The ARD for the field duplicates yielded a value of approximately 43%, and the T-H value was 46%. The ARD for the pulp duplicates was approximately 5%, and the T-H yielded a value of 7%. 13.4.4 2009 EXTERNAL CHECKS
Silver Standard sent approximately 10% of the pulps to Assayers Canada Lab for checks on the principal lab, (ALS Chemex). Simple scatter plots were created for 336 pairs for gold and silver. With the exception of a rare outlier, all data fell on a 1:1 line, indicating excellent precision. The author concludes that the data are of good quality for use in the current Resource Estimates.

P&E Mining Consultants Inc., Rpt No. 173 Page 75 of 117 Brucejack Property Silver Standard Resources Inc.
14.0 ADJACENT PROPERTIES
14.1 KERR-SULPHURETS-MITCHELL PROPERTY
Seabridge Gold Inc.‟s Kerr-Sulphurets-Mitchell property (Figure 14-1), which hosts three notable copper-gold mineral deposits, namely the Kerr , Mitchell and Sulphurets, is situated immediately adjacent to the western boundary of the Brucejack and Snowfield Properties. Seabridge acquired the property from Placer Dome in June 2000 and since that time has developed it into one of the largest gold/copper deposits in the world. Through extensive drilling, Seabridge has confirmed the presence of a large, disseminated, gold-copper system known as the Mitchell Zone, with average grades in the order of 0.8 g/t Au and 0.2% Cu. The zone is a moderately dipping, roughly tabular gold-copper deposit measuring approximately 1,600 m along strike, 400 to 900 meters down dip, and at least 300 to 600 m thick. The geology, dimensions and metal distribution of the Mitchell deposit are consistent with those of a gold-enriched, low-grade copper porphyry model. The deposit remains open in the down-dip direction and to a lesser extent to the south and southeast. The Sulphurets Zone is a moderately dipping, roughly tabular gold-copper deposit measuring approximately 1,300 m along strike and up to 170 m thick and remains open down-dip and along strike. Although smaller than the Mitchell Zone, the Sulphurets Zone is an attractive target due to its proximity to the Mitchell Zone, higher gold grades, and near surface exposures. The Kerr Zone deposit has been delineated by over 26,000 m of core drilling over 144 drill holes spaced at intervals of 50 to 100 m and contains much lower gold grades than the neighbouring Sulphurets and Mitchell deposits but has higher copper grades. The mineralized area forms a mostly continuous, north-south trending and westerly dipping, irregular body at least 1700 m long, and up to 200 m thick. Higher grades are associated with crackled quartz stockwork, anhydrite veining, and chlorite alteration. Mineralization is open at depth and along strike (Lechner, 2009). In 2009, Resource Modeling Inc. (“RMI”) completed revised NI 43-101 compliant Resource Estimates for the Kerr, Sulphurets and Mitchell Zones as shown in Table 14.1 below
Table 14.1: Seabridge Gold 2009 Kerr-Sulphurets-Mitchell Resources (0.50 g/t gold
equivalent cut-off grade)
Measured Resources Indicated Mineral Resources Inferred Mineral Resources Zone Tonnes Gold Copper Tonnes Gold Copper Tonnes Gold Copper
(000) (g/t) (%) (000) (g/t) (%) (000) (g/t) (%) Mitchell 579,272 0.66 0.18 930,603 0.62 0.18 514,878 0.51 0.14 Kerr -- -- -- 225,300 0.23 0.41 69,900 0.18 0.39 Sulphurets -- -- -- 87,300 0.72 0.27 160,900 0.63 0.17
Total 579,272 0.66 0.18 1,243,203 0.56 0.23 745,678 0.50 0.17

P&E Mining Consultants Inc., Rpt No. 173 Page 76 of 117 Brucejack Property Silver Standard Resources Inc.
Figure 14-1: Kerr-Sulphurets-Mitchell Property Geology Map (after Lechner, 2009)

P&E Mining Consultants Inc., Rpt No. 173 Page 77 of 117 Brucejack Property Silver Standard Resources Inc.
A recent pit study, dated June 2009 and based on the most recent Resource model (Figure 14-2), estimated a 48 year mine life (see Seabridge News Release, dated June 10, 2009), while an updated PEA, dated July 2009, estimated a 30 year mine life recovering 19.3 million ounces of gold, 5.3 billion pounds of copper, 2.8 million ounces of silver and 1.9 million pounds of molybdenum (see Seabridge News Release, dated July 30, 2009). In July 2009, a purchase agreement was signed with Max Minerals which resulted in the doubling of the KSM land position, which will provide more exploration potential and scope for facilities (see Seabridge News Release, dated September 8, 2009). Results from the 2009 drill program which commenced in June, will be used to generate remaining data required for the 2010 preliminary feasibility study which will convert Resources to Reserves (see Seabridge News Release, dated September 10, 2009). 14.2 IRON CAP ZONE
The Iron Cap property (see Figure 14-1), also owned and operated by Seabridge, is located above the north side of Mitchell Glacier, north of Silver Standard‟s Snowfield Property. According to B.C. Geological Survey (Minfile No. 104B 173, 2008); “The 500 by 1500-metre Iron Cap Zone is a large area of well-exposed, intensely and pervasively quartz-sericite-pyrite altered intrusive and volcanic rock located in the northeast corner of the claim block. Alteration is controlled by northeast-trending, near-vertical structures with associated stockwork fractures and veins. Pyrite content varies from 10 % to 70 % and averages about 25 %. To the west, the intense quartz-sericite-pyrite alteration of the Iron Cap Zone gradually weakens and primary intrusive textures can be observed. Mapping by Noranda has delineated a northeast trending intrusion intermittently exposed over 200 by 800 m now referred to as the Iron Cap West zone. This zone is a strongly altered granodiorite, laced with a fine- to medium-grained quartz stockwork of varying intensity. Fracture coating and disseminated chalcopyrite and malachite, with minor pyrite, occurs throughout the intrusion. Forty partially leached rock chip samples collected by Noranda over an area of 1200 by 300 m from the Iron Cap West and adjacent Iron Cap Zone averaged 1.0 gram per tonne gold and 0.32 per cent copper (Press Release, Seabridge Gold Inc., July 25, 2005).” The qualified persons for this technical report have not verified the above information relating to Seabridge‟s Kerr-Sulphurets-Mitchell and Iron Cap properties and the information is not necessarily indicative of the mineralization of the Brucejack Property.

P&E Mining Consultants Inc., Rpt No. 173 Page 78 of 117 Brucejack Property Silver Standard Resources Inc.
Figure 14-2: Plan Map of the KSM Property PEA 2008 Pit Perimeters (after Wardrop,
2009b)

P&E Mining Consultants Inc., Rpt No. 173 Page 79 of 117 Brucejack Property Silver Standard Resources Inc.
15.0 MINERAL PROCESSING AND METALLURGICAL TESTING
Silver Standard prepared composite samples from the West, Bridge, Galena Hill and SG Zones in late 2009. These samples have been sent for testing to Process Research Associates in Richmond, B.C., and no results have been received as of the date of this report. The metallurgical program will test various process options and then proceed with various optimization studies of the preferred process. Table 15.1 gives details of the Brucejack Property composite samples. No other mineral processing or metallurgical testing has been undertaken by Silver Standard for any of the zones located within the Brucejack Property. Past metallurgical testing has been covered in Section 5.5 of this report.
Table 15.1: Brucejack Property Composite Sample Locations
Zone Hole From (m)
To (m) Interval Average
Au ppm Average Ag ppm
Approximate Weight (kgs)
SG Zone SU-04 228.50 255.50 27.00 2.57 6.17 72.0 Galena Hill SU-05 323.50 378.00 54.50 1.31 41.26 145.3 Galena Hill SU-06 25.00 68.00 43.00 2.55 69.10 114.7 Galena Hill SU-06 146.00 210.50 64.50 1.06 11.59 172.0 Bridge Zone SU-010 221.50 285.00 63.50 0.72 10.34 169.3 Bridge Zone SU-019 368.00 419.50 51.50 1.60 7.52 137.3 Bridge Zone SU-021 136.00 196.65 60.65 0.71 13.54 161.7 Bridge Zone SU-21 498.40 551.10 52.70 2.73 15.02 140.5 Bridge Zone SU-25 77.50 128.14 50.64 2.22 13.50 135.0 Bridge Zone SU-27 0.91 58.00 57.09 0.86 4.16 152.2 West Zone SU-32 335.35 383.00 47.65 1.91 15.60 127.1 West Zone SU-32 421.00 454.00 33.00 1.05 105.79 88.0 West Zone SU-32 535.00 568.00 33.00 2.89 9.62 88.0 Galena Hill SU-33 68.40 111.50 43.10 3.08 37.16 114.9 West Zone SU-36 48.00 69.50 21.50 1.52 12.58 57.3 West Zone SU-36 234.50 272.00 37.50 0.64 5.25 100.0

P&E Mining Consultants Inc., Rpt No. 173 Page 80 of 117 Brucejack Property Silver Standard Resources Inc.
16.0 MINERAL RESOURCE ESTIMATES 16.1 INTRODUCTION The Mineral Resource Estimate presented herein is reported in accordance with the Canadian Securities Administrators‟ National Instrument 43-101 and has been estimated in conformity with generally accepted CIM “Estimation of Mineral Resource and Mineral Reserves Best Practices” (2005) guidelines. Mineral Resources are not Mineral Reserves and do not have demonstrated economic viability. There is no guarantee that all or any part of the Mineral Resource will be converted into Mineral Reserve. The quantity and grade of reported Inferred Mineral Resources in this Estimate are conceptual in nature. All Resource estimation work reported herein was carried out by FH Brown, MSc (Eng) CPG Pr.Sci.Nat., and Eugene Puritch, P.Eng., both independent Qualified Persons in terms of NI 43-101, from information and data supplied by Silver Standard Resources Inc. The effective date of these Estimates is December 1, 2009. A draft copy of this report was reviewed by Silver Standard for factual errors. Mineral Resource modeling and estimation were carried out using the commercially available GEMS Gemcom v5.23 and Snowden Supervisor v7.10.11 software programs. Pit shell optimization was carried out using Whittle Four-X Single Element v1.10. This Resource Estimate encompasses six distinct modeled mineralization zones, viz. the West Zone, Shore Zone, Gossan Hill Zone, Galena Hill Zone, SG Zone and Bridge Zone. 16.2 PREVIOUS RESOURCE ESTIMATES
A previous public Mineral Resource Estimate for the Brucejack deposits dated April 16, 2001 was prepared by Pincock Allen & Holt Ltd1. The Mineral Resource Estimate reported a total Measured and Indicated Mineral Resource of 421,400 ozs Au and an Inferred Mineral Resource of 82,000 ozs of Au (Table 16.1), based on a gold-equivalent cutoff derived from a Ag:Au equivalency ratio of 66:1.
Table 16.1: Pincock Allen & Holt Ltd. April 16, 2001 Mineral Resource Estimate.
Zone Class AuEq Cutoff
Tonnes x 1000 Au g/t Ag g/t Au ozs
x 1000 Ag ozs x 1000
West MEA 0.1 opt 144.0 15.09 594 69.8 2,750.4 West IND 0.1 opt 899.5 10.98 482 317.5 13,942.3 Shore IND 0.2 opt 92.3 11.54 143 34.2 424.6
TOTAL IND 991.8 11.03 451 351.8 14,366.8 TOTAL MEA + IND 1,135.8 11.54 470 421.4 17,150.6
West INF 0.1 opt 51.6 5.82 249 9.6 412.8 SG INF 0.2 opt 46.2 9.21 25 13.7 37.0 Galena Hill INF 0.2 opt 30.9 24.39 271 24.2 268.8 Gossan Hill INF 0.2 opt 22.6 47.34 62 34.4 45.2
TOTAL INF 51.3 16.86 156 82.0 756.5
1 Sulphurets-Bruceside property British Columbia technical report, Pincock Allen & Holt Ltd., dated April 16, 2001.

P&E Mining Consultants Inc., Rpt No. 173 Page 81 of 117 Brucejack Property Silver Standard Resources Inc.
16.3 SAMPLE DATABASE
Sample data were provided by Silver Standard in the form of ASCII text files and Excel spreadsheets. Data included historical surface drilling records, historical underground drilling records, and current Silver Standard drilling records. The supplied databases contains records for 929 drillholes. Of these, 85 drillholes were outside the block model limits or had no reported assay data. The 844 drillhole records (Table 16.2) used for this Mineral Resource Estimate contain collar, survey and assay data. Assay data fields consist of the drillhole ID, downhole interval distances, sample number, Au grades and Ag grades. All data are in metric units and all collar coordinates were converted by Silver Standard to the UTM NAD27 system.
Table 16.2: Drilling database records.
Data Type Record Count Historical Surface Drilling 365
Historical UG Drilling 442 Silver Standard Surface Drilling 37
TOTAL 844 The database contains a total of 51,985 Au assays and 51,049 Ag assays. Due to the varying assay protocols in use during different project phases, the following low grade conversions were used: For the historical drilling, Au assay grades less than 0.17g/t were converted to 0.085g/t, and Ag assay grades less than 1.71g/t were converted to 0.85g/t For the current Silver Standard drilling program, Au assay grades less than 0.005g/t were converted to 0.0025g/t, and Ag assay grades less than 0.5g/t were converted to 0.025g/t. Silver Standard also provided an AutoCAD format wireframe of the historical underground mining development at the West Zone. Historic mine plans were used to digitize the underground development. Underground workings were digitized on 44 east-west sections in the mine grid coordinate system using AutoCAD software. Section lines were generally spaced every 10 m, with a reduction to 5 m spacing in areas of more complex development (i.e., in areas of multiple tunnels, junctions etc.). The digitized data were converted to UTM NAD27 coordinates using the McElhanney conversion factors, imported into the Gemcom mining software, and used to generate a single three dimensional solid to represent the underground workings. 16.4 DATABASE VALIDATION
Industry standard validation checks were completed on the supplied database, and minor corrections made. P&E typically validates a Mineral Resource database by checking for inconsistencies in naming conventions or analytical units, duplicate entries, interval, length or distance values less than or equal to zero, blank or zero-value assay results, out-of-sequence intervals, intervals or distances greater than the reported drill hole length, inappropriate collar

P&E Mining Consultants Inc., Rpt No. 173 Page 82 of 117 Brucejack Property Silver Standard Resources Inc.
locations, and missing interval and coordinate fields. No significant discrepancies with the supplied data were noted. Downhole surveys for the current drilling were completed by Silver Standard with a Reflex EZ-Shot magnetic instrument. Measurements were taken every 100 m unless drastic deviations occurred, in which case additional measurements were taken every 50 m to eliminate error. Downhole survey data were examined by P&E for significant deviations. Of the 190 survey measurements reported for the current Silver Standard drilling program, three measurements reported a downhole survey deviation from the previous measurement of greater than 5°, with a maximum reported difference of 10.2°. Surface drillhole orientations were also reviewed by P&E. Eleven historical surface drillholes reported a plunge of less than 30°, and should be reviewed against historical records. P&E also notes that the majority of the surface drillholes completed by Silver Standard are sub-parallel to identified structural orientations at Brucejack, and recommends additional drilling moving forward to further define mineralization trends in the project area (Figure 16-1).
Figure 16-1: Surface drillhole orientations.

P&E Mining Consultants Inc., Rpt No. 173 Page 83 of 117 Brucejack Property Silver Standard Resources Inc.
16.5 TOPOGRAPHIC CONTROL
For the Brucejack project, aerial photography specialists Aero Geometrics was contracted by Silver Standard to produce a topographic map of the property. Using high-resolution photographs taken from a small airplane in 2008, a photo-mosaic was first made of the Brucejack Property. Using this photo-mosaic and elevation data obtained from 1:50,000 scale national topographic maps published in 1979 by the Surveys and Mapping Branch of the Department of Energy, Mines & Resources, Aero Geometrics digitally generated a contoured topographic map with contour lines spaced at two-meter intervals and presented this map as digital elevation model, or DEM, in .dxf (Autocad) format. In order for this topographic map to be consistent with the NAD27, Zone 9 UTM grid system being used by Silver Standard for the projects, it was necessary to make minor adjustments (vertical and lateral shifts) to the positioning of the DEM. These adjustments were carried out by various workers, including geological consultants and McElhanney technicians, and were checked against numerous topographic points (historic and 2009 Brucejack drill hole collars, the western shoreline of Brucejack Lake, historic mine grid stations) that had been surveyed by McElhanney field crews in 2009. 16.6 DENSITY
A total of 312 bulk density measurements were provided by Silver Standard, with an average bulk density of 2.73 t/m3 (Table 16.3). Density measurements were obtained from core samples by ALS Chemex. For the West Zone a value of 2.75 t/m3 was used historically2. As this value is in good agreement with the average density reported by Silver Standard, a global bulk density value of 2.75 t/m3 was assigned to all lithologies for this Mineral Resource Estimate.
Table 16.3: Bulk density statistics.
Count 312 Minimum 2.21 t/m3 Maximum 3.28 t/m3 Average 2.73 t/m3 Standard Deviation 0.14
16.7 DOMAIN MODELING
Six mineralization zones at Brucejack have been identified by Silver Standard, with the West Zone and Shore Zone considered by Silver Standard as being predominately structurally controlled vein systems related to the north-trending Brucejack Fault, and the other zones tentatively defined as mineralized stockwork/breccia/vein systems. The overall trend of the West Zone and Shore Zone mineralization is ~135°, and modeling for these zones was generating from successive polylines spaced every ten meters and oriented perpendicular to the trend of the mineralization. The outlines of the polylines were defined by the selection of mineralized material at or above 0.5g/t Au with demonstrated continuity along strike and down dip. In some cases mineralization below 0.5g/t Au was included for the purpose of
2 ibid.

P&E Mining Consultants Inc., Rpt No. 173 Page 84 of 117 Brucejack Property Silver Standard Resources Inc.
1000m
SG ZONE
SHORE ZONE
WEST ZONE
BRIDGE ZONE
GOSSAN HILL
GALENA HILL
1000m
SG ZONE
SHORE ZONE
WEST ZONE
BRIDGE ZONE
GOSSAN HILL
GALENA HILL
1000m
SG ZONE
SHORE ZONE
WEST ZONE
BRIDGE ZONE
GOSSAN HILL
GALENA HILL
maintaining continuity. All polyline vertices were snapped directly to drillhole assay intervals, in order to generate a true three-dimensional representation of the extent of the mineralization. For the Gossan Hill Zone, Galena Hill Zone, SG Zone and Bridge Zone, mineralization models were generated from successive polylines spaced every twenty-five meters and oriented north-south. The outlines of the polylines were defined by the selection of mineralized material at or above 0.5g/t Au with demonstrated continuity along strike and down dip. In some cases mineralization below 0.5g/t Au was included for the purpose of maintaining continuity. All polyline vertices were snapped directly to drillhole assay intervals, in order to generate a true three-dimensional representation of the extent of the mineralization. In order to ensure that all potential economic mineralization was captured for Mineral Resource estimation, a secondary mineralization halo for the Bridge Zone was subsequently modeled using a 0.2g/t Au-equivalent value, based on the parameters listed in Table 16.4. The highest assay sample grades reported for the current SSR drilling program (16948.5 g/t Au and 8695.5g/t Ag) were recovered from inside this halo, highlighting the potential for high-grade precious metal vein systems within the Bridge Zone. Three-dimensional models of the mineralization domains were then created by combining successive polylines into wireframes (Figure 16-2). P&E notes that the use of large-scale mineralization domaining is likely to bias the contribution of high grade veins within the various mineralization domains.
Table 16.4: Au-equivalent parameters.
Commodity Price Recovery Au Equivalency Au US$800.00/oz 75% 1.00 Ag US$12.00/oz 73% 0.015
Figure 16-2: Isometric view of the Brucejack domains.

P&E Mining Consultants Inc., Rpt No. 173 Page 85 of 117 Brucejack Property Silver Standard Resources Inc.
Ag Assays TOTAL WEST ZONE
SHORE ZONE
GOSSAN HILL
GALENA HILL SG ZONE BRIDGE
ZONE BZ HALO
Samples 34728 22774 1523 1876 2199 347 3511 2498Minimum 0.25 0.86 0.86 0.70 0.25 0.25 0.25 0.25Maximum 37636.40 37636.40 15340.50 2982.86 1490.00 130.97 774.00 8695.50Mean 87.65 124.25 49.05 13.64 19.53 8.81 10.13 12.99St Dev 595.82 721.08 426.54 77.48 63.20 10.23 34.47 195.93CV 6.80 5.80 8.70 5.68 3.24 1.16 3.40 15.08
Au Assays TOTAL WEST ZONE
SHORE ZONE
GOSSAN HILL
GALENA HILL SG ZONE BRIDGE
ZONE BZ HALO
Samples 34728 22774 1523 1876 2199 347 3511 2498Minimum 0.002 0.012 0.085 0.002 0.009 0.005 0.002 0.002Maximum 16948.500 2519.900 9490.870 368.260 135.600 18.510 384.000 16948.500Mean 3.736 3.305 13.723 1.456 1.290 1.475 0.979 9.632St Dev 116.878 34.311 293.532 12.293 4.535 2.134 7.087 355.540CV 31.284 10.381 21.390 8.444 3.515 1.446 7.241 36.912
16.8 COMPOSITING
Assay sample lengths for the database range from 0.01m to 48.00m, with an average sample length of 1.52m. A compositing length of 1.50m was therefore selected for use during estimation. Length-weighted composites were calculated for Au and Ag within the defined mineralization domains. Missing sample intervals in the historical data were assigned a nominal background grade of 0.001g/t Au or 0.001g/t Ag. The compositing process started at the first point of intersection between the drillhole and the domain intersected, and halted upon exit from the domain wireframe. Composites that were less than 0.5m in length were discarded so as to not introduce a short sample bias into the estimation process. The wireframes that represented the interpreted mineralization domains were also used to back-tag a rock code field into the drillhole workspace. Each assay and composite were assigned a domain rock code value based on the domain wireframe that the interval midpoint fell within. The composite data were then exported to Gemcom extraction files for grade estimation. 16.9 EXPLORATORY DATA ANALYSIS
Summary assay statistics (Table 16.5) and summary composite statistics (Table 16.6) were calculated by domain for each commodity. Comparison of the data sets suggests that additional drilling will be required moving forward in order to identify individual higher grade vein sets within the defined mineralization domains. A comparison of the data sets also demonstrates the difference in grade distributions within the mineralization domains (Figure 16-3).
Table 16.5: Summary assay statistics by domain.

P&E Mining Consultants Inc., Rpt No. 173 Page 86 of 117 Brucejack Property Silver Standard Resources Inc.
Ag Composites TOTAL WEST
ZONESHORE ZONE
GOSSAN HILL
GALENA HILL SG ZONE BRIDGE
ZONE BZ HALO
Samples 33684 22014 1676 1774 1990 321 3366 2543Minimum 0.001 0.001 0.402 0.001 0.250 0.379 0.250 0.149Maximum 28781.600 28781.600 1410.690 1493.950 905.188 93.327 653.720 4572.290Mean 66.360 94.090 28.231 11.761 17.309 7.977 9.102 11.073St Dev 373.990 457.055 84.499 53.733 42.963 8.590 23.750 126.506CV 5.636 4.858 2.993 4.569 2.482 1.077 2.609 11.425
Au Composites TOTAL WEST
ZONESHORE ZONE
GOSSAN HILL
GALENA HILL SG ZONE BRIDGE
ZONE BZ HALO
Samples 33684 22014 1676 1774 1990 321 3366 2543Minimum 0.001 0.001 0.034 0.001 0.029 0.007 0.040 0.002Maximum 8905.310 1639.000 701.964 173.214 90.694 14.025 97.147 8905.310Mean 2.755 2.710 2.849 1.209 1.164 1.294 0.887 8.061St Dev 68.867 22.597 22.387 6.980 3.069 1.791 3.007 240.831CV 24.997 8.338 7.857 5.772 2.636 1.384 3.390 29.875
Table 16.6: Summary composite statistics by domain.
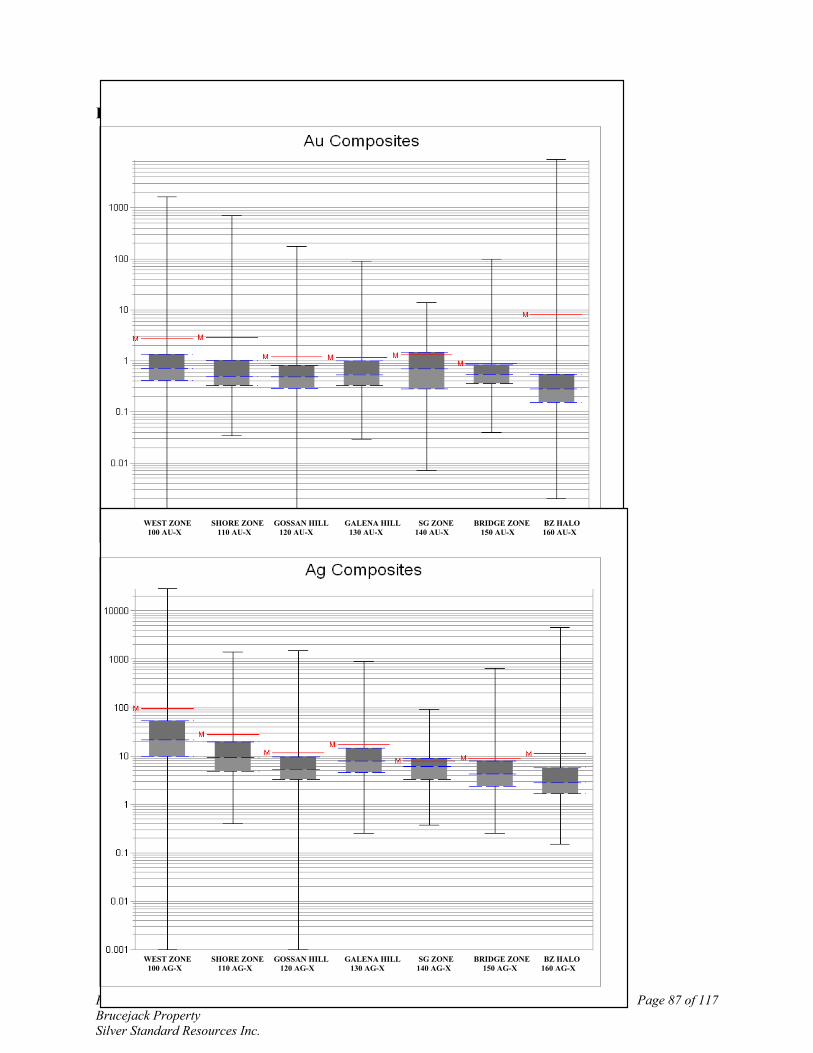
P&E Mining Consultants Inc., Rpt No. 173 Page 87 of 117 Brucejack Property Silver Standard Resources Inc.
Figure 16-3: Box and Whisker plots of composite statistics by domain.
WEST ZONE SHORE ZONE GOSSAN HILL GALENA HILL SG ZONE BRIDGE ZONE BZ HALO 100 AU-X 110 AU-X 120 AU-X 130 AU-X 140 AU-X 150 AU-X 160 AU-X
WEST ZONE SHORE ZONE GOSSAN HILL GALENA HILL SG ZONE BRIDGE ZONE BZ HALO 100 AG-X 110 AG-X 120 AG-X 130 AG-X 140 AG-X 150 AG-X 160 AG-X

P&E Mining Consultants Inc., Rpt No. 173 Page 88 of 117 Brucejack Property Silver Standard Resources Inc.
16.10 TREATMENT OF EXTREME VALUES
The presence of high-grade outliers was evaluated by examining composite cutting graphs, histograms and log-probability graphs for the defined mineralization domains. For the Bridge Zone, Galena Hill, Gossan Hill, SG Zone and Shore Zone, threshold values (Table 16.7) were selected that minimize rapid changes in the composite sample distribution. The influence of composite samples equal to or higher than the threshold value selected was restricted during estimation to 30m, in order to limit the influence of higher grade assay values on the overall stockwork mineralization captured within the defined mineralization domains. For the West Zone and the Bridge Zone Halo, capping limits were implemented on composites exceeding these values during estimation.
Table 16.7: Capping and threshold values.
COMMODITY Au g/t Ag g/t Bridge Zone 8.00 160
Bridge Zone Halo 4.00 160 Galena Hill 16.00 260 Gossan Hill 20.00 160
SG Zone 10.00 40 Shore Zone 80.00 550 West Zone 60.00 2300
16.11 VARIOGRAPHY
For the Bridge Zone, Galena Hill, Gossan Hill, SG Zone and Shore Zone mineralization domains, anisotropy was determined for each commodity from ellipsoids fitted to directional exponential correlograms oriented along azimuths spaced 30° apart and calculated at dips of 0°, 30°, 60° and 90°. The correlograms were derived from composite values.
For the West Zone, indicator exponential correlograms based on 8.00g/t Au and 90g/t Ag discriminators were generated for azimuths spaced 30° apart and calculated at dips of 0°, 30°, 60° and 90°. The correlograms were derived from composite values.
The resulting ellipsoids were used as the basis for estimation search ranges, distance calculations and Mineral Resource classification (Table 16.8). The correlograms represent ranges of continuity somewhat commensurate with the drilling spacing and cannot therefore be considered to be truly representative of the underlying mineralization.

P&E Mining Consultants Inc., Rpt No. 173 Page 89 of 117 Brucejack Property Silver Standard Resources Inc.
Table 16.8: Domain anisotropy definitions.
Bridge Zone Galena Hill Range Azimuth Dip Range Azimuth Dip
Au
Z 7 121 30 13 192 45 Y 59 304 60 94 324 34 X 387 032 -1 30 073 26
CO 0.7 0.6 C1 0.3 0.4
Ag
Z 559 026 45 221 286 43 Y 33 299 -3 29 307 -45 X 62 032 -45 43 026 10
CO .8 .8 C1 .2 .2
SG Zone Shore Zone
Range Azimuth Dip Range Azimuth Dip
Au
Z 66 197 74 22 304 25 Y 271 290 1 132 307 -65 X 19 021 16 18 035 1
CO 0.4 .9 C1 0.6 .1
Ag
Z 18 181 37 15 327 37 Y 190 266 -45 206 010 -45 X 25 331 23 26 075 23
CO 0.5 0.8 C1 0.5 0.2
Gossan Hill West Zone Indicator
Range Azimuth Dip Range Azimuth Dip
Au
Z 4 159 50 45 281 50 Y 37 269 17 34 32 17 X 9 012 35 9 008 35
CO 0.5 0.7 C1 0.5 0.3
Ag
Z 11 17 43 50 254 71 Y 9 330 -36 41 303 -12 X 20 80 -26 15 030 14
CO 0.4 0.6 C1 0.6 0.4

P&E Mining Consultants Inc., Rpt No. 173 Page 90 of 117 Brucejack Property Silver Standard Resources Inc.
16.12 BLOCK MODELS
An orthogonal block model was established across the property for the Bridge Zone, Galena Hill, Gossan Hill, SG Zone and Shore Zone mineralization domains (Table 16.9). A separate rotated block model was established for the West Zone (Table 16.10). Each block model consists of separate models for Au estimated grades, Ag estimated grades, associated rock codes, percent, density and classification attributes and a calculated Au-equivalent (“AuEq”) grade. A percent block model was used to accurately represent the volumes and tonnages that were contained within the respective mineralization domains. As a result, domain boundaries were properly represented by the percent model‟s capacity to measure infinitely variable inclusion percentages within a specific domain. The volume of the defined historical workings was also calculated for the West Zone and depleted from the model prior to estimation.
Table 16.9: Brucejack block model setup.
Origin Blocks Size X 425,800 80 25m Y 6,256,500 140 25m Z 2,000 100 10m
Rotation None
Table 16.10: West Zone block model setup.
Origin Blocks Size X 426,800 150 10 Y 6,257,600 150 10 Z 1,600 90 10
Rotation 40° 16.13 ESTIMATION & CLASSIFICATION
The Mineral Resource Estimate was constrained by wireframes that form hard boundaries between the respective composite assay data files. Individual block grades were used to calculate a Au-equivalent grade model. For the Bridge Zone, Galena Hill, Gossan Hill, SG Zone and Shore Zone mineralization domains, block grades were estimated using Inverse Distance Cubed (ID3) linear weighting of composite values. A two-pass series of expanding search ellipses with varying minimum sample requirements was used for sample selection and classification, and sample distances were adjusted by the defined anisotropy. During the first pass, eight to twelve composite values from two or more drillholes within a search ellipse corresponding to the defined ranges were required for estimation. All block grades estimated during the first pass were classified as Indicated, with a total of 6,275 blocks estimated. During the second pass, blocks not populated during the first pass were estimated. Three to twelve composite values from one or more drillholes within a search ellipse corresponding to
P&E Mining Consultants Inc., Rpt No. 173 Page 91 of 117 Brucejack Property Silver Standard Resources Inc.
about 200% of the defined range were required for estimation. All block grades estimated during the second pass were classified as Inferred, with a total of 10,049 blocks estimated. For the West Zone mineralization domain the block estimates were calculated using a two-bin Indicator Kriging (IK) partition of each commodity. Based on the defined indicator correlograms, for each block a high-grade probability, high grade estimate and low-grade estimate were calculated and then combined into a single block estimate. A three-pass series of expanding search ellipses with varying minimum sample requirements were used for sample selection and classification: During the West Zone first pass, twelve composite values from one or more drillholes within a search ellipse corresponding to 15% of the defined range were required for estimation. All block grades estimated during the first pass were classified as Measured, with a total of 4,433 blocks estimated. During the West Zone second pass, blocks not populated during the first pass were estimated. Eight to twelve composite values from one or more drillholes within a search ellipse corresponding to 100% of the defined range were required for estimation. All block grades estimated during the second pass were classified as Indicated, with a total of 9,500 blocks estimated. During the West Zone third pass, blocks not populated during the first or second pass were estimated. Three to twelve composite values from one or more drillholes within a search ellipse corresponding to 200% of the defined range were required for estimation. All block grades estimated during the third pass were classified as Inferred, with a total of 770 blocks estimated. For the Bridge Zone Halo mineralization domain, block estimates were calculated using Inverse Distance Cubed weighting of the nearest six capped composites within the defined Bridge Zone Halo. All blocks estimated during this pass were classified as Inferred, with a total of 18,325 blocks estimated. 16.14 RESOURCE ESTIMATE
Mineral Resources were classified in accordance with guidelines established by the Canadian Institute of Mining, Metallurgy and Petroleum, November 11, 2005: Inferred Mineral Resource: “An „Inferred Mineral Resource‟ is that part of a Mineral Resource for which quantity and grade or quality can be estimated on the basis of geological evidence and limited sampling and reasonably assumed, but not verified, geological and grade continuity. The Estimate is based on limited information and sampling gathered through appropriate techniques from locations such as outcrops, trenches, pits, workings and drillholes.” Indicated Mineral Resource: “An „Indicated Mineral Resource‟ is that part of a Mineral Resource for which quantity, grade or quality, densities, shape and physical characteristics, can be estimated with a level of confidence sufficient to allow the appropriate application of technical and economic parameters, to support mine planning and evaluation of the economic

P&E Mining Consultants Inc., Rpt No. 173 Page 92 of 117 Brucejack Property Silver Standard Resources Inc.
viability of the deposit. The Estimate is based on detailed and reliable exploration and testing information gathered through appropriate techniques from locations such as outcrops, trenches, pits, workings and drillholes that are spaced closely enough for geological and grade continuity to be reasonably assumed.” Measured Mineral Resource: “A „Measured Mineral Resource‟ is that part of a Mineral Resource for which quantity, grade or quality, densities, shape, and physical characteristics are so well established that they can be estimated with confidence sufficient to allow the appropriate application of technical and economic parameters, to support production planning and evaluation of the economic viability of the deposit. The Estimate is based on detailed and reliable exploration, sampling and testing information gathered through appropriate techniques from locations such as outcrops, trenches, pits, workings and drillholes that are spaced closely enough to confirm both geological and grade continuity.” In order to ensure that the reported Mineral Resources meet the CIM requirement for “reasonable prospects for economic extraction”, conceptual Lerchs-Grossman optimized pit shells were developed based on all available Mineral Resources (Measured, Indicated and Inferred), using the economic parameters listed in Table 16.11 (Figure 16-4). Based on knowledge of Mineral Resource projects in the vicinity of Brucejack, Silver Standard mandated the use of a 0.35g/t AuEq cutoff for the reporting of Mineral Resources at Brucejack. The results from the optimized pit-shells are used solely for the purpose of reporting Mineral Resources that have reasonable prospects for economic extraction.
Table 16.11: Optimized pit-shell parameters.
Tailings & Water US$0.80/rock tonne Mining Cost US$1.75/rock tonne
Processing Cost US$5.00/ore tonne Process Recovery Au 75%, Ag 73%
G&A US$1.00/ore tonne Pit Wall Slope Angle 50°

P&E Mining Consultants Inc., Rpt No. 173 Page 93 of 117 Brucejack Property Silver Standard Resources Inc.
1000m
SG ZONE
SHORE ZONE
WEST ZONE
BRIDGE ZONE
GOSSAN HILL
GALENA HILL
1000m
SG ZONE
SHORE ZONE
WEST ZONE
BRIDGE ZONE
GOSSAN HILL
GALENA HILL
1000m
SG ZONE
SHORE ZONE
WEST ZONE
BRIDGE ZONE
GOSSAN HILL
GALENA HILL
Figure 16-4: Conceptual optimized pit shells.
All Mineral Resources were tabulated against a mandated 0.35g/t Au equivalent cutoff, as constrained within the optimized pit shell (Table 16.12 and Table 16.13).
Table 16.12: Combined Mineral Resource Estimate at a 0.35g/t AuEq cutoff1,2,3
.
Class Tonnes x M Au g/t Ag g/t Au ozs
x M Ag ozs
x M Measured 9.9 2.06 75.0 0.66 23.8 Indicated 110.7 0.95 11.7 3.38 41.6 Measured + Indicated 120.5 1.04 16.9 4.04 65.4 Inferred 198 0.76 11.2 4.87 71.5
(1) Resource sensitivities are accumulated within an optimized pit shell. (2) Mineral Resources which are not Mineral Reserves do not have demonstrated economic viability. The Estimate of Mineral Resources may be materially affected by environmental, permitting, legal, title, taxation, socio-political, marketing, or other relevant issues. (3) The quantity and grade of reported Inferred Resources in this estimation are conceptual in nature. There is no guarantee that all or any part of the Mineral Resource will be converted into Mineral Reserve.

P&E Mining Consultants Inc., Rpt No. 173 Page 94 of 117 Brucejack Property Silver Standard Resources Inc.
Table 16.13: Mineral Resource Estimates by domain at a AuEq 0.35g/t cutoff1,2,3
.
Bridge Zone Tonnes x M Au g/t Ag g/t Au ozs
x M Ag ozs
x M Measured 0.0 0.00 0.0 0.00 0.0 Indicated 88.2 0.80 7.9 2.27 22.4 Measured + Indicated 88.2 0.80 7.9 2.27 22.4 Inferred 80.4 0.81 12.9 2.09 33.5
Bridge Zone Halo Tonnes x M Au g/t Ag g/t Au ozs
x M Ag ozs
x M Measured 0.0 0.00 0.0 0.00 0.0 Indicated 0.0 0.00 0.0 0.00 0.0 Measured + Indicated 0.0 0.00 0.0 0.00 0.0 Inferred 88.9 0.67 9.5 1.90 27.2
SG ZONE Tonnes x M Au g/t Ag g/t Au ozs
x M Ag ozs
x M Measured 0.0 0.00 0.0 0.00 0.0 Indicated 0.0 0.00 0.0 0.00 0.0 Measured + Indicated 0.0 0.00 0.0 0.00 0.0 Inferred 1.1 1.27 7.6 0.05 0.3
SHORE ZONE Tonnes x M Au g/t Ag g/t Au ozs
x M Ag ozs
x M Measured 0.0 0.00 0.0 0.00 0.0 Indicated 1.6 5.40 26.3 0.27 1.3 Measured + Indicated 1.6 5.40 26.3 0.27 1.3 Inferred 1.6 1.59 12.0 0.08 0.6
GOSSAN HILL Tonnes x M Au g/t Ag g/t Au ozs
x M Ag ozs
x M Measured 0.0 0.00 0.0 0.00 0.0 Indicated 0.5 2.59 10.6 0.04 0.2 Measured + Indicated 0.5 2.59 10.6 0.04 0.2 Inferred 9.0 0.92 12.6 0.27 3.7
GALENA HILL Tonnes x M Au g/t Ag g/t Au ozs
x M Ag ozs
x M Measured 0.0 0.00 0.0 0.00 0.0 Indicated 6.9 1.10 17.8 0.25 4.0 Measured + Indicated 6.9 1.10 17.8 0.25 4.0 Inferred 16.6 0.87 11.0 0.47 5.9
WEST ZONE Tonnes x M Au g/t Ag g/t Au ozs
x M Ag ozs
x M Measured 9.9 2.06 75.0 0.66 23.8 Indicated 13.5 1.27 31.7 0.55 13.8 Measured + Indicated 23.4 1.61 50.0 1.21 37.6 Inferred 0.5 1.01 30.8 0.02 0.5
(1) Resource sensitivities are accumulated within an optimized pit shell. (2) Mineral Resources which are not Mineral Reserves do not have demonstrated economic viability. The Estimate of Mineral Resources may be materially affected by environmental, permitting, legal, title, taxation, socio-political, marketing, or other relevant issues. (3) The quantity and grade of reported Inferred Resources in this estimation are conceptual in nature. There is no guarantee that all or any part of the Mineral Resource will be converted into Mineral Reserve.
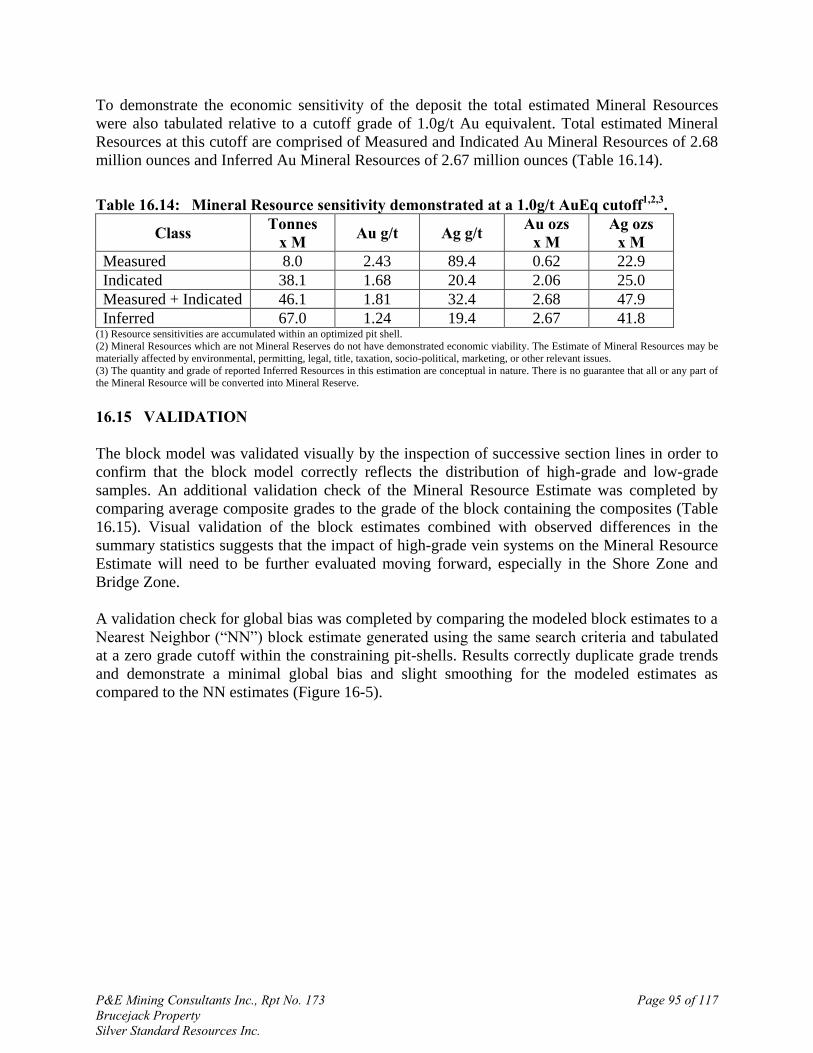
P&E Mining Consultants Inc., Rpt No. 173 Page 95 of 117 Brucejack Property Silver Standard Resources Inc.
To demonstrate the economic sensitivity of the deposit the total estimated Mineral Resources were also tabulated relative to a cutoff grade of 1.0g/t Au equivalent. Total estimated Mineral Resources at this cutoff are comprised of Measured and Indicated Au Mineral Resources of 2.68 million ounces and Inferred Au Mineral Resources of 2.67 million ounces (Table 16.14).
Table 16.14: Mineral Resource sensitivity demonstrated at a 1.0g/t AuEq cutoff1,2,3
.
Class Tonnes x M Au g/t Ag g/t Au ozs
x M Ag ozs
x M Measured 8.0 2.43 89.4 0.62 22.9 Indicated 38.1 1.68 20.4 2.06 25.0 Measured + Indicated 46.1 1.81 32.4 2.68 47.9 Inferred 67.0 1.24 19.4 2.67 41.8
(1) Resource sensitivities are accumulated within an optimized pit shell. (2) Mineral Resources which are not Mineral Reserves do not have demonstrated economic viability. The Estimate of Mineral Resources may be materially affected by environmental, permitting, legal, title, taxation, socio-political, marketing, or other relevant issues. (3) The quantity and grade of reported Inferred Resources in this estimation are conceptual in nature. There is no guarantee that all or any part of the Mineral Resource will be converted into Mineral Reserve. 16.15 VALIDATION
The block model was validated visually by the inspection of successive section lines in order to confirm that the block model correctly reflects the distribution of high-grade and low-grade samples. An additional validation check of the Mineral Resource Estimate was completed by comparing average composite grades to the grade of the block containing the composites (Table 16.15). Visual validation of the block estimates combined with observed differences in the summary statistics suggests that the impact of high-grade vein systems on the Mineral Resource Estimate will need to be further evaluated moving forward, especially in the Shore Zone and Bridge Zone. A validation check for global bias was completed by comparing the modeled block estimates to a Nearest Neighbor (“NN”) block estimate generated using the same search criteria and tabulated at a zero grade cutoff within the constraining pit-shells. Results correctly duplicate grade trends and demonstrate a minimal global bias and slight smoothing for the modeled estimates as compared to the NN estimates (Figure 16-5).

P&E Mining Consultants Inc., Rpt No. 173 Page 96 of 117 Brucejack Property Silver Standard Resources Inc.
MINIMUM MAXIMUM AVERAGE ST DEV CV
Au Block Estimate 0.16 48.05 2.66 3.59 1.35
Au Composite Avg 0.23 276.08 3.56 11.24 3.15
Au Capped Composite Avg 0.23 60.00 3.24 6.93 2.14
Ag Block Estimate 1.84 1234.14 123.57 137.00 1.11
Ag Composite Avg 25.71 4471.78 150.62 279.69 1.86
Ag Capped Composite Avg 25.71 2300.00 147.60 246.90 1.67
Au Block Estimate 0.09 208.30 4.06 19.08 4.70
Au Composite Avg 0.09 62.46 2.44 6.61 2.71
Au Capped Composite Avg 0.09 62.46 2.44 6.61 2.71
Ag Block Estimate 0.88 303.00 25.59 37.05 1.45
Ag Composite Avg 0.86 226.09 26.39 35.79 1.36
Ag Capped Composite Avg 0.86 226.09 26.39 35.79 1.36
Au Block Estimate 0.09 46.12 1.15 3.26 2.84
Au Composite Avg 0.06 29.36 1.17 2.65 2.26
Au Capped Composite Avg 0.06 20.00 1.13 2.25 1.99
Ag Block Estimate 0.48 283.57 12.03 22.64 1.88
Ag Composite Avg 0.66 428.07 11.95 31.05 2.60
Ag Capped Composite Avg 0.66 160.00 10.76 16.95 1.58
Au Block Estimate 0.10 10.55 1.02 1.22 1.20
Au Composite Avg 0.03 8.97 1.05 1.12 1.06
Au Capped Composite Avg 0.03 8.97 1.05 1.12 1.06
Ag Block Estimate 1.08 309.70 17.57 26.39 1.50
Ag Composite Avg 0.65 163.21 16.64 23.38 1.40
Ag Capped Composite Avg 0.65 163.21 16.64 23.38 1.40
Au Block Estimate 0.07 3.60 1.08 0.80 0.74
Au Composite Avg 0.11 7.09 1.18 1.17 0.99
Au Capped Composite Avg 0.11 7.09 1.18 1.17 0.99
Ag Block Estimate 1.81 20.10 7.19 3.64 0.51
Ag Composite Avg 1.24 28.31 7.79 5.73 0.74
Ag Capped Composite Avg 1.24 28.31 7.79 5.73 0.74
Au Block Estimate 0.07 7.03 0.72 0.54 0.75
Au Composite Avg 0.01 33.76 0.84 1.74 2.08
Au Capped Composite Avg 0.01 8.00 0.77 0.84 1.09
Ag Block Estimate 0.55 150.57 9.20 13.67 1.48
Ag Composite Avg 0.31 149.97 8.38 12.74 1.52
Ag Capped Composite Avg 0.31 149.97 8.38 12.74 1.52
Au Block Estimate 0.01 2.51 0.47 0.43 0.93
Au Composite Avg 0.01 1888.31 7.70 107.69 13.99
Au Capped Composite Avg 0.01 4.00 0.58 0.75 1.29
Ag Block Estimate 0.34 89.82 5.79 9.28 1.60
Ag Composite Avg 0.20 971.65 11.07 57.60 5.20
Ag Capped Composite Avg 0.20 160.00 8.23 18.79 2.28
WE
ST
ZO
NE
SH
OR
E Z
ON
EG
OS
SA
N H
ILL
GA
LE
NA
HIL
LS
G Z
ON
EB
RID
GE
ZO
NE
BR
IDG
E Z
ON
E
HA
LO
Table 16.15: Block grades and average composite grades.

P&E Mining Consultants Inc., Rpt No. 173 Page 97 of 117 Brucejack Property Silver Standard Resources Inc.
Figure 16-5: Section swath plots.

P&E Mining Consultants Inc., Rpt No. 173 Page 98 of 117 Brucejack Property Silver Standard Resources Inc.
17.0 OTHER RELEVANT DATA AND INFORMATION
There are no other data considered relevant to this report that have not previously been included.

P&E Mining Consultants Inc., Rpt No. 173 Page 99 of 117 Brucejack Property Silver Standard Resources Inc.
18.0 INTERPRETATION AND CONCLUSIONS
18.1 INTERPRETATION
Geological Setting Silver Standard‟s Brucejack Property is situated along the western margin of British Columbia‟s Intermontane Belt which extends from the Alaska-Yukon border southwards to the Chilcotin region in the southern part of the province and is underlain by rocks belonging to the allocthonous litho-tectonic terrane of “Stikinia”. The Stikinia terrane consists of Triassic and Jurassic volcanic arc assemblages that were accreted onto the Paleozoic basement of the North American continental margin and which, in the area of the Brucejack Property consists of Upper Triassic and Lower to Middle Jurassic Hazelton Group volcanic, volcaniclastic and sedimentary rocks, that have been intruded by Mesozoic intermediate to felsic plutons and minor Tertiary mafic dykes and sills. Regional Mineralization Hazelton Group rocks underlying the Brucejack and surrounding properties host extensive systems of mineralization and associated alteration systems that were undoubtedly developed as a result of hydrothermal activity focused on hypabyssal, Early Jurassic intermediate, porphyritic intrusions. While deposits such as Snowfield, Kerr and Mitchell are probably best described as gold-enriched copper porphyry systems, most if not all of the mineralization in the Brucejack area (West, Bridge, Galena Hill, Shore, SG, Gossan Hill and Mammoth Zones) can be classified as Epithermal Au-Ag-Cu, Low-Sulphidation Deposits, although it is possible that some of the mineralization also displays characteristics of intrusion related vein systems that fall within the Intermediate-Sulphidation Epithermal subtype of Hedenquist et al. (2000). Brucejack Property Mineralization The Brucejack area has been the focus of periodic exploration over the past several decades resulting in the discovery of at least 40 gossanous zones containing gold, silver, copper and molybdenum bearing quartz/carbonate veining, stockwork and breccia hosted mineralization. Typically, these gossanous showings reflect the weathering of disseminated pyrite in argillic and phyllic alteration zones. The size of these gossans, their tectonic fabric, intensity of alteration and metallogenesis make them attractive exploration targets and most have been extensively sampled and/or drill tested Silver Standard has reviewed all of the historical and on-going exploration results from the Brucejack Property, allowing it to identify seven zones of potentially near term economically viable mineralization as noted below. This is in addition to the porphyry-type mineralization comprising the Snowfield Zone located immediately to the north.

P&E Mining Consultants Inc., Rpt No. 173 Page 100 of 117 Brucejack Property Silver Standard Resources Inc.
High Priority Mineralized Zones - Brucejack Property 1. West Zone; 2. Bridge Zone; 3. Galena Hill Zone; 4. Shore Zone; 5. SG Zone; 6. Gossan Hill Zone; 7. Mammoth Zone. Resource Estimates Mineral Resource modeling and estimation were carried out on the West, Bridge, Galena Hill, Shore, SG, and Gossan Hill Zones, using the commercially available GEMS Gemcom v5.23 and Snowden Supervisor v7.10.11 software programs. Pit shell optimization was carried out using Whittle Four-X Single Element v1.10. The Mineral Resource Estimates were based on a database of 844 drillhole records that contain a total of 51,985 Au assays and 51,049 Ag assays. Various exploratory data analyses were completed by P&E to establish modeling populations, grade capping limits, and spatial relationships etc. In the opinion of P&E the data are globally unbiased and locally consistent with the current drill hole data. Further, the data used to estimate Mineral Resources are reliable based on QA/QC results (blanks, standards, and check assays) and an audit of the electronic database. Silver Standard considers the West Zone and Shore Zone as being predominately structurally controlled vein systems related to the north-trending Brucejack Fault, with the other zones tentatively defined as intrusion related mineralized stockwork/breccia/vein systems. An orthogonal block model was established across the property for the Bridge Zone, Galena Hill, Gossan Hill, SG Zone and Shore Zone mineralization domains. A separate rotated block model was established for the West Zone. For the Bridge Zone, Galena Hill, Gossan Hill, SG Zone and Shore Zone mineralization domains, block grades were estimated using Inverse Distance Cubed (ID3) linear weighting of composite values. A two-pass series of expanding search ellipses with varying minimum sample requirements was used for sample selection and classification, and sample distances were adjusted by the defined anisotropy. For the West Zone mineralization domain the block estimates were calculated using a two-bin Indicator Kriging (IK) partition of each commodity. A three-pass series of expanding search ellipses with varying minimum sample requirements were used for sample selection and classification: The block models were validated visually by the inspection of successive section lines in order to confirm that the block model correctly reflected the distribution of high-grade and low-grade

P&E Mining Consultants Inc., Rpt No. 173 Page 101 of 117 Brucejack Property Silver Standard Resources Inc.
samples. An additional validation check of the Mineral Resource Estimate was completed by comparing average composite grades to the grade of the block containing the composites. A validation check for global bias was completed by comparing the modeled block estimates to a Nearest Neighbour (“NN”) block estimate generated using the same search criteria and tabulated at a zero grade cut-off within the constraining pit-shells. Results correctly duplicate grade trends and demonstrate a minimal global bias and slight smoothing for the modeled estimates as compared to the NN estimates. 18.2 CONCLUSIONS
The 2009 Measured and Indicated precious metals Resources for the Brucejack Property
as prepared by P&E, increased to 4.04 million ounces of gold and 65.4 million ounces of silver and Inferred Resources are 4.87 million ounces of gold and 71.5 million ounces of silver.
The previous Sulphurets Resource was focused on the higher grade underground mining potential while the current P&E Resource expands those parameters to include surface bulk mining opportunities in light of higher precious metals prices.
The six mineralized zones for which Resource Estimates were prepared all remain open in at least one direction and are worthy of further drilling.
The Brucejack deposits require further drill delineation and Resource updating prior to undertaking more advanced scoping or feasibility level studies.

P&E Mining Consultants Inc., Rpt No. 173 Page 102 of 117 Brucejack Property Silver Standard Resources Inc.
19.0 RECOMMENDATIONS
19.1 RECOMMENDATIONS AND PROPOSED BUDGET
It is the opinion of the authors of this report that the Mineral Resources outlined at the various deposits within the Brucejack Property are of sufficient merit to warrant continued delineated drilling. It is therefore recommended:
That a results-driven diamond drilling program totalling approximately 24,000 metres of NQ sized coring be undertaken to both expand existing Resources (potentially by a total of 3 to 4 million ounces gold) through a program of step-out drilling and to further define the mineralized zones, through a program of in-fill drilling, in order that to allow upgrading of existing Inferred category mineralization to the Indicated category;
That the drilling be apportioned amongst the West Zone, Bridge Zone, Galena Hill Zone, Shore Zone, SG Zone, and Gossan Hill Zone deposits on a priority basis according to the exploration potential or economic attractiveness of the existing mineralization;
That a portion of the total drilling budget be expended on testing new outside targets, some of which have potential to host Eskay Creek style of mineralization;
That optimization of metallurgical test work on composites prepared late last year be completed;
That select historical drill holes within the West Zone be twinned in order to verify previous data;
That a limited program of confirmation drilling be conducted on the Shore Zone;
That additional drilling, oriented perpendicular to the known structural trends, be undertaken at the Bridge Zone. This would allow for better optimization of future Resource Estimate updates;
That Geotechnical and metallurgical holes be completed in several areas to provide data that would help facilitate advanced scoping level studies;
That advance metallurgical studies be conducted in tandem with similar work planned for the Snowfield Zone.
19.1.1 BRUCEJACK PROPERTY 2010 PROPOSED EXPLORATION BUDGET
The above recommended work programs have a proposed budget of approximately $10 million as shown in more detail in Table 19.1.

P&E Mining Consultants Inc., Rpt No. 173 Page 103 of 117 Brucejack Property Silver Standard Resources Inc.
Table 19.1: Proposed 2010 Exploration Budget for the Brucejack Property.
Item Cost (CDN$)
Drilling 24,000 metres $ 4,200,000 Supplies $ 850,000 Labour, fuel, expediting $ 750,000 Assaying $ 850,000 Helicopter and fixed wing $ 2,500,000 Geological consulting $ 300,000 Contingency (6%) $ 550,000 TOTAL $ 10,000,000

P&E Mining Consultants Inc., Rpt No. 173 Page 104 of 117 Brucejack Property Silver Standard Resources Inc.
Respectfully Submitted, P & E Mining Consultants Inc {SIGNED AND SEALED} [Eugene Puritch] ______________________________ Eugene Puritch, P.Eng., President Effective Date: December 1, 2009
Dated this 14th Day of January, 2010
P&E Mining Consultants Inc., Rpt No. 173 Page 105 of 117 Brucejack Property Silver Standard Resources Inc.
20.0 REFERENCES
Active Minerals Ltd., 1984: Kerr 7, 8, 9, 10, 12, 15, 41, 99 Claims (Sulphurets Creek Property),
Skeena Mining Division. Assessment Report No. 13369. Alldrick, D. J. (1989): Volcanic Centers in the Stewart Complex; British Columbia Ministry of
Energy, Mines and Petroleum Resources, Paper 1989-1. Alldrick, D. J., and Britton, J. M. (1988): Geology and Mineral Deposits of the Sulphurets Area;
British Columbia Ministry of Energy, Mines and Petroleum Resources Open Map File 1988-4.
Alldrick, D.J., and Britton, J.M., 1991: Sulphurets Area Geology, Open file 1991-21 Geology
Maps, British Columbia Geological Surveys Branch. Allen, D.G., 1991: Geological and Geochemical Report on the Hat Property, Skeena Mining
Division, British Columbia for Jantri Resources Inc. Assessment Report No. 21978.
AMEC (Martin, T. et al) 2004: Kerr-Sulphurets Project, Scoping Study – Tailings and Waste
Rock Management, Proprietary Report Commissioned by Noranda Inc. Anderson, R. G. (1989): A Stratigraphic, Plutonic, and Structural Framework for the Iskut River
Map Area, Northwestern British Columbia; in Current Research, Part E, Geological Survey of Canada, Paper 89-1E, p. 145-154.
Anderson, R.G., and Bevier, M. L., 1990: A note on Mesozoic and Tertiary K-Ar
geochronometry of pluton sites, Iskut River map area, northwestern British Columbia: Geological Survey of Canada, Paper 90-1E.
Armstrong, T., Brown, F., and Yassa, A., 2009: Technical Report and Resource Estimate on the
Snowfield Property, Skeena Mining Division, British Columbia, Canada, Latitude 56°29' N by Longitude 130° W, NI 43-101 Technical Report by P&E Mining Consultants Inc., filed January 31, 2009, 87 pages
Ashley, R.P., 1982: Occurrence model for enargite-gold deposits, in Erickson, R.L., ed.,
Characteristics of Mineral Deposit Occurrences: United States Geological Survey, Open File Report 82-795, p. 144-147.
Bagby, W.C., and Berger, B.R., 1986: Geologic characteristics of sediment hosted disseminated
precious-metal deposits in the western United States: Reviews in Economic Geology, v. 2, p. 169-199.
Baker, T., 2002, Emplacement depth and carbon dioxide-rich fluid inclusions in intrusion-related
gold deposits: Economic Geology, v. 97, p. 1111-1117.

P&E Mining Consultants Inc., Rpt No. 173 Page 106 of 117 Brucejack Property Silver Standard Resources Inc.
Berger, B.R., and Henley, R.W., 1989: Advances in the understanding of epithermal gold-silver deposits, with special reference to the western United States, in Keays, R.R., Ramsay, W.R.H., and Groves, D.I. eds., The Geology of Gold Deposits: The Perspective in 1988: Economic Geology, Monograph 6, p. 405-423.
Bethke, P.M., Rye, R.O., Stoffregen, R.E., and Vikre, P.G., 2005: Evolution of the magmatic-
hydrothermal acid-sulfate system at Summitville, Colorado: Integration of geological, stable isotope, and fluid inclusion evidence: Chemical Geology, v. 215, p. 281-315.
Blanchflower, J.D., 2008: Technical Report on the Snowfield Property, Skeena Mining Division,
British Columbia, Canada. Report for Silver Standard Resources. Bonham, J.F., Jr., 1988: Models for volcanic-hosted precious metal deposits; a review, in
Schafer, R.W., Cooper, J.J., and Vikre, P.G., eds., Bulk Mineable Precious Metal Deposits of the Western United States: Geological Society of Nevada, p. 259-271.
Britton, J.M., and Alldrick, D.J. (1988):' Sulphurets Map Area. in Geological Fieldwork 1987,
BC Ministry of Energy, Mines and Petroleum Resources, Paper 1988-1, pp. 199-209.
Budinski, D. R., McKnight R. T., Wallis, C. S., 2001: Sulphurets-Bruceside Property, British
Columbia, Technical Report. PAH Project No. 9814.00d, dated April 16, 2001. Budinski, David, R., 1995: Summary Report on the Snowfield Project Suphurets Property,
Skeena Mining Division, Orcan Consultants. Burk, R, (2009a): Internal Silver Standard Report on the Regional and Property Geology of the
Brucejack Property, dated December 9, 2009. Burk, R, (2009b): Email correspondence from Mr Ron Burk, Silver Standard‟s Chief Geologist,
regarding Silver Standard‟s 2009 Exploration Program, dated December 22, 2009. Carson, D. 2003: Mineralogy and Interpretation of Mineralized an Hydrothermally Altered 2004
Field Samples from the Kerr-Sulphurets Porphyry Copper-Gold Property, British Columbia – Carson Geomin Report KS-01, Proprietary Report Commissioned by Noranda Inc.
Carson, D. 2004: Mineralogy and Interpretation of Mineralized an Hydrothermally Altered 2004
Field Samples from the Kerr-Sulphurets Porphyry Copper-Gold Property, British Columbia – Carson Geomin Report KS-02, Proprietary Report Commissioned by Noranda Inc.
Champigny, N., and Sinclair, A.J., 1982: The Cinola gold deposit, Queen Charlotte Islands
British Columbia, in Hodder, R.W., and Petruk, W., eds., Proceedings of the Gold Symposium: The Canadian Institute of Mining and Metallurgy, Special Volume 24, p. 243-254.

P&E Mining Consultants Inc., Rpt No. 173 Page 107 of 117 Brucejack Property Silver Standard Resources Inc.
Clark, J.R., and Williams-Jones, A.E., 1990, Analogues of epithermal gold-silver deposition in geothermal well scales: Nature, v. 346, p. 644-645.
Clark, J.R., and Williams-Jones, A.E., 1986, Geology and genesis of epithermal gold-barite
mineralization, Verrenas deposit, Toodoggone district, B.C. (abstract): Geological Association Canada-Mineralogical Association Canada, Annual Meeting, Ottawa, 1986, Program with Abstracts, v. 11, p. 57.
Copland, H., 1991: Diamond Drilling Report on the Kerr Property, Skeena Mining Division,
British Columbia, Assessment Report #21552 filed with B.C. Ministry of Mines and Petroleum Resources, August 9, 1991.
Corona Corporation, 1990: Newhawk Gold Mines Ltd., Sulphurets Project Feasibility Study. Cox, D.P., and Singer, D.A., eds., 1986, Mineral Deposit Models: United States Geological
Survey, Bulletin 1693, United States Government Printing Office, Washington, D.C., 379 p.
Cyr, J.B., Pease, R.B., and Schroeter, R.G., 1984, Geology and mineralization at Equity Silver
mine: Economic Geology, v. 79, p. 947-968. Dale, E.W., 1984: Geochemical Report on a Silt and Soil Sampling Survey over portions of the
Kerr 1-5, Kerr 7-10, Kerr 12-35, Kerr 38-44 and Kerr 49-51 Claims, Sulphurets Creek Region, Skeena Mining Division, British Columbia. Assessment Report No. 12471.
Dane, A. B., D.A., Brown, M.G., Ferguson, L.J., 1980: Diamond Drilling Report for Mitchell 1,
Central 1 and Sulphurets 1 Claim Groups. Assessment Report No. 08420. Dane, A. B., 1981: Diamond Drilling Report for the Sulphurets Property. Sulphurets 1 Group,
Central 1 Group and Central 2 Group Mineral Claims. Assessment Report No. 09568.
Dearin, C.1989: Mineable "Geological" Ore Reserve Estimation and Geological Vein Summary,
Sulphurets Project - West Zone - Brucejack Lake - Northwestern British Columbia. Prepared for Newhawk Gold Mines Ltd.
Ditson, G.M., Wells, R.C., and Bridge, D.J., 1995: Kerr: The Geology and Evolution of a
Deformed Porphyry Copper-Gold Deposit, North-western British Columbia, in Porphyry Deposits of the North-western Cordillera of North America, Canadian Institute of Mining, Metallurgy and Petroleum, Special Volume 46, p. 509-523.
Dube, B., Gosselin, P., Mercier-Langevin, P., Hannington, M., and Galley, A., 2007: Gold-rich
volcanogenic massive sulphide deposits, in Goodfellow, W.D., ed., Mineral Deposits of Canada: A Synthesis of Major Deposit-Types, District Metallogeny, the Evolution of Geological Provinces, and Exploration Methods: Geological Association of Canada, Mineral Deposits Division, Special Publication 5, p. 75-94.

P&E Mining Consultants Inc., Rpt No. 173 Page 108 of 117 Brucejack Property Silver Standard Resources Inc.
Epp, W.R., 1985: Geochemical, Geological, Trenching and Diamond Drilling Report on the Kerr Claims, Skeena Mining Division. 1985 Mineral Exploration Assessment Report No. 14614.
Erickson, G.E., and Cunningham, C.G., 1993, Epithermal precious-metal deposits hosted by the
Neogene and Quaternary volcanic complex of the central Andes, in Kirkham, R.V., Sinclair, W.D., Thorpe, R.I., and Duke, J.M., eds., Mineral Deposit Modeling: Geological Association of Canada, Special Paper 40, p. 419-431.
Faure, K., Matsuhisa, Y., Metsugi, H., Mizota, C., and Hayashi, S., 2002, The Hishikari Au-Ag
epithermal deposit, Japan: oxygen and hydrogen isotope evidence in determining the source of paleohydrothermal fluids: Economic Geology, v. 97, p. 481-498.
Government of B.C., 2000: Cassiar Iskut-Stikine Land and Resource Management Plan. Gray, M.D., and Munguia, J., 2006: Field Review Summary Report, Kerr-Sulphurets Project,
Iskut River Region, British Columbia, Canada, Proprietary Report Commissioned by Seabridge Gold Inc.
Grove, E.W., 1986: Geology and Mineral Deposits of the Unuk River-Salmon River-Anyox
Area. B.C. Department of Mines and Petroleum Resources, Bulletin 63. Grove, E.W., 1971: Geology and Mineral Deposits of the Stewart Area, B.C. British Columbia
Dept. of Mines and Petroleum Resources, Bulletin No. 58 Hayba, D.O., Bethke, P.M., Heald, P.M., and Foley, N.K., 1985, Geologic, mineralogic, and
geochemical characteristics of volcanic-hosted epithermal precious-metal deposits: Reviews in Economic Geology, v. 2, p. 129-167.
Hedenquist, J.W., 1987: Mineralization associated with volcanic-related hydrothermal systems in
the circum-Pacific Basin, in Horn, M.K. ed., Transactions of the Fourth Circum-Pacific Energy and Mineral Resources Conference, Singapore: American Association of Petroleum Geologists, p. 513-524.
Hedenquist, J.W., Arribas, A.R., and Gonzalez-Urien, E., 2000: Exploration for epithermal gold
deposits, Chapter 7 in Hagemann, S.G., and Brown, P.E., eds., Gold in 2000: Society of Economic Geologists, Reviews in Economic Geology, v. 13, p. 245-277.
Hedenquist, J.W, Izawa, E., Arribas, A.R., and White, N.C., 1996, Epithermal Gold Deposits:
Styles, Characteristics, and Exploration: The Society of Resource Geology: Resource Geology Special Publication number 1, 70 p.
Hedenquist, J.W., Matsuhisa, Y., Izawa, E., White, N.C., Giggenbach, W.F., and Aoki, M., 1994:
Geology, geochemistry, and origin of high sulfidation Cu-Au mineralization in the Nansatsu district, Japan: Economic Geology, v. 89, p. 1-30.

P&E Mining Consultants Inc., Rpt No. 173 Page 109 of 117 Brucejack Property Silver Standard Resources Inc.
Henderson, J.R., Kirkham, R.V., Henderson, M.N., Payne, J.G., Wright, T.O, and Wright, R.L., 1992: Stratigraphy and Structure of the Sulphurets Area, British Columbia, in Current Research, Part A: Geological Survey of Canada, Paper 92-1A, p. 323-332.
Henley, R.W., and Ellis, A.J., 1983: Geothermal systems, ancient and modern: Earth Science
Reviews, v. 19, p. 1-50. Hicks, K.E., 1988: Assessment Report, 1987 Field Season, Shore Group, Sulphurets Project,
Brucejack Lake Area, Skeena Mining Division for the Sulphurets Joint Venture. Newhawk Gold Mines Ltd. (Operator), Granduc Mines Ltd. Assessment Report No. 17133.
Hicks, K.E., 1988: Assessment Report, 1987 Field Season B J Group, Sulphurets Project,
Brucejack Lake Area, Skeena Mining Division. Assessment Report No. 17166. Huard, A. and Savell, M., 2005: Report On The 2004 Exploration Program Kerr-Sulphurets
Property, Proprietary Report Commissioned by Falconbridge Ltd. Izawa, E., Naito, K., Ibaraki, K., and Suzuki, R., 1993, Mudstones in a hydrothermal eruption
crater above the gold-bearing vein system of the Yamada deposit at Hishikari, Japan: Resource Geology, Special Issue No. 14, p. 85-92.
Kirkham, R.V., 1991: Provisional Geology of the Mitchell-Sulphurets Region, Northwestern
British Columbia (104B/8, 9); Geological Survey of Canada, Open File 2416. Kirkham, R.V., 1963. The Geology and Mineral Deposits in the Vicinity of the Mitchell and
Sulphurets Glaciers, Northwest British Columbia. Unpublished M.Sc. Thesis, U.B.C.
Kirkham, R.V., and Margolis, J., 1995: Overview of the Sulphurets Area, North-western British
Columbia, in Porphyry Deposits of the Northwestern Cordillera of North America, Canadian Institute of Mining, Metallurgy and Petroleum, Special Volume 46, p. 473-483.
Kruchkowski, E., 1975: Geology and Geochemistry of Mitch, Ray, Ted, Patty and Ran Mineral
Claims, Sulphurets Creek Property, 56O 30'N. 130' 15'W, Unuk River Area, Skeena Mining Division, British Columbia. An Assessment Report on 1974 Program on New Mitch and Mitch NO. 12 Claim Groups. Assessment Report No. 05416.
Kruchkowski, E., Ostensoe, E., 1976: Report of Trenching, Geological and Geochemical
Survey, Iron Cap 1, 2, 3; Tedray 1, 2, 3, 6 and Grace claims. Sulphurets Creek Property, Unuk River Area, Skeena Mining Division, British Columbia. An Assessment Report of the 1976 Work Program on Tedray One Claim Group. Assessment Report No. 06066.

P&E Mining Consultants Inc., Rpt No. 173 Page 110 of 117 Brucejack Property Silver Standard Resources Inc.
Kruchkowski, E., Ostensoe, E.A., 1977: Report of Work Red River Claim Unuk River, Skeena M.D., British Columbia. Assessment Report No. 06255.
Kruchkowski, E.R., 1986: Report on Brucejack 1-3 Claims, Stewart, British Columbia, Skeena
Mining Division. Assessment Report No. 15370. Lechner, M. J., 2009: Updated KSM Mineral Resources, Report prepared for Seabridge Gold
Inc, dated March 30, 2009. Lewis, P.D. (1994): Structural Geology Compilation - Brucejack Lake Area; an in-house report
prepared for Newhawk Gold Mines Ltd. Lewis, P.D. Toma, A., Tosdal, R.M. (compilers), 2001: Metallogenesis of the Iskut River Area,
North-western British Columbia, in Mineral Deposit Research Unit Special Publication Number 1.
Lindgren, W., 1922: A suggestion for the terminology of certain minerals deposits: Economic
Geology, v. 17, p. 202-294. Lindgren, W., 1933: Mineral Deposits: McGraw-Hill, New York, 4th edition, 930 p. Margolis, J., and Britten, R.M., 1995: Porphyry-Style and Epithermal Copper-Molybdenum-
Gold-Silver Mineralization in the Northern and South-Eastern Sulphurets District, North-western British Columbia, in Porphyry Deposits of the North-western Cordillera of North America, Canadian Institute of Mining, Metallurgy and Petroleum, Special Volume 46, p. 499-508.
Margolis, J., 1993, Geology and Intrusion-Related Copper-Gold Mineralization, Sulphurets,
British Columbia: Ph.D. thesis, University of Oregon, Eugene, Oregon, 289 p. McCrea, J. A. (2007): Technical Report on the Snowfields Project, Skeena Mining Division,
British Columbia, Canada; private report prepared for Silver Standard Resources Inc., pp. 33 plus appendices.
McDonald, D.W.A., 1990: The Silbak Premier Silver-Gold Deposit: A Structurally Controlled,
Base Metal-Rich Cordilleran Epithermal Deposit, Stewart, B.C.: Ph.D. thesis, University of Western Ontario, London, Ontario, 411 p.
McElhanney Consulting Services Ltd., 2008: KSM Project Road Access Scoping Level Study
Internal report for Seabridge Gold Inc., Revised June 24, 2008 McPherson, M.D., Roach S., and McDonough B., 1994: 1994 Summary Report on the
Sulphurets Joint Venture, Bruceside Project, Skeena Mining Division, Newhawk Gold Mines Ltd.
McPherson, M.D., 1993: 1993 Summary Report on the Sulphurets Property, Snowfield Property,
Skeena Mining Division, Newhawk Gold Mines Ltd.

P&E Mining Consultants Inc., Rpt No. 173 Page 111 of 117 Brucejack Property Silver Standard Resources Inc.
McPherson, M.D., 1993: 1993 Assessment Report on the Snowfield Property, Skeena Mining Division. Assessment Report No. 23172.
McPherson, M., 1994: 1994 Assessment Report on the South Bruce Group, Sulphurets Property
– Bruceside Project, Skeena Mining Division. Assessment Report No. 23609. McPherson, M., 1994: 1994 Assessment Report on the North Bruce Group, Sulphurets Property
– Bruceside Project, Skeena Mining Division. Assessment Report No. 23613. McPherson, M., Roach, S., McDonough, B., 1994: 1994 Exploration Summary, Sulphurets Joint
Venture, Bruceside Project, Skeena Mining Division. Assessment Report No. 24610.
Melnyk, W., 1983: Diamond Drilling Report for Sulphurets 83 Group, Sulphurets Property,
Skeena Mining Division. Assessment Report No. 11667. Montgomery, J.H., 1976: Petrographic Report on Rocks from Mitchell Creek Area. Assessment
Report No. 05958. Nakamura, H., Sumi, K., Karagiri, K., and Iwata, T., 1970, The geological environment of the
Matsukawa geothermal area, Japan: Geothermics, Special Issue 2, p. 221-231. Newhawk Gold Mines Ltd.1987: Progress Report·1987 Phase I, Sulphurets Project, Brucejack
Lake Area, Skeena Mining Division, B.C., Canada, prepared for Sulphurets Joint Venture, July 6.
Newton, R.S., Butterworth, B.P, Casselman, S.G., Payne, J.G., 1989: Kerr Project Report –
1989, Volume I, Text, Maps and Appendices, Skeena Mining Division, Sulphurets Gold Corporation. Assessment Report No. 19541.
Roach, S. and MacDonald, A.J., (1992): Silver-gold mineralization - West Zone, Brucejack
Lake, northwest British Columbia; in Geological Fieldwork 1991, BC Ministry of Energy, Mines and Petroleum Resources, Paper 1992-1, pp. 503-511.
Rye, R.O., Bethke, P.M., and Wasserman, M.D., 1992: The stable isotope geochemistry of acid
sulfate alteration: Economic Geology, v. 87, p. 225-262. Savell, M., 2008: Report on Diamond Drilling at the KSM (Kerr‐Sulphurets‐Mitchell) Property
Mineral Claims 254756, 254758, 516245, and 516251, Skeena Mining Division. Report dated May 15, 2008 and covering work performed June 19 – November 6, 2007 prepared for Seabridge Gold Inc.
Sillitoe, R.H., Hannington, M.D., and Thompson, J.F.H., 1996: High-sulfidation deposits in the
volcanogenic massive sulfide environment: Economic Geology, v. 91, p. 204-212. Sillitoe, R.H., and Bonham, H.F., Jr., 1984: Volcanic landforms and ore deposits: Economic
Geology, v. 79, p. 1286-1298.
P&E Mining Consultants Inc., Rpt No. 173 Page 112 of 117 Brucejack Property Silver Standard Resources Inc.
Stantec Consulting Ltd., 2003: Environmental Evaluation of Kerr-Sulphurets Property, North-western B.C.; Proprietary Report Commissioned by Noranda Inc.
Stoffregen, R.E., 1987: Genesis of acid-sulfate alteration and Au-Cu-Ag mineralization at
Summitville, Colorado: Economic Geology, v. 82, p. 1575-1591. Taylor, B.E., 2007: Epithermal gold deposits, in Goodfellow, W.D., ed., Mineral Deposits of
Canada: A Synthesis of Major Deposit-Types, District Metallogeny, the Evolution of Geological Provinces, and Exploration Methods: Geological Association of Canada, Mineral Deposits Division, Special Publication No. 5, p. 113-139.
Taylor, B.E., 1996, Epithermal gold deposits, in Eckstrand, O.R., Sinclair, W.D., and Thorpe,
R.I., eds., Geology of Canadian Mineral Deposit Types: Geological Survey of Canada, Geology Canada, no. 8, p. 329-350.
Taylor, B.E., 1987: Stable isotope geochemistry of ore-forming fluids, in Kyser, T.K. ed., Stable
Isotope Geochemistry of Low Temperature Fluids: Mineralogical Association of Canada, Short Course Handbook, v. 13, p.337-445.
Taylor, B.E., 1988: Degassing of rhyolitic magmas: Hydrogen isotope evidence and implications
for magmatic-hydrothermal ore deposits, in Taylor, R.P., and Strong, D.F., eds., Recent Advances in the Geology of Granites-Related Mineral Deposits: Canadian Institute of Mining and Metallurgy, Special Publication, v. 39, p. 33-49.
Tribe, N.L., 1985: Progress Report, 1985 Field Season, Sulphurets Property, Brucejack Lake
Area, Skeena Mining Division, British Columbia, Canada. Assessment Report No. 14672.
Tribe, N.L., 1987: Assessment Report, 1986 Field Season, B J Group, Sulphurets Project,
Brucejack Lake Area, Skeena Mining Division for the Newcana J.V., Newhawk Gold Mines Ltd., Lacana Mining Corp. Assessment Report No. 15684.
Tribe, N.L. Hicks, K.E., Wells, R., Kelly, CSD., 1987: Exploration British Columbia, Financial
Assistance for Mineral Exploration Progress Report, 1986 Field Season, Sulphurets Project, Brucejack Lake Area, Skeena Mining Division, British Columbia. Report No. 15724.
Tribe, N.L., 1988: Report on the 1988 Summer Exploration Program Prospecting, Geological
Mapping, Drilling and Trenching ont he Marmot Group of Claims. Tedray 9, 10, 11, 12, 13, 14, 15, 16, 17, 18, OK 1, 2. Sulphurets Project, Brucejack Lake Area, Skeena Mining Division, British Columbia, Canada. Assessment Report No. 18564.
Visagie, D., 1991: Geochemical Report, Bruceside 1 Group, Skeena Mining Division.
Assessment Report No. 21884. Visagie, D.A., McDonough, B., 1992: Trenching, Geology and Geochemistry of the South
Bruce Group, Skeena Mining Division. Assessment Report No. 22636.

P&E Mining Consultants Inc., Rpt No. 173 Page 113 of 117 Brucejack Property Silver Standard Resources Inc.
Visagie, D.A., Roach, S., 1992: Trenching, Geology and Geochemistry of the North Bruce Group, Skeena Mining Division. Assessment Report No. 22657.
Visagie, D.A., 1993: Drilling: SG Zone – Hole 93-417, North Bruce Group, Sulphurets Project,
Skeena Mining Division. Assessment Report No. 23169. Visagie, D.A., 1993: Drilling of the Galena Hill Zone, Hole 93-422, South Bruce Group,
Sulphurets Project, Skeena Mining Division. Assessment Report No. 23170. Wardrop, 2009a: Kerr-Sulphurets-Mitchell Preliminary Economic Assessment 2008, report
written for Seabridge Gold and later filed as NI 43-101 Technical Report, 513 p. Wardrop, 2009b: Kerr-Sulphurets-Mitchell Preliminary Economic Assessment Addendum 2009,
report written for Seabridge Gold and filed as NI 43-101 Technical Report, dated September 8, 2009.
Watts, Griffis and McOuat Limited 1987: A Review of the Sulphurets Project, British Columbia
for Granduc Mines Ltd. Watts, Griffis and McOuat Limited, 1989: Geological Reserves - Sulphurets Project. Letter
report for Newhawk Gold Mines Ltd. White, D.E., Muffler, L.J.P., and Truesdell, A.H., 1971, Vapor-dominated hydrothermal systems
compared with hot-water systems: Economic Geology, v. 66, p. 75-97. Williams, A.E., and McKibben, M.A., 1989: A brine interface in the Salton Sea geothermal
system, California: Fluid geochemical and isotopic characteristics: Geochimica et Cosmochimica Acta, v. 53, p. 1905-1920.
Wojdak, P.J., and Sinclair, A.J., 1984: Equity Silver silver-copper-gold deposit; alteration and
fluid inclusion studies: Economic Geology, v. 79, p. 969-990.

P&E Mining Consultants Inc., Rpt No. 173 Page 114 of 117 Brucejack Property Silver Standard Resources Inc.
21.0 CERTIFICATES CERTIFICATE of AUTHOR Dr. Wayne D. Ewert, P.Geo. I, Wayne D. Ewert, P. Geo., residing at 10 Langford Court, Brampton, Ontario, L6W 4K4 do hereby certify that: 1. I am a principal of P & E Mining Consultants Inc. and currently contracted as a consultant by Silver Standard
Resources Inc. and have worked as a geologist continuously since obtaining my B.Sc. degree in 1970. 2. This certificate applies to the technical report titled “Technical Report and Resource Estimates on the West, Bridge,
Galena Hill, Shore, SG & Gossan Hill Gold & Silver Zones of the Brucejack Property, Northern British Columbia, Canada” (the “Technical Report”) dated January 14, 2010.
3. I graduated with an Honours Bachelor of Science degree in Geology from the University of Waterloo in 1970 and
with a PhD degree in Geology from Carleton University in 1977. I am a member of the Geological Association of Canada, of the Canadian Institute of Mining and Metallurgy and a P. Geo., Registered in the Province of British Columbia (APEGBC No. 18965), the Province of Ontario (APGO No. 0866) and the Province of Saskatchewan (APEGS No.16217). I have read the definition of “qualified person” set out in National Instrument 43-101 (“NI 43-101”) and certify that by reason of my education, affiliation with a professional association (as defined in NI 43-101) and past relevant work experience, I fulfill the requirements to be a “qualified person” for the purposes of NI 43-101. My relevant experience for the purpose of the Technical Report is: Supervising Project Geologist III, Cominco Ltd., ................................................... 1976 – 1982 Supervising Project Geologist, Getty Mines Ltd., .................................................... 1982 – 1986 Regional Manager, Gold Fields Canadian Mining Limited, .................................... 1986 – 1987 Canadian Manager, New Projects, Gold Fields Canadian Mining Limited, ............. 1987 – 1992 Vice-President, A.C.A. Howe International Limited, ............................................... 1992 – 2004 Principal, P&E Mining Consultants Inc., ............................................................. 2004 – Present
4. I have not visited the Brucejack Property.
5. I am responsible for sections 1 through 10, 14, 15 and 17 and co-authored sections 18 and 19 and am also responsible for the overall structuring of this Technical Report.
6. I am independent of Silver Standard Resources Inc. applying the test in Section 1.4 of NI 43-101.
7. I have had no prior involvement with the Brucejack Property that is the subject of the Technical Report.
8. I have read NI 43-101 and Form 43-101F1 and the Technical Report has been prepared in compliance therewith.
9. As of the date of this certificate, to the best of my knowledge, information and belief, the Technical Report contains all scientific and technical information that is required to be disclosed to make the Technical Report not misleading.
Effective Date: December 01, 2009 Signing Date: January 14, 2010 {SIGNED AND SEALED} [Wayne D. Ewert] ________________________________ Dr. Wayne D. Ewert P. Geo.

P&E Mining Consultants Inc., Rpt No. 173 Page 115 of 117 Brucejack Property Silver Standard Resources Inc.
CERTIFICATE of AUTHOR Tracy J. Armstrong, P.Geo. I, Tracy J. Armstrong, residing at 2007 Chemin Georgeville, res. 22, Magog, QC J1X 3W4, do hereby certify that: 1. I am an independent geological consultant contracted by P&E Mining Consultants Inc. and have worked as a
geologist continuously since my graduation from university in 1982. 2. This certificate applies to the technical report titled “Technical Report and Resource Estimates on the West, Bridge,
Galena Hill, Shore, SG & Gossan Hill Gold & Silver Zones of the Brucejack Property, Northern British Columbia, Canada” (the “Technical Report”) dated January 14, 2010.
3. I am a graduate of Queen‟s University at Kingston, Ontario with a B.Sc. (HONS) in Geological Sciences (1982). I am
a geological consultant currently licensed by the Order of Geologists of Québec (License 566) and by the Association of Professional Geoscientists of Ontario (License 1204). I have read the definition of “qualified person” set out in National Instrument 43-101 (NI 43-101) and certify that by reason of my education and past relevant work experience, I fulfill the requirements to be a “qualified person” for the purposes of NI 43-101. My relevant experience for the purpose of the Technical Report is: Underground production geologist, Agnico-Eagle Laronde Mine ............................ 1988-1993; Exploration geologist, Laronde Mine ....................................................................... 1993-1995; Exploration coordinator, Placer Dome ..................................................................... 1995-1997; Senior Exploration Geologist, Barrick Exploration .................................................. 1997-1998; Exploration Manager, McWatters Mining ................................................................ 1998-2003; Chief Geologist Sigma Mine .............................................................................................. 2003; Consulting Geologist .......................................................................................... 2003 to present;
4. I have not visited the Brucejack Property.
5. I am responsible for the preparation and authoring of Sections 11 through 13 and co-authoring Sections 18 and 19 of this Technical Report.
6. I am independent of Silver Standard Resources Inc. applying the test in Section 1.4 of NI 43-101.
7. I have had no prior involvement with the Brucejack Property that is the subject of the Technical Report.
8. I have read NI 43-101 and Form 43-101F1 and the Technical Report has been prepared in compliance therewith.
9. As of the date of this certificate, to the best of my knowledge, information and belief, the Technical Report contains all scientific and technical information that is required to be disclosed to make the Technical Report not misleading.
Effective Date: December 01, 2009 Signing Date: January 14, 2010 {SIGNED AND SEALED} [Tracy J. Armstrong] ________________________________ Tracy J. Armstrong P. Geo.

P&E Mining Consultants Inc., Rpt No. 173 Page 116 of 117 Brucejack Property Silver Standard Resources Inc.
CERTIFICATE of AUTHOR Fred H. Brown, CPG, PrSciNat I, Fred H. Brown, residing at Suite B-10, 1610 Grover St. Lynden WA, 98264 USA do hereby certify that: 1. I am an independent geological consultant contracted by P&E Mining Consultants Inc. and have worked as a
geologist continuously since my graduation from university in 1987. 2. This certificate applies to the technical report titled “Technical Report and Resource Estimates on the West, Bridge,
Galena Hill, Shore, SG & Gossan Hill Gold & Silver Zones of the Brucejack Property, Northern British Columbia, Canada” (the “Technical Report”) dated January 14, 2010.
3. I graduated with a Bachelor of Science degree in Geology from New Mexico State University in 1987. I obtained a
Graduate Diploma in Engineering (Mining) in 1997 from the University of the Witwatersrand and a Master of Science in Engineering (Civil) from the University of the Witwatersrand in 2005. I am registered with the South African Council for Natural Scientific Professions as a Professional Geological Scientist (registration number 400008/04), the American Institute of Professional Geologists as a Certified Professional Geologist (certificate number 11015) and the Society for Mining, Metallurgy and Exploration as a Registered Member (#4152172). I have read the definition of “qualified person” set out in National Instrument 43-101 (NI 43-101) and certify that by reason of my education and past relevant work experience, I fulfill the requirements to be a “qualified person” for the purposes of NI 43-101. My relevant experience for the purpose of the Technical Report is: Underground Mine Geologist, Freegold Mine, AAC ................................................ 1987-1995; Mineral Resource Manager, Vaal Reefs Mine, Anglogold........................................ 1995-1997; Resident Geologist, Venetia Mine, De Beers ........................................................... 1997-2000; Chief Geologist, De Beers Consolidated Mines ....................................................... 2000-2004; Consulting Geologist .......................................................................................... 2004 to present.
4. I visited the Brucejack Property from September 9 to September 13, 2009.
5. I am responsible for the preparation and co-authoring of Section 16 and co-authoring Sections 18 and 19 of this Technical Report.
6. I am independent of Silver Standard Resources Inc. applying the test in Section 1.4 of NI 43-101.
7. I have had no prior involvement with the Brucejack Property that is the subject of the Technical Report.
8. I have read NI 43-101 and Form 43-101F1 and the Technical Report has been prepared in compliance therewith.
9. As of the date of this certificate, to the best of my knowledge, information and belief, the Technical Report contains all scientific and technical information that is required to be disclosed to make the Technical Report not misleading.
Effective Date: December 01, 2009 Signing Date: January 14, 2010 {SIGNED AND SEALED} [Fred H. Brown] ________________________________ Fred H. Brown CPG, PrSciNat

P&E Mining Consultants Inc., Rpt No. 173 Page 117 of 117 Brucejack Property Silver Standard Resources Inc.
CERTIFICATE of AUTHOR EUGENE J. PURITCH, P.ENG. I, Eugene J. Puritch, P. Eng., residing at 44 Turtlecreek Blvd., Brampton, Ontario, L6W 3X7, do hereby certify that: 1. I am President of P&E Mining Consultants Inc. under contract by Silver Standard Resources Inc. (the “Issuer”).
2. This certificate applies to the technical report titled “Technical Report and Resource Estimates on the West, Bridge,
Galena Hill, Shore, SG & Gossan Hill Gold & Silver Zones of the Brucejack Property, Northern British Columbia, Canada” (the “Technical Report”) dated January 14, 2010.
3. I am a graduate of The Haileybury School of Mines, with a Technologist Diploma in Mining, as well as obtaining an additional year of undergraduate education in Mine Engineering at Queen‟s University. In addition I have also met the Professional Engineers of Ontario Academic Requirement Committee‟s Examination requirement for Bachelor‟s Degree in Engineering Equivalency. I am currently licensed by the Professional Engineers of Ontario (License No. 100014010) and the Association of Professional Engineers and Geoscientists of Saskatchewan (License No. 16216) and registered with the Ontario Association of Certified Engineering Technicians and Technologists as a Senior Engineering Technologist. I am also a member of the National and Toronto CIM. I have practiced my profession continuously since 1978. I have read the definition of “qualified person” set out in National Instrument 43-101 (“NI 43-101”) and certify that, by reason of my education, affiliation with a professional association (as defined in NI 43-101) and past relevant work experience, I fulfill the requirements to be a “qualified person” for the purposes of NI 43-101. My summarized career experience is as follows:
- Mining Technologist - H.B.M.&S. and Inco Ltd. 1978-1980 - Open Pit Mine Engineer – Cassiar Asbestos/Brinco Ltd 1981-1983 - Pit Engineer/Drill & Blast Supervisor – Detour Lake Mine 1984-1986 - Self-Employed Mining Consultant – Timmins Area 1987-1988 - Mine Designer/Resource Estimator – Dynatec/CMD/Bharti 1989-1995
- Self-Employed Mining Consultant/Resource-Reserve Estimator 1995-2004 - President – P & E Mining Consultants Inc. 2004-Present 4. I have not visited the Brucejack Property.
5. I am responsible for co-authoring Section 16 of the Technical Report.
6. I am independent of the Issuer applying the test in Section 1.4 of NI 43-101.
7. I have had no prior involvement with the Brucejack Property that is the subject of the Technical Report.
8. I have read NI 43-101 and Form 43-101F1 and the Technical Report has been prepared in compliance therewith.
9. As of the date of this certificate, to the best of my knowledge, information and belief, the Technical Report contains
all scientific and technical information that is required to be disclosed to make the Technical Report not misleading; Effective Date: December 01, 2009 Signing Date: January 14, 2010 {SIGNED AND SEALED} [Eugene Puritch] ________________________________ Eugene J. Puritch, P.Eng


![Index [msu.edu]Continuing education eWeRt HouSe, eWeRt PlACe, SuMMeRtoWn (off MAP) B1 Continuing education ReWley HouSe, 1 Wellington SquARe B5 Continuing Professional development](https://static.fdocuments.net/doc/165x107/5e718db0c7ad31345e781ee5/index-msuedu-continuing-education-ewert-house-ewert-place-summertown-off-map.jpg)


