Transylvania County Community Transportation … of Contents Transylvania County Community...
148
Transylvania County Community Transportation Service Plan Final Report February 2011 Prepared by
Transcript of Transylvania County Community Transportation … of Contents Transylvania County Community...
Transylvania County Community Transportation Service Plan Final Report February 2011 Prepared by
Table of Contents
Transylvania County Community Transportation Service Plan Page i
Table of Contents
Executive Summary ...................................................................................................................................... 1
System Existing Conditions .......................................................................................................................... 4
Advisory and Governance Structure ................................................................................................ 4
Existing Service Characteristics ........................................................................................................ 5
Analysis of Demand ......................................................................................................................... 9
Funding and Financial Management .............................................................................................. 13
Capacity Analysis ............................................................................................................................ 15
Public Satisfaction and Community Needs .................................................................................... 17
Summary ........................................................................................................................................ 20
Service Area Characteristics ....................................................................................................................... 21
Purpose .......................................................................................................................................... 21
Transportation Setting ................................................................................................................... 21
Historical and Projected Population .............................................................................................. 23
Population Density ......................................................................................................................... 24
Target Population and Household Groups .................................................................................... 25
Mobility Needs Assessment ........................................................................................................... 34
Employment and Commuting ....................................................................................................... 36
Transylvania County Activity Centers and Key Public Transit Destinations ................................... 41
Regional Activity Centers ............................................................................................................... 42
Summary ........................................................................................................................................ 43
Management and Service Alternatives ..................................................................................................... 45
Introduction ................................................................................................................................... 45
Financial Alternatives ..................................................................................................................... 45
Management Alternatives ............................................................................................................. 55
Operations and Service Alternatives ............................................................................................. 61
Implementation Schedule .............................................................................................................. 82
Cost and Revenue Projections ....................................................................................................... 87
Capital Plan .................................................................................................................................... 90
Summary ........................................................................................................................................ 91
Table of Contents
Transylvania County Community Transportation Service Plan Page ii
Table of Contents
Appendices
Appendix A – Public Survey Form
Appendix B – Rider Survey Form
Appendix C – Transit Needs Assessment Data
Appendix D – Model Service Contract
Appendix E – Model Monthly Performance Report
Appendix F – Best Practice Service Agreement
Appendix G - Public Hearing Notice and Resolution for the Adoption of CTSP
List of Tables
Table 1 – Operating Trends ........................................................................................................................... 8
Table 2 – Productivity Trends ....................................................................................................................... 8
Table 3 – Financial Statistics ....................................................................................................................... 13
Table 4 – Financial Efficiency and Effectiveness Trends ............................................................................. 15
Table 5 – Vehicle Inventory......................................................................................................................... 16
Table 6 –Historical and Projected Population ............................................................................................. 23
Table 7 – Population and Population Change by Municipality and Township ........................................... 23
Table 8 – Work Trips of Transylvania County Residents (2002 to 2007) .................................................... 39
Table 9 – Work trips of Transylvania County Workers (2002 to 2007) ....................................................... 40
Table 10 – Three Variable Cost Allocation Model ....................................................................................... 47
Table 11 – Point Deviation Running Time .................................................................................................. 68
Table 12 – Route Deviation Service Projected Operating Statistics ........................................................... 73
Table 13 -- Regional TRANSPORT Shuttle Service Options ......................................................................... 80
Table 14 – Phased Implementation Plan .................................................................................................... 83
Table 15 – Operating Costs (current year dollars) ...................................................................................... 88
Table 16 – Financial Forecasts (current year dollars) ................................................................................. 89
Table 17 – Projected Capital Costs .............................................................................................................. 91

Table of Contents
Transylvania County Community Transportation Service Plan Page iii
List of Figures
Figure 1 – Time Distribution of Demand – Scheduled Pick-Ups ................................................................... 9
Figure 2 – Time Distribution of Demand – Trip Ends .................................................................................. 10
Figure 3 – Distribution of Demand of TRANSPORT Services ....................................................................... 11
Figure 4 – Current TRANSPORT Organizational Structure .......................................................................... 16
Figure 5 – Transylvania County ................................................................................................................... 22
Figure 6– Population Density ...................................................................................................................... 24
Figure 7 – Percent Senior Citizen Population (60+) .................................................................................... 27
Figure 8 – Density of Senior Citizen Population (60+) ................................................................................ 28
Figure 9 – Percent Disabled Population ...................................................................................................... 29
Figure 10 – Density of Disabled Population ................................................................................................ 30
Figure 11 – Percent of Population Living at or Below the Poverty Level .................................................... 31
Figure 12 – Density of Population Living at or Below the Poverty Level .................................................... 32
Figure 13 – Percent Carless Households ..................................................................................................... 33
Figure 14 – Carless Household Density ....................................................................................................... 34
Figure 15 – Mobility Needs Score ............................................................................................................... 35
Figure 16 – Employment Locations ............................................................................................................. 37
Figure 17 – Employment Density ................................................................................................................ 38
Figure 18 – Activity Centers and Key Public Transit Destinations............................................................... 42
Figure 19 – Regional Activity Centers ......................................................................................................... 43
Figure 20 – County-Wide Demand Response Transportation Option ........................................................ 64
Figure 21 – Point Deviation Service Option ................................................................................................ 67
Figure 22 – Sample Bus Stop Sign ............................................................................................................... 69
Figure 23 – Route Deviation Service Option ............................................................................................... 71
Figure 24 – Regional Shuttle Route Recommendation ............................................................................... 80

Executive Summary
Transylvania County Community Transportation Plan Page 1
EXECUTIVE SUMMARY INTRODUCTION The Transylvania County Transportation System (TRANSPORT) provides public transportation using the combined resources of county funding, the Federal Transit Administration (FTA) Section 5311 program, and the North Carolina Department of Transportation (NCDOT) Public Transportation Division’s (PTD) Rural Operating Assistance Program (ROAP), and other sources. The transit system operates subscription and demand response service throughout Transylvania County and medical trips to Buncombe and Henderson Counties. The system is available to any member of the general public but is primarily used by seniors, Medicaid clients, persons with disabilities and clients of various human service programs.
The Community Transportation Service Plan (CTSP) represents a strategic effort to evaluate TRANSPORT’s current approach in all facets of management and operations, improve the delivery of existing transportation services, and ensure that the transit system is meeting the mobility needs of the transportation disadvantaged and the general population now and planning a response to their projected mobility needs over the next five years. This report also fulfills the North Carolina Department of Transportation (NCDOT) requirement that every five years transit systems develop a CTSP as a prerequisite for receiving Federal and State funding for capital, administrative and operating assistance.
The CTSP for the TRANSPORT system has the following purposes, as prescribed by NCDOT:
• To identify the current performance and organizational direction of the system;
• To recommend strategies to improve operations and management that increase mobility options for transit dependent individuals and the general public;
• To improve the efficiency and effectiveness of the organization and the transportation services it provides to the public;
• To support and encourage defensible, results-based budget requests to NCDOT for funding; and
• To promote the coordination of public transportation services across geographies.
These objectives have guided the preparation of this study and are reflected in the final recommendations. SUMMARY OF THE CTSP
To meet the study objectives outlined above, this report provides a comprehensive look at transit in Transylvania County. This includes a description and analysis of current transit services as well as the operating environment in which those services are provided. Using this

Executive Summary
Transylvania County Community Transportation Plan Page 2
inventory of information and the analyses performed, a comprehensive set of financial, management, operational, and service alternatives are presented. System Existing Conditions
TRANSPORT (Transylvania People Oriented Rural Transportation) is the primary provider of public transportation service in Transylvania County, and is administered by the County as part of the County government. TRANSPORT operates subscription and demand response service throughout Transylvania County and medical trips to Buncombe and Henderson Counties. As of 2009, the system operates seven vans and provides 12 in-county vehicle runs per day serving senior citizen facilities, vocational services, trade schools, employment sites, and shopping areas. The majority of service directly operated by TRANSPORT is subscription based. TRANSPORT also operates service to the Hendersonville Dialysis Center (Henderson County); all other out-of-county trips are brokered through City Cab or ARC Angel. TRANSPORT averages between 150 and 175 passenger trips per day, with service available Monday through Friday, 6:00 AM to 6:00 PM. The system ridership has increased 14 percent in the last 3 years as has the vehicle revenue miles (16 percent). Operating expenses have increased somewhat proportionally during the same time period (approximately 13 percent).
To better understand the existing conditions of the area’s public transportation needs, public outreach sessions were held at various locations, as well as rider surveys conducted. The survey results showed that almost half of the respondents were aware of TRANSPORT’s services. Moreover, a vast majority of riders were satisfied with the services provided. In addition, discussion sessions were held with TRANSPORT’s Advisory Board and interviews conducted with human services agencies and other stakeholders. Finally, a review of other area plans, studies and data was undertaken to determine possible transit needs. Service Area Characteristics
After analyzing the existing conditions and operations of TRANSPORT, an analysis of the existing population and transportation setting within Transylvania County was performed. Of particular interest were areas in the County where transit need was the greatest. This included analysis of data on the targeted population groups, including senior citizens, persons with disabilities, low income individuals, and households without access to an automobile. The locations of activity centers that attract transit trips (i.e., major employers, shopping centers, medical and senior citizen facilities, and post-secondary schools) was mapped, and origin and destination information provided data on commuting patterns in terms of where County residents work and where County employees live. Field reconnaissance of the county was also undertaken to understand the existing and future land use, key generators, roadway characteristics, etc. Based upon the above data, a transportation needs assessment was compiled that mapped the possible transit markets within Transylvania County. The analysis showed that population growth has slowed in the last few years but most of the growth has been within the Town of Brevard. The County has seen an increase since 2000 in the population that is at least 60 years of age, is living below the poverty level, and living with a

Executive Summary
Transylvania County Community Transportation Plan Page 3
disability. Transylvania County is now above the state average in terms of percentage of households in all these categories. However, the County continues to remain rural in nature, with limited population concentrations in the small towns; this should continue given that half of Transylvania County is national forest. Employment within the County has diminished between 2002 and 2007, and origin and destination data show an increasing trend in county residents commuting out of county for employment. Management and Service Alternatives Based upon the data collected and analyzed, a series of financial, management and service alternatives were developed. Financial Alternatives:
• Develop a fully allocated cost model, using assistance from NCDOT and the Institute for Transportation Research and Education
• Develop billing rates for new markets • Use cost model to determine cost effectiveness of brokered medical trips • Pursue new funding sources through contract services • Pursue additional funding sources
Management Alternatives
• Formalize data collection and service monitoring • Formalize brokerage operations, policies and procedures • Review scheduling and tracking procedures • Develop marketing plan
Operation and Service Alternatives
• Expand service levels and service coverage in the midday period • Use GIS to monitor ridership patterns and trends • Implement county-wide demand response transportation zones • Develop point deviation service option • Develop route deviation service option within Brevard and Pisgah Forest
Regional Transportation Service Options
• Use ADA van for out-of-county dialysis service • Explore other methods to reduce costs associated with out-of-county medical trips • Establish regional carpool/vanpool system • Implement regional general public transportation shuttle to Asheville Airport (with
connections to Asheville Transit and Apple Country Transportation) All of the proposed improvements are a menu of service options which should be reviewed and analyzed to determine which should be selected for implementation. In large measure, the pace of implementation will be based upon available funding.
System Existing Conditions
Transylvania County Community Transportation Service Plan Page 4
SYSTEM EXISTING CONDITIONS
This chapter provides a description and analysis of the community transportation
system in Transylvania County (TRANSPORT), as well as provides a brief inventory of other transit providers in the county and in the region. The information contained in this chapter will be used as the base data for the development of the five-year plan.
ADVISORY AND GOVERNANCE STRUCTURE
The primary provider of public transportation service in Transylvania County is the Transylvania People Oriented Rural Transportation (TRANSPORT). The system is administered by the County and is a part of the County government.
The County Manager and County Human Resource Director oversee the TRANSPORT
program, with the County Board of Commissioners acting as the governing board for the system.
The system is also guided by a 16 member Transit Advisory Board (TAB), which includes the County Manager, the TRANSPORT Support Services Administrator, affected human service agencies, and community and business representatives. The composition of the TAB complies with the TAB membership guidelines established by NCDOT. At the outset of this study, the TAB had not met in several months since there were no specific issues to discuss. However, as the CTSP process was initiated, regular meeting have again been held. A review of a sample of meeting agenda and minutes indicated that the TAB addresses the issues relevant to community transportation in Transylvania County. When meetings have been held, attendance has not been a problem. The consultant team met with the TAB at one of its regularly scheduled meetings and asked the group if they felt they have sufficient opportunity to provide input and guide community transportation policy. All felt that the current structure is effective and that they have ample opportunity to provide input and guidance into local community transportation policy decision making.
The March 2010 Compliance, Capacity, and Proficiency Review (CCAP) of the TRANSPORT system found that the County is not providing advance notice of their TAB meetings to the Clerk to the County Commissioners as required by North Carolina General Statutes § 143-318.10(b). TRANSPORT has indicated that it will begin notifying the Clerk to the County Commissioners at least two weeks before every TAB meeting and will become effective starting with the next TAB meeting.

System Existing Conditions
Transylvania County Community Transportation Service Plan Page 5
EXISTING SERVICE CHARACTERISTICS
This section describes the services that make up the local community transportation network and analyzes the efficiency and effectiveness of the services provided by TRANSPORT. Available Services
TRANSPORT operates subscription and demand response service throughout Transylvania County and medical trips to Buncombe and Henderson Counties. Service is subsidized through various Federal, State, and local specialized transportation funding programs. The system is available to any member of the general public but is primarily used by seniors, Medicaid enrollees, persons with disabilities or clients of various human service programs.
TRANSPORT operates seven vans funded under the NCDOT – PTD S.5311 program and provides approximately 12 in-county vehicle runs per day serving senior citizen facilities (e.g., nutrition sites, senior centers, and recreation centers), vocational services, trade schools, employment sites, and shopping areas. Most trips are provided during the morning and afternoon periods and are designed to serve human service clients and senior citizens while the midday period is designed to serve the general public – grocery shopping, the post office, and other services. The majority of service directly operated by TRANSPORT is subscription based and consists of trips carrying multiple passengers to common destinations located in within the County’s two population centers – the City of Brevard and the Town of Rosman.
TRANSPORT directly operates service to the Hendersonville Dialysis Center in Henderson
County three days a week, with all other out-of-county trips brokered to City-Cab (Brevard) or ARC Angel Trans Support Services (Hendersonville).
TRANSPORT contracts with City Cab to provide all Medicaid transportation and most of the demand response service while ARC Angel is used only when an out-of-county Medicaid trip requires the use of a lift-equipped vehicle.
TRANSPORT staff has indicated that it is more efficient to broker Medicaid trips to City Cab because the trips tend to be more individualized and are harder to group into a schedule where two or more passengers ride on the same vehicle. Staff also indicated that Medicaid riders tend to be more geographically dispersed and require a greater level of vehicle and driver resources. TRANSPORT will dispatch its lift-equipped vehicles to serve Medicaid riders who cannot access City Cab vehicles; however, the system generally does not serve areas that are removed from the Brevard and Rosman population centers. Members of the TAB noted that this policy is an impediment to mobility in the outlying areas. The policy will be examined more thoroughly in subsequent sections of this CTSP process.

System Existing Conditions
Transylvania County Community Transportation Service Plan Page 6
TRANSPORT’s March 2010 Compliance, Capacity, and Proficiency Review (CCAP) cited a deficiency in the area of contracting procedures. The compliance review found that the contract between TRANSPORT and City Cab has not been formalized and submitted to the NCDOT for review despite the fact that the contract exceeds $3,000 and includes the distribution of State transportation funds to the cab company without the approval from the NCDOT. The compliance review indicated that the County must revise its contracting procedures to ensure that all third party contracts over $3,000 in scope are reviewed by NCDOT prior to execution. The compliance review also recommended that the County formalize its brokerage operations, policies, and procedures. (Transylvania County Department of Social Services has an agreement with City Cab, and TRANSPORT assists in providing this service by making reservations and delivering manifests to City Cab.) This issue will be discussed more thoroughly in subsequent sections of this CTSP process.
Subscription and demand response services are available Monday through Friday, from
6:00 AM to 6:00 PM. Riders wanting to schedule a trip are required to call TRANSPORT at least 24 hours in advance of the desired pick-up time. The subscription service is prearranged and serves specific origin and destination points on a reoccurring basis; as a result, this group of riders generally does not schedule service on a day-to-day basis. Passenger fares are generally subsidized through various funding sources and donations; however, there are no subsidies for riders that do not meet certain eligibility thresholds – these riders are considered the “general public” and must pay a fare of $1.00 for in-county service, a discounted fare of $5.00 for in-county City Cab service, and a discounted fare of $15.00 for out-of-county City Cab service.
On a daily basis, certain vehicle runs are dedicated strictly to transporting pre-school aged children from home locations to day care facilities including the County’s Child Development Center. Many of these trips are paid for through the Work First program.
TRANSPORT averages between 150 and 175 passenger trips per day, with scheduled
pick-ups generally occurring between the hours of 8:00 AM and 10:00 AM and 2:00 PM and 4:00 PM.
Other Human Service Transportation in Transylvania County
The State of North Carolina requires all nursing homes and assisted living facilities in the state to provide transportation services for their clients. In Transylvania County, these facilities generally own one or two vans, which are operated on an as needed basis for medical appointments, weekly shopping trips, and social events. These facilities do not charge an upfront fare for the use of the vans, but rather, include the cost of operating this transportation service in the overall fee these businesses charge to their customers or clients. At present, TRANSPORT does not serve any clients or residents using these facilities.
Private Transportation in Transylvania County
City Cab is the only private transportation provider in the County.
System Existing Conditions
Transylvania County Community Transportation Service Plan Page 7
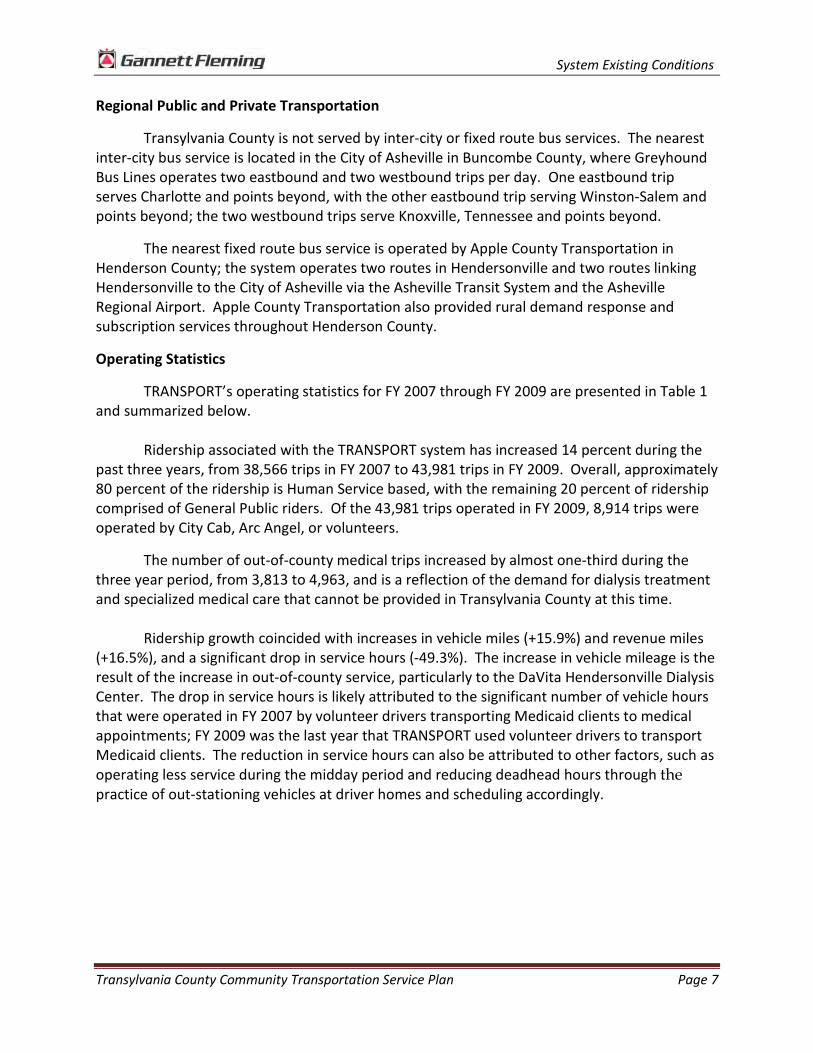
Regional Public and Private Transportation
Transylvania County is not served by inter-city or fixed route bus services. The nearest inter-city bus service is located in the City of Asheville in Buncombe County, where Greyhound Bus Lines operates two eastbound and two westbound trips per day. One eastbound trip serves Charlotte and points beyond, with the other eastbound trip serving Winston-Salem and points beyond; the two westbound trips serve Knoxville, Tennessee and points beyond.
The nearest fixed route bus service is operated by Apple County Transportation in Henderson County; the system operates two routes in Hendersonville and two routes linking Hendersonville to the City of Asheville via the Asheville Transit System and the Asheville Regional Airport. Apple County Transportation also provided rural demand response and subscription services throughout Henderson County.
Operating Statistics
TRANSPORT’s operating statistics for FY 2007 through FY 2009 are presented in Table 1 and summarized below.
Ridership associated with the TRANSPORT system has increased 14 percent during the past three years, from 38,566 trips in FY 2007 to 43,981 trips in FY 2009. Overall, approximately 80 percent of the ridership is Human Service based, with the remaining 20 percent of ridership comprised of General Public riders. Of the 43,981 trips operated in FY 2009, 8,914 trips were operated by City Cab, Arc Angel, or volunteers.
The number of out-of-county medical trips increased by almost one-third during the three year period, from 3,813 to 4,963, and is a reflection of the demand for dialysis treatment and specialized medical care that cannot be provided in Transylvania County at this time.
Ridership growth coincided with increases in vehicle miles (+15.9%) and revenue miles
(+16.5%), and a significant drop in service hours (-49.3%). The increase in vehicle mileage is the result of the increase in out-of-county service, particularly to the DaVita Hendersonville Dialysis Center. The drop in service hours is likely attributed to the significant number of vehicle hours that were operated in FY 2007 by volunteer drivers transporting Medicaid clients to medical appointments; FY 2009 was the last year that TRANSPORT used volunteer drivers to transport Medicaid clients. The reduction in service hours can also be attributed to other factors, such as operating less service during the midday period and reducing deadhead hours through the practice of out-stationing vehicles at driver homes and scheduling accordingly.

System Existing Conditions
Transylvania County Community Transportation Service Plan Page 8
Table 1 – Operating Trends
Operating Statistics FY 2007 FY 2008 FY 2009 % Change Vehicle Service Hours 20,430 10,627 10,360 -49.3% TRANSPORT 8,223 8,204 7,802 -5.1% Other 12,207 2,423 2,558 -79.0% Vehicle Service Miles 296,901 313,977 343,963 15.9% TRANSPORT 135,781 142,853 131,750 -3.0% Other 161,120 171,124 212,213 31.7% Vehicle Revenue Miles 265,312 274,968 309,015 16.5% TRANSPORT 117,081 117,535 106,907 -8.7% Other 148,231 157,433 202,108 36.3% Passenger Trips 38,566 41,119 43,981 14.0
Source: FY 2007 – FY 2009 OPSTATS Reports
Productivity – Table 2 provides data regarding the productivity of the scheduled service on the TRANSPORT system measured on a per service hour basis.
Table 2 - Productivity Trends
Passengers Per FY 2007 FY 2008 FY 2009 % Change Vehicle Service Hour 1.89 3.87 4.25 124.9
Source: FY 2007 – FY 2009 OPSTATS Reports
As shown, TRANSPORT’s passenger productivity more than doubled between FY 2007 and FY 2009, from 1.89 passengers per service hour to 4.25 passengers per service hour; this performance exceeds the average of the peer group (4.17 passengers per service hour) used in the 2009 Performance Planning Analysis that was prepared by the Institute for Transportation Research and Education (ITRE) of the North Carolina State University. This performance is likely attributed to TRANSPORT's policy of focusing on serving the Brevard and Pisgah Forest area and brokering the more geographically dispersed and time consuming Medicaid and rural trips to a local taxi service; this policy enables TRANSPORT to carry mostly subscription riders, which allows the system to schedule vehicle runs that carry multiple passengers. However, the high productivity may come at the expense of countywide transit equity and mobility, in that residents living in the rural areas of the County only receive public transportation service if they meet Medicaid eligibility requirements.

System Existing Conditions
Transylvania County Community Transportation Service Plan Page 9
ANALYSIS OF DEMAND
An analysis of the current demand on the TRANSPORT system was undertaken and includes data obtained from a one complete day of driver manifests from March 2009. A review of one week of sample manifests showed that the one day used was representative of a typical day of operation for TRANSPORT given the high rate of subscription trips. In addition, an extensive analysis of vehicle utilization and productivity had already been performed by ITRE, so there was little need to perform any additional analysis for that purpose.
It is important to point out that the ridership data obtained from the driver manifests do not include the Medicaid trips provided by City Cab. As a result, the composition and location of demand may be understated, particularly as it relates to the number of out-of-county trips and pick-up locations in the outlying areas of the County. Composition of Demand
One factor that affects both the efficiency as well as the resource need of the
TRANSPORT system is the distribution of that demand throughout the day. Figure 1 shows that the demand for pick-ups on TRANSPORT is concentrated between 7:00 AM and 9:00 AM and 12:00 PM and 2:00 PM, with demand dropping off sharply during the other time periods. This type of demand distribution is common for systems operating a demand responsive service model with a high number of subscription trips.
Figure 1 - Time Distribution of Demand – Scheduled Pick Ups
0
5
10
15
20
25
30
35
6:00 AM
7:00 AM
8:00 AM
9:00 AM
10:00 AM
11:00 AM
12:00 PM
1:00 PM
2:00 PM
3:00 PM
4:00 PM
5:00 PMSc
hedu
led
Pick
-Ups
60 Minute Period Beginning

System Existing Conditions
Transylvania County Community Transportation Service Plan Page 10
Scheduled pick-ups are only one element of the scheduled operation of service. The intensity of activity also depends on drop-off times. Together, these equal trip ends, that is, anytime a vehicle makes a stop for a passenger to board or alight from the vehicle. This provides a more accurate picture of the level of activity on the TRANSPORT system. Figure 2 provides the pattern of trip ends for each 60-minute period throughout the same service day as the scheduled pick up times. What the figure shows is that trip end activity is much less distinctively peaked than the pattern of scheduled pick-ups, though the busiest hour for trip ends occurs during the 12:00 PM hour.
Figure 2 - Time Distribution of Demand – Trip Ends
TRANSPORT exhibits a high trip end activity during the 8:00 AM and 9:00 AM hours, as well as the 2:00 PM hour; with the exception of the midday period, which is the slowest part of the day, passenger activity is consistent between 7:00 AM and 4:00 PM. Again, this pattern of activity is typical of a system operating subscription and demand responsive services.
The figures show that most passenger activity occurs between the hours of 8:00 AM and 10:00 AM and 12:00 PM and 2:00 PM, with minimal passenger activity before 7:00 AM and after 4:00 PM. These findings are similar to the passenger activity noted in the ITRE Performance Planning Analysis study, which showed high concentrations of passenger activity occurring between 7:00 AM and 9:00 AM and 2:00 PM and 4:00 PM. As a result, there is excess capacity in the system during the midday period to provide additional general public general purpose demand response service in the County. As noted in the ITRE Performance Plan, Transylvania County should pursue funding sources with clients that need transportation during the midday period.
0
10
20
30
40
50
60
6:00 AM
7:00 AM
8:00 AM
9:00 AM
10:00 AM
11:00 AM
12:00 PM
1:00 PM
2:00 PM
3:00 PM
4:00 PM
5:00 PMSc
hedu
led
Trip
End
s
60 Minute Period Beginning

System Existing Conditions
Transylvania County Community Transportation Service Plan Page 11
Using the sample of completed driver manifests from one complete day in March 2009, the geographic distribution of demand of TRANSPORT’s services was analyzed. A review of the geographic distribution of demand is graphically depicted in Figure 3.
Figure 3 – Distribution of Demand of TRANSPORT Services
As shown, scheduled pick-ups and drop offs are heavily concentrated in the City of Brevard and Pisgah Forest area and to a lesser extent, the Town of Rosman. These municipalities represent the primary population and activity centers in the County. The remaining demand is generally dispersed throughout the northeastern portions of the County near the Henderson County border.

System Existing Conditions
Transylvania County Community Transportation Service Plan Page 12
Scheduling
TRANSPORT utilizes Trip Maker software to schedule its daily service; the brokered trips are scheduled using hard copy manual methods. The Medical Transportation Coordinator is responsible for scheduling the subscription trips and taking calls from customers requesting service. Daily service is almost entirely comprised of subscription trips, that is, they do not change on a daily basis. Currently, TRANSPORT typically schedules its runs with all subscription trips and uses designated runs in the midday period to address non-subscription, or daily trips. The scheduled trips are processed and organized into the driver manifests, which are provided to the drivers the day prior to the scheduled service. The driver manifests are verified the day after the scheduled trip. The ITRE Performance Plan report indicated that the system is not following the proper procedures when utilizing the Trip Maker subscription function, which is resulting in the software recording a high number of cancellations that are not the fault of the passenger. Currently, many subscriptions are scheduled for more days than the client is actually going to ride. TRANSPORT staff cancels the unneeded trips during the daily scheduling process.
The Medicaid trips operated by City Cab are scheduled by TRANSPORT who in turn, faxes the cab company a daily trip manifest each afternoon for scheduled trips the next day. Medicaid riders are not permitted to make a reservation through City Cab.
TRANSPORT has procedures in place to capture and enter data regarding service actually operated. TRANSPORT drivers record information regarding trips provide onto their manifests. This information is then manually entered into the Trip Maker system by the Medical Transportation Coordinator. The ITRE Performance Planning report indicated that the drivers do not always pick-up and drop-off passengers in the scheduled order, which can disrupt the dispatching and re-scheduling process and prevent the system from knowing exactly how many passengers are on a vehicle at a certain time.
The scheduled trip data are recorded for reporting and draw down purposes. TRANSPORT does not create daily, weekly, or monthly ridership reports.
ITRE Performance Plan
Using the Operations Statistics (OPSTATS) and Vehicle Utilization Data (VUD) reports compiled by the NCDOT, ITRE analyzed the current operations of TRANSPORT and assembled a list of priority goals to guide the organization’s policy decisions in the coming years. The goals identified in the plan included:
• Targeted performance measures; • Create driver manifests in which trips are listed in a designated order for the driver to
follow; • Utilize the subscription function in TripMaker to improve the efficiency of service
delivery; • Explore options for service expansion;

System Existing Conditions
Transylvania County Community Transportation Service Plan Page 13
• Evaluate the cost effectiveness of brokering trips to the City Cab taxi company; • Formalize the process for reviewing reports; and • Reduce the number of cancellations that have a negative impact on efficiency and
scheduling.
All of these issues were considered further as part of the CTSP process.
FUNDING AND FINANCIAL MANAGEMENT
TRANSPORT is primarily funded through the Federal Transit Administration (FTA) Section 5311 program for rural and small urban areas. Transylvania County is a subrecipient of these funds through NCDOT. On the state level, TRANSPORT is funding through the North Carolina Rural Operating Assistance Program (ROAP), the North Carolina Elderly and Disabled Transportation Assistance Program (EDTAP). Local funds are provided through the Transylvania County general fund.
Funding sources subsidize the cost of transporting the vast majority of TRANSPORT's passengers. As noted above, County residents not eligible for fare subsidies are charged a fare of $1.00 for in-county service, $5.00 for in-county City- Cab service and $15.00 for out-of-county City Cab service.
Financial Statistics
Table 3 provides information on the trend in the operating costs of the TRANSPORT system between FY 2007 and FY 2009.
Table 3 - Financial Statistics Trends
Financial Statistics FY 2007 FY 2008 FY 2009 % Change Operating Expenses
Administrative $145,881 $162,241 $172,877 18.5% Operations $173,085 $172,469 $186,985 8.0%
Subtotal $318,966 $334,710 $359,862 12.8% Operating Assistance & Revenue
Federal $111,148 $126,914 $134,422 20.9% State $93,047 $100,081 $95,326 2.4% Local $85,228 $85,375 $99,023 16.2% Passenger Fares $3,591 $2,938 $5,448 51.7% Other $25,953 $19,402 $17,242 -33.6%
Subtotal $318,967 $334,710 $351,461 10.2% Source: FY 2007 – FY 2009 OPSTATS Reports
System Existing Conditions
Transylvania County Community Transportation Service Plan Page 14
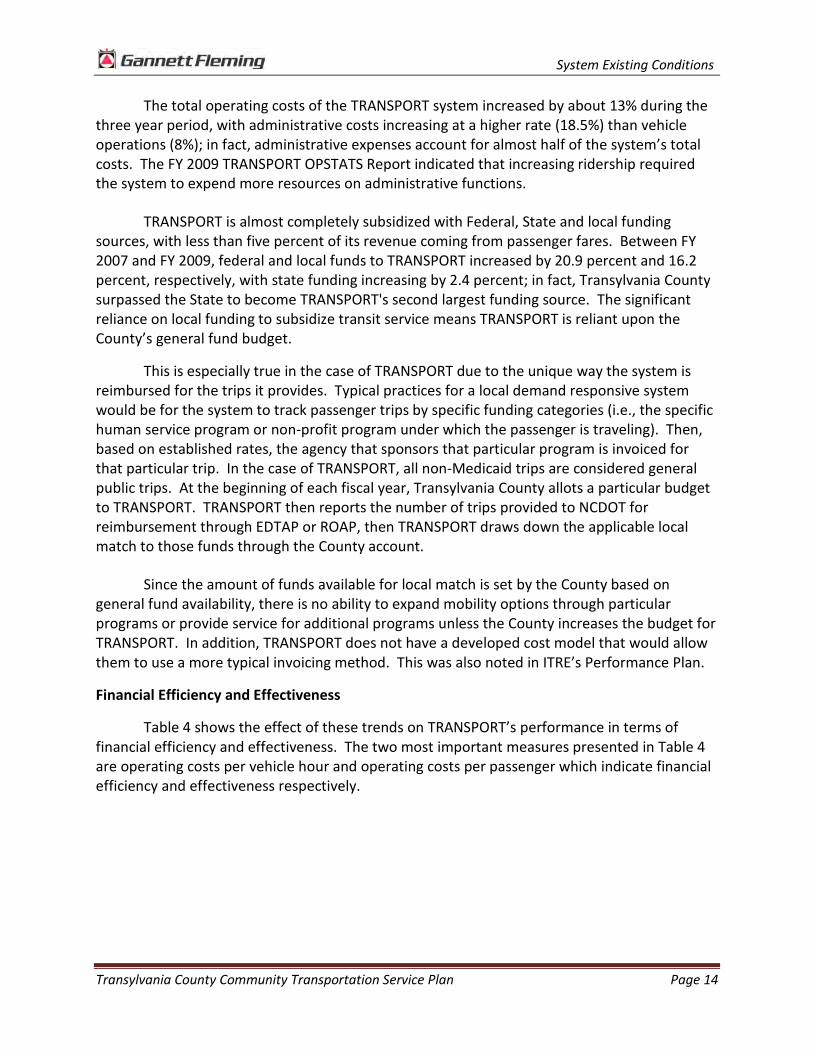
The total operating costs of the TRANSPORT system increased by about 13% during the three year period, with administrative costs increasing at a higher rate (18.5%) than vehicle operations (8%); in fact, administrative expenses account for almost half of the system’s total costs. The FY 2009 TRANSPORT OPSTATS Report indicated that increasing ridership required the system to expend more resources on administrative functions.
TRANSPORT is almost completely subsidized with Federal, State and local funding sources, with less than five percent of its revenue coming from passenger fares. Between FY 2007 and FY 2009, federal and local funds to TRANSPORT increased by 20.9 percent and 16.2 percent, respectively, with state funding increasing by 2.4 percent; in fact, Transylvania County surpassed the State to become TRANSPORT's second largest funding source. The significant reliance on local funding to subsidize transit service means TRANSPORT is reliant upon the County’s general fund budget.
This is especially true in the case of TRANSPORT due to the unique way the system is reimbursed for the trips it provides. Typical practices for a local demand responsive system would be for the system to track passenger trips by specific funding categories (i.e., the specific human service program or non-profit program under which the passenger is traveling). Then, based on established rates, the agency that sponsors that particular program is invoiced for that particular trip. In the case of TRANSPORT, all non-Medicaid trips are considered general public trips. At the beginning of each fiscal year, Transylvania County allots a particular budget to TRANSPORT. TRANSPORT then reports the number of trips provided to NCDOT for reimbursement through EDTAP or ROAP, then TRANSPORT draws down the applicable local match to those funds through the County account.
Since the amount of funds available for local match is set by the County based on general fund availability, there is no ability to expand mobility options through particular programs or provide service for additional programs unless the County increases the budget for TRANSPORT. In addition, TRANSPORT does not have a developed cost model that would allow them to use a more typical invoicing method. This was also noted in ITRE’s Performance Plan.
Financial Efficiency and Effectiveness
Table 4 shows the effect of these trends on TRANSPORT’s performance in terms of financial efficiency and effectiveness. The two most important measures presented in Table 4 are operating costs per vehicle hour and operating costs per passenger which indicate financial efficiency and effectiveness respectively.

System Existing Conditions
Transylvania County Community Transportation Service Plan Page 15
Table 4 – Financial Efficiency and Effectiveness Trends Criteria –
Criteria – Operating Costs Per
Figures in Dollars ($) % Change FY 2007 FY 2008 FY 2009
Vehicle Service Miles 1.07 1.07 1.05 -2.6 Vehicle Revenue Miles 1.20 1.22 1.16 -3.1 Vehicle Service Hours 15.61 31.50 34.74 122.5 Passenger Trip 8.27 8.14 8.18 -1.1
Source: FY 2007 – FY 2009 OPSTATS Reports
In terms of financial effectiveness, the operating costs per vehicle service miles and vehicle revenue miles decreased 2.6 percent and 3.1 percent, respectively, between FY 2007 and FY 2009. Over the same period, the operating costs per service hour more than doubled from $15.61 to $34.74. The declining cost per mile occurred because operating costs are being spread over more miles, which is likely attributed to higher operating speeds due to lower dwell times at pick-up and drop-off locations; conversely, the increase in the cost per hour is attributed to costs increasing while the number of hours operated by TRANSPORT dropped significantly. This is attributed to TRANSPORT brokering out Medicaid trips to City Cab and the out of county trips requiring wheelchair assistance to Arc Angel; It is important to note that TRANSPORT has not developed a cost model to determine if brokering out trips to City Cab and ArcAngel is more cost effective than if TRANSPORT operated these trips. This was also noted in ITRE’s Performance Plan.
The operating cost per passenger trip was stable over the three year period and in fact, exhibited a decline of approximately one percent. This performance is attributed to high productivity due the large provision of grouped subscription trips.
CAPACITY ANALYSIS
The Support Services Administrator is responsible for the day-to-day operation of the TRANSPORT system. Along with the Services Support Administrator, the system employs a full-time Program Support Assistant, a full-time Medical Transportation Coordinator, and seven drivers (4.6 FTE). The organizational structure of the TRANSPORT system is presented in Figure 4.

System Existing Conditions
Transylvania County Community Transportation Service Plan Page 16
Figure 4 - Current TRANSPORT Organizational Structure
Fleet Inventory
TRANSPORT operates a fleet of seven federally funded vehicles used to provide the subscription and demand responsive services in Transylvania County. The fleet includes four conversion vans, two lift-equipped vans, and one 20 foot LTV. The Public Transportation Management System (PTMS) data indicate that all of the revenue vehicles in the fleet are equipped with two-way Motorola radios. Table 5 provides a detailed fleet inventory. In FY 2010, Van number 28 is scheduled to be replaced by a 20 foot LTV, which was purchased using American Recovery and Reinvestment Act (ARRA) funds.
Table 5 – TRANSPORT Vehicle Inventory
Year Make Vehicle Type Seating
Capacity Wheelchair
Stations Vehicle
Use Mileage
ID Oct-09 Van 32 2009 Ford 20 ft. LTV 10 2 R 11,770 Van 33 2009 Ford Conversion Van 13 0 R 8,587 Van 31 2006 Ford Conversion Van 9 0 R 60,277 Van 30 2006 Ford Lift Equipped Van 9 2 R 90,183 Van 29 2003 Dodge Conversion Van 14 0 R 112,425 Van 28 2003 Dodge Lift Equipped Van 14 3 R 129,944 Van 24 2000 Dodge Conversion Van 14 0 B 44,583
County Board of Commissioners
County Manager
Support Services Administrator
1 FT
Program Support Assistant
1 FT
Medical Transportation
Coordinator1 FT
Drivers7 (4.6 FTE)

System Existing Conditions
Transylvania County Community Transportation Service Plan Page 17
The seating capacity for the entire fleet is 83 passengers, plus seven wheelchair stations. On a typical day, six vehicles are used for peak service, which results in a spare ratio of approximately 17 percent.
The NCDOT considers the useful life of vans to be 100,000 miles. Under this guideline, two of the vehicles in the TRANSPORT fleet are past their useful life and should be replaced.
TRANSPORT Facility
TRANSPORT operates from an office in the County’s Community Services Building in downtown Brevard. The office space is sufficient to address administrative needs. TRANSPORT practices out-stationing under which TRANSPORT drivers store the vehicles at their homes. This allows them to leave from and return to their homes at the beginning and end of their shift. This policy appears to be very efficient at reducing deadhead hours.
All preventative and unscheduled vehicle maintenance functions are performed under contract with the City of Brevard at the City garage. TRANSPORT uses TCMD software from ITRE to monitor vehicle maintenance.
PUBLIC SATISFACTION AND COMMUNITY NEEDS
To incorporate local input into the CTSP process, the scope of work for the study included a series of public walk-in meetings, rider surveys, and interviews with County human service agencies. This section provides a summary of the results of these public and staff participation efforts.
Public Walk-In Sessions Two public walk-in sessions were held on December 16, 2009. Sessions were held in the
afternoon at the County library in Brevard and in the early evening at the Wal-Mart located in Pisgah Forest.
The times of the sessions were selected based on the typical activity pattern at the location. That is, the sessions were held over periods during which it would be possible to speak with the highest number of people. Information posters were displayed at each location to provide a general overview of the CTSP study and planning process as well as general information about TRANSPORT. To attract attention and increase participation, participants were invited to enter a raffle for a $25 gift card.
A total of 90 people participated in the walk-in meetings by completing a brief
questionnaire that included five questions pertaining to the level of awareness of TRANSPORT services, unmet transportation needs in the County, and improvement suggestions. A copy of the survey is included in Appendix A. The major finding from the questionnaire was that almost half (49%) of the participants are unaware of TRANSPORT services; approximately one-third of the participants know of the service only through seeing the vehicles operating in the

System Existing Conditions
Transylvania County Community Transportation Service Plan Page 18
community. The most frequently cited improvement suggestions included a Brevard/Pisgah Forest Circulator and more public information and marketing. TRANSPORT Rider Surveys
On board rider surveys were conducted on TRANSPORT vehicles in December 2009. The vehicle operators offered a survey card and pencil to any passenger willing to take the survey; the riders could either complete the survey during their trip or complete the survey after leaving the vehicle and return it the next time they rode TRANSPORT. The survey was comprised of 16 questions pertaining to riding habits, service ratings, rider demographics, and improvement suggestions. Limited writing was required to answer the questions. A copy of the survey card is included in Appendix B.
Overall, 57 surveys were completed and returned. Major highlights from the surveys included:
• Three-quarters ride TRANSPORT five days a week;
• Close to half (40%) of the riders have been using TRANSPORT for less than two years;
• All service attributes were rated very favorably, with almost unanimous (98%) satisfaction in terms of the services provided;
• Most respondents could be considered transit dependent in that only nine percent could have made their trip without TRANSPORT services; and
• There were few improvement suggestions – the suggestions that were provided mainly concerned expansion of service.
Transylvania County Stakeholder Interviews
The consultant team conducted a series of telephone interviews with individuals representing various public and private organizations with an interest in public transportation. The interviews were designed to obtain input regarding TRANSPORT services, unmet transportation needs, and improvement suggestions.
A total of six individuals/agencies participated in the telephone interviews. Overall, each interviewee participated in the Coordinated Public Transportation & Human Services Transportation Plan prepared by the Land-of-Sky RPO in March 2009, and thus, were familiar with the priorities that were developed as part of the planning effort. When read the list of the priorities (listed in the following section) – the respondents basically agreed with the list. The areas that were met with some skepticism included increasing the use of private operators and operating evening service. One respondent indicated that with only one private operator in the County (i.e., City Cab), TRANSPORT has little in the way of bargaining power or controlling costs increases; another respondent indicated that demand is not high enough to warrant evening service.

System Existing Conditions
Transylvania County Community Transportation Service Plan Page 19
In terms of unmet transportation needs and improvements, comments included:
• Provide more general public service, especially during the midday period – Apple Country Transit in Henderson County was cited as an example;
• operate additional vehicles to provide passengers greater flexibility when scheduling service – TRANSPORT provides certain trips during certain times of the day due to limited resources;
• operate additional vehicles to reduce overcrowding and trip denials; and
• TRANSPORT needs to find a way to provide service to residents living throughout the entire County and not just serve the residents living in Brevard and Rosman.
The respondents were very satisfied with TRANSPORT service, with respondents indicating that the system is responsive, well organized, and provides excellent customer service. The respondents indicated that TRANSPORT does an adequate job marketing the service but could do better, with more than one respondent indicating that the general public has a vague understanding of the types of services TRANSPORT provides; however, one respondent stated that because TRANSPORT’s scope of services is limited, there is not much information to market to the public. TAB Interview
The consultant team also met with the local TAB to discuss unmet needs and strategies to address them. The TAB indicated that they agreed with the list of unmet needs and priority actions identified in the local Coordinated Plan (described below).
In addition, the TAB stressed the need for:
• More availability of Spanish speaking customer service options;
• More general purpose trips for things such as shopping from outlying areas of county; and
• More availability of wheelchair lift equipped vehicles in the outlying areas of the county.
Local Coordinated Plan
In March 2009, the Land-of-Sky RPO completed a Coordinated Public Transportation and Human Services Transportation Plan for the regional planning area which includes Buncombe, Haywood, Madison, and Transylvania Counties. This included an outreach and stakeholder involvement process to identify unmet needs in the region and to identify priority actions needed to address those needs. The priorities identified included:

System Existing Conditions
Transylvania County Community Transportation Service Plan Page 20
• Infrastructure Issues – more lift-equipped vans; park and ride facilities; feeder routes to connect rural areas to Asheville area; and pedestrian amenities around bus stops.
• Information and Communication Issues – mobility coordination; increased marketing; GIS/GPS location software; and coordination between counties.
• Route and Response Issues – extended hours of service; extended workforce transportation; door-to-door service; more flexible service to serve more social and discretionary trips; more service to industrial parks; and more inter-county trips particularly employment and health care related trips into Asheville.
• Other Issues – cost of service; extend service to special needs populations; and financial and organizational support for volunteers providing transportation to transit dependent populations.
The prioritized needs for Transylvania County included:
• More flexible senior transportation (social/recreational); • More vehicles for increased service options; • Subsidized Vouchers for disabled workers (supplement social security); • Increased Private Provider Service; • Psychiatric Patient transportation to the "Clubhouse"; • Young workers’ transportation; • Door through door service; • After hours service; • Support neighborhood transport; • Service to Connestee/Cedar Mountain; and • Inter-County trips to Fletcher/other employment locations (possibly including park &
ride locations).
The feasibility of these service issues were further examined as part of the service planning process for this study effort. SUMMARY
This chapter provided an overview of the current community transportation services available in Transylvania County along with a description of how services are structured organizationally. In addition, the productivity and effectiveness of the current services was described. This analysis built upon the extensive work already conducted by ITRE in terms of operational and vehicle utilization analysis. Lastly, this chapter described the findings and priorities identified in two relevant planning documents: the Performance Plan assembled by ITRE; and the local Coordinated Public Transportation and Human Services Transportation Plan assembled by the Land-of-Sky RPO. All of the information presented was instrumental in guiding the development of service improvement proposals throughout the remainder of the CTSP process.

Service Area Characteristics
Transylvania County Community Transportation Service Plan Page 21
SERVICE AREA CHARACTERISTICS
PURPOSE
This chapter presents a description of the transportation setting within Transylvania County. It relies on information from a variety of sources, much of which is the most recent U.S. Census. It includes information on population, employment activity, travel patterns, and important destinations that generally attract transit trips. Of particular concern is ascertaining the location and concentrations of population groups and households – senior citizens (60+), persons with a sensory, physical, or mental disability, persons living below the poverty line, and households without access to an automobile – which may have difficulty accessing employment, medical appointments, shopping and other activities without adequate transit service. Although demographic analysis cannot determine the exact need for transit service, it provides important evidence for locations that could support new or more extensive transit service.
Most of the data presented in this report have been analyzed using census block groups, which is the smallest geographical unit for analyzing demographic data; one limitation of using census block group data for this report is that population data at this level have not been updated since the 2000 Census. However, more recent population data from the 2005-2007 American Community Survey (ACS) were available at the county level and were used to compare the changes that have occurred within the target population and household groups since the 2000 U.S. Census.
In addition, general population estimates of Transylvania County for the year 2008 and beyond was available from the North Carolina Office of State Planning.
Information utilized for this analysis was drawn from a variety of sources, including the 1990 and 2000 U.S. Census, the 2005-2007 American Community Survey, the North Carolina Center for Geographic Information and Analysis, the North Carolina Office of State Planning, and the Transylvania County Planning Department. TRANSPORTATION SETTING
Transylvania County is located in the southwestern part of North Carolina and is bordered by Buncombe County to the north, Henderson County to the east, Haywood and Jackson Counties to the west, and Pickens, Oconee and Greenville Counties in South Carolina to the south. The County is largely rural in character and is defined by a mountainous topography, which has a strong influence on the location and density of development. Further, almost half of the county’s land area is government-controlled, with most of this land located within the Pisgah National Forest, which covers the northern portion of the County. The base map of Transylvania County is presented in Figure 5.

Service Area Characteristics
Transylvania County Community Transportation Service Plan Page 22
There are two municipalities in Transylvania County – the City of Brevard, which is the county seat and primary population and economic center in the county and the Town of Rosman, which is much smaller and located approximately ten miles southwest of Brevard. The County is also comprised of eight townships, which are not municipal areas and are mainly used for census purposes.
Important corridors in Transylvania County include U.S. 64, U.S. 178, U.S. 276, NC 215,
NC 280, and NC 281.
Public transportation in Transylvania County is provided by TRANSPORT (Transylvania People Oriented Rural Transportation), which is operated by the county’s transportation department and is primarily designed for transit dependent population groups, such as senior citizens, persons with a disability, pre-school age children, and clients under the auspices of various social service agencies. TRANSPORT is available countywide and is operated on weekdays from 6:00 AM to 6:00 PM.
Figure 5 – Transylvania County
Service Area Characteristics
Transylvania County Community Transportation Service Plan Page 23
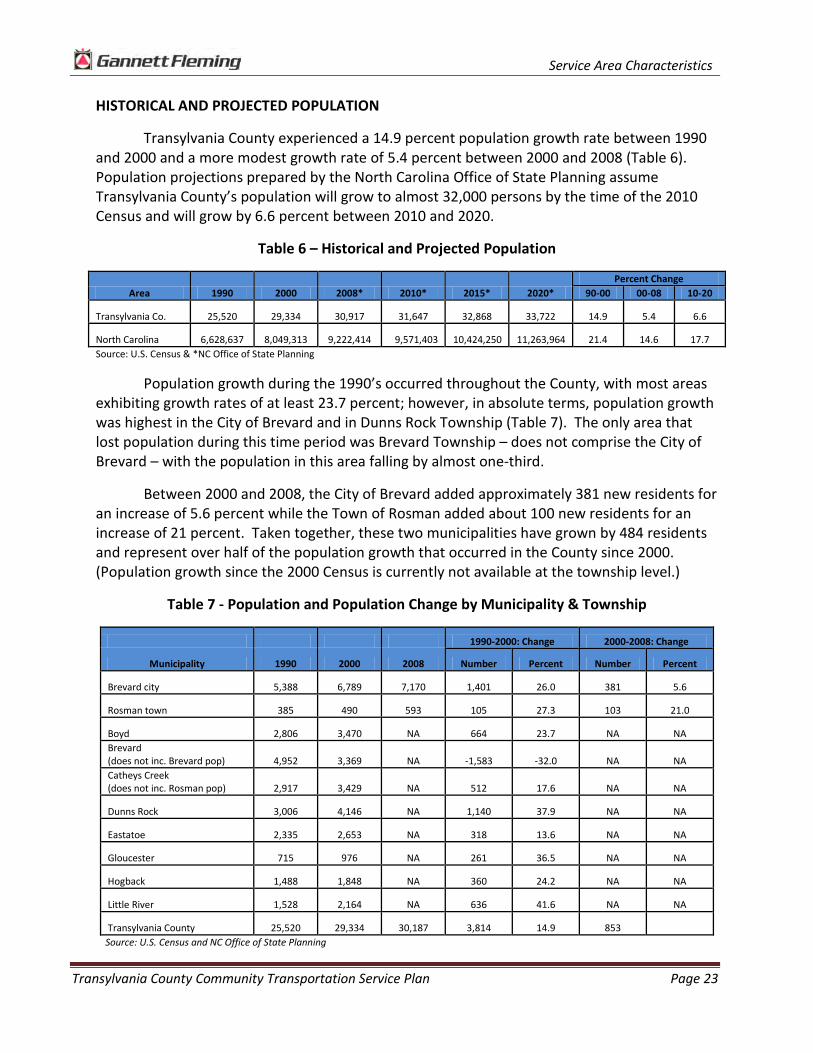
HISTORICAL AND PROJECTED POPULATION
Transylvania County experienced a 14.9 percent population growth rate between 1990 and 2000 and a more modest growth rate of 5.4 percent between 2000 and 2008 (Table 6). Population projections prepared by the North Carolina Office of State Planning assume Transylvania County’s population will grow to almost 32,000 persons by the time of the 2010 Census and will grow by 6.6 percent between 2010 and 2020.
Table 6 – Historical and Projected Population
Area 1990 2000 2008* 2010* 2015* 2020* Percent Change
90-00 00-08 10-20
Transylvania Co. 25,520 29,334 30,917 31,647 32,868 33,722 14.9 5.4 6.6
North Carolina 6,628,637 8,049,313 9,222,414 9,571,403 10,424,250 11,263,964 21.4 14.6 17.7 Source: U.S. Census & *NC Office of State Planning
Population growth during the 1990’s occurred throughout the County, with most areas exhibiting growth rates of at least 23.7 percent; however, in absolute terms, population growth was highest in the City of Brevard and in Dunns Rock Township (Table 7). The only area that lost population during this time period was Brevard Township – does not comprise the City of Brevard – with the population in this area falling by almost one-third.
Between 2000 and 2008, the City of Brevard added approximately 381 new residents for an increase of 5.6 percent while the Town of Rosman added about 100 new residents for an increase of 21 percent. Taken together, these two municipalities have grown by 484 residents and represent over half of the population growth that occurred in the County since 2000. (Population growth since the 2000 Census is currently not available at the township level.)
Table 7 - Population and Population Change by Municipality & Township
1990-2000: Change 2000-2008: Change
Municipality 1990 2000 2008 Number Percent Number Percent
Brevard city 5,388 6,789 7,170 1,401 26.0 381 5.6
Rosman town 385 490 593 105 27.3 103 21.0
Boyd 2,806 3,470 NA 664 23.7 NA NA Brevard (does not inc. Brevard pop) 4,952 3,369 NA
-1,583 -32.0
NA NA
Catheys Creek (does not inc. Rosman pop) 2,917 3,429 NA
512 17.6
NA NA
Dunns Rock 3,006 4,146 NA 1,140 37.9 NA NA
Eastatoe 2,335 2,653 NA 318 13.6 NA NA
Gloucester 715 976 NA 261 36.5 NA NA
Hogback 1,488 1,848 NA 360 24.2 NA NA
Little River 1,528 2,164 NA 636 41.6 NA NA
Transylvania County 25,520 29,334 30,187 3,814 14.9 853 Source: U.S. Census and NC Office of State Planning
Service Area Characteristics
Transylvania County Community Transportation Service Plan Page 24
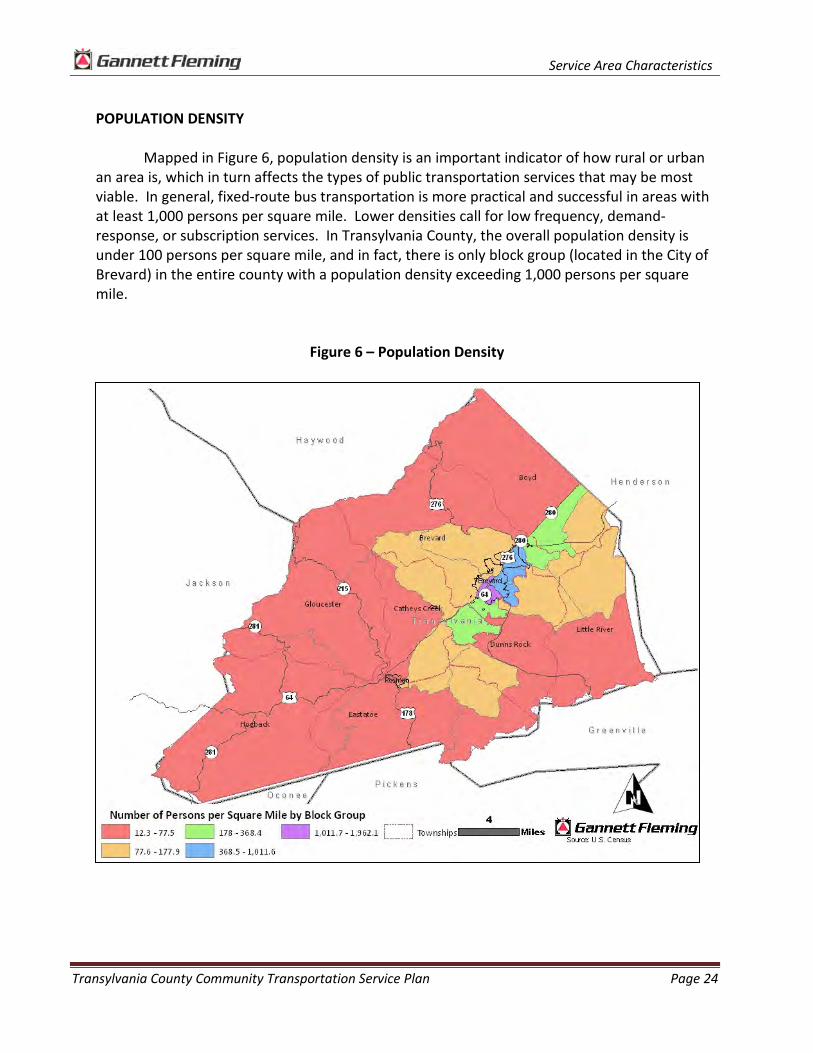
POPULATION DENSITY
Mapped in Figure 6, population density is an important indicator of how rural or urban an area is, which in turn affects the types of public transportation services that may be most viable. In general, fixed-route bus transportation is more practical and successful in areas with at least 1,000 persons per square mile. Lower densities call for low frequency, demand-response, or subscription services. In Transylvania County, the overall population density is under 100 persons per square mile, and in fact, there is only block group (located in the City of Brevard) in the entire county with a population density exceeding 1,000 persons per square mile.
Figure 6 – Population Density

Service Area Characteristics
Transylvania County Community Transportation Service Plan Page 25
TARGET POPULATION AND HOUSEHOLD GROUPS
To plan effectively for a public and human service transportation network, it is important to identify key target population groups that largely comprise the customer base for community transportation services. The population groups analyzed in this report are those groups that may have greater transportation needs compared to the general population.
Transportation needs are defined in part by identifying the relative size and location of the population groups and households in the County most likely to be dependent on some form of public transportation service. Once the locality of populations and households with transportation needs is determined and analyzed, it is possible to evaluate the extent to which current transit services are meeting the needs of the community.
• Senior Citizens (60+) – Older adults tend to be frequent users of community transportation services because they are unable or unwilling to drive and because transportation services oriented to seniors exist.
• Persons with Disabilities – The Americans with Disabilities Act (ADA) 49 CFR 37.3
protects individuals from transportation discrimination who have either a physical, mental, or sensory disability. This is a more specific definition of disability status compared to the broader definition used in the 2000 U.S. Census long form, which identified six disability categories – physical sensory, mental, going outside of the home, self-care and employment. This inclusive definition resulted in a larger number of people identifying themselves as having a mobility limitation than as having a disability under the Americans with Disabilities Act.
The U.S. Census Bureau revised the disability question beginning in the 2008 ACS, with the question separated into six categories – hearing, vision, cognitive, ambulatory, self-care, and independent living; having an employment disability was eliminated as a possible response.
For the purpose of this study, the disabled population refers to people with either a hearing (sensory), vision (sensory), cognitive (mental), or ambulatory (physical) disability, and did not include the population indicating a self-care or independent living disability.
• Persons Living Below the Poverty Line – Another important indicator of the need for and propensity to use community transportation services among an area population is the number of persons living below the poverty level. This group tends to rely more heavily on public transportation because many are unable to afford an automobile, cannot afford a second automobile for their household, or choose not to use their limited income for an automobile.
• Households without Access to a Vehicle – The final target group used for this analysis is households who do not own or have access to a private automobile. This is

Service Area Characteristics
Transylvania County Community Transportation Service Plan Page 26
an important statistic because households without a vehicle are considered to be entirely dependent upon alternative transportation sources.
These target populations are consistent with the customer base for current and future services and programs funded by FTA sections 5310, 5311, 5316, and 5317.
It is important to remember that in many cases, individuals in the target population groups will have more than one of the transit-dependent characteristics listed above, and in fact, will often exhibit multiple characteristics.
The County’s aforementioned target population and household groups are graphically depicted in Figure 7 through Figure 14. Each variable is examined in terms of percent of total population and population density and is presented at the census block group level. Density provides a measure of the relative size of the population within each block group while the percentages can convey transit need among sparsely populated block groups with low relative density. Since land areas among the block groups vary, it is not particularly meaningful to compare the raw numbers of persons or carless housing units in each category.
Figure 15 combines the percent and density variables from each target group, as well
includes the total number to identify those areas in the County with the greatest need and potential demand for public and human service transportation.
In addition, the trend among each target group is compared using the 2000 U.S. Census and the 2005-2007 ACS; the 2005-2007 ACS is published for geographical areas with populations between 20,000 and 65,000 persons, and is based on the average characteristics over the three year period. This survey has a larger sample than one year estimates and is not as current. As a result, there is a larger margin of error associated with this three year average, so it is important to interpret comparisons with the 2000 Census data with some caution. Senior Citizens (60+)
According to the 2007 ACS, there are nearly 9,000 senior citizens living in Transylvania County. This comprises almost 30 percent of the total population and is well above the statewide average of 17.0 percent. Since the 2000 Census, the senior citizen population in the County has increased by almost ten percent, which is lower than the 16.7 percent increase incurred statewide.
Senior Citizens (60+)
2000 2007 Change: 2000-2007
Persons 60+ Number Percent Number Percent Number Percent Transylvania County 8,079 27.5 8,863 29.8 784 9.7 North Carolina 1,293,316 16.1 1,509,537 17.0 216,221 16.7
Source: 2000 U.S. Census and the 2005-2007 American Community Survey (ACS)

Service Area Characteristics
Transylvania County Community Transportation Service Plan Page 27
Figure 7 is a map of the senior citizen population as a percentage of the total population and Figure 8 is a map showing the density of the senior citizen population group. Overall, the senior citizen population is most prominent in certain block groups located in and around the City of Brevard, and in one block group located in the southern portion of the County within the boundaries of Dunns Rock and Eastatoe Townships. The highest densities of senior citizens are located in the City of Brevard, but even here, there are generally less than 1,000 seniors per square mile.
Figure 7 – Percent Senior Citizen Population (60+)

Service Area Characteristics
Transylvania County Community Transportation Service Plan Page 28
Figure 8 – Density of Senior Citizen Population (60+)
Persons with a Disability
According to the 2007 ACS, there are approximately 7,000 Transylvania County residents that have a physical, sensory, or mental disability. This comprises almost one-quarter of the total population and exceeds the statewide average of 16.8 percent. Since the 2000 Census, the number of County residents with a disability has grown by approximately one-fifth, which is in stark contrast to the 1.4 percent increase exhibited statewide.
Persons with a Disability
2000 2007 Change: 2000-2007
Persons with a Disability Number Percent Number Percent Number Percent Transylvania County 5,790 19.7 6,979 24.8 1,189 20.5 North Carolina 1,335,239 16.6 1,354,481 16.8 19,242 1.4
Source: 2000 U.S. Census and the 2005-2007 American Community Survey (ACS)

Service Area Characteristics
Transylvania County Community Transportation Service Plan Page 29
Figure 9 is a map of the disabled population as a percentage of the total population and Figure 10 is a map showing the density of the disabled population group. As shown, the census block groups with the highest percentages of disabled persons are found in the City of Brevard and in two block groups located in the western section of the County within the boundaries of Gloucester and Hogback Townships. The density of the disabled population generally follows the same pattern as the overall population density, with the highest concentrations of disabled persons located in the City of Brevard.
Figure 9 – Percent Disabled Population

Service Area Characteristics
Transylvania County Community Transportation Service Plan Page 30
Figure 10 – Density of Disabled Population
Persons Living Below the Poverty Line
According to the 2007 ACS, there are nearly 4,900 Transylvania County residents living at or below the poverty level. This comprises 16.5 percent of the total population and is comparable with the statewide average of 14.8 percent. However, since the 2000 Census, the poverty rate in the County has increased by over three-quarters, which is more than double the increase incurred statewide.
Persons Living At or Below the Poverty Level
2000 2007 Change: 2000-2007
Low Income Population Number Percent Number Percent Number Percent Transylvania County 2,708 9.5 4,873 16.5 2,165 79.9 North Carolina 958,667 12.3 1,273,645 14.8 314,978 32.9
Source: 2000 U.S. Census and the 2005-2007 American Community Survey (ACS)
Service Area Characteristics
Transylvania County Community Transportation Service Plan Page 31
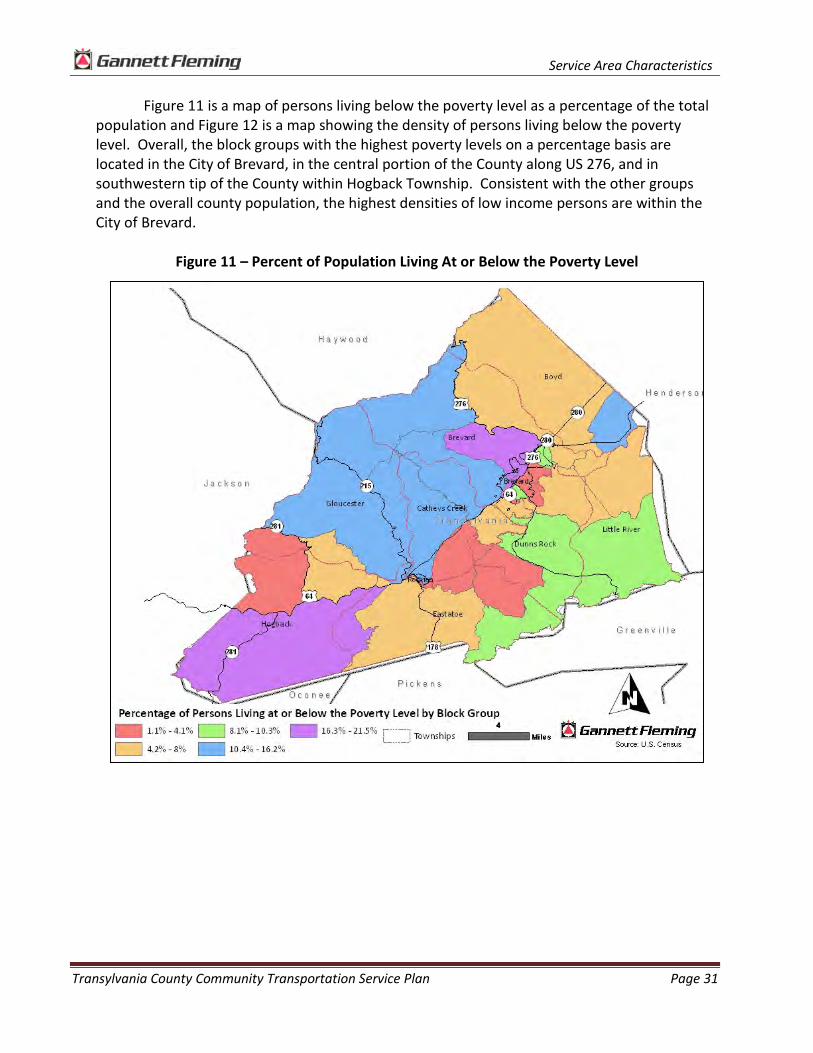
Figure 11 is a map of persons living below the poverty level as a percentage of the total population and Figure 12 is a map showing the density of persons living below the poverty level. Overall, the block groups with the highest poverty levels on a percentage basis are located in the City of Brevard, in the central portion of the County along US 276, and in southwestern tip of the County within Hogback Township. Consistent with the other groups and the overall county population, the highest densities of low income persons are within the City of Brevard.
Figure 11 – Percent of Population Living At or Below the Poverty Level

Service Area Characteristics
Transylvania County Community Transportation Service Plan Page 32
Figure 12 – Density of Population Living At or Below the Poverty Level
Carless Households According to the 2007 ACS, there are approximately 713 households in Transylvania
County without access to a vehicle. This comprises 5.7 percent of the population and is lower than the statewide average of 6.5 percent. Since the 2000 Census, the number of carless households in the County has dropped by approximately one percent, while throughout the State the number of carless households has declined by 4.5 percent.
The low number of carless households may appear at odds with the increasing numbers of population groups in the County that generally exhibit lower automobile ownership, such as senior citizens, persons with disabilities, and persons living at or below the poverty level. However, due to the rural character of the County, personal transportation is vital for mobility; additionally, personal transportation is vital for accessing jobs in regional employment centers located outside of the County, particularly in Henderson and Buncombe Counties.

Service Area Characteristics
Transylvania County Community Transportation Service Plan Page 33
Carless Households
2000 2007 Change: 2000-2007 Carless Households Number Percent Number Percent Number Percent
Transylvania County 721 5.9 713 5.7 -8 -1.1 North Carolina 235,339 7.5 224,721 6.5 -10,618 -4.5
Source: 2000 U.S. Census and the 2005-2007 American Community Survey (ACS)
Figure 13 is a map of carless households as a percentage of total households and Figure
14 is a map showing the density of carless households. The highest percentages of carless households are located in the City of Brevard and in portions of Brevard and Catheys Creek Townships, with the highest densities of carless households limited to the City of Brevard.
Figure 13 – Percent Carless Households

Service Area Characteristics
Transylvania County Community Transportation Service Plan Page 34
Figure 14 – Carless Household Density
MOBILITY NEEDS ASSESSMENT
This section presents an overview of the likelihood of transit use and a composite measure of mobility need. An assessment of mobility need was performed to identify those areas with the greatest need and potential demand for public and human service transportation. A dozen variables were used to rate each census block group in terms of transit potential. These variables include both rates and aggregate measures of mobility need. Rates, such as percentage of seniors in total population and density of senior citizens, are useful in understanding the composition of an area. Aggregate measures, such as total senior citizen population, indicate the potential for travel in general, and transit trip making in particular.
Twelve variables were used to analyze mobility need for the region and were derived
from the four target groups discussed in this section, including senior citizens (60 years old and above), persons with disabilities, persons at or below the poverty level, and zero car households. For each target group, three variables were utilized (number, percent, and density).

Service Area Characteristics
Transylvania County Community Transportation Service Plan Page 35
For all variables, higher values are indicative of greater need and likelihood of transit use. For example, a census block group with high senior citizen density or a high number of zero car households exhibits greater mobility need and propensity for transit use. In this analysis, a standardized score has been used to combine the different variables. With this approach for each variable, the census block group with the lowest value is assigned a score of zero while the census block group with the highest value is assigned a value of 100. The other areas are computed by interpolating between maximum and minimum values. These scores can then be added for 12 variables. Accordingly, the highest possible score would be 1,200.
Figure 15 presents the Mobility Needs Score by census block group for Transylvania County, and illustrates that the census block group attaining the highest score (800.3) is located in the City of Brevard. Many of the areas surrounding Brevard attain the next highest score (352.1 to 584.6). These results reflect the combined impact of the variables described above. The figure also shows that the vast majority of the County exhibits low scores and indicates a low level of mobility need.
The census data used to determine the mobility needs in the County are shown in Appendix C.
Figure 15 – Mobility Needs Score

Service Area Characteristics
Transylvania County Community Transportation Service Plan Page 36
EMPLOYMENT AND COMMUTING
The need for and the nature of the public transportation services in an area also depends on certain economic factors such as employment and the commuting patterns of employees in a given area. It is essential to understand these factors when planning for employment related transportation services.
Employment data and commuting patterns were obtained from the U.S. Census Bureau LED Origin-Destination Database for the years 2002 to 2007.
It is important to recognize that the commuting data included in this analysis do not reflect current economic conditions, which have worsened in Transylvania County and throughout the United States since 2007. According to the Bureau of Labor Statistics, the unemployment rate in Transylvania County has risen from 3.7 percent in 2007 to 8.9 percent as of April 2010; however, this is better than the statewide unemployment average, which went from 4.7 percent in 2007 to 10.8 percent as of April 2010.
Overall, the number of jobs in Transylvania County was somewhat static during the six
year period, with the number of jobs falling from 9,375 jobs in 2002 to 8,873 jobs in 2007, or a decrease of 5.4 percent.
Figure 16 shows the total number of jobs located in each census block group in Transylvania County and Figure 17 shows the density of the total number of jobs within each block group. Overall, employment is generally concentrated in the City of Brevard and the surrounding area, with two block groups in the southern and western portions of the County also exhibiting a fairly significant number of jobs. Employment density is highest in the City of Brevard and along the U.S. 64 corridor between Brevard and U.S. 276 in Pisgah Forest.
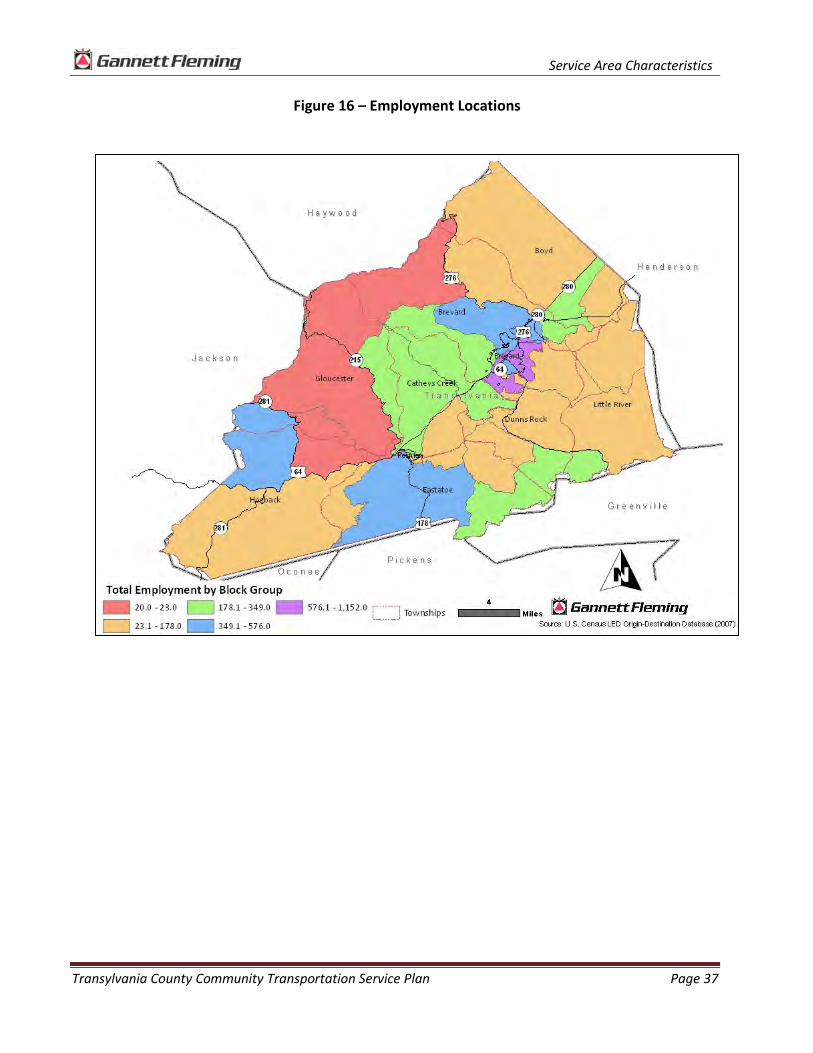
Service Area Characteristics
Transylvania County Community Transportation Service Plan Page 37
Figure 16 – Employment Locations

Service Area Characteristics
Transylvania County Community Transportation Service Plan Page 38
Figure 17 – Employment Density
Commuting Patterns
Table 8 describes county-to-county work flow from 2002 and 2007 for the Transylvania
County resident labor force, as well as shows the top ten places where Transylvania County residents work. Table 9 provides similar information for people who work in Transylvania County.
Just over half of the workers who reside in Transylvania County are also employed within the county (53.1%), with Brevard Township accounting for two-thirds of the intra-county commutes, followed Eastatoe Township and Catheys Creek Township. The top five out-of-county work place destinations for workers living in Transylvania County include Henderson, Buncombe, Jackson, Mecklenburg, and Haywood Counties. Approximately two-thirds of the trips into Henderson and Buncombe Counties are destined for two locations – Hendersonville Township (Henderson County) and the City of Asheville (Buncombe County); these municipalities are two primary employment and commercial centers in the region.

Service Area Characteristics
Transylvania County Community Transportation Service Plan Page 39
Between 2002 and 2007, the Transylvania County labor force grew by 2.6 percent and became increasingly disbursed throughout the region, with significant growth rates in the number of county residents commuting into Forsyth (+304.3%), Jackson (+76.3%), and Mecklenburg Counties (+54.9%); in the aggregate, Buncombe County attracted the highest number of County workers over the six year period (+262). At the same time, intra-county commuting declined by 14.5 percent in Transylvania County, with Henderson County also attracting fewer county residents during the six year period.
Table 8– Work Trips of Transylvania County Residents (2002 to 2007)
Work Place
2002 2007 Percent Change Number Percent Number Percent
County Transylvania County 6,410 63.7 5,481 53.1 -14.5 Henderson County 1,141 11.3 1,081 10.5 -5.3 Buncombe County 751 7.5 1,013 9.8 34.9 Jackson County 236 2.3 416 4.0 76.3 Mecklenburg County 257 2.6 398 3.9 54.9 Haywood County 116 1.2 140 1.4 20.7 Greenville County, SC 109 1.1 133 1.3 22.0 Guilford County 75 0.7 114 1.1 52.0 Wake County 94 0.9 103 1.0 9.6 Forsyth County 23 0.2 93 0.9 304.3 All Other Locations 858 8.5 1,357 13.1 58.2
Total 10,070 100.0 10,329 100.0 2.6 Municipality
Brevard township 4,133 41.0 3,619 35.0 -12.4 Hendersonville township 710 7.1 669 6.5 -5.8 Asheville 449 4.5 616 6.0 37.2 Eastatoe township 361 3.6 590 5.7 63.4 Catheys Creek township 430 4.3 369 3.6 -14.2 Cashiers township 174 1.7 333 3.2 91.4 Township 1, Charlotte 208 2.1 322 3.1 54.8 Hogback township 317 3.1 321 3.1 1.3 Dunns Rock township 282 2.8 223 2.2 -20.9 Boyd township 208 2.1 185 1.8 -11.1 All Other Locations 2,798 27.8 3,082 29.8 10.2
Total 10,070 100.0 10,329 100.0 2.6 Source: U.S. Census LED Origin-Destination Database
In 2007, nearly two-thirds of the jobs in Transylvania County were held by county residents, of which, approximately 41 percent live in Brevard Township with another quarter of the county work force living in Catheys Creek and Dunns Rock Townships. Of the work trips originating in other counties and destined for Transylvania County, most of the trips came from Henderson County, followed by Buncombe, Haywood, Mecklenburg, and Jackson Counties.

Service Area Characteristics
Transylvania County Community Transportation Service Plan Page 40
Between 2002 and 2007, the number of jobs in Transylvania County declined by approximately five percent. During the six year period, fewer workers lived in the county, and although the number of work trips originating in certain counties and destined for Transylvania County exhibited high growth rates, the absolute number of these trips was modest; In addition, the number of work trips destined for Transylvania County from Buncombe and Mecklenburg Counties dropped by 3.4 percent and 52.6 percent, respectively, during the six year period.
Table 9 – Work Trips of Transylvania County Workers (2002 to 2007)
Residence
2002 2007 Percent Change Number Percent Number Percent
County Transylvania County 6,410 68.4 5,481 61.8 -14.5 Henderson County 1,086 11.6 1,181 13.3 8.7 Buncombe County 567 6.0 548 6.2 -3.4 Haywood County 108 1.2 224 2.5 107.4 Mecklenburg County 302 3.2 143 1.6 -52.6 Jackson County 67 0.7 100 1.1 49.3 Greenville County, SC 75 0.8 100 1.1 33.3 Macon County 62 0.7 83 0.9 33.9 Pickens County, SC 44 0.5 74 0.8 68.2 Cherokee County 32 0.3 67 0.8 109.4 All Other Locations 622 6.6 872 9.8 40.2 Total 9,375 100 8,873 100 -5.4
Municipality Brevard township 2,781 29.7 2,233 25.2 -19.7 Catheys Creek township 764 8.1 713 8.0 -6.7 Dunns Rock township 832 8.9 702 7.9 -15.6 Boyd township 678 7.2 551 6.2 -18.7 Hendersonville township (Henderson Co.) 471 5.0 460 5.2 -2.3 Eastatoe township 507 5.4 407 4.6 -19.7 Little River township 384 4.1 380 4.3 -1.0 Mills River township (Henderson Co.) 331 3.5 344 3.9 3.9 Hogback township 247 2.6 324 3.7 31.2 Asheville city (Buncombe, Co.) 236 2.5 193 2.2 -18.2 All Other Locations 2,144 22.9 2,566 28.9 19.7 Total 9,375 100 8,873 100 -5.4
Source: U.S. Census LED Origin-Destination Database
Overall, there is considerable cross-commuting occurring between Transylvania County and the surrounding region; however, the trend during the 2002 to 2007 period indicates that jobs are migrating out of the county, along with county residents who are increasingly working throughout the region and in some cases, as far as Mecklenburg County.

Service Area Characteristics
Transylvania County Community Transportation Service Plan Page 41
TRANSYLVANIA COUNTY ACTIVITY CENTERS AND KEY PUBLIC TRANSIT DESTINATIONS
This section provides an overview of activity centers and major destinations, or trip generators, in Transylvania County. These destinations include hospitals, senior citizen facilities (nursing homes, adult day care centers, and retirement communities), human service agencies, post-secondary schools, large retail centers, and major employers.
Figure 18 shows the location and distribution of these activity centers and key destinations. As is evident with population patterns, virtually all of the major trip generators are located in Brevard and along the U.S. 64 corridor between Brevard and U.S. 276 in Pisgah Forest.
According to the Employment Security Commission of North Carolina, there are eight employers in the County that employ at least 100 employees at a single location, including:
• The Transylvania Community Hospital, Inc. • Wal-Mart • Brevard College Corp • Ivy Hill Health & Retirement • MB Industries Inc. • TVS, Inc. • Lowes Home Centers Inc.
With the exception of MB Industries Inc., which is located in Rosman, every other major employer is located in Brevard or within the immediate vicinity of the city.
In many cases, a major employer is depicted on the map as a major activity center, such as the Transylvania Community Hospital inc. (hospital), Wal-Mart (large retail center), Brevard College (post-secondary school), and Ivy Hill Health & Retirement (senior citizen facility).
These destinations are not presented as an exhaustive list of all such facilities in Transylvania County. However, comparing these locations to the areas exhibiting high transit dependent characteristics gives a sense of the likely travel patterns and destinations in Transylvania County for persons utilizing public transportation to meet their mobility needs.

Service Area Characteristics
Transylvania County Community Transportation Service Plan Page 42
Figure 18 – Activity Centers and Key Public Transit Destinations
REGIONAL ACTIVITY CENTERS
For reference purposes, Figure 19 shows the location and distribution of major regional activity centers located in areas where inter-county coordination would most likely occur between TRANSPORT and regional transportation providers. The destinations include hospitals, shopping centers, industrial parks, and post-secondary schools; these activity centers should not be seen as a complete list of all such facilities in these areas.
The largest concentration of activity centers are located in and around the cities of Asheville and Hendersonville, which are the two primary out-of-county destinations served by TRANSPORT, either directly with in-house vehicles or via third private operators – City Cab or Arc Angel; these areas also comprise a significant number of Transylvania County resident work trips.
The figure also shows that many of the activity centers are located along major corridors, such as Interstate 26, which enhances their accessibility and ease in which they could be served by TRANSPORT.

Service Area Characteristics
Transylvania County Community Transportation Service Plan Page 43
Figure 19 – Regional Activity Centers
SUMMARY OF FINDINGS
The City of Brevard is the primary population and economic center in Transylvania County and contains the highest concentration of transit dependent population groups and households without access to automobiles. These attributes indicate that the City of Brevard exhibits the highest need for transit service in the County, and is most likely the only area that could feasibly support some type of flexible fixed route bus service. In general, the County is best suited to the type of demand-responsive service currently provided by TRANSPORT.
Transylvania County has grown during each of the last two Census periods and is expected to show modest growth when the next Census is completed in 2010. Population growth has occurred throughout the County, with the most significant growth in absolute terms confined to the City of Brevard and the adjacent township of Dunns Rock. The City of Brevard and the Town of Rosman accounted for almost half of the population growth in the County between 2000 and 2008.

Service Area Characteristics
Transylvania County Community Transportation Service Plan Page 44
Between 2000 and 2007, a higher share of the County population is at least 60 years of age, lives below the poverty level, and is impaired by a disability, with all three categories exceeding the statewide average. Conversely, the percentage of carless households in the County has dropped below the state average and exhibited a slight decline during the seven year period.
A six year sample of travel trends between 2002 and 2007 indicated the County lost jobs during this period, with an increasing number of county residents commuting to destinations throughout the region for employment.

Management and Service Alternatives
Transylvania County Community Transportation Service Plan Page 45
MANAGEMENT AND SERVICE ALTERNATIVES INTRODUCTION
This chapter of the CTSP for the TRANSPORT system presents a number of financial, management, operational, and service alternatives that are a reflection of the analysis of the current system, public participation, community characteristics, site visits, and discussions with TRANSPORT staff. All of the alternatives presented in this document have been reviewed and analyzed by TRANSPORT staff, NCDOT, and the Transportation Advisory Board to determine which should be selected for implementation. Advantages and possible disadvantages to each alternative are also listed.
FINANCIAL ALTERNATIVES
The financial alternatives include methods to improve or expand upon revenue and ways to improve on the efficiency and effectiveness of revenue administration. Due to funding constraints at the local and statewide levels, it is imperative that TRANSPORT develop strategies to maximize revenue, control costs, and develop new revenue markets. The financial proposals presented below include the development of a fully allocated cost model to provide TRANSPORT the means to allocate resources more efficiently and fairly, an examination of billing strategies, and ways in which to generate additional revenue.
Develop a Fully Allocated Cost Model
Typical practice for a local demand responsive system is for the system to track passenger trips by specific funding categories (i.e., the specific human service program or non-profit program under which the passenger is traveling). Then, based on established rates, the agency that sponsors that particular program is invoiced for that particular trip. In the case of TRANSPORT, all non-Medicaid trips are considered general public trips.
At the beginning of each fiscal year, Transylvania County allots a particular budget to TRANSPORT. TRANSPORT then reports the number of trips provided to NCDOT for reimbursement through EDTAP or ROAP, then TRANSPORT draws down the applicable local match to those funds through the County account. Since the amount of funds available for the local match is based on the County’s general fund availability, there is no ability to expand mobility options through particular programs or provide service for additional programs unless the County increases the budget for TRANSPORT.
Further, because TRANSPORT does not know the actual cost of providing each unit of service (i.e., passenger trips), the system does not have a complete financial framework in which to use its limited resources more efficiently and effectively. As a result, TRANSPORT is limited to operating just the least costly trip, which means that someone living in the outlying areas of the County (wheelchair or not) and is not traveling under Medicaid cannot access

Management and Service Alternatives
Transylvania County Community Transportation Service Plan Page 46
service because it is not cost effective for TRANSPORT to send a vehicle out to pick up that one person. If there was a specific program such as a DSS program that could be billed based on an established rate, or a program to fund specific trips such using supplemental RGP and/or EDTAP funds, TRANSPORT could increase access to service.
Under this recommendation, TRANSPORT should begin tracking trips by funding program and by category and apply a cost allocation model so costs can be distributed equally among funding sources. Understanding the true costs and level of service provided to the various ridership group – human service and Medicaid clients and the general public – will assist TRANSPORT and the County in estimating future costs and transportation needs.
A cost allocation model is the process of allocating each line item expenses to one of several factors (vehicle miles, vehicle hours, and fixed costs) in order to determine the total cost associated with operating a given service. If TRANSPORT is to pursue additional funding sources and expand the availability of public transportation in the County, the system will require a more complete and accurate assessment of financial data in order to:
• Ensure that the total costs of transportation services are recovered and that they are recovered in an equitable manner (i.e. each funding program pays its fair share), and;
• Report to funding sources and taxpayers how money was spent, what revenues were realized, and the financial status of the system.
The section presents a three-variable cost model based on TRANSPORT’s Fiscal Year 2009 OP STATS Report. The calculation excluded the vehicle miles and vehicle hours that were operated by other providers during the year; additionally, the transit system’s administrative costs that were associated with scheduling and monitoring in-house passenger trips was separated from the administrative costs associate with scheduling and monitoring passenger trips provided by City Cab, Arc Angel and volunteer drivers.
There are various cost computations and variations in developing a cost model; as a result, TRANSPORT is strongly encouraged to consult with the NCDOT PTD to determine the most appropriate cost allocation model for the system. Moreover, NCDOT PTD should consult with ITRE to develop a model and train TRANSPORT staff in its use; without technical assistance and training TRANSPORT will likely not be able to implement this recommendation. Finally, development of the fully allocated cost model is critical since the model output data will be needed to implement some of the other recommendations in this document.
In FY 2009, approximately 44 percent of all expenditures can be allocated to vehicle hours ($152,365), while approximately 13 percent ($43,941) can be allocated to vehicle miles. Operators’ wages and the costs of their fringe benefits are allocated to vehicle hours. Other costs, such as fuel and vehicle maintenance, are a direct function of the vehicle miles operated and are categorized as such. In addition, insurance costs are a function of accident exposure in terms of miles of service. The costs associated with hours and miles represent the variable operating expenses.

Management and Service Alternatives
Transylvania County Community Transportation Service Plan Page 47
TRANSPORT’s total administrative costs (i.e., fixed operating costs) in FY 2009 were $163,557. However, since the transit system’s administrative expenses are associated with scheduling and monitoring directly operated trips, as well as trips operated by City Cab and trips operated by other sources (i.e., Arc Angel and volunteers), the system’s administrative costs were separated according to the percentage of trips provided by each of the three providers. Based on this calculation, 80 percent ($130,846) of the administrative costs incurred by TRANSPORT in Fiscal Year 2009 was allocated to in-house operations, with nine percent ($14,720) allocated to scheduling and monitoring trips provided by City Cab and 11 percent ($17,991) of the administrative costs allocated to trips provided by Arc Angel and volunteers.
Overall, TRANSPORT’s administrative overhead factor is estimated at 66.6 percent, which is based on dividing the administrative costs ($130,846) by the operating costs ($196,306) associated with directly operated service. In the analysis, we have computed the fixed costs as a percentage of the variable operating expenses. In some cost models, the expenses are assigned to peak vehicles. Under these circumstances a fixed unit of cost is computed. For Transylvania County, a percentage approach has been suggested where the total operating cost is 1.666 times the variable (i.e., hours and miles) expenses. Alternatively, TRANSPORT could assign administrative costs, not as a percentage, bus on a cost per passenger basis (i.e., $130,846 divided by 35,067 trips, or $3.73 per trip).
The results of this allocation process for the TRANSPORT system are presented in Table 10.
Table 10 – Three Variable Cost Allocation Model
FY 2009
Vehicle Miles
Vehicle Hours
Fixed Costs
Administrative Salaries & Fringes $124,277 $124,277 Advertising & Promotion $1,693 $1,693 Employee Development $615 $615 Indirect Services $26,372 $26,372 Other $10,600 $10,780 Total Administrative Costs $163,557 $163,557 In-House $130,846 $130,846 City Cab $14,720 $14,720 Other $17,991 $17,991
Operating Drivers Wages & Salaries $136,306 $136,306 Other Staff Salaries & Fringes $16,059 $16,059 Fuel $24,733 $24,733 Maintenance $9,708 $9,708 Other $180 $180 Insurance $9,320 $9,320 Total Operating Cost $196,306 $43,941 $152,365 Total Allocated Costs $43,941 $152,365 $130,846 Operating Statistics 131,750 7,802 $196,306 Unit Cost $0.33 $19.53 66.6%

Management and Service Alternatives
Transylvania County Community Transportation Service Plan Page 48
Based on the allocation of these and all other costs, the cost allocation equation would be as follows:
Total Cost = 1.666 * [($0.33* Miles) + ($19.53 * Hours)]
For example, if operation of one of TRANSPORT’s van routes requires that the vehicle be operated 1,000 hours and 12,000 miles per year, the cost to TRANSPORT would be:
Total Cost = 1.666 * [($0.33* 12,000) + ($19.53 * 1,000)] or approximately $ 39,134
Any individual component of TRANSPORT service can now be priced using this cost allocation methodology, as long as the hours and miles associated with that service are known.
Advantages
• Enhances financial management by providing the ability to determine how much the transit service truly costs, and provides better tracking of how money is spent and revenue is realized.
• The NCDOT PTD requires all community transportation systems in the state to prepare
an annual analysis of their system’s fully allocated costs.
• With knowledge of costs, TRANSPORT can allocate resources more efficiently and fairly.
Disadvantages
• Increased staff time ensuring that operating and administrative costs are allocated correctly and consistently.
• TRANSPORT would have to dedicate more time to recordkeeping functions to ensure that all data is readily available for review by County officials and/or contracting agencies.
• Would likely require training to ensure model is calculated correctly; however, the NCDOT PTD requires systems to develop an annual cost model and would likely support training and technical assistance.
Develop Billing Rate System for New Services
In North Carolina and elsewhere, most transit systems operating subscription service utilize some form of billing rate to charge agencies or organizations for transporting their clients; this is the only way to capture the cost of service since the majority of agency clients cannot afford to pay a fare.
Though TRANSPORT and the County do not think this recommendation is feasible for changing the billing system for their existing services, the billing rates could be used for future markets or for changing the billing rates if new funding becomes available. Billing agencies for

Management and Service Alternatives
Transylvania County Community Transportation Service Plan Page 49
transporting their clients is considered a best practice in the transit industry and is performed throughout the State as a means of allocating transportation costs and benefits equally among the community and the various social service programs.
The section below describes how contract service could be implemented and administered if TRANSPORT and the County want to use billing rates for new markets.
The fully allocated cost that would be charged to an agency is a policy decision that should be made by the Board. For example, the Board may determine that non-profit social service agencies should share in the State transit subsidies and therefore should only be required to pay a percentage of the fully allocated cost. The Board might also establish the policy that all private for-profit agencies should not share in the subsidies and therefore would be required to pay 100 percent of the fully allocated cost. This decision should be made at the policy level and should be based on a well-thought out basis.
A contract rate policy should be developed and adopted by the Board, which clearly explains the factors that influence billing rates; having a policy will provide TRANSPORT with the necessary guidance and direction to negotiate contract rates without having to return to the Board for each routine contract.
The billing rate could be gradually “phased-in” over a period of time, with the contracts providing the details of the rate that will be initially charged, the difference between the rate and the actual cost, and the length of time over which the rate will be increased until the fully allocated amount is reached. The agencies should be made aware of the actual cost of the service during the “phase-in” period.
Agencies can be billed in several ways; the most common arrangements are listed below:
• Distance based billing rate – this arrangement represents the most efficient means of recovering the actual costs of the transportation system, as agencies pay for their transportation services based on the distance traveled by their clients. If this billing rate is chosen, TRANSPORT would need to determine whether to utilize a straight per mile billing rate versus a zone based system. A zone based system, would require the establishment of several different zones, with the agencies billed according to the number of zones their clients travel through. Since most of the activity in the County is concentrated in a relatively small area, TRANSPORT could implement a limited number of zones so as not to create a layer of complexity that is confusing and not necessary.
• Hourly based billing rate – this arrangement can be a good method of recovering the transportation costs, but it can be somewhat difficult to assess hourly charges to particular agencies when carrying passengers from multiple agencies. TRANSPORT would have to implement a cost sharing mechanism in order to assess the amount billed to particular agencies when their vehicles are serving multiple agencies.

Management and Service Alternatives
Transylvania County Community Transportation Service Plan Page 50
• Trip based billing rates – this arrangement is easy to calculate when billing particular agencies for the services rendered; however, billing agencies based upon the number of trips provided does not necessarily recover the actual costs incurred by TRANSPORT if trip lengths vary.
A crucial component of agency billing will be to develop program-specific data collection. This would include using the daily manifests to track ongoing operations data including vehicle hours, vehicle miles, and passenger trips. The data used to prepare monthly reports is generally gathered through complete and accurate driver manifests, which are compiled on a daily basis, and then summarized each month. This will require TRANSPORT to improve their scheduling procedures, as well as learn how to utilize the billing function feature included in the scheduling software used by the system. As a result, adequate training of designated staff will be key aspects of the successful implementation of this action. Advantages
• Revenue from human service agency contracts can be used as matching funds for the federal 5310, 5311, 5316, and 5317 programs.
• Would likely increase the availability of transportation service if more revenue is being generated, which is one of the major goals of the CTSP process.
• Agencies would schedule their client trips more efficiently, which in turn, may save the County money.
• The process is more equitable, as agencies pay for the service consumed.
Disadvantages
• Increases the level of oversight for all parties involved – TRANSPORT, the individual agencies, and the County.
• Agencies may be required to locate additional funds to meet additional transportation expenses that were not factored in under the present draw down funding mechanism.
• TRANSPORT will have a responsibility to control costs; as a result, the level of data collection and service monitoring would need to increase and be carefully reviewed.
• The additional responsibilities related to invoicing and service monitoring may require additional TRANSPORT resources (staff and vehicles).
• Would likely require more involvement and time from the Board and TAB.
• TRANSPORT staff would require training to utilize the scheduling software’s billing function. However, if staff is properly trained to make full use of software, previously unrealized efficiencies could be obtained.
Management and Service Alternatives
Transylvania County Community Transportation Service Plan Page 51
Use Cost Model to Determine Cost Effectiveness of Brokered Medicaid Trips
TRANSPORT brokers all Medicaid trips and some general public transportation trips to City Cab, a local private taxi operator based in the City of Brevard. TRANSPORT considers this arrangement to be more cost effective since most Medicaid trips are single user trips that are expensive for TRANSPORT to serve, particularly the Medicaid clients living in the outlying areas of the County. However, because TRANSPORT does not know the actual cost of providing service, the system is unable to determine if, in fact, City Cab is a more cost effective provider of Medicaid transportation. It is recommended that TRANSPORT utilize a fully allocated cost model using current costs to compare the difference in price between Medicaid trips provided in-house versus City Cab taxi service.
If TRANSPORT is more cost effective, the system should begin operating certain trips that can be accommodated by existing resources, such as trips that occur in the midday period.
It is recommended that TRANSPORT undergo a more thorough cost analysis using current operating costs and obtaining if possible, City Cab’s documented transportation costs. Since Medicaid trips are more individualized, TRANSPORT would have to schedule carefully so as to not negate the added ridership with inefficient vehicle movements. Advantages
• TRANSPORT could receive a new revenue source as well as increase productivity and cost efficiency measures.
• Adheres to the Medicaid objective of using the most cost efficient means of transportation.
Disadvantages
• May require more staff time to schedule and arrange trips.
• City Cab could react negatively if they perceive a loss of business.
• There may be political opposition if it is perceived that a public organization is benefiting financially at the expense of a local private business.
Pursue New Funding Sources through Contract Services
One of the objectives of this CTSP study is to develop new funding sources that do not require County matching funds. Once the cost model is in place, TRANSPORT can establish invoicing procedures and begin reaching out to non-profits, private nursing homes, and local institutions (Blue Ridge Community College) to offer transportation service. TRANSPORT should ask these agencies/organizations/institutions what changes might improve service that would make them/clients more likely to use TRANSPORT services. For example, the Community College may be interested in providing service to students from outlying areas. Some of these institutions, organizations, and agencies might have a need for employment

Management and Service Alternatives
Transylvania County Community Transportation Service Plan Page 52
service, which could be eligible for funding under the Federal Transit Administrations’ (FTA) Sections 5316 (JARC) and 5317 (New Freedom) programs. A sample contract is shown in Appendix D. Advantages
• If costs are spread across a greater number of agencies, TRANSPORT could potentially charge each participating agency a lower fee.
• Productivity could improve, particularly if agencies schedule service during the midday period when TRANSPORT exhibits excess capacity.
• Funds from contract services could be used as local match for federal Section 5310 (Elderly and Disabled), 5316 (JARC), and 5317 (New Freedom) programs.
Disadvantages
• May require more staff time and resources to schedule and arrange trips.
Pursue Additional Funding Sources
The availability of multiple funding sources helps to ensure financial stability and the provision of a consistent level of service; multiple revenue sources may also allow for the provision of additional or enhanced service. As the benefits of transit service extend over more than one segment of the community, dependence upon more than one revenue source helps to ensure that costs and benefits are equitably allocated.
The following provides potential federal and state funding sources for TRANSPORT’s existing services as well as potential additional services outlined in this plan. It should be noted that these are discretionary funds and will depend on the availability of funds and the approval from the state.
• Rural Operating Assistance Program (ROAP) – The North Carolina Department of Transportation, Public Transportation Division provides funding to each county under the Rural Operating Assistance Program Grant (ROAP). Funding is allocated into three categories: Elderly and Disabled Transportation Assistance Program (EDTAP), Work First/Employment Transportation, and Rural General Public (RGP). The State also allows systems to ask for supplemental funds from one of these programs to operate a specific program.
The Elderly and Disabled Transportation Assistance Program (EDTAP) – This program provides operating assistance funds for the transportation of elderly and disabled persons. This transportation assistance allows these individuals to reside for a longer period in their homes, thereby enhancing their quality of life. The funds are intended for those individuals who do not qualify for transportation assistance under a human service program and to provide

Management and Service Alternatives
Transylvania County Community Transportation Service Plan Page 53
transportation services for elderly and disabled individuals when other funding sources are not available. The State funds up to 100 percent of the cost of service.
The Employment Transportation Assistance Program (EMP) -- This program is
intended to assist transitional Work First participants after eligibility for cash assistance has concluded; participants in local Workforce Development Programs and/or the general public with employment-related transportation needs. Priority should be given to the employment transportation needs of individuals that are not eligible to receive benefits from the Temporary Assistance for Needy Families (TANF) program or to participants in Workforce Development Programs. The State funds up to 100 percent of the cost of service.
The Rural General Public Program (RGP) – This program provides operating
assistance funds to provide transportation services to individuals who are not human service agency clients. The State funds up to 90 percent of the cost of service.
• Elderly and Disabled Individuals Transportation Program (FTA SECTION 5310) – This program could assist TRANSPORT in providing more service to senior citizens and persons with disabilities by providing funding for capital projects – vehicles, radio and communication equipment, wheelchair lifts and restraints, computer hardware and software, and vehicle shelters; and operating expenses – driver salaries and fringes, vehicle insurance, volunteer reimbursements, vehicle supplies (fuel, maintenance expenses).
Eligible recipients include state and local governments, nonprofit organizations (including Indian tribes and groups) and public transit operators in non-urbanized areas. The local match required for operating funds is 50 percent from non-federal transportation funds. For capital projects the required local match is 20 percent from non-federal transportation funds.
• Job Access - Reverse Commute (JARC) (Section 5316) – The objectives of the JARC program are to improve access to transportation services to employment and employment-related activities for welfare recipients and eligible low-income individuals, and to transport residents of urbanized areas to suburban employment opportunities. Under this program, FTA provides financial assistance for transportation services planned, designed, and carried out to meet the transportation needs of welfare recipients and eligible low-income individuals, and of reverse commuters regardless of income. This program can assist in developing shuttle services, demand response service, night or weekend service, ridesharing and vanpool activities, and marketing expenses related to employment services.

Management and Service Alternatives
Transylvania County Community Transportation Service Plan Page 54
FTA requires a 50/50 match for all JARC funds. A cash commitment toward the local match is the primary option for accessing JARC funds, but in-kind match is allowable.
• New Freedom Program (FTA Section 5317) – This program funds new transportation services and public transportation alternatives beyond those required by ADA to assist persons with disabilities in both urban and rural areas. Eligible recipients include private non-profit organizations, state or local governments, and operators of public transportation services including private operators of public transportation services. New Freedom funds may be used to finance capital and operating expenses related to vehicle purchases, technology (radio communications, GIS), staff training, maintenance, and supporting accessible taxi, ride sharing and van pool programs. The federal share of eligible capital and planning costs may not exceed 80 percent of the net cost of the activity. The federal share of the eligible operating costs may not exceed 50 percent of the net operating costs of the activity. Recipients may use up to 10 percent of their apportionment to support program administrative costs including administration, planning, and technical assistance, which may be funded at 100 percent Federal share. The local share of eligible capital and planning costs shall be no less than 20 percent of the net cost of the activity, and the local share for eligible operating costs shall be no less than 50 percent of the net operating costs.
As with all FTA formula program grants administered by NCDOT, all of the local match must be provided from sources other than federal DOT funds. The NCDOT permits systems to use ROAP funds as matching for the 5310, 5316 and 5317. Other possible sources for a local match include local or State appropriations; other non-DOT federal funds; private donations; revenue from human services contracts and net income generated from advertising. Examples of types of programs that are potential sources of local match include: employment training, aging, community services, vocational rehabilitation services, and Temporary Assistance for Needy Families (TANF).
TRANSPORT should regularly check the Community Transportation Association of America (CTAA) website, which is a clearinghouse for available funding sources and program requirements.
TRANSPORT may require assistance and/or training from NCDOT PTD in terms of administration tasks, grant writing, and required reporting procedures associated with funding programs the system has never utilized. Other possible funding sources include raising general public fares and requesting towns such as the City of Brevard to help fund new transit services that primarily serve within the city limits (described later in this chapter).

Management and Service Alternatives
Transylvania County Community Transportation Service Plan Page 55
MANAGEMENT ALTERNATIVES
The management alternatives are those actions which can be undertaken to improve staff efficiency, maintain a high quality of service, and enhance the visibility of the system, with the ultimate objective being to improve the provision of transportation services. For the purposes of this study, data collection, service monitoring, brokerage operations, policies, and procedures, and marketing were examined.
Formalize Data Collection and Service Monitoring
The ITRE Performance Plan indicated that TRANSPORT does not have a formal process for reviewing operational and performance statistics on a monthly basis.
It is recommended that TRANSPORT adopt a data management program. The program should be designed to ensure that recordkeeping practices are standardized and that all required reports and applications are submitted in a timely manner. The program should establish procedures that allow TRANSPORT to prepare accurate, complete, and timely monthly service reports. These monthly reports can show the progress of the system, its trends, and overall ability to satisfy various riders. The data that should be included in a monthly report includes the following:
• Total trips, vehicle miles, vehicle hours, revenue miles, and revenue hours for the system;
• Number of trips, miles, and hours of service provided to each funding program (i.e., RGP, Medicaid, EDTAP), as well as revenue for each funding program;
• Key performance indicators including, passenger trips per vehicle service hour, passenger trips per vehicle revenue mile, passenger trips per vehicle mile, cost per vehicle hour, cost per vehicle mile, cost per passenger, safety incidents per 100,000 vehicle miles; and on-time performance; and
• Key service quality and reliability standards including passenger complaints per passengers carried, preventable accidents per vehicle miles operated, road calls per vehicle miles operated, cancelled trips and no-shows (demand response, subscription, and Medicaid), trip denials, and on-time performance.
When using performance measures as an analytical tool, it is important that TRANSPORT identify its own baseline and measure itself against this baseline; comparing itself to the peer group used in the ITRE Performance Plan can assist the system in establishing baselines, however it is important to recognize the differences in operating procedures and policies among these peer systems.
Data should be aggregated over the fiscal year, so that the final monthly report for a
fiscal year also gives a year-end summary perspective. Through this type of on-going reporting and analysis, TRANSPORT can be monitored much more effectively. Also, when problems with
Management and Service Alternatives
Transylvania County Community Transportation Service Plan Page 56
the service do occur, TRANSPORT will be able to identify issues more easily and address them in a timely manner.
The Monthly reports should be provided to the Board and TAB for review.
Sample monthly and annual performance reports are included in Appendix E.
Detailed reporting practices are necessary to ensure that will need to be formalized be needed if TRANSPORT would begin providing contract service.
ITRE has indicated to the project team that the scheduling software used by TRANSPORT (i.e., TrIP Maker) is capable of processing this data collection effort. If TRANSPORT requires assistance to implement this program, they should contact ITRE who provides free technical assistance and training.
Advantages
• Provides documentation of needs and justification of additional resources.
• NCDOT identified the improvement of efficiency and effectiveness as one of the major goals of the CTSP process.
• Can assist in identifying a problem before its impacts service; enables management to be proactive rather than reactive in solving problems.
• Federal funding programs require transit systems to monitor the performance of their systems as a condition and justification of receiving financial assistance.
Disadvantages
• Staff time associated with developing tracking mechanisms and conducting data collection efforts.
• Existing scheduling software is not equipped to prepare detailed operating reports.
Formalize Brokerage Operations, Policies and Procedures
There are presently issues of non-compliance with respect to TRANSPORT’s arrangement with City Cab to provide Medicaid and RGP transportation. At issue are the lack of a formalized contract and the allocation of State funds to the taxi company without the approval of the NCDOT PTD.
Under this recommendation, TRANSPORT should formalize its arrangement with the City Cab taxi company, as well as any other private operators that provide transportation service in the County. This is important not only to ensure compliance with state and federal requirements, but also to ensure that the providers are maintaining certain performance and

Management and Service Alternatives
Transylvania County Community Transportation Service Plan Page 57
safety standards. For example, Medicaid requires operators to conduct annual drug and alcohol testing and to regularly monitor the driving records of its operators.
The service agreement/contract should include terms and conditions related to
passenger safety, vehicle insurance, drug testing, maintenance, vehicle cleanliness, and performance standards (on-time performance, customer service, trip denials, passenger complaints, etc.).
The contract should also require the providers to collect operating statistics (vehicle miles, vehicle hours, mileage, operating costs, capital costs, trip time, origin and destination addresses, etc.) that would be submitted to TRANSPORT on a monthly basis; it is recommended that the private operator also include the actual, fully-allocated costs that were incurred to provide the service.
Contracts should include no guarantee of service levels and also include penalties and
incentives for performance, such as fines (for late or missed trips, poor interior cleanliness, inoperable safety features, etc) or incentives (bonuses for superior performance).
TRANSPORT should have access upon request to all operator records and should plan to spot-check records on a regular basis.
A sample contract between a taxi company and a transit provider is shown in the Appendix F.
Transylvania County should also formalize and officially adopt its “open market entry” policy, which places no limits in terms of the availability of private transportation operators to provide transportation service in the county. This is a favorable policy to have as it allows for competition and hence, the possibility of lower transportation costs. Although there is little likelihood of increased competition in the near future on account of the County’s population size, this is nonetheless a prudent policy and could prove advantageous at some time if additional private transportation providers want to compete for business.
Advantages
• Protects TRANSPORT from lawsuits that could occur from an accident or passenger dispute. The North Carolina Department of Health and Human Services (DHHS) requires drivers of public and private transportation services to participate in random drug and alcohol testing; the DHHS also requires transportation providers to conduct annual driver screening to look for traffic violations and other discretions, such as driving under the influence of alcohol or a controlled substance.
• Provides data that is useful in conducting cost and service analyses.
Disadvantages
• None.

Management and Service Alternatives
Transylvania County Community Transportation Service Plan Page 58
Review Scheduling and Tracking Procedures
The ITRE Performance Plan indicated a number of scheduling procedures that can negatively impact performance and efficiency, including:
• Subscriptions are being set up for more days than the client is going to ride resulting in a high number of cancellations. It is recommended that a trip only be recorded as a cancellation when the client cancels the trip.
• The Medicaid manifests are hand-written by TRANSPORT office staff and then faxed to City Cab. It is recommended that these trips be entered into the scheduling software like any other trip so that they can be easily reviewed at any time and be processed into monthly operating and performance reports as part of the data management program described previously.
• The order of trips on the manifests are often completed differently by the drivers’ due to inaccurate pick-up times; conducting the trips according to the manifest allows the scheduler and dispatcher to have a better idea of where a driver is at a given time, which provides more flexibility to reschedule and reassign driver assignments. If this is a reoccurring issue, the scheduler and the drivers should be required to hold regular meetings to discuss any changes in origins and destinations and changes to traffic patterns.
• TRANSPORT should periodically monitor routes to ensure that they are still accurate and efficient.
If TRANSPORT is having difficulties with scheduling procedures, the system should contact ITRE, which developed the scheduling software used by TRANSPORT. ITRE provides free technical assistance and training to transit system statewide. This is especially important if the system begins to provide Medicaid trips or initiate any new services.
If training does occur, TRANSPORT should cross-train at least one other staff person, preferably a driver, which is not only important from the standpoint of ensuring that the system has sufficient back-up in one of the key areas of the system, but also to contribute to a better working relationship among the scheduler and the drivers’ whose job functions are closely interconnected. Marketing One issue that was identified in the public forums was the lack of knowledge in terms what services TRANSPORT provides to the community. The NCDOT PTD considers the marketing of transit services to be a high priority in order to sustain and build ridership, and encourages systems to allocated around two percent of their budget to marketing activities. A comprehensive marketing program can create community support for TRANSPORT, helping to ensure that the system is seen as a beneficial community service, which then helps to maintain or increase local funding for the transit system.

Management and Service Alternatives
Transylvania County Community Transportation Service Plan Page 59
TRANSPORT management has expressed concern that increasing marketing efforts may attract ridership that the system is unable to accommodate at this time. As a result, it is recommended that the system hire a professional marketing firm that could develop a marketing plan that is practical and tailored to the needs and limited resources of the TRANSPORT system. Another possibility may be for TRANSPORT to team with a graphics or marketing class at Blue Ridge Community College to determine if student might help develop a new logo or develop other marketing suggestions.
Some of the recommendations for marketing TRANSPORT’s services include:
• Framework – Planning of the marketing effort should be detailed and comprehensive. Emphasis should be place on setting objectives, project design, and evaluation. Coordination should be maintained with other area marketing efforts undertaken by the County. A consistent design theme should be maintained for all marketing materials so that the brand can be easily identified. It is especially important that prior to the implementation of any new service, TRANSPORT prepare an aggressive marketing campaign to educate the public about the service and highlight the services’ benefits to the community and riding public.
• Logo – A clearly identified logo should be prepared which identifies TRANSPORT as the transit agency in Transylvania County. The logo should reflect some identifying qualities of the County and incorporate them with a transit theme. The logo would provide a standard item to be used in all marketing efforts. The new logo, along with TRASNSPORT’s phone number and website should also be on the vehicles more prominently.
• Website – TRANSPORT should develop its own stand-alone website that is better organized and regularly updated. The site would describe the current services and explain how riders can utilize the system. All required ADA and Title VI information should also be included in the design, and would be beneficial if some aspects of these federal regulations were more fully explained for the benefit of the riders. The site should share a design theme with the logo and include links with County agencies, non-profit organizations, and major activity centers, such as the Transylvania Regional Hospital. Links to other relevant transportation sites, such as sharetheridenc.org should also be included on the site.
• User Guide – The current brochures distributed by TRANSPORT are adequate, but it would be better if all information regarding the system was available in one document and widely distributed throughout the County, particularly at agencies, senior citizen facilities, and non-profit organizations. As with the web site, the user guide should include all required ADA and Title VI information, with some aspects of these federal regulations more fully explained for the benefit of the riders. Contact information for agencies and organizations that use or might make use of the system should also be included. Given the graphical quality of County publications, TRANSPORT may be able to utilize County resources to design an attractive and inexpensive brochure.

Management and Service Alternatives
Transylvania County Community Transportation Service Plan Page 60
• Market Research – TRANSPORT should begin conducting periodic surveying of users and non-users of the transit system to gather data on ridership demographics, to identify attitudes regarding existing services, to determine interest in new or expanded services, and other information which would assist TRANSPORT in improving the services it provides to passengers and County residents. A cost effective way for TRANSPORT to determine public opinion is to administer on-line surveys that are provided by several companies, such as Survey Monkey. On-line survey programs are easy to set-up and administer, and the data is tabulated and processed into reports. TRANSPORT should always conduct market research before the planning expanded or new services.
• Target the General Public – Since a large portion of the riders on the TRANSPORT system are human service agency clients, persons with disabilities and senior citizens, the general public may not realize that the service is available to all riders. TRANSPORT should develop specific marketing efforts targeted to the general public, advertising the fact that the transit service is for everyone in the community. These efforts include designing and placing decals on the vehicles advertising that the transit service is “open for all riders,” distributing flyers and writing press releases that clearly state that service is open to everyone in the community, and ensuring that system brochures and other rider informational pieces stress that the service is open for all members of the community.
The Board and TAB should be closely involved in the marketing program, as they represent a cross-section of the community and could be used in public relations efforts to promote and publicize TRANSPORT.
Additionally, it is important that elected and government officials who make funding decisions that affect public transportation in the county, as well as representatives of civic organizations (i.e., Chamber of Commerce and non-profit groups) see that TRANSPORT is efficient, effective, and useful. To help ensure this, TRANSPORT should assemble a mailing list of such individuals and groups to be used for the following purposes.
• Distribution of Reports – Elected and county government officials should receive copies of any performance reports or strategic plans prepared by TRANSPORT regarding the services provided.
• Newsletters – TRANSPORT should develop an annual or biannual newsletter for distribution to area agencies and organizations, elected officials and key decision makers, and also to the riders. The newsletter should describe any new initiatives or efficiency gains. Both positive and negative results should be communicated. Positive results will show effectiveness while communicating negative results will show that the system has identified problems through its own initiative and has shown how it plans to rectify the situation. This is much more positive than elected officials learning of problems when the situation demands an immediate response. These newsletters

Management and Service Alternatives
Transylvania County Community Transportation Service Plan Page 61
could also be made available in senior citizen centers, human service agencies, as well as placed on the vehicles for distribution to system users.
Advantages
• Potential to generate additional ridership and improve productivity.
• Develop a better understanding of customer needs in order to utilize limited resources more effectively.
• Improve the image of TRANSPORT in the community.
• Marketing of services is a requirement of NCDOT PTD.
Disadvantages
• Marketing effort would increase administrative responsibilities; however, marketing efforts should be implemented gradually and consistent with the availability of service.
• Limited funding may be is available to hire a marketing firm, develop a web site, and
pay for the use of a web server. TRANSPORT should prioritize marketing functions and does not have to implement every task at the same time.
OPERATIONS AND SERVICE ALTERNATIVES
Funding constraints in the near term will prevent TRANSPORT from implementing any service expansions that would increase system operating costs. As a result, service alternatives in the first few years of the plan should focus on improving operational efficiency and strategic deployment of resources, which can increase ridership and coverage without the need to acquire additional vehicles and hire more administrative and operations staff. In the later years of the plan if funding and demand for service have trended upward in the County, then at that time, TRANSPORT could consider expanding service and/or implementing new services. Public input that was obtained for this planning study, as well as public input noted in the Land-of-Sky Coordinated Human Service and Transportation Plan indicated that there is a need in the County for more service options, greater service flexibility, access to regional activity centers, and more service in the outlying areas of the County. The service issues that have been identified below address findings from planning inputs and public participation.
Expand the Service Levels and Service Coverage in the Midday Period
Examination of vehicle utilization charts and operator manifests indicates that there is
excess capacity during the midday hours (approximately between 10:00 AM and 2:00 PM and after 4:00 PM). Conversely, the vehicles exhibit high utilization rate during the morning and afternoon peak period when the system is primarily transporting clients to and from agency programs. It was also learned that TRANSPORT will have some additional capacity during the

Management and Service Alternatives
Transylvania County Community Transportation Service Plan Page 62
midday period as a result of the system no longer having to use a vehicle in the midday period to deliver meals to a child care center.
TRANSPORT should maximize the existing operational capabilities of its vehicle fleet by expanding service levels during the midday period to accommodate the general public; this includes providing more service in the Brevard area where most of the population resides, as well as providing basic lifeline service throughout the outlying areas of the county. A particular need that was cited during the public participation process was the lack of public transportation for residents who do not qualify for assistance through an agency program, but due to age or income level, may benefit if public transportation is available to access medical care, shopping trips and other services. With careful scheduling practices, increasing service during the midday period would likely not negatively impact existing services or resources. Some of the possible service options that could be employed are described in more detail below and include:
• County-wide transportation zones
• Point deviation service
• Flexible fixed route service
A variety of funding sources are available to cover the costs of operating expanded service or new services in the County for the general public and residents who do not qualify for transportation subsidies through Medicaid or other social service programs. The sources of these funds come from the NCDOT PTD, and FTA, both via Transylvania County. The former includes operating and capital assistance via the RGP and EDTAP programs; the local match for RGP funds is 10 percent while the EDTAP are entirely paid for by the State. FTA’s Section 5310 and 5317 programs provide operating and capital assistance, with operating assistance requiring a 50 percent local match and capital assistance requiring a 20 percent local match. TRANSPORT does have the option of using the RGP and EDTAP funds as the local match.
Using GIS to Monitor Ridership Patterns and Trends
TRANSPORT should utilize Geographic Information Systems (GIS) to begin monitoring the origin and destination addresses of the ridership to look for concentrations of ridership activity and demand. This technology is more applicable for when the system operates more general public transportation trips that may not be starting and ending at the same place each day as compared to the agency trips that currently comprise the bulk of TRANSPORT’s ridership. The Transylvania County Assessor’s Office, which oversees the Geographical Information System (GIS) program for the county could possibly provide assistance in mapping the origin and destination locations of TRANSPORT riders at various times throughout the year. If TRANSPORT could prepare a simple spreadsheet listing the exact address of each pick up and drop off location by trip, trip purpose, and trip program, the work involved in creating a GIS database that could then be graphically depicted for analysis purposes is not a complicated

Management and Service Alternatives
Transylvania County Community Transportation Service Plan Page 63
process. If the County is not capable of providing assistance, TRANSPORT should contact the Land-of-Sky RPO which also has GIS capabilities.
Matching common origins and destinations will improve productivity, as more people will be on each vehicle at any given time. It is recognized that not all trips will be able to be teamed with other trips, due to any number of reasons, such as the remoteness of a destination, passenger appointment time, or available vehicles; however, utilizing GIS technology will assist TRANSPORT in maximizing efficiencies to the extent possible.
Additionally, the proper pairing of trips would allow for current resources (i.e., vehicles and drivers) to be reallocated to any of the proposed proposals presented in this document, thus limiting new capital expenditures.
If reoccurring concentrations of trips are found or certain trip patterns emerge, TRANSPORT is better prepared to act accordingly, either through redeploying resources, expanding services, or operating new types of services, such as route deviation or point deviate on routes.
If reoccurring concentrations of trips are found, then flexible routes and various hybrid demand response services to serve these areas could prove to be feasible.
County-Wide Demand Response Transportation Zones
Public input that was gathered during the planning process cited the lack of general public transportation service in the outlying areas in the County as an unmet need. Because of the rural nature of this area, frequent daily service is unlikely, however, what TRANSPORT can do is divide the County into three separate zones and use one vehicle to operate general public demand responsive service within each zone and from each zone to Brevard one day per week during the midday period between 10:00 AM and 2:00 PM; this is the time period when the system exhibits excess capacity after serving the agency trips. In determining the zone boundaries, major roads were utilized, including U.S. 178, State Route 281, and U.S. 276. A map of the possible transportation zones is shown in Figure 20.

Management and Service Alternatives
Transylvania County Community Transportation Service Plan Page 64
Figure 20 - County-Wide Demand Response Transportation Option
This four hour period should provide sufficient time to provide basic lifeline services (shopping, pharmacy pick-up, banking, personal care, etc.) for residents living in the outlying areas of the County. Passengers could also have the option of waiting until after 4:00 PM to schedule their return trip, which is the other period in the day when vehicle utilization drops.
This type of service could not be relied upon for such things as work trips or other frequent trips such as dialysis.
A 24-hour advanced reservation would be required and TRANSPORT would not serve the zones if no reservations have been made.
In addition to general public trips, TRANSPORT could maximize productivity and vehicle utilization by coordinating with the County’s DSS to schedule Medicaid appointments to Brevard based on the day in which the client’s community would be served by TRANSPORT. This would be a case by case basis due the unique medical needs of the Medicaid clients; however, to the extent possible, grouping Medicaid trips which tend to be individualized could greatly improve cost effectiveness. As noted previously, TRANSPORT would need to have

Management and Service Alternatives
Transylvania County Community Transportation Service Plan Page 65
implemented the cost allocation model in order to accurately bill Medicaid for each trip it provided.
This service proposal is largely cost neutral in that no additional vehicles, vehicle service hours, or administrative costs would be required to operate this service. The only additional costs that would be incurred by TRANSPORT are related to marketing the service to the public.
It is possible that vehicle miles could increase significantly if this service is implemented since TRANSPORT does not provide much service in the outlying areas of the County at the present time. However, due to the very rural character of the area, the demand for service will likely be modest.
Depending on demand and utilization for the county-wide service, TRANSPORT may find it beneficial to acquire an ADA accessible mini-van, which would be more cost effective to operate compared to the system’s existing fleet of vehicle models and would also provide better maneuverability on the narrow and winding roads which comprise a significant portion of the road network in the County’s outlying areas. A mini-van would cost approximately $27,000.
This route should be monitored for effectiveness and efficiency using the performance measures described in the data collection and service monitoring recommendation. A trial period extending approximately six months to one year should be adequate to help determine whether or not the service should be made permanent or undergo modification.
NCDOT PTD has stated that Haywood and Cherokee Counties use a similar zone system,
and that TRANSPORT could contact those agencies to learn some best practices.
Advantages
• Addresses an unmet need that was cited throughout the planning process by increasing the level of transit mobility to non-Medicaid residents that reside in the outlying areas of the County.
• Provides service that allows for people to prearrange appointments.
• Would not disrupt the current users of the system since this service would be provided when vehicles are underutilized.
• A County funded system should make service available to all taxpaying residents.
• Increases visibility of TRANSPORT services as more County residents come in contact with the systems’ vehicles.
• Fills available seats on TRANSPORT vehicles, thus increasing productivity and cost effectiveness.

Management and Service Alternatives
Transylvania County Community Transportation Service Plan Page 66
Disadvantages
• Operating transportation zones may at some point require a dedicated vehicle.
• Will require some additional costs associated with marketing to make the public aware of these services.
• May require long layovers at destinations.
• Capital funding may not be available for the acquisition of a mini-van.
• Vehicle communication is less reliable the farther vehicles are from Brevard due to County’s topography; as a result, performance could be negatively impacted if there are problems communicating changes in scheduling or communicating various problems that may be encountered while the vehicle is in service.
Point Deviation Service Option
A service option that may be appropriate for TRANSPORT to consider at some point in the future in the Brevard area is point deviation service during the midday period, which would provide a consistent and convenient service in and around the city to accommodate general public transportation trips (i.e., grocery shopping, picking-up medications at the pharmacy, banking, personal care, socializing, etc.). This type of route blends the structure of fixed route service with the flexibility of demand responsive service. That is, the vehicle would be scheduled to arrive/depart at specific points at specific times, but the route traveled between those scheduled time points is dictated completely by passenger requests.
Figure 21 provides an outline for such a service in the Brevard area. The point deviation route in Brevard could have four time points, such as the Silvermont Senior Center, the Brevard Housing Authority, the K-Mart/Ingles Market, and Wal-Mart. These time points were chosen because they represent frequent destinations noted in TRANSPORT’s driver manifests and City Cab’s monthly Medicaid trip log, and also because they represent major retail centers and areas with a high concentration of affordable housing. Passengers looking to use the service have two options. They can board the vehicle at one of the scheduled stops without a reservation and request to be taken to their destination or they can call and make a reservation. Passengers will also have to understand that the bus will be heading in a general direction (i.e., northbound or southbound) to make its next scheduled time point. Therefore, if passengers wants to travel to a destination in the opposite direction, they would need to wait for the return trip.

Management and Service Alternatives
Transylvania County Community Transportation Service Plan Page 67
Figure 21 – Point Deviation Service Option
The scheduled time point stops would usually be made within a 10-minute window. If there are no deviations between the check point stops, the vehicle may arrive early, but would not leave until the scheduled time.
The second component of a point deviation service is the zone in which it operates. That is, a passenger’s origin and destination must be within a designated zone in order for their trip to be served. Figure 2 also depicts a potential zone for the demand responsive nature of the service. The proposed zone would encompass three-quarters of a mile which corresponds to the ADA service regulations and would also cover most of the City of Brevard. Therefore, passengers on this service could receive curb to curb service throughout most of the city.
General industry practice suggests that an accurate estimate of the amount of time needed to provide such a service would be twice the amount of time it would take to operate on a fixed route basis between the established time points. The average running speed was determined by dividing the number of service miles and service hours that were directly operated by TRANSPORT vehicles in FY 2009 (131,750 miles and 7,802 hours), which results in an average speed of approximately 17 miles per hour. Table 11 provides an estimate of the

Management and Service Alternatives
Transylvania County Community Transportation Service Plan Page 68
amount of time needed to operate a one way trip using the four time points that were selected for this service.
Table 11 – Possible Point Deviation Running Time
Segment Mileage
Avg. Op. Speed (MPH)
Fixed Route Running Time
(minutes)
Point Deviation Running Time
(minutes) Silvermont Sr. Center to Brevard Housing Auth. 0.60 17 2.1 4.2 Brevard Housing Auth. to K-Mart/Ingles Market 1.1 17 3.9 7.8 K-Mart/Ingles Market to Wal-Mart 3.4 17 12.0 24.0
Total 4.2 17 18.0 36.0 Speed Based on the estimated one-way running time, a round trip would require approximately 36 minutes. Using one vehicle, and allowing for recovery and layover, the point deviation route service could be offered at a 60 minute frequency.
If TRANSPORT were to operate point deviation service in the Brevard area, it is suggested that the service be introduced at a minimal level for an initial period to determine the community acceptance and usage of the service. A reasonable level of service might be two days a week between 10:00 AM and 3:00 PM.
TRANSPORT should also consider operating this service using the system’s existing 20 foot lift-equipped LTV mini-bus. In addition to having a greater seating capacity than the conversion and lift-equipped vans, this vehicle also portrays a more customer-friendly image. Standard lift-equipped vans can be saddled with the stigma of being the “elderly and disabled van” whereas a minibus looks more like a true transit vehicle and is more aesthetically pleasing. The drawbacks to using the LTV vehicle include the need for the driver to have a Commercial Drivers License (CDL) and the inability to provide door-to-door service when the route would deviate from the normal schedule.
Given the current funding situation facing TRANSPORT, the highest priority will be to maintain the existing level of service currently provided in Transylvania County. As a result, it is unlikely that new services will be feasible within the five year time frame of this CTSP study. However, , if TRANSPORT provided a point deviation route in replace of an existing vehicle run during the midday period, it is unlikely that TRANSPORT would incur any significant increase in administrative and/or operating costs. The only additional costs would be related to market research, marketing and promotional materials (cost up to $2,000 during first year of service) and placing marked bus stop signs at the four time point locations. In fact, this type of service may be more cost efficient if riders access TRANSPORT services at a designated stop instead of requesting to be picked-up at their home or other location, which in turn, may also help alleviate some of the stress on TRANSPORT’s other vehicles by potentially eliminating the number of single passenger trips.
At the outset, it is not recommended that permanent signs for bus stops be produced or installed. Instead, one of many temporary signage solutions could be employed. Some transit systems place adhesive stickers denoting a bus stop on the back of other municipal signs

Management and Service Alternatives
Transylvania County Community Transportation Service Plan Page 69
BUS STOP
(828) 884-3203
Transylvaniacounty.org
(i.e., no parking, etc.) Other systems use plastic wraps that are placed around utility poles. Each of these could be easily removed if the service is not successful and is eliminated. However, whatever type of temporary sign that is used should display the TRANSPORT name and logo, the words “Bus Stop” and preferably, the symbol for bus stop. Figure 22 provides a guide for how a TRANSPORT bus stop sign could be laid out.
The cost of permanent bus stop signs is estimated at $120 per sign, which includes the cost of installation.
Figure 22 – Sample Bus Stop Sign Due to the unique nature of point deviation service, TRANSPORT should establish a
service policy that would include the distance of the route deviation and advanced notice requirements for passengers. Though “real-time” scheduling would be an added benefit of this service, staffing levels may not be sufficient to handle demand. It is recommended that the route deviate up to three quarters of a mile in order to satisfy ADA requirements.
Any new service operated by TRANSPORT should be monitored for effectiveness and efficiency using the performance measures described in the data collection and service monitoring recommendation. However, because point deviation service would be unique among the services currently provided by TRANSPORT, it is recommended that the standard for this service be developed based on the performance of similar types of services operated either in the State or somewhere in the eastern United States. The NCDOT PTD or the regional mobility development specialist could assist with finding similar types of services operated in the State.
Management and Service Alternatives
Transylvania County Community Transportation Service Plan Page 70
A trial period extending approximately six months to one year should be adequate to help determine whether or not the service should be made permanent.
A variety of funding sources may be available to cover the operating and capital costs associated with operating this point deviation service option, including the State’s RGP and EDTAP programs and the FTA Section 5310 and 5317 programs. The local match for RGP funds is 10 percent while the EDTAP are entirely paid for by the State. The FTA Section 5310 and 5317 programs require a 50 percent local match for operating assistance and a 20 percent local match for capital assistance. TRANSPORT does have the option of using the RGP and EDTAP funds as the local match. Another possibility is to have the City of Brevard help fund the new services since a majority of the service area falls within the City limits.
As noted in the marketing recommendations, TRANSPORT should conduct market research before planning and operating any expanded or new services in the County. Route Deviation Service Option
Another service option that may be appropriate for TRANSPORT to consider at some point in the future in the Brevard area is route deviation service during the midday period that would operate between the City of Brevard and Pisgah Forest (U.S. 276); this area is the County’s population and commercial activity center and is where the majority of TRANSPORT’s origins and destinations are located.
This service is where a route travels along a defined alignment on an established schedule. Based on passenger requests, the route will deviate from the defined alignment up to a prescribed limit or within a defined zone, make the passenger pick-up or drop-off, and then return to the defined route before the next marked bus stop.
With this service, passengers can board with a reservation at a requested location or without a reservation at a marked stop or scheduled time point. In some systems, the extent of deviation is three-quarters of a mile which corresponds to the ADA service regulations. A possible route alignment is shown in Figure 23. This route is conceptual in nature; future study would be required to define a final route alignment in detail.
Based on the characteristics of the Brevard area, a potential route was designed that would operate between the Silvermont Senior Center in Brevard and Wal-Mart in Pisgah Forest and serve several transit activity centers in between the terminus points, including College Walk, Transylvania Regional Hospital, Transylvania Vocational Services, downtown Brevard, and Blue Ridge Community College; the route would also directly serve or provide access to numerous grocery stores and other commercial enterprises along the U.S. 64 corridor, as well as serve several senior citizen facilities (nursing homes, retirement communities, etc.) and low income housing units.

Management and Service Alternatives
Transylvania County Community Transportation Service Plan Page 71
Based on the round trip mileage, projected average speed and the need to accommodate deviations based on passenger requests, this conceptual route could be operated at a frequency of every 75 minutes.
Designated bus stops would be established in the Brevard area and at major activity centers along the U.S. 64 corridor, such as large grocery stores, College Walk, Wal-Mart, and Transylvania Regional Hospital. As with the point deviation option, temporary bus stop signs should be used at the beginning of the service until TRANSPORT can determine if the route should be made permanent.
The approximate cost of permanent bus stop signs is estimated at $120 per sign, which
includes the cost of installation.
Figure 23 – Route Deviation Service Option
Management and Service Alternatives
Transylvania County Community Transportation Service Plan Page 72
If TRANSPORT were to operate route deviation service in the Brevard area, it is suggested that the service be introduced at a minimal level for an initial period to determine the community acceptance and usage of the service. Similar to the point deviation option, a reasonable level of service might be two days a week between 10:00 AM and 3:00 PM.
As with the point deviation option, this service should also be operated using
TRANSPORT’s existing 20 foot lift-equipped LTV mini-bus. As noted previously, the drawbacks to using the LTV vehicle include the need for the driver to have a Commercial Drivers License (CDL) and the inability to provide door-to-door service when the route deviates from the alignment.
If TRANSPORT provided route deviation service in place of an existing vehicle run during the midday period, it is unlikely that any significant increase in administrative and/or operating costs would occur other than start up costs associated with market research, promotion, and public information, which could cost up to $2,000 and would occur during the first year of service.
However, in the event that TRANSPORT would operate route as an addition to the services already being provided by the transit system, the projected operating statistics for this route is presented in Table 12. Given the current financial situation in Transylvania County, it is unlikely that any new services will be provided during the five year time frame of this CTSP study. It is possible that Year five (2015) of this plan may present an opportunity for TRANSPORT to examine the feasibility of this service, but only if funding and economic conditions have improved. For this reason, the costs associated with this service will not be reflected in the five year financial plan.
Assuming this route operated two days a week and provided four round trips each day, the service would incur approximately 359 annual vehicle hours and 5,568 annual vehicle miles. Since it is difficult to estimate the number of deviations that will be requested on this route, the number of miles is based on the vehicle not deviating from the alignment.
Using the fully allocated cost model that was developed for this study, the annual
operating cost of providing service on this route in current dollars would be approximately $15,000. Due to inflationary factors, the annual cost of this service is projected to increase to nearly $19,000 in FY 2015.
Total Cost = 1.666 * [($0.33 per mile * 5,568) + ($19.53 per hour * 359)] or $14,741
Under the assumption of 4.2 passengers per hour – the productivity rate of TRANSPORT’s services in FY 2009 – the route deviation service would provide approximately 1,500 passenger trips annually. If the current in-county fare of $1.00 fare were charged, this would garner approximately $1,500 in passenger revenue annually.

Management and Service Alternatives
Transylvania County Community Transportation Service Plan Page 73
Table 12 – Route Deviation Service Projected Operating Statistics
Route Deviation Service Service Parameters Span of Service 10:00 AM to 3:00 PM Annual Days of Service 96 Miles per Round Trip 14.5* Minutes per Round Trip 51* Daily Round Trips 4 Annual Vehicle Miles 5,568* Annual Vehicle Hours 359 (includes layover) Passengers 1,508 Passenger Revenue $1,508 Annual Operating Cost $14,741
* Does not include time and distance attributed to deviations
Due to the unique nature of route deviation service, TRANSPORT should establish a service policy that would include the distance or frequency of route deviations, advanced notice requirements for passengers, and the boarding and alighting locations. It is recommended that the route deviate up to three quarters of a mile in order to satisfy ADA requirements.
Although it is also unlikely that this service would be feasible within the five year time frame of this CTSP study, if TRANSPORT provided a flexible fixed route in place of an existing vehicle run during the midday period, it is unlikely that any significant increase in administrative and/or operating costs would occur other than costs related to market research, marketing and promotional materials and placing marked bus stop signs at the four time point locations. In fact, this type of service may be more cost efficient if riders access TRANSPORT services at a designated stop instead of requesting to be picked-up at their home or other location.
Any new service operated by TRANSPORT should be monitored for effectiveness and efficiency using the performance measures described in the data collection and service monitoring recommendation. However, because flexible fixed route service would be unique among the services currently provided by TRANSPORT, it is recommended that the standard for this service be developed based on the performance of similar types of services operated either in the State or somewhere in the eastern United States. The NCDOT PTD or the regional mobility development specialist could assist with finding similar types of services operated in the State, such as Jackson County and Macon County.
A trial period extending approximately six months to one year should be adequate to help determine whether or not the service should be made permanent.
A variety of funding sources may be available to cover the operating and capital costs associated with operating this flexible fixed route service option, including the State’s RGP and EDTAP programs and the FTA Section 5310 and 5317 programs. The local match for RGP funds

Management and Service Alternatives
Transylvania County Community Transportation Service Plan Page 74
is 10 percent while the EDTAP are entirely paid for by the State. The FTA Section 5310 and 5317 programs require a 50 percent local match for operating assistance and a 20 percent local match for capital assistance. TRANSPORT does have the option of using the RGP and EDTAP funds as the local match. Another possibility is to have the City of Brevard help fund the new services since a majority of the service area falls within the City limits.
Advantages
• This service would offer passengers in the Brevard area more flexibility in their trips making in that they could opt to use the route without the need to make an advanced reservation. As a result, this could also lessen the scheduling and dispatching workload for the TRANSPORT staff.
• The point deviation and the route deviation service options provide more convenient and consistent service to the general public, which was cited as an unmet need during the planning process.
• The services would not increase operating or administrative costs by a significant rate if they are operated during the midday period in replace of service that is currently provided during that time period.
• Both service options would likely be eligible for State and FTA funding to offset operating and/or capital costs.
• Both services could relieve capacity on the other vehicle runs that serve the Brevard area.
• Provide transit service where most of the ridership demand is located.
• Easy means of serving a large segment of the County’s population.
Disadvantages
• TRANSPORT may not have sufficient vehicle capacity to dedicate a vehicle to a particular area for a specific time period.
• The LTV vehicle would require the operator to have a Commercial Driver’s License (CDL).
• The LTV vehicle may not be capable of providing door-to-door service for all customers.
Regional Transportation Options
Given the population characteristics of Transylvania County, residents requiring specialized medical treatment or wanting access to major shopping centers and retailers generally travel to the City of Hendersonville in Henderson County or the City of Asheville in
Management and Service Alternatives
Transylvania County Community Transportation Service Plan Page 75
Buncombe County. TRANSPORT provides out-of-county medical trips to Henderson and Buncombe Counties, with the vast majority of these trips taken by Medicaid clients. TRANSPORT directly operates service to a dialysis clinic in Hendersonville three times a week, with all of the other out-of-county medical trips operated by City Cab. The distance between Brevard and Hendersonville is approximately 20 miles while the distance between Brevard and Asheville is almost 31 miles. Though both counties are served by public transportation systems that operate fixed route and rural demand response and subscription services, these systems do not provide any service into Transylvania County at this time. As a result, opportunities for sharing riders among transit systems is not present and the distance required to connect with these regional systems is too far to warrant daily service from Transylvania County.
However, there are still a number of recommendations to improve the cost efficiency of TRANSPORT’s out-of-county transportation service, as well as expand access to regional activity centers. Each of these recommendations is described below. Dialysis Transportation Service
TRANSPORT directly operates one round trip every Monday, Wednesday, and Friday to
the Hendersonville Dialysis Center using one of its lift-equipped vans. Based on the number of passengers that are transported to this destination each trip, TRANSPORT should consider acquiring a most cost effective vehicle, such an ADA accessible mini-van, to operate this service; this vehicle is more fuel efficient compared to the existing fleet and could also be used in inclement weather (i.e., snow storms) when the other vehicles in the fleet must be idled for safety reasons. The cost of a new mini-van would be approximately $27,000. The major drawback to a mini-van versus a passenger van or lift-equipped van is capacity and the lack of a wheelchair lift.
A variety of funding sources are available to cover the costs of operating expanded service or new services for the general public and residents who don’t qualify for transportation subsidies through Medicaid or other social service programs. The sources of these funds come from the NCDOT PTD, and FTA, both via Transylvania County. The former includes operating and capital assistance via the RGP and EDTAP programs; the local match for RGP funds is 10 percent while the EDTAP are entirely paid for by the State. FTA’s Section 5310 and 5317 programs provide operating and capital assistance, with operating assistance requiring a 50 percent local match and capital assistance requiring a 20 percent local match. TRANSPORT does have the option of using the RGP and EDTAP funds as the local match.
Advantages
• Cost savings would be achieved through improved fuel economy.
• The vehicle could be operated during inclement weather, which is important for dialysis patients who require regularly scheduled treatment.
• Having a wheelchair accessible mini-van could be a selling point to area nursing homes,

Management and Service Alternatives
Transylvania County Community Transportation Service Plan Page 76
who might be interested in contracting with TRANSPORT during inclement weather to transport their residents or clients to medical appointments.
Disadvantages
• Mini-vans provide fewer seats and are not equipped with a wheelchair lift; however, the vehicles are equipped with a wheelchair ramp.
• Capital funding may not be available to fund the purchase of a new vehicle at this time. Regional Medicaid Transportation
TRANSPORT should explore methods to reduce the costs associated with out-of-county
Medicaid trips provided by City Cab. The cab company’s round-trip fare between Hendersonville and Transylvania County is $110; the round-trip fare to Asheville is $140. In May 2010, City Cab operated 21 trips to Asheville and 15 trips to Hendersonville for a total cost of nearly $5,000.
• Restrict out-of-county medical trips to certain days of the week and require medical appointments to be scheduled during the morning hours only; with this policy, TRANSPORT can try group Medicaid clients onto City Cab vehicles for vehicles if they are going to similar destinations. This policy would have to be somewhat flexible based on the medical needs of the Medicaid client. Since City Cab operates four door sedans only, it is likely that no more than three people could ride in a cab at the same time.
• TRANSPORT should continue to ensure that Medicaid clients travelling out-of-county for medical treatment cannot be treated in-county. According to the North Carolina Department of Health and Human Services (DHHS) Adult Medicaid Manual MA-2910, Medicaid will not fund transportation to a provider at a significantly greater distance from the recipient’s residence solely because of personal preference if a suitable local source is available. This policy should be strictly enforced.
Advantages
• Ride sharing and enforcing Medicaid travel policy could be very cost effective.
Disadvantages
• City Cab may not want to transport multiple people at one time.
• Ride sharing could complicate the billing process.
• Physicians and/or medical facilities may be unable or unwilling to schedule morning appointments only.

Management and Service Alternatives
Transylvania County Community Transportation Service Plan Page 77
Regional Carpools and Vanpools According to the public walk-up meetings, rider surveys and recommendations from the
Land of Sky coordinated plan, there does not appear to be a large demand for out-of-county trips to access employment destinations. However, according to 2007 U.S. Census Bureau LED Origin-Destination Data Base, approximately 20 percent (2,094 people) of Transylvania County’s resident workforce commutes into either Henderson County (10.5percent) or Buncombe County (9.8percent); of this number, approximately 600 county residents work in the City of Asheville (Buncombe County) and 461 county residents work in the Hendersonville Township (Henderson County).
Since there is a fairly high number of County residents commuting into specific places
(i.e., Hendersonville Township and the City of Asheville) there may be some level of interest in carpooling or ridesharing to these destinations.
TRANSPORT is too small to develop and operate a travel demand management (TDM) program. However, the system could conduct market research either through a survey distributed to the public or by designating a Board meeting that would include a presentation on car/van pooling. In the region, the City of Asheville operates a TDM program, so TRANSPORT could schedule a representative from the Asheville TDM to give a presentation at the Board meeting.
The Asheville TDM would be responsible for administering the program, finding an appropriate park and ride location, and paying for any costs associated with carpool and vanpool facilities. TRANSPORT would primarily act as an intermediary and perhaps assist in scouting for potential park and ride locations or coordinating meetings in the County. It was noted in a description of North Carolina ARRA projects that NCDOT has asked for funding to construct a park and ride location in Transylvania County; this would likely be the parking location for any carpool and/or vanpool program operating in the county. If not, the Asheville TDM with assistance from TRANSPORT could approach local shopping centers, churches, or any entity with excess parking and ask for permission to use a certain number of parking spaces for a specified number of hours each day.
In addition, TRANSPORT and/or the County web site should provide a link to the statewide carpool matching service – sharetheridenc.org. This site provides a database of commuters and their schedules, so someone living in Brevard could see if anyone else in the area is looking to carpool to a specific place; the site also includes information on vanpools and park and ride lots.
Advantages
• Consistent with NCDOT goals of making the transportation network safer and more efficient.
• Consistent with environmental concerns in the County and a good way to increase public awareness of the TRANSPORT system.

Management and Service Alternatives
Transylvania County Community Transportation Service Plan Page 78
• Trip patterns and demand could reveal a market for regularly scheduled regional service that would be operated by TRANSPORT. If regional service was operated daily and used for employment transportation, the system would be eligible for the State’s Employment Transportation Assistance Program (EMP); the State funds up to 100 percent of the cost of service. TRANSPORT would also be eligible for the FTA’s Section 5316 and 5317 programs, which require local matches of either 20 or 50 percent depending if the funds are to be used for capital or operating assistance.
Disadvantages
• Requires more staff time to schedule meetings and arrange site visits to potential park and ride facilities; however, as noted above, the Asheville TDM would be responsible for administering and financing the program.
Regional General Public Transportation Shuttle
The need to provide more inter-county transportation was cited in the public
participation component of the CTSP planning process and was also noted in the Land-of-Sky RPO Coordinated Public Transportation and Human Services Transportation Plan. The distance to access regional activity centers would be costly to serve on a daily basis unless there were significant demand in Transylvania County that would justify the operating costs that would be incurred by TRANSPORT. However, if TRANSPORT were able to acquire a smaller vehicle (i.e., mini-van) to operate dialysis service, this vehicle could also be used to operate limited out-of-county general public service.
The NCDOT is constructing a park and ride facility near the Asheville Regional Airport that will open in two years and also function as a transfer point for the Asheville Transit System and Apple County Transportation. It is recommended – pending market research findings and funding and resource availability – that TRANSPORT provide one round trip per week to this transfer point where riders would have the option of accessing fixed route bus service into Asheville or Hendersonville. This recommendation would be implemented in Year three of the plan and would depend on the ability to acquire a mini-van to make the service more cost effective and reasonable based on current funding limitations. For the duration of this plan providing one round trip per week is realistic considering that TRANSPORT would have to operate this service on one the two days during the week when the system is not serving the Hendersonville dialysis center; one day should be left open for other trip purposes and time for vehicle maintenance.
The initial planning for this service should involve some level of market research to determine the level of interest and/or need for regional transportation service among the County population; TRANSPORT should target college students, senior citizens, and other population groups that may not have access to an automobile or are unable to drive.

Management and Service Alternatives
Transylvania County Community Transportation Service Plan Page 79
TRANSPORT could also prepare a more comprehensive feasibility study examining the costs and benefits of providing regional transportation service. The State’s Rural Planning Program provides up to 100 percent of the cost of preparing regional feasibility studies. Since regional coordination is a goal of the NCDOT PTD, it is likely that a feasibility study to examine coordination between TRANSPORT and other regional systems would garner consideration.
Based on the current schedules of Apple County Transportation and the Asheville Transit System, this plan assumes that TRANSPORT would arrive at the park and ride facility to meet the regional transit buses at around 10:00 AM; in the afternoon, TRANSPORT would return to the facility and pick-up passengers at approximately 5:00 PM. The route would depart from a location in downtown Brevard and travel north along U.S. 64 through Hendersonville, then travel north on I-26 north and exit at the Asheville Regional Airport; the park and ride facility will be within a few miles of the airport.
The distance between Brevard and the transfer point is approximately 33 miles, with
one round trip requiring approximately two hours of travel time. Due to the travel time required to reach the park and ride facility, TRANSPORT should designate one of two pick-up and drop-off points in Brevard and require passengers to meet the vehicle.
Another regional service option would be to operate one day a week between the cities of Brevard and Hendersonville and provide riders could access to the Apple Country Transportation bus that would take them to the park and ride facility transfer point and provide connecting service to the Asheville Transit System. Serving Hendersonville instead of the park and ride facility would reduce the round trip distance by approximately 24 miles and shave nearly 45 minutes from the round-trip travel time. The potential routing of this service is depicted in Figure 24.
The major drawback to serving Hendersonville is the need for passengers to make two transfers to reach the City of Asheville, which would likely deter a significant portion of potential ridership, especially considering that Asheville is likely to be the primary destination of the people utilizing the service.
Table 13 shows the fully allocated annual cost to operate the two service options, with annual service to the park and ride facility costing approximately $5,600 and the annual cost to operate service between Brevard and Hendersonville being approximately $3,350.
NC DOT Park and Ride – Total Cost = 1.666 * [($0.33 per mile * 3,432) + ($19.53 per hour * 114)] or $5,596
Hendersonville – Total Cost = 1.666 * [($0.33 per mile * 2,184) + ($19.53 per hour * 66)] or $3,349 Start up costs associated with market research, promotion, and public information
could add as much as $2,000 to annual operating costs during the first year of service.
Under the assumption of 4.2 passengers per hour – the productivity rate of TRANSPORT’s services in FY 2009 – the shuttle service to the park and ride facility would provide approximately 480 passenger trips and $1,440 in passenger revenue annually; service to

Management and Service Alternatives
Transylvania County Community Transportation Service Plan Page 80
Hendersonville would provide approximately 278 trips and $834 in passenger revenue on an annual basis.
Table 13 – Regional TRANSPORT Shuttle Service Options
Regional Shuttle Route
Shuttle to NCDOT Park & Ride Shuttle to Hendersonville Service Parameters Service Parameters
Span of Service One round trip per week One round trip per week Annual Days of Service 52 52 Miles per Round Trip 66 42 Minutes per Round Trip 120 76.4 Daily Round Trips One One Annual Vehicle Miles 3,432 2,184 Annual Vehicle Hours 114 (includes layover) 66 (includes layover) Passenger Trips 480 278 Passenger Revenue $1,440 $834 Annual Operating Cost $5,596 $3,349
Figure 24 – Regional Shuttle Route Recommendation

Management and Service Alternatives
Transylvania County Community Transportation Service Plan Page 81
TRANSPORT should require advanced reservations on a first come, first serve basis and only operate the route if at least two passengers have reserved a ride. A service policy should be developed for this service including reservation policies, vehicle wait time at the time of the pick-up, and any other operational issues that may affect passengers.
Any new service operated by TRANSPORT should be monitored for effectiveness and
efficiency using the performance measures described in the data collection and service monitoring recommendation. However, because this regional shuttle service would be unique among the services currently provided by TRANSPORT, it is recommended that the standard for this service be developed based on the performance of similar types of services operated either in the State or somewhere in the eastern United States. The NCDOT-PTD or the regional mobility development specialist could assist with finding similar types of services operated in the State.
A trial period extending approximately six months to one year should be adequate to
help determine whether or not the service should be made permanent or undergo modifications.
The regional shuttle route could be funded through the State’s Rural Operating Assistance Program (ROAP), in particular the Rural General Public Program (RGP) and/or supplemental RGP funds, and the Elderly and Disabled Transportation Assistance Program (EDTAP) and/or supplemental EDTAP funds. Since this service would generally not be providing employment transportation, it is unlikely that TRANSPORT would be eligible for the FTA’s Section 5316 (JARC) program or the State’s Employment Transportation Assistance Program.
Advantages
• Increases regional coordination and provides mobility options for County residents.
• If a smaller vehicle is available (i.e., mini-van), the trip would be more cost effective.
• TRANSPORT could use service to gauge interest in operating more regularly scheduled regional service that could be used to access employment.
Disadvantages
• Operating a regional shuttle will increase TRANSPORT’s annual operating costs.
• Using the same vehicle for the dialysis trips and the regional shuttle would leave only one day a week for assigning vehicle maintenance.
• The service may not be utilized by the community; at the same time, the service would also be easy to eliminate.

Management and Service Alternatives
Transylvania County Community Transportation Service Plan Page 82
IMPLEMENTATION SCHEDULE
Provided below is a potential five-year implementation schedule for the list of alternatives described in this chapter. Specific tasks are provided on an annual basis. Table 14 presents a phased implementation schedule for all of the proposals that exist in this document over a five year period. Each “X” indicates the year that the recommendation should be implemented. It is expected that some of the recommendation may never be implemented, while others would be implemented after the initial five years. This table merely demonstrates one potential phased implementation plan, which could also be used in determining the priority of each recommendation. In general, most of the recommendations throughout the five year plan are non-service related, with the only significant costs in the first few years of the plan due to the need to procure new vehicles – two replacements and one expansion. As a result, the plan presents a realistic and financially constrained plan that will address TRANSPORT’s needs during the next five years through efficiency improvements and obtaining additional revenue in which to perhaps provide additional services in the later years of the plan or beyond the plan’s five year horizon.

Management and Service Alternatives
Transylvania County Community Transportation Service Plan Page 83
Table 14 – Phased Implementation Plan
Recommendation 2011 2012 2013 2014 2015 On-
Going Year One
TRANSPORT should hold staff meeting to create objectives and goals related to the CTSP. X X
Develop Fully Allocated Costs Model to obtain an estimate of per mile, per hour, and per trip cost of service. Consult with NC DOT PTD for assistance and/or Training, if necessary.
X X
Reevaluate fully allocated cost of service each year to ensure cost recovery for non-county subsidized funding sources. X X
Using fully allocated cost model, develop new billing rates for new serivces X
Using the cost model to obtain current cost of service, TRANSPORT should evaluate cost effectiveness of brokering all Medicaid trips to City Cab’s.
X X
Begin identifying and applying for funding that can increase transit for general population. X X
Identify data management needs to develop processes to track and monitor system performance X X
Request two replacement vehicles from NC DOT-PTD X TRANSPORT should formalize contract with City Cab and ensure the contract is designed to provide the system the opportunity to provide Medicaid trips in the future. The system should also confer with the State to determine if the County is required to formalize its brokerage policies.
X
TRANSPORT should request City Cab to undertake full analysis of determine its fully allocated costs X
Hold driver meetings to reevaluate routes to ensure that they are accurate and efficient. X X
Hold staff meeting to begin process of formalizing improving data collection, service monitoring, scheduling, and tracking procedures. System should determine if on-site visit from ITRE would be helpful to improve scheduling procedures and use of software. If additional software is needed, TRANSPORT should plan to acquire software as soon as possible.
X
TRANSPORT should identify marketing firm and begin redesigning marketing materials, such as system logo and website.
X X
Constantly strive to attract new riders without affecting performance.
X X
Reevaluate out-of-county Medicaid trips – restrict certain trips to specific days of the week, and ensure that medical treatment cannot be done in-county.
X
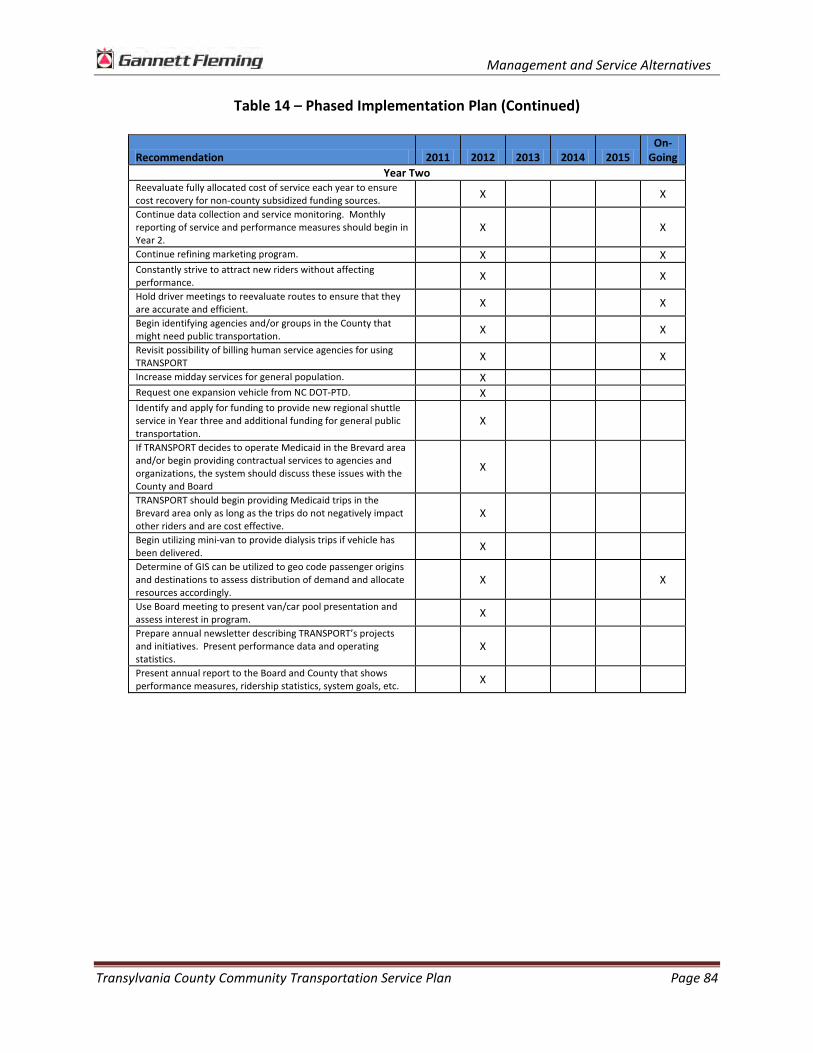
Management and Service Alternatives
Transylvania County Community Transportation Service Plan Page 84
Table 14 – Phased Implementation Plan (Continued)
Recommendation 2011 2012 2013 2014 2015 On-
Going Year Two
Reevaluate fully allocated cost of service each year to ensure cost recovery for non-county subsidized funding sources. X X
Continue data collection and service monitoring. Monthly reporting of service and performance measures should begin in Year 2.
X X
Continue refining marketing program. X X Constantly strive to attract new riders without affecting performance. X X
Hold driver meetings to reevaluate routes to ensure that they are accurate and efficient. X X
Begin identifying agencies and/or groups in the County that might need public transportation. X X
Revisit possibility of billing human service agencies for using TRANSPORT X X
Increase midday services for general population. X Request one expansion vehicle from NC DOT-PTD. X Identify and apply for funding to provide new regional shuttle service in Year three and additional funding for general public transportation.
X
If TRANSPORT decides to operate Medicaid in the Brevard area and/or begin providing contractual services to agencies and organizations, the system should discuss these issues with the County and Board
X
TRANSPORT should begin providing Medicaid trips in the Brevard area only as long as the trips do not negatively impact other riders and are cost effective.
X
Begin utilizing mini-van to provide dialysis trips if vehicle has been delivered. X
Determine of GIS can be utilized to geo code passenger origins and destinations to assess distribution of demand and allocate resources accordingly.
X X
Use Board meeting to present van/car pool presentation and assess interest in program. X
Prepare annual newsletter describing TRANSPORT’s projects and initiatives. Present performance data and operating statistics.
X
Present annual report to the Board and County that shows performance measures, ridership statistics, system goals, etc. X

Management and Service Alternatives
Transylvania County Community Transportation Service Plan Page 85
Table 14 – Phased Implementation Plan (Continued)
Recommendation 2011 2012 2013 2014 2015 On-Going
Year Three Reevaluate fully allocated cost of service each year to ensure cost recovery for non-county subsidized funding sources. X X
Continue data collection and service monitoring. X X Continue refining marketing program – implement website with new information, such as the link to sharetheridenc.org and possibly on-line surveys.
X X
Constantly strive to attract new riders without affecting performance. X X
Hold driver meetings to reevaluate routes to ensure that they are accurate and efficient. X X
Begin identifying agencies and/or groups in the County that might need public transportation. X X
Continue to identify funding options for maintaining and expanding services to the public. X X
Continually monitor Medicaid trips to ensure trips are cost effective and not negatively impacting service. X X
Request one replacement vehicle from NC DOT-PTD. X If funding is available and mini-van has been procured, TRANSPORT should begin marketing program for the regional shuttle service – public information, media announcements, etc.
X
Begin implementing regional shuttle sometime in Year 3 X
Continue refining marketing program – implement website with new information, such as the link to sharetheridenc.org and possibly on-line surveys
X
Conduct market research to determine level of interest or demand for flexible services (i.e., point deviation or route deviation).
X X
Begin operating service in designated county-wide zones one day per week during midday period. X
Revisit possibility of billing human service agencies for using TRANSPORT. X X
Present annual report to the Board and County that shows performance measures, ridership statistics, system goals, etc. X
Prepare annual newsletter describing TRANSPORT’s projects and initiatives. Present performance data and operating statistics.
X
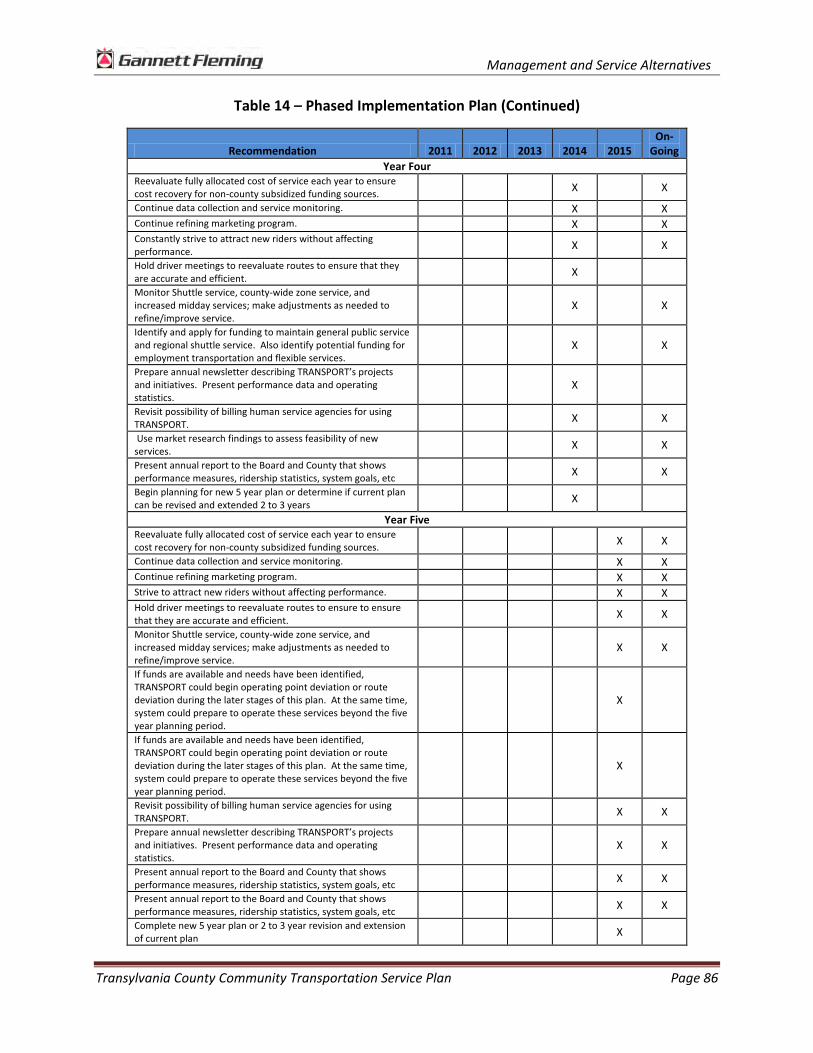
Management and Service Alternatives
Transylvania County Community Transportation Service Plan Page 86
Table 14 – Phased Implementation Plan (Continued)
Recommendation 2011 2012 2013 2014 2015 On-
Going Year Four
Reevaluate fully allocated cost of service each year to ensure cost recovery for non-county subsidized funding sources. X X
Continue data collection and service monitoring. X X Continue refining marketing program. X X Constantly strive to attract new riders without affecting performance. X X
Hold driver meetings to reevaluate routes to ensure that they are accurate and efficient. X
Monitor Shuttle service, county-wide zone service, and increased midday services; make adjustments as needed to refine/improve service.
X X
Identify and apply for funding to maintain general public service and regional shuttle service. Also identify potential funding for employment transportation and flexible services.
X X
Prepare annual newsletter describing TRANSPORT’s projects and initiatives. Present performance data and operating statistics.
X
Revisit possibility of billing human service agencies for using TRANSPORT. X X
Use market research findings to assess feasibility of new services. X X
Present annual report to the Board and County that shows performance measures, ridership statistics, system goals, etc X X
Begin planning for new 5 year plan or determine if current plan can be revised and extended 2 to 3 years X
Year Five Reevaluate fully allocated cost of service each year to ensure cost recovery for non-county subsidized funding sources. X X
Continue data collection and service monitoring. X X Continue refining marketing program. X X Strive to attract new riders without affecting performance. X X Hold driver meetings to reevaluate routes to ensure to ensure that they are accurate and efficient. X X
Monitor Shuttle service, county-wide zone service, and increased midday services; make adjustments as needed to refine/improve service.
X X
If funds are available and needs have been identified, TRANSPORT could begin operating point deviation or route deviation during the later stages of this plan. At the same time, system could prepare to operate these services beyond the five year planning period.
X
If funds are available and needs have been identified, TRANSPORT could begin operating point deviation or route deviation during the later stages of this plan. At the same time, system could prepare to operate these services beyond the five year planning period.
X
Revisit possibility of billing human service agencies for using TRANSPORT. X X
Prepare annual newsletter describing TRANSPORT’s projects and initiatives. Present performance data and operating statistics.
X X
Present annual report to the Board and County that shows performance measures, ridership statistics, system goals, etc X X
Present annual report to the Board and County that shows performance measures, ridership statistics, system goals, etc X X
Complete new 5 year plan or 2 to 3 year revision and extension of current plan X

Management and Service Alternatives
Transylvania County Community Transportation Service Plan Page 87
It should be noted that this implementation schedule provides an incremental approach to the improvement of the TRANSPORT system. Available funding or local support will most likely affect this proposed schedule. Certain items may be implemented quicker while others delayed. While this is not a set schedule, it does provide a “building block” towards implementation of the plan. COST AND REVENUE PROJECTIONS
This section describes the projected operating costs, revenue, and deficits for the TRANSPORT system through 2015. All of the estimates were initially prepared in 2009 or constant dollars. This represents the last complete year for which data was available. The total operating cost value was then escalated in order to obtain the system costs in the actual year of expenditure to reflect the consequences of inflation. Operating costs are predicted to escalate at an increasing rate for each year based on rates developed by the NCDOT TIP Development Unit (i.e., 1.0200 in 2011, 1.0608 in 2012, 1.1032 in 2013, 1.1474 in 2014, and 1.1933 in 2015).
Because the recommendations included in this plan are primarily non-service related, the level of service is expected to remain fairly constant during the five year planning period. The only planned increase in service related costs is the implementation of a regional shuttle service in year three (FY 2013), which would provide one weekday round trip between the City of Brevard and a future NC DOT owned park and ride facility near the Asheville Regional Airport. From the park and ride facility, TRANSPORT passengers’ would transfer onto the Asheville Transit System or Apple Country Transportation. This service would add about 114 vehicle hours and increase TRANSPORT’s current annual operating costs by approximately $7,000 in FY 2013 (when adjusted for inflation). The service is projected to carry approximately 480 passengers per year based on the system’s current productivity of around 4.2 passengers per hour. No additional peak vehicles are required to operate this service. The recommendations also proposed a number of service concepts including countywide zone, point deviation, and route deviation services. It is possible for TRANSPORT to operate these services using existing resources and modifying the utilization and deployment of the vehicle fleet. However, any additional services above the existing services already provided by TRANSPORT would likely require additional resources (i.e., vehicles, personnel, or labor hours). For example, if the route deviation service was implemented during the last year of the plan (FY 2015) as an addition to existing TRANSPORT services, the route would cost almost $24,000 when adjusted for inflation. The annual cost of the service is based on FY 2009 dollars, or approximately $15,000 (refer to Table 12). Table 15 reflects the projected operating costs. During the first and second years of the CTSP, all cost increases are attributable to inflation. When the regional shuttle route is implemented in the third year of the plan, the percent increase as derived from the previous years is added to the annual inflation-related cost increase.
Management and Service Alternatives
Transylvania County Community Transportation Service Plan Page 88
Overall, when adjusting for inflation and accounting for the added expenditure of the weekly regional shuttle route, the operating costs for TRANSPORT are expected to increase by approximately two-thirds (+68.1%) between the baseline year of 2009 and 2015.
Table 15 – Operating Costs (Current Year Dollars)
2010 2011 2012 2013 2014 2015 Operating Cost - Baseline $359,828 $367,025 $389,340 $429,520 $492,831 $588,095 Regional Shuttle -- -- -- $6,680 $7,664 $9,146
In order to get an idea of the exact amount of funding necessary to operate
TRANSPORT services during the next five years, funding forecasts have been calculated. Table 16 details the expected funding from all funding sources over the course of the plan. Passenger fares are projected to increase six percent from year to year, which is consistent with TRANSPORT’s ridership increasing by an average of approximately six percent between FY 2007 and FY 2009. This projection assumes passenger fares will remain the same during the five year period. The passenger fares from the regional shuttle assume a base fare of $3.00, which is the current out-of-county fare charged by TRANSPORT.
The level of transit funding was based on the NC DOT inflation rates, so it is important
to recognize that the funding levels are assumptions and are subject to change. Developing forecasts of operating assistance is a challenging endeavor since there is considerable uncertainty regarding transit funding at all levels of government (local, state, and federal).
During the five year planning period, the forecasts assume that operating assistance will continue to be fairly evenly distributed among federal, state, and local sources. The “other” revenue sources are a line item from TRANSPORT’s current funding which was carried over for these estimates.
It is assumed for this study that the additional revenue needed to balance TRANSPORT’s
budget over the five year period would come the State’s Rural Operating Assistance Program (ROAP), which includes the Rural General Public Program (RGP) and the Elderly and Disabled Transportation Assistance Program (EDTAP). The RGP program pays for 90 percent of the costs associated with providing transportation services for persons who do not have a human service agency or organization that pays for their transportation. The remaining 10 percent of costs must come from a local source. In terms of the EDTAP program, the State will pay up to 100 percent of the costs associated with transporting seniors (60+) and disabled persons when other funding sources are not available.

Management and Service Alternatives
Transylvania County Community Transportation Service Plan Page 89
Table 16 – Financial Forecasts (Current Year Dollars)
2010 2011 2012 2013 2014 2015 Operating Costs $359,828 $367,025 $389,340 $429,520 $492,831 $588,095 Marketing Costs $0 $0 $0 $562 $175 $182 Capital Costs $72,000 $81,600 $30,339 $45,231 $0 $0 Total Costs $431,828 $448,625 $419,679 $481,993 $500,671 $597,424
Revenue
Existing Service $5,605 $5,717 $5,946 $6,183 $6,431 $6,688 Regional Shuttle $0 $0 $0 $1,441 $1,441 $1,441 5311 – CTP Admin Federal $177,926 $180,083 $190,160 $212,729 $244,758 $294,123 State $11,120 $11,255 $11,885 $13,296 $15,297 $18,383 Local $33,361 $33,766 $35,655 $39,887 $45,892 $55,148
Sub-Total $222,408 $225,103 $237,700 $265,911 $305,947 $367,654 ROAP – EDTAP (State) $53,917 $54,571 $57,624 $64,463 $74,169 $89,128 ROAP – RGP State $54,591 $55,253 $58,345 $65,269 $75,096 $90,242 Local $6,066 $6,139 $6,483 $7,252 $8,344 $10,027
Sub-Total $60,657 $61,392 $64,827 $72,521 $83,440 $100,269 Capital Funding Federal $57,600 $65,280 $24,271 $36,185 $0 $0 State $7,200 $8,160 $3,034 $4,523 $0 $0 Local $7,200 $8,160 $3,034 $4,523 $0 $0 Subtotal $72,000 $81,600 $30,339 $45,231 $0 $0 Other $17,242 $20,242 $23,242 $26,242 $29,242 $32,242
Total Revenue $431,828 $448,625 $419,679 $481,993 $500,671 $597,424
However, the TRANSPORT system should continually access the service it provides and determine whether it can access federal programs, such as the Federal Transit Administration’s (FTA) 5310, 5316, and 5317 programs. Although these federal programs require a 50 percent local match if used for operating assistance, the local match could be obtained through the use of existing ROAP funds, Transylvania County, and grants or donations from local organizations and foundations.
It is also worth noting that additional revenue could be obtained through operating a
portion of the Medicaid trips currently provided by City Cab. The City of Brevard could also be requested to help fund any new services that primarily operate within the city limits.

Management and Service Alternatives
Transylvania County Community Transportation Service Plan Page 90
It is assumed that if additional funding is not available from federal and/or state programs, the operating deficit would be covered by local county funds. Further, maintaining existing services and implementing the recommendations in the plan are subject to funding availability. For this reason it is essential that TRANSPORT continually re-evaluate its operations and delivery of service to ensure that the most cost effective transportation services are provided to the public. Since most of the recommendations are non-service related, particularly in the first few years of the plan, TRANSPORT should be able to implement many of the financial, management, and operational recommendations without incurring any significant added expenditures. In fact, many of the recommendations included in the plan will assist the system in allocating resources more efficiently. CAPITAL PLAN
The proposed capital plan provides a vehicle replacement and expansion plan for TRANSPORT during the five years covered by the CTSP. The capital plan calls for the purchase of a total of four vehicles – three replacements and one expansion – during the five year period. In addition, TRANSPORT is currently in the process of replacing one its lift-equipped vans that has exceeded 100,000 miles with a new 20 foot LTV with funding from the American Recovery and Reinvestment Act (ARRA). This vehicle will be delivered sometime in the later part of FY 2010.
The three vehicles that are recommended for replacement include one 2002 Dodge lift-equipped van with 128,452 miles, one 2003 Dodge conversion van with 112,425 miles and one 2006 Ford lift-equipped van with 90,183 miles. Both the 2002 and 2003 Dodge vehicles have exceeded their useful economic life defined by the NCDOT as 100,000 miles and should be replaced in FY 2011. Since TRANSPORT is replacing one of its lift-equipped vehicles with a LTV mini-bus in FY 2010, it is recommended that the system replace the 2003 Dodge conversion van with a lift-equipped van; this reconfiguration of the fleet will maintain an appropriate ratio of wheelchair lift vehicles that can deliver door-to-door service in the County.
The 2006 Ford lift-equipped van will likely surpass 100,000 miles by Year two of the
plan and is being scheduled for replacement in Year three (FY 2013). The expansion vehicle is a mini-van that would be acquired in Year two of the plan (FY
2012) for use on the out-of-county dialysis trips and the proposed regional shuttle that could begin service in FY 2013.
These vehicles should be purchased through NCDOT’s statewide vehicle purchasing contract, which covers 90 percent of the vehicle cost. The cost of each lift-equipped van is approximately $40,000 in the current year, with the current cost of the mini-van being approximately $27,000.

Management and Service Alternatives
Transylvania County Community Transportation Service Plan Page 91
Table 17 lists the capital costs associated with the CTSP for the years 2010 through 2015. Each cost is placed in the appropriate year based on the implementation schedule outlined above, with the total cost of each vehicle adjusted to reflect NC DOT inflation rates.
Table 17 – Projected Capital Costs
Year Replacement Vehicles New Vehicles
Total ($) # Unit Cost ($) Total ($) # Unit Cost ($) Total ($) 2010 1 $72,000 $72,000 $72,000 2011 2 $40,800 $81,600 $81,600 2012 -- -- -- 1 $28,642 $28,642 $28,642 2013 1 $44,128 $44,128 -- -- -- $44,128 2014 -- -- -- -- -- -- -- 2015 -- -- -- -- -- -- -- Capital costs are projected to be highest during the first full year of the plan
implementation. This is due to the fact that the procurement of three vehicles – two replacements and one expansion – is recommended.
It is recognized that this replacement program may be constrained by the availability of
capital funding.
SUMMARY
This chapter has detailed a number of financial, management, operational, and service alternatives, which offer solutions to current TRANSPORT issues. The alternatives are intended to improve the financial position of the system, maximize productivity and cost efficiency, and increase service where possible. These recommendations in this draft final report have been presented to NCDOT and TRANSPORT’s Transportation Advisory Board for their review and comment, and will be presented to County Commissioners and the public for input before being adopted.

APPENDIX A

HAPPY HOLIDAYS! Thank you for participating in the
TRANSYLVANIA COUNTY COMMUNITY TRANSPORTATION SERVICE PLAN Transylvania County is currently preparing a plan to guide and improve Transport, the public transportation service currently provided in the county.
Please take this opportunity to provide your input into this process by completing this brief questionnaire. Your time and suggestions are much appreciated.
1. How familiar are you with Transport?
I know what Transport is and am familiar with the services they provide. I have seen the Transport vans but am not familiar with the services they provide. I was not aware that the County provides transportation services.
2. Have you or a member of your family used Transport services in the past year? Yes No
3. How important do you think public transportation is to the residents of Transylvania County?
Not Important Important Very Important
4. Do you know of any types of trips that Transylvania County residents need to make but cannot due to a lack of transportation? Yes No If yes, please explain (use back of sheet if necessary)
5. Do you have any suggestions for how Transport service could be improved?
Yes No If yes, please provide your suggestions (use back of sheet if necessary):
______________________________________________________________________________
********************************* Detach Here ***************************************
Thank you for your time! Please feel free to enter our free drawing for a $25 gift card
Name: _________________________________________________________________________
Address: _______________________________ Town, State, Zip __________________________
Phone: ________________________________ Email: __________________________________

APPENDIX B

TRANSYLVANIA COUNTY “TRANSPORT” - RIDER SURVEY - 2009
Dear Customers: We=d like to learn more about you and your travel needs to help Transylvania County plan the future services of the Transylvania County Transportation (Transport). Please read each question and mark the most appropriate answer. Please complete only one survey form during this survey period. After you finish answering all questions, please return the completed survey to the driver on this or a future trip.
1. How long have you been riding Transport?
G Less than a year G 1-2 years G 3-4 years G 5+ years 2. What program is helping to pay for your trip today?
G Senior G Persons with Disabilities G General Public G Medicaid G Med-Drive (In-County) G Dialysis G Personal Care Assistant G Other _________________
3. What is the purpose of your trip today?
G Shopping G Senior Center G Medical/dental G Work G Other ___________________ (please specify)
4. Do you use Transport for other reasons?
G No G Yes (If yes, check all that apply) G Shopping G Senior Center G Medical/dental G Work G Other _____________________ (please specify)
5. During a typical week (Monday through Friday), how often do you
use Transport? G 5 Days G 4 Days G 3 Days G 2 Days G 1 Day 6. Please answer the following about your typical experience when
calling Transport to schedule your trips: There is no answer or busy signal? G Yes G No G Sometimes Hold time is too long? G Yes G No G Sometimes Person answering phone is polite? G Yes G No G Sometimes Person answering phone is rude? G Yes G No G Sometimes
7. How convenient was the scheduled pick-up time of your trip
compared to the time that you wanted to travel? G Convenient G Acceptable G Inconvenient G Very Inconvenient
8. How close was your pick up time on this trip to the scheduled
time? G On time G Not on time (please complete below) Early Late G 1 to 10 Minutes G 1 to 10 Minutes G 11 to 20 Minutes G 11 to 20 Minutes G More than 20 Minutes G More than 20 Minutes
9. How would you describe the amount of time you will spend on the Transport vehicle to make this trip?
G Too long G About right G Don’t know 10. How do you rate Transport for the following:
Very Excellent Good Good Fair Poor
Cleanliness of vehicle G G G G G Driver courtesy G G G G G Driver skills/Safety G G G G G Comfort of ride G G G G G Fare charged G G G G G Service information G G G G G
Picking-up on time G G G G G Places served G G G G G 11. Compared to last year, how is Transport? G Better now
G Better last year G About the same G Did not ride last year
12. Compared to last year, are you riding: G More G Less G About the same G Did not ride last year
13. Could you have made this trip if Transport service was not
available? G No G Yes G Yes, but with inconvenience 14. Your sex: G Male G Female 15. Your age: G Under 18 G 18 to 29 G 30 to 44 G 45 to 64 G 65+ 16. What are the most important improvements that you would
suggest for Transport? (use back of form if needed) ________________________________________________________________________________________________________________
After completing this card, please return it to the driver or to the driver on your next Transport trip. Thank you for your help.

APPENDIX C
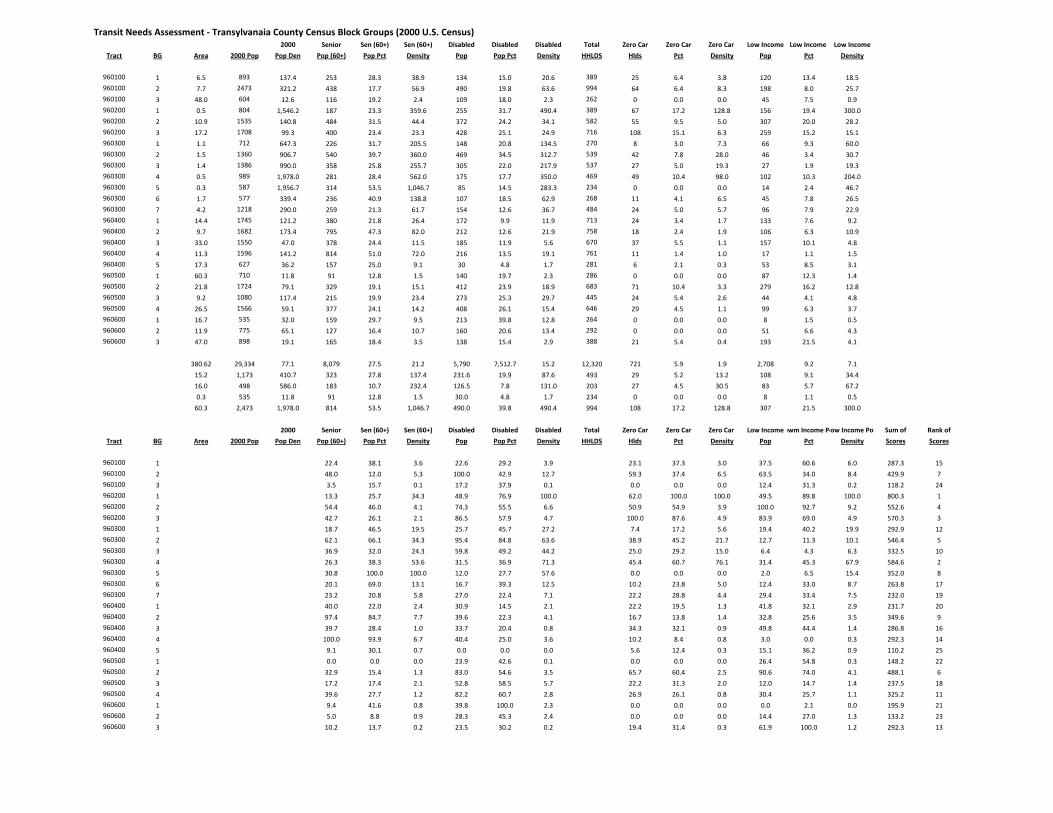
Transit Needs Assessment ‐ Transylvanaia County Census Block Groups (2000 U.S. Census)2000 Senior Sen (60+) Sen (60+) Disabled Disabled Disabled Total Zero Car Zero Car Zero Car Low Income Low Income Low Income
Tract BG Area 2000 Pop Pop Den Pop (60+) Pop Pct Density Pop Pop Pct Density HHLDS Hlds Pct Density Pop Pct Density
960100 1 6.5 893 137.4 253 28.3 38.9 134 15.0 20.6 389 25 6.4 3.8 120 13.4 18.5
960100 2 7.7 2473 321.2 438 17.7 56.9 490 19.8 63.6 994 64 6.4 8.3 198 8.0 25.7
960100 3 48.0 604 12.6 116 19.2 2.4 109 18.0 2.3 262 0 0.0 0.0 45 7.5 0.9
960200 1 0.5 804 1,546.2 187 23.3 359.6 255 31.7 490.4 389 67 17.2 128.8 156 19.4 300.0
960200 2 10.9 1535 140.8 484 31.5 44.4 372 24.2 34.1 582 55 9.5 5.0 307 20.0 28.2
960200 3 17.2 1708 99.3 400 23.4 23.3 428 25.1 24.9 716 108 15.1 6.3 259 15.2 15.1
960300 1 1.1 712 647.3 226 31.7 205.5 148 20.8 134.5 270 8 3.0 7.3 66 9.3 60.0
960300 2 1.5 1360 906.7 540 39.7 360.0 469 34.5 312.7 539 42 7.8 28.0 46 3.4 30.7
960300 3 1.4 1386 990.0 358 25.8 255.7 305 22.0 217.9 537 27 5.0 19.3 27 1.9 19.3
960300 4 0.5 989 1,978.0 281 28.4 562.0 175 17.7 350.0 469 49 10.4 98.0 102 10.3 204.0
960300 5 0.3 587 1,956.7 314 53.5 1,046.7 85 14.5 283.3 234 0 0.0 0.0 14 2.4 46.7
960300 6 1.7 577 339.4 236 40.9 138.8 107 18.5 62.9 268 11 4.1 6.5 45 7.8 26.5
960300 7 4.2 1218 290.0 259 21.3 61.7 154 12.6 36.7 484 24 5.0 5.7 96 7.9 22.9
960400 1 14.4 1745 121.2 380 21.8 26.4 172 9.9 11.9 713 24 3.4 1.7 133 7.6 9.2
960400 2 9.7 1682 173.4 795 47.3 82.0 212 12.6 21.9 758 18 2.4 1.9 106 6.3 10.9
960400 3 33.0 1550 47.0 378 24.4 11.5 185 11.9 5.6 670 37 5.5 1.1 157 10.1 4.8
960400 4 11.3 1596 141.2 814 51.0 72.0 216 13.5 19.1 761 11 1.4 1.0 17 1.1 1.5
960400 5 17.3 627 36.2 157 25.0 9.1 30 4.8 1.7 281 6 2.1 0.3 53 8.5 3.1
960500 1 60.3 710 11.8 91 12.8 1.5 140 19.7 2.3 286 0 0.0 0.0 87 12.3 1.4
960500 2 21.8 1724 79.1 329 19.1 15.1 412 23.9 18.9 683 71 10.4 3.3 279 16.2 12.8
960500 3 9.2 1080 117.4 215 19.9 23.4 273 25.3 29.7 445 24 5.4 2.6 44 4.1 4.8
960500 4 26.5 1566 59.1 377 24.1 14.2 408 26.1 15.4 646 29 4.5 1.1 99 6.3 3.7
960600 1 16.7 535 32.0 159 29.7 9.5 213 39.8 12.8 264 0 0.0 0.0 8 1.5 0.5
960600 2 11.9 775 65.1 127 16.4 10.7 160 20.6 13.4 292 0 0.0 0.0 51 6.6 4.3
960600 3 47.0 898 19.1 165 18.4 3.5 138 15.4 2.9 388 21 5.4 0.4 193 21.5 4.1
380.62 29,334 77.1 8,079 27.5 21.2 5,790 7,512.7 15.2 12,320 721 5.9 1.9 2,708 9.2 7.1
15.2 1,173 410.7 323 27.8 137.4 231.6 19.9 87.6 493 29 5.2 13.2 108 9.1 34.4
16.0 498 586.0 183 10.7 232.4 126.5 7.8 131.0 203 27 4.5 30.5 83 5.7 67.2
0.3 535 11.8 91 12.8 1.5 30.0 4.8 1.7 234 0 0.0 0.0 8 1.1 0.5
60.3 2,473 1,978.0 814 53.5 1,046.7 490.0 39.8 490.4 994 108 17.2 128.8 307 21.5 300.0
2000 Senior Sen (60+) Sen (60+) Disabled Disabled Disabled Total Zero Car Zero Car Zero Car Low Incomeowm Income Poow Income Po Sum of Rank of
Tract BG Area 2000 Pop Pop Den Pop (60+) Pop Pct Density Pop Pop Pct Density HHLDS Hlds Pct Density Pop Pct Density Scores Scores
960100 1 22.4 38.1 3.6 22.6 29.2 3.9 23.1 37.3 3.0 37.5 60.6 6.0 287.3 15
960100 2 48.0 12.0 5.3 100.0 42.9 12.7 59.3 37.4 6.5 63.5 34.0 8.4 429.9 7
960100 3 3.5 15.7 0.1 17.2 37.9 0.1 0.0 0.0 0.0 12.4 31.3 0.2 118.2 24
960200 1 13.3 25.7 34.3 48.9 76.9 100.0 62.0 100.0 100.0 49.5 89.8 100.0 800.3 1
960200 2 54.4 46.0 4.1 74.3 55.5 6.6 50.9 54.9 3.9 100.0 92.7 9.2 552.6 4
960200 3 42.7 26.1 2.1 86.5 57.9 4.7 100.0 87.6 4.9 83.9 69.0 4.9 570.3 3
960300 1 18.7 46.5 19.5 25.7 45.7 27.2 7.4 17.2 5.6 19.4 40.2 19.9 292.9 12
960300 2 62.1 66.1 34.3 95.4 84.8 63.6 38.9 45.2 21.7 12.7 11.3 10.1 546.4 5
960300 3 36.9 32.0 24.3 59.8 49.2 44.2 25.0 29.2 15.0 6.4 4.3 6.3 332.5 10
960300 4 26.3 38.3 53.6 31.5 36.9 71.3 45.4 60.7 76.1 31.4 45.3 67.9 584.6 2
960300 5 30.8 100.0 100.0 12.0 27.7 57.6 0.0 0.0 0.0 2.0 6.5 15.4 352.0 8
960300 6 20.1 69.0 13.1 16.7 39.3 12.5 10.2 23.8 5.0 12.4 33.0 8.7 263.8 17
960300 7 23.2 20.8 5.8 27.0 22.4 7.1 22.2 28.8 4.4 29.4 33.4 7.5 232.0 19
960400 1 40.0 22.0 2.4 30.9 14.5 2.1 22.2 19.5 1.3 41.8 32.1 2.9 231.7 20
960400 2 97.4 84.7 7.7 39.6 22.3 4.1 16.7 13.8 1.4 32.8 25.6 3.5 349.6 9
960400 3 39.7 28.4 1.0 33.7 20.4 0.8 34.3 32.1 0.9 49.8 44.4 1.4 286.8 16
960400 4 100.0 93.9 6.7 40.4 25.0 3.6 10.2 8.4 0.8 3.0 0.0 0.3 292.3 14
960400 5 9.1 30.1 0.7 0.0 0.0 0.0 5.6 12.4 0.3 15.1 36.2 0.9 110.2 25
960500 1 0.0 0.0 0.0 23.9 42.6 0.1 0.0 0.0 0.0 26.4 54.8 0.3 148.2 22
960500 2 32.9 15.4 1.3 83.0 54.6 3.5 65.7 60.4 2.5 90.6 74.0 4.1 488.1 6
960500 3 17.2 17.4 2.1 52.8 58.5 5.7 22.2 31.3 2.0 12.0 14.7 1.4 237.5 18
960500 4 39.6 27.7 1.2 82.2 60.7 2.8 26.9 26.1 0.8 30.4 25.7 1.1 325.2 11
960600 1 9.4 41.6 0.8 39.8 100.0 2.3 0.0 0.0 0.0 0.0 2.1 0.0 195.9 21
960600 2 5.0 8.8 0.9 28.3 45.3 2.4 0.0 0.0 0.0 14.4 27.0 1.3 133.2 23
960600 3 10.2 13.7 0.2 23.5 30.2 0.2 19.4 31.4 0.3 61.9 100.0 1.2 292.3 13

APPENDIX D

1
Model Sale of Service Contract Contract for Transportation Services
Between Purchaser and Transit System
WHEREAS, (Purchaser) has an interest in provision of transportation services to (specify target population and service area), and WHEREAS, (Transit System) has been officially designated as the (urban or regional) transit system for (specify service area) pursuant to Section 324A. 1. Code of Iowa and has vehicles and employees available for transporting those persons, NOW, THEREFORE, THE PARTIES DO HEREBY MUTUALLY AGREE AS FOLLOWS: A. Purpose and Timeframe
1. The purpose of this contract is to arrange for public transit services under the auspices of the designated public transit system.
2. The contract period shall begin on ________________ and continue through __ _. Any extension or renewal of this contract shall be in writing and mutually agreed upon by both parties.
B. Description of Service
1. All transit services will be provided in vehicles open to the public (without discrimination.)
2. Service shall be provided (specify days of service) except on the following holidays: (specify service holidays)
3. Service hours under this contract shall be (specify service hours). 4. Service shall be (specify nature of service, i.e.: "daily demand-responsive
transportation within City of Iowa plus Monday/Wednesday shuttle to Des Moines designed primarily around the needs of older Iowans for congregate meal, grocery and medical transportation," or "advanced reservation demand responsive service centering on Head Start attendance centers", or "fixed-route services on 30-minute headways along routes shown on attached map, plus supplemental demand responsive services for those physically unable to board route buses.")
5. Access to service shall be obtained by (describe means of access, i.e.: "flagging bus at designated stops along route" or "calling transit system for ride reservations at least, 24 hours in advance, "making ride reservations with county coordinator at least 2 hours in advance.")
6. Service fares (or recommended contributions) shall be as follows: (specify fare/contribution structure)
7. Services shall be (self) insured with the following coverages: a. general liability $1,000,000 b. uninsured and underinsured motorist $1,000,000
8. Continuity of services shall be provided through access to (specify nature and location of spare vehicles or other provisions).

2
C. Responsibilities of Transit System
1. (The transit system) shall serve as an independent contractor. 2. (The transit system) shall provide and maintain in safe and presentable condition
such vehicles as are required to provide the services described above, including backup.
3. (The transit system) shall employ and train, clean and courteous personnel as necessary to provide the services described above. Each driver shall have a chauffeur or commercial vehicle driver license as appropriate.
4. (The transit system) shall conduct drug and alcohol testing of all personnel performing safety sensitive duties under this agreement. The testing program shall conform to all requirements of the Federal Transit Administration.
5. (The transit system) shall operate all services described above including scheduling and dispatching support.
6. (The transit system) shall notify (purchaser) in the event of any unavoidable interruption or delay in service.
7. (The transit system) shall notify (purchaser) of any incidents relating to passengers served under this contract.
8. (The transit system) shall insure services to the limits described above, naming (purchaser) with a certificate of insurance to this effect. Such insurance shall not be cancelled except after 30 days notice to (purchaser).
9. (The transit system) shall accept all risk and indemnify and hold (purchaser) harmless from all losses, damage, claims, demands, liabilities, suits, or proceedings, including court costs, attorney''s and witness'' fees relating to loss or damage to property or to injury or death of any person arising out of the acts or omissions of (the transit system) or its employees or agents.
10. (The transit system) shall maintain accounting and records for all services rendered and shall assure that all persons handling project funds, including passenger revenues, are bonded to levels appropriate for the amounts of funds handled.
11. (The transit system) shall provide to (purchaser) a (monthly) billing for services rendered in the previous (month) including a report of units of service provided and revenues credited toward the service from passengers and from other sources.
12. (The transit system) shall secure an independent audit of its transportation program including services provided under this contract and shall provide a copy of the audit report to (purchaser).
13. (The transit system) shall permit inspection of its vehicles, services, books, and records by (purchaser) or agencies providing funding to (purchaser) upon the request of (purchaser).
14. (The transit system) shall provide information about the availability of the above described services, as well as other services of (the transit system) to both the target population of this contract and the general public.
15. (The transit system) shall comply with all applicable state and federal laws, including but not limited to, equal employment opportunity laws, nondiscrimination laws, traffic laws, motor vehicle equipment laws, confidentiality laws and freedom of information laws.
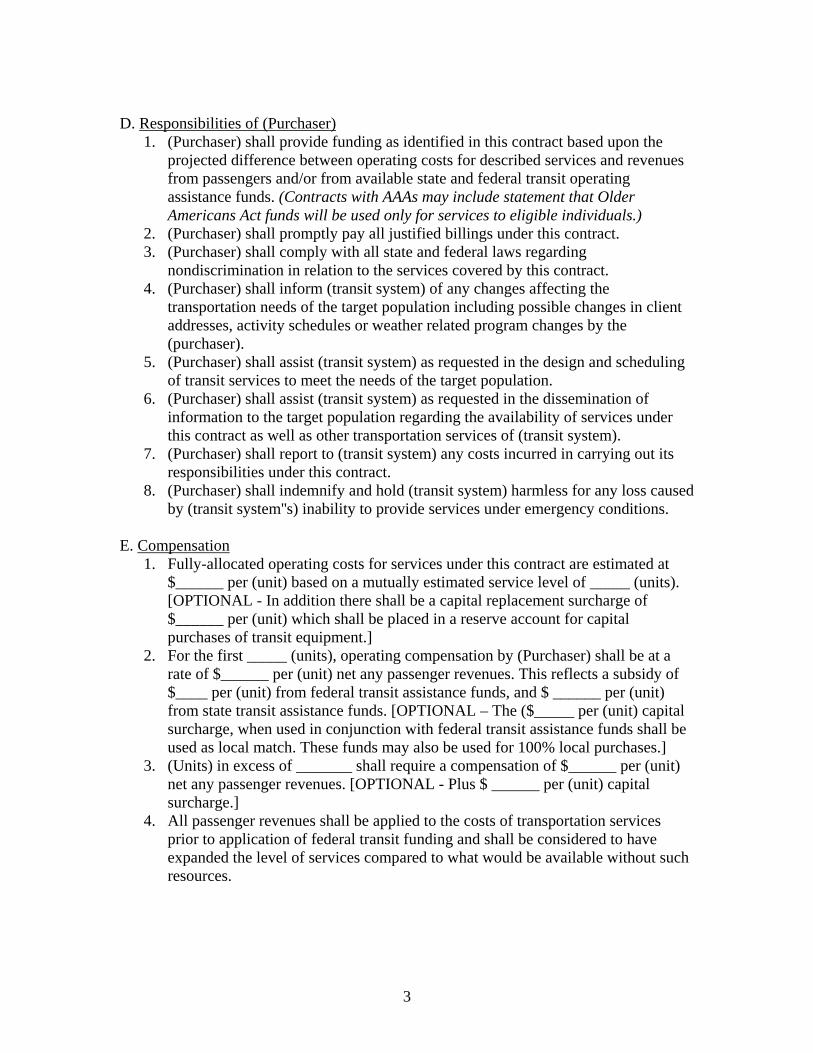
3
D. Responsibilities of (Purchaser)
1. (Purchaser) shall provide funding as identified in this contract based upon the projected difference between operating costs for described services and revenues from passengers and/or from available state and federal transit operating assistance funds. (Contracts with AAAs may include statement that Older Americans Act funds will be used only for services to eligible individuals.)
2. (Purchaser) shall promptly pay all justified billings under this contract. 3. (Purchaser) shall comply with all state and federal laws regarding
nondiscrimination in relation to the services covered by this contract. 4. (Purchaser) shall inform (transit system) of any changes affecting the
transportation needs of the target population including possible changes in client addresses, activity schedules or weather related program changes by the (purchaser).
5. (Purchaser) shall assist (transit system) as requested in the design and scheduling of transit services to meet the needs of the target population.
6. (Purchaser) shall assist (transit system) as requested in the dissemination of information to the target population regarding the availability of services under this contract as well as other transportation services of (transit system).
7. (Purchaser) shall report to (transit system) any costs incurred in carrying out its responsibilities under this contract.
8. (Purchaser) shall indemnify and hold (transit system) harmless for any loss caused by (transit system''s) inability to provide services under emergency conditions.
E. Compensation
1. Fully-allocated operating costs for services under this contract are estimated at $______ per (unit) based on a mutually estimated service level of _____ (units). [OPTIONAL - In addition there shall be a capital replacement surcharge of $______ per (unit) which shall be placed in a reserve account for capital purchases of transit equipment.]
2. For the first _____ (units), operating compensation by (Purchaser) shall be at a rate of $______ per (unit) net any passenger revenues. This reflects a subsidy of $____ per (unit) from federal transit assistance funds, and $ ______ per (unit) from state transit assistance funds. [OPTIONAL – The ($_____ per (unit) capital surcharge, when used in conjunction with federal transit assistance funds shall be used as local match. These funds may also be used for 100% local purchases.]
3. (Units) in excess of _______ shall require a compensation of $______ per (unit) net any passenger revenues. [OPTIONAL - Plus $ ______ per (unit) capital surcharge.]
4. All passenger revenues shall be applied to the costs of transportation services prior to application of federal transit funding and shall be considered to have expanded the level of services compared to what would be available without such resources.

4
5. The costs of services under this contract identified in E.1 above are based upon assumptions concerning costs of supplies and the existence of other transit service contracts. Should circumstances change to significantly increase costs of service under this contract, the rate of compensation may/shall be subject to renegotiation. Should circumstances change to reduce actual costs below the estimated level, any surplus funds shall be credited toward transportation services of (purchaser) during (next fiscal year).
6. Billings for services under this contract, shall be on a reimbursement basis and shall be provided to the (purchaser) on approximately the (__th) day of each month, based on services provided and the passenger revenues collected the previous month.
7. Payment of justified billings shall be due by the (__th) day of each month (or within ___ days of billing.)
F. Reporting
1. Items to report with each monthly billing based on the previous month shall be: Total number of (units) provided Total number of rides provided Total number of miles driven Total passenger revenues collected Total federal transit assistance credited Total state transit assistance credited
2. Items to report at year-end shall be: Total number of units provided Total number of rides provided Total number of miles driven Total passenger revenues collected Actual fully allocated costs of services Total federal transit assistance credited Total state transit assistance credited Total compensation billed to purchaser
Surplus/shortfall 3. Items to report on an on-going basis shall include incidents involving passengers
transported under this contract, any uses of subcontracted providers to avoid interruptions in service, and any interruption in service.
G. Entire Agreement
1. This contract contains the entire agreement between (purchaser) and (transit system). There are no other agreements or understandings, written or verbal, which shall take precedence over the items contained herein unless made a part of this contract by amendment procedure.
H. Amendments
1. Any changes to this contract must be in writing and be mutually agreed upon by both (purchaser) and (transit system). Changes must also receive the concurrence of the Iowa Department of Transportation, Office of Public Transit.

5
I. Termination
1. Cancellation of this contract may be initiated by either party through written notice to the other party at least 30 days prior to the date of cancellation.
J. Saving Clause
1. Should any provision of this contract be deemed unenforceable by a court of law, all other provisions shall remain in effect.
K. Assignability and Subcontractings
1. This contract is not assignable to any other party without the express written approval of the (purchaser), and the (transit system) with the concurrence of the Iowa Department of Transportation, Office of Public Transit.
2. No part of the transportation services described in this contract may be subcontracted by (transit system) without the express written approval of (purchaser).
3. Not withstanding the provisions in K.1. above, it is hereby agreed that (transit system) may under emergency circumstances temporarily subcontract any portion of the service if it is deemed necessary by (transit system) to avoid a service interruption. (Purchaser) shall be notified, in advance if possible, each time this provision is invoked.
ADOPTED BY THE PARTIES AS WITNESSED AND DATED BELOW, SUBJECT TO THE CONCURRENCE OF THE IOWA DEPARTMENT OF TRANSPORTATION, OFFICE OF PUBLIC TRANSIT. (If concurrence from another funding agency is also needed, that information may be added as well.) For (Purchaser): For (Transit System): _________________________________ ________________________________ Date: Date: _________________________________ ________________________________

APPENDIX E


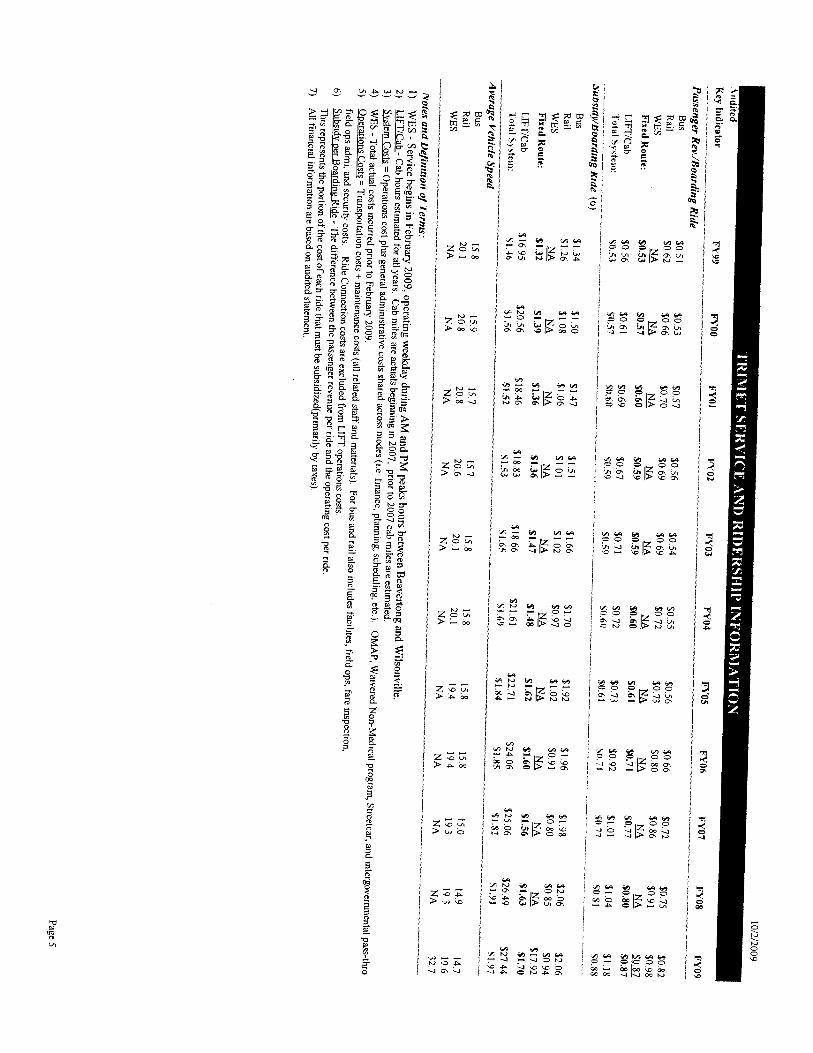

APPENDIX F

COMMUNITY TRANSPORT
AND
TAXI PROVIDER
BEST PRACTICE STANDARD
‘SERVICE AGREEMENT’
July 2008

The basis of the Best Practice Service Agreement was originally developed between South West Community Transport and Premier Cabs. This Agreement took several years in the making during which research was undertaken to ensure the Service Agreement did not knowingly breach the legalities of the NSW Taxi Industry legislation / regulations. In 2008 the Community Transport Organisation and the NSW Taxi Council joined forces with South West Community Transport and Premier Cabs to finalise the document. This Service Agreement between Taxi Providers and Community Transport groups has been endorsed by the Community Transport Organisation and the NSW Taxi Council as an example of a Best Practice Service Agreement which could be utilized by both industries in the development of future partnerships. Thank you to all involved in the making of this document. In particular
Lyn Bright – South West Community Transport Rhonda Chesterton – Premier Cabs Daryl Briggs – Premier Cabs Peter McLeod – Community Transport Organisation Howard Harrison – NSW Taxi Council Peter Ramshaw – NSW Taxi Council

COMMUNITY TRANSPORT
AND
TAXI PROVIDER
BEST PRACTICE STANDARD
‘SERVICE AGREEMENT’
JULY, 2008

Project Title PROVISION OF TAXI TRANSPORT FOR FRAIL AND RISK AGED AND OTHER PERSONS WITH DISABILITIES (INCLUDING WHEELCHAIR ACCESSIBLE TAXIS (WATS) FOR CLIENTS USING WHEELCHAIRS).
Service Agreement Description PROVISION OF TAXI TRANSPORT FOR FRAIL AND RISK AGED AND OTHER PERSONS WITH DISABILITIES (INCLUDING WHEELCHAIR ACCESSIBLE TAXIS (WATS) FOR CLIENTS USING WHEELCHAIRS).
The Principal (INSERT NAME OF COMMUNITY TRANSPORT ORGANISATION and ABN)
The Contractor (Insert Name of Taxi Network and ABN)
Contact Persons
The relevant contact persons in relation to this Service Agreement are as follows:
For the “Principal”
Name:
Telephone
Facsimile
For the “The Contractor”
Name:
Telephone
Facsimile

Table of Contents 1 PART A – THE PRINCIPAL’S REQUEST...............................................................................1
1.1 SERVICE AGREEMENT REQUIREMENTS IN BRIEF.....................................................1 1.1.1 CONFLICT OF INTEREST ..............................................................................................1
2 PART B – SPECIFICATION ......................................................................................................2 2.1 BACKGROUND...................................................................................................................2
2.1.1 HOME AND COMMUNITY CARE ..................................................................................2 2.1.2 THE PRINCIPAL..............................................................................................................2
2.2 SCOPE OF WORK................................................................................................................2 2.2.1 SERVICE AGREEMENT ..................................................................................................2 2.2.2 AREA OF PROJECTS ......................................................................................................2
2.3 SPECIAL CONDITIONS OF SERVICE AGREEMENT .....................................................3 2.3.1 GLOSSARY OF TERMS ...................................................................................................3 2.3.2 SELECTION PROCESS FOR REFERRAL OF WORK ....................................................3 2.3.3 NUMBER OF CONTRACTORS .......................................................................................3 2.3.4 ADDITIONAL CONTRACTORS AND THE PRINCIPAL ................................................3 2.3.5 DRIVER REQUIREMENTS..............................................................................................4 2.3.6 DAMAGES........................................................................................................................4 2.3.7 RESPONSIBILITY PERIODS...........................................................................................5 2.3.8 VEHICLE REQUIREMENTS ...........................................................................................5 2.3.9 SERVICE LINE.................................................................................................................5 2.3.10 MULTIPLE HACC CLIENT TRANSPORTATION ......................................................5 2.3.11 CUSTOMER SATISFACTION SURVEYING...............................................................5 2.3.12 COMPLAINTS .............................................................................................................6 2.3.13 ACCIDENTS AND INCIDENTS ..................................................................................6 2.3.14 JOB VARIATIONS .......................................................................................................6 2.3.15 NOTIFICATICATIONS................................................................................................6 2.3.16 WAITING TIME...........................................................................................................7 2.3.17 CANCELLED JOBS.....................................................................................................7 2.3.18 DUTY OF CARE..........................................................................................................7 2.3.19 COMPLIANCE WITH LEGISLATION ........................................................................8 2.3.20 CONTRACTOR BEHAVIOUR.....................................................................................8 2.3.21 PERIOD OF SERVICE AGREEMENT AND TERMINATION ....................................8 2.3.22 PERFORMANCE OF SERVICES................................................................................9 2.3.23 CLIENT CONFIDENTIALITY .....................................................................................9 2.3.24 PUBLIC DISCLOSURE...............................................................................................9 2.3.25 PRICING STRUCTURE...............................................................................................9 2.3.26 ADDITIONAL CHARGES .........................................................................................10 2.3.27 PRICE VARIATIONS .................................................................................................10 2.3.28 GOODS AND SERVICES TAX ..................................................................................10 2.3.29 ORDERS AND PAYMENT.........................................................................................11 2.3.30 SECURITY .................................................................................................................12 2.3.31 INTERNET SECURITY..............................................................................................12 2.3.32 NEGATION OF EMPLOYMENT, PARTNERSHIP OR AGENCY.............................13 2.3.33 CONTRACTOR PERSONNEL...................................................................................13 2.3.34 CONFLICT OF INTEREST .......................................................................................13 2.3.35 OFFERS OF EMPLOYMENT ...................................................................................14 2.3.36 INTELLECTUAL PROPERTY RIGHTS ....................................................................14 2.3.37 SUB-CONTRACTING................................................................................................14 2.3.38 MINIMUM STANDARDS AND CONDITIONS OF EMPLOYMENT........................14 2.3.39 INDEMNITY AND INSURANCE ...............................................................................15 2.3.40 SERVICE AGREEMENT MANAGEMENT................................................................16
3 PART C – CONTRACTOR DECLARATION ........................................................................17 3.1 CONTRACTOR DETAILS.................................................................................................17 3.2 DECLARATION.................................................................................................................18
3.2.1 Contractor Declaration ..................................................................................................18 3.2.2 Principal Declaration.....................................................................................................19
3.3 PRICING SCHEDULE .......................................................................................................20 3.3.1 METERED RATE TRIPS ................................................................................................20 3.3.2 FIXED RATE TRIPS.......................................................................................................20 3.3.3 ADDITIONAL CHARGES ..............................................................................................21 3.3.4 SETTLEMENT DISCOUNT (IF APPLICABLE) ............................................................21

1 PART A – THE PRINCIPAL’S REQUEST
1.1 SERVICE AGREEMENT REQUIREMENTS IN BRIEF
The Principal, funded under the Home and Community Care (HACC) program invites submissions from providers of taxi services to provide quality transport to HACC eligible clients.
The initial service agreement period is for 12 months from date of signing by both parties.
A full statement of the services required under the proposed contract appears in the Specification – Part B.
1.1.1 CONFLICT OF INTEREST
The Contractor must warrant that to the best of its knowledge at the date of submitting its response/signing of this Service Agreement no conflict of interest exists or is likely to arise in relation to this Service Agreement, by its employees or any sub-contractors.
If during the course of the Service Agreement period a conflict or risk of conflict of interest arises The Contractor undertakes to notify The Principal immediately in writing of that conflict or risk of conflict.
The Contractor shall use its best endeavours to ensure that any employee, agent or sub-contractor of The Contractor shall not, during the course of the Service Agreement, engage in any activity or obtain any interest likely to conflict with or restrict The Contractor in providing the Goods/Services under this service agreement and shall immediately disclose to The Principal such activity or interest.
In this clause, a conflict of interest shall include but not be limited to:
• an employee of The Contractor paying or offering to pay or provide to an employee or agent or consultant of a benefit or an employee, agent or consultant of The Principal receiving a benefit directly or indirectly from The Contractor which is intended to or which has or may have the effect of directly or indirectly influencing the implementation of this Service Agreement
• an employee of The Contractor being related to or having a close association with or influence over an employee of The Principal which may have the effect of influencing the implementation of this Service Agreement.
Page 1

2 PART B – SPECIFICATION
2.1 BACKGROUND
2.1.1 HOME AND COMMUNITY CARE
The Home and Community Care (HACC) Program is a cost-shared program between the Commonwealth and State/Territory governments. It provides funding for services that support people who live at home and whose capacity for independent living is at risk of premature or inappropriate admission to long-term residential care.
The HACC Program is a key provider of community care services to frail and risk aged people and younger people with disabilities, and their carers. For further information on HACC see http://www.dadhc.nsw.gov.au/DADHC
2.1.2 THE PRINCIPAL
(Insert brief background on the CTO organisation, how it is funded and what it does.)
For further information on The Principal see (Insert web page address if available)
2.2 SCOPE OF WORK
2.2.1 SERVICE AGREEMENT
This Service Agreement requires the transport by Taxi (vehicle or mini bus, WATs) or other vehicles with contracted driver for HACC clients
The Principal will continue to provide transport services using owned, brokered vehicles, taxis and/or vehicles with contracted driver services for frail and at risk aged and other people with disabilities. The Principal will also continue to trial other modes of transport provision where appropriate and funding sources request other transport initiatives are explored.
Frail and at risk aged and other people with disabilities, including people who use wheelchairs who are part of this Program, are referred to as ‘HACC clients’
The Principal shall batch all detailed passenger requests for transport into vehicle jobs and forward trip information to The Contractor via email or fax.
Requests are usually sent the previous day and return or outbound trips maybe forwarded no later than 15 minutes before a requested pickup.
2.2.2 AREA OF PROJECTS
The Project area covers (Insert area of coverage eg LGA areas etc)
Page 2

2.3 SPECIAL CONDITIONS OF SERVICE AGREEMENT
2.3.1 GLOSSARY OF TERMS
In the Service Agreement document the following words and expressions shall have the meanings hereby assigned to them, except where the context otherwise requires:
• ‘Contractor Personnel’ means all persons employed or subcontracted (including Bailee taxi drivers) by The Contractor on duties related to the Service Agreement.
• ‘The ‘Principal’ means (Insert name of CTO)
• ‘The Principal HACC Client’ means passenger or person travelling in the vehicle other than the driver
• ‘Employee’ to read “Bailee” where applicable
• ‘Taxi Network’ means an authorised taxi network as defined by the NSW Passenger Transport Act 1990
• ‘Transport Job’ or ‘Job’ means a job or trip ordered by The Principal with a specific authorised job number
• ‘WAT’ means Wheelchair Accessible Taxis
• ‘HACC Client’ means an eligible person assessed and approved to use this transport service via HACC Transport.
2.3.2 SELECTION PROCESS FOR REFERRAL OF WORK
The percentage of work allocated to The Contractor remains at the absolute discretion of The Principal, and will be decided on the basis of value for money including quality, with reliability, vehicle type and mode of transport required including availability taken into consideration.
2.3.3 NUMBER OF CONTRACTORS
The Principal reserves to right to appoint as many contractors including owner operator drivers as necessary to this service to ensure that the requirements of HACC clients are met.
2.3.4 ADDITIONAL CONTRACTORS AND THE PRINCIPAL
The Contractor should note that this Service Agreement shall not be exclusive. The Principal reserves the right to advertise and initiate additional transport contracts during the period of this Service Agreement.
The decision to do so remains at the absolute discretion of The Principal.
Page 3

The Principal also reserves the right at any time during this Service Agreement to operate its own transport fleet of vehicles either The Principal staff and or volunteers to transport HACC eligible clients for any purpose.
2.3.5 DRIVER REQUIREMENTS
Clients find it helpful where drivers are wearing the transport company accredited uniform and this ensures HACC clients / passengers can identify with confidence the company they are being transported with.
The Principal expects all passengers will receive a safe and stress free transportation provided in a courteous, effective and timely manner and that HACC clients will be treated respectfully and with dignity at all times.
Drivers will be required to provide client requested assistance to HACC clients. Where required the driver shall:
• escort the passenger to and from the door or handover to a named responsible person at the destination as instructed
• assist a HACC client with ingress or egress from a vehicle.
• assist with wheelchair or walking frames or other mobility equipment,
• open gates and/or doors
• assist with seatbelts or other
• as specified on the job request addressing special client needs.
Drivers are not expected to physically lift or carry HACC clients up stairs or into homes but must assist on ingress and egress of the vehicle, home and or destination where required.
Where a driver fails to provide appropriate assistance to any HACC client, and is proved to be unsatisfactory to The Principal (such as failing to hand over a dementia client to a responsible person as requested on the job under special instructions or provide assistance as requested on special instructions), it is requested that the driver be denied any further work under this contract.
If at the time of hiring a driver has doubt, for whatever reason, that the hiring cannot be completed in an appropriate manner, the driver must contact the taxi network immediately for further instruction. Any instance of this kind should be advised to The Principal for information and/or any further action.
2.3.6 DAMAGES
• Failure by to provide HACC client requested assistance,
• Failure to pickup on time without advising The Principal:
Page 4

• Failure to notify The Principal, within defined Timeframe, of inability to complete a job
Failures of this nature could lead to termination of this Service Agreement;
The Contractor should make drivers and staff aware of these damages
It shall be at the absolute discretion of The Principal to action these damages.
The Principal reserves the right to reduce allocated work to a contractor due to poor performance.
2.3.7 RESPONSIBILITY PERIODS
The taxi driver’s responsibility periods are defined as the period of time a HACC client is in their care where a duty of care applies. The duty of care is defined under the taxi driver’s responsibilities under the Passenger Transport Act and the relevant regulations and standards, or any additional special needs instructions advised in advance by The Principal which are not deemed to be unreasonable or unsafe by the taxi network or contrary to the provisions of the Passenger Transport Act 1990.
2.3.8 VEHICLE REQUIREMENTS
All passenger vehicles used to transport The Principal clients must comply with all NSW State licensing laws, acts and regulations as required by the Ministry of Transport and or the Roads and Traffic Authority. These specifications can be obtained from the relevant Departments..
2.3.9 SERVICE LINE
The Contractor will be required to allocate a telephone and fax line for job transmissions. Other methods of communicating bookings may be mutually agreed.
2.3.10 MULTIPLE HACC CLIENT TRANSPORTATION
It is envisaged economies of scale can be achieved by multiple passenger loadings for HACC clients who require transport to appointments and other community services and locations.
Drivers will be required to pick up HACC clients heading to various destinations from different locations.
2.3.11 CUSTOMER SATISFACTION SURVEYING
The Principal may from time to time negotiate with The Contractor, requesting support from The Contractor in conducting quality assurance surveys of at least 5% of HACC clients transported under this Service Agreement. The surveys shall relate to customer satisfaction and the results shall be shared between The Principal and The Contractor within one week of completion of
Page 5

the survey. The aim of such surveys shall be to plan future services and partnerships and to identify strategies for service improvements.
Release of survey information will be by mutual agreement between The Principal and The Contractor
2.3.12 COMPLAINTS
The Contractor must undertake responses to complaints created by their transport service.
The Ministry of Transport Customer Feedback Management System (CFMS) may be used. Acknowledgement of the complaint is to be forwarded to The Principal within 5 working days of the complaint being lodged. A final response, including any letters of apology, relating to the complaint must be forwarded to The Principal within 20 working days of the complaint being lodged.
The Contractor will be required to nominate a representative to be responsible for overseeing any complaint investigation and enquiries from The Principal.
2.3.13 ACCIDENTS AND INCIDENTS
The Contractor shall report any transport accident/incident involving a HACC client immediately to The Principal. As per the Accreditation Standards and Passenger Transport Act The Principal may be required to report any such accidents to the Ministry of Transport
Should there be a concern about a HACC client then it is expected the driver will report it to The Principal via The Contractor on the day of service.
Should another car be required to complete the intended journey, then The Contractor shall supply that vehicle at no additional cost to The Principal.
Should The Contractor be unable to furnish another vehicle within a 10-minute time frame of the failure, then that contractor shall advise The Principal immediately and The Principal will decide the course of action to be taken from that point on.
2.3.14 JOB VARIATIONS
Prior authorisation from The Principal shall be required for any job variations of any kind. If authorisation is not obtained, then the job will only be paid at the agreed rate.
2.3.15 NOTIFICATICATIONS
Where a job is allocated to and providing The Contractor has had the job in their possession for a minimum period of 1 hour and they cannot make the pickup within 15 minutes of the designated pickup time then that company must advise The Principal immediately
Page 6
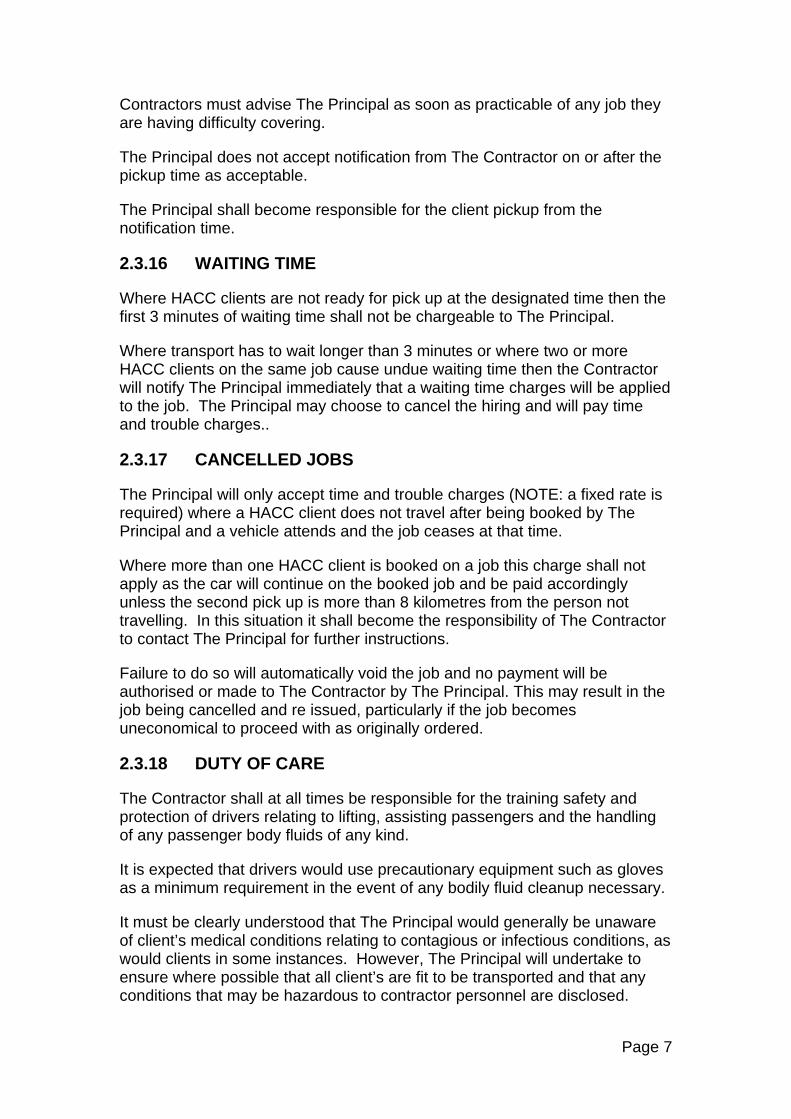
Contractors must advise The Principal as soon as practicable of any job they are having difficulty covering.
The Principal does not accept notification from The Contractor on or after the pickup time as acceptable.
The Principal shall become responsible for the client pickup from the notification time.
2.3.16 WAITING TIME
Where HACC clients are not ready for pick up at the designated time then the first 3 minutes of waiting time shall not be chargeable to The Principal.
Where transport has to wait longer than 3 minutes or where two or more HACC clients on the same job cause undue waiting time then the Contractor will notify The Principal immediately that a waiting time charges will be applied to the job. The Principal may choose to cancel the hiring and will pay time and trouble charges..
2.3.17 CANCELLED JOBS
The Principal will only accept time and trouble charges (NOTE: a fixed rate is required) where a HACC client does not travel after being booked by The Principal and a vehicle attends and the job ceases at that time.
Where more than one HACC client is booked on a job this charge shall not apply as the car will continue on the booked job and be paid accordingly unless the second pick up is more than 8 kilometres from the person not travelling. In this situation it shall become the responsibility of The Contractor to contact The Principal for further instructions.
Failure to do so will automatically void the job and no payment will be authorised or made to The Contractor by The Principal. This may result in the job being cancelled and re issued, particularly if the job becomes uneconomical to proceed with as originally ordered.
2.3.18 DUTY OF CARE
The Contractor shall at all times be responsible for the training safety and protection of drivers relating to lifting, assisting passengers and the handling of any passenger body fluids of any kind.
It is expected that drivers would use precautionary equipment such as gloves as a minimum requirement in the event of any bodily fluid cleanup necessary.
It must be clearly understood that The Principal would generally be unaware of client’s medical conditions relating to contagious or infectious conditions, as would clients in some instances. However, The Principal will undertake to ensure where possible that all client’s are fit to be transported and that any conditions that may be hazardous to contractor personnel are disclosed.
Page 7

The Principal will not accept liability for drivers contracting any condition from HACC clients or for a driver completing any other passenger assistance other than stipulated on the run sheet
It is mandatory that drivers and or The Contractor have the insurance cover to protect themselves for any situation arising whilst providing services for The Principal.
It is also a condition of this Service Agreement under duty of care provisions, that HACC eligible clients will not be loaded into a WAT by standing on the hoist platform. The only way any person may be hoist loaded into a vehicle is where they are first seated into a wheelchair and then loaded. The only exception to this condition shall be when a vehicle has been designed specifically for the loading of HACC eligible clients via standing on the hoist, where the driver rides the hoist with the client and where HACC Transport has provided approval for same to The Contractor.
2.3.19 COMPLIANCE WITH LEGISLATION
Taxis, other vehicles with contracted driver, including mini bus and WAT contractors must act within the general meaning and intention of this Service Agreement at all times and be legally covered to be able to perform work for The Principal under all New South Wales State Transport Legislations and Acts.
All drivers of taxis must hold the appropriate NSW driver’s licence and taxi driver’s authority for the type of taxi vehicle being driven.
Vehicle inspections and duty of care issues shall be adhered to at all times by taxi drivers, taxi operators and contractors. All State legal requirements for vehicle inspections shall be completed as required by the NSW State licensing authority at no cost to The Principal. Failure to do so will automatically make this Service Agreement void.
2.3.20 CONTRACTOR BEHAVIOUR
The Principal does not accept any responsibility for the actions or behaviour of The Contractor, their employees or subcontractors working under this Service Agreement.
The Principal does not accept any liability for any damage caused by accident or otherwise by The Contractor, their employees or subcontractors working under this Service Agreement.
2.3.21 PERIOD OF SERVICE AGREEMENT AND TERMINATION
The Service Agreement shall be in force for an initial period of 12 months from date of both parties signing the document or another period as may be agreed by both parties from time to time.
Page 8

The Service Agreement has a 2 x 1 year extension option that can be exercised. These options will only be exercised, at the absolute discretion of the principal in the event that
a) Funding for the Service Agreement is available and remains under existing arrangements; and
b) The Principal approves for the Service Agreement to be extended
c) Approval will be reliant on the adherence to the conditions of the Service Agreement during the previous period
Either party may terminate the Service agreement, in writing to the other party, if the other party fails to fulfil its obligations under the agreement, and such failure is not remedied within (insert number) working days of the receipt of the notice of breach or if such failure is remedied but repeated at any time after the receipt of such notice.
2.3.22 PERFORMANCE OF SERVICES
The Contractor shall perform and carry out the services at all times in a conscientious, expeditious and professional fashion. Where The Contractor or its contractor personnel is required to provide or use equipment, such equipment shall be suitable for the Services and shall be maintained by The Contractor or its contractor personnel in good and proper working conditions.
The Contractor warrants that its employees and agents are competent and have all necessary skill, training and qualifications to carry out the services in accordance with these conditions.
2.3.23 CLIENT CONFIDENTIALITY
The nature of this service is such that The Contractor and all the personnel working on projects encompassed under this Service Agreement shall be required to treat all aspects of projects, including oral as well as written material made available during the project as confidential. A breach of confidentiality shall be considered a breach of the Service Agreement and shall be grounds for termination of the Service Agreement.
2.3.24 PUBLIC DISCLOSURE
The Contractor shall not use this Service Agreement or the Principal’s name for promotional purposes, without the prior written consent of the Principal.
2.3.25 PRICING STRUCTURE
Pricing of trips shall be via the metered rate current at the time of the booking or at a contract price that may be agreed from time to time.
Page 9
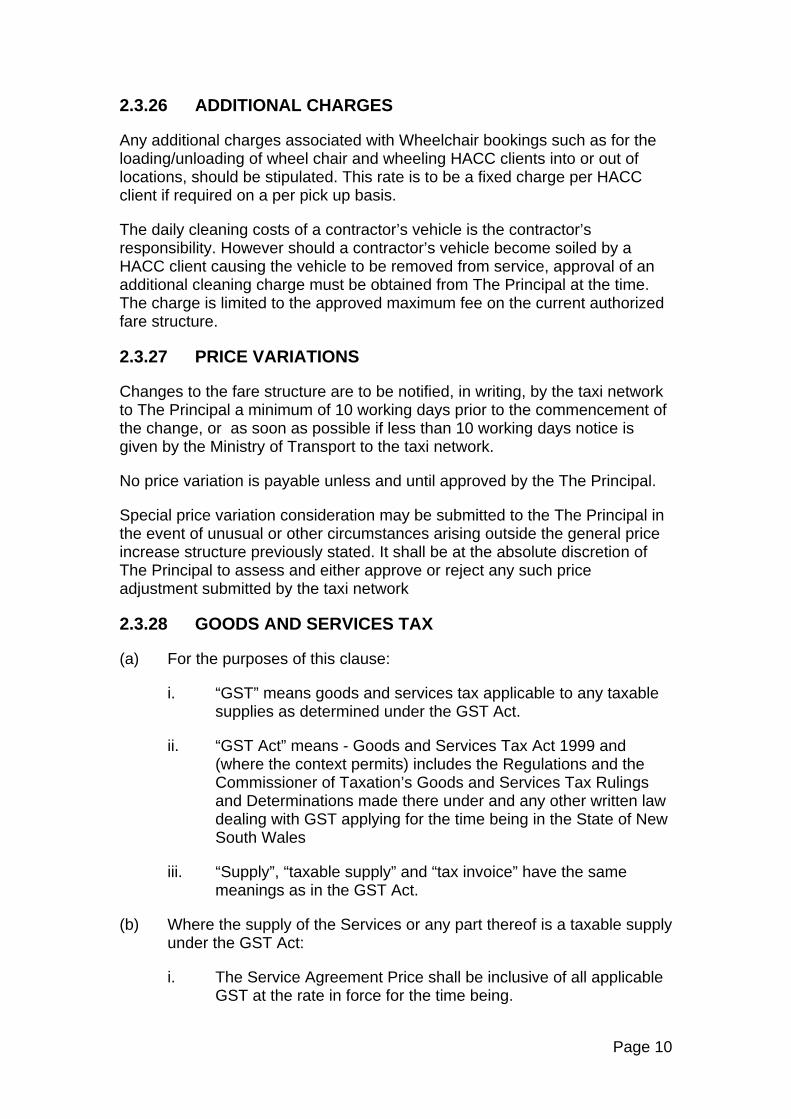
2.3.26 ADDITIONAL CHARGES
Any additional charges associated with Wheelchair bookings such as for the loading/unloading of wheel chair and wheeling HACC clients into or out of locations, should be stipulated. This rate is to be a fixed charge per HACC client if required on a per pick up basis.
The daily cleaning costs of a contractor’s vehicle is the contractor’s responsibility. However should a contractor’s vehicle become soiled by a HACC client causing the vehicle to be removed from service, approval of an additional cleaning charge must be obtained from The Principal at the time. The charge is limited to the approved maximum fee on the current authorized fare structure.
2.3.27 PRICE VARIATIONS
Changes to the fare structure are to be notified, in writing, by the taxi network to The Principal a minimum of 10 working days prior to the commencement of the change, or as soon as possible if less than 10 working days notice is given by the Ministry of Transport to the taxi network.
No price variation is payable unless and until approved by the The Principal.
Special price variation consideration may be submitted to the The Principal in the event of unusual or other circumstances arising outside the general price increase structure previously stated. It shall be at the absolute discretion of The Principal to assess and either approve or reject any such price adjustment submitted by the taxi network
2.3.28 GOODS AND SERVICES TAX
(a) For the purposes of this clause:
i. “GST” means goods and services tax applicable to any taxable supplies as determined under the GST Act.
ii. “GST Act” means - Goods and Services Tax Act 1999 and (where the context permits) includes the Regulations and the Commissioner of Taxation’s Goods and Services Tax Rulings and Determinations made there under and any other written law dealing with GST applying for the time being in the State of New South Wales
iii. “Supply”, “taxable supply” and “tax invoice” have the same meanings as in the GST Act.
(b) Where the supply of the Services or any part thereof is a taxable supply under the GST Act:
i. The Service Agreement Price shall be inclusive of all applicable GST at the rate in force for the time being.
Page 10

ii. The obligation of the Principal or the Customer to pay the Service Agreement Price or any instalment thereof, and the right of The Contractorto recover the Service Agreement Price or any instalment thereof, shall be subject to and conditional upon the prior issue by The Contractorand the prior receipt by the Principal or the Customer (as the case may be) of a tax invoice in respect of the Service Agreement Price, or the relevant instalment thereof, which complies in all respects with the GST Act.
iii. This provision applies notwithstanding any other provision of the Service Agreement or any legislation or rule of law to the contrary, but does not apply if The Contractor is not registered for GST, and is not required to be so registered, under the GST Act.
(b) The Contractor shall at all times observe, perform and comply with all applicable provisions of the GST Act relative to the supply of the Services under the Service Agreement.
2.3.29 ORDERS AND PAYMENT
Contractors will be required to collect the first part of the transport fare, as stated on The Principal booking request from the HACC Client, which will be a set amount. The balance of the fare shall be billed to The Principal monthly by The Contractor.
Trip payments must be submitted within two (2) months of the service being provided. Trip payments submitted later that two (2) months of the service provision may not be recognised for payment.
Hard copy invoices sent for payment must include:
• The Principal authorised job number,
• Job date,
• Job time,
• name of HACC Client(s),
• cost of the job plus any additional costs associated with that job.
• Details must also be provided of monies collected from the HACC Client on each respective job.
Invoicing methods, including the use of third party invoicing services, and credit arrangements including any penalties for late payment are to be agreed by both parties before commencement of any agreement.
Page 11
2.3.30 SECURITY
The Contractor shall, when attending the Principal’s, or it’s HACC Client’s, premises or facilities, comply with all reasonable directions and procedures relating to occupational health (including the Principal’s smoke free work place policy) and safety and security in effect for those premises or in regard to those facilities, as notified by the Principal.
At no time shall any contracted staff go back to a HACC Client relating to a transport journey already undertaken and ordered by The Principal without the written permission of the staff of The Principal.
Neither shall Taxi nor vehicle with driver contract staff approach HACC Clients known to them from The Principal unless that HACC Client requests their attendance or presence.
2.3.31 INTERNET SECURITY
When the services under this Service Agreement require a computer system, The Contractor is required to maintain the adequacy of the security of their online computer system.
Adequate security should address the following:
(a) integrity of data – security measures designed to ensure that data transmitted or stored electronically is neither accidentally nor deliberately altered, defaced or lost;
(b) confidentiality – the characteristic of data and information being disclosed only to authorised persons, entities and processes;
(c) authentication – security measures designed to establish the validity of a transmission, message, or originator or a means of verifying an individual’s eligibility to receive specific categories of information; and
(d) availability of service – the characteristic of data, information and information systems being accessible and usable on a timely basis in the required manner.
Technology and management control mechanisms may include but not be limited to the following:
(a) anti virus tools;
(b) firewalls;
(c) back-ups;
(d) encryption/SSL;
(e) password controls;
Page 12

(f) business continuity plans;
(g) electronic ID’s; and
(h) change controls.
2.3.32 NEGATION OF EMPLOYMENT, PARTNERSHIP OR AGENCY
The Contractor shall not represent itself, and shall ensure that its employees do not represent themselves as being employees, partners or agents of the SWCT.
The Contractor shall not by virtue of this Service Agreement be or for any purpose be deemed to be an employee, partner or agent of the The Principal.
2.3.33 CONTRACTOR PERSONNEL
With the exception of taxi drivers, The Principal and The Contractor shall agree on the names and roles of the personnel who will perform all or some of the services under the Service Agreement.
The Contractor agrees that the identity of the taxi driver will be known by The Contractor and pursuant to privacy laws, will be available at the request of The Principal
The Contractor warrants that its employees, subcontractors and agents have the necessary skills, training and qualifications to provide the services requested by The Principal for HACC Clients in relation to assistance and vehicle operations required in this Service Agreement for the vehicle with driver services.
The Contractor warrants that its employees, subcontractors and agents will be skilled and trained in manual handling passenger assistance techniques.
Operators of WATs must be fully trained in client assistance and manual handling including all relevant safety procedures associated with the operation of a WAT’ vehicle including Wheel Chair loading and anchorage devices.
The Contractor is also required to ensure drivers and administration staff are fully aware of the contents, obligations and including penalty’s that do apply to this Service Agreement and contractor providing car with driver services to The Principal.
2.3.34 CONFLICT OF INTEREST
The Contractor warrants that, at the date of signing this Service Agreement, no conflict of interest exists or is likely to arise in the performance of its obligations under this Service Agreement. If, during the term of this Service Agreement, a conflict or risk of conflict of interest arises, The Contractor undertakes to notify the Principal immediately in writing of that conflict or risk.
Page 13

The existence of, or failure to declare such conflict of interest will entitle The Principal to terminate the Service Agreement.
2.3.35 OFFERS OF EMPLOYMENT
If The Contractor is approached by an employee of The Principal involved in the establishment or management of the Service Agreement seeking employment during the Service Agreement period, The Contractor shall promptly declare to The Principal that a potential conflict of interest has arisen.
Should The Contractor consider it has bona fide reasons for dealing with an employee of The Principal involved in the establishment or management of the Service Agreement during the Service Agreement period it shall obtain written approval from The Principal before proceeding with any approach or negotiation.
2.3.36 INTELLECTUAL PROPERTY RIGHTS
The title, copyright and all other rights to the intellectual property in and to all documents, photographs, drawings, pictures, designs, films, slides, video tapes, audio tapes, objects, displays and other materials of whatsoever kind produced, created, designed, devised or made by, or on behalf of The Contractor for the specific purpose only of complying with the requirements of this Service Agreement shall forthwith rest with The Principal.
2.3.37 SUB-CONTRACTING
Work in respect of this Service Agreement shall not be sub-contracted, in whole or in part, without the prior written approval of The Principal.
Any approval to engage a sub-Contractor to provide any part of the services required under this Service Agreement shall not relieve The Contractor from any of the liabilities or obligations under this Service Agreement. The Contractor shall be responsible for the work of the sub-Contractor or any employee or agent of the sub-Contractor and guarantee that all goods or services provided by the sub-Contractor and furnished under the Contract shall be free from deficiencies in design, performance, materials and workmanship.
2.3.38 MINIMUM STANDARDS AND CONDITIONS OF EMPLOYMENT
With respect to all work done in New South Wales under the Service Agreement The Contractor shall:
• In so far as The Contractor employees are engaged in the provision of the services pursuant to the Service Agreement, the remuneration and terms of employment of each employee for the duration of the Service Agreement will be consistent with the remuneration and terms of employment that reflect the industry standard as expressed in awards
Page 14

and agreements (including the Taxi Industry (Contract Drivers) Contract Determination 1984) and any code of practice that may apply to a particular industry; and
• If The Contractor enters into any contract with a third party in relation to the provision of the service by The Contractor pursuant to the Service Agreement (“Sub-contract”), The Contractor shall ensure that it is a term of the sub-contract that the remuneration and terms of employment of any employee employed by a third party for the performance of the sub-contract will, for the duration of the sub-contract, be consistent with the remuneration and terms of employment that reflect the industry standard as expressed in awards and agreements (including the Taxi Industry (Contract Drivers) Contract Determination 1984) and any code of practice that may apply to a particular industry.
Failure by The Contractor to comply with this requirement shall entitle The Principal by notice in writing to The Contractor to forthwith terminate the Service Agreement, but without prejudice to any other rights or remedies of The Principal.
2.3.39 INDEMNITY AND INSURANCE
The Contractor shall ensure that the Network and, where applicable its Contractor Personnel, arrange and maintain insurance policies to the satisfaction of The Principal to cover its liabilities to The Principal as follows:.
• a policy of Public Liability Insurance for a sum of not less than $10,000,000.
• a policy of Workers Compensation insurance in accordance with the requirements of the Act where applicable.
• a policy of Comprehensive Motor Vehicle Insurance for vehicles to be used on Service Agreement.
It is the responsibility of The Contractor to ensure that all insurance policies remain valid for the duration of the initial Service Agreement term and any extension periods.
The Contractor shall produce evidence of compliance with the insurance requirements to the Principal within a reasonable time upon request.
Page 15

2.3.40 SERVICE AGREEMENT MANAGEMENT
2.3.40.1 The Principal’s Service Agreement Manager The Executive Officer of The Principal will manage the Service Agreement:
Name: Insert details,
Telephone:
Facsimile:
Email: Insert email address
2.3.40.2 Contractor Representative The Contractor shall nominate a senior staff member as The Contractor Representative. The role of The Contractor Representative will be to:
(a) act as the initial point of contact in relation to any Service Agreement Management issues required by The Principal; and
(b) attend meetings as required, in relation to any other issue affecting this Service Agreement and its operation.
2.3.40.3 Taxi Network Records The Contractor shall be required to:
(a) Maintain records of services provided under this Service Agreement; and
(b) Make this information available to The Principal within a reasonable time upon request.
2.3.40.4 Performance Records The Principal will maintain appropriate records monitoring Contractor performance. The Principal shall call upon The Contractor to explain any instances of unsatisfactory performance. Unsatisfactory performance includes, but is not limited to, late delivery against agreed timeframes or frequent rejection of orders. Unsatisfactory performance may lead to termination of the contract in addition to any other rights available to The Principal under the Conditions of Contract.
Page 16

3 PART C – CONTRACTOR DECLARATION
3.1 CONTRACTOR DETAILS
CONTRACTOR: (identity of the legal entity that will enter into the contract with The Principal)
FULL LEGAL ENTITY [NAME]:.......................................................................
TRADING OR BUSINESS NAME...................................................................
REGISTERED OFFICE: .................................................................................
[PHYSICAL/MAILING] ....................................................................................
ABN NUMBER................................................................................................
REGISTERED FOR GST ...............................................................................
BUSINESS TELEPHONE & FACSIMILE NUMBERS .....................................
........................................................................................................................
E-MAIL ADDRESS:.........................................................................................
WEB PAGE ADDRESS: .................................................................................
CONTACT PERSON ......................................................................................
NAME: ............................................................................................................
POSITION:......................................................................................................
TELEPHONE:………………………...MOBILE PHONE:..................................
FACSIMILE: ....................................................................................................
E-MAIL:...........................................................................................................
CORPORATE STATUS: Please Tick
SOLE TRADER • PARTNERSHIP • Attach all partners’ names & partnership agreement
COMPANY Provide ACN or other entity identifier TRUST • Attach a copy of the trust deed. JOINT VENTURE, CONSORTIUM, ETC Attach details including any agreements OTHER • Attach details.
Page 17

3.2 DECLARATION
3.2.1 Contractor Declaration
I / We offer to perform the work under the service agreement for the prices stated in the attached Price Schedule in accordance with and subject to the conditions of the Service Agreement, the Specifications, Drawings (if any) and any other documents I / We have examined and agreed.
SIGNED BY THE CONTRACTOR [Authorised Person]
SIGNATURE:______________________________________________
DATE; ________/_____/________________________________
FULL NAME:______________________________________________
[Please Print Clearly]
POSITION:_______________________________________________
ADDRESS: ______________________________________________
___________________________________________________
__________________________________________________
WITNESS
SIGNATURE:_____________________________________________
DATE: __________/_____/_________________________________
FULL NAME:______________________________________________
[Please Print Clearly]
OCCUPATION:____________________________________________
ADDRESS:_______________________________________________
___________________________________________________
___________________________________________________
Page 18

3.2.2 Principal Declaration
I/We agree to accept the offer to perform work and other conditions required by the Contractor as outlined in the service agreement.
SIGNED BY THE PRINCIPAL [Authorised Person]
SIGNATURE: ______________________________________
DATE; _______/_____/_________________________
FULL NAME: ______________________________________
[Please Print Clearly]
POSITION: ______________________________________
ADDRESS: ______________________________________
______________________________________
______________________________________
WITNESS
SIGNATURE: ______________________________________
DATE: ___/_____/_____________________________
FULL NAME: ______________________________________
[Please Print Clearly]
OCCUPATION: _______________________________________
ADDRESS: _______________________________________
________________________________________
________________________________________
Page 19

3.3 PRICING SCHEDULE
NOTE; All charges must be submitted on service agreement documents, any additional charges requested at a later date may not be accepted by the Principal
3.3.1 METERED RATE TRIPS
The maximum fares authorised for the (insert Transport District details] effective (insert date) are as follows:
Rate per Minute for authorised
waiting time
Hiring ChargeRate per Kilometre
Time (Flagfall)
Booking Fee
6am to 10pm $x.xx $x.xx xx.x cents $xx.xx
10pm to 6 am $x.xx +20% $x.xx xx.x cents $xx.xx
Other (specifiy)
3.3.2 FIXED RATE TRIPS
[Attach Details]
Page 20

Page 21
3.3.3 ADDITIONAL CHARGES
Taxi Car
WATs Vehicle with Driver
Other (please explain)
Other (please explain)
Time and Trouble (on arrival for a passenger not travelling (fixed price) when job ceases at pick up point)
$ $ $ $ $
Waiting time (cost per minute after 3 minutes.)
$ $ $ $ $
Cleaning of vehicle (cost per each 15 minutes, including any down time)
$ $ $ $ $
WAT Charge (Fee per Wheelchair hoist loading/unloading/wheeling in/out)
$ N/A $ $ $ $
Remote Area: (Any additional charges requested (provide details)
$ $ $ $ $
Any other additional charges (specify charge and include details)
$ $ $ $ $
3.3.4 SETTLEMENT DISCOUNT (IF APPLICABLE)
A discount of (Insert percentage) % is offered for payments made within (insert no. of days) days of rendering of the account. Date of rendering is the date upon which the correct account [accompanied by all necessary documents proving delivery] is received by the Officer nominated for that purpose in the Service Agreement or order. Payment will be deemed to have been made on the date the cheque is drawn by The Principal and provided it is cleared within normal banking clearance schedules.

APPENDIX G