PACKER TEST - SINGLE BH01€¦ · PACKER TEST - SINGLE Test Method British Standard 5930: 1981...
160
PACKER TEST - SINGLE Test Method British Standard 5930: 1981 "Code of Practice for Site Investigations" Part 21.5 Packer Test Depth: 12.5 to 21 Client: Auckland Council Project: Hackett Diversion - St Mary's Bay CSO Job No. 255303 Hole Packer: Depth, D: (m bgl) 21.00 D Packer Model: Boyart Longyear Cased to: (m bgl) 1.80 (NW / HW / PW) Packer Type: Pneumatic (USE nitrogen, NO CO2 or oxygen) Flowmeter calibration No. 879553/13 Test Section Packer Inflation Pressure: 150 (PSI) Diameter (dia): (m bgl) HQ3 (NQ3 / HQ3 / PQ3) (driller to determine inflation pressure according to vendor instructions) From, (A): (m bgl) 12.50 A SKETCH OF TEST ARRANGEMENT To, (B): (m bgl) 21.00 B dia Midpoint, (C) = (A+B)/2: (m bgl) 16.75 C Gauge height, G Groundwater Depth, (SWL): (m bgl) 5.34 SWL W SWL Date: DD-MM 2/05/2017 SWL D SWL Time: HH:mm 7:30:00 AM Static Head Gauge Height, (GH): (m agl) 0.5 GH Test Section Static Head, SH=(SWL+GH) x g kPa 57.29 SH Hose length from Gauge to packer head m (needed for head loss calculations back in office - high flow rates only) Height to gasket at top of rods (RH): (m agl( 1.72 RH Max Allowable Gauge Pressure Maximum allowable pressure (MAP) = 11.3kPa x (A) kPa 135.6 MAP Pump max pressure (from driller) kPa ok CHECK: pump capability >= MAP prior to starting test Hose length pump to gauge m (needed for head loss calculations back in office - high flow rates only) Maximum allowable gauge pressure (MAGP) = MAP - SH kPa 78.31 MAGP Test Pressures Number of increments (N_Stage); (typically use 3) n 3 N_STAGE Gauge pressure increment, = MAGP / N_Stage kPa 35 P_INC Stage duration (consists of 3 equal duration sub-stages) min 15 stage duration (typically 15min, consisting of three 5min substages) Packer seated in landing ring test Water drop noted in broken rods either (Y or N) Drop below top of rods mm NOTE: Fill rods to overflowing prior to test Test duration min Time taken to drop Pressure disipation test Bypass backflow pressure (intantaneous) kPa bypass flow immediately after last test cycle and record instanteous back pressure Duration to dissipation to zero gauge pressure min Recovery period (1) If fuild returns via casing during test (indicating bypass /poor seal) , record flow rate during each corresponding test substage. For example: 2min:45secs to fill 22.5L bucket (2) No need to carry out rod leakage tests L2 and L3 if L1 shows no flow (ie. No rod leakage) (3) 1 psi = 6.8948 kPa = 0.06895 bar; use kPa if possible (4) v7.1 - 20170602JME System leakage from gasket recorded when notedand has been substracted from water take from gauge to give total water take for each recording interval (refer to tabulated data sheet) Comments: BH01 Time: Date: 02/05/2017 Tested by: BGW
Transcript of PACKER TEST - SINGLE BH01€¦ · PACKER TEST - SINGLE Test Method British Standard 5930: 1981...

PACKER TEST - SINGLE Test Method British Standard 5930: 1981 "Code of Practice for Site Investigations" Part 21.5 Packer Test Depth: 12.5 to 21
Client: Auckland Council
Project: Hackett Diversion - St Mary's Bay CSO
Job No. 255303
Hole Packer:Depth, D: (m bgl) 21.00 D Packer Model: Boyart Longyear
Cased to: (m bgl) 1.80 (NW / HW / PW) Packer Type: Pneumatic (USE nitrogen, NO CO2 or oxygen)
Flowmeter calibration No. 879553/13
Test Section Packer Inflation Pressure: 150 (PSI)Diameter (dia): (m bgl) HQ3 (NQ3 / HQ3 / PQ3) (driller to determine inflation pressure according to vendor instructions)From, (A): (m bgl) 12.50 A SKETCH OF TEST ARRANGEMENTTo, (B): (m bgl) 21.00 B dia
Midpoint, (C) = (A+B)/2: (m bgl) 16.75 C
Gauge height, G
Groundwater
Depth, (SWL): (m bgl) 5.34 SWL W
SWL Date: DD-MM 2/05/2017 SWL D
SWL Time: HH:mm 7:30:00 AM
Static Head
Gauge Height, (GH): (m agl) 0.5 GH Test Section
Static Head, SH=(SWL+GH) x g kPa 57.29 SH
Hose length from Gauge to packer head m (needed for head loss calculations back in office - high flow rates only)
Height to gasket at top of rods (RH): (m agl( 1.72 RH
Max Allowable Gauge Pressure
Maximum allowable pressure (MAP) = 11.3kPa x (A) kPa 135.6 MAP
Pump max pressure (from driller) kPa ok CHECK: pump capability >= MAP prior to starting test
Hose length pump to gauge m (needed for head loss calculations back in office - high flow rates only)
Maximum allowable gauge pressure (MAGP) = MAP - SH kPa 78.31 MAGP
Test Pressures
Number of increments (N_Stage); (typically use 3) n 3 N_STAGE
Gauge pressure increment, = MAGP / N_Stage kPa 35 P_INC
Stage duration (consists of 3 equal duration sub-stages) min 15 stage duration (typically 15min, consisting of three 5min substages)
Packer seated in landing ring test
Water drop noted in broken rods either (Y or N)
Drop below top of rods mm NOTE: Fill rods to overflowing prior to test
Test duration min Time taken to drop
Pressure disipation test
Bypass backflow pressure (intantaneous) kPa bypass flow immediately after last test cycle and record instanteous back pressure
Duration to dissipation to zero gauge pressure min Recovery period
(1) If fuild returns via casing during test (indicating bypass /poor seal) , record flow rate during each corresponding test substage. For example: 2min:45secs to fill 22.5L bucket(2) No need to carry out rod leakage tests L2 and L3 if L1 shows no flow (ie. No rod leakage)(3) 1 psi = 6.8948 kPa = 0.06895 bar; use kPa if possible(4)
v7.1 - 20170602JME
System leakage from gasket recorded when notedand has been substracted from water take from gauge to give total water take for each recording interval (refer to tabulated data sheet)
Comments:
BH01
Time:
Date: 02/05/2017
Tested by: BGW

PACKER TEST - SINGLE
Test Method British Standard 5930: 1981 "Code of Practice for Site Investigations" Part 21.5 Packer Test Depth: 12.5 to 21.0
Job No. 255303
Stag
e Target Duration (min) Pressure Increment
Target Gauge Pressure (kPa / psi)
Actual Gauge Pressure (kPa / psi) Duration (min) Gauge Start (Litres) Gauge End (Litres) Leakage Adjustment
L1 5 3 P_INC x 3Rod leakage test at P_INC x 3
L2 5 2 P_INC x 2Rod leakage test at P_INC x 2
L3 5 1 P_INC x 1Rod leakage test at P_INC x 1
1a 5 1 5 5 5 min 8693.3 8728.0 0.8
1b 5 1 5 5 5 min 8728.0 8842.5 0.8
1c 5 1 5 5 5 min 8842.5 8967.0 0.8
2a 5 2 10 10 5 min 9010.0 9159.3 1.0
2b 5 2 10 10 5 min 9159.3 9319.6 1.0
2c 5 2 10 10 5 min 9319.6 9469.8 1.0
3a 5 3 15 15 5 min 9515.5 9795.1 1.5
3b 5 3 15 15 5 min 9795.1 9876.8 1.5
3c 5 3 15 15 5 min 9876.8 10056.9 1.5
4a 5 2 10 10 5 min 10100.0 10254.9 1.0
4b 5 2 10 10 5 min 10254.9 10408.3 1.0
4c 5 2 10 10 5 min 10408.3 10562.2 1.0
5a 5 1 5 5 5 min 10600.0 10730.6 0.5
5b 5 1 5 5 5 min 10730.6 10861.7 0.5
5c 5 1 5 5 5 min 10861.7 10992.9 0.5
123.7
BH01
Date / Time:
Test Records
Total Water Take (per 5 mins) Notes
33.9
113.7
150 mL/min leakage from gasket
'
'
130.7
148.3
159.3
149.2
278.1
80.2
178.6
153.9
152.4
152.9
130.1
130.6
200 mL/min leakage from gasket
'
100 mL/min leakage from gasket
'
'
300 mL/min leakage from gasket
'
'
200 mL/min leakage from gasket
'
'
'

PACKER TEST - SINGLE Test Method British Standard 5930: 1981 "Code of Practice for Site Investigations" Part 21.5 Packer Test Depth: 29.15 to 34.5
Client: Auckland Council
Project: Hackett Diversion - St Mary's Bay CSO
Job No. 255303
Hole Packer:Depth, D: (m bgl) 34.50 D Packer Model: Boyart Longyear
Cased to: (m bgl) 5.25 (HW) Packer Type: Pneumatic (USE nitrogen, NO CO2 or oxygen)
Flowmeter calibration No. 879553/13
Test Section Packer Inflation Pressure: 150 (PSI)Diameter (dia): (m bgl) HQ3 (NQ3 / HQ3 / PQ3) (driller to determine inflation pressure according to vendor instructions)From, (A): (m bgl) 29.15 A SKETCH OF TEST ARRANGEMENTTo, (B): (m bgl) 34.50 B dia
Midpoint, (C) = (A+B)/2: (m bgl) 32.00 C
Gauge height, G
Groundwater
Depth, (SWL): (m bgl) 11.94 SWL W
SWL Date: DD-MM 3/05/2017 SWL D
SWL Time: HH:mm 9:40:00 AM
Static Head
Gauge Height, (GH): (m agl) 0.5 GH Test Section
Static Head, SH=(SWL+GH) x g kPa 122.04 SH
Hose length from Gauge to packer head m (needed for head loss calculations back in office - high flow rates only)
Height to gasket at top of rods (RH): (m agl( 1.60 RH
Max Allowable Gauge Pressure
Maximum allowable pressure (MAP) = 11.3kPa x (A) kPa 333.4 MAP
Pump max pressure (from driller) kPa ok CHECK: pump capability >= MAP prior to starting test
Hose length pump to gauge m (needed for head loss calculations back in office - high flow rates only)
Maximum allowable gauge pressure (MAGP) = MAP - SH kPa 211.31 MAGP 30 PSI
Test Pressures
Number of increments (N_Stage); (typically use 3) n 3 N_STAGE
Gauge pressure increment, = MAGP / N_Stage kPa 70 P_INC 10 PSIStage duration (consists of 3 equal duration sub-stages) min 5 stage duration (typically 15min, consisting of three 5min substages)
Packer seated in landing ring test
Water drop noted in broken rods either (Y or N)
Drop below top of rods mm NOTE: Fill rods to overflowing prior to test
Test duration min Time taken to drop
Pressure disipation test
Bypass backflow pressure (intantaneous) kPa bypass flow immediately after last test cycle and record instanteous back pressure
Duration to dissipation to zero gauge pressure min Recovery period
(1) If fuild returns via casing during test (indicating bypass /poor seal) , record flow rate during each corresponding test substage. For example: 2min:45secs to fill 22.5L bucket(2) No need to carry out rod leakage tests L2 and L3 if L1 shows no flow (ie. No rod leakage)(3) 1 psi = 6.8948 kPa = 0.06895 bar; use kPa if possible(4)
(5) Groundwater recorded during drilling when hole depth 25.5m
Test pressures 10/20/30/20/10 PSI
v7.1 - 20170602JME
System leakage from gasket recorded when notedand has been substracted from water take from gauge to give total water take for each recording interval (refer to tabulated data sheet)
Comments:
BH01
Time:
Date: 02/05/2017
Tested by: BGW

PACKER TEST - SINGLE
Test Method British Standard 5930: 1981 "Code of Practice for Site Investigations" Part 21.5 Packer Test Depth: 29.15 to 34.5
Job No. 255303
Stag
e Target Duration (min) Pressure Increment
Target Gauge Pressure (kPa / psi)
Actual Gauge Pressure (kPa / psi) Duration (min) Gauge Start (Litres) Gauge End (Litres) Leakage Adjustment
L1 5 3 P_INC x 3Rod leakage test at P_INC x 3
L2 5 2 P_INC x 2Rod leakage test at P_INC x 2
L3 5 1 P_INC x 1Rod leakage test at P_INC x 1
1a 5 1 P_INC x 1 10 5 min 11038.3 11047.6 0.5
1b 5 1 P_INC x 1 10 5 min 11047.6 11056.7 0.5
1c 5 1 P_INC x 1 10 5 min 11056.7 11065.7 0.5
2a 5 2 P_INC x 2 20 5 min 11068.0 11081.9 1.0
2b 5 2 P_INC x 2 20 5 min 11081.9 11095.5 1.0
2c 5 2 P_INC x 2 20 5 min 11095.5 11108.8 1.0
3a 5 3 P_INC x 3 30 5 min 11115.5 11134.5 1.5
3b 5 3 P_INC x 3 30 5 min 11134.5 11153.2 1.5
3c 5 3 P_INC x 3 30 5 min 11153.2 11171.7 1.5
4a 5 2 P_INC x 2 20 5 min 11174.5 11187.6 1.0
4b 5 2 P_INC x 2 20 5 min 11187.6 11200.7 1.0
4c 5 2 P_INC x 2 20 5 min 11200.7 11214.2 1.0
5a 5 1 P_INC x 1 10 5 min 11215.5 11223.8
5b 5 1 P_INC x 1 10 5 min 11223.8 11232.6
5c 5 1 P_INC x 1 10 5 min 11232.6 11241.1
8.5
BH01
Date / Time: 03/05/2017 09:40am
Test Records
Total Water Take (per 5 mins) Notes
8.8
8.6
100 mL/min leakage from gasket
'
'
12.9
12.6
12.3
17.5
17.2
17.0
12.1
12.1
12.5
200 mL/min leakage from gasket
'
leakage not recorded
'
'
'
'
'
200 mL/min leakage from gasket
'
'
300 mL/min leakage from gasket

PACKER TEST - SINGLE Test Method British Standard 5930: 1981 "Code of Practice for Site Investigations" Part 21.5 Packer Test Depth: 9.75 to 15.0
Client: Auckland Council
Project: Hackett Diversion - St Mary's Bay CSO
Job No. 255303
Hole Packer:Depth, D: (m bgl) 15.00 D Packer Model: Boyart Longyear
Cased to: (m bgl) 3.70 (HW) Packer Type: Pneumatic (USE nitrogen, NO CO2 or oxygen)
Flowmeter calibration No. 879553/13
Test Section Packer Inflation Pressure: 150 (PSI)Diameter (dia): (m bgl) HQ3 (NQ3 / HQ3 / PQ3) (driller to determine inflation pressure according to vendor instructions)From, (A): (m bgl) 9.75 A SKETCH OF TEST ARRANGEMENTTo, (B): (m bgl) 15.00 B dia
Midpoint, (C) = (A+B)/2: (m bgl) 12.375 C
Gauge height, G
Groundwater
Depth, (SWL): (m bgl) SWL W
SWL Date: DD-MM 9/05/2017 SWL D
SWL Time: HH:mm
Static Head
Gauge Height, (GH): (m agl) 0.5 GH Test Section
Static Head, SH=(SWL+GH) x g kPa 15.00 SH
Hose length from Gauge to packer head m (needed for head loss calculations back in office - high flow rates only)
Height to gasket at top of rods (RH): (m agl( 1.45 RH
Max Allowable Gauge Pressure
Maximum allowable pressure (MAP) = 11.3kPa x (A) kPa 110.0 MAP
Pump max pressure (from driller) kPa ok CHECK: pump capability >= MAP prior to starting test
Hose length pump to gauge m (needed for head loss calculations back in office - high flow rates only)
Maximum allowable gauge pressure (MAGP) = MAP - SH kPa 95.00 MAGP 15 PSI
Test Pressures
Number of increments (N_Stage); (typically use 3) n 3 N_STAGE
Gauge pressure increment, = MAGP / N_Stage kPa P_INC 5 PSIStage duration (consists of 3 equal duration sub-stages) min 15 stage duration (typically 15min, consisting of three 5min substages)
Packer seated in landing ring test
Water drop noted in broken rods either (Y or N)
Drop below top of rods mm NOTE: Fill rods to overflowing prior to test
Test duration min Time taken to drop
Pressure disipation test
Bypass backflow pressure (intantaneous) kPa bypass flow immediately after last test cycle and record instanteous back pressure
Duration to dissipation to zero gauge pressure min Recovery period
(1) If fuild returns via casing during test (indicating bypass /poor seal) , record flow rate during each corresponding test substage. For example: 2min:45secs to fill 22.5L bucket(2) No need to carry out rod leakage tests L2 and L3 if L1 shows no flow (ie. No rod leakage)(3) 1 psi = 6.8948 kPa = 0.06895 bar; use kPa if possible(4)
(5)
Test pressures 10/20/30/20/10 PSI
v7.1 - 20170602JME
Noted groundwater of 0.1m agl; used conservative groundwater level of 1m bgl for pressure calculation.
System leakage from gasket recorded when notedand has been substracted from water take from gauge to give total water take for each recording interval (refer to tabulated data sheet)
Comments:
BH04
Time: 09:30am
Date: 09/05/2017
Tested by: JME / Justin

PACKER TEST - SINGLE
Test Method British Standard 5930: 1981 "Code of Practice for Site Investigations" Part 21.5 Packer Test Depth: 9.75 to 15.0 EOBH
Job No. 255303
Stag
e Target Duration (min) Pressure Increment
Target Gauge Pressure (kPa / psi)
Actual Gauge Pressure (kPa / psi) Duration (min) Gauge Start (Litres) Gauge End (Litres) Leakage Adjustment
L1 5 3 P_INC x 3Rod leakage test at P_INC x 3
L2 5 2 P_INC x 2Rod leakage test at P_INC x 2
L3 5 1 P_INC x 1Rod leakage test at P_INC x 1
1a 5 1 5 5 5 min 12773.0 12782.3 1.0
1b 5 1 5 5 5 min 12782.3 12790.4 1.0
1c 5 1 5 5 5 min 12790.4 12798.1 1.0
2a 5 2 10 10 5 min 12802.5 12817.7 1.5
2b 5 2 10 10 5 min 12817.7 12832.3 1.5
2c 5 2 10 10 5 min 12832.3 12846.3 1.5
3a 5 3 15 15 5 min 12853.0 12878.9 6.0
3b 5 3 15 15 5 min 12878.9 12904.0 6.0
3c 5 3 15 15 5 min 12904.0 12925.8 6.0
4a 5 2 10 10 5 min 12926.1 12938.4 6.0
4b 5 2 10 10 5 min 12938.4 12956.4 6.0
4c 5 2 10 10 5 min 12956.4 12965.3 6.0
5a 5 1 5 5 5 min 12968.5 12977.8 6.0
5b 5 1 5 5 5 min 12977.8 12987.2 6.0
5c 5 1 5 5 5 min 12987.2 12996.4 6.0 3.2
13.7
13.1
12.5
19.9
19.1
15.8
6.3
12.0
2.9
3.3
3.4
6.7
BH04
Date / Time: 09/05/2017 09:30am
Test Records
Total Water Take (per 5 mins) Notes
200 mL/min leakage from gasket
'
'
8.3
7.1
300 mL/min leakage from gasket
'
'
1.2 L/min leakage from gasket
'
'
'
'
'
'
'
'
PACKER TEST - SINGLE Test Method British Standard 5930: 1981 "Code of Practice for Site Investigations" Part 21.5 Packer Test Depth: 18.85 to 25.15
Client: Auckland Council
Project: Hackett Diversion - St Mary's Bay CSO
Job No. 255303
Hole Packer:Depth, D: (m bgl) 25.15 D Packer Model: Boyart Longyear
Cased to: (m bgl) 2.30 (HW) Packer Type: Pneumatic (USE nitrogen, NO CO2 or oxygen)
Flowmeter calibration No. 879553/13
Test Section Packer Inflation Pressure: 150 (PSI)Diameter (dia): (m bgl) HQ3 (NQ3 / HQ3 / PQ3) (driller to determine inflation pressure according to vendor instructions)From, (A): (m bgl) 18.85 A SKETCH OF TEST ARRANGEMENTTo, (B): (m bgl) 25.15 B dia
Midpoint, (C) = (A+B)/2: (m bgl) 22.00 C
Gauge height, G
Groundwater
Depth, (SWL): (m bgl) 3.11 SWL W
SWL Date: DD-MM 28/04/2017 SWL D
SWL Time: HH:mm 8:00:00 AM
Static Head
Gauge Height, (GH): (m agl) 0.515 GH Test Section
Static Head, SH=(SWL+GH) x g kPa 36.00 SH
Hose length from Gauge to packer head m (needed for head loss calculations back in office - high flow rates only)
Height to gasket at top of rods (RH): (m agl( 1.35 RH
Max Allowable Gauge Pressure
Maximum allowable pressure (MAP) = 11.3kPa x (A) kPa 210.0 MAP
Pump max pressure (from driller) kPa ok CHECK: pump capability >= MAP prior to starting test
Hose length pump to gauge m (needed for head loss calculations back in office - high flow rates only)
Maximum allowable gauge pressure (MAGP) = MAP - SH kPa 180.00 MAGP
Test Pressures
Number of increments (N_Stage); (typically use 3) n 3 N_STAGE
Gauge pressure increment, = MAGP / N_Stage kPa 70 P_INC 10 PSIStage duration (consists of 3 equal duration sub-stages) min 15 stage duration (typically 15min, consisting of three 5min substages)
Packer seated in landing ring test
Water drop noted in broken rods either (Y or N)
Drop below top of rods mm 17mm NOTE: Fill rods to overflowing prior to test
Test duration min 6 min 45 sec Time taken to drop
Pressure disipation test
Bypass backflow pressure (intantaneous) kPa bypass flow immediately after last test cycle and record instanteous back pressure
Duration to dissipation to zero gauge pressure min Recovery period
(1) If fuild returns via casing during test (indicating bypass /poor seal) , record flow rate during each corresponding test substage. For example: 2min:45secs to fill 22.5L bucket(2) No need to carry out rod leakage tests L2 and L3 if L1 shows no flow (ie. No rod leakage)(3) 1 psi = 6.8948 kPa = 0.06895 bar; use kPa if possible(4)
(5)
v7.1 - 20170602JME
Hammering occurred between 10-40 kPa on 3rd pressure increment; pressure reduced from target 30 PSI to 25 PSI to compensate.
System leakage from gasket recorded when notedand has been substracted from water take from gauge to give total water take for each recording interval (refer to tabulated data sheet)
Comments:
BH06
Time: 10:30am
Date: 28/04/2017
Tested by: BGW

PACKER TEST - SINGLE
Test Method British Standard 5930: 1981 "Code of Practice for Site Investigations" Part 21.5 Packer Test Depth: 18.85 to 25.15
Job No. 255303
Stag
e Target Duration (min) Pressure Increment
Target Gauge Pressure (kPa / psi)
Actual Gauge Pressure (kPa / psi) Duration (min) Gauge Start (Litres) Gauge End (Litres) Leakage Adjustment
L1 5 3 P_INC x 3Rod leakage test at P_INC x 3
L2 5 2 P_INC x 2Rod leakage test at P_INC x 2
L3 5 1 P_INC x 1Rod leakage test at P_INC x 1
1a 5 1 10 10 5 min 8074.9 8076.0
1b 5 1 10 10 5 min 8076.0 8077.1
1c 5 1 10 10 5 min 8077.1 8079.1
2a 5 2 20 20 5 min 8080.1 8083.1
2b 5 2 20 20 5 min 8083.1 8086.4
2c 5 2 20 20 5 min 8086.4 8089.3
3a 5 3 30 25 5 min 8090.3 8101.2 1.0
3b 5 3 30 25 5 min 8101.2 8112.3 1.0
3c 5 3 30 25 5 min 8112.3 8124.5 1.0
4a 5 2 20 20 5 min 8124.9 8130.6 1.0
4b 5 2 20 20 5 min 8130.6 8136.3 1.0
4c 5 2 20 20 5 min 8136.3 8141.7 1.0
5a 5 1 10 10 5 min 8142.5 8145.6 1.0
5b 5 1 10 10 5 min 8145.6 8149.9 1.0
5c 5 1 10 10 5 min 8149.9 8152.2 1.0
'
'
'
c. 200 mL/min gasket leakage
'
'
'
'
'
1.3
9.9
10.1
11.2
4.7
4.7
4.4
2.1
3.3
BH06
Date / Time: 28/04/2017 10:30am
Test Records
Total Water Take (per 5 mins) Notes

PACKER TEST - SINGLE Test Method British Standard 5930: 1981 "Code of Practice for Site Investigations" Part 21.5 Packer Test Depth: 9.85 to 15.10
Client: Auckland Council
Project: Hackett Diversion - St Mary's Bay CSO
Job No. 255303
Hole Packer:Depth, D: (m bgl) 15.10 D Packer Model: Boyart Longyear
Cased to: (m bgl) 4.00 (HW) Packer Type: Pneumatic (USE nitrogen, NO CO2 or oxygen)
Flowmeter calibratio 12024.6 879553/13
Test Section Packer Inflation Pressure: 150 (PSI)Diameter (dia): (m bgl) HQ3 (NQ3 / HQ3 / PQ3) (driller to determine inflation pressure according to vendor instructions)From, (A): (m bgl) 9.85 A SKETCH OF TEST ARRANGEMENTTo, (B): (m bgl) 15.10 B dia
Midpoint, (C) = (A+B)/2: (m bgl) 12.48 C
Gauge height, G
Groundwater
Depth, (SWL): (m bgl) 1.45 SWL W
SWL Date: DD-MM 11/05/2017 SWL D
SWL Time: HH:mm 8:00:00 AM
Static Head
Gauge Height, (GH): (m agl) 1.000 GH Test Section
Static Head, SH=(SWL+GH) x g kPa 24.10 SH
Hose length from Gauge to packer head m (needed for head loss calculations back in office - high flow rates only)
Height to gasket at top of rods (RH): (m agl( 1.35 RH
Max Allowable Gauge Pressure
Maximum allowable pressure (MAP) = 11.3kPa x (A) kPa 111.3 MAP
Pump max pressure (from driller) kPa ok CHECK: pump capability >= MAP prior to starting test
Hose length pump to gauge m (needed for head loss calculations back in office - high flow rates only)
Maximum allowable gauge pressure (MAGP) = MAP - SH kPa 87.20 MAGP
Test Pressures
Number of increments (N_Stage); (typically use 3) n 3 N_STAGE
Gauge pressure increment, = MAGP / N_Stage kPa 29 P_INC (use 5 PSI)
Stage duration (consists of 3 equal duration sub-stages) min 15 stage duration (typically 15min, consisting of three 5min substages)
Packer seated in landing ring test
Water drop noted in broken rods either (Y or N)
Drop below top of rods mm NOTE: Fill rods to overflowing prior to test
Test duration min Time taken to drop
Pressure disipation test
Bypass backflow pressure (intantaneous) kPa bypass flow immediately after last test cycle and record instanteous back pressure
Duration to dissipation to zero gauge pressure min Recovery period
(1) If fuild returns via casing during test (indicating bypass /poor seal) , record flow rate during each corresponding test substage. For example: 2min:45secs to fill 22.5L bucket(2) No need to carry out rod leakage tests L2 and L3 if L1 shows no flow (ie. No rod leakage) (not applicable for pneumatic packer)(3) 1 psi = 6.8948 kPa = 0.06895 bar; use kPa if possible(4)
v7.1 - 20170602JME
System leakage from gasket recorded when notedand has been substracted from water take from gauge to give total water take for each recording interval (refer to tabulated data sheet)
Comments:
BH08
Time:
Date: 11/05/2017
Tested by: JME

PACKER TEST - SINGLE
Test Method British Standard 5930: 1981 "Code of Practice for Site Investigations" Part 21.5 Packer Test Depth: 9.85 to 15.10
Job No. 255303
Stag
e Target Duration (min) Pressure Increment
Target Gauge Pressure (kPa / psi)
Actual Gauge Pressure (kPa / psi) Duration (min) Gauge Start (Litres) Gauge End (Litres) Leakage Adjustment
L1 5 3 P_INC x 3Rod leakage test at P_INC x 3
L2 5 2 P_INC x 2Rod leakage test at P_INC x 2
L3 5 1 P_INC x 1Rod leakage test at P_INC x 1
1a 5 1 5 5 5 12020.6 12024.6 1.0
1b 5 1 5 5 5 12024.6 12028.8 1.0
1c 5 1 5 5 5 12028.8 12033.5 1.0
2a 5 2 10 10 5 12035.4 12041.2 1.9
2b 5 2 10 10 5 12041.2 12046.9 1.9
2c 5 2 10 10 5 12046.9 12052.7 1.9
3a 5 3 15 15 5 12056.0 12064.5 3.1
3b 5 3 15 15 5 12064.5 12073.6 3.1
3c 5 3 15 15 5 12073.6 12082.9 3.1
4a 5 2 10 10 5 12084.5 12092.8 1.7
4b 5 2 10 10 5 12092.8 12101.1 1.7
4c 5 2 10 10 5 12101.1 12109.8 1.7
5a 5 1 5 5 5 12114.5 12121.5 1.2
5b 5 1 5 5 5 12121.5 12130.6 1.2
5c 5 1 5 5 5 12130.6 12137.7 1.2
3.7
BH08
Date / Time: 11/05/2017
Test Records
Total Water Take (per 5 mins) Notes
3.0
3.2
c. 208 mL/min gasket leakage
'
'
5.9
3.9
3.8
3.9
5.4
6.0
6.2
6.6
6.6
7.0
5.8
7.9
c. 374 mL/min gasket leakage
'
c. 234 mL/min gasket leakage
'
'
c. 623 mL/min gasket leakage
'
'
c. 340 mL/min gasket leakage
'
'
'

u2
cm² cm² 150 10
u2
cm² cm² 150 10
Date :Cone no. :Project no. :
CPT no. :
Test according NEN 5140 class 1Project :Location:Position:
St Mary's BaySt Mary's Bay Road Reserve0, 0 RD
11/12/2017S10CFIIP.S16083
DF17GE038CPT_20 1/15
Cone resistance (qc) in MPa Friction ratio (Rf) in %
Sleeve friction (fs) in MPa Inclination (I) in degrx
Dep
th in
m to
refe
renc
e le
vel (
)
0
-1
-2
-3
-4
-5
-6
-7
-8
-9
-10
-11
-12
-13
-14
-15
-16
-17
-18
-19
-20
-21
-22
-23
-24
2 4 6 8 10 12 14 16 18 20 246810
0.10 0.20 0.30 0.40 0.50
1.45
0.4
1.4
1.0
0.9
0.7
1.1
2.4
3.6
4.5
4.6
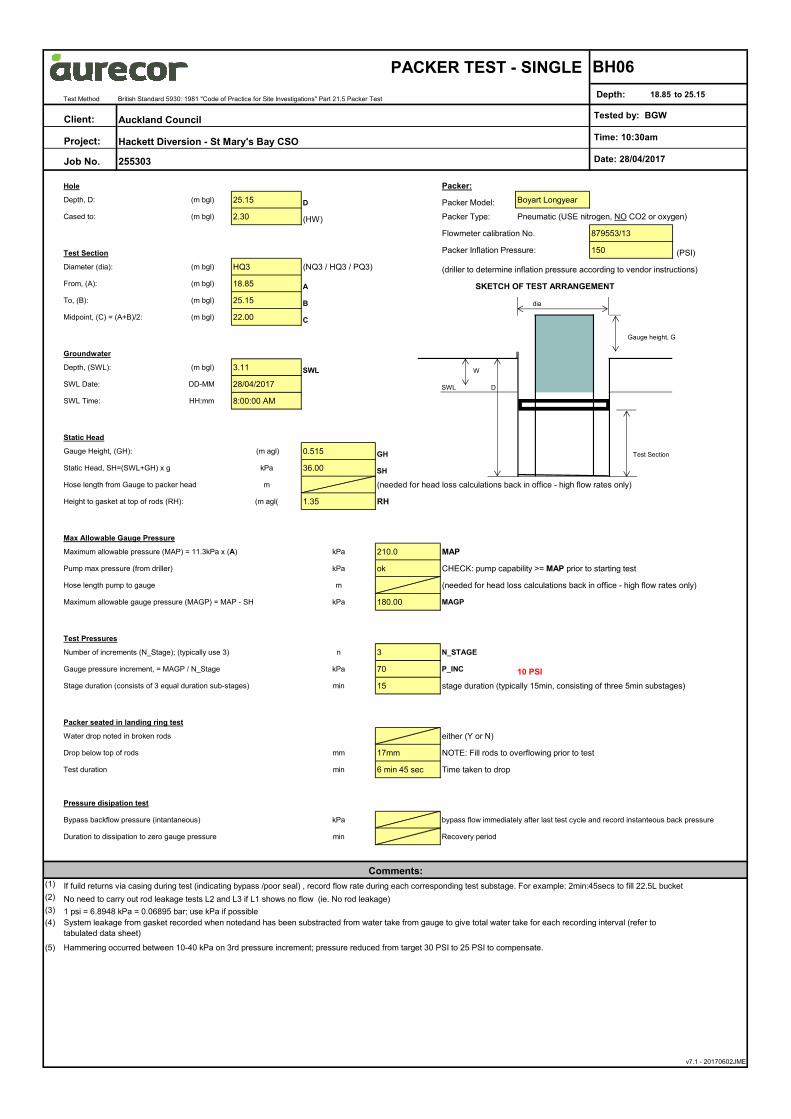
G.L. : 0.00 m
1.50 m Predrilled
EOH: MAX PUSH 8T
SWL: -1.5M
qc = 20.80fs = 0.43 I = 5.38Final depth = 10.44

u2
cm² cm² 150 10
Date :Cone no. :Project no. :
CPT no. :
Test according NEN 5140 class 1Project :Location:Position:
St Mary's BaySt Mary's Bay Road Reserve0, 0 RD
11/12/2017S10CFIIP.S16083
DF17GE038CPT_20 2/15
Dynamic pore pressure (u2) in MPa
Equilibirum pore pressure (u0) in MPa Inclination (I) in degrx
Dep
th in
m to
refe
renc
e le
vel (
)
0
-1
-2
-3
-4
-5
-6
-7
-8
-9
-10
-11
-12
-13
-14
-15
-16
-17
-18
-19
-20
-21
-22
-23
-24
-0.1 0.0 0.1 0.2 0.3 0.4 0.5 0.6 0.7 0.8 0.9 1.0 1.1 1.2 1.3
0.00 0.20 0.40 0.60 0.80 1.00 1.20
1.45
2.27 ->
0.4
1.4
1.0
0.9
0.7
1.1
2.4
3.6
4.5
4.6
G.L. : 0.00 m
1.50 m Predrilled
EOH: MAX PUSH 8T
SWL: -1.5M
u = 2.34 I = 5.38

u2
cm² cm² 150 10
Date :Cone no. :Project no. :
CPT no. :
Test according NEN 5140 class 1Project :Location:Position:
St Mary's BaySt Mary's Bay Road Reserve0, 0 RD
11/12/2017S10CFIIP.S16083
DF17GE038CPT_20 3/15
Corrected cone resistance (qt) in MPaD
epth
in m
to re
fere
nce
leve
l ()
0
-1
-2
-3
-4
-5
-6
-7
-8
-9
-10
-11
-12
-13
-14
-15
-16
-17
-18
-19
-20
-21
-22
-23
-24
2 4 6 8 10 12 14 16 18 20 22 24 26 28 30
1.45
G.L. : 0.00 m
1.50 m Predrilled
EOH: MAX PUSH 8T
SWL: -1.5M

u2
cm² cm² 150 10
Date :Cone no. :Project no. :
CPT no. :
Test according NEN 5140 class 1Project :Location:Position:
St Mary's BaySt Mary's Bay Road Reserve0, 0 RD
11/12/2017S10CFIIP.S16083
DF17GE038CPT_20 4/15
Excess pore pressure (du) in MPa Dynamic pore pressure ratio (u/qc) in MPaD
epth
in m
to re
fere
nce
leve
l ()
0
-1
-2
-3
-4
-5
-6
-7
-8
-9
-10
-11
-12
-13
-14
-15
-16
-17
-18
-19
-20
-21
-22
-23
-24
-0.1 0.0 0.1 0.2 0.3 0.4 0.5 0.6 0.7 0.8 01234
1.45
2.25 ->
G.L. : 0.00 m
1.50 m Predrilled
EOH: MAX PUSH 8T
SWL: -1.5M
u2
cm² cm² 150 10
Date :Cone no. :Project no. :
CPT no. :
Test according NEN 5140 class 1Project :Location:Position:
St Mary's BaySt Mary's Bay Road Reserve0, 0 RD
11/12/2017S10CFIIP.S16083
DF17GE038CPT_20 5/15
Effective cone resistance (qe) in MPaD
epth
in m
to re
fere
nce
leve
l ()
0
-1
-2
-3
-4
-5
-6
-7
-8
-9
-10
-11
-12
-13
-14
-15
-16
-17
-18
-19
-20
-21
-22
-23
-24
2 4 6 8 10 12 14 16 18 20 22 24 26 28 30
1.45
G.L. : 0.00 m
1.50 m Predrilled
EOH: MAX PUSH 8T
SWL: -1.5M

u2
cm² cm² 150 10
Date :Cone no. :Project no. :
CPT no. :
Test according NEN 5140 class 1Project :Location:Position:
St Mary's BaySt Mary's Bay Road Reserve0, 0 RD
11/12/2017S10CFIIP.S16083
DF17GE038CPT_20 6/15
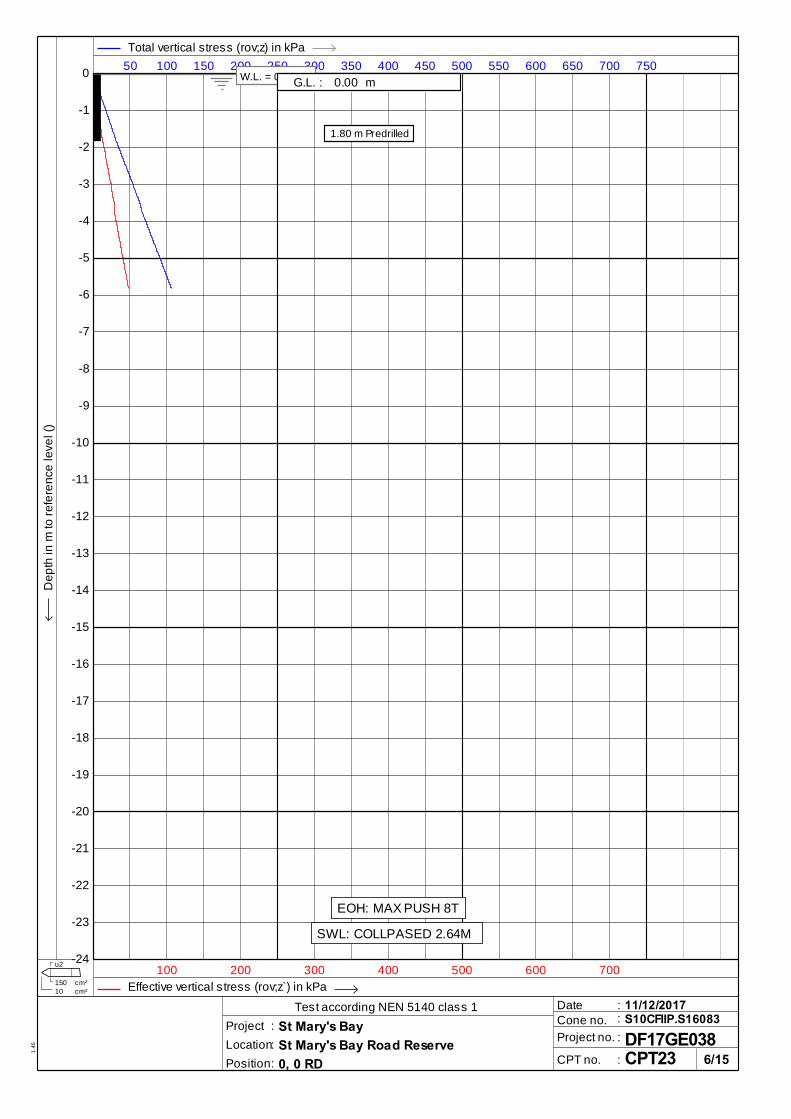
Total vertical stress (rov;z) in kPa
Effective vertical stress (rov;z̀ ) in kPa
Dep
th in
m to
refe
renc
e le
vel (
)
0
-1
-2
-3
-4
-5
-6
-7
-8
-9
-10
-11
-12
-13
-14
-15
-16
-17
-18
-19
-20
-21
-22
-23
-24
50 100 150 200 250 300 350 400 450 500 550 600 650 700 750
100 200 300 400 500 600 700
1.45
G.L. : 0.00 m
1.50 m Predrilled
EOH: MAX PUSH 8T
SWL: -1.5M

u2
cm² cm² 150 10
Date :Cone no. :Project no. :
CPT no. :
Test according NEN 5140 class 1Project :Location:Position:
St Mary's BaySt Mary's Bay Road Reserve0, 0 RD
11/12/2017S10CFIIP.S16083
DF17GE038CPT_20 7/15
Net cone resistance (qn) in MPa Pore pressure ratio (Bq)D
epth
in m
to re
fere
nce
leve
l ()
0
-1
-2
-3
-4
-5
-6
-7
-8
-9
-10
-11
-12
-13
-14
-15
-16
-17
-18
-19
-20
-21
-22
-23
-24
2 4 6 8 10 12 14 16 18 20 0.00.20.40.60.8
1.45
G.L. : 0.00 m
1.50 m Predrilled
EOH: MAX PUSH 8T
SWL: -1.5M

u2
cm² cm² 150 10
Date :Cone no. :Project no. :
CPT no. :
Test according NEN 5140 class 1Project :Location:Position:
St Mary's BaySt Mary's Bay Road Reserve0, 0 RD
11/12/2017S10CFIIP.S16083
DF17GE038CPT_20 8/15
Normalised cone resistance (qnorm) [Qt] Normalised friction ratio (fnorm) in %D
epth
in m
to re
fere
nce
leve
l ()
0
-1
-2
-3
-4
-5
-6
-7
-8
-9
-10
-11
-12
-13
-14
-15
-16
-17
-18
-19
-20
-21
-22
-23
-24
50 100 150 200 250 300 350 400 450 500 246810
1.45
G.L. : 0.00 m
1.50 m Predrilled
EOH: MAX PUSH 8T
SWL: -1.5M

u2
cm² cm² 150 10
Date :Cone no. :Project no. :
CPT no. :
Test according NEN 5140 class 1Project :Location:Position:
St Mary's BaySt Mary's Bay Road Reserve0, 0 RD
11/12/2017S10CFIIP.S16083
DF17GE038CPT_20 9/15
Soil behaviour type index (Ic)D
epth
in m
to re
fere
nce
leve
l ()
0
-1
-2
-3
-4
-5
-6
-7
-8
-9
-10
-11
-12
-13
-14
-15
-16
-17
-18
-19
-20
-21
-22
-23
-24
0.5 1.0 1.5 2.0 2.5 3.0 3.5 4.0 4.5 5.0 5.5 6.0 6.5 7.0 7.5
1.45
7 6 5 4 3 2
(2) Organic soils(3) Clay(4) Silt mixtures(5) Sand mixtures(6) Sand clean to silty(7) Gravelly sand
G.L. : 0.00 m
1.50 m Predrilled

u2
cm² cm² 150 10
Date :Cone no. :Project no. :
CPT no. :
Test according NEN 5140 class 1Project :Location:Position:
St Mary's BaySt Mary's Bay Road Reserve0, 0 RD
11/12/2017S10CFIIP.S16083
DF17GE038CPT_20 10/15
Undrained shear strength (Su) in kPaD
epth
in m
to re
fere
nce
leve
l ()
0
-1
-2
-3
-4
-5
-6
-7
-8
-9
-10
-11
-12
-13
-14
-15
-16
-17
-18
-19
-20
-21
-22
-23
-24
100 200 300 400 500 600 700 800 900 1000 1100 1200 1300 1400 1500
1.45
G.L. : 0.00 m
1.50 m Predrilled
EOH: MAX PUSH 8T
SWL: -1.5M

u2
cm² cm² 150 10
Date :Cone no. :Project no. :
CPT no. :
Test according NEN 5140 class 1Project :Location:Position:
St Mary's BaySt Mary's Bay Road Reserve0, 0 RD
11/12/2017S10CFIIP.S16083
DF17GE038CPT_20 11/15
Relative density (consolidated) in %
Relative density (over-consolidated) in %
Dep
th in
m to
refe
renc
e le
vel (
)
0
-1
-2
-3
-4
-5
-6
-7
-8
-9
-10
-11
-12
-13
-14
-15
-16
-17
-18
-19
-20
-21
-22
-23
-24
10 20 30 40 50 60 70 80 90 100 110 120 130 140 150
20 40 60 80 100 120 140
1.45
G.L. : 0.00 m
1.50 m Predrilled
EOH: MAX PUSH 8T
SWL: -1.5M

u2
cm² cm² 150 10
Date :Cone no. :Project no. :
CPT no. :
Test according NEN 5140 class 1Project :Location:Position:
St Mary's BaySt Mary's Bay Road Reserve0, 0 RD
11/12/2017S10CFIIP.S16083
DF17GE038CPT_20 12/15
Equivalent SPT N60 ValueD
epth
in m
to re
fere
nce
leve
l ()
0
-1
-2
-3
-4
-5
-6
-7
-8
-9
-10
-11
-12
-13
-14
-15
-16
-17
-18
-19
-20
-21
-22
-23
-24
5 10 15 20 25 30 35 40 45 50 55 60 65 70 75
1.45
G.L. : 0.00 m
1.50 m Predrilled
EOH: MAX PUSH 8T
SWL: -1.5M

u2
cm² cm² 150 10
Date :Cone no. :Project no. :
CPT no. :
Test according NEN 5140 class 1Project :Location:Position:
St Mary's BaySt Mary's Bay Road Reserve0, 0 RD
11/12/2017S10CFIIP.S16083
DF17GE038CPT_20 13/15
Sounding speed in cm/sD
epth
in m
to re
fere
nce
leve
l ()
0
-1
-2
-3
-4
-5
-6
-7
-8
-9
-10
-11
-12
-13
-14
-15
-16
-17
-18
-19
-20
-21
-22
-23
-24
0.5 1.0 1.5 2.0 2.5 3.0 3.5 4.0 4.5 5.0 5.5 6.0 6.5 7.0 7.5
1.45
G.L. : 0.00 m
1.50 m Predrilled
EOH: MAX PUSH 8T
SWL: -1.5M

u2
cm² cm² 150 10
Dep
th in
m to
refe
renc
e le
vel (
)
Date :Cone no. :Project no. :
CPT no. :
Test according NEN 5140 class 1Project :Location:Position:
St Mary's BaySt Mary's Bay Road Reserve0, 0 RD
11/12/2017S10CFIIP.S16083
DF17GE038CPT_20 14/15
0
-1
-2
-3
-4
-5
-6
-7
-8
-9
-10
-11
-12
-13
-14
-15
-16
-17
-18
-19
-20
-21
-22
-23
-24
1.45
(3)
(0)
(5)
(5)
(4)(3)
(3)
(5)
(3)
(3)
(3)
(4)(4)
(5)
(4)(5)
Soil (Qt, Fr) Soil (Qt, Bq) Soil (Average)
Soil behaviour type classification after Robertson 1990
(0) Not defined(1) Sensitive, fine grained(2) Organic soils-peats(3) Clays-clay to silty clay(4) Clayey silt to silty clay(5) Sand mixtures(6) Sands(7) Gravelly sand to sand(8) Very stiff sand to clayey sand(9) Very stiff fine grained
(3)
(0)
(5)
(4)
(5)
(5)
(4)(3)
(5)
(5)
(5)(5)
(6)
Soil (Qt, Fr) Soil (Qt, Bq) Soil (Average)
Soil behaviour type classification after Robertson 1990
(0) Not defined(1) Sensitive, fine grained(2) Organic soils-peats(3) Clays-clay to silty clay(4) Clayey silt to silty clay(5) Sand mixtures(6) Sands(7) Gravelly sand to sand(8) Very stiff sand to clayey sand(9) Very stiff fine grained
(3)
(0)
(6)(0)
(4)(0)
(4)
(5)
(4)(3)
(4)
(5)(5)(4)(6)
Soil (Qt, Fr) Soil (Qt, Bq) Soil (Average)
Soil behaviour type classification after Robertson 1990
(0) Not defined(1) Sensitive, fine grained(2) Organic soils-peats(3) Clays-clay to silty clay(4) Clayey silt to silty clay(5) Sand mixtures(6) Sands(7) Gravelly sand to sand(8) Very stiff sand to clayey sand(9) Very stiff fine grained
G.L. : 0.00 m
1.50 m Predrilled

u2
cm² cm² 150 10
Date :Cone no. :Project no. :
CPT no. :
Test according NEN 5140 class 1Project :Location:Position:
St Mary's BaySt Mary's Bay Road Reserve0, 0 RD
11/12/2017S10CFIIP.S16083
DF17GE038CPT_20 15/15
Internal friction angle in degreesD
epth
in m
to re
fere
nce
leve
l ()
0
-1
-2
-3
-4
-5
-6
-7
-8
-9
-10
-11
-12
-13
-14
-15
-16
-17
-18
-19
-20
-21
-22
-23
-24
5 10 15 20 25 30 35 40 45 50 55 60 65 70 75
1.45
G.L. : 0.00 m
1.50 m Predrilled
EOH: MAX PUSH 8T
SWL: -1.5M

u2
cm² cm² 150 10
u2
cm² cm² 150 10
Date :Cone no. :Project no. :
CPT no. :
Test according NEN 5140 class 1Project :Location:Position:
St Mary's BaySt Mary's Bay Road Reserve0, 0 RD
11/12/2017S10CFIIP.S16083
DF17GE038CPT_21 1/15
Cone resistance (qc) in MPa Friction ratio (Rf) in %
Sleeve friction (fs) in MPa Inclination (I) in degrx
Dep
th in
m to
refe
renc
e le
vel (
)
0
-1
-2
-3
-4
-5
-6
-7
-8
-9
-10
-11
-12
-13
-14
-15
-16
-17
-18
-19
-20
-21
-22
-23
-24
2 4 6 8 10 12 14 16 18 20 246810
0.10 0.20 0.30 0.40 0.50
1.45
0.8
2.0
2.6
3.5
3.7
3.6
3.7
3.0
2.7
3.5
3.4
G.L. : 0.00 m
1.50 m Predrilled
EOH: MAX PUSH 8T
SWL:-1.61M
qc = 26.58fs = 0.16 I = 3.64Final depth = 11.47

u2
cm² cm² 150 10
Date :Cone no. :Project no. :
CPT no. :
Test according NEN 5140 class 1Project :Location:Position:
St Mary's BaySt Mary's Bay Road Reserve0, 0 RD
11/12/2017S10CFIIP.S16083
DF17GE038CPT_21 2/15
Dynamic pore pressure (u2) in MPa
Equilibirum pore pressure (u0) in MPa Inclination (I) in degrx
Dep
th in
m to
refe
renc
e le
vel (
)
0
-1
-2
-3
-4
-5
-6
-7
-8
-9
-10
-11
-12
-13
-14
-15
-16
-17
-18
-19
-20
-21
-22
-23
-24
-0.1 0.0 0.1 0.2 0.3 0.4 0.5 0.6 0.7 0.8 0.9 1.0 1.1 1.2 1.3
0.00 0.20 0.40 0.60 0.80 1.00 1.20
1.45
2.95 ->1.22 ->
2.6 ->
1.57 ->
1.59 ->
0.8
2.0
2.6
3.5
3.7
3.6
3.7
3.0
2.7
3.5
3.4
G.L. : 0.00 m
1.50 m Predrilled
EOH: MAX PUSH 8T
SWL:-1.61M
u = -0.02 I = 3.64

u2
cm² cm² 150 10
Date :Cone no. :Project no. :
CPT no. :
Test according NEN 5140 class 1Project :Location:Position:
St Mary's BaySt Mary's Bay Road Reserve0, 0 RD
11/12/2017S10CFIIP.S16083
DF17GE038CPT_21 3/15
Corrected cone resistance (qt) in MPaD
epth
in m
to re
fere
nce
leve
l ()
0
-1
-2
-3
-4
-5
-6
-7
-8
-9
-10
-11
-12
-13
-14
-15
-16
-17
-18
-19
-20
-21
-22
-23
-24
2 4 6 8 10 12 14 16 18 20 22 24 26 28 30
1.45
G.L. : 0.00 m
1.50 m Predrilled
EOH: MAX PUSH 8T
SWL:-1.61M

u2
cm² cm² 150 10
Date :Cone no. :Project no. :
CPT no. :
Test according NEN 5140 class 1Project :Location:Position:
St Mary's BaySt Mary's Bay Road Reserve0, 0 RD
11/12/2017S10CFIIP.S16083
DF17GE038CPT_21 4/15
Excess pore pressure (du) in MPa Dynamic pore pressure ratio (u/qc) in MPaD
epth
in m
to re
fere
nce
leve
l ()
0
-1
-2
-3
-4
-5
-6
-7
-8
-9
-10
-11
-12
-13
-14
-15
-16
-17
-18
-19
-20
-21
-22
-23
-24
-0.1 0.0 0.1 0.2 0.3 0.4 0.5 0.6 0.7 0.8 01234
1.45
2.93 ->1.19 ->
2.57 ->
1.49 ->
1.53 ->
G.L. : 0.00 m
1.50 m Predrilled
EOH: MAX PUSH 8T
SWL:-1.61M

u2
cm² cm² 150 10
Date :Cone no. :Project no. :
CPT no. :
Test according NEN 5140 class 1Project :Location:Position:
St Mary's BaySt Mary's Bay Road Reserve0, 0 RD
11/12/2017S10CFIIP.S16083
DF17GE038CPT_21 5/15
Effective cone resistance (qe) in MPaD
epth
in m
to re
fere
nce
leve
l ()
0
-1
-2
-3
-4
-5
-6
-7
-8
-9
-10
-11
-12
-13
-14
-15
-16
-17
-18
-19
-20
-21
-22
-23
-24
2 4 6 8 10 12 14 16 18 20 22 24 26 28 30
1.45
G.L. : 0.00 m
1.50 m Predrilled
EOH: MAX PUSH 8T
SWL:-1.61M

u2
cm² cm² 150 10
Date :Cone no. :Project no. :
CPT no. :
Test according NEN 5140 class 1Project :Location:Position:
St Mary's BaySt Mary's Bay Road Reserve0, 0 RD
11/12/2017S10CFIIP.S16083
DF17GE038CPT_21 6/15
Total vertical stress (rov;z) in kPa
Effective vertical stress (rov;z̀ ) in kPa
Dep
th in
m to
refe
renc
e le
vel (
)
0
-1
-2
-3
-4
-5
-6
-7
-8
-9
-10
-11
-12
-13
-14
-15
-16
-17
-18
-19
-20
-21
-22
-23
-24
50 100 150 200 250 300 350 400 450 500 550 600 650 700 750
100 200 300 400 500 600 700
1.45
G.L. : 0.00 m
1.50 m Predrilled
EOH: MAX PUSH 8T
SWL:-1.61M

u2
cm² cm² 150 10
Date :Cone no. :Project no. :
CPT no. :
Test according NEN 5140 class 1Project :Location:Position:
St Mary's BaySt Mary's Bay Road Reserve0, 0 RD
11/12/2017S10CFIIP.S16083
DF17GE038CPT_21 7/15
Net cone resistance (qn) in MPa Pore pressure ratio (Bq)D
epth
in m
to re
fere
nce
leve
l ()
0
-1
-2
-3
-4
-5
-6
-7
-8
-9
-10
-11
-12
-13
-14
-15
-16
-17
-18
-19
-20
-21
-22
-23
-24
2 4 6 8 10 12 14 16 18 20 0.00.20.40.60.8
1.45
G.L. : 0.00 m
1.50 m Predrilled
EOH: MAX PUSH 8T
SWL:-1.61M

u2
cm² cm² 150 10
Date :Cone no. :Project no. :
CPT no. :
Test according NEN 5140 class 1Project :Location:Position:
St Mary's BaySt Mary's Bay Road Reserve0, 0 RD
11/12/2017S10CFIIP.S16083
DF17GE038CPT_21 8/15
Normalised cone resistance (qnorm) [Qt] Normalised friction ratio (fnorm) in %D
epth
in m
to re
fere
nce
leve
l ()
0
-1
-2
-3
-4
-5
-6
-7
-8
-9
-10
-11
-12
-13
-14
-15
-16
-17
-18
-19
-20
-21
-22
-23
-24
50 100 150 200 250 300 350 400 450 500 246810
1.45
G.L. : 0.00 m
1.50 m Predrilled
EOH: MAX PUSH 8T
SWL:-1.61M

u2
cm² cm² 150 10
Date :Cone no. :Project no. :
CPT no. :
Test according NEN 5140 class 1Project :Location:Position:
St Mary's BaySt Mary's Bay Road Reserve0, 0 RD
11/12/2017S10CFIIP.S16083
DF17GE038CPT_21 9/15
Soil behaviour type index (Ic)D
epth
in m
to re
fere
nce
leve
l ()
0
-1
-2
-3
-4
-5
-6
-7
-8
-9
-10
-11
-12
-13
-14
-15
-16
-17
-18
-19
-20
-21
-22
-23
-24
0.5 1.0 1.5 2.0 2.5 3.0 3.5 4.0 4.5 5.0 5.5 6.0 6.5 7.0 7.5
1.45
7 6 5 4 3 2
(2) Organic soils(3) Clay(4) Silt mixtures(5) Sand mixtures(6) Sand clean to silty(7) Gravelly sand
G.L. : 0.00 m
1.50 m Predrilled

u2
cm² cm² 150 10
Date :Cone no. :Project no. :
CPT no. :
Test according NEN 5140 class 1Project :Location:Position:
St Mary's BaySt Mary's Bay Road Reserve0, 0 RD
11/12/2017S10CFIIP.S16083
DF17GE038CPT_21 10/15
Undrained shear strength (Su) in kPaD
epth
in m
to re
fere
nce
leve
l ()
0
-1
-2
-3
-4
-5
-6
-7
-8
-9
-10
-11
-12
-13
-14
-15
-16
-17
-18
-19
-20
-21
-22
-23
-24
100 200 300 400 500 600 700 800 900 1000 1100 1200 1300 1400 1500
1.45
G.L. : 0.00 m
1.50 m Predrilled
EOH: MAX PUSH 8T
SWL:-1.61M

u2
cm² cm² 150 10
Date :Cone no. :Project no. :
CPT no. :
Test according NEN 5140 class 1Project :Location:Position:
St Mary's BaySt Mary's Bay Road Reserve0, 0 RD
11/12/2017S10CFIIP.S16083
DF17GE038CPT_21 11/15
Relative density (consolidated) in %
Relative density (over-consolidated) in %
Dep
th in
m to
refe
renc
e le
vel (
)
0
-1
-2
-3
-4
-5
-6
-7
-8
-9
-10
-11
-12
-13
-14
-15
-16
-17
-18
-19
-20
-21
-22
-23
-24
10 20 30 40 50 60 70 80 90 100 110 120 130 140 150
20 40 60 80 100 120 140
1.45
G.L. : 0.00 m
1.50 m Predrilled
EOH: MAX PUSH 8T
SWL:-1.61M

u2
cm² cm² 150 10
Date :Cone no. :Project no. :
CPT no. :
Test according NEN 5140 class 1Project :Location:Position:
St Mary's BaySt Mary's Bay Road Reserve0, 0 RD
11/12/2017S10CFIIP.S16083
DF17GE038CPT_21 12/15
Equivalent SPT N60 ValueD
epth
in m
to re
fere
nce
leve
l ()
0
-1
-2
-3
-4
-5
-6
-7
-8
-9
-10
-11
-12
-13
-14
-15
-16
-17
-18
-19
-20
-21
-22
-23
-24
5 10 15 20 25 30 35 40 45 50 55 60 65 70 75
1.45
G.L. : 0.00 m
1.50 m Predrilled
EOH: MAX PUSH 8T
SWL:-1.61M

u2
cm² cm² 150 10
Date :Cone no. :Project no. :
CPT no. :
Test according NEN 5140 class 1Project :Location:Position:
St Mary's BaySt Mary's Bay Road Reserve0, 0 RD
11/12/2017S10CFIIP.S16083
DF17GE038CPT_21 13/15
Sounding speed in cm/sD
epth
in m
to re
fere
nce
leve
l ()
0
-1
-2
-3
-4
-5
-6
-7
-8
-9
-10
-11
-12
-13
-14
-15
-16
-17
-18
-19
-20
-21
-22
-23
-24
0.5 1.0 1.5 2.0 2.5 3.0 3.5 4.0 4.5 5.0 5.5 6.0 6.5 7.0 7.5
1.45
G.L. : 0.00 m
1.50 m Predrilled
EOH: MAX PUSH 8T
SWL:-1.61M

u2
cm² cm² 150 10
Dep
th in
m to
refe
renc
e le
vel (
)
Date :Cone no. :Project no. :
CPT no. :
Test according NEN 5140 class 1Project :Location:Position:
St Mary's BaySt Mary's Bay Road Reserve0, 0 RD
11/12/2017S10CFIIP.S16083
DF17GE038CPT_21 14/15
0
-1
-2
-3
-4
-5
-6
-7
-8
-9
-10
-11
-12
-13
-14
-15
-16
-17
-18
-19
-20
-21
-22
-23
-24
1.45
(0)
(3)(6)
(5)
(5)
(5)
(4)(4)
(5)
(4)
(3)
(3)
(4)
Soil (Qt, Fr) Soil (Qt, Bq) Soil (Average)
Soil behaviour type classification after Robertson 1990
(0) Not defined(1) Sensitive, fine grained(2) Organic soils-peats(3) Clays-clay to silty clay(4) Clayey silt to silty clay(5) Sand mixtures(6) Sands(7) Gravelly sand to sand(8) Very stiff sand to clayey sand(9) Very stiff fine grained
(3)
(3)
(0)
(0)
(5)
(4)
(3)
(4)
(5)
(3)
(4)
(3)
Soil (Qt, Fr) Soil (Qt, Bq) Soil (Average)
Soil behaviour type classification after Robertson 1990
(0) Not defined(1) Sensitive, fine grained(2) Organic soils-peats(3) Clays-clay to silty clay(4) Clayey silt to silty clay(5) Sand mixtures(6) Sands(7) Gravelly sand to sand(8) Very stiff sand to clayey sand(9) Very stiff fine grained
(0)
(3)(6)(0)
(0)
(5)
(4)
(4)
(5)(4)
(3)
(4)
(4)
(4)
Soil (Qt, Fr) Soil (Qt, Bq) Soil (Average)
Soil behaviour type classification after Robertson 1990
(0) Not defined(1) Sensitive, fine grained(2) Organic soils-peats(3) Clays-clay to silty clay(4) Clayey silt to silty clay(5) Sand mixtures(6) Sands(7) Gravelly sand to sand(8) Very stiff sand to clayey sand(9) Very stiff fine grained
G.L. : 0.00 m
1.50 m Predrilled

u2
cm² cm² 150 10
Date :Cone no. :Project no. :
CPT no. :
Test according NEN 5140 class 1Project :Location:Position:
St Mary's BaySt Mary's Bay Road Reserve0, 0 RD
11/12/2017S10CFIIP.S16083
DF17GE038CPT_21 15/15
Internal friction angle in degreesD
epth
in m
to re
fere
nce
leve
l ()
0
-1
-2
-3
-4
-5
-6
-7
-8
-9
-10
-11
-12
-13
-14
-15
-16
-17
-18
-19
-20
-21
-22
-23
-24
5 10 15 20 25 30 35 40 45 50 55 60 65 70 75
1.45
G.L. : 0.00 m
1.50 m Predrilled
EOH: MAX PUSH 8T
SWL:-1.61M

u2
cm² cm² 150 10
u2
cm² cm² 150 10
Date :Cone no. :Project no. :
CPT no. :
Test according NEN 5140 class 1Project :Location:Position:
St Mary's BaySt Mary's Bay Road Reserve0, 0 RD
11/12/2017S10CFIIP.S16083
DF17GE038CPT_22 1/15
Cone resistance (qc) in MPa Friction ratio (Rf) in %
Sleeve friction (fs) in MPa Inclination (I) in degrx
Dep
th in
m to
refe
renc
e le
vel (
)
0
-1
-2
-3
-4
-5
-6
-7
-8
-9
-10
-11
-12
-13
-14
-15
-16
-17
-18
-19
-20
-21
-22
-23
-24
2 4 6 8 10 12 14 16 18 20 246810
0.10 0.20 0.30 0.40 0.50
1.45
0.7
0.6
2.5
2.0
1.3
1.0
1.4
G.L. : 0.00 m
1.50 m Predrilled
EOH: MAX PUSH 8T
SWL: -1.92M
qc = 18.96fs = 0.26 I = 2.90Final depth = 7.77

u2
cm² cm² 150 10
Date :Cone no. :Project no. :
CPT no. :
Test according NEN 5140 class 1Project :Location:Position:
St Mary's BaySt Mary's Bay Road Reserve0, 0 RD
11/12/2017S10CFIIP.S16083
DF17GE038CPT_22 2/15
Dynamic pore pressure (u2) in MPa
Equilibirum pore pressure (u0) in MPa Inclination (I) in degrx
Dep
th in
m to
refe
renc
e le
vel (
)
0
-1
-2
-3
-4
-5
-6
-7
-8
-9
-10
-11
-12
-13
-14
-15
-16
-17
-18
-19
-20
-21
-22
-23
-24
-0.1 0.0 0.1 0.2 0.3 0.4 0.5 0.6 0.7 0.8 0.9 1.0 1.1 1.2 1.3
0.00 0.20 0.40 0.60 0.80 1.00 1.20
1.45
2.01 ->
0.7
0.6
2.5
2.0
1.3
1.0
1.4
G.L. : 0.00 m
1.50 m Predrilled
EOH: MAX PUSH 8T
SWL: -1.92M
u = 3.06 I = 2.90

u2
cm² cm² 150 10
Date :Cone no. :Project no. :
CPT no. :
Test according NEN 5140 class 1Project :Location:Position:
St Mary's BaySt Mary's Bay Road Reserve0, 0 RD
11/12/2017S10CFIIP.S16083
DF17GE038CPT_22 3/15
Corrected cone resistance (qt) in MPaD
epth
in m
to re
fere
nce
leve
l ()
0
-1
-2
-3
-4
-5
-6
-7
-8
-9
-10
-11
-12
-13
-14
-15
-16
-17
-18
-19
-20
-21
-22
-23
-24
2 4 6 8 10 12 14 16 18 20 22 24 26 28 30
1.45
G.L. : 0.00 m
1.50 m Predrilled
EOH: MAX PUSH 8T
SWL: -1.92M

u2
cm² cm² 150 10
Date :Cone no. :Project no. :
CPT no. :
Test according NEN 5140 class 1Project :Location:Position:
St Mary's BaySt Mary's Bay Road Reserve0, 0 RD
11/12/2017S10CFIIP.S16083
DF17GE038CPT_22 4/15
Excess pore pressure (du) in MPa Dynamic pore pressure ratio (u/qc) in MPaD
epth
in m
to re
fere
nce
leve
l ()
0
-1
-2
-3
-4
-5
-6
-7
-8
-9
-10
-11
-12
-13
-14
-15
-16
-17
-18
-19
-20
-21
-22
-23
-24
-0.1 0.0 0.1 0.2 0.3 0.4 0.5 0.6 0.7 0.8 01234
1.45
G.L. : 0.00 m
1.50 m Predrilled
EOH: MAX PUSH 8T
SWL: -1.92M

u2
cm² cm² 150 10
Date :Cone no. :Project no. :
CPT no. :
Test according NEN 5140 class 1Project :Location:Position:
St Mary's BaySt Mary's Bay Road Reserve0, 0 RD
11/12/2017S10CFIIP.S16083
DF17GE038CPT_22 5/15
Effective cone resistance (qe) in MPaD
epth
in m
to re
fere
nce
leve
l ()
0
-1
-2
-3
-4
-5
-6
-7
-8
-9
-10
-11
-12
-13
-14
-15
-16
-17
-18
-19
-20
-21
-22
-23
-24
2 4 6 8 10 12 14 16 18 20 22 24 26 28 30
1.45
G.L. : 0.00 m
1.50 m Predrilled
EOH: MAX PUSH 8T
SWL: -1.92M

u2
cm² cm² 150 10
Date :Cone no. :Project no. :
CPT no. :
Test according NEN 5140 class 1Project :Location:Position:
St Mary's BaySt Mary's Bay Road Reserve0, 0 RD
11/12/2017S10CFIIP.S16083
DF17GE038CPT_22 6/15
Total vertical stress (rov;z) in kPa
Effective vertical stress (rov;z̀ ) in kPa
Dep
th in
m to
refe
renc
e le
vel (
)
0
-1
-2
-3
-4
-5
-6
-7
-8
-9
-10
-11
-12
-13
-14
-15
-16
-17
-18
-19
-20
-21
-22
-23
-24
50 100 150 200 250 300 350 400 450 500 550 600 650 700 750
100 200 300 400 500 600 700
1.45
G.L. : 0.00 m
1.50 m Predrilled
EOH: MAX PUSH 8T
SWL: -1.92M

u2
cm² cm² 150 10
Date :Cone no. :Project no. :
CPT no. :
Test according NEN 5140 class 1Project :Location:Position:
St Mary's BaySt Mary's Bay Road Reserve0, 0 RD
11/12/2017S10CFIIP.S16083
DF17GE038CPT_22 7/15
Net cone resistance (qn) in MPa Pore pressure ratio (Bq)D
epth
in m
to re
fere
nce
leve
l ()
0
-1
-2
-3
-4
-5
-6
-7
-8
-9
-10
-11
-12
-13
-14
-15
-16
-17
-18
-19
-20
-21
-22
-23
-24
2 4 6 8 10 12 14 16 18 20 0.00.20.40.60.8
1.45
G.L. : 0.00 m
1.50 m Predrilled
EOH: MAX PUSH 8T
SWL: -1.92M

u2
cm² cm² 150 10
Date :Cone no. :Project no. :
CPT no. :
Test according NEN 5140 class 1Project :Location:Position:
St Mary's BaySt Mary's Bay Road Reserve0, 0 RD
11/12/2017S10CFIIP.S16083
DF17GE038CPT_22 8/15
Normalised cone resistance (qnorm) [Qt] Normalised friction ratio (fnorm) in %D
epth
in m
to re
fere
nce
leve
l ()
0
-1
-2
-3
-4
-5
-6
-7
-8
-9
-10
-11
-12
-13
-14
-15
-16
-17
-18
-19
-20
-21
-22
-23
-24
50 100 150 200 250 300 350 400 450 500 246810
1.45
G.L. : 0.00 m
1.50 m Predrilled
EOH: MAX PUSH 8T
SWL: -1.92M

u2
cm² cm² 150 10
Date :Cone no. :Project no. :
CPT no. :
Test according NEN 5140 class 1Project :Location:Position:
St Mary's BaySt Mary's Bay Road Reserve0, 0 RD
11/12/2017S10CFIIP.S16083
DF17GE038CPT_22 9/15
Soil behaviour type index (Ic)D
epth
in m
to re
fere
nce
leve
l ()
0
-1
-2
-3
-4
-5
-6
-7
-8
-9
-10
-11
-12
-13
-14
-15
-16
-17
-18
-19
-20
-21
-22
-23
-24
0.5 1.0 1.5 2.0 2.5 3.0 3.5 4.0 4.5 5.0 5.5 6.0 6.5 7.0 7.5
1.45
7 6 5 4 3 2
(2) Organic soils(3) Clay(4) Silt mixtures(5) Sand mixtures(6) Sand clean to silty(7) Gravelly sand
G.L. : 0.00 m
1.50 m Predrilled

u2
cm² cm² 150 10
Date :Cone no. :Project no. :
CPT no. :
Test according NEN 5140 class 1Project :Location:Position:
St Mary's BaySt Mary's Bay Road Reserve0, 0 RD
11/12/2017S10CFIIP.S16083
DF17GE038CPT_22 10/15
Undrained shear strength (Su) in kPaD
epth
in m
to re
fere
nce
leve
l ()
0
-1
-2
-3
-4
-5
-6
-7
-8
-9
-10
-11
-12
-13
-14
-15
-16
-17
-18
-19
-20
-21
-22
-23
-24
100 200 300 400 500 600 700 800 900 1000 1100 1200 1300 1400 1500
1.45
G.L. : 0.00 m
1.50 m Predrilled
EOH: MAX PUSH 8T
SWL: -1.92M

u2
cm² cm² 150 10
Date :Cone no. :Project no. :
CPT no. :
Test according NEN 5140 class 1Project :Location:Position:
St Mary's BaySt Mary's Bay Road Reserve0, 0 RD
11/12/2017S10CFIIP.S16083
DF17GE038CPT_22 11/15
Relative density (consolidated) in %
Relative density (over-consolidated) in %
Dep
th in
m to
refe
renc
e le
vel (
)
0
-1
-2
-3
-4
-5
-6
-7
-8
-9
-10
-11
-12
-13
-14
-15
-16
-17
-18
-19
-20
-21
-22
-23
-24
10 20 30 40 50 60 70 80 90 100 110 120 130 140 150
20 40 60 80 100 120 140
1.45
G.L. : 0.00 m
1.50 m Predrilled
EOH: MAX PUSH 8T
SWL: -1.92M

u2
cm² cm² 150 10
Date :Cone no. :Project no. :
CPT no. :
Test according NEN 5140 class 1Project :Location:Position:
St Mary's BaySt Mary's Bay Road Reserve0, 0 RD
11/12/2017S10CFIIP.S16083
DF17GE038CPT_22 12/15
Equivalent SPT N60 ValueD
epth
in m
to re
fere
nce
leve
l ()
0
-1
-2
-3
-4
-5
-6
-7
-8
-9
-10
-11
-12
-13
-14
-15
-16
-17
-18
-19
-20
-21
-22
-23
-24
5 10 15 20 25 30 35 40 45 50 55 60 65 70 75
1.45
G.L. : 0.00 m
1.50 m Predrilled
EOH: MAX PUSH 8T
SWL: -1.92M

u2
cm² cm² 150 10
Date :Cone no. :Project no. :
CPT no. :
Test according NEN 5140 class 1Project :Location:Position:
St Mary's BaySt Mary's Bay Road Reserve0, 0 RD
11/12/2017S10CFIIP.S16083
DF17GE038CPT_22 13/15
Sounding speed in cm/sD
epth
in m
to re
fere
nce
leve
l ()
0
-1
-2
-3
-4
-5
-6
-7
-8
-9
-10
-11
-12
-13
-14
-15
-16
-17
-18
-19
-20
-21
-22
-23
-24
0.5 1.0 1.5 2.0 2.5 3.0 3.5 4.0 4.5 5.0 5.5 6.0 6.5 7.0 7.5
1.45
G.L. : 0.00 m
1.50 m Predrilled
EOH: MAX PUSH 8T
SWL: -1.92M

u2
cm² cm² 150 10
Dep
th in
m to
refe
renc
e le
vel (
)
Date :Cone no. :Project no. :
CPT no. :
Test according NEN 5140 class 1Project :Location:Position:
St Mary's BaySt Mary's Bay Road Reserve0, 0 RD
11/12/2017S10CFIIP.S16083
DF17GE038CPT_22 14/15
0
-1
-2
-3
-4
-5
-6
-7
-8
-9
-10
-11
-12
-13
-14
-15
-16
-17
-18
-19
-20
-21
-22
-23
-24
1.45
(3)
(3)
(6)
(4)
(4)(5)(4)
Soil (Qt, Fr) Soil (Qt, Bq) Soil (Average)
Soil behaviour type classification after Robertson 1990
(0) Not defined(1) Sensitive, fine grained(2) Organic soils-peats(3) Clays-clay to silty clay(4) Clayey silt to silty clay(5) Sand mixtures(6) Sands(7) Gravelly sand to sand(8) Very stiff sand to clayey sand(9) Very stiff fine grained
(6)
(3)
(6)
(6)
(5)
(6)(0)
Soil (Qt, Fr) Soil (Qt, Bq) Soil (Average)
Soil behaviour type classification after Robertson 1990
(0) Not defined(1) Sensitive, fine grained(2) Organic soils-peats(3) Clays-clay to silty clay(4) Clayey silt to silty clay(5) Sand mixtures(6) Sands(7) Gravelly sand to sand(8) Very stiff sand to clayey sand(9) Very stiff fine grained
(6)
(0)(3)
(3)
(6)
(0)
(4)(5)(4)
(0)
(0)(0)
Soil (Qt, Fr) Soil (Qt, Bq) Soil (Average)
Soil behaviour type classification after Robertson 1990
(0) Not defined(1) Sensitive, fine grained(2) Organic soils-peats(3) Clays-clay to silty clay(4) Clayey silt to silty clay(5) Sand mixtures(6) Sands(7) Gravelly sand to sand(8) Very stiff sand to clayey sand(9) Very stiff fine grained
G.L. : 0.00 m
1.50 m Predrilled

u2
cm² cm² 150 10
Date :Cone no. :Project no. :
CPT no. :
Test according NEN 5140 class 1Project :Location:Position:
St Mary's BaySt Mary's Bay Road Reserve0, 0 RD
11/12/2017S10CFIIP.S16083
DF17GE038CPT_22 15/15
Internal friction angle in degreesD
epth
in m
to re
fere
nce
leve
l ()
0
-1
-2
-3
-4
-5
-6
-7
-8
-9
-10
-11
-12
-13
-14
-15
-16
-17
-18
-19
-20
-21
-22
-23
-24
5 10 15 20 25 30 35 40 45 50 55 60 65 70 75
1.45
G.L. : 0.00 m
1.50 m Predrilled
EOH: MAX PUSH 8T
SWL: -1.92M
u2
cm² cm² 150 10
u2
cm² cm² 150 10
Date :Cone no. :Project no. :
CPT no. :
Test according NEN 5140 class 1Project :Location:Position:
St Mary's BaySt Mary's Bay Road Reserve0, 0 RD
11/12/2017S10CFIIP.S16083
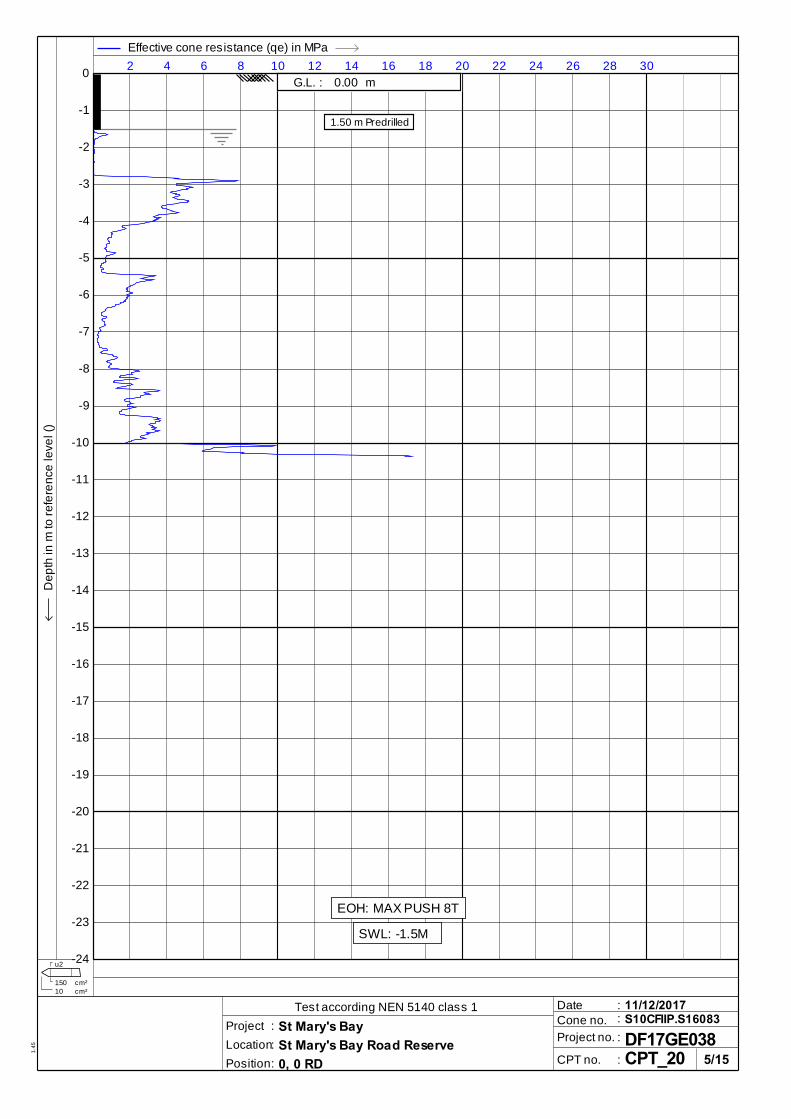
DF17GE038CPT23 1/15
Cone resistance (qc) in MPa Friction ratio (Rf) in %
Sleeve friction (fs) in MPa Inclination (I) in degrx
Dep
th in
m to
refe
renc
e le
vel (
)
0
-1
-2
-3
-4
-5
-6
-7
-8
-9
-10
-11
-12
-13
-14
-15
-16
-17
-18
-19
-20
-21
-22
-23
-24
2 4 6 8 10 12 14 16 18 20 246810
0.10 0.20 0.30 0.40 0.50
1.45
W.L. = 0.00 m
1.1
1.8
0.9
1.4
1.5
G.L. : 0.00 m
1.80 m Predrilled
EOH: MAX PUSH 8T
SWL: COLLPASED 2.64M
qc = 12.45fs = 0.64 I = 2.07Final depth = 5.88

u2
cm² cm² 150 10
Date :Cone no. :Project no. :
CPT no. :
Test according NEN 5140 class 1Project :Location:Position:
St Mary's BaySt Mary's Bay Road Reserve0, 0 RD
11/12/2017S10CFIIP.S16083
DF17GE038CPT23 2/15
Dynamic pore pressure (u2) in MPa
Equilibirum pore pressure (u0) in MPa Inclination (I) in degrx
Dep
th in
m to
refe
renc
e le
vel (
)
0
-1
-2
-3
-4
-5
-6
-7
-8
-9
-10
-11
-12
-13
-14
-15
-16
-17
-18
-19
-20
-21
-22
-23
-24
-0.1 0.0 0.1 0.2 0.3 0.4 0.5 0.6 0.7 0.8 0.9 1.0 1.1 1.2 1.3
0.00 0.20 0.40 0.60 0.80 1.00 1.20
1.45
W.L. = 0.00 m
1.1
1.8
0.9
1.4
1.5
G.L. : 0.00 m
1.80 m Predrilled
EOH: MAX PUSH 8T
SWL: COLLPASED 2.64M
u = 0.13 I = 2.07

u2
cm² cm² 150 10
Date :Cone no. :Project no. :
CPT no. :
Test according NEN 5140 class 1Project :Location:Position:
St Mary's BaySt Mary's Bay Road Reserve0, 0 RD
11/12/2017S10CFIIP.S16083
DF17GE038CPT23 3/15
Corrected cone resistance (qt) in MPaD
epth
in m
to re
fere
nce
leve
l ()
0
-1
-2
-3
-4
-5
-6
-7
-8
-9
-10
-11
-12
-13
-14
-15
-16
-17
-18
-19
-20
-21
-22
-23
-24
2 4 6 8 10 12 14 16 18 20 22 24 26 28 30
1.45
W.L. = 0.00 mG.L. : 0.00 m
1.80 m Predrilled
EOH: MAX PUSH 8T
SWL: COLLPASED 2.64M

u2
cm² cm² 150 10
Date :Cone no. :Project no. :
CPT no. :
Test according NEN 5140 class 1Project :Location:Position:
St Mary's BaySt Mary's Bay Road Reserve0, 0 RD
11/12/2017S10CFIIP.S16083
DF17GE038CPT23 4/15
Excess pore pressure (du) in MPa Dynamic pore pressure ratio (u/qc) in MPaD
epth
in m
to re
fere
nce
leve
l ()
0
-1
-2
-3
-4
-5
-6
-7
-8
-9
-10
-11
-12
-13
-14
-15
-16
-17
-18
-19
-20
-21
-22
-23
-24
-0.1 0.0 0.1 0.2 0.3 0.4 0.5 0.6 0.7 0.8 01234
1.45
W.L. = 0.00 mG.L. : 0.00 m
1.80 m Predrilled
EOH: MAX PUSH 8T
SWL: COLLPASED 2.64M

u2
cm² cm² 150 10
Date :Cone no. :Project no. :
CPT no. :
Test according NEN 5140 class 1Project :Location:Position:
St Mary's BaySt Mary's Bay Road Reserve0, 0 RD
11/12/2017S10CFIIP.S16083
DF17GE038CPT23 5/15
Effective cone resistance (qe) in MPaD
epth
in m
to re
fere
nce
leve
l ()
0
-1
-2
-3
-4
-5
-6
-7
-8
-9
-10
-11
-12
-13
-14
-15
-16
-17
-18
-19
-20
-21
-22
-23
-24
2 4 6 8 10 12 14 16 18 20 22 24 26 28 30
1.45
W.L. = 0.00 mG.L. : 0.00 m
1.80 m Predrilled
EOH: MAX PUSH 8T
SWL: COLLPASED 2.64M
u2
cm² cm² 150 10
Date :Cone no. :Project no. :
CPT no. :
Test according NEN 5140 class 1Project :Location:Position:
St Mary's BaySt Mary's Bay Road Reserve0, 0 RD
11/12/2017S10CFIIP.S16083
DF17GE038CPT23 6/15
Total vertical stress (rov;z) in kPa
Effective vertical stress (rov;z̀ ) in kPa
Dep
th in
m to
refe
renc
e le
vel (
)
0
-1
-2
-3
-4
-5
-6
-7
-8
-9
-10
-11
-12
-13
-14
-15
-16
-17
-18
-19
-20
-21
-22
-23
-24
50 100 150 200 250 300 350 400 450 500 550 600 650 700 750
100 200 300 400 500 600 700
1.45
W.L. = 0.00 mG.L. : 0.00 m
1.80 m Predrilled
EOH: MAX PUSH 8T
SWL: COLLPASED 2.64M

u2
cm² cm² 150 10
Date :Cone no. :Project no. :
CPT no. :
Test according NEN 5140 class 1Project :Location:Position:
St Mary's BaySt Mary's Bay Road Reserve0, 0 RD
11/12/2017S10CFIIP.S16083
DF17GE038CPT23 7/15
Net cone resistance (qn) in MPa Pore pressure ratio (Bq)D
epth
in m
to re
fere
nce
leve
l ()
0
-1
-2
-3
-4
-5
-6
-7
-8
-9
-10
-11
-12
-13
-14
-15
-16
-17
-18
-19
-20
-21
-22
-23
-24
2 4 6 8 10 12 14 16 18 20 0.00.20.40.60.8
1.45
W.L. = 0.00 mG.L. : 0.00 m
1.80 m Predrilled
EOH: MAX PUSH 8T
SWL: COLLPASED 2.64M

u2
cm² cm² 150 10
Date :Cone no. :Project no. :
CPT no. :
Test according NEN 5140 class 1Project :Location:Position:
St Mary's BaySt Mary's Bay Road Reserve0, 0 RD
11/12/2017S10CFIIP.S16083
DF17GE038CPT23 8/15
Normalised cone resistance (qnorm) [Qt] Normalised friction ratio (fnorm) in %D
epth
in m
to re
fere
nce
leve
l ()
0
-1
-2
-3
-4
-5
-6
-7
-8
-9
-10
-11
-12
-13
-14
-15
-16
-17
-18
-19
-20
-21
-22
-23
-24
50 100 150 200 250 300 350 400 450 500 246810
1.45
W.L. = 0.00 mG.L. : 0.00 m
1.80 m Predrilled
EOH: MAX PUSH 8T
SWL: COLLPASED 2.64M

u2
cm² cm² 150 10
Date :Cone no. :Project no. :
CPT no. :
Test according NEN 5140 class 1Project :Location:Position:
St Mary's BaySt Mary's Bay Road Reserve0, 0 RD
11/12/2017S10CFIIP.S16083
DF17GE038CPT23 9/15
Soil behaviour type index (Ic)D
epth
in m
to re
fere
nce
leve
l ()
0
-1
-2
-3
-4
-5
-6
-7
-8
-9
-10
-11
-12
-13
-14
-15
-16
-17
-18
-19
-20
-21
-22
-23
-24
0.5 1.0 1.5 2.0 2.5 3.0 3.5 4.0 4.5 5.0 5.5 6.0 6.5 7.0 7.5
1.45
W.L. = 0.00 m
7 6 5 4 3 2
(2) Organic soils(3) Clay(4) Silt mixtures(5) Sand mixtures(6) Sand clean to silty(7) Gravelly sand
G.L. : 0.00 m
1.80 m Predrilled

u2
cm² cm² 150 10
Date :Cone no. :Project no. :
CPT no. :
Test according NEN 5140 class 1Project :Location:Position:
St Mary's BaySt Mary's Bay Road Reserve0, 0 RD
11/12/2017S10CFIIP.S16083
DF17GE038CPT23 10/15
Undrained shear strength (Su) in kPaD
epth
in m
to re
fere
nce
leve
l ()
0
-1
-2
-3
-4
-5
-6
-7
-8
-9
-10
-11
-12
-13
-14
-15
-16
-17
-18
-19
-20
-21
-22
-23
-24
100 200 300 400 500 600 700 800 900 1000 1100 1200 1300 1400 1500
1.45
W.L. = 0.00 mG.L. : 0.00 m
1.80 m Predrilled
EOH: MAX PUSH 8T
SWL: COLLPASED 2.64M

u2
cm² cm² 150 10
Date :Cone no. :Project no. :
CPT no. :
Test according NEN 5140 class 1Project :Location:Position:
St Mary's BaySt Mary's Bay Road Reserve0, 0 RD
11/12/2017S10CFIIP.S16083
DF17GE038CPT23 11/15
Relative density (consolidated) in %
Relative density (over-consolidated) in %
Dep
th in
m to
refe
renc
e le
vel (
)
0
-1
-2
-3
-4
-5
-6
-7
-8
-9
-10
-11
-12
-13
-14
-15
-16
-17
-18
-19
-20
-21
-22
-23
-24
10 20 30 40 50 60 70 80 90 100 110 120 130 140 150
20 40 60 80 100 120 140
1.45
W.L. = 0.00 mG.L. : 0.00 m
1.80 m Predrilled
EOH: MAX PUSH 8T
SWL: COLLPASED 2.64M

u2
cm² cm² 150 10
Date :Cone no. :Project no. :
CPT no. :
Test according NEN 5140 class 1Project :Location:Position:
St Mary's BaySt Mary's Bay Road Reserve0, 0 RD
11/12/2017S10CFIIP.S16083
DF17GE038CPT23 12/15
Equivalent SPT N60 ValueD
epth
in m
to re
fere
nce
leve
l ()
0
-1
-2
-3
-4
-5
-6
-7
-8
-9
-10
-11
-12
-13
-14
-15
-16
-17
-18
-19
-20
-21
-22
-23
-24
5 10 15 20 25 30 35 40 45 50 55 60 65 70 75
1.45
W.L. = 0.00 mG.L. : 0.00 m
1.80 m Predrilled
EOH: MAX PUSH 8T
SWL: COLLPASED 2.64M

u2
cm² cm² 150 10
Date :Cone no. :Project no. :
CPT no. :
Test according NEN 5140 class 1Project :Location:Position:
St Mary's BaySt Mary's Bay Road Reserve0, 0 RD
11/12/2017S10CFIIP.S16083
DF17GE038CPT23 13/15
Sounding speed in cm/sD
epth
in m
to re
fere
nce
leve
l ()
0
-1
-2
-3
-4
-5
-6
-7
-8
-9
-10
-11
-12
-13
-14
-15
-16
-17
-18
-19
-20
-21
-22
-23
-24
0.5 1.0 1.5 2.0 2.5 3.0 3.5 4.0 4.5 5.0 5.5 6.0 6.5 7.0 7.5
1.45
W.L. = 0.00 mG.L. : 0.00 m
1.80 m Predrilled
EOH: MAX PUSH 8T
SWL: COLLPASED 2.64M

u2
cm² cm² 150 10
Dep
th in
m to
refe
renc
e le
vel (
)
Date :Cone no. :Project no. :
CPT no. :
Test according NEN 5140 class 1Project :Location:Position:
St Mary's BaySt Mary's Bay Road Reserve0, 0 RD
11/12/2017S10CFIIP.S16083
DF17GE038CPT23 14/15
0
-1
-2
-3
-4
-5
-6
-7
-8
-9
-10
-11
-12
-13
-14
-15
-16
-17
-18
-19
-20
-21
-22
-23
-24
1.45
(5)
(5)
(8)
Soil (Qt, Fr) Soil (Qt, Bq) Soil (Average)
Soil behaviour type classification after Robertson 1990
(0) Not defined(1) Sensitive, fine grained(2) Organic soils-peats(3) Clays-clay to silty clay(4) Clayey silt to silty clay(5) Sand mixtures(6) Sands(7) Gravelly sand to sand(8) Very stiff sand to clayey sand(9) Very stiff fine grained
(6)
(7)(6)
(6)
(6)
(6)(7)
Soil (Qt, Fr) Soil (Qt, Bq) Soil (Average)
Soil behaviour type classification after Robertson 1990
(0) Not defined(1) Sensitive, fine grained(2) Organic soils-peats(3) Clays-clay to silty clay(4) Clayey silt to silty clay(5) Sand mixtures(6) Sands(7) Gravelly sand to sand(8) Very stiff sand to clayey sand(9) Very stiff fine grained
(6)
(6)
(0)(6)
(6)
(8)
Soil (Qt, Fr) Soil (Qt, Bq) Soil (Average)
Soil behaviour type classification after Robertson 1990
(0) Not defined(1) Sensitive, fine grained(2) Organic soils-peats(3) Clays-clay to silty clay(4) Clayey silt to silty clay(5) Sand mixtures(6) Sands(7) Gravelly sand to sand(8) Very stiff sand to clayey sand(9) Very stiff fine grained
G.L. : 0.00 m
1.80 m Predrilled

u2
cm² cm² 150 10
Date :Cone no. :Project no. :
CPT no. :
Test according NEN 5140 class 1Project :Location:Position:
St Mary's BaySt Mary's Bay Road Reserve0, 0 RD
11/12/2017S10CFIIP.S16083
DF17GE038CPT23 15/15
Internal friction angle in degreesD
epth
in m
to re
fere
nce
leve
l ()
0
-1
-2
-3
-4
-5
-6
-7
-8
-9
-10
-11
-12
-13
-14
-15
-16
-17
-18
-19
-20
-21
-22
-23
-24
5 10 15 20 25 30 35 40 45 50 55 60 65 70 75
1.45
W.L. = 0.00 mG.L. : 0.00 m
1.80 m Predrilled
EOH: MAX PUSH 8T
SWL: COLLPASED 2.64M

u2
cm² cm² 150 10
u2
cm² cm² 150 10
Date :Cone no. :Project no. :
CPT no. :
Test according NEN 5140 class 1Project :Location:Position:
St Mary's BaySt Mary's Bay Road Reserve0, 0 RD
11/12/2017S10CFIIP.S16083
DF17GE038CPT_24 1/15
Cone resistance (qc) in MPa Friction ratio (Rf) in %
Sleeve friction (fs) in MPa Inclination (I) in degrx
Dep
th in
m to
refe
renc
e le
vel (
)
0
-1
-2
-3
-4
-5
-6
-7
-8
-9
-10
-11
-12
-13
-14
-15
-16
-17
-18
-19
-20
-21
-22
-23
-24
2 4 6 8 10 12 14 16 18 20 246810
0.10 0.20 0.30 0.40 0.50
1.45
1.0
1.8
2.1
1.9
1.7
1.3
1.2
1.0
0.7
0.4
0.7
G.L. : 0.00 m
1.50 m Predrilled
EOH: MAX PUSH 8T
SWL: -1.61M
qc = 14.74fs = 0.06 I = 1.91Final depth = 11.46

u2
cm² cm² 150 10
Date :Cone no. :Project no. :
CPT no. :
Test according NEN 5140 class 1Project :Location:Position:
St Mary's BaySt Mary's Bay Road Reserve0, 0 RD
11/12/2017S10CFIIP.S16083
DF17GE038CPT_24 2/15
Dynamic pore pressure (u2) in MPa
Equilibirum pore pressure (u0) in MPa Inclination (I) in degrx
Dep
th in
m to
refe
renc
e le
vel (
)
0
-1
-2
-3
-4
-5
-6
-7
-8
-9
-10
-11
-12
-13
-14
-15
-16
-17
-18
-19
-20
-21
-22
-23
-24
-0.1 0.0 0.1 0.2 0.3 0.4 0.5 0.6 0.7 0.8 0.9 1.0 1.1 1.2 1.3
0.00 0.20 0.40 0.60 0.80 1.00 1.20
1.45
1 ->
1.33 ->
1.33 ->1.43 ->1.38 ->
1.0
1.8
2.1
1.9
1.7
1.3
1.2
1.0
0.7
0.4
0.7
G.L. : 0.00 m
1.50 m Predrilled
EOH: MAX PUSH 8T
SWL: -1.61M
u = 0.97 I = 1.91

u2
cm² cm² 150 10
Date :Cone no. :Project no. :
CPT no. :
Test according NEN 5140 class 1Project :Location:Position:
St Mary's BaySt Mary's Bay Road Reserve0, 0 RD
11/12/2017S10CFIIP.S16083
DF17GE038CPT_24 3/15
Corrected cone resistance (qt) in MPaD
epth
in m
to re
fere
nce
leve
l ()
0
-1
-2
-3
-4
-5
-6
-7
-8
-9
-10
-11
-12
-13
-14
-15
-16
-17
-18
-19
-20
-21
-22
-23
-24
2 4 6 8 10 12 14 16 18 20 22 24 26 28 30
1.45
G.L. : 0.00 m
1.50 m Predrilled
EOH: MAX PUSH 8T
SWL: -1.61M

u2
cm² cm² 150 10
Date :Cone no. :Project no. :
CPT no. :
Test according NEN 5140 class 1Project :Location:Position:
St Mary's BaySt Mary's Bay Road Reserve0, 0 RD
11/12/2017S10CFIIP.S16083
DF17GE038CPT_24 4/15
Excess pore pressure (du) in MPa Dynamic pore pressure ratio (u/qc) in MPaD
epth
in m
to re
fere
nce
leve
l ()
0
-1
-2
-3
-4
-5
-6
-7
-8
-9
-10
-11
-12
-13
-14
-15
-16
-17
-18
-19
-20
-21
-22
-23
-24
-0.1 0.0 0.1 0.2 0.3 0.4 0.5 0.6 0.7 0.8 01234
1.45
0.97 ->
1.27 ->
1.14 ->1.16 ->
G.L. : 0.00 m
1.50 m Predrilled
EOH: MAX PUSH 8T
SWL: -1.61M

u2
cm² cm² 150 10
Date :Cone no. :Project no. :
CPT no. :
Test according NEN 5140 class 1Project :Location:Position:
St Mary's BaySt Mary's Bay Road Reserve0, 0 RD
11/12/2017S10CFIIP.S16083
DF17GE038CPT_24 5/15
Effective cone resistance (qe) in MPaD
epth
in m
to re
fere
nce
leve
l ()
0
-1
-2
-3
-4
-5
-6
-7
-8
-9
-10
-11
-12
-13
-14
-15
-16
-17
-18
-19
-20
-21
-22
-23
-24
2 4 6 8 10 12 14 16 18 20 22 24 26 28 30
1.45
G.L. : 0.00 m
1.50 m Predrilled
EOH: MAX PUSH 8T
SWL: -1.61M

u2
cm² cm² 150 10
Date :Cone no. :Project no. :
CPT no. :
Test according NEN 5140 class 1Project :Location:Position:
St Mary's BaySt Mary's Bay Road Reserve0, 0 RD
11/12/2017S10CFIIP.S16083
DF17GE038CPT_24 6/15
Total vertical stress (rov;z) in kPa
Effective vertical stress (rov;z̀ ) in kPa
Dep
th in
m to
refe
renc
e le
vel (
)
0
-1
-2
-3
-4
-5
-6
-7
-8
-9
-10
-11
-12
-13
-14
-15
-16
-17
-18
-19
-20
-21
-22
-23
-24
50 100 150 200 250 300 350 400 450 500 550 600 650 700 750
100 200 300 400 500 600 700
1.45
G.L. : 0.00 m
1.50 m Predrilled
EOH: MAX PUSH 8T
SWL: -1.61M

u2
cm² cm² 150 10
Date :Cone no. :Project no. :
CPT no. :
Test according NEN 5140 class 1Project :Location:Position:
St Mary's BaySt Mary's Bay Road Reserve0, 0 RD
11/12/2017S10CFIIP.S16083
DF17GE038CPT_24 7/15
Net cone resistance (qn) in MPa Pore pressure ratio (Bq)D
epth
in m
to re
fere
nce
leve
l ()
0
-1
-2
-3
-4
-5
-6
-7
-8
-9
-10
-11
-12
-13
-14
-15
-16
-17
-18
-19
-20
-21
-22
-23
-24
2 4 6 8 10 12 14 16 18 20 0.00.20.40.60.8
1.45
G.L. : 0.00 m
1.50 m Predrilled
EOH: MAX PUSH 8T
SWL: -1.61M

u2
cm² cm² 150 10
Date :Cone no. :Project no. :
CPT no. :
Test according NEN 5140 class 1Project :Location:Position:
St Mary's BaySt Mary's Bay Road Reserve0, 0 RD
11/12/2017S10CFIIP.S16083
DF17GE038CPT_24 8/15
Normalised cone resistance (qnorm) [Qt] Normalised friction ratio (fnorm) in %D
epth
in m
to re
fere
nce
leve
l ()
0
-1
-2
-3
-4
-5
-6
-7
-8
-9
-10
-11
-12
-13
-14
-15
-16
-17
-18
-19
-20
-21
-22
-23
-24
50 100 150 200 250 300 350 400 450 500 246810
1.45
G.L. : 0.00 m
1.50 m Predrilled
EOH: MAX PUSH 8T
SWL: -1.61M

u2
cm² cm² 150 10
Date :Cone no. :Project no. :
CPT no. :
Test according NEN 5140 class 1Project :Location:Position:
St Mary's BaySt Mary's Bay Road Reserve0, 0 RD
11/12/2017S10CFIIP.S16083
DF17GE038CPT_24 9/15
Soil behaviour type index (Ic)D
epth
in m
to re
fere
nce
leve
l ()
0
-1
-2
-3
-4
-5
-6
-7
-8
-9
-10
-11
-12
-13
-14
-15
-16
-17
-18
-19
-20
-21
-22
-23
-24
0.5 1.0 1.5 2.0 2.5 3.0 3.5 4.0 4.5 5.0 5.5 6.0 6.5 7.0 7.5
1.45
7 6 5 4 3 2
(2) Organic soils(3) Clay(4) Silt mixtures(5) Sand mixtures(6) Sand clean to silty(7) Gravelly sand
G.L. : 0.00 m
1.50 m Predrilled

u2
cm² cm² 150 10
Date :Cone no. :Project no. :
CPT no. :
Test according NEN 5140 class 1Project :Location:Position:
St Mary's BaySt Mary's Bay Road Reserve0, 0 RD
11/12/2017S10CFIIP.S16083
DF17GE038CPT_24 10/15
Undrained shear strength (Su) in kPaD
epth
in m
to re
fere
nce
leve
l ()
0
-1
-2
-3
-4
-5
-6
-7
-8
-9
-10
-11
-12
-13
-14
-15
-16
-17
-18
-19
-20
-21
-22
-23
-24
100 200 300 400 500 600 700 800 900 1000 1100 1200 1300 1400 1500
1.45
G.L. : 0.00 m
1.50 m Predrilled
EOH: MAX PUSH 8T
SWL: -1.61M

u2
cm² cm² 150 10
Date :Cone no. :Project no. :
CPT no. :
Test according NEN 5140 class 1Project :Location:Position:
St Mary's BaySt Mary's Bay Road Reserve0, 0 RD
11/12/2017S10CFIIP.S16083
DF17GE038CPT_24 11/15
Relative density (consolidated) in %
Relative density (over-consolidated) in %
Dep
th in
m to
refe
renc
e le
vel (
)
0
-1
-2
-3
-4
-5
-6
-7
-8
-9
-10
-11
-12
-13
-14
-15
-16
-17
-18
-19
-20
-21
-22
-23
-24
10 20 30 40 50 60 70 80 90 100 110 120 130 140 150
20 40 60 80 100 120 140
1.45
G.L. : 0.00 m
1.50 m Predrilled
EOH: MAX PUSH 8T
SWL: -1.61M

u2
cm² cm² 150 10
Date :Cone no. :Project no. :
CPT no. :
Test according NEN 5140 class 1Project :Location:Position:
St Mary's BaySt Mary's Bay Road Reserve0, 0 RD
11/12/2017S10CFIIP.S16083
DF17GE038CPT_24 12/15
Equivalent SPT N60 ValueD
epth
in m
to re
fere
nce
leve
l ()
0
-1
-2
-3
-4
-5
-6
-7
-8
-9
-10
-11
-12
-13
-14
-15
-16
-17
-18
-19
-20
-21
-22
-23
-24
5 10 15 20 25 30 35 40 45 50 55 60 65 70 75
1.45
G.L. : 0.00 m
1.50 m Predrilled
EOH: MAX PUSH 8T
SWL: -1.61M
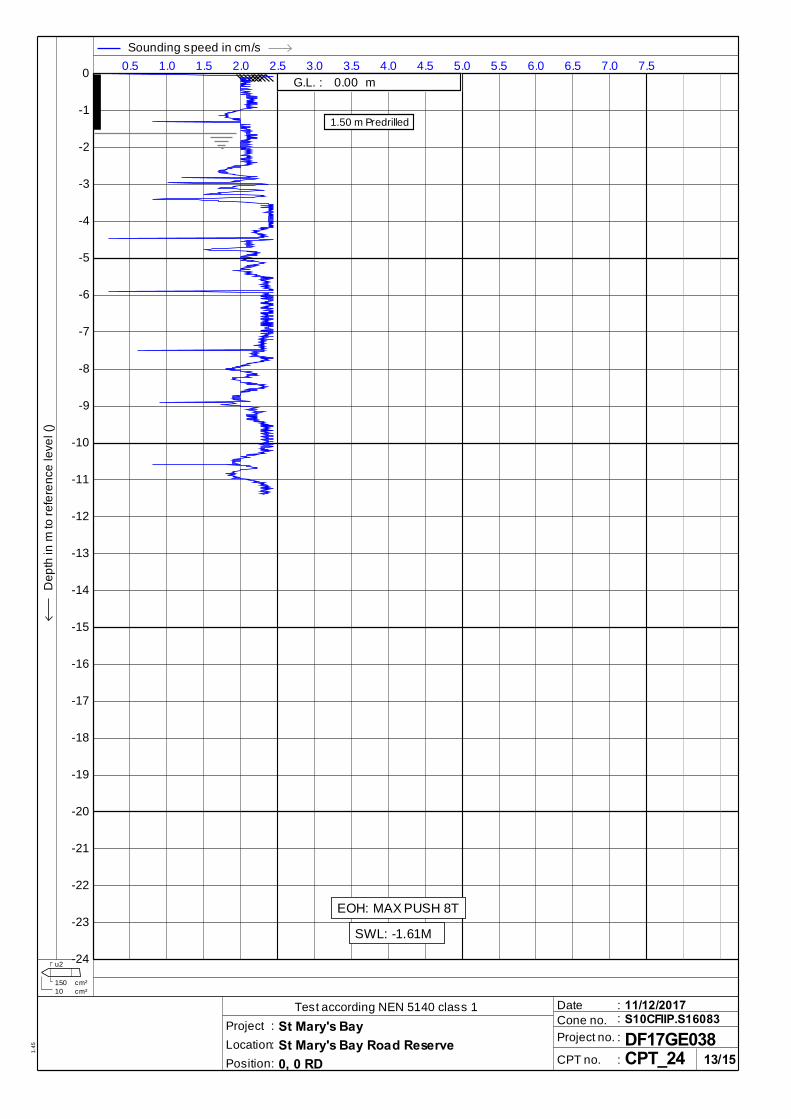
u2
cm² cm² 150 10
Date :Cone no. :Project no. :
CPT no. :
Test according NEN 5140 class 1Project :Location:Position:
St Mary's BaySt Mary's Bay Road Reserve0, 0 RD
11/12/2017S10CFIIP.S16083
DF17GE038CPT_24 13/15
Sounding speed in cm/sD
epth
in m
to re
fere
nce
leve
l ()
0
-1
-2
-3
-4
-5
-6
-7
-8
-9
-10
-11
-12
-13
-14
-15
-16
-17
-18
-19
-20
-21
-22
-23
-24
0.5 1.0 1.5 2.0 2.5 3.0 3.5 4.0 4.5 5.0 5.5 6.0 6.5 7.0 7.5
1.45
G.L. : 0.00 m
1.50 m Predrilled
EOH: MAX PUSH 8T
SWL: -1.61M

u2
cm² cm² 150 10
Dep
th in
m to
refe
renc
e le
vel (
)
Date :Cone no. :Project no. :
CPT no. :
Test according NEN 5140 class 1Project :Location:Position:
St Mary's BaySt Mary's Bay Road Reserve0, 0 RD
11/12/2017S10CFIIP.S16083
DF17GE038CPT_24 14/15
0
-1
-2
-3
-4
-5
-6
-7
-8
-9
-10
-11
-12
-13
-14
-15
-16
-17
-18
-19
-20
-21
-22
-23
-24
1.45
(3)
(0)
(5)
(3)
(5)
(3)
(4)
(4)(5)
(4)
(5)
(4)
(5)
(5)(4)
Soil (Qt, Fr) Soil (Qt, Bq) Soil (Average)
Soil behaviour type classification after Robertson 1990
(0) Not defined(1) Sensitive, fine grained(2) Organic soils-peats(3) Clays-clay to silty clay(4) Clayey silt to silty clay(5) Sand mixtures(6) Sands(7) Gravelly sand to sand(8) Very stiff sand to clayey sand(9) Very stiff fine grained
(3)
(3)
(3)(6)(0)
(4)
(3)
(5)
(3)
(4)
(3)
(4)
(3)
(4)
(3)
(3)
Soil (Qt, Fr) Soil (Qt, Bq) Soil (Average)
Soil behaviour type classification after Robertson 1990
(0) Not defined(1) Sensitive, fine grained(2) Organic soils-peats(3) Clays-clay to silty clay(4) Clayey silt to silty clay(5) Sand mixtures(6) Sands(7) Gravelly sand to sand(8) Very stiff sand to clayey sand(9) Very stiff fine grained
(3)
(0)
(6)(0)
(4)
(5)
(4)
(4)(4)
(4)
(4)
(4)
(4)
(4)
Soil (Qt, Fr) Soil (Qt, Bq) Soil (Average)
Soil behaviour type classification after Robertson 1990
(0) Not defined(1) Sensitive, fine grained(2) Organic soils-peats(3) Clays-clay to silty clay(4) Clayey silt to silty clay(5) Sand mixtures(6) Sands(7) Gravelly sand to sand(8) Very stiff sand to clayey sand(9) Very stiff fine grained
G.L. : 0.00 m
1.50 m Predrilled

u2
cm² cm² 150 10
Date :Cone no. :Project no. :
CPT no. :
Test according NEN 5140 class 1Project :Location:Position:
St Mary's BaySt Mary's Bay Road Reserve0, 0 RD
11/12/2017S10CFIIP.S16083
DF17GE038CPT_24 15/15
Internal friction angle in degreesD
epth
in m
to re
fere
nce
leve
l ()
0
-1
-2
-3
-4
-5
-6
-7
-8
-9
-10
-11
-12
-13
-14
-15
-16
-17
-18
-19
-20
-21
-22
-23
-24
5 10 15 20 25 30 35 40 45 50 55 60 65 70 75
1.45
G.L. : 0.00 m
1.50 m Predrilled
EOH: MAX PUSH 8T
SWL: -1.61M

u2
cm² cm² 150 10
u2
cm² cm² 150 10
Date :Cone no. :Project no. :
CPT no. :
Test according NEN 5140 class 1Project :Location:Position:
St Mary's BaySt Mary's Bay Road Reserve0, 0 RD
11/12/2017S10CFIIP.S16083
DF17GE038CPT_25 1/15
Cone resistance (qc) in MPa Friction ratio (Rf) in %
Sleeve friction (fs) in MPa Inclination (I) in degrx
Dep
th in
m to
refe
renc
e le
vel (
)
0
-1
-2
-3
-4
-5
-6
-7
-8
-9
-10
-11
-12
-13
-14
-15
-16
-17
-18
-19
-20
-21
-22
-23
-24
2 4 6 8 10 12 14 16 18 20 246810
0.10 0.20 0.30 0.40 0.50
1.45
0.5
1.2
2.2
3.0
3.2
3.3
G.L. : 0.00 m
1.50 m Predrilled
EOH: MAX PUSH 8T
SWL: -1.72M
qc = 6.98fs = 0.14 I = 3.83Final depth = 6.98

u2
cm² cm² 150 10
Date :Cone no. :Project no. :
CPT no. :
Test according NEN 5140 class 1Project :Location:Position:
St Mary's BaySt Mary's Bay Road Reserve0, 0 RD
11/12/2017S10CFIIP.S16083
DF17GE038CPT_25 2/15
Dynamic pore pressure (u2) in MPa
Equilibirum pore pressure (u0) in MPa Inclination (I) in degrx
Dep
th in
m to
refe
renc
e le
vel (
)
0
-1
-2
-3
-4
-5
-6
-7
-8
-9
-10
-11
-12
-13
-14
-15
-16
-17
-18
-19
-20
-21
-22
-23
-24
-0.1 0.0 0.1 0.2 0.3 0.4 0.5 0.6 0.7 0.8 0.9 1.0 1.1 1.2 1.3
0.00 0.20 0.40 0.60 0.80 1.00 1.20
1.45
1.81 ->1.93 ->2.85 ->2.52 ->2.49 ->3.59 ->3.04 ->
0.5
1.2
2.2
3.0
3.2
3.3
G.L. : 0.00 m
1.50 m Predrilled
EOH: MAX PUSH 8T
SWL: -1.72M
u = 2.83 I = 3.83

u2
cm² cm² 150 10
Date :Cone no. :Project no. :
CPT no. :
Test according NEN 5140 class 1Project :Location:Position:
St Mary's BaySt Mary's Bay Road Reserve0, 0 RD
11/12/2017S10CFIIP.S16083
DF17GE038CPT_25 3/15
Corrected cone resistance (qt) in MPaD
epth
in m
to re
fere
nce
leve
l ()
0
-1
-2
-3
-4
-5
-6
-7
-8
-9
-10
-11
-12
-13
-14
-15
-16
-17
-18
-19
-20
-21
-22
-23
-24
2 4 6 8 10 12 14 16 18 20 22 24 26 28 30
1.45
G.L. : 0.00 m
1.50 m Predrilled
EOH: MAX PUSH 8T
SWL: -1.72M

u2
cm² cm² 150 10
Date :Cone no. :Project no. :
CPT no. :
Test according NEN 5140 class 1Project :Location:Position:
St Mary's BaySt Mary's Bay Road Reserve0, 0 RD
11/12/2017S10CFIIP.S16083
DF17GE038CPT_25 4/15
Excess pore pressure (du) in MPa Dynamic pore pressure ratio (u/qc) in MPaD
epth
in m
to re
fere
nce
leve
l ()
0
-1
-2
-3
-4
-5
-6
-7
-8
-9
-10
-11
-12
-13
-14
-15
-16
-17
-18
-19
-20
-21
-22
-23
-24
-0.1 0.0 0.1 0.2 0.3 0.4 0.5 0.6 0.7 0.8 01234
1.45
1.43 ->1.79 ->2.76 ->2.46 ->2.43 ->3.81 ->2.61 ->
G.L. : 0.00 m
1.50 m Predrilled
EOH: MAX PUSH 8T
SWL: -1.72M

u2
cm² cm² 150 10
Date :Cone no. :Project no. :
CPT no. :
Test according NEN 5140 class 1Project :Location:Position:
St Mary's BaySt Mary's Bay Road Reserve0, 0 RD
11/12/2017S10CFIIP.S16083
DF17GE038CPT_25 5/15
Effective cone resistance (qe) in MPaD
epth
in m
to re
fere
nce
leve
l ()
0
-1
-2
-3
-4
-5
-6
-7
-8
-9
-10
-11
-12
-13
-14
-15
-16
-17
-18
-19
-20
-21
-22
-23
-24
2 4 6 8 10 12 14 16 18 20 22 24 26 28 30
1.45
G.L. : 0.00 m
1.50 m Predrilled
EOH: MAX PUSH 8T
SWL: -1.72M

u2
cm² cm² 150 10
Date :Cone no. :Project no. :
CPT no. :
Test according NEN 5140 class 1Project :Location:Position:
St Mary's BaySt Mary's Bay Road Reserve0, 0 RD
11/12/2017S10CFIIP.S16083
DF17GE038CPT_25 6/15
Total vertical stress (rov;z) in kPa
Effective vertical stress (rov;z̀ ) in kPa
Dep
th in
m to
refe
renc
e le
vel (
)
0
-1
-2
-3
-4
-5
-6
-7
-8
-9
-10
-11
-12
-13
-14
-15
-16
-17
-18
-19
-20
-21
-22
-23
-24
50 100 150 200 250 300 350 400 450 500 550 600 650 700 750
100 200 300 400 500 600 700
1.45
G.L. : 0.00 m
1.50 m Predrilled
EOH: MAX PUSH 8T
SWL: -1.72M
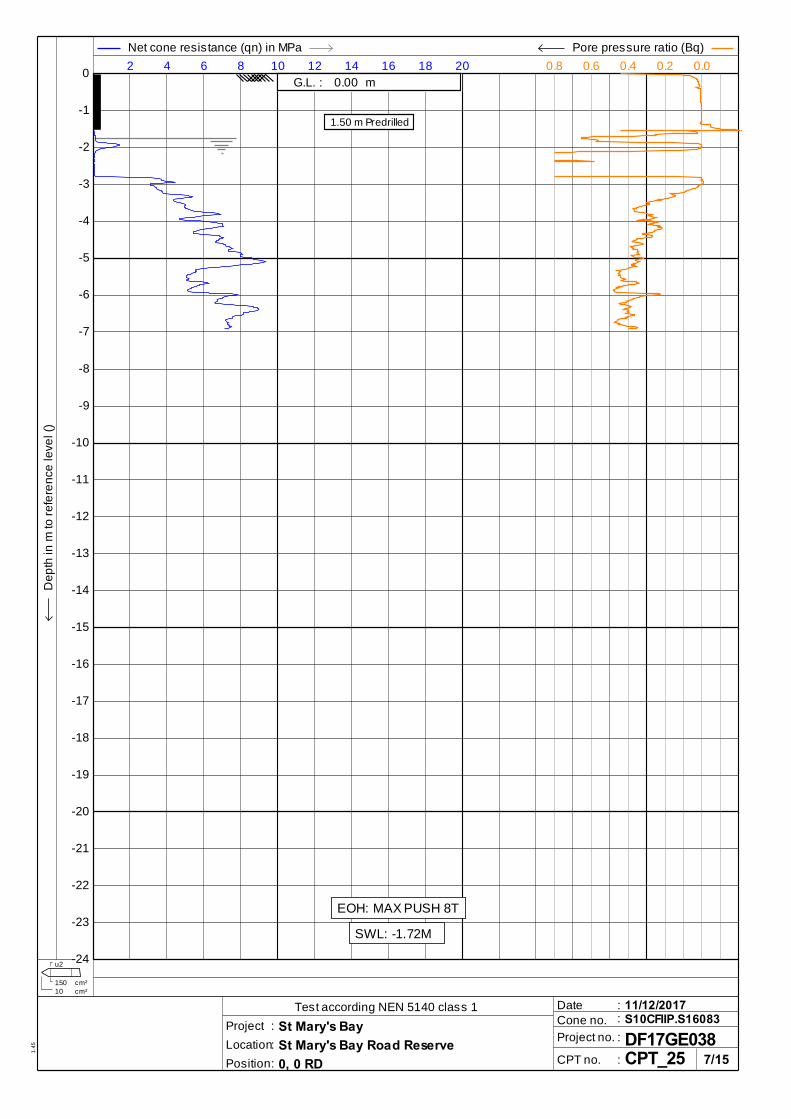
u2
cm² cm² 150 10
Date :Cone no. :Project no. :
CPT no. :
Test according NEN 5140 class 1Project :Location:Position:
St Mary's BaySt Mary's Bay Road Reserve0, 0 RD
11/12/2017S10CFIIP.S16083
DF17GE038CPT_25 7/15
Net cone resistance (qn) in MPa Pore pressure ratio (Bq)D
epth
in m
to re
fere
nce
leve
l ()
0
-1
-2
-3
-4
-5
-6
-7
-8
-9
-10
-11
-12
-13
-14
-15
-16
-17
-18
-19
-20
-21
-22
-23
-24
2 4 6 8 10 12 14 16 18 20 0.00.20.40.60.8
1.45
G.L. : 0.00 m
1.50 m Predrilled
EOH: MAX PUSH 8T
SWL: -1.72M

u2
cm² cm² 150 10
Date :Cone no. :Project no. :
CPT no. :
Test according NEN 5140 class 1Project :Location:Position:
St Mary's BaySt Mary's Bay Road Reserve0, 0 RD
11/12/2017S10CFIIP.S16083
DF17GE038CPT_25 8/15
Normalised cone resistance (qnorm) [Qt] Normalised friction ratio (fnorm) in %D
epth
in m
to re
fere
nce
leve
l ()
0
-1
-2
-3
-4
-5
-6
-7
-8
-9
-10
-11
-12
-13
-14
-15
-16
-17
-18
-19
-20
-21
-22
-23
-24
50 100 150 200 250 300 350 400 450 500 246810
1.45
G.L. : 0.00 m
1.50 m Predrilled
EOH: MAX PUSH 8T
SWL: -1.72M

u2
cm² cm² 150 10
Date :Cone no. :Project no. :
CPT no. :
Test according NEN 5140 class 1Project :Location:Position:
St Mary's BaySt Mary's Bay Road Reserve0, 0 RD
11/12/2017S10CFIIP.S16083
DF17GE038CPT_25 9/15
Soil behaviour type index (Ic)D
epth
in m
to re
fere
nce
leve
l ()
0
-1
-2
-3
-4
-5
-6
-7
-8
-9
-10
-11
-12
-13
-14
-15
-16
-17
-18
-19
-20
-21
-22
-23
-24
0.5 1.0 1.5 2.0 2.5 3.0 3.5 4.0 4.5 5.0 5.5 6.0 6.5 7.0 7.5
1.45
7 6 5 4 3 2
(2) Organic soils(3) Clay(4) Silt mixtures(5) Sand mixtures(6) Sand clean to silty(7) Gravelly sand
G.L. : 0.00 m
1.50 m Predrilled

u2
cm² cm² 150 10
Date :Cone no. :Project no. :
CPT no. :
Test according NEN 5140 class 1Project :Location:Position:
St Mary's BaySt Mary's Bay Road Reserve0, 0 RD
11/12/2017S10CFIIP.S16083
DF17GE038CPT_25 10/15
Undrained shear strength (Su) in kPaD
epth
in m
to re
fere
nce
leve
l ()
0
-1
-2
-3
-4
-5
-6
-7
-8
-9
-10
-11
-12
-13
-14
-15
-16
-17
-18
-19
-20
-21
-22
-23
-24
100 200 300 400 500 600 700 800 900 1000 1100 1200 1300 1400 1500
1.45
G.L. : 0.00 m
1.50 m Predrilled
EOH: MAX PUSH 8T
SWL: -1.72M

u2
cm² cm² 150 10
Date :Cone no. :Project no. :
CPT no. :
Test according NEN 5140 class 1Project :Location:Position:
St Mary's BaySt Mary's Bay Road Reserve0, 0 RD
11/12/2017S10CFIIP.S16083
DF17GE038CPT_25 11/15
Relative density (consolidated) in %
Relative density (over-consolidated) in %
Dep
th in
m to
refe
renc
e le
vel (
)
0
-1
-2
-3
-4
-5
-6
-7
-8
-9
-10
-11
-12
-13
-14
-15
-16
-17
-18
-19
-20
-21
-22
-23
-24
10 20 30 40 50 60 70 80 90 100 110 120 130 140 150
20 40 60 80 100 120 140
1.45
G.L. : 0.00 m
1.50 m Predrilled
EOH: MAX PUSH 8T
SWL: -1.72M

u2
cm² cm² 150 10
Date :Cone no. :Project no. :
CPT no. :
Test according NEN 5140 class 1Project :Location:Position:
St Mary's BaySt Mary's Bay Road Reserve0, 0 RD
11/12/2017S10CFIIP.S16083
DF17GE038CPT_25 12/15
Equivalent SPT N60 ValueD
epth
in m
to re
fere
nce
leve
l ()
0
-1
-2
-3
-4
-5
-6
-7
-8
-9
-10
-11
-12
-13
-14
-15
-16
-17
-18
-19
-20
-21
-22
-23
-24
5 10 15 20 25 30 35 40 45 50 55 60 65 70 75
1.45
G.L. : 0.00 m
1.50 m Predrilled
EOH: MAX PUSH 8T
SWL: -1.72M

u2
cm² cm² 150 10
Date :Cone no. :Project no. :
CPT no. :
Test according NEN 5140 class 1Project :Location:Position:
St Mary's BaySt Mary's Bay Road Reserve0, 0 RD
11/12/2017S10CFIIP.S16083
DF17GE038CPT_25 13/15
Sounding speed in cm/sD
epth
in m
to re
fere
nce
leve
l ()
0
-1
-2
-3
-4
-5
-6
-7
-8
-9
-10
-11
-12
-13
-14
-15
-16
-17
-18
-19
-20
-21
-22
-23
-24
0.5 1.0 1.5 2.0 2.5 3.0 3.5 4.0 4.5 5.0 5.5 6.0 6.5 7.0 7.5
1.45
G.L. : 0.00 m
1.50 m Predrilled
EOH: MAX PUSH 8T
SWL: -1.72M

u2
cm² cm² 150 10
Dep
th in
m to
refe
renc
e le
vel (
)
Date :Cone no. :Project no. :
CPT no. :
Test according NEN 5140 class 1Project :Location:Position:
St Mary's BaySt Mary's Bay Road Reserve0, 0 RD
11/12/2017S10CFIIP.S16083
DF17GE038CPT_25 14/15
0
-1
-2
-3
-4
-5
-6
-7
-8
-9
-10
-11
-12
-13
-14
-15
-16
-17
-18
-19
-20
-21
-22
-23
-24
1.45
(3)
(0)
(5)
(5)
(5)
(5)
(5)
Soil (Qt, Fr) Soil (Qt, Bq) Soil (Average)
Soil behaviour type classification after Robertson 1990
(0) Not defined(1) Sensitive, fine grained(2) Organic soils-peats(3) Clays-clay to silty clay(4) Clayey silt to silty clay(5) Sand mixtures(6) Sands(7) Gravelly sand to sand(8) Very stiff sand to clayey sand(9) Very stiff fine grained
(3)
(0)(6)
(0)
Soil (Qt, Fr) Soil (Qt, Bq) Soil (Average)
Soil behaviour type classification after Robertson 1990
(0) Not defined(1) Sensitive, fine grained(2) Organic soils-peats(3) Clays-clay to silty clay(4) Clayey silt to silty clay(5) Sand mixtures(6) Sands(7) Gravelly sand to sand(8) Very stiff sand to clayey sand(9) Very stiff fine grained
(3)
(0)
(6)
(0)
Soil (Qt, Fr) Soil (Qt, Bq) Soil (Average)
Soil behaviour type classification after Robertson 1990
(0) Not defined(1) Sensitive, fine grained(2) Organic soils-peats(3) Clays-clay to silty clay(4) Clayey silt to silty clay(5) Sand mixtures(6) Sands(7) Gravelly sand to sand(8) Very stiff sand to clayey sand(9) Very stiff fine grained
G.L. : 0.00 m
1.50 m Predrilled

u2
cm² cm² 150 10
Date :Cone no. :Project no. :
CPT no. :
Test according NEN 5140 class 1Project :Location:Position:
St Mary's BaySt Mary's Bay Road Reserve0, 0 RD
11/12/2017S10CFIIP.S16083
DF17GE038CPT_25 15/15
Internal friction angle in degreesD
epth
in m
to re
fere
nce
leve
l ()
0
-1
-2
-3
-4
-5
-6
-7
-8
-9
-10
-11
-12
-13
-14
-15
-16
-17
-18
-19
-20
-21
-22
-23
-24
5 10 15 20 25 30 35 40 45 50 55 60 65 70 75
1.45
G.L. : 0.00 m
1.50 m Predrilled
EOH: MAX PUSH 8T
SWL: -1.72M

Table D-1: Laboratory Testing Register
Bore-
hole
Depth
from
(m
BGL)
Depth
to (m
BGL)
Sample
Type
Layer
Code
Testing
Lab
Testing
Tu
be
Lo
g +
SV
Bu
lk D
en
sit
y +
MC
PS
D -
Hy
dro
mete
r
PS
D -
We
t S
ieve
Att
erb
erg
Lim
it
Tri
ax
ial
(UU
)
Tri
ax
ial
(CU
)
UC
S
Petr
og
rap
hy
BH01 19.9 20.12 HQ3 EUz2 Opus
Y
BH01 22.04 22.2 HQ3 EUz2 Opus
Y
BH01 27 27.47 HQ3 EUs2 Opus
Y
BH04 3.89 4.1 HQ3 EUs2 Opus
Y
BH04 5.25 5.41 HQ3 EUs2 Opus
Y
BH04 5.75 6 HQ3 EUz Opus
Y
BH04 13.3 13.49 HQ3 EUs Opus
Y
BH06 20.12 20.36 HQ3 EUs Opus
Y
BH06 20.63 20.86 HQ3 EUs Opus
Y
BH06 21.87 22.02 HQ3 EUs Opus
Y
BH07B
6.63 6.77 HQ3 EUs2 Opus
Y
BH07B
8.94 9.1 HQ3 EUs Opus
Y
BH07B
1.3 1.5 HA150 Fg Babbage
Y
BH08 4.22 4.5 HQ3 EWs Opus
Y
BH08 5.27 5.43 HQ3 EUs Opus
Y
BH08 6.95 7.13 HQ3 EUs Opus
Y
BH08 3 3.45 U54 Fg Babbage Y
Y Y
Y
BH08 13.5 13.69 HQ3 EUs3 Opus
Y
BH08 12.41 12.57 HQ3 EUs3 Opus
Y
BH08 14.07 14.31 HQ3 EUs3 Apsar
Y Y*
BH09A
1.5 1.65 HQ3 Fc Babbage
BH09A
1.8 2.25 SPT Fc Babbage
Y
BH09A
3 3.45 SPT Fc Babbage
Y
BH20 1.6 1.75 HQ3 ERc Babbage
Y
BH20 3.45 3.62 HQ3 ERz Babbage
Y
Y
BH24 1.85 1.97 HQ3 Fg Babbage
Y
BH24 11.5 11.65 HQ3 EUs Babbage
Y
BH26 3 3.5 U54 TLs Babbage Y Y
Y
BH26 13.11 13.29 HQ3 EUs2 Babbage
Y
BH26 12.88 12.83 HQ3 EUs2 Apsar
Y*
BH26 13.82 13.95 HQ3 EUs3 Apsar
Y*
BH26 12.88 13.11 HQ3 EUs2 Opus
Y

Bore-
hole
Depth
from
(m
BGL)
Depth
to (m
BGL)
Sample
Type
Layer
Code
Testing
Lab
Testing
Tu
be
Lo
g +
SV
Bu
lk D
en
sit
y +
MC
PS
D -
Hy
dro
mete
r
PS
D -
We
t S
ieve
Att
erb
erg
Lim
it
Tri
ax
ial
(UU
)
Tri
ax
ial
(CU
)
UC
S
Petr
og
rap
hy
BH27 7.5 7.95 SPT ERs Babbage
Y
BH27 7.95 8.1 HQ3 ERs Babbage
Y
BH27 8.4 8.67 HQ3 EWs Babbage
Y Y Y
BH30 4.95 5.1 HQ3 ERs Babbage
Y
BH30 5.8 5.9 HQ3 ERs Babbage
Y
BH30 6.79 7.01 HQ3 EWz Babbage
Y
Y
BH30 11.41 11.52 HQ3 EUz Babbage
Y
BH30 12.6 12.77 HQ3 EUz Opus
Y
BH30 11.52 11.66 HQ3 EUz Apsar
Y*
MA01 1.45 1.65 HQ3 TLs Babbage
Y
MA01 1.7 2.2 U54 TLs Babbage Y
Y
Y
MA01 2.2 2.7 U54 TLs/TLz
Babbage Y Y
Y
MA03 0.5 1 U54 TLs Babbage Y Y
Y
MA03 1 1.5 U54 TLs/TLc
Babbage Y Y
Y
MA03 2.3 2.8 U54 TAc Babbage Y Y
Y
MA03 8.2 8.48 HQ3 EUs Opus
Y
Triaxial Tests: UU = Unconsolidated Undrained Triaxial; CU = Consolidated Undrained Triaxial *Currently awaiting Rock Petrography report – will be included in future revision.

Aurecon
Currently awaiting Rock Petrography report – will be included in future revision.

Babbage Geotechnical Laboratory Level 4 68 Beach Road P O Box 2027 Auckland 1010 New Zealand Telephone 64-9-367 4954 E-mail [email protected]
200010725 Hackett Diversion Tube Log Report.docx
BGL is an operating division of Babbage Consultants Limited
Please reply to: W.E. Campton Page 1 of 2
Aurecon New Zealand Limited PO Box 9762 Newmarket Auckland 1149 Attention: JAMES ELVY
Job Number: 60770#L BGL Registration Number: 2439 Checked by: WEC
24th July 2017
DESCRIPTION & LOG OF PUSH-TUBE SOILS Dear Sir, Re: HACKETT DIVERSION
BGL Report Number: 60770#L/Hackett Diversion Tube Log The following report presents visual descriptions, lab test results and photographs of the soils contained within a 54mm diameter undisturbed push-tube sample delivered to this laboratory on the 12th of July 2017. These descriptions were made in accordance with the following standards, and are presented on a form based upon a design supplied by Aurecon. Field Description of Soil and Rock: Guideline for the Field Classification and Description of NZ Geotechnical Society Inc. December 2005 Soil and Rock for Engineering Purposes: Vane Shear Strength: NZ Geotechnical Society Guideline 2001 Thank you for the opportunity to carry out these sample descriptions. If you have any queries regarding the content of this report please contact the undersigned at your convenience. Yours faithfully, Justin Franklin Assistant Laboratory Manager Babbage Geotechnical Laboratory

UNDISTURBED (THIN TUBE / PISTON SAMPLE) SHEET
JOB NAME: HACKETT DIVERSION
Sample Type / Diameter: U54 / 54mm Hole Number: BH08 Recorded Depth of
Top of Sample: 3.00m Recorded Depth of Bottom of Sample: 3.45m
Length of Soil in Tube: 530mm Length of Tube: 600mm
Distance Tube was Pushed: 450mm Recovery %: 118 %
Sampled By: AURECON Date Sampled: 10/05/2017
Peak Shear Vane (top): not suitable for vane -
sand
Peak Shear Vane (bottom): not suitable for vane - sand Remoulded Shear Vane (top): Remoulded Shear Vane (bottom):
Sample Condition: undisturbed Material Type: SAND, SHELLS, CLAY
EXTRUDED MATERIAL DESCRIPTION (visual observation and behaviour)
Depth
(m) Material Description Lab Testing
TOP OF TUBE
WET SIEVE SAMPLE 2.90 2.91 – 2.98m
water content = 28.2 % SAND, fine to medium, non- Gravel = 0 % plastic, mottled grey & dark grey, Sand = 86 % slightly moist. Silt & Clay fractions = 14 %
3.00 CLAY, soft to firm, highly plastic, grey & light grey, very moist. LIMITS SAMPLE Intermixed fine to medium SAND 2.98 – 3.09m & 3.20 – 3.25m & CLAY, grey with black spots, water content = 56.5 % slightly moist to moist. liquid limit = 59
3.10 SAND, fine to medium, non- plastic limit = 21 3.10m plastic, grey with thin black plasticity index = 38 bands, slightly moist. CUM TRIAXIAL Thin yellowish brown band. 3.09 – 3.20m
3.20 CLAY, soft to firm, highly plastic, water content = 50.5 % 3.20m grey, very moist, complete bulk density = 1.75 t/m3 cockle shell in centre of sample. dry density = 1.16 t/m3 CLAY, soft to firm, highly plastic, blackish dark grey, very moist, minor fine
3.30 shell material. Mix of highly plastic CLAY & finely comminuted shells, dark grey with white speckles.
Clean, finely comminuted shells
with occasional larger shell fragments.
3.40 SAND, fine to coarse, very weakly cemented, non-plastic, grey & dark orange, slightly moist.
1cm of WAX BOTTOM OF TUBE
3.50
Page 2 of 2
TR
IA
XIA
L S
AM
PLE

Babbage Geotechnical Laboratory Level 4 68 Beach Road P O Box 2027 Auckland 1010 New Zealand Telephone 64-9-367 4954 E-mail [email protected]
200016649 Tube Log Report St Marys Bay.docx
BGL is an operating division of Babbage Consultants Limited
Please reply to: W.E. Campton Page 1 of 7
Aurecon New Zealand Limited PO Box 9762 Newmarket Auckland 1149 Attention: ISABELLA MERSCHDORF
Job Number: 61256#L BGL Registration Number: 2520 Checked by: WEC
14th March 2018
DESCRIPTION & LOG OF PUSH-TUBE SOILS Dear Isabella,
Re: ST MARYS BAY Report Number: 61256#L/St Marys Bay Tube Logs The following report presents visual descriptions, lab test results and photographs of the soils contained within 54mm diameter undisturbed push-tube samples delivered to this laboratory on the 13th of February 2018. These descriptions were made in accordance with the following standards, and are presented on a form based upon a design supplied by Aurecon. Field Description of Soil and Rock: Guideline for the Field Classification and Description of NZ Geotechnical Society Inc. December 2005 Soil and Rock for Engineering Purposes: Vane Shear Strength: NZ Geotechnical Society Guideline 2001 Thank you for the opportunity to carry out these sample descriptions. If you have any queries regarding the content of this report please contact the undersigned at your convenience. Yours faithfully, Justin Franklin Assistant Laboratory Manager Babbage Geotechnical Laboratory

UNDISTURBED (THIN TUBE / PISTON SAMPLE) SHEET
JOB NAME: ST MARYS BAY
Sample Type / Diameter: U54 / 54mm Hole Number: BH26 Recorded Depth of
Top of Sample: 3.00m Recorded Depth of Bottom of Sample: 3.50m
Length of Soil in Tube: 480mm Length of Tube: 600mm
Distance Tube was Pushed: 500mm Recovery %: 96 %
Sampled By: AURECON Date Sampled: 13/02/2018
Peak Shear Vane (top): not carried out – sand in top of
tube
Peak Shear Vane (bottom): not carried out – sand in bottom of
tube Remoulded Shear Vane (top): Remoulded Shear Vane (bottom):
Sample Condition: disturbed down to 3.26m ? undisturbed below 3.26m Material Type: CLAY & SAND
EXTRUDED MATERIAL DESCRIPTION (visual observation and behaviour)
Photos (not to scale)
Depth (m)
Material Description Lab Testing
2.90 TOP OF TUBE
EMPTY SPACE
3.00
Intermixed CLAY, soft to firm,
3.10 highly plastic, grey, moist, AND
SAND, fine to coarse, non-
plastic, dark grey, moist,
common shell fragments,
(disturbed ?).
3.20
Small clast of orange & light grey
clay at 3.20m
DENSITY SAMPLE
3.28 – 3.38m
3.30 SAND, fine to coarse, non- water content = 30.5 %
plastic, dark grey with white bulk density = 1.72 t/m3
mottles, moist, common finely dry density = 1.32 t/m3
comminuted shells. air voids = 9.6 %
3.40 Thinly banded CLAY, firm, highly WET SIEVE SAMPLE
plastic, grey & light brownish 3.28 – 3.38m
grey, moist, trace organics, AND water content = 30.5 %
SAND, fine, silty, non-plastic, Gravel = 1 %
dark grey, moist. Sand = 97 %
3.50 EMPTY SPACE Silt & clay fractions = 2 %
BOTTOM OF TUBE
Page 2 of 7

UNDISTURBED (THIN TUBE / PISTON SAMPLE) SHEET
JOB NAME: ST MARYS BAY
Sample Type / Diameter: U54 / 54mm Hole Number: MA01 Recorded Depth of
Top of Sample: 1.70m Recorded Depth of Bottom of Sample: 2.20m
Length of Soil in Tube: 540mm Length of Tube: 600mm
Distance Tube was Pushed: 500mm Recovery %: 108 %
Sampled By: AURECON Date Sampled: 13/02/2018
Peak Shear Vane (top): not carried out – sand in top of
tube
Peak Shear Vane (bottom): not carried out – sand in bottom of
tube Remoulded Shear Vane (top): Remoulded Shear Vane (bottom):
Sample Condition: undisturbed Material Type: SAND
EXTRUDED MATERIAL DESCRIPTION (visual observation and behaviour)
Depth
(m) Material Description Lab Testing
1.60 TOP OF TUBE
EMPTY SPACE
1.70
1.80
1.90 SAND, fine to coarse, some silt,
trace organics, slightly plastic, WET SIEVE SAMPLE
dark grey with grey patches, 1.88 – 2.06m
moist to very moist, occasional water content = 40.9 %
pockets & lenses of highly Gravel = 0 %
2.00 plastic, grey clay. Sand = 81 %
Silt & clay fractions = 19 %
2.10 CUM TRIAXIAL
2.08 – 2.19m
water content = 37.2 %
bulk density = 1.82 t/m3
dry density = 1.32 t/m3
2.20
BOTTOM OF TUBE
Page 3 of 7

UNDISTURBED (THIN TUBE / PISTON SAMPLE) SHEET
JOB NAME: ST MARYS BAY
Sample Type / Diameter: U54 / 54mm Hole Number: MA01 Recorded Depth of
Top of Sample: 2.20m Recorded Depth of Bottom of Sample: 2.70m
Length of Soil in Tube: 540mm Length of Tube: 600mm
Distance Tube was Pushed: 500mm Recovery %: 108 %
Sampled By: AURECON Date Sampled: 13/02/2018
Peak Shear Vane (top): not carried out – sand in top of
tube
Peak Shear Vane (bottom): 12 kPa
Remoulded Shear Vane (top): Remoulded Shear Vane (bottom): 6 kPa
Sample Condition: undisturbed Material Type: SAND & CLAY
EXTRUDED MATERIAL DESCRIPTION (visual observation and behaviour)
Photos (not to scale)
Depth (m)
Material Description Lab Testing
SHEAR VANE
2.10 TOP OF TUBE kPa peak / kPa remoulded
EMPTY SPACE
2.20
SAND, fine to medium, trace
coarse grains, trace comminuted
shells, dark grey with white
2.30 mottles, very moist.
LIMITS SAMPLE
2.40 2.40 – 2.50m & 2.60 – 2.70m
water content = 51.6 %
liquid limit = 62
Intermixed CLAY, soft, highly plastic limit = 19
plastic, grey, very moist, AND plasticity index = 43
2.50 SAND, fine to medium, trace
coarse grains, trace comminuted DENSITY SAMPLE
shells, dark grey with white 2.50 – 2.60m
mottles, very moist. water content = 42.9 %
bulk density = 1.78 t/m3
2.60 dry density = 1.24 t/m3
air voids = 0.0 %
LIMITS SAMPLE
SHEAR VANE
2.70 12kPa peak / 6kPa remoulded
BOTTOM OF TUBE
Page 4 of 7

UNDISTURBED (THIN TUBE / PISTON SAMPLE) SHEET
JOB NAME: ST MARYS BAY
Sample Type / Diameter: U54 / 54mm Hole Number: MA03 Recorded Depth of
Top of Sample: 0.50m Recorded Depth of Bottom of Sample: 1.00m
Length of Soil in Tube: 540mm Length of Tube: 600mm
Distance Tube was Pushed: 500mm Recovery %: 108 %
Sampled By: AURECON Date Sampled: 13/02/2018
Peak Shear Vane (top): not carried out – sand in top of
tube
Peak Shear Vane (bottom): not carried out – sand in bottom of
tube Remoulded Shear Vane (top): Remoulded Shear Vane (bottom):
Sample Condition: undisturbed Material Type: SAND
EXTRUDED MATERIAL DESCRIPTION (visual observation and behaviour)
Photos (not to scale)
Depth (m)
Material Description Lab Testing
0.40 TOP OF TUBE
EMPTY SPACE
0.50
0.60
SAND, fine to coarse, minor silt,
minor fine to medium gravel,
0.70 occasional comminuted shells
from 0.50 – 0.70m & common WET SIEVE SAMPLE
comminuted shells from 0.70 – 0.70 – 0.85m & 0.95 – 1.00m
1.00m, rare wood fragments, water content = 33.4 %
non-plastic, dark grey with white Gravel = 5 %
0.80 mottles, moist to wet. Sand = 82 %
Silt & clay fractions = 13 %
DENSITY SAMPLE
0.85 – 0.95m
0.90 water content = 31.5 %
bulk density = 1.86 t/m3
dry density = 1.42 t/m3
air voids = 2.2 %
1.00 WET SIEVE SAMPLE
BOTTOM OF TUBE
Page 5 of 7

UNDISTURBED (THIN TUBE / PISTON SAMPLE) SHEET
JOB NAME: ST MARYS BAY
Sample Type / Diameter: U54 / 54mm Hole Number: MA03 Recorded Depth of
Top of Sample: 1.00m Recorded Depth of Bottom of Sample: 1.50m
Length of Soil in Tube: 520mm Length of Tube: 600mm
Distance Tube was Pushed: 500mm Recovery %: 104 %
Sampled By: AURECON Date Sampled: 13/02/2018
Peak Shear Vane (top): not carried out – sand in top of
tube
Peak Shear Vane (bottom): not carried out – sand in bottom of
tube Remoulded Shear Vane (top): Remoulded Shear Vane (bottom):
Sample Condition: undisturbed Material Type: SAND
EXTRUDED MATERIAL DESCRIPTION (visual observation and behaviour)
Photos (not to scale)
Depth (m)
Material Description Lab Testing
0.90 TOP OF TUBE
EMPTY SPACE
1.00
1.10
1.20
SAND, fine to medium, minor silt, WET SIEVE SAMPLE
trace siltstone inclusions, non- 1.16 – 1.36m
plastic, grey, very moist to wet. water content = 32.7 %
Gravel = 0 %
1.30 Sand = 88 %
Silt & clay fractions = 12 %
DENSITY SAMPLE
1.40 1.36 – 1.46m
water content = 32.5 %
bulk density = 1.86 t/m3
dry density = 1.40 t/m3
air voids = 1.5 %
1.50
BOTTOM OF TUBE
Page 6 of 7

UNDISTURBED (THIN TUBE / PISTON SAMPLE) SHEET
JOB NAME: ST MARYS BAY
Sample Type / Diameter: U54 / 54mm Hole Number: MA03 Recorded Depth of
Top of Sample: 2.30m Recorded Depth of Bottom of Sample: 2.80m
Length of Soil in Tube: 400mm Length of Tube: 600mm
Distance Tube was Pushed: 500mm Recovery %: 80 %
Sampled By: AURECON Date Sampled: 13/02/2018
Peak Shear Vane (top): 89 kPa Peak Shear Vane (bottom): 62 kPa
Remoulded Shear Vane (top): 35 kPa Remoulded Shear Vane (bottom): 32 kPa
Sample Condition: undisturbed Material Type: CLAY
EXTRUDED MATERIAL DESCRIPTION (visual observation and behaviour)
Photos (not to scale)
Depth (m)
Material Description Lab Testing
2.20 TOP OF TUBE
2.30 EMPTY SPACE
2.40
LIMITS SAMPLE
2.40 – 2.60m
2.50 water content = 38.0 %
SHEAR VANE liquid limit = 72
89kPa peak / 35kPa remoulded plastic limit = 22
plasticity index = 50
2.60 CLAY, minor fine to medium
sand, stiff, highly plastic, light DENSITY SAMPLE
grey, slightly moist. 2.60 – 2.70m
water content = 36.8 %
bulk density = 1.84 t/m3
2.70 dry density = 1.34 t/m3
air voids = 0.0 %
SHEAR VANE
2.80 62kPa peak / 32kPa remoulded
BOTTOM OF TUBE
Page 7 of 7
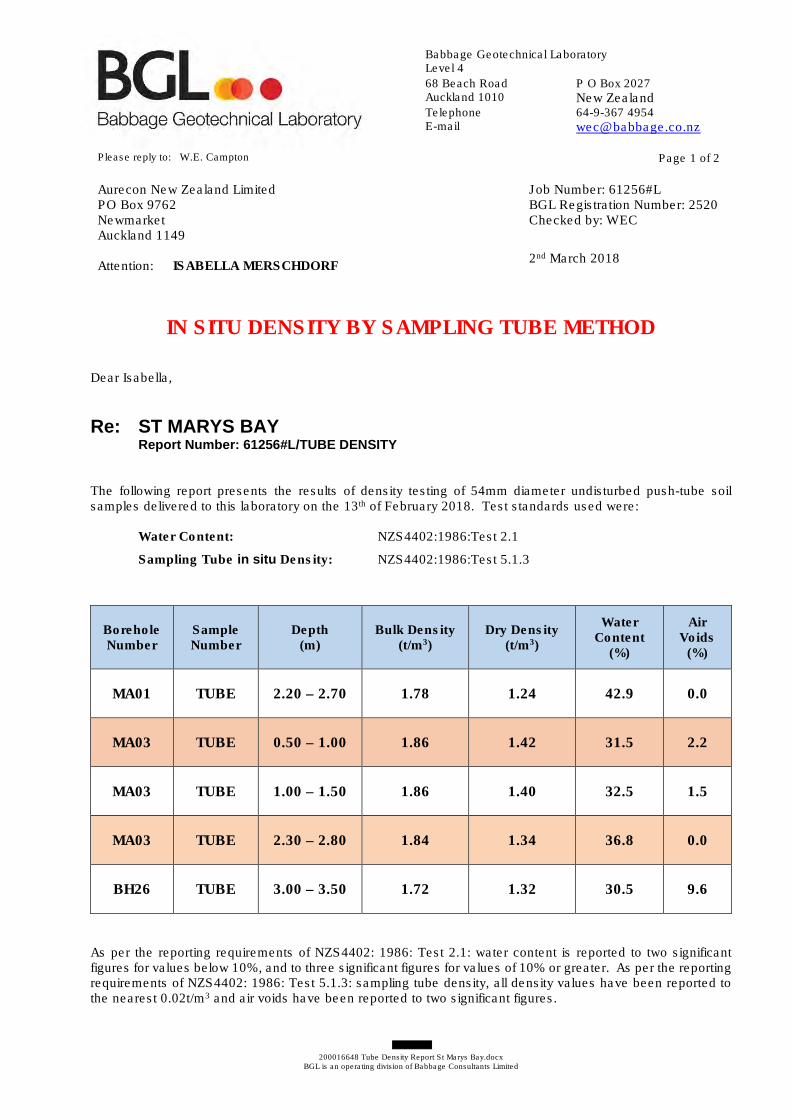
Babbage Geotechnical Laboratory Level 4 68 Beach Road P O Box 2027 Auckland 1010 New Zealand Telephone 64-9-367 4954 E-mail [email protected]
200016648 Tube Density Report St Marys Bay.docx
BGL is an operating division of Babbage Consultants Limited
Please reply to: W.E. Campton Page 1 of 2
Aurecon New Zealand Limited PO Box 9762 Newmarket Auckland 1149 Attention: ISABELLA MERSCHDORF
Job Number: 61256#L BGL Registration Number: 2520 Checked by: WEC
2nd March 2018
IN SITU DENSITY BY SAMPLING TUBE METHOD
Dear Isabella,
Re: ST MARYS BAY Report Number: 61256#L/TUBE DENSITY The following report presents the results of density testing of 54mm diameter undisturbed push-tube soil samples delivered to this laboratory on the 13th of February 2018. Test standards used were: Water Content: NZS4402:1986:Test 2.1
Sampling Tube in situ Density: NZS4402:1986:Test 5.1.3
Borehole Number
Sample Number
Depth (m)
Bulk Density (t/m3)
Dry Density (t/m3)
Water Content
(%)
Air Voids
(%)
MA01 TUBE 2.20 – 2.70 1.78 1.24 42.9 0.0
MA03 TUBE 0.50 – 1.00 1.86 1.42 31.5 2.2
MA03 TUBE 1.00 – 1.50 1.86 1.40 32.5 1.5
MA03 TUBE 2.30 – 2.80 1.84 1.34 36.8 0.0
BH26 TUBE 3.00 – 3.50 1.72 1.32 30.5 9.6
As per the reporting requirements of NZS4402: 1986: Test 2.1: water content is reported to two significant figures for values below 10%, and to three significant figures for values of 10% or greater. As per the reporting requirements of NZS4402: 1986: Test 5.1.3: sampling tube density, all density values have been reported to the nearest 0.02t/m3 and air voids have been reported to two significant figures.

Job Number: 61256#L
2nd March 2018
Page 2 of 2
200016648 Tube Density Report St Marys Bay.docx
BGL is an operating division of Babbage Consultants Limited
The soils tested were natural undisturbed soils. For calculating the air voids percentages a solid density of 2.65 t/m3 was assumed for these tests. Note that this assumed value is not part of the IANZ endorsement for this report. Sample Descriptions (not part of BGL IANZ Accreditation) MA01 / TUBE / 2.20 – 2.70m: Intermixed CLAY, soft, highly plastic, grey, very moist, & SAND, fine to medium, trace coarse grains, trace comminuted shells, dark grey with white mottles, very moist. MA03 / TUBE / 0.50 – 1.00m: SAND, fine to coarse, minor silt, minor fine to medium gravel, common comminuted shells, rare wood fragments, non-plastic, dark grey with white mottles, moist to wet. MA03 / TUBE / 1.00 – 1.50m: SAND, fine to medium, minor silt, trace siltstone inclusions, non-plastic, grey, very moist to wet. MA03 / TUBE / 2.30 – 2.80m: CLAY, minor fine to medium sand, stiff, highly plastic, light grey, slightly moist. BH26 / TUBE / 3.00 – 3.50m: SAND, fine to coarse, non-plastic, dark grey with white mottles, moist, common finely comminuted shells. Please note that the test results relate only to the samples tested. Thank you for the opportunity to carry out this testing. If you have any queries regarding the content of this report, please contact the undersigned at your convenience.
Yours faithfully, Justin Franklin Signatory (Assistant Laboratory Manager) Babbage Geotechnical Laboratory
All tests reported herein have been performed in accordance with the laboratory’s scope of accreditation. This report may not be reproduced except in full & with written approval from BGL.

Babbage Geotechnical Laboratory Level 4 68 Beach Road P O Box 2027 Auckland 1010 New Zealand Telephone 64-9-367 4954 E-mail [email protected]
200010727 Hackett Diversion PSD Report.docx
BGL is an operating division of Babbage Consultants Limited
Please reply to: W.E. Campton Page 1 of 4
Aurecon New Zealand Limited PO Box 9762 Newmarket Auckland 1149 Attention: JAMES ELVY
Job Number: 60770#L BGL Registration Number: 2439 Checked by: WEC
20th July 2017
WET SIEVE PARTICLE-SIZE DISTRIBUTION TESTING Dear Sir,
Re: HACKETT DIVERSION Report Number: 60770#L/PSD The following report presents the results of wet sieve particle-size distribution testing of soil samples delivered to this laboratory on the 12th of July 2017. Test results are summarised below, with the following pages showing graphs and detailed results. Test standards used were: Water Content: NZS4402:1986:Test 2.1
Wet Sieve Test: NZS4402:1986:Test 2.8.1
Borehole Number
Sample Number
Depth (m)
Fraction of Sample (% of Dry Mass)
GRAVEL (2 – 60mm)
SAND (0.06 – 2mm)
SILT & CLAY FRACTIONS (< 0.06mm)
BH07B BAG 1.30 – 1.50 0 84 16
BH08 TUBE 3.00 – 3.45 0 86 14
Please note that the results table immediately above with the various particle-size fractions is included for your information only, and is not included in the IANZ endorsement for this report. As per the reporting requirements of NZS4402: 1986: Test 2.1: water content is reported to two significant figures for values below 10%, and to three significant figures for values of 10% or greater. Test 2.8.1: wet sieve the percentages passing the sieves are reported to nearest 1%.

Job Number: 60770#L
20th July 2017
Page 2 of 4
200010727 Hackett Diversion PSD Report.docx
BGL is an operating division of Babbage Consultants Limited
Please note that the test results relate only to the samples under test. Thank you for the opportunity to carry out this testing. If you have any queries regarding the content of this report, please contact the undersigned at your convenience. Yours faithfully, Justin Franklin Signatory (Assistant Laboratory Manager) Babbage Geotechnical Laboratory
All tests reported herein have been performed in accordance with the laboratory’s scope of accreditation. This report may not be reproduced except in full & with written approval from BGL.

Job Number: 60770#L Sheet 1 of 1 Page 3 of 4
Reg. Number: 2439 Version No: 4
Report No: 60770#L/PSD Issue Date: March 2016
Tested By: JF 14-Jul-17
Compiled By: JF 14-Jul-17
Checked By: WEC 17-Jul-17
BH: BH07B Sample No: BAG
Depth: 1.30 - 1.50m Water Content: 21.0 % (material < 37.5mm)
TEST METHOD:Sieve Percentage Sample weighed wet, then oven-dried and re-weighed. Sample then
Size (mm) Passing washed over a 63µm sieve. Sample then oven dried, weighed & sieved
0.600 100 over a stack of test sieves. The percentage passing the 63µm was obtained
0.425 99 by difference.
0.300 990.212 97 SIEVE ANALYSIS (% of dry mass)0.150 85 TOTAL0.090 34 COBBLES: 200 - 60mm 0 %0.063 16
(Coarse) 60 - 20mm 0GRAVEL: (Medium) 20 - 6mm 0 0 %
(Fine) 6 - 2mm 0
(Coarse) 2.0 - 0.6mm 0SAND: (Medium) 0.6 - 0.2mm 5 84 %
(Fine) 0.2 - 0.06mm 79
SILT & CLAY FRACTIONS: < 0.06mm 16 %100%
HACKETT DIVERSIONProject:
PARTICLE-SIZE DISTRIBUTION BY WET SIEVETest Methods: NZS4402: 1986: Test 2.1, Test 2.8.1
Please note that the various particle-size fractions shown above is included for your information only, and is not included in the IANZ endorsement for this report.
SILT & CLAY FRACTIONS
Fine
SAND
Medium Coarse Fine Medium
GRAVEL
Coarse CO
BB
LE
S
0
10
20
30
40
50
60
70
80
90
100
0.01 0.10 1.00 10.00 100.00
Per
cen
tag
e P
assi
ng
Sieve Size (mm)
WET SIEVE PARTICLE-SIZE DISTRIBUTION
20/07/2017 Hackett Diversion Wet Sieve BH07B 1.30 - 1.50m.xlsx

Job Number: 60770#L Sheet 1 of 1 Page 4 of 4
Reg. Number: 2439 Version No: 4
Report No: 60770#L/PSD Issue Date: March 2016
Tested By: WEC 17-Jul-17
Compiled By: WEC 18-Jul-17
Checked By: JD 18-Jul-17
BH: BH08 Sample No: TUBE
Depth: 3.00 - 3.45m Water Content: 28.2 % (material < 37.5mm)
TEST METHOD:Sieve Percentage Sample weighed wet, then oven-dried and re-weighed. Sample then
Size (mm) Passing washed over a 63µm sieve. Sample then oven dried, weighed & sieved
2.00 100 over a stack of test sieves. The percentage passing the 63µm was obtained
1.18 100 by difference.
0.600 980.425 97 SIEVE ANALYSIS (% of dry mass)0.300 95 TOTAL0.212 92 COBBLES: 200 - 60mm 0 %0.150 750.090 31 (Coarse) 60 - 20mm 00.063 14 GRAVEL: (Medium) 20 - 6mm 0 0 %
(Fine) 6 - 2mm 0
(Coarse) 2.0 - 0.6mm 2SAND: (Medium) 0.6 - 0.2mm 10 86 %
(Fine) 0.2 - 0.06mm 74
SILT & CLAY FRACTIONS: < 0.06mm 14 %100%
HACKETT DIVERSIONProject:
PARTICLE-SIZE DISTRIBUTION BY WET SIEVETest Methods: NZS4402: 1986: Test 2.1, Test 2.8.1
Please note that the various particle-size fractions shown above is included for your information only, and is not included in the IANZ endorsement for this report.
SILT & CLAY FRACTIONS
Fine
SAND
Medium Coarse Fine Medium
GRAVEL
Coarse CO
BB
LE
S
0
10
20
30
40
50
60
70
80
90
100
0.01 0.10 1.00 10.00 100.00
Per
cen
tag
e P
assi
ng
Sieve Size (mm)
WET SIEVE PARTICLE-SIZE DISTRIBUTION
20/07/2017 Hackett Diversion Wet Sieve BH08 3.00 - 3.45m.xlsx

Babbage Geotechnical Laboratory Level 4 68 Beach Road P O Box 2027 Auckland 1010 New Zealand Telephone 64-9-367 4954 E-mail [email protected]
200016650 Wet Sieve Report St Marys Bay.docx
BGL is an operating division of Babbage Consultants Limited
Please reply to: W.E. Campton Page 1 of 10
Aurecon New Zealand Limited PO Box 9762 Newmarket Auckland 1149 Attention: ISABELLA MERSCHDORF
Job Number: 61256#L BGL Registration Number: 2520 Checked by: WEC
6th March 2018
WET SIEVE PARTICLE-SIZE DISTRIBUTION TESTING Dear Isabella,
Re: ST MARYS BAY Report Number: 61256#L/Wet Sieve The following report presents the results of wet sieve particle-size distribution testing of soil samples delivered to this laboratory on the 13th of February 2018. Test results are summarised below, with the following pages showing graphs and detailed results. Test standards used were: Water Content: NZS4402:1986:Test 2.1
Wet Sieve Test: NZS4402:1986:Test 2.8.1
Borehole Number
Sample Number
Depth (m)
Fraction of Sample (% of Dry Mass)
GRAVEL (2 – 60mm)
SAND (0.06 – 2mm)
SILT & CLAY FRACTIONS (< 0.06mm)
MA01 BAG 1.45 – 1.65 1 79 20
MA01 TUBE 1.70 – 2.20 0 81 19
MA03 TUBE 0.50 – 1.00 5 82 13
MA03 TUBE 1.00 – 1.50 0 88 12
BH24 BAG 11.50 – 11.65 0 73 27
BH26 CORE 13.11 – 13.29 0 83 17
BH26 TUBE 3.00 – 3.50 1 97 2
BH27 CORE 8.40 – 8.67 0 84 16

Job Number: 61256#L
6th March 2018
Page 2 of 10
200016650 Wet Sieve Report St Marys Bay.docx
BGL is an operating division of Babbage Consultants Limited
Please note that the results table immediately above with the various particle-size fractions is included for your information only, and is not included in the IANZ endorsement for this report. As per the reporting requirements of NZS4402: 1986: Test 2.1: water content is reported to two significant figures for values below 10%, and to three significant figures for values of 10% or greater. Test 2.8.1: wet sieve the percentages passing the sieves are reported to nearest 1%. Please note that the test results relate only to the samples under test. Thank you for the opportunity to carry out this testing. If you have any queries regarding the content of this report, please contact the undersigned at your convenience.
Yours faithfully, Justin Franklin Signatory (Assistant Laboratory Manager) Babbage Geotechnical Laboratory
All tests reported herein have been performed in accordance with the laboratory’s scope of accreditation. This report may not be reproduced except in full & with written approval from BGL.

Job Number: 61256#L Sheet 1 of 1 Page 3 of 10
Reg. Number: 2520 Version No: 4
Report No: 61256#L/Wet Sieve Issue Date: March 2016
Tested By: WEC 27-Feb-18
Compiled By: WEC 27-Feb-18
Checked By: JD 27-Feb-18
BH: MA01 Sample No: BAG
Depth: 1.45 - 1.65m Water Content: 37.2 % (material < 37.5mm)
TEST METHOD:
Sieve Percentage Sample weighed wet, then oven-dried and re-weighed. Sample then
Size (mm) Passing washed over a 63µm sieve. Sample then oven dried, weighed & sieved
4.75 100 over a stack of test sieves. The percentage passing the 63µm was obtained
2.00 99 by difference.
1.18 99
0.600 99 SIEVE ANALYSIS (% of dry mass)
0.425 98 TOTAL
0.300 98 COBBLES: 200 - 60mm 0 %
0.212 96
0.150 81 (Coarse) 60 - 20mm 0
0.090 31 GRAVEL: (Medium) 20 - 6mm 0 1 %
0.063 20 (Fine) 6 - 2mm 1
(Coarse) 2.0 - 0.6mm 1
SAND: (Medium) 0.6 - 0.2mm 5 79 %
(Fine) 0.2 - 0.06mm 73
SILT & CLAY FRACTIONS: < 0.06mm 20 %
100%
ST MARYS BAYProject:
PARTICLE-SIZE DISTRIBUTION BY
WET SIEVETest Methods: NZS4402: 1986: Test 2.1, Test 2.8.1
Please note that the various particle-size fractions shown above is included for your information only, and is not
included in the IANZ endorsement for this report.
SILT & CLAY FRACTIONS
Fine
SAND
Medium Coarse Fine Medium
GRAVEL
Coarse CO
BB
LE
S
0
10
20
30
40
50
60
70
80
90
100
0.01 0.10 1.00 10.00 100.00
Pe
rce
nta
ge
Pa
ss
ing
Sieve Size (mm)
WET SIEVE PARTICLE-SIZE DISTRIBUTION
6/03/2018 St Marys Bay Wet Sieve MA01 1.45 - 1.65m.xlsx

Job Number: 61256#L Sheet 1 of 1 Page 4 of 10
Reg. Number: 2520 Version No: 4
Report No: 61256#L/Wet Sieve Issue Date: March 2016
Tested By: JD 6-Mar-18
Compiled By: JD 6-Mar-18
Checked By: JF 6-Mar-18
BH: MA01 Sample No: TUBE
Depth: 1.70 - 2.20m Water Content: 40.9 % (material < 37.5mm)
TEST METHOD:
Sieve Percentage Sample weighed wet, then oven-dried and re-weighed. Sample then
Size (mm) Passing washed over a 63µm sieve. Sample then oven dried, weighed & sieved
1.18 100 over a stack of test sieves. The percentage passing the 63µm was obtained
0.600 99 by difference.
0.425 99
0.300 98 SIEVE ANALYSIS (% of dry mass)
0.212 96 TOTAL
0.150 80 COBBLES: 200 - 60mm 0 %
0.090 28
0.063 19 (Coarse) 60 - 20mm 0
GRAVEL: (Medium) 20 - 6mm 0 0 %
(Fine) 6 - 2mm 0
(Coarse) 2.0 - 0.6mm 1
SAND: (Medium) 0.6 - 0.2mm 6 81 %
(Fine) 0.2 - 0.06mm 74
SILT & CLAY FRACTIONS: < 0.06mm 19 %
100%
ST MARYS BAYProject:
PARTICLE-SIZE DISTRIBUTION BY
WET SIEVETest Methods: NZS4402: 1986: Test 2.1, Test 2.8.1
Please note that the various particle-size fractions shown above is included for your information only, and is not
included in the IANZ endorsement for this report.
SILT & CLAY FRACTIONS
Fine
SAND
Medium Coarse Fine Medium
GRAVEL
Coarse CO
BB
LE
S
0
10
20
30
40
50
60
70
80
90
100
0.01 0.10 1.00 10.00 100.00
Pe
rce
nta
ge
Pa
ss
ing
Sieve Size (mm)
WET SIEVE PARTICLE-SIZE DISTRIBUTION
6/03/2018 St Marys Bay Wet Sieve MA01 1.70 - 2.20m.xlsx

Job Number: 61256#L Sheet 1 of 1 Page 5 of 10
Reg. Number: 2520 Version No: 4
Report No: 61256#L/Wet Sieve Issue Date: March 2016
Tested By: WEC / JF 2-Mar-18
Compiled By: WEC 2-Mar-18
Checked By: JF 2-Mar-18
BH: MA03 Sample No: TUBE
Depth: 0.50 - 1.00m Water Content: 33.4 % (material < 37.5mm)
TEST METHOD:
Sieve Percentage Sample weighed wet, then oven-dried and re-weighed. Sample then
Size (mm) Passing washed over a 63µm sieve. Sample then oven dried, weighed & sieved
9.50 100 over a stack of test sieves. The percentage passing the 63µm was obtained
6.70 98 by difference.
4.75 97
2.00 95 SIEVE ANALYSIS (% of dry mass)
1.18 94 TOTAL
0.600 92 COBBLES: 200 - 60mm 0 %
0.425 89
0.300 80 (Coarse) 60 - 20mm 0
0.212 60 GRAVEL: (Medium) 20 - 6mm 2 5 %
0.150 38 (Fine) 6 - 2mm 3
0.090 17
0.063 13 (Coarse) 2.0 - 0.6mm 3
SAND: (Medium) 0.6 - 0.2mm 36 82 %
(Fine) 0.2 - 0.06mm 43
SILT & CLAY FRACTIONS: < 0.06mm 13 %
100%
ST MARYS BAYProject:
PARTICLE-SIZE DISTRIBUTION BY
WET SIEVETest Methods: NZS4402: 1986: Test 2.1, Test 2.8.1
Please note that the various particle-size fractions shown above is included for your information only, and is not
included in the IANZ endorsement for this report.
SILT & CLAY FRACTIONS
Fine
SAND
Medium Coarse Fine Medium
GRAVEL
Coarse CO
BB
LE
S
0
10
20
30
40
50
60
70
80
90
100
0.01 0.10 1.00 10.00 100.00
Pe
rce
nta
ge
Pa
ss
ing
Sieve Size (mm)
WET SIEVE PARTICLE-SIZE DISTRIBUTION
6/03/2018 St Marys Bay Wet Sieve MA03 0.50 - 1.00m.xlsx

Job Number: 61256#L Sheet 1 of 1 Page 6 of 10
Reg. Number: 2520 Version No: 4
Report No: 61256#L/Wet Sieve Issue Date: March 2016
Tested By: WEC / JF 2-Mar-18
Compiled By: WEC 2-Mar-18
Checked By: JF 2-Mar-18
BH: MA03 Sample No: TUBE
Depth: 1.00 - 1.50m Water Content: 32.7 % (material < 37.5mm)
TEST METHOD:
Sieve Percentage Sample weighed wet, then oven-dried and re-weighed. Sample then
Size (mm) Passing washed over a 63µm sieve. Sample then oven dried, weighed & sieved
0.600 100 over a stack of test sieves. The percentage passing the 63µm was obtained
0.425 99 by difference.
0.300 99
0.212 96 SIEVE ANALYSIS (% of dry mass)
0.150 78 TOTAL
0.090 25 COBBLES: 200 - 60mm 0 %
0.063 12
(Coarse) 60 - 20mm 0
GRAVEL: (Medium) 20 - 6mm 0 0 %
(Fine) 6 - 2mm 0
(Coarse) 2.0 - 0.6mm 0
SAND: (Medium) 0.6 - 0.2mm 7 88 %
(Fine) 0.2 - 0.06mm 81
SILT & CLAY FRACTIONS: < 0.06mm 12 %
100%
ST MARYS BAYProject:
PARTICLE-SIZE DISTRIBUTION BY
WET SIEVETest Methods: NZS4402: 1986: Test 2.1, Test 2.8.1
Please note that the various particle-size fractions shown above is included for your information only, and is not
included in the IANZ endorsement for this report.
SILT & CLAY FRACTIONS
Fine
SAND
Medium Coarse Fine Medium
GRAVEL
Coarse CO
BB
LE
S
0
10
20
30
40
50
60
70
80
90
100
0.01 0.10 1.00 10.00 100.00
Pe
rce
nta
ge
Pa
ss
ing
Sieve Size (mm)
WET SIEVE PARTICLE-SIZE DISTRIBUTION
6/03/2018 St Marys Bay Wet Sieve MA03 1.00 - 1.50m.xlsx

Job Number: 61256#L Sheet 1 of 1 Page 7 of 10
Reg. Number: 2520 Version No: 4
Report No: 61256#L/Wet Sieve Issue Date: March 2016
Tested By: WEC 26-Feb-18
Compiled By: WEC 26-Feb-18
Checked By: JD 27-Feb-18
BH: BH24 Sample No: BAG
Depth: 11.50 - 11.65m Water Content: 19.6 % (material < 37.5mm)
TEST METHOD:
Sieve Percentage Sample weighed wet, then oven-dried and re-weighed. Sample then
Size (mm) Passing washed over a 63µm sieve. Sample then oven dried, weighed & sieved
2.00 100 over a stack of test sieves. The percentage passing the 63µm was obtained
1.18 99 by difference.
0.600 97
0.425 96 SIEVE ANALYSIS (% of dry mass)
0.300 93 TOTAL
0.212 87 COBBLES: 200 - 60mm 0 %
0.150 76
0.090 44 (Coarse) 60 - 20mm 0
0.063 27 GRAVEL: (Medium) 20 - 6mm 0 0 %
(Fine) 6 - 2mm 0
(Coarse) 2.0 - 0.6mm 3
SAND: (Medium) 0.6 - 0.2mm 12 73 %
(Fine) 0.2 - 0.06mm 58
SILT & CLAY FRACTIONS: < 0.06mm 27 %
100%
ST MARYS BAYProject:
PARTICLE-SIZE DISTRIBUTION BY
WET SIEVETest Methods: NZS4402: 1986: Test 2.1, Test 2.8.1
Please note that the various particle-size fractions shown above is included for your information only, and is not
included in the IANZ endorsement for this report.
SILT & CLAY FRACTIONS
Fine
SAND
Medium Coarse Fine Medium
GRAVEL
Coarse CO
BB
LE
S
0
10
20
30
40
50
60
70
80
90
100
0.01 0.10 1.00 10.00 100.00
Pe
rce
nta
ge
Pa
ss
ing
Sieve Size (mm)
WET SIEVE PARTICLE-SIZE DISTRIBUTION
6/03/2018 St Marys Bay Wet Sieve BH24 11.50 - 11.65m.xlsx

Job Number: 61256#L Sheet 1 of 1 Page 8 of 10
Reg. Number: 2520 Version No: 4
Report No: 61256#L/Wet Sieve Issue Date: March 2016
Tested By: WEC 26-Feb-18
Compiled By: WEC 26-Feb-18
Checked By: JD 27-Feb-18
BH: BH26 Sample No: CORE
Depth: 13.11 - 13.29m Water Content: 19.6 % (material < 37.5mm)
TEST METHOD:
Sieve Percentage Sample weighed wet, then oven-dried and re-weighed. Sample then
Size (mm) Passing washed over a 63µm sieve. Sample then oven dried, weighed & sieved
2.00 100 over a stack of test sieves. The percentage passing the 63µm was obtained
1.18 99 by difference.
0.600 96
0.425 95 SIEVE ANALYSIS (% of dry mass)
0.300 91 TOTAL
0.212 84 COBBLES: 200 - 60mm 0 %
0.150 69
0.090 31 (Coarse) 60 - 20mm 0
0.063 17 GRAVEL: (Medium) 20 - 6mm 0 0 %
(Fine) 6 - 2mm 0
(Coarse) 2.0 - 0.6mm 4
SAND: (Medium) 0.6 - 0.2mm 14 83 %
(Fine) 0.2 - 0.06mm 65
SILT & CLAY FRACTIONS: < 0.06mm 17 %
100%
ST MARYS BAYProject:
PARTICLE-SIZE DISTRIBUTION BY
WET SIEVETest Methods: NZS4402: 1986: Test 2.1, Test 2.8.1
Please note that the various particle-size fractions shown above is included for your information only, and is not
included in the IANZ endorsement for this report.
SILT & CLAY FRACTIONS
Fine
SAND
Medium Coarse Fine Medium
GRAVEL
Coarse CO
BB
LE
S
0
10
20
30
40
50
60
70
80
90
100
0.01 0.10 1.00 10.00 100.00
Pe
rce
nta
ge
Pa
ss
ing
Sieve Size (mm)
WET SIEVE PARTICLE-SIZE DISTRIBUTION
6/03/2018 St Marys Bay Wet Sieve BH26 13.11 - 13.29m.xlsx

Job Number: 61256#L Sheet 1 of 1 Page 9 of 10
Reg. Number: 2520 Version No: 4
Report No: 61256#L/Wet Sieve Issue Date: March 2016
Tested By: WEC 28-Feb-18
Compiled By: WEC 28-Feb-18
Checked By: JF 28-Feb-18
BH: BH26 Sample No: TUBE
Depth: 3.00 - 3.50m Water Content: 30.5 % (material < 37.5mm)
TEST METHOD:
Sieve Percentage Sample weighed wet, then oven-dried and re-weighed. Sample then
Size (mm) Passing washed over a 63µm sieve. Sample then oven dried, weighed & sieved
4.75 100 over a stack of test sieves. The percentage passing the 63µm was obtained
2.00 99 by difference.
1.18 98
0.600 97 SIEVE ANALYSIS (% of dry mass)
0.425 94 TOTAL
0.300 89 COBBLES: 200 - 60mm 0 %
0.212 80
0.150 58 (Coarse) 60 - 20mm 0
0.090 9 GRAVEL: (Medium) 20 - 6mm 0 1 %
0.063 2 (Fine) 6 - 2mm 1
(Coarse) 2.0 - 0.6mm 3
SAND: (Medium) 0.6 - 0.2mm 20 97 %
(Fine) 0.2 - 0.06mm 74
SILT & CLAY FRACTIONS: < 0.06mm 2 %
100%
ST MARYS BAYProject:
PARTICLE-SIZE DISTRIBUTION BY
WET SIEVETest Methods: NZS4402: 1986: Test 2.1, Test 2.8.1
Please note that the various particle-size fractions shown above is included for your information only, and is not
included in the IANZ endorsement for this report.
SILT & CLAY FRACTIONS
Fine
SAND
Medium Coarse Fine Medium
GRAVEL
Coarse CO
BB
LE
S
0
10
20
30
40
50
60
70
80
90
100
0.01 0.10 1.00 10.00 100.00
Pe
rce
nta
ge
Pa
ss
ing
Sieve Size (mm)
WET SIEVE PARTICLE-SIZE DISTRIBUTION
6/03/2018 St Marys Bay Wet Sieve BH26 3.00 - 3.50m.xlsx

Job Number: 61256#L Sheet 1 of 1 Page 10 of 10
Reg. Number: 2520 Version No: 4
Report No: 61256#L/Wet Sieve Issue Date: March 2016
Tested By: WEC / JF 2-Mar-18
Compiled By: WEC 2-Mar-18
Checked By: JF 6-Mar-18
BH: BH27 Sample No: CORE
Depth: 8.40 - 8.67m Water Content: 25.7 % (material < 37.5mm)
TEST METHOD:
Sieve Percentage Sample weighed wet, then oven-dried and re-weighed. Sample then
Size (mm) Passing washed over a 63µm sieve. Sample then oven dried, weighed & sieved
2.00 100 over a stack of test sieves. The percentage passing the 63µm was obtained
1.18 99 by difference.
0.600 97
0.425 95 SIEVE ANALYSIS (% of dry mass)
0.300 89 TOTAL
0.212 80 COBBLES: 200 - 60mm 0 %
0.150 63
0.090 29 (Coarse) 60 - 20mm 0
0.063 17 GRAVEL: (Medium) 20 - 6mm 0 0 %
(Fine) 6 - 2mm 0
(Coarse) 2.0 - 0.6mm 3
SAND: (Medium) 0.6 - 0.2mm 20 84 %
(Fine) 0.2 - 0.06mm 61
SILT & CLAY FRACTIONS: < 0.06mm 16 %
100%
ST MARYS BAYProject:
PARTICLE-SIZE DISTRIBUTION BY
WET SIEVETest Methods: NZS4402: 1986: Test 2.1, Test 2.8.1
Please note that the various particle-size fractions shown above is included for your information only, and is not
included in the IANZ endorsement for this report.
SILT & CLAY FRACTIONS
Fine
SAND
Medium Coarse Fine Medium
GRAVEL
Coarse CO
BB
LE
S
0
10
20
30
40
50
60
70
80
90
100
0.01 0.10 1.00 10.00 100.00
Pe
rce
nta
ge
Pa
ss
ing
Sieve Size (mm)
WET SIEVE PARTICLE-SIZE DISTRIBUTION
6/03/2018 St Marys Bay Wet Sieve BH27 8.40 - 8.67m.xlsx

Babbage Geotechnical Laboratory Level 4 68 Beach Road P O Box 2027 Auckland 1010 New Zealand Telephone 64-9-367 4954 E-mail [email protected]
200016651 Hydrometer Report St Marys Bay.docx
BGL is an operating division of Babbage Consultants Limited
Please reply to: W.E. Campton Page 1 of 6
Aurecon New Zealand Limited PO Box 9762 Newmarket Auckland 1149 Attention: ISABELLA MERSCHDORF
Job Number: 61256#L BGL Registration Number: 2520 Checked by: WEC
2nd March 2018
HYDROMETER PARTICLE-SIZE DISTRIBUTION TESTING Dear Isabella,
Re: ST MARYS BAY Report Number: 61256#L/HYD The following report presents the results of hydrometer particle-size distribution testing of soil samples delivered to this laboratory on the 13th of February 2018. Test results are summarised below, with the following pages showing graphs and detailed results. Test standards used were: Water Content: NZS4402:1986:Test 2.1
Wet Sieve Test: NZS4402:1986:Test 2.8.1
Hydrometer Test: NZS4402:1986:Test 2.8.4
Borehole Number
Sample Number
Depth (m)
Hydrometer Grading (% of Dry Mass)
GRAVEL (2 –
<9.50mm)
SAND (0.06 – 2mm)
SILT FRACTION
(0.002 – 0.06mm)
CLAY FRACTION (< 0.002mm)
BH20 BAG 3.45 – 3.62 0 1 50 49
BH24 BAG 1.85 – 1.97 0 51 31 18
BH27 BAG 7.95 – 8.10 0 40 41 19
*BH30 BAG 6.79 – 7.01 0 4 79 17
*This sample was prepared from weakly cemented siltstone rock core by scraping the core and breaking down the shavings into the constituent particles by prolonged agitation in a water / sodium hexametaphosphate solution, as per the hydrometer test standard.

Job Number: 61256#L
2nd March 2018
Page 2 of 6
200016651 Hydrometer Report St Marys Bay.docx
BGL is an operating division of Babbage Consultants Limited
The whole soil was used for these hydrometer tests. As the organic content of the soil was very low, peroxide pretreatment was not carried out. A solid density of 2.65t/m3 was assumed for these hydrometer tests, and is not part of the IANZ endorsement for this report. As per the reporting requirements of NZS4402: 1986: Test 2.1: water content is reported to two significant figures for values below 10%, and to three significant figures for values of 10% or greater. Test 2.8.1: wet sieve & Test 2.8.4: hydrometer, the ‘percentages passing’ and ‘percentages fine than’ are reported to nearest 1%. Please note that the test results relate only to the samples under test. Thank you for the opportunity to carry out this testing. If you have any queries regarding the content of this report, please contact the undersigned at your convenience.
Yours faithfully, Justin Franklin Signatory (Assistant Laboratory Manager) Babbage Geotechnical Laboratory
All tests reported herein have been performed in accordance with the laboratory’s scope of accreditation. This report may not be reproduced except in full & with written approval from BGL.

Job Number: 61256#L Sheet 1 of 1 Page 3 of 6
Reg. Number: 2520 Version No: 4
Report No: 61256#L/HYD Issue Date: Feb 2016
Tested By: WEC 20-Feb-18
Compiled By: WEC 21-Feb-18
Checked By: JD 21-Feb-18
BH No: BH20 Sample No: BAG Depth: 3.45 - 3.62m
Particle Size (mm) % Finer Than Water Content (%): 44.3
0.212 100 Sample History: Natural / Air Dried / Oven Dried / Unknown
0.063 99 pH of sedimentation suspension: 8.0
0.037 98
0.027 95 TOTAL
0.019 93
0.014 89
0.010 85 GRAVEL: (Medium) < 9.5 - 6mm 0 0 %
0.0076 78 (Fine) 6 - 2mm 0
0.0056 72
0.0041 65 (Coarse) 2.0 - 0.6mm 0
0.0030 58 SAND: (Medium) 0.6 - 0.2mm 0 1 %
0.0022 51 (Fine) 0.2 - 0.06mm 1
0.0013 39
(Coarse) 0.06 - 0.02mm 6
(Medium) 0.02 - 0.006mm 20 50 %
(Fine) 0.006 - 0.002mm 24
CLAY FRACTION: < 0.002mm 49 %
100%
HYDROMETER TEST WAS CARRIED OUT ON THE WHOLE SOIL / SOIL FRACTION PASSING A 9.50mm SIEVE
ST MARYS BAYProject:
Test Methods: NZS4402: 1986: Test 2.1, Test 2.8.1, Test 2.8.4
PARTICLE-SIZE DISTRIBUTION BY
HYDROMETER
SILT
FRACTION:
HYDROMETER ANALYSIS (% of dry mass)
Fine
SILT
Medium Coarse Fine
SAND
Medium Coarse Fine
GRAVELCLAY
0
10
20
30
40
50
60
70
80
90
100
0.001 0.010 0.100 1.000 10.000
Perc
en
tag
e o
f S
am
ple
Fin
er
Th
an
Particle Size (mm)
HYDROMETER PARTICLE-SIZE DISTRIBUTION
2/03/2018 St Marys Bay Hydrometer BH20 3.45 - 3.62m.xlsx

Job Number: 61256#L Sheet 1 of 1 Page 4 of 6
Reg. Number: 2520 Version No: 4
Report No: 61256#L/HYD Issue Date: Feb 2016
Tested By: WEC 20-Feb-18
Compiled By: WEC 21-Feb-18
Checked By: JD 21-Feb-18
BH No: BH24 Sample No: BAG Depth: 1.85 - 1.97m
Particle Size (mm) % Finer Than Water Content (%): 56.1
2.00 100 Sample History: Natural / Air Dried / Oven Dried / Unknown
0.600 99 pH of sedimentation suspension: 8.0
0.212 98
0.063 50 TOTAL
0.048 45
0.035 37
0.025 34 GRAVEL: (Medium) < 9.5 - 6mm 0 0 %
0.018 31 (Fine) 6 - 2mm 0
0.013 28
0.0094 26 (Coarse) 2.0 - 0.6mm 1
0.0067 24 SAND: (Medium) 0.6 - 0.2mm 4 51 %
0.0047 22 (Fine) 0.2 - 0.06mm 46
0.0034 20
0.0024 19 (Coarse) 0.06 - 0.02mm 17
0.0014 17 (Medium) 0.02 - 0.006mm 8 31 %
(Fine) 0.006 - 0.002mm 6
CLAY FRACTION: < 0.002mm 18 %
100%
HYDROMETER TEST WAS CARRIED OUT ON THE WHOLE SOIL / SOIL FRACTION PASSING A 9.50mm SIEVE
ST MARYS BAYProject:
Test Methods: NZS4402: 1986: Test 2.1, Test 2.8.1, Test 2.8.4
PARTICLE-SIZE DISTRIBUTION BY
HYDROMETER
SILT
FRACTION:
HYDROMETER ANALYSIS (% of dry mass)
Fine
SILT
Medium Coarse Fine
SAND
Medium Coarse Fine
GRAVELCLAY
0
10
20
30
40
50
60
70
80
90
100
0.001 0.010 0.100 1.000 10.000
Perc
en
tag
e o
f S
am
ple
Fin
er
Th
an
Particle Size (mm)
HYDROMETER PARTICLE-SIZE DISTRIBUTION
2/03/2018 St Marys Bay Hydrometer BH24 1.85 - 1.97m.xlsx

Job Number: 61256#L Sheet 1 of 1 Page 5 of 6
Reg. Number: 2520 Version No: 4
Report No: 61256#L/HYD Issue Date: Feb 2016
Tested By: WEC 20-Feb-18
Compiled By: WEC 21-Feb-18
Checked By: JD 21-Feb-18
BH No: BH27 Sample No: BAG Depth: 7.95 - 8.10m
Particle Size (mm) % Finer Than Water Content (%): 28.2
0.600 100 Sample History: Natural / Air Dried / Oven Dried / Unknown
0.212 98 pH of sedimentation suspension: 8.0
0.063 61
0.041 52 TOTAL
0.031 47
0.022 45
0.016 40 GRAVEL: (Medium) < 9.5 - 6mm 0 0 %
0.012 37 (Fine) 6 - 2mm 0
0.0087 33
0.0062 30 (Coarse) 2.0 - 0.6mm 0
0.0045 27 SAND: (Medium) 0.6 - 0.2mm 4 40 %
0.0032 24 (Fine) 0.2 - 0.06mm 36
0.0024 21
0.0014 16 (Coarse) 0.06 - 0.02mm 17
(Medium) 0.02 - 0.006mm 13 41 %
(Fine) 0.006 - 0.002mm 11
CLAY FRACTION: < 0.002mm 19 %
100%
HYDROMETER TEST WAS CARRIED OUT ON THE WHOLE SOIL / SOIL FRACTION PASSING A 9.50mm SIEVE
ST MARYS BAYProject:
Test Methods: NZS4402: 1986: Test 2.1, Test 2.8.1, Test 2.8.4
PARTICLE-SIZE DISTRIBUTION BY
HYDROMETER
SILT
FRACTION:
HYDROMETER ANALYSIS (% of dry mass)
Fine
SILT
Medium Coarse Fine
SAND
Medium Coarse Fine
GRAVELCLAY
0
10
20
30
40
50
60
70
80
90
100
0.001 0.010 0.100 1.000 10.000
Perc
en
tag
e o
f S
am
ple
Fin
er
Th
an
Particle Size (mm)
HYDROMETER PARTICLE-SIZE DISTRIBUTION
2/03/2018 St Marys Bay Hydrometer BH27 7.95 - 8.10m.xlsx

Job Number: 61256#L Sheet 1 of 1 Page 6 of 6
Reg. Number: 2520 Version No: 4
Report No: 61256#L/HYD Issue Date: Feb 2016
Tested By: WEC 20-Feb-18
Compiled By: WEC 21-Feb-18
Checked By: JD 21-Feb-18
BH No: BH30 Sample No: BAG Depth: 6.79 - 7.01m
Particle Size (mm) % Finer Than Water Content (%): 28.9
0.600 100 Sample History: Natural / Air Dried / Oven Dried / Unknown
0.212 99 pH of sedimentation suspension: 8.0
0.063 97
0.035 91 TOTAL
0.026 85
0.020 77
0.015 67 GRAVEL: (Medium) < 9.5 - 6mm 0 0 %
0.011 57 (Fine) 6 - 2mm 0
0.0085 47
0.0062 39 (Coarse) 2.0 - 0.6mm 0
0.0045 31 SAND: (Medium) 0.6 - 0.2mm 1 4 %
0.0033 24 (Fine) 0.2 - 0.06mm 3
0.0024 19
0.0014 13 (Coarse) 0.06 - 0.02mm 19
(Medium) 0.02 - 0.006mm 39 79 %
(Fine) 0.006 - 0.002mm 21
CLAY FRACTION: < 0.002mm 17 %
100%
HYDROMETER TEST WAS CARRIED OUT ON THE WHOLE SOIL / SOIL FRACTION PASSING A 9.50mm SIEVE
ST MARYS BAYProject:
Test Methods: NZS4402: 1986: Test 2.1, Test 2.8.1, Test 2.8.4
PARTICLE-SIZE DISTRIBUTION BY
HYDROMETER
SILT
FRACTION:
HYDROMETER ANALYSIS (% of dry mass)
Fine
SILT
Medium Coarse Fine
SAND
Medium Coarse Fine
GRAVELCLAY
0
10
20
30
40
50
60
70
80
90
100
0.001 0.010 0.100 1.000 10.000
Perc
en
tag
e o
f S
am
ple
Fin
er
Th
an
Particle Size (mm)
HYDROMETER PARTICLE-SIZE DISTRIBUTION
2/03/2018 St Marys Bay Hydrometer BH30 6.79 - 7.01m.xlsx

Babbage Geotechnical Laboratory Level 4 68 Beach Road P O Box 2027 Auckland 1010 New Zealand Telephone 64-9-367 4954 E-mail [email protected]
200010726 Hackett Diversion Limits Report.docx
BGL is an operating division of Babbage Consultants Limited
Please reply to: W.E. Campton Page 1 of 3
Aurecon New Zealand Limited PO Box 9762 Newmarket Auckland 1149 Attention: JAMES ELVY
Job Number: 60770#L BGL Registration Number: 2439 Checked by: WEC
20th July 2017
ATTERBERG LIMITS TESTING Dear Sir, Re: HACKETT DIVERSION Report Number: 60770#L/AL The following report presents the results of Atterberg Limits testing of a soil sample delivered to this laboratory on the 12th of July 2017. Test results are summarised below, with page 3 showing where the sample plots on the Unified Soil Classification System (Casagrande) Chart. Test standards used were: Water Content: NZS4402:1986:Test 2.1
Liquid Limit: NZS4402:1986:Test 2.2
Plastic Limit: NZS4402:1986:Test 2.3
Plasticity Index: NZS4402:1986:Test 2.4
Borehole Number
Sample Number Depth (m) Water
Content (%) Liquid Limit
Plastic Limit
Plasticity Index
BH08 TUBE 3.00 – 3.45 56.5 59 21 38
As per the reporting requirements of NZS4402: 1986: Test 2.1: water content is reported to two significant figures for values below 10%, and to three significant figures for values of 10% or greater. Test 2.2: liquid limit and test 2.3: plastic limit are reported to the nearest whole number. The whole soil was used for these tests, and was wet up and dried where required for the plastic limit and liquid limit tests.

Job Number: 60770#L
20th July 2017
Page 2 of 3
200010726 Hackett Diversion Limits Report.docx
BGL is an operating division of Babbage Consultants Limited
Please note that the test results relate only to the sample under test. Thank you for the opportunity to carry out this testing. If you have any queries regarding the content of this report, please contact the undersigned at your convenience. Yours faithfully, Justin Franklin Signatory (Assistant Laboratory Manager) Babbage Geotechnical Laboratory
All tests reported herein have been performed in accordance with the laboratory’s scope of accreditation. This report may not be reproduced except in full & with written approval from BGL.

Job Number:
Reg. Number:
Report No:
Tested By: WEC / JD
Compiled By: WEC
Checked By: JF
BH08 TUBE 3.00 - 3.45 59 21 38
CL = CLAY, low plasticity ('lean' clay) CH = CLAY, high plasticity ('fat' clay)OL = ORGANIC CLAY or ORGANIC SILT, low liquid limit OH = ORGANIC CLAY or ORGANIC SILT, high liquid limitML = SILT, low liquid limit MH = SILT, high liquid limit ('elastic silt')CL - ML = SILTY CLAY
60770#L
2439
60770#L/AL
19-Jul-17
20-Jul-17
Sheet 1 of 1
Version No:
Version Date:
Page 3 of 3
4
April 2014
Test Methods: NZS4402: 1986: Test 2.2, Test 2.3 and Test 2.4
SUMMARY OF TESTING
HACKETT DIVERSION
Borehole Number
July 2017
Project:
DETERMINATION OF THE LIQUID LIMIT, PLASTIC LIMIT & THE PLASTICITY INDEX
The chart below & soil classification terminology is taken from ASTM D2487-11 "Standard Practice for Classification of Soils for Engineering Purposes (Unified Soil Classification System)", June 2011, & is based on the classification scheme developed by A. Casagrande in the 1940's (Casagrande, A., 1948: Classification and identification of soil. Transactions of the American Society of Civil Engineers, v. 113, p. 901-930). The chart below & the soil classification given in the table above are included for your information only, and are not included in the IANZ endorsement for this report.
CHART LEGEND
Sample Number
Depth (m) Liquid Limit Plastic LimitPlasticity
IndexSoil Classification Based on
USCS Chart Below
CH
0
20
40
60
80
100
0 20 40 60 80 100 120 140 160
PL
AS
TIC
ITY
IN
DE
X
LIQUID LIMIT
UNIFIED SOIL CLASSIFICATION SYSTEM (USCS) PLASTICITY (CASAGRANDE) CHART
BH08 / TUBE / 3.00 - 3.45m
A - LINE
MH or OH
CH or OH
CL or OL
ML or OL
CL - ML
20/07/2017 Hackett Diversion LIMIT.xlsx

Babbage Geotechnical Laboratory Level 4 68 Beach Road P O Box 2027 Auckland 1010 New Zealand Telephone 64-9-367 4954 E-mail [email protected]
200016652 Limits Report St Marys Bay.docx
BGL is an operating division of Babbage Consultants Limited
Please reply to: W.E. Campton Page 1 of 4
Aurecon New Zealand Limited PO Box 9762 Newmarket Auckland 1149 Attention: ISABELLA MERSCHDORF
Job Number: 61256#L BGL Registration Number: 2520 Checked by: WEC
2nd March 2018
ATTERBERG LIMITS TESTING Dear Isabella,
Re: ST MARYS BAY Report Number: 61256#L/AL The following report presents the results of Atterberg Limits testing of soil samples delivered to this laboratory on the 13th of February 2018. Test results are summarised below, with pages 3 and 4 showing where the samples plot on the Unified Soil Classification System (Casagrande) Chart. Test standards used were: Water Content: NZS4402:1986:Test 2.1
Liquid Limit: NZS4402:1986:Test 2.2
Plastic Limit: NZS4402:1986:Test 2.3
Plasticity Index: NZS4402:1986:Test 2.4
Borehole Number
Sample Number
Depth (m) Water
Content (%) Liquid Limit
Plastic Limit
Plasticity Index
BH09A SPT 1.80 – 2.25 30.6 50 � 18 � 32
BH09A SPT 3.00 – 3.45 33.9 39 � 16 � 23
BH20 CORE 1.60 – 1.75 50.3 110 29 81
BH20 BAG 3.45 – 3.62 44.1 110 23 87
BH27 SPT 7.50 – 7.95 30.5 42 16 26
BH27 CORE 8.40 – 8.67 24.1 46 � 15 � 31

Job Number: 61256#L
2nd March 2018
Page 2 of 4
200016652 Limits Report St Marys Bay.docx
BGL is an operating division of Babbage Consultants Limited
Borehole Number
Sample Number
Depth (m) Water
Content (%)
Liquid Limit
Plastic Limit
Plasticity Index
BH30 BAG 4.95 – 5.10 42.5 47 20 27
BH30 BAG 5.80 – 5.90 28.2 53 19 34
BH30* BAG 6.79 – 7.01 29.2 63 � 22 � 41
BH30* BAG 11.41 – 11.52 18.6 50 � 23 � 27
MA01 TUBE 2.20 – 2.70 51.6 62 � 19 � 43
MA03 TUBE 2.30 – 2.80 38.0 72 22 50
*These samples were prepared from weakly cemented rock core. The soil was wet up and sieved through a
425µm sieve, with more water added if necessary to obtain the liquid limit. The sample was then dried back to the plastic limit moisture content. As per the reporting requirements of NZS4402: 1986: Test 2.1: water content is reported to two significant figures for values below 10%, and to three significant figures for values of 10% or greater. Test 2.2: liquid limit and test 2.3: plastic limit are reported to the nearest whole number. The whole soil was used for all water content tests (the soils were in a natural state), and for the plastic limit
and liquid limit tests without a diamond beside them. The soil fraction passing a 425µm sieve was used for the plastic limit and liquid limit tests with a diamond (�) beside them. The soil was wet up and dried where required for the plastic limit and liquid limit tests. Please note that the test results relate only to the samples under test. Thank you for the opportunity to carry out this testing. If you have any queries regarding the content of this report, please contact the undersigned at your convenience. Yours faithfully, Wayne Campton Signatory (Laboratory Manager) Babbage Geotechnical Laboratory
All tests reported herein have been performed in accordance with the laboratory’s scope of accreditation. This report may not be reproduced except in full & with written approval from BGL.

Job Number:
Reg. Number:
Report No:
Tested By: WC / JD / TJ
Compiled By: JF
Checked By: JF
BH09A SPT 1.80 - 2.25 50 18 32
BH09A SPT 3.00 - 3.45 39 16 23
BH20 CORE 1.60 - 1.75 110 29 81
BH20 BAG 3.45 - 3.62 110 23 87
BH27 SPT 7.50 - 7.95 42 16 26
BH27 CORE 8.40 - 8.67 46 15 31
BH30 BAG 4.95 - 5.10 47 20 27
BH30 BAG 5.80 - 5.90 53 19 34
BH30 BAG 6.79 - 7.01 63 22 41
BH30 BAG 11.41 - 11.52 50 23 27
CL = CLAY, low plasticity ('lean' clay) CH = CLAY, high plasticity ('fat' clay)
OL = ORGANIC CLAY or ORGANIC SILT, low liquid limit OH = ORGANIC CLAY or ORGANIC SILT, high liquid limit
ML = SILT, low liquid limit MH = SILT, high liquid limit ('elastic silt')
CL - ML = SILTY CLAY
The chart below & soil classification terminology is taken from ASTM D2487-11 "Standard Practice for Classification of Soils for
Engineering Purposes (Unified Soil Classification System)", June 2011, & is based on the classification scheme developed by A.
Casagrande in the 1940's (Casagrande, A., 1948: Classification and identification of soil. Transactions of the American Society of Civil
Engineers, v. 113, p. 901-930). The chart below & the soil classification given in the table above are included for your information only,
and are not included in the IANZ endorsement for this report.
CHART LEGEND
Sample
NumberDepth (m) Liquid Limit Plastic Limit
Plasticity
Index
Soil Classification Based on
USCS Chart Below
CL - CH
CH
CL - CH
CL
CH
CL
CL
CH
CH
CL
SUMMARY OF TESTING
ST MARYS BAY
Borehole
Number
Feb / Mar 2018
Project:
DETERMINATION OF THE LIQUID LIMIT, PLASTIC
LIMIT & THE PLASTICITY INDEX
61256#L
2520
61256#L/AL
2/03/2018
2/03/2018
Sheet 1 of 1
Version No:
Version Date:
Page 3 of 4
5
July 2017
Test Methods: NZS4402: 1986: Test 2.2, Test 2.3 and Test 2.4
0
20
40
60
80
100
0 20 40 60 80 100 120 140 160
PL
AS
TIC
ITY
IN
DE
X
LIQUID LIMIT
UNIFIED SOIL CLASSIFICATION SYSTEM (USCS) PLASTICITY (CASAGRANDE) CHART
BH09A / SPT / 1.80 - 2.25m BH09A / SPT / 3.00 - 3.45m BH20 / CORE / 1.60 - 1.75m BH20 / BAG / 3.45 - 3.62m
BH27 / SPT / 7.50 - 7.95m BH27 / CORE / 8.40 - 8.67m BH30 / BAG / 4.95 - 5.10m BH30 / BAG / 5.80 - 5.90m
BH30 / BAG / 6.79 - 7.01m BH30 / BAG / 11.41 - 11.52m
A - LINE
MH or OH
CH or OH
CL or OL
ML or OL
CL - ML
2/03/2018 St Marys Bay Limits 1.xlsx

Job Number:
Reg. Number:
Report No:
Tested By: WC / JD / TJ
Compiled By: JF
Checked By: JF
MA01 TUBE 2.20 - 2.70 62 19 43
MA03 TUBE 2.30 - 2.80 72 22 50
CL = CLAY, low plasticity ('lean' clay) CH = CLAY, high plasticity ('fat' clay)
OL = ORGANIC CLAY or ORGANIC SILT, low liquid limit OH = ORGANIC CLAY or ORGANIC SILT, high liquid limit
ML = SILT, low liquid limit MH = SILT, high liquid limit ('elastic silt')
CL - ML = SILTY CLAY
The chart below & soil classification terminology is taken from ASTM D2487-11 "Standard Practice for Classification of Soils for
Engineering Purposes (Unified Soil Classification System)", June 2011, & is based on the classification scheme developed by A.
Casagrande in the 1940's (Casagrande, A., 1948: Classification and identification of soil. Transactions of the American Society of Civil
Engineers, v. 113, p. 901-930). The chart below & the soil classification given in the table above are included for your information only,
and are not included in the IANZ endorsement for this report.
CHART LEGEND
Sample
NumberDepth (m) Liquid Limit Plastic Limit
Plasticity
Index
Soil Classification Based on
USCS Chart Below
CH
CH
SUMMARY OF TESTING
ST MARYS BAY
Borehole
Number
Feb / Mar 2018
Project:
DETERMINATION OF THE LIQUID LIMIT, PLASTIC
LIMIT & THE PLASTICITY INDEX
61256#L
2520
61256#L/AL
2/03/2018
2/03/2018
Sheet 1 of 1
Version No:
Version Date:
Page 4 of 4
5
July 2017
Test Methods: NZS4402: 1986: Test 2.2, Test 2.3 and Test 2.4
0
20
40
60
80
100
0 20 40 60 80 100 120 140 160
PL
AS
TIC
ITY
IN
DE
X
LIQUID LIMIT
UNIFIED SOIL CLASSIFICATION SYSTEM (USCS) PLASTICITY (CASAGRANDE) CHART
MA01 / TUBE/ 2.20 - 2.70m MA03 / TUBE / 2.30 - 2.80m
A - LINE
MH or OH
CH or OH
CL or OL
ML or OL
CL - ML
2/03/2018 St Marys Bay Limits 2.xlsx

Babbage Geotechnical Laboratory Level 4 68 Beach Road P O Box 2027 Auckland 1010 New Zealand Telephone 64-9-367 4954 E-mail [email protected]
200010728 Hackett Diversion Triaxial Report.docx
BGL is an operating division of Babbage Consultants Limited
Please reply to: W.E. Campton Page 1 of 7
Aurecon New Zealand Limited PO Box 9762 Newmarket Auckland 1149 Attention: JAMES ELVY
Job Number: 60770#L BGL Registration Number: 2439 Checked by: WEC
25th July 2017
CONSOLIDATED, UNDRAINED (CU), MULTI-STAGE TRIAXIAL COMPRESSIVE STRENGTH TESTING
Dear Sir,
Re: HACKETT DIVERSION Report Number: 60770#L/CU Triaxial BH08 3.00 – 3.45m
Borehole No: BH08 Sample No: TUBE Depth: 3.00 – 3.45m The following report presents the results of triaxial compressive strength testing of a 54mm diameter undisturbed push-tube soil sample delivered to this laboratory on the 12th of July 2017. The client request was to measure the consolidated, undrained compression of the sample in a triaxial apparatus under known conditions of effective stress, with measurement of porewater pressure. We were instructed to test a single sample at effective pressures of 30kPa, 60kPa, and 120kPa by carrying out a 3-point multi-stage test. Please note that the multi-stage method described below is commonly carried out by soils testing laboratories, but is not part of BS1377:1990: Part 8: Section 7 (in which a number of specimens taken from one soil sample are each tested to failure at different effective pressures). The method described below is therefore a departure from BS1377:1990: Part 8: Section 7. Test standards used were: Water Content: NZS4402: 1986: Test 2.1
Preparation of specimen: BS1377: 1990: Part 8: Section 4
Saturation: BS1377: 1990: Part 8: Section 5
Consolidation: BS1377: 1990: Part 8: Section 6
Consolidated-undrained triaxial compression test with measurement of pore pressure: BS1377: 1990: Part 8: Section 7
Test Procedure The sample was extruded from the push-tube and trimmed to length. The sample was then set up in a triaxial cell & saturation was achieved in distinct stages by 30kPa increments of cell pressure and back pressure, with a differential pressure of 10kPa (cell pressure 10kPa greater than back pressure) in order to maintain a small positive effective stress.

Job Number: 60770#L
25th July 2017
Page 2 of 7
200010728 Hackett Diversion Triaxial Report.docx
BGL is an operating division of Babbage Consultants Limited
The final saturation stage used a cell pressure of 400kPa and a back pressure of 390kPa. Saturation was then confirmed by increasing the cell pressure to 450kPa, and observing the increase in porewater pressure. A porewater pressure coefficient (B) of 0.99 was achieved, confirming saturation of the sample. The cell pressure was then lowered to 420kPa, and the porewater pressure was allowed to stabilise before the first consolidation cycle was begun. Excess porewater pressure was then dissipated during the first consolidation cycle, resulting in an effective stress of 30kPa. The sample was then compressed at a set rate of 0.010mm per minute (actual rate of 0.009mm per minute) until the deviator stress was close to maximum. Compression was then stopped and the load taken off the sample. Cell pressure was increased to 450kPa and the resulting increased porewater pressure was dissipated in the second consolidation cycle, resulting in an effective pressure of 60kPa acting on the same sample. Once consolidated, the 2nd compression cycle was compressed at a set rate of 0.010mm per minute (actual rate of 0.009mm per minute) until the deviator stress was close to maximum. Compression was again stopped and the load taken off the sample. Cell pressure was increased to 510kPa and the resulting increased porewater pressure was dissipated in the third consolidation cycle, resulting in an effective pressure of 120kPa acting on the same sample. Once consolidated, the 3rd compression cycle was compressed at a set rate of 0.010mm per minute (actual rate of 0.010mm per minute) until complete failure of the sample had occurred. Mohr circle plots for each cycle are presented on page 4 of this report. We leave the determination of the angle of resistance and the cohesion to our clients, but as a guide to this we tabulate each tangent to sets of circles on the graph. This test was carried out in a laboratory in which the temperature is controlled between 18°C and 22°C. Each test result is data obtained at a specific test location. The nature and continuity of subsoil conditions away from the test area could vary from the data recovered during this testing. Thank you for the opportunity to carry out this testing. If you have any queries regarding the content of this report please contact the undersigned at your convenience. Yours faithfully, Justin Franklin Signatory (Assistant Laboratory Manager) Babbage Geotechnical Laboratory
All tests reported herein have been performed in accordance with the laboratory’s scope of accreditation. This report may not be reproduced except in full & with written approval from BGL.

Version No: 3
Issue Date: Jan-15
Report No: Auth. By: WEC
CU MULTI-STAGE TRIAXIAL COMPRESSION TEST Tested By: JF / WEC 17-Jul-17
Compiled By: JF 24-Jul-17
Checked By: WEC 25-Jul-17
Borehole: BH08 Sample No: TUBE Depth: 3.00 - 3.45mSample History: undisturbed / remoulded / compacted / other
Sample Description (not part of BGL IANZ accreditation):
Test Procedure: single sample with side drains at different effective consolidation pressures.
Initial Diameter: 53.6 mm Initial Moisture Content: 50.5 %
Initial Length: 108.5 mm Final Moisture Content: 43.0 %
Initial Mass: 428.85 g Initial Dry Density: 1.16 t/m3
Initial Bulk Density: 1.75 t/m3 Final Dry Density: 1.24 t/m3
Saturation Procedure: 30kPa increments of cell pressure and back pressure, differential pressure of 10kPa.
At End of Saturation: Cell Pressure Increase: 50.0 kPa Final Cell Pressure: 420 kPa
Resulting Increase in Pore Pressure: 49.3 kPa Final Pore Pressure: 409.6 kPa
Pore Pressure Coefficient B : 0.99
Test Cycles:
Cell Pressure kPa
Back Pressure kPa
Effective Pressure kPaPore Pressure at Start of Consolidation kPa
Pore Pressure to Dissipate kPa
Dissipation %
Pore Pressure at End of Consolidation kPa
Rate of Strain (set) mm/min
Rate of Strain (actual) mm/min
Pore Pressure at Start of Compression kPa
Axial Strain at Failure (*cumulative) % * 2.95 * 12.33Axial Strain at Failure (*cumulative) mm * 3.14 * 12.81Deviator Stress at Failure kPa
Pore Pressure at Failure kPa
Effective Major Principal Stress at Failure kPa
Effective Minor Principal Stress at Failure kPa
Effective Principal Stress Ratio at Failure
Failure Type:
Membrane Restraining Effect Correction kPa
Vertical Side Drain Correction kPa
HACKETT DIVERSION
2 3
420 510
SATURATION CYCLE
SAMPLE DETAILS
TOP 2/3 of sample: SAND, fine to medium, non-plastic, grey with thin black bands, slightly moist.
Bottom 1/3 of sample: CLAY, soft to firm, highly plastic, grey with black spots, very moist.
BS 1377: 1990: Part 8: Section 7: Consolidated-undrained triaxial compression test with measurement of pore pressure / NZS4402:1986: Test 2.1 - Water Content
390
1
120
88.8
450
30
19.6
39060
43.2
390
0.0100.009390.0
0.010
98.9
0.0100.010391.0
100.0100.0
423.387.026.7
467.9
0.009390.0
Criteria Used to Determine Failure:
1.261.3642.2
maximum deviator stress / maximum effective principal stress ratio
Job Number:
60770#LRegistration No:
243960770#L/CU Triaxial BH08 3.00 - 3.45m
Page 3 of 7
0.3 1.0
0.0
409.6 433.2 478.8
390.0 390.0 391.0
122.4
164.5
60.3
42.1
405.856.414.2
6.6 6.6
PLASTIC
COMPRESSION CYCLES
CONSOLIDATION CYCLES
FAILURE CONDITIONS
CORRECTIONS APPLIED TO MEASURED DEVIATOR STRESS
Effective Major Principal Stress at Start of Compression
kPa
3.962 3.9043.261
30.0 60.0 119.0
0.1
25/07/2017 Hackett Diversion Triaxial BH08 3.00 - 3.45m.xlsx

Version No: 3Issue Date: Jan-15
Auth. By: WECInitials Date
Tested By: JF / WEC 17-Jul-17Job No: 60770#L Plotted By: JF 24-Jul-17
Reg. No: 2439 Checked By: WEC 25-Jul-17
Effective Effective From Graph Below:Major Minor
Mohr Circle Plot: Principal Principal Angle of Shear Resistance φ'= degreesStress Stress s' t'
(σ1') (σ3') (σ1' + σ3')/2 (σ1' - σ3')/2 Cohesion c'= kPacycle kPa kPa kPa kPa
1 56 14 35 21 (Values to be decided upon by Geotechnical Engineer)2 87 27 57 303 165 42 103 61
Effective Stress Path Parameters
Borehole Number: BH08Depth:
TUBE
Page 4 of 7
3.00 - 3.45mSample Number:
3-POINT MULTI-STAGE TRIAXIAL COMPRESSION TEST
HACKETT DIVERSIONBS 1377: 1990: Part 8: Section 7: Consolidated-undrained with Porewater Pressure Measurement
PROJECT:
0
20
40
60
80
100
0 20 40 60 80 100 120 140 160 180 200
SH
EA
R S
TR
ES
S (
kPa)
NORMAL STRESS (kPa)
MOHR CIRCLE PLOTCycle 1 - Mohr Circle
Cycle 2 - Mohr Circle
Cycle 3 - Mohr Circle
Tangent to Circles 1 & 2: slope angle = 25° / y-intercept = 7kPa
Tangent to Circles 2 & 3: slope angle = 42° / y-intercept = -10kPa
Tangent to Circles 1 & 3: slope angle = 36° / y-intercept = 0kPa
25/07/2017 Hackett Diversion Triaxial BH08 3.00 - 3.45m.xlsx

Version No: 3Issue Date: Jan-15
Auth. By: WECInitials Date
Tested By: JF / WEC 17-Jul-17Job No: 60770#L Plotted By: JF 24-Jul-17
Reg. No: 2439 Checked By: WEC 25-Jul-17TUBE
3-POINT MULTI-STAGE TRIAXIAL COMPRESSION TEST
PROJECT: HACKETT DIVERSIONBS 1377: 1990: Part 8: Section 7: Consolidated-undrained with Porewater Pressure Measurement
Page 5 of 7
Borehole Number: BH08Depth: 3.00 - 3.45m
Sample Number:
0
20
40
60
80
100
120
140
0 2 4 6 8 10 12 14
Dev
iato
r S
tres
s (
kPa)
Cumulative Strain %
Stress vs Strain
Cycle 1 - 30 kPa
Cycle 2 - 60 kPa
Cycle 3 - 120 kPa
0
20
40
60
80
100
0 2 4 6 8 10 12 14
Por
ewat
er P
ress
ure
Cha
nge
(kP
a)
Cumulative Strain %
PWP Change vs Strain
Cycle 1 PWP Change
Cycle 2 PWP Change
Cycle 3 PWP Change
1.0
2.0
3.0
4.0
5.0
0 2 4 6 8 10 12 14
Str
ess
Rat
io
Cumulative Strain %
Stress Ratio vs Strain
Cycle 1 - 30 kPa
Cycle 2 - 60 kPa
Cycle 3 - 120 kPa
0
10
20
30
40
50
60
70
0 20 40 60 80 100 120 140
t'
s'
Stress Path
Cycle 1 - 30 kPa
Cycle 2 - 60 kPa
Cycle 3 - 120 kPa
25/07/2017 Hackett Diversion Triaxial BH08 3.00 - 3.45m.xlsx

Version No: 3Issue Date: Jan-15
Auth. By: WECInitials Date
Tested By: JF / WEC 17-Jul-17
Job No: 60770#L Plotted By: JF 24-Jul-17
Reg. No: 2439 Checked By: WEC 25-Jul-17TUBE
3-POINT MULTI-STAGE TRIAXIAL COMPRESSION TEST
PROJECT: HACKETT DIVERSION
Page 6 of 7
BS 1377: 1990: Part 8: Section 7: Consolidated-undrained with Porewater Pressure Measurement
Borehole Number: BH08Depth: 3.00 - 3.45m
Sample Number:
0.0
0.1
0.2
0.3
0.4
0.5
0.6
0.7
0.8
0.9
1.0
0 100 200 300 400 500
B-V
alu
e
Applied Cell Pressure (kPa)
SATURATION
B-Value
B = 0.95
0
10
20
30
40
50
60
70
80
90
100
0 2 4 6 8 10 12 14 16
Dis
sip
atio
n (
%)
Square Root of Time (minutes)
CONSOLIDATION
Cycle 1
Cycle 2
Cycle 3
0
10
20
30
40
50
60
70
80
90
100
0.0 0.1 1.0 10.0 100.0 1000.0
Dis
sip
atio
n (
%)
Log of Time (minutes)
CONSOLIDATION
Cycle 1
Cycle 2
Cycle 3
25/07/2017 Hackett Diversion Triaxial BH08 3.00 - 3.45m.xlsx

Version No: 3Issue Date: Jan-15
Auth. By: WECInitials Date
Tested By: JF / WEC 17-Jul-17Job No: 60770#L Plotted By: JF 24-Jul-17
Reg. No: 2439 Checked By: WEC 25-Jul-17
3-POINT MULTI-STAGE TRIAXIAL COMPRESSION TEST Page 7 of 7
BS 1377:1990: Test 8: Section 7: Consolidated Undrained with Porewater Pressure Measurement
PROJECT: HACKETT DIVERSION
SAMPLE BEFORE TEST SAMPLE AFTER TEST
Borehole Number: BH08Depth: 3.00 - 3.45m
Sample Number: TUBE
25/07/2017 Hackett Diversion Triaxial BH08 3.00 - 3.45m.xlsx

Babbage Geotechnical Laboratory Level 4 68 Beach Road P O Box 2027 Auckland 1010 New Zealand Telephone 64-9-367 4954 E-mail [email protected]
200016645 CU Triaxial Report St Marys Bay.docx
BGL is an operating division of Babbage Consultants Limited
Please reply to: W.E. Campton Page 1 of 7
Aurecon New Zealand Limited PO Box 9762 Newmarket Auckland 1149 Attention: ISABELLA MERSCHDORF
Job Number: 61256#L BGL Registration Number: 2520 Checked by: WEC
14th March 2018
CONSOLIDATED, UNDRAINED (CU), MULTI-STAGE TRIAXIAL COMPRESSIVE STRENGTH TESTING
Dear Isabella,
Re: ST MARYS BAY Report Number: 61256#L/CU Triaxial MA01 1.70 – 2.20m
Borehole No: MA01 Sample No: TUBE Depth: 1.70 – 2.20m
The following report presents the results of triaxial compressive strength testing of a core sample delivered to this laboratory on the 13th of February 2018. The client request was to measure the consolidated, undrained compression of the sample in a triaxial apparatus under known conditions of effective stress, with measurement of porewater pressure. We were instructed to test a single sample at effective pressures of 10kPa, 20Pa, and 40kPa by carrying out a 3-point multi-stage test. Based on our experience, however, these pressures were considered far too low to give a reliable test result, so effective stresses of 40kPa, 80kPa and 160kPa were agreed with the client. Please note that the multi-stage method described below is commonly carried out by soils testing laboratories, but is not part of BS1377:1990: Part 8: Section 7 (in which a number of specimens taken from one soil sample are each tested to failure at different effective pressures). The method described below is therefore a departure from BS1377:1990: Part 8: Section 7. Test standards used were: Water Content: NZS4402: 1986: Test 2.1
Preparation of specimen: BS1377: 1990: Part 8: Section 4
Saturation: BS1377: 1990: Part 8: Section 5
Consolidation: BS1377: 1990: Part 8: Section 6
Consolidated-undrained triaxial compression test with measurement of pore pressure: BS1377: 1990: Part 8: Section 7
Test Procedure The core sample was removed from the core box and trimmed to length. The sample was then set up in a triaxial cell & saturation was achieved in distinct stages by 50kPa increments of cell pressure and back pressure, with a differential pressure of 10kPa (cell pressure 10kPa greater than back pressure) in order to maintain a small positive effective stress.

Job Number: 61256#L
14th March 2018
Page 2 of 7
200016645 CU Triaxial Report St Marys Bay.docx
BGL is an operating division of Babbage Consultants Limited
The final saturation stage used a cell pressure of 400kPa and a back pressure of 390kPa. Saturation was then confirmed by increasing the cell pressure to 430kPa, and observing the increase in porewater pressure. A porewater pressure coefficient (B) of 1.00 was achieved, confirming saturation of the sample. Excess porewater pressure was then dissipated during the first consolidation cycle, resulting in an effective stress of 40kPa. The sample was then compressed at a set rate of 0.015mm per minute (actual rate of 0.015mm per minute) until the stress ratio was close to maximum. Compression was then stopped and the load taken off the sample. Cell pressure was increased to 470kPa and the resulting increased porewater pressure was dissipated in the second consolidation cycle, resulting in an effective pressure of 80kPa acting on the same sample. Once consolidated, the 2nd compression cycle was compressed at a set rate of 0.015mm per minute (actual rate of 0.014mm per minute) until the stress ratio was close to maximum. Compression was again stopped and the load taken off the sample. Cell pressure was increased to 550kPa and the resulting increased porewater pressure was dissipated in the third consolidation cycle, resulting in an effective pressure of 160kPa acting on the same sample. Once consolidated, the 3rd compression cycle was compressed at a set rate of 0.015mm per minute (actual rate of 0.014mm per minute) until complete failure of the sample had occurred. Mohr circle plots for each cycle are presented on page 4 of this report. We leave the determination of the angle of resistance and the cohesion to our clients, but as a guide to this we tabulate each tangent to sets of circles on the graph. This test was carried out in a laboratory in which the temperature is controlled between 18°C and 22°C. Each test result is data obtained at a specific test location. The nature and continuity of subsoil conditions away from the test area could vary from the data recovered during this testing. Thank you for the opportunity to carry out this testing. If you have any queries regarding the content of this report please contact the undersigned at your convenience.
Yours faithfully, Justin Franklin Signatory (Assistant Laboratory Manager) Babbage Geotechnical Laboratory
All tests reported herein have been performed in accordance with the laboratory’s scope of accreditation. This report may not be reproduced except in full & with written approval from BGL.

Version No: 4
Issue Date: Aug-17
Report No: Auth. By: WEC
CU MULTI-STAGE TRIAXIAL COMPRESSION TEST Tested By: JF March 2018
Compiled By: JF 14-Mar-18
Checked By: WEC 14-Mar-18
Borehole: MA01 Sample No: TUBE Depth: 1.70 - 2.20mSample History: undisturbed / remoulded / compacted / other
Sample Description (not part of BGL IANZ accreditation):
Test Procedure: single sample with side drains at different effective consolidation pressures.
Initial Diameter: 54.0 mm Initial Moisture Content: 37.2 %
Initial Length: 109.0 mm Final Moisture Content: 31.0 %
Initial Mass: 453.53 g Initial Dry Density: 1.32 t/m3
Initial Bulk Density: 1.82 t/m3 Final Dry Density: 1.43 t/m
3
Saturation Procedure: 50kPa increments of cell pressure and back pressure, differential pressure of 10kPa. Saturated from top and base of sample.
At End of Saturation: Cell Pressure Increase: 30.0 kPa Final Cell Pressure: 430 kPa
Resulting Increase in Pore Pressure: 29.9 kPa Final Pore Pressure: 420.0 kPa
Pore Pressure Coefficient B : 1.00
Test Cycles:
Cell Pressure kPa
Back Pressure kPa
Effective Pressure kPaPore Pressure at Start of Consolidation kPa
Pore Pressure to Dissipate kPa
Dissipation %
Pore Pressure at End of Consolidation kPa
Rate of Strain (set) mm/min
Rate of Strain (actual) mm/min
Pore Pressure at Start of Compression kPa
Axial Strain at Failure (*cumulative) % * 5.59 * 12.86
Axial Strain at Failure (*cumulative) mm * 5.93 * 13.23
Deviator Stress at Failure kPa
Pore Pressure at Failure kPa
Effective Major Principal Stress at Failure kPa
Effective Minor Principal Stress at Failure kPa
Effective Principal Stress Ratio at Failure
Failure Type:
Membrane Restraining Effect Correction kPa
Vertical Side Drain Correction kPa
ST MARYS BAY
2 3
430 550
SATURATION CYCLE
SAMPLE DETAILS
BS 1377: 1990: Part 8: Section 7: Consolidated-undrained triaxial compression test with measurement
of pore pressure / NZS4402:1986: Test 2.1 - Water Content
SAND, fine to coarse, some silt, trace organics, slightly plastic, dark grey with grey patches, moist to
very moist, occasional pockets & lenses of highly plastic, grey clay.
390
1
160
134.4
470
40
30.3
390
80
67.3
390
0.015
0.015
391.2
0.015
99.8
0.015
0.014
390.3
100.195.9
435.1
123.4
34.9
476.2
0.014
390.0
Criteria Used to Determine Failure:
2.80
3.03
30.0
maximum deviator stress / maximum effective principal stress ratio
Job Number:
61256#L
Registration No:
252061256#L/CU Triaxial MA01 1.70 - 2.20m
Page 3 of 7
0.5 1.0
6.6
420.3 457.3 524.4
391.2 390.0 390.3
195.2
268.9
88.6
73.8
412.9
47.0
17.1
6.6 6.6
PLASTIC
COMPRESSION CYCLES
CONSOLIDATION CYCLES
FAILURE CONDITIONS
CORRECTIONS APPLIED TO MEASURED DEVIATOR STRESS
Effective Major Principal Stress at Start of
CompressionkPa
2.754 3.6463.541
38.8 80.0 159.7
0.3
14/03/2018 St Marys Bay CU Triaxial MA01 1.70 - 2.20m.xlsx

Version No: 4Issue Date: Aug-17
Auth. By: WECInitials Date
Tested By: JF March 2018
Job No: 61256#L Plotted By: JF 14-Mar-18
Reg. No: 2520 Checked By: WEC 14-Mar-18
Effective Effective From Graph Below:Major Minor
Mohr Circle Plot: Principal Principal Angle of Shear Resistance φ'= degrees
Stress Stress s' t'
(σ1') (σ3') (σ1' + σ3')/2 (σ1' - σ3')/2 Cohesion c'= kPacycle kPa kPa kPa kPa
1 47 17 32 15 (Values to be decided upon by Geotechnical Engineer)
2 123 35 79 44
3 269 74 171 98
Effective Stress Path
Parameters
Borehole Number: MA01Depth:
TUBE
Page 4 of 7
1.70 - 2.20mSample Number:
3-POINT MULTI-STAGE TRIAXIAL COMPRESSION TEST
ST MARYS BAYBS 1377: 1990: Part 8: Section 7: Consolidated-undrained with Porewater Pressure Measurement
PROJECT:
0
20
40
60
80
100
120
140
0 100 200 300
SH
EA
R S
TR
ES
S
(kP
a)
NORMAL STRESS (kPa)
MOHR CIRCLE PLOTCycle 1 - Mohr Circle
Cycle 2 - Mohr Circle
Cycle 3 - Mohr Circle
Tangent to Circles 1 & 2: slope angle = 38° / y-intercept = -6kPa
Tangent to Circles 2 & 3: slope angle = 35° / y-intercept = -2kPa
Tangent to Circles 1 & 3: slope angle = 36° / y-intercept = -5kPa
14/03/2018 St Marys Bay CU Triaxial MA01 1.70 - 2.20m.xlsx

Version No: 4
Issue Date: Aug-17Auth. By: WEC
Initials Date
Tested By: JF March 2018
Job No: 61256#L Plotted By: JF 14-Mar-18
Reg. No: 2520 Checked By: WEC 14-Mar-18TUBE
3-POINT MULTI-STAGE TRIAXIAL COMPRESSION TEST
PROJECT: ST MARYS BAYBS 1377: 1990: Part 8: Section 7: Consolidated-undrained with Porewater Pressure Measurement
Page 5 of 7
Borehole Number: MA01Depth: 1.70 - 2.20m
Sample Number:
0
50
100
150
200
250
300
0 5 10 15 20 25
Devia
tor
Str
ess
(kP
a)
Cumulative Strain %
Stress vs Strain
Cycle 1 - 40 kPa
Cycle 2 - 80 kPa
Cycle 3 - 160 kPa
0
10
20
30
40
50
60
70
80
90
100
0 5 10 15 20 25
Po
rew
ate
r P
ressu
re C
han
ge
(kP
a)
Cumulative Strain %
PWP Change vs Strain
Cycle 1 PWP Change
Cycle 2 PWP Change
Cycle 3 PWP Change
1.0
2.0
3.0
4.0
0 5 10 15 20 25
Str
ess
Rati
o
Cumulative Strain %
Stress Ratio vs Strain
Cycle 1 - 40 kPa
Cycle 2 - 80 kPa
Cycle 3 - 160 kPa
0
20
40
60
80
100
120
140
0 100 200 300
t'
s'
Stress Path
Cycle 1 - 40 kPa
Cycle 2 - 80 kPa
Cycle 3 - 160 kPa
14/03/2018 St Marys Bay CU Triaxial MA01 1.70 - 2.20m.xlsx

Version No: 4
Issue Date: Aug-17
Auth. By: WECInitials Date
Tested By: JF March 2018
Job No: 61256#L Plotted By: JF 14-Mar-18
Reg. No: 2520 Checked By: WEC 14-Mar-18TUBE
3-POINT MULTI-STAGE TRIAXIAL COMPRESSION TEST
PROJECT: ST MARYS BAY
Page 6 of 7
BS 1377: 1990: Part 8: Section 7: Consolidated-undrained with Porewater Pressure Measurement
Borehole Number: MA01Depth: 1.70 - 2.20m
Sample Number:
0.0
0.1
0.2
0.3
0.4
0.5
0.6
0.7
0.8
0.9
1.0
0 100 200 300 400 500
B-V
alu
e
Applied Cell Pressure (kPa)
SATURATION
B-Value
B = 0.95
0
10
20
30
40
50
60
70
80
90
100
0 1 2 3 4 5 6 7 8
Dis
sip
ati
on
(%
)
Square Root of Time (minutes)
CONSOLIDATION
Cycle 1
Cycle 2
Cycle 3
0
10
20
30
40
50
60
70
80
90
100
0.0 0.1 1.0 10.0 100.0
Dis
sip
ati
on
(%
)
Log of Time (minutes)
CONSOLIDATION
Cycle 1
Cycle 2
Cycle 3
14/03/2018 St Marys Bay CU Triaxial MA01 1.70 - 2.20m.xlsx

Version No: 4
Issue Date: Aug-17
Auth. By: WECInitials Date
Tested By: JF Feb 2018
Job No: 61256#L Plotted By: JF 14-Mar-18
Reg. No: 2520 Checked By: WEC 14-Mar-18
3-POINT MULTI-STAGE TRIAXIAL COMPRESSION TEST Page 7 of 7
BS 1377:1990: Test 8: Section 7: Consolidated Undrained with Porewater Pressure Measurement
PROJECT: ST MARYS BAY
SAMPLE BEFORE TEST SAMPLE AFTER TEST
Borehole Number: MA01Depth: 1.70 - 2.20m
Sample Number: TUBE
14/03/2018 St Marys Bay CU Triaxial MA01 1.70 - 2.20m.xlsx

Babbage Geotechnical Laboratory Level 4 68 Beach Road P O Box 2027 Auckland 1010 New Zealand Telephone 64-9-367 4954 E-mail [email protected]
200016646 UU Triaxial Report St Marys Bay.docx
BGL is an operating division of Babbage Consultants Limited
Please reply to: W.E. Campton Page 1 of 5
Aurecon New Zealand Limited PO Box 9762 Newmarket Auckland 1149 Attention: ISABELLA MERSCHDORF
Job Number: 61256#L BGL Registration Number: 2520 Checked by: WEC
26th February 2018
UNCONSOLIDATED, UNDRAINED, ‘QUICK’ (QU) TRIAXIAL COMPRESSIVE STRENGTH TESTING
Dear Isabella,
Re: ST MARYS BAY Report Number: 61256#L/UU Triaxial The following report presents the results of unconsolidated, undrained, ‘quick’ (QU) triaxial compression testing of a core sample delivered to this laboratory on the 13th of February 2018. Test results are summarised below, with the following pages showing detailed results. The samples were tested in accordance with the following standards:
Water Content: NZS4402:1986:Test 2.1 Determination of the undrained shear strength in triaxial compression without measurement of pore pressure BS1377:1990: Part 7: Section 8 (definitive method): The sample was set up in a triaxial cell with a single covering membrane (having a total thickness of 0.2mm), and the cell was then filled with water. The cell pressure was then raised to the required pressure of 180kPa (as per your instructions) and the axial load applied straight away. The loading machine was set at a rate of compression to induce failure within 5 to 15 minutes. The rate of compression was set at 0.50mm / minute. The load versus strain was measured until failure.
Sample Identification
Cell Pressure (kPa)
Maximum Deviator
Stress (kPa)
Shear Strength (cu)
(kPa)
Strain (%)
Mode of Failure
BH27 / CORE / 8.40 – 8.67m
180 434 217 8.0 Plastic

Job Number: 61256#L
26th February 2018
Page 2 of 5
200016646 UU Triaxial Report St Marys Bay.docx
BGL is an operating division of Babbage Consultants Limited
As per the reporting requirements of NZS4402: 1986: Test 2.1: water content is reported to two significant figures for values below 10%, and to three significant figures for values of 10% or greater. As per the reporting requirements of BS1377:1990: Part 7: Section 8: the value of Cu is reported to the nearest whole number. Please note that the test results relate only to the sample under test. Thank you for the opportunity to carry out this testing. If you have any queries regarding the content of this report, please contact the undersigned at your convenience.
Yours faithfully, Justin Franklin Signatory (Assistant Laboratory Manager) Babbage Geotechnical Laboratory
All tests reported herein have been performed in accordance with the laboratory’s scope of accreditation. This report may not be reproduced except in full & with written approval from BGL.

Job No: Reg. No:
61256#L 2520
Undrained Shear Strength in Triaxial Compression Tested By: JF 23/02/2018
Without Porewater Pressure Measurement Compiled By: JF 26/02/2018
Test Method: BS1377: 1990: Part 7: Section 8 / NZS4402:1986: Test 2.1 Checked By: WEC 26/02/2018
Bore Number: BH27 Sample Number: CORE Depth: 8.40 - 8.67m
Strain
0.00 4.656 0.000 0.000 7.847 0.0 2916.7 0
0.58 4.920 0.264 0.002 7.865 92.5 2922.9 31
1.17 5.198 0.542 0.004 7.878 155.3 2929.4 52
1.75 5.480 0.824 0.007 7.888 208.0 2936.0 70
2.33 5.756 1.100 0.009 7.897 255.0 2942.5 86
2.90 6.042 1.386 0.011 7.906 301.5 2949.2 102
3.48 6.327 1.671 0.013 7.914 341.6 2956.0 115
4.07 6.609 1.953 0.016 7.923 384.6 2962.7 129
4.65 6.891 2.235 0.018 7.931 425.4 2969.5 143
5.23 7.168 2.512 0.020 7.939 469.9 2976.2 157
5.82 7.441 2.785 0.022 7.948 514.8 2982.8 172
6.40 7.706 3.049 0.024 7.958 562.4 2989.2 188
6.98 7.974 3.318 0.026 7.967 612.8 2995.8 204
7.57 8.248 3.592 0.029 7.978 665.0 3002.5 221
8.13 8.520 3.864 0.031 7.988 716.4 3009.2 237
8.72 8.794 4.138 0.033 7.998 768.5 3015.9 254
9.33 9.084 4.428 0.035 8.008 821.7 3023.2 271
9.92 9.355 4.699 0.037 8.018 872.9 3029.9 287
10.48 9.620 4.964 0.039 8.028 923.4 3036.6 303
11.07 9.884 5.228 0.042 8.038 973.8 3043.2 319
11.65 10.149 5.493 0.044 8.047 1020.6 3049.9 334
12.23 10.424 5.768 0.046 8.056 1065.5 3056.9 348
12.82 10.710 6.053 0.048 8.064 1106.3 3064.2 360
13.40 10.995 6.339 0.050 8.072 1143.5 3071.5 372
13.98 11.284 6.628 0.053 8.078 1175.5 3079.0 381
14.57 11.574 6.917 0.055 8.084 1205.8 3086.5 390
15.13 11.863 7.207 0.057 8.089 1234.1 3094.0 398
15.72 12.136 7.480 0.059 8.095 1261.0 3101.2 406
16.30 12.408 7.752 0.062 8.099 1284.2 3108.3 413
16.88 12.683 8.027 0.064 8.103 1305.5 3115.6 418
17.47 12.960 8.304 0.066 8.107 1323.2 3122.9 423
18.05 13.241 8.585 0.068 8.110 1340.0 3130.4 427
18.63 13.529 8.872 0.071 8.112 1351.1 3138.1 430
19.22 13.828 9.172 0.073 8.114 1360.9 3146.2 432
19.78 14.109 9.453 0.075 8.116 1368.7 3153.8 433
20.37 14.387 9.731 0.077 8.117 1374.3 3161.3 434
20.95 14.666 10.010 0.080 8.118 1378.0 3168.9 43421.53 14.945 10.288 0.082 8.118 1378.6 3176.6 433
22.12 15.239 10.583 0.084 8.114 1360.8 3184.7 427
22.70 15.548 10.892 0.087 8.105 1315.7 3193.3 411
23.28 15.859 11.203 0.089 8.099 1280.8 3202.0 399
Report No: Page 3 of 5
Version 5, August 2017
kPa
61256#L/UU Triaxial
ST MARYS BAY
Axial Force
(N)
Corrected
Area
(mm2)
Measured
Deviator
Stress (kPa)
PROJECT:
Time
(minutes)
Compression
Gauge
(mm)
Specimen
Compression
(mm)
Load Gauge
(mm)
Maximum Deviator
Stress: 434 kPa Shear Strength (Cu): 217
26/02/2018 St Marys Bay UU Triaxial BH27 8.40 - 8.67m.xlsx

Reg. No:
2520
Undrained Shear Strength in Triaxial Compression Tested By: JF 23/02/2018
Without Porewater Pressure Measurement Compiled By: JF 26/02/2018
Test Method: BS1377: 1990: Part 7: Section 8 / NZS4402: 1986: Test 2.1 Checked By: WEC 26/02/2018
Bore Number: BH27 Sample Number: CORE Depth: 8.40 - 8.67m
Test Performed on: Whole soil / Fraction passing 19mm test sieve
Sample History: Undisturbed / remoulded / recompacted / unknown
Sample Method & Type: from core sample / from tube sample / larger tube / block sample / pressed into tube
compacted with standard/heavy compactive effort
180 kPa Membrane Thickness (mm) 0.2
Membrane Correction (kPa) 0.6
Initial Diameter: 60.94 mm Failure Conditions:Initial Length: 125.77 mm
Initial Mass: 732.39 g Strain at failure: 8.0 %
Initial Bulk Density: 2.00 t/m3 Rate of Strain: 0.38 % / minute
Initial Dry Density: 1.61 t/m3 Compression at failure: 10.0 mm
Water Content Before Test: 24.3 % Rate of Compression: 0.48 mm / minute
Water Content After Test: 24.1 %
Mode of Failure: plastic
Page 4 of 5 Report No:
Version 5, August 2017
ST MARYS BAY
Job No:
61256#L
PROJECT:
61256#L/UU Triaxial
Cell Confining Pressure Set at:
0
100
200
300
400
500
0.0 1.0 2.0 3.0 4.0 5.0 6.0 7.0 8.0 9.0 10.0
Devia
tor
Str
ess
(kP
a)
Axial Strain (%)
Stress - Strain Curve
26/02/2018 St Marys Bay UU Triaxial BH27 8.40 - 8.67m.xlsx

Reg. No:
2520
Undrained Shear Strength in Triaxial Compression Tested By: JF 23/02/2018
Without Porewater Pressure Measurement Compiled By: JF 26/02/2018
Test Method: BS1377: 1990: Part 7: Section 8 / NZS4402: 1986: Test 2.1 Checked By: WEC 26/02/2018
Bore Number: BH27 Sample Number: CORE Depth: 8.40 - 8.67m
Sample Description (not part of BGL IANZ Accreditation ):
SAMPLE BEFORE TEST
SAMPLE AFTER TEST
SANDSTONE, fine to medium, occasional coarse grains, extremely weak,
slightly to moderately weathered, grey with trace white speckles, very weakly
cemented.
PROJECT: ST MARYS BAY
Job No: Report No: Page 5 of 5
61256#L 61256#L/UU Triaxial Version 5, August 2017
26/02/2018 St Marys Bay UU Triaxial BH27 8.40 - 8.67m.xlsx