P53-Dependent Subcellular Proteome Localization Following ... PDFs for webpage/2010_… ·...
25
1 P53-Dependent Subcellular Proteome Localization Following DNA Damage François-Michel Boisvert 1 and Angus I. Lamond 1 * 1. Wellcome Trust Centre for Gene Regulation & Expression, College of Life Sciences, University of Dundee, MSI/WTB/JBC Complex, Dow Street, Dundee DD1 5EH United Kingdom * Corresponding author: Angus I. Lamond Wellcome Trust Centre for Gene Regulation & Expression Phone: +44 (0)1382 385473 Fax: +44 (0)1382 385695 email: [email protected] Running title: Spatial Proteomics and p53 Keywords: Mass Spectrometry, SILAC, Proteomics, Protein Localization, DNA Damage, p53 © 2010 WILEY-VCH Verlag GmbH & Co. KGaA, Weinheim Received: April 01, 2010 / Revised: June 02, 2010 / Accepted: June 29, 2010 DOI: 10.1002/pmic.201000213
Transcript of P53-Dependent Subcellular Proteome Localization Following ... PDFs for webpage/2010_… ·...
1
P53-Dependent Subcellular Proteome Localization Following DNA Damage
François-Michel Boisvert1 and Angus I. Lamond1*
1. Wellcome Trust Centre for Gene Regulation & Expression, College of Life Sciences, University of Dundee, MSI/WTB/JBC Complex, Dow Street, Dundee DD1 5EH United Kingdom
* Corresponding author: Angus I. Lamond
Wellcome Trust Centre for Gene Regulation & Expression
Phone: +44 (0)1382 385473
Fax: +44 (0)1382 385695
email: [email protected]
Running title: Spatial Proteomics and p53
Keywords: Mass Spectrometry, SILAC, Proteomics, Protein Localization, DNA Damage, p53
© 2010 WILEY-VCH Verlag GmbH & Co. KGaA, Weinheim
Received: April 01, 2010 / Revised: June 02, 2010 / Accepted: June 29, 2010
DOI: 10.1002/pmic.201000213
2
SUMMARY
The nucleolus is involved in regulating several aspects of stress responses and
cell cycle arrest through the tumor suppressor p53. Under normal conditions, p53 is a
short-lived protein that is present in cells at a barely detectable level. Upon exposure of
cells to various form of exogenous stress, such as DNA damage, there is a stabilization of
p53 which is then responsible for an ensuing cascade of events. To further investigate
the effect of p53 activation, we used a mass spectrometry based proteomics method to
provide an unbiased, quantitative and high throughput approach for measuring the
subcellular distribution of the proteome that is dependent on p53. The spatial
proteomics method analyses a whole cell extract created by recombining differentially
labelled subcellular fractions derived from cells in which proteins have been mass
labelled with heavy isotopes [1]. This was used here to measure the relative distribution
between cytoplasm, nucleus and nucleolus of around 2,000 proteins in HCT116 cells
that are either expressing wild-type p53, or null for p53. Spatial proteomics also
facilitates a proteome-wide comparison of changes in protein localization in response to
a wide range of physiological and experimental perturbations. We used this method to
study differences in protein localization in HCT116 cells either with or without p53, and
studied the differences in cellular response to DNA damage following treatment of
HCT116 cells with etoposide in both p53 wild-type and null genetic backgrounds.
INTRODUCTION
The nucleolus is involved in regulating several aspects of stress responses and cell cycle
arrest through the tumor suppressor p53. The p53 tumor suppressor gene is mutated in
approximately 50% of human tumors and plays an important role in the response to genotoxic
stress and hypoxia [2]. Under normal conditions, p53 is a short-lived protein that is present in
cells at a barely detectable level. Upon exposure of cells to various form of exogenous stress,
such as DNA damage, heat shock, hypoxia, etc., there is a stabilization of p53 which is then
responsible for an ensuing cascade of events, resulting in either cell cycle arrest, or in
apoptosis. Accumulation of p53 in the cell induces the p21-mediated inhibition of cyclin
D/cdk4 and cyclinE/cdk2, resulting in cell cycle arrest in G1. The stability of the p53 protein
in mammals is primarily regulated in non-transformed cells by the interplay of two proteins,
3
hdm2 and p14Arf in humans (the equivalent mouse proteins are mdm2 and p19Arf) [3].
Hdm2 functions as a specific E3 ubiquitin ligase for p53, resulting in a low level of p53 under
normal growth conditions due to proteasome-mediated degradation of ubiquitin-conjugated
p53. A variety of stimuli, including stress pathways and oncogenic signals, increase
expression of Arf, which then associates with hdm2 to inhibit the ubiquitination, nuclear
export and subsequent degradation of p53. It has been proposed that Arf physically sequesters
hdm2 in nucleoli, thereby relieving nucleoplasmic p53 from hdm2-mediated degradation[4].
Arf is predominantly a nucleolar protein and might also regulate ribosome biogenesis by
retarding the processing of early 47S/45S and 32S rRNA precursors, perhaps through
interaction with B23 [5]. Exposure of cells to various forms of stress such as DNA damage,
heat shock and aberrant ribosome biogenesis results in an increase in p53 and cell cycle
arrest. Thus, the nucleolus acts as a sensor for cellular stress signals through p53 stabilization
[6].
SILAC, or stable isotope labeling with amino acids in cell culture, is the use of stable isotopic
atoms along with mass spectrometry for quantitative mass spectrometry analysis [7-8]. This
method allows quantitative analyses of proteins by comparison of the mass of light and
heavier forms of the same peptide from a given protein, arising from the presence of heavier,
stable isotopes such as 13C, 2H and 15N. These stable isotopes are incorporated in proteins by
in vivo labeling, i.e., growing the cells in specialized media where specific amino acids,
typically arginine and lysine, are replaced with corresponding heavy isotope-substituted
forms in which either all carbons, or combinations of carbons, hydrogens or nitrogens are
isotope-labeled[9]. Cleavage at the substituted arginine or lysine by trypsin generates a
peptide with a shift in mass relative to the control (i.e. unsubstituted) peptide and this can
easily be resolved by mass spectrometry. The ratio of intensities of the “light” and “heavy”
peptide signals identified by mass spectrometry directly correlates with the relative amount of
the cognate protein from each sample. This method has been widely used for both relative
quantification of protein levels after exposure of cells to drugs and inhibitors and for the
identification of specific protein interaction partners [10-13].
Using a quantitative proteomic approach to measure the protein content in different cellular
fractions, we utilized a technique called spatial proteomics that measures the cellular
distribution of thousands of proteins using a combination of cellular fractionation and mass
spectrometry [1]. This method involves first culturing cells with SILAC medium to ensure
4
proteins are fully labelled [9]. The SILAC incorporated cells are then separated into fractions,
e.g. the cytoplasm, nucleus and nucleolus which are recombined such that each fraction has a
distinct isotope signature. The labeling thus allows quantification of the relative abundance of
peptides originating from subcellular fraction and was used to study the relative distribution
of the proteome between the cytoplasm, nucleus and nucleolus [1]. We hypothesized that we
could use this technique also to determine the difference in protein localization caused by
specific gene knockouts, such as here between wild-type and p53 null cells. We then
identified and quantified the change in proteome localization induced by activation of the
DNA damage response in either the presence, or absence, of p53.
Materials and Methods
Cell culture
The human colon carcinoma cell line HCT116 that are either wild-type (p53 +/+) or p53 null
(p53 -/-) were cultured as adherent cells in DMEM (Dulbeccos’s modified eagle medium,
Invitrogen, custom order) depleted of arginine and lysine. The DMEM was supplemented
with 10% fetal bovine serum dialyzed with a cut-off of 10 kDa (Invitrogen, 26400-044), 100
U/ml penicillin/streptomycin, 2 mM L-Glutamine. Arginine and lysine was added in either
light (Arg0, Sigma, A5006; Lys0, Sigma, L5501), medium (Arg6, Cambridge Isotope Lab
(CIL), CNM-2265; Lys4, CIL, DLM-2640), or heavy (Arg10, CIL, CNLM-539; Lys8, CIL,
CNLM-291) form to a final concentration of 28 μg/ml for arginine and 49 μg/ml for lysine.
Cells were tested for full incorporation of the label after six passages.
Cell Fractionation
Cytoplasm, nuclei and nucleoli were prepared from HCT116 cells using a method originally
described in [14]. Briefly, cells were washed three times with PBS, resuspended in 5 ml
buffer A (10 mM HEPES-KOH [pH 7.9], 1.5 mM MgCl2, 10 mM KCl, 0.5 mM DTT), and
dounce homogenized ten times using a tight pestle. Dounced nuclei were centrifuged at 228 ×
g for 5 min at 4°C. The supernatant represents the cytoplasmic fraction. The nuclear pellet
was resuspended in 3 ml 0.25 M sucrose, 10 mM MgCl2, and layered over 3 ml 0.35 M
5
sucrose, 0.5 mM MgCl2, and centrifuged at 1430 × g for 5 min at 4°C. The clean, pelleted
nuclei were resuspended in 3 ml 0.35 M sucrose, 0.5 mM MgCl2, and sonicated for 6 × 10 s
using a microtip probe and a Misonix XL 2020 sonicator at power setting 5. The sonication
was checked using phase contrast microscopy, ensuring that there were no intact cells and
that the nucleoli were readily observed as dense, refractile bodies. The sonicated sample was
then layered over 3 ml 0.88 M sucrose, 0.5 mM MgCl2 and centrifuged at 2800 × g for 10
min at 4°C. The pellet contained the nucleoli, while the supernatant consisted of the
nucleoplasmic fraction. The nucleoli were then washed by resuspension in 500 μl of 0.35 M
sucrose, 0.5 mM MgCl2, followed by centrifugation at 2000 × g for 2 min at 4°C. Proteins
were quantified using the Quant-IT protein assay (Invitrogen) and measured using a Qubit
(Invitrogen). Equal amounts of total protein from each fraction were then recombined to
recreate a whole cell extract, but with cytoplasm (Cyto), nuclei (Nuc) and nucleoli (No)
arising from cells with different isotopic labels.
Western blotting and Coomassie staining.
Equal amounts (10 μg) of proteins from each fraction were boiled in loading buffer, and then
separated by one-dimensional SDS–PAGE (4–12% Bis-Tris Novex mini-gel, Invitrogen) and
either visualized by Coomassie staining (SimplyBlue SafeStain, Invitrogen) or transferred to
nitrocellulose prior to western blotting with a rabbit polyclonal RPL11 antibody (abcam) or a
mouse monoclonal B23-nucleophosmin antibody (Sigma).
Immunofluorescence
Cells were grown on glass coverslips and fixed with 3.7% paraformaldehyde in cytoskeleton
(CSK, 10 mM PIPES pH 6.8, 10 mM NaCl, 300 mM sucrose, 3 mM MgCl2 and 2 mM
EDTA) buffer for 10 minutes. Cells were then permeabilized in PBS containing 0.5% Triton
X-100 for 10 minutes, and then labelled with antibodies recognizing RPL11 (Abcam). After
washing with PBS containing 0.1% Triton X-100 and PBS, cells were then labelled with a
secondary antibody coupled to Alexa 594 (Molecular Probes) and mounted on slides with
Vectashield (Vector Laboratories Inc) containing DAPI. Fluorescence imaging was
performed on a DeltaVision Spectris widefield deconvolution microscope (Applied
Precision), using a CoolMax charge-coupled device camera (Roper Scientific). Cells were
imaged using a 60x NA 1.4 Plan-Apochromat objective (Olympus) and the appropriate filter
sets (Chroma Technology Corp.), with 20 optical sections of 0.5 μM each acquired.
SoftWorX software (Applied Precision) was used for both acquisition and deconvolution.
6
Gel electrophoresis and in-gel digestion
The reconstituted cell fractions were reduced in 10 mM DTT and alkylated in 50 mM
iodoacetamide prior to boiling in loading buffer, and then separated by one-dimensional
SDS–PAGE (4–12% Bis-Tris Novex mini-gel, Invitrogen) and visualized by colloidal
Coomassie staining (Novex, Invitrogen). The entire protein gel lanes were excised and cut
into 8 slices each. Every gel slice was subjected to in-gel digestion with trypsin[15]. The
resulting tryptic peptides were extracted by 1% formic acid, then 100% acetonitrile,
lyophilized in a speedvac, and resuspended in 1% formic acid.
LC-MS/MS
Trypsin digested peptides were separated using an Ultimate U3000 (Dionex Corporation)
nanoflow LC-system consisting of a solvent degasser, micro and nanoflow pumps, flow
control module, UV detector and a thermostated autosampler. 10 μl of sample (a total of 2
μg) was loaded with a constant flow of 20μl/min onto a PepMap C18 trap column (0.3 mm id
x 5 mm, Dionex Corporation). After trap enrichment peptides were eluted onto a PepMap
C18 nano column (75 μm x 15 cm, Dionex Corporation) with a linear gradient of 5-35%
solvent B (90% acetonitrile with 0.1% formic acid) over 65 minutes with a constant flow of
300 nl/min. The HPLC system was coupled to a LTQ Orbitrap XL (Thermo Fisher Scientific
Inc) via a nano ES ion source (Proxeon Biosystems). The spray voltage was set to 1.2 kV and
the temperature of the heated capillary was set to 200 oC. Full scan MS survey spectra (m/z
335-1800) in profile mode were acquired in the Orbitrap with a resolution of 60,000 after
accumulation of 500,000 ions. The five most intense peptide ions from the preview scan in
the Orbitrap were fragmented by collision induced dissociation (normalised collision energy
35%, activation Q 0.250 and activation time 30 ms) in the LTQ after the accumulation of
10,000 ions. Maximal filling times were 1,000 ms for the full scans and 150 ms for the
MS/MS scans. Precursor ion charge state screening was enabled and all unassigned charge
states as well as singly charged species were rejected. The dynamic exclusion list was
restricted to a maximum of 500 entries with a maximum retention period of 90 seconds and a
relative mass window of 10 ppm. The lock mass option was enabled for survey scans to
improve mass accuracy [16]. Data were acquired using the Xcalibur software.
Quantification and Bioinformatic Analysis
7
Quantitation was performed using the program MaxQuant version 1.0.13.13 [17-18]. The
derived peak list generated by Quant.exe (the first part of MaxQuant) was searched using
Mascot (Matrix Sciences, London, UK) as the database search engine for peptide
identifications against the International Protein Index (IPI) human protein database version
3.37 containing 69,290 proteins, to which 175 commonly observed contaminants and all the
reversed sequences had been added. The initial mass tolerance was set to 7 p.p.m. and
MS/MS mass tolerance was 0.5 Da. Enzyme was set to trypsin/p with 2 missed cleavages.
Carbamidomethylation of cysteine was searched as a fixed modification, whereas N-acetyl
protein and oxidation of methionine were searched as variable modifications. Identification
was set to a false discovery rate of 1%. To achieve reliable identifications, all proteins were
accepted based on the criteria that the number of forward hits in the database was at least
100-fold higher than the number of reverse database hits, thus resulting in a false discovery
rate (FDR) of less than 1%. A minimum of 2 peptides were quantified for each protein.
Protein isoforms and proteins that cannot be distinguished based on the peptides identified
are grouped and displayed on a single line with multiple IPI numbers (see supplementary
tables).
8
Results
HCT116 p53+/+ is a human colon carcinoma cell line, which contains a wild-type p53 gene, whereas
the HCT116 p53-/- is a p53 knockout cell line derived from HCT116 p53+/+ by homologous
recombination [19]. Cells were grown in three different media for SILAC labelling, containing
arginine and lysine, either with the normal ‘light’ isotopes of carbon and nitrogen (i.e. 12C14N) (light),
or L-arginine-13C614N4 and L-lysine-2H4 (medium) or L-arginine- 13C6-15N4 and L-lysine-13C6-15N2
(heavy). Separate cytoplasmic, nuclear and nucleolar fractions were isolated from each labelled cell
population as previously described[14]. Equal amounts of total protein from each fraction were then
recombined to recreate a whole cell extract, but with cytoplasm (Cyto), nuclei (Nuc) and nucleoli
(No) arising from cells with different isotope labels (Figure 1A). The recombined whole cell extract
mixture was solubilised with loading buffer, proteins separated using SDS-PAGE and the resulting
gel cut into 8 equal pieces, trypsin digested and analyzed by LC-MS/MS using an LTQ Orbitrap[20].
The resulting ratios between light, medium and heavy isotopic forms for each peptide identified were
quantified using MaxQuant[17]. The separate ratio values for each peptide in a given protein were
averaged to provide a measure of the relative distribution for the protein between the respective
cytoplasmic, nuclear and nucleolar compartments (Figure 1A). Two independent experiments were
performed of the whole spatial proteomics procedure using separate preparations of isotope-labelled
HCT116 cells (Figure 1B and C). We named each repeat WTa and WTb for the wild-type cells, and
p53a and p53b for the p53 knock-out cells. A total of 20,500 peptides were quantified, corresponding
to 1,958 proteins (i.e. protein isoform groups, see materials and methods) using a minimum of two
peptides identified and a false discovery rate of 1%. The distribution ratio between the three cellular
compartments derived for each protein was calculated as a median of the values for all peptides
identified for each protein (Supplementary Table 1).
To check whether any differences observed in proteome localization dependent upon p53 arose
because of biologically relevant changes and not simply due to experimental variation (e.g. in
reproducibility of either mass spectrometry or fractionation procedures), statistical evaluation of the
repeat data sets was carried out. The data show a Pearson correlation of 0.92 and 0.93 for the
nucleoplasmic/cytoplasmic and the nucleolar/cytoplasmic ratios respectively between repeats of the
wild-type cells (i.e. WTa versus WTb). A similar reproducibility was observed for the p53 knock-out
cells, with Pearson correlations of 0.93 and 0.98 for the nucleoplasmic/cytoplasmic and the
nucleolar/cytoplasmic ratios, respectively, between repeats using the p53 knock-out cells.
Interestingly, there is little variation between the wild-type and the p53 knock-out cells in terms of
overall proteome localization within the cell. The Pearson correlation between the p53 +/+ and -/-
cells is 0.91 and 0.94 for the nucleoplasmic/cytoplasmic and the nucleolar/cytoplasmic ratios,
9
respectively, indicating there are little or no p53-dependent differences in subcellular protein
localization. This is illustrated in the respective plots showing comparison of the subcellular protein
distribution of WT cells according to their nucleoplasmic/cytoplasmic ratio (Figure 2A) and
nucleolar/cytoplasmic ratio (Figure 2B) and of the p53 knock-out cells according to their
nucleoplasmic/cytoplasmic ratio (Figure 2C) and nucleolar/cytoplasmic ratio (Figure 2D). The
proteins were sorted according to their log base two WT ratios from highest to lowest, and the
proteins are displayed in the same order in the p53 knock-out cells to underline the differences.
Although there are minor variations between the two cell lines with regards to proteome localization,
only 40 proteins had a ratio difference greater than two (Supplementary Table 2). Interestingly, 18 of
those 40 proteins are involved directly in pre-mRNA splicing, which could suggest it reflects a
genuine difference between the two cell genotypes. This difference in proteins involved in mRNA
processing has also been observed previously in a p53 dependent protein expression profiling study of
the HCT116 cells [21]. We conclude that variations from the fractionation and mass spectrometry
procedure have at most a small effect on the values measured and we conclude further that there are
only minor differences in subcellular protein localization resulting directly from p53 genotype.
Next, we used spatial proteomics to compare the cellular localization of the proteome in HCT116
cells following exposure to the topoisomerase II inhibitor etoposide, which induces DNA damage and
double strand breaks. We checked whether we could observe any differences in subcellular
localization following DNA damage that would be dependent on p53. The data show a moderate
effect on protein localization in wild-type cells with Pearson correlations of 0.88 and 0.85 for the
nucleoplasmic/cytoplasmic and the nucleolar/cytoplasmic ratios respectively, between samples when
wild-type cells were treated with Etoposide. This is illustrated in the respective scatter plots showing
the localization of proteins of Wild-Type cells (Figure 3A, blue) and showing the effect of Etoposide
on protein localization (Figure 3B, red). For the p53 knock-out cells (Figure 3C, blue), we found a
similar effect of Etoposide treatment, with a Pearson correlation of 0.89 for the
nucleoplasmic/cytoplasmic ratio (Figure 3D, red). However, the effect on the nucleolar localization
was much closer to the differences between repeats of the experiment with a Pearson correlation of
0.93 for the nucleolar/cytoplasmic ratios between samples when cells were treated with Etoposide.
This suggests that Etoposide induces a significant change in the protein content of the nucleolus, and
that this change is at least in part dependent on the presence of wild-type p53. This increased
segregation of nucleolar proteins within the nucleolus following stress is consistent with previous
observations[6].
These spatial proteomics data provide new evidence showing that p53 is involved in the response to
DNA damage in the nucleolus. We analysed further which proteins specifically showed a difference
in localization in p53 null cells. We found 123 proteins that after DNA damage had more than a two-
fold difference between the wild-type and the p53 knock-out cells (Supplementary Table 3, page 1).
10
The most striking group of proteins identified were the ribosomal proteins, which show a clear change
in cellular localization following DNA damage in wild-type cells (Figure 4A and Supplementary
Table 3, page 2). These data are consistent with an inhibition of the nucleolar import of ribosomal
proteins. Interestingly, this effect is not observed in the absence of p53 (Figure 4C), indicating that
p53 is directly or indirectly involved in the inhibition of ribosomal protein import following cellular
stress (Figure 4D). There was no difference between the p53 wild-type and null cells in the
localization of ribosomal proteins in the absence of DNA damage (Figure 4B). We also observed a
difference between the nucleoplasm and the nucleolus. If simultaneously there is an equivalent change
in cytoplasmic and nucleoplasmic content from the nucleolus, it is not possible to visualize this
change by plotting the nucleoplasmic/cytoplasmic versus the nucleolar/cytoplasmic ratios. Thus, we
plotted the nucleolar/nucleoplasmic ratios before and after DNA damage (Figure 4 E and F). We
observed a redistribution of the ribosomal proteins following DNA damage in the wild-type cells from
the nucleolus to the nucleoplasm (Figure 4E). In this case, most proteins appears below the line below
the line through the origin on the scatter plot. However, this relocalization did not occur in the
absence of p53 (Figure 4F) where most proteins cluster near the line through the origin.
To confirm the change in localization of ribosomal proteins after DNA damage, we performed both
western blots on cellular fractions and immunofluorescence. Equal amounts of either total cell
lysates (Figure 5A, lanes 1 and 5) or of extracts from the cytoplasmic (Figure 5A, Cyto, lanes
2 and 6), nuclear (Figure 5A, Nuc, lanes 3 and 7) or nucleolar (Figure 5A, No, lanes 4 and 8)
fractions of either HCT116 wild-type cells (top) or p53 knock-out (bottom) that were either
mock-treated (lanes 1-4) or treated with 50 μM etoposide (lanes 5-8) for 1 hour were
separated by SDS-PAGE and stained with Coomassie Blue to make sure of equivalent
loading of proteins from each fraction. The same fractions were again separated by SDS-
PAGE, but this time transferred to nitrocellulose prior to western blotting with either a
RPL11 antibody or a B23-nucleophosmin antibody. RPL11 is observed in both the cytoplasm
and nucleolus in the absence of DNA damage (Figure 5B, mock). However, there is a
reduction in the amount of RPL11 located in the nucleolus following treatment with
Etoposide (Figure 5B, lanes 4). This appears to coincide with an increase in RPL11 in both
the cytoplasm and the nucleoplasm, and this increase is not observed in p53 knock-out cells
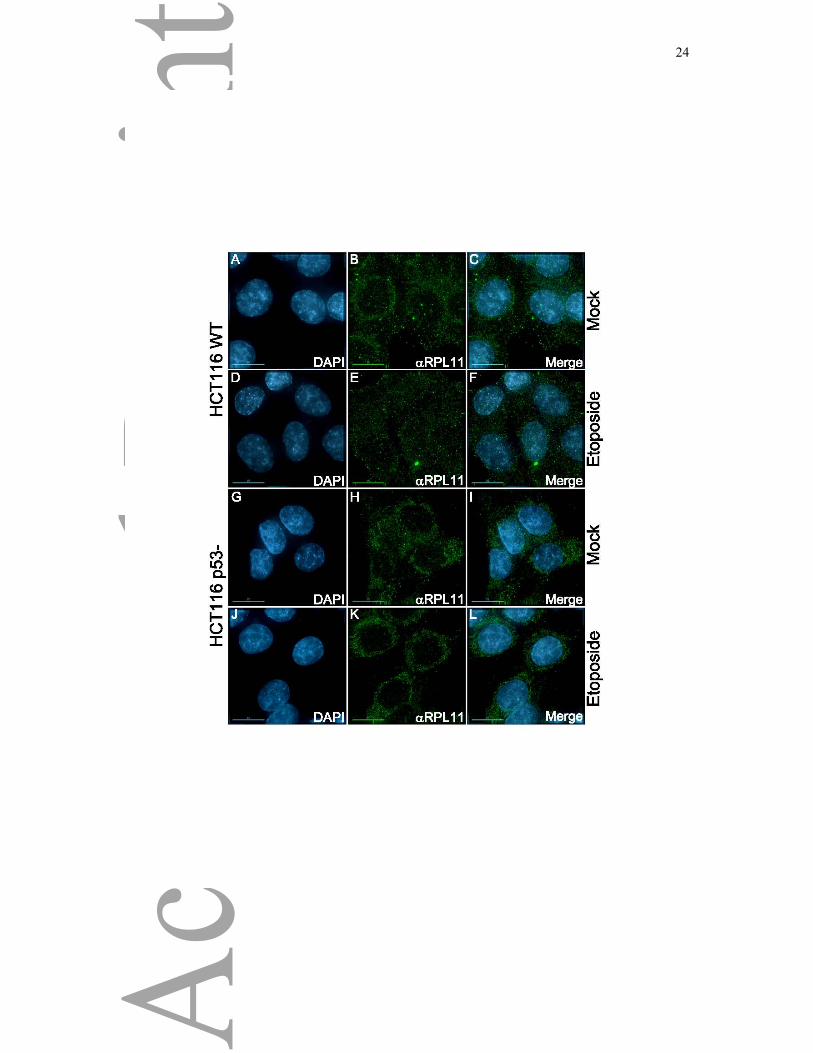
(Figure 5B, Eto, lanes 3 and 4). To further demonstrate this relocalization, HCT116 wild-type
(Figure 6A-F) and p53 knock-out (Figure 6G-L) cells were cultured on coverslips and either
mock-treated (Figure 6A-C and Figure 6G-I) or treated with 50 μM etoposide (Figure 6D-F
and Figure 6J-L) for 1 hour. Cells were then fixed, permeabilized and labelled for
immunofluorescence using an antibody recognizing RPL11 (Figure 6B-E-H-K). We did not
11
detect endogenous RPL11 in the nucleolus in these experiments despite trying different
fixation procedures, although we did detect a GFP-tagged ribosomal protein in both the
cytoplasm and the nucleolus ([22]. This is likely due to failure of the antibody to penetrate
and reach its epitope in the nucleolus of fixed cells. However, we detected a strong
cytoplasmic signal by immunofluorescence with the RPL11 antibody. There was a difference
in the localization of RPL11 following treatment of HCT116 cells with Etoposide (compare
Figure 6B and Figure 6E), with an increase in labelling in the nucleus evident after DNA
damage. Again, this relocalization of RPL11 was not observed in HCT116 cells lacking p53
(compare Figure 6H and K). This demonstrates how spatial proteomics can be used to not only look
at individual protein responses under different conditions, but also how different groups of proteins
can be analyzed provide an unbiaised understanding of underlying functional interactions at a system-
wide level.
The proteomic experiments not only provide data showing the relative enrichment of proteins in
different subcellular compartments, they also make it possible to analyze the ion intensity of proteins
in the cell as a measurement of total protein abundance. Although less reliable than the SILAC ratios,
it still provides an interesting measure of changes in protein level. We thus analyzed the intensity
values to address whether we could identify candidate proteins induced following treatment with
Etoposide, and which of these changes in protein level are dependent on p53. Approximately 5%
(103) of proteins identified showed a >3-fold increase in protein level following treatment with
Etoposide (Supplementary table 4, page 1). Of those 103 proteins, we found a specific GO enrichment
in proteins involved in mRNA splicing (12), amino acid metabolic process (10), intracellular transport
(10) and response to oxidative stress (6). Interestingly, only 6 of these proteins were not increased
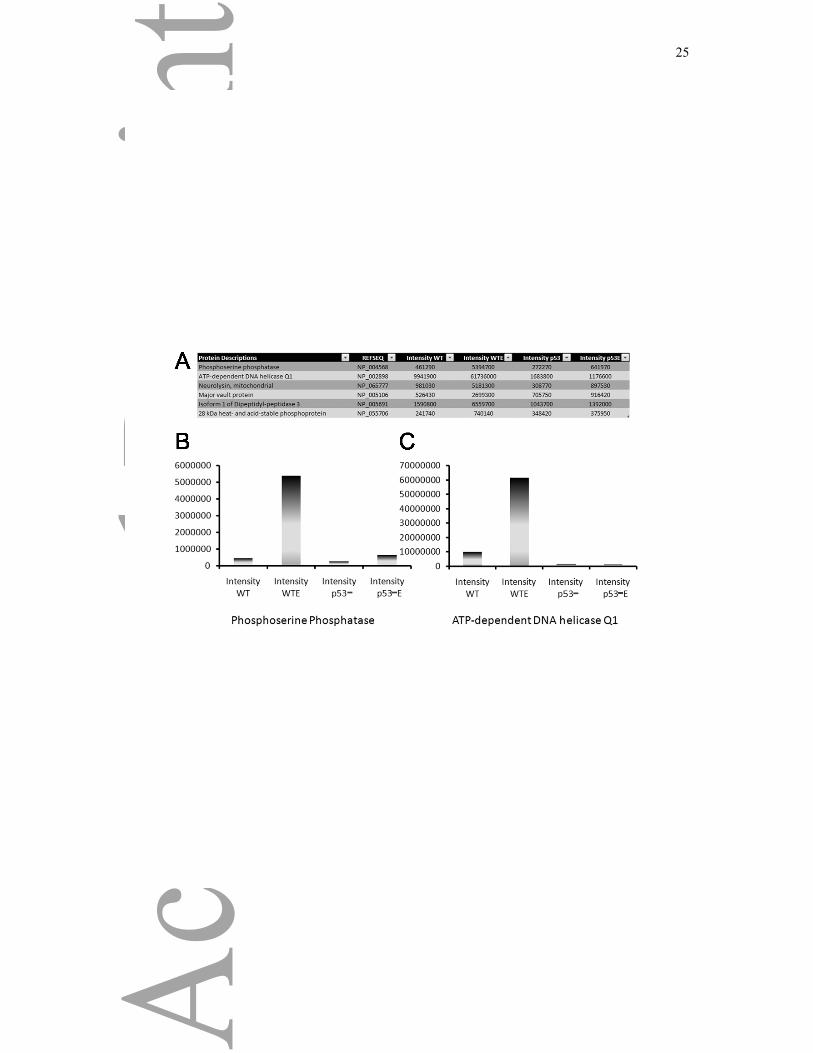
also in the p53 knock-out cells (Figure 7A and Supplementary Table 4, page 2). The increase of
intensity of Phosphoserine phosphatase and the ATP-dependent DNA helicase Q1 (RecQ1) are
shown in Figure 7B and 7C, where the induction of protein after DNA damage is seen only in wild-
type cells. None of those six proteins have been previously characterized as being p53-regulated
transcriptional targets, although a disctinct role for RECQ1 has been described in the maintenance of
the genomic stability. RECQ1 catalyzes DNA unwinding and strand annealing, and these activities are
likely to be important for its role in DNA repair [23].
Discussion
In this study we used spatial proteomics as an unbiased and quantitative mass spectrometry based
approach to study not only the difference in localization between cells that differ only at one gene
locus, p53, but also to see the difference in how the cells respond to DNA damage, a response in
12
which p53 is involved. We show that there are very few differences in the overall subcellular
localization of proteins that depends on the p53 gene. This confirms the specificity of the response
and is consistent with the fact that under normal conditions, p53 is a short-lived protein that is present
in cells at a barely detectable level. Thus, p53 makes little difference to the subcellular proteome
localization under normal growth conditions. Interestingly, the forty proteins that showed a
localization difference in the absence of p53 (but without DNA damage) were mostly proteins
involved in splicing, including most of the members of the core spliceosome (Sm A, B, D1, D3 and
E), as well as several other splicing factors (SF3A, B, hnRNPs) This may reflect a true difference
between those two cell lines in p53-dependent gene expression and merit further investigation in
future. However, we cannot rule out that the difference in expression was acquired through secondary
mutations as a result of culturing the two cell lines in parallel for several years [2].
Upon exposure of cells to various forms of exogenous stress, such as DNA damage, there is a
stabilization of p53, which is then responsible for an ensuing cascade of events, resulting in either cell
cycle arrest, or in apoptosis. We observed a general effect of etoposide on the
nucleoplasmic/cytoplasmic protein ratios, which shows that the response in both cell lines is generally
quite similar for the proteins shuttling between the cytoplasm and the nucleus. We found a notable
difference in the nucleolar/cytoplasmic ratios following DNA damage, whether p53 is present or not.
In wild-type cells, p53 appears to cause a shut-down of nucleolar activity, which results in a specific
segregation of nucleolar proteins within the nucleolus. However, this seems to be dependent on p53,
as the effect is observed to a much lesser extent in p53 knock-out cells. One such consequence is that
the ribosomal proteins are no longer accumulating in the nucleolus following DNA damage. This
suggest a possible early role for p53 in shutting down the rDNA transcription machinery, as well as
either stopping the nucleolar recruitment, or retention of ribosomal proteins in the nucleolus,
indicating that cells undergo a rapid stop in ribosome subunit production following DNA damage.
Several recent reports showed that p53 becomes activated after silencing of ribosomal proteins such
as RPL23 [24], RPL11 [25], RPS6 [26] and TIF1A [27]. Other evidence emerging from a number of
mouse models support the existence of this ribosomal dependent p53 checkpoint in vivo [28]. During
normal cellular growth, ribosomal proteins are assembled into ribosomal subunits, but several
ribosomal proteins (RPL11, RPL5, RPL23, RPS7 and RPS9) have now been shown to be released
from the nucleolus following stress and to bind HDM2, resulting in stabilization of p53 [28-31]. Our
data suggest that p53 is actually necessary for the initial release of ribosomal proteins from the
nucleolus following stress, and that this release probably results in an amplification of the p53
response through stabilization by preventing HDM2-mediated degradation of p53.
Cell growth is essential for cell-cycle progression and the attainment of a particular cell mass is a
prerequisite for cell division. As ribosome levels reflect the capacity of the cell to grow and achieve
this cell mass, it is possible that ribosome subunit production in the nucleolus plays an important role
13
in controlling cell-cycle progression. Another important link between the fate of the cell and the level
of ribosome subunit biogenesis has been demonstrated from the observation that events that perturb
the structure or function of the nucleolus, the centre of rDNA transcription and ribosome subunit
production, can cause p53 accumulation[6, 32], which can lead to cell-cycle arrest or apoptosis [2].
Because such events produce a negative effect on rRNA transcription, it is possible that the levels of
rRNA are directly influenced by p53 accumulation and the decision to trigger cell-cycle arrest, or
even apoptosis[33]. In addition, the repetitive nature of the rRNA genes, in combination with the
dense loading of the RNA polymerase I complexes on the active templates, provides a potential
sensor for DNA damage. The amplification of signals associated with stalled polymerases and/or
reduced rRNA levels could further activate p53 and other DNA-damage response pathways.
The spatial proteomics method used here allowed us to characterize how cells respond differently
depending on the presence of a single, albeit very important, protein in response to DNA damage. It
has provided accurate information at a proteome-wide level of the specific effect, and has allowed us
to characterize more precisely how cells respond to exposure to Etoposide. It will be interesting in the
future to analyze also the post-translational modifications that change under different conditions. The
spatial proteomics approach complements other methods and can be used to further analyse and
independently verify data from microscopy and molecular studies that are not readily applicable in
high throughput. We envisage that spatial proteomics can be used to characterize a wide range of
different cell types and can be combined with alternative fractionation techniques to analyse multiple
subcellular compartments and structures.
Acknowledgements
AIL is a Wellcome Trust Principal Research Fellow. FMB is supported by a fellowship from the
Caledonian Research Foundation. This work was funded in part by the European Commission’s FP7
(GA HEALTH-F4-2008-201648/PROSPECTS) (www.prospects-fp7.eu/), by RASOR (Radical
Solutions for Researching the Proteome) and by a Wellcome Trust programme grant (073980/Z/03/Z).
We thank other members and colleagues of the Lamond lab for their advice and suggestions.
14
Figure Legends
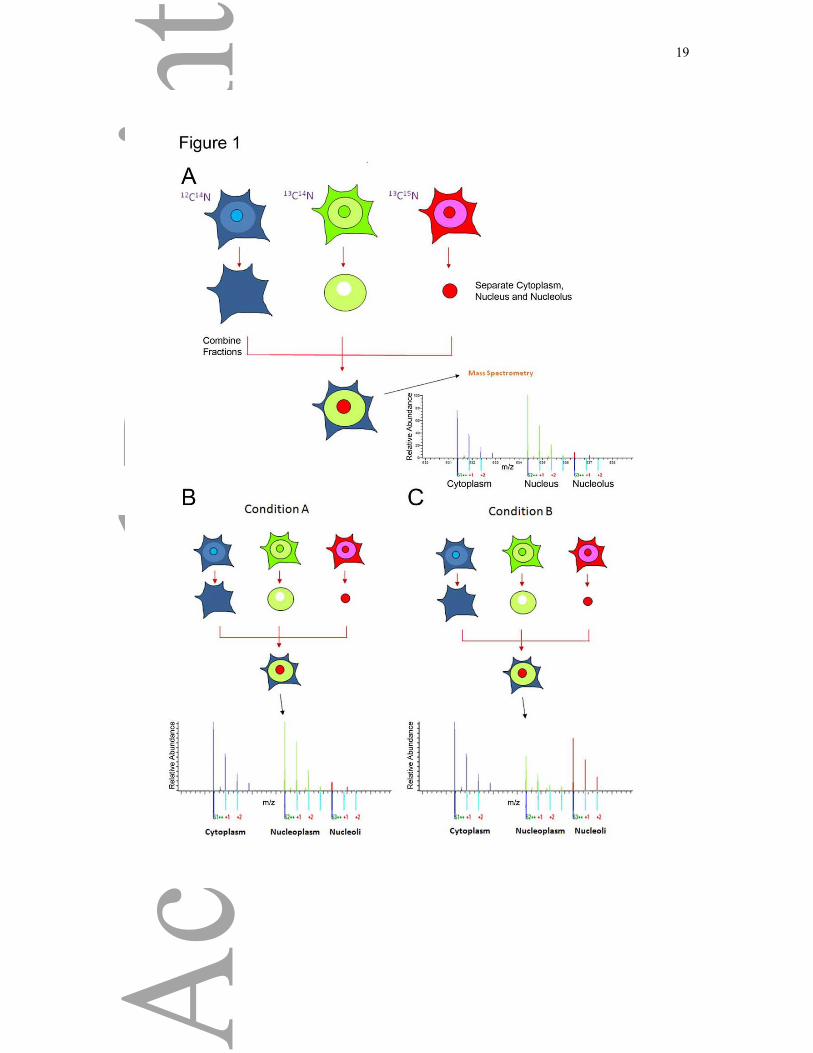
Figure 1: Spatial Proteomics Method
A) Human colon carcinoma HCT116 cells were grown in DMEM containing either the
normal ‘light’ isotopes of carbon and nitrogen (i.e. 12C14N) (light), or L-arginine-13C6
14N4 and
L-lysine-2H4 (medium) or L-arginine- 13C6-15N4 and L-lysine-13C6-
15N2 (heavy). Separate
cytoplasmic, nuclear and nucleolar fractions were isolated from each labelled cell population.
Equal amounts of total protein from each fraction were then recombined to recreate a whole
cell extract, but with cytoplasm (Cyto), nuclei (Nuc) and nucleoli (No) arising from cells with
different isotope labels. The recombined whole cell extract mixture was solubilised with
loading buffer, proteins separated using SDS-PAGE and the resulting gel cut into 8 equal
pieces, trypsin digested and analyzed by LC-MS/MS using an LTQ Orbitrap. To compare
different genotype or conditions, cells are analysed as described above, and changes in
localization under different conditions will result in changes in SILAC ratios under normal
conditions (A) and following treatment or when studying a different condition (C).
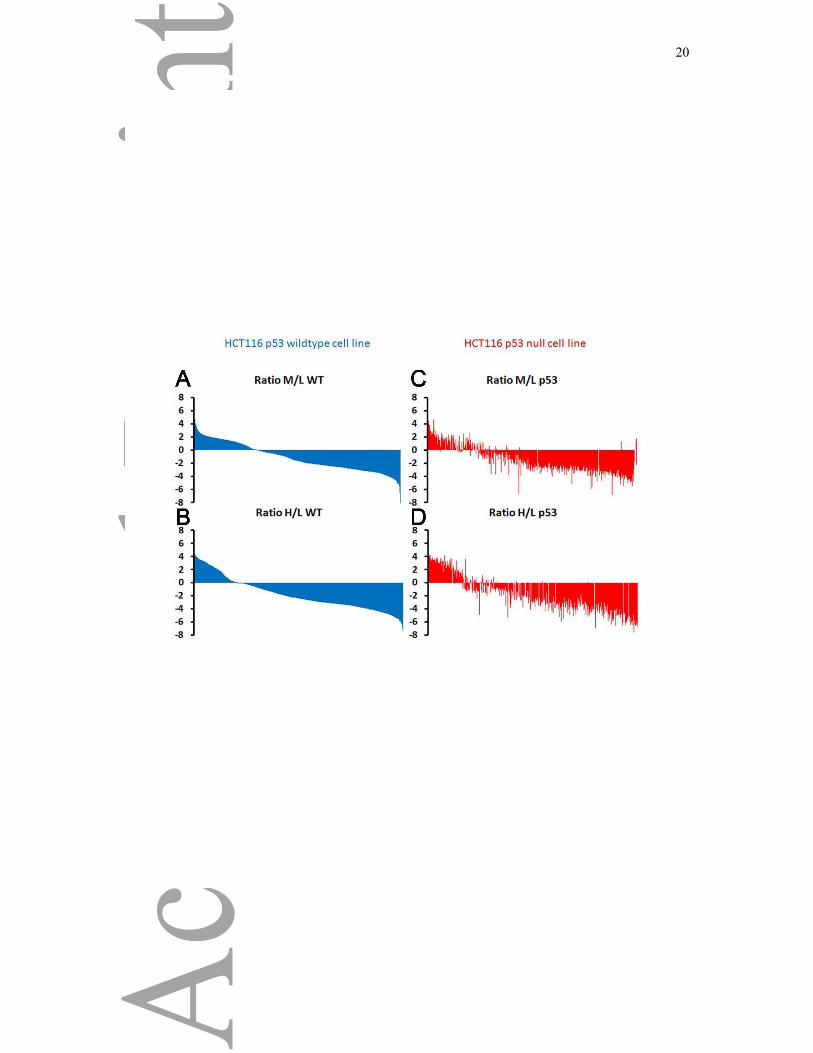
Figure 2: Comparison of HCT116 p53 +/+ and p53 -/- cells.
Graph represents the proteins (x axis) versus the log base two of the SILAC ratio corresponding to the
A),C) nucleoplasmic/cytoplasmic (medium over light, M/L) or the B),D) nucleolar/cytoplasmic
(heavy over light, H/L) in the y axis. The plots correspond to the cellular distribution of proteins from
WT cells (A and B) or from the p53 knock-out cells (C and D). The order of the proteins shown are
sorted according to their localization ration from the WT cells, and the proteins are displayed in the
same order in the p53 knock-out cells.
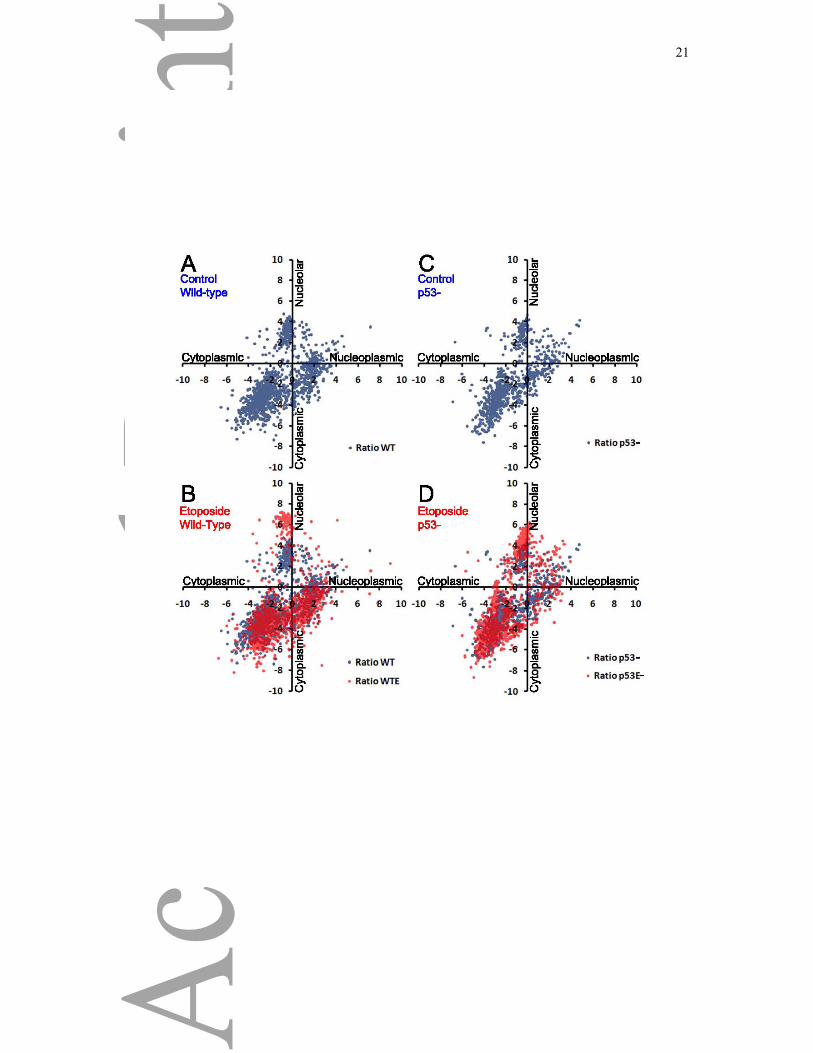
Figure 3: DNA Damage Response and p53
Visualization of the spatial proteomics data by graphical representation, plotting the log base
two Nucleoplasmic/Cytoplasmic ratio on the X axis and log base two Nucleolar/Cytoplasmic
ratio on the Y axis of either mock treated A) wild-type and B) p53 knock-out cells, or of
Etoposide treated C) wild-type and D) p53 knock-out cells.
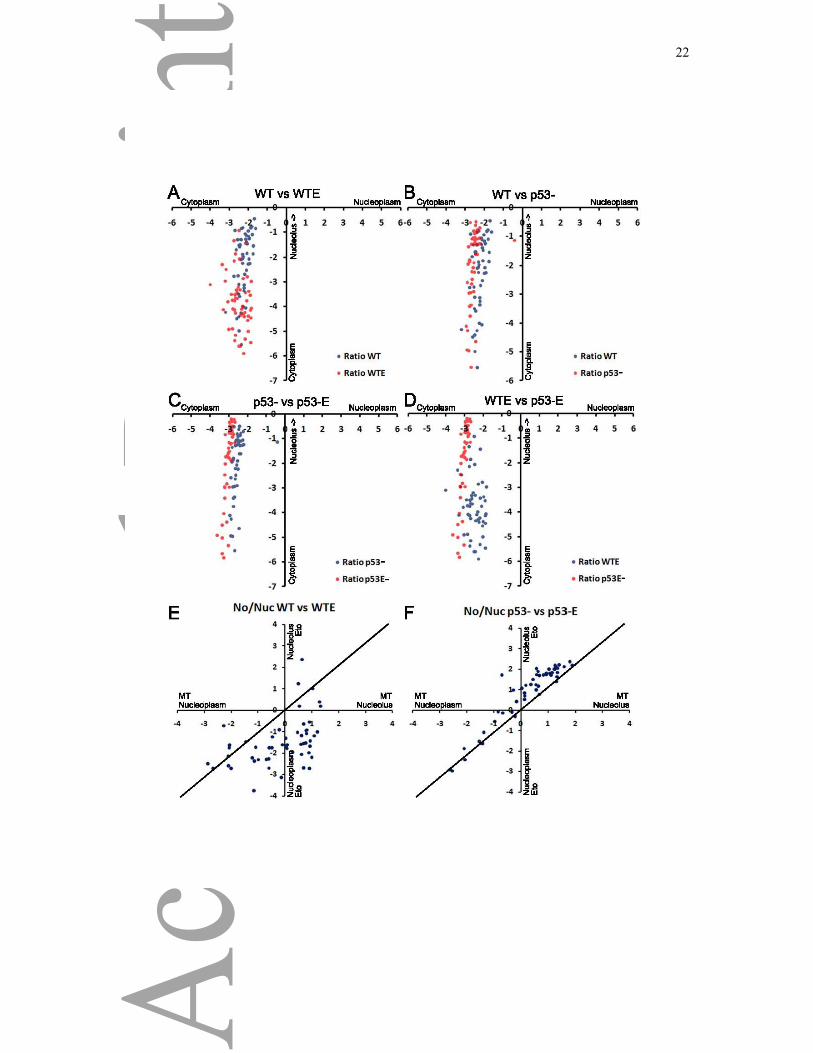
Figure 4: Effect of p53 on the Ribosomal Proteins Response to DNA Damage.
15
Visualization of the spatial proteomics data of ribosomal proteins by graphical representation,
plotting the log base two Nucleoplasmic/Cytoplasmic ratio on the X axis and log base two
Nucleolar/Cytoplasmic ratio on the Y axis of A) wild-type mock treated (blue) and wild-type
etoposide treated cells (red), B) wild-type mock treated (blue) and p53 knock-out mock
treated cells (red), C) p53 knock-out mock treated (blue) and p53 knock-out etoposide treated
cells (red) and D) wild-type etoposide treated (blue) and p53 knock-out etoposide treated
cells (red). Visualization of the spatial proteomics data of ribosomal proteins by graphical
representation, plotting the log base two Nucleolar/Nucleoplasmic ratio of mock-treated cells
(MT) on the X axis and of etoposide-treated cells (Eto) on the Y axis for the E) wild-type
cells and F) p53 knock-out cells.
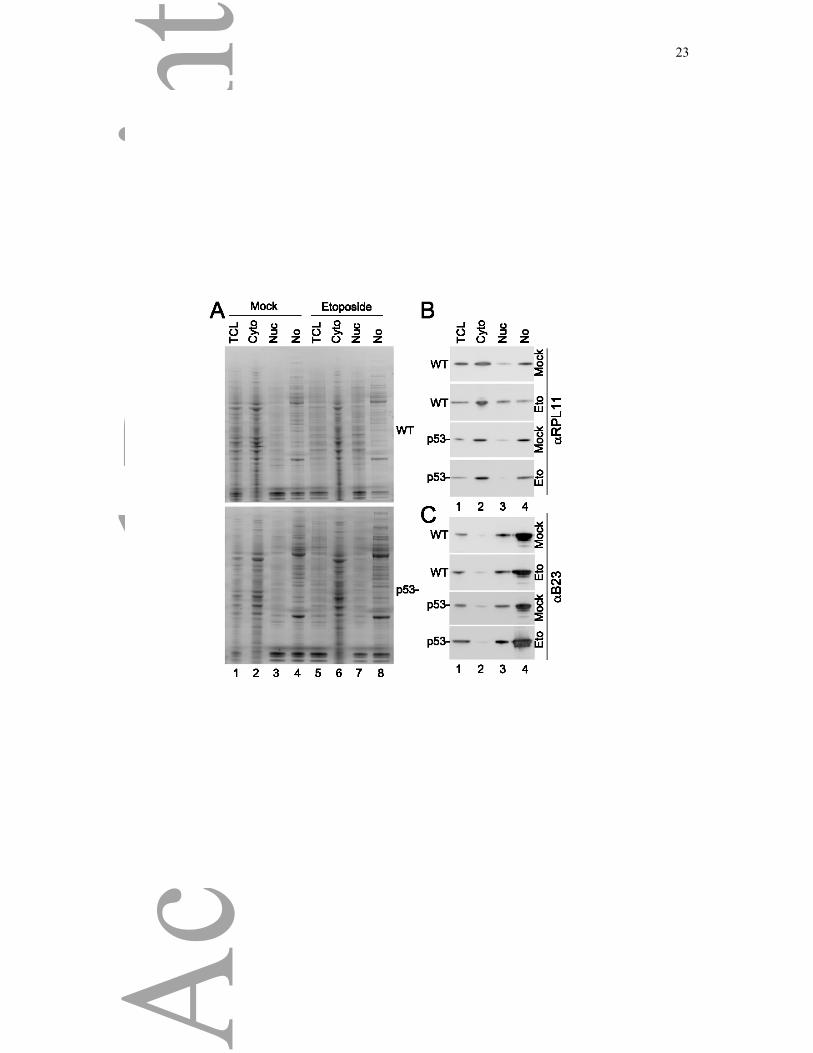
Figure 5: Western Blot Analysis of Ribosomal Proteom Response
A) Equal amount (10μg) of total cell lysates (lanes 1 and 5) or of extracts from the
cytoplasmic (Cyto, lanes 2 and 6), nuclear (Nuc, lanes 3 and 7) or nucleolar (No, lanes 4 and
8) fractions of HCT116 wild-type cells (top) or p53 knock-out (bottom) that were either
mock-treated (1-4) or treated with 50 μM etoposide for 1 hour (5-8) were separated by SDS-
PAGE and stained with Coomassie Blue. B) The same fractions were separated by SDS-
PAGE, transferred to nitrocellulose prior to western blotting with a RPL11 antibody or a
B23-nucleophosmin antibody.
Figure 6: Immunofluorescence Analysis of Ribosomal Protein Response
HCT116 wild-type (A-F) and p53 knock-out (G-L) were cultured on coverslips and either
mock-treated (A-C and G-I) or treated with 50 μM etoposide (D-F and J-L) for 1 hour. Cells
were then fixed with 3.7% paraformaldehyde in CSK buffer for 10 minutes, permeabilized
and labelled for immunofluorescence using an antibody recognizing RPL11 (B-E-H-K).
DNA was visualized using DAPI (A-D-G-J). Scale bars represent 15 μm.

16
Figure 7: p53-Dependent Protein Induced by DNA Damage
Example of two proteins (Phosphoserine Phosphatase and ATP-dependent DNA helicase Q1) whose
intensity was increased following Etoposide treatment in wild-type cells (compare Intensity WT
versus Intensity WTE), but not in p53 knock-out cells (compare Intensity p53 versus Intensity p53E).
17
References
[1] Boisvert, F. M., Lam, Y. W., Lamont, D., Lamond, A. I., A quantitative proteomics analysis of subcellular proteome localization and changes induced by DNA damage. Mol Cell Proteomics 2010, 9, 457-470. [2] Vogelstein, B., Lane, D., Levine, A. J., Surfing the p53 network. Nature 2000, 408, 307-310. [3] Prives, C., Signaling to p53: breaking the MDM2-p53 circuit. Cell 1998, 95, 5-8. [4] Wsierska-Gadek, J., Horky, M., How the nucleolar sequestration of p53 protein or its interplayers contributes to its (re)-activation. Annals of the New York Academy of Sciences 2003, 1010, 266-272. [5] Bertwistle, D., Sugimoto, M., Sherr, C. J., Physical and functional interactions of the Arf tumor suppressor protein with nucleophosmin/B23. Mol Cell Biol 2004, 24, 985-996. [6] Rubbi, C. P., Milner, J., Disruption of the nucleolus mediates stabilization of p53 in response to DNA damage and other stresses. EMBO J 2003, 22, 6068-6077. [7] Ong, S. E., Kratchmarova, I., Mann, M., Properties of 13C-substituted arginine in stable isotope labeling by amino acids in cell culture (SILAC). J Proteome Res 2003, 2, 173-181. [8] Mann, M., Functional and quantitative proteomics using SILAC. Nat Rev Mol Cell Biol 2006, 7, 952-958. [9] Ong, S. E., Blagoev, B., Kratchmarova, I., Kristensen, D. B., et al., Stable isotope labeling by amino acids in cell culture, SILAC, as a simple and accurate approach to expression proteomics. Mol Cell Proteomics 2002, 1, 376-386. [10] Andersen, J. S., Lam, Y. W., Leung, A. K., Ong, S. E., et al., Nucleolar proteome dynamics. Nature 2005, 433, 77-83. [11] Trinkle-Mulcahy, L., Boulon, S., Lam, Y. W., Urcia, R., et al., Identifying specific protein interaction partners using quantitative mass spectrometry and bead proteomes. J Cell Biol 2008, 183, 223-239. [12] Mittler, G., Butter, F., Mann, M., A SILAC-based DNA protein interaction screen that identifies candidate binding proteins to functional DNA elements. Genome Res 2009, 19, 284-293. [13] Vermeulen, M., Hubner, N. C., Mann, M., High confidence determination of specific protein-protein interactions using quantitative mass spectrometry. Curr Opin Biotechnol 2008, 19, 331-337. [14] Andersen, J. S., Lyon, C. E., Fox, A. H., Leung, A. K., et al., Directed proteomic analysis of the human nucleolus. Curr Biol 2002, 12, 1-11. [15] Shevchenko, A., Wilm, M., Vorm, O., Mann, M., Mass spectrometric sequencing of proteins silver-stained polyacrylamide gels. Anal Chem 1996, 68, 850-858. [16] Olsen, J. V., de Godoy, L. M., Li, G., Macek, B., et al., Parts per million mass accuracy on an Orbitrap mass spectrometer via lock mass injection into a C-trap. Mol Cell Proteomics 2005, 4, 2010-2021. [17] Cox, J., Mann, M., MaxQuant enables high peptide identification rates, individualized p.p.b.-range mass accuracies and proteome-wide protein quantification. Nat Biotechnol 2008, 26, 1367-1372. [18] Cox, J., Matic, I., Hilger, M., Nagaraj, N., et al., A practical guide to the MaxQuant computational platform for SILAC-based quantitative proteomics. Nat Protoc 2009, 4, 698-705. [19] Bunz, F., Dutriaux, A., Lengauer, C., Waldman, T., et al., Requirement for p53 and p21 to sustain G2 arrest after DNA damage. Science 1998, 282, 1497-1501. [20] Ong, S. E., Mann, M., A practical recipe for stable isotope labeling by amino acids in cell culture (SILAC). Nat Protoc 2006, 1, 2650-2660. [21] Rahman-Roblick, R., Roblick, U. J., Hellman, U., Conrotto, P., et al., p53 targets identified by protein expression profiling. Proc Natl Acad Sci U S A 2007, 104, 5401-5406. [22] Lam, Y. W., Lamond, A. I., Mann, M., Andersen, J. S., Analysis of nucleolar protein dynamics reveals the nuclear degradation of ribosomal proteins. Curr Biol 2007, 17, 749-760. [23] Wu, Y., Brosh, R. M., Jr., Distinct roles of RECQ1 in the maintenance of genomic stability. DNA Repair (Amst) 2010, 9, 315-324.
18
[24] Zhang, Y., Shi, Y., Li, X., Du, W., et al., Inhibition of the p53-MDM2 interaction by adenovirus delivery of ribosomal protein L23 stabilizes p53 and induces cell cycle arrest and apoptosis in gastric cancer. J Gene Med 2010, 12, 147-156. [25] Lohrum, M. A., Ludwig, R. L., Kubbutat, M. H., Hanlon, M., Vousden, K. H., Regulation of HDM2 activity by the ribosomal protein L11. Cancer Cell 2003, 3, 577-587. [26] Volarevic, S., Stewart, M. J., Ledermann, B., Zilberman, F., et al., Proliferation, but not growth, blocked by conditional deletion of 40S ribosomal protein S6. Science 2000, 288, 2045-2047. [27] Yuan, X., Zhou, Y., Casanova, E., Chai, M., et al., Genetic inactivation of the transcription factor TIF-IA leads to nucleolar disruption, cell cycle arrest, and p53-mediated apoptosis. Mol Cell 2005, 19, 77-87. [28] Fumagalli, S., Di Cara, A., Neb-Gulati, A., Natt, F., et al., Absence of nucleolar disruption after impairment of 40S ribosome biogenesis reveals an rpL11-translation-dependent mechanism of p53 induction. Nat Cell Biol 2009, 11, 501-508. [29] Lindstrom, M. S., Nister, M., Silencing of ribosomal protein S9 elicits a multitude of cellular responses inhibiting the growth of cancer cells subsequent to p53 activation. PLoS One 2010, 5, e9578. [30] Zhang, F., Hamanaka, R. B., Bobrovnikova-Marjon, E., Gordan, J. D., et al., Ribosomal stress couples the unfolded protein response to p53-dependent cell cycle arrest. J Biol Chem 2006, 281, 30036-30045. [31] Ohashi, S., Natsuizaka, M., Wong, G. S., Michaylira, C. Z., et al., Epidermal Growth Factor Receptor and Mutant p53 Expand an Esophageal Cellular Subpopulation Capable of Epithelial-to-Mesenchymal Transition through ZEB Transcription Factors. Cancer Res 2010. [32] Olson, M. O., Sensing cellular stress: another new function for the nucleolus? Sci STKE 2004, 2004, pe10. [33] Russell, J., Zomerdijk, J. C., RNA-polymerase-I-directed rDNA transcription, life and works. Trends Biochem Sci 2005, 30, 87-96.
19
20
21
22
23
24
25