Comparative transcriptome and subcellular …bacsa-silk.org/user_pic/files/Dr. Xu.transcriptome...
41
Comparative transcriptome and subcellular proteome analysis of Bombyx mori (Lepidoptera) larval midgut response to BmNPV in different resistant strains Jiaping Xu, Ph D, Professor Anhi Agricultural University, China Anhui Agricultural University
Transcript of Comparative transcriptome and subcellular …bacsa-silk.org/user_pic/files/Dr. Xu.transcriptome...

Comparative transcriptome and subcellularproteome analysis of Bombyx mori(Lepidoptera) larval midgut response to BmNPV in different resistant strains
Jiaping Xu, Ph D, Professor
Anhi Agricultural University, China
Anhui Agricultural University
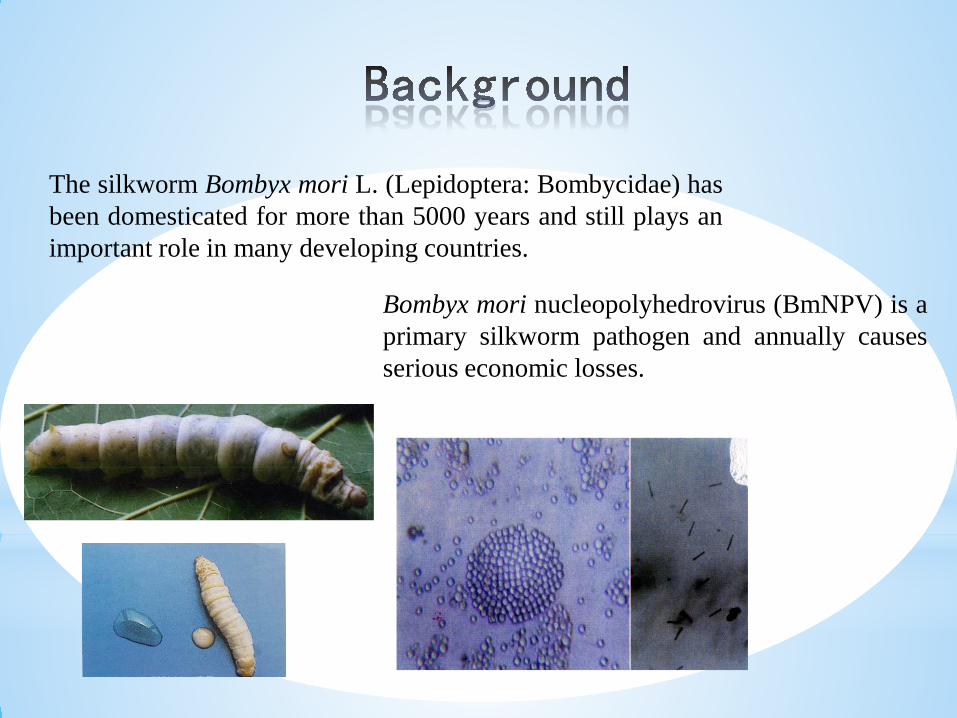
The silkworm Bombyx mori L. (Lepidoptera: Bombycidae) hasbeen domesticated for more than 5000 years and still plays animportant role in many developing countries.
Bombyx mori nucleopolyhedrovirus (BmNPV) is aprimary silkworm pathogen and annually causesserious economic losses.
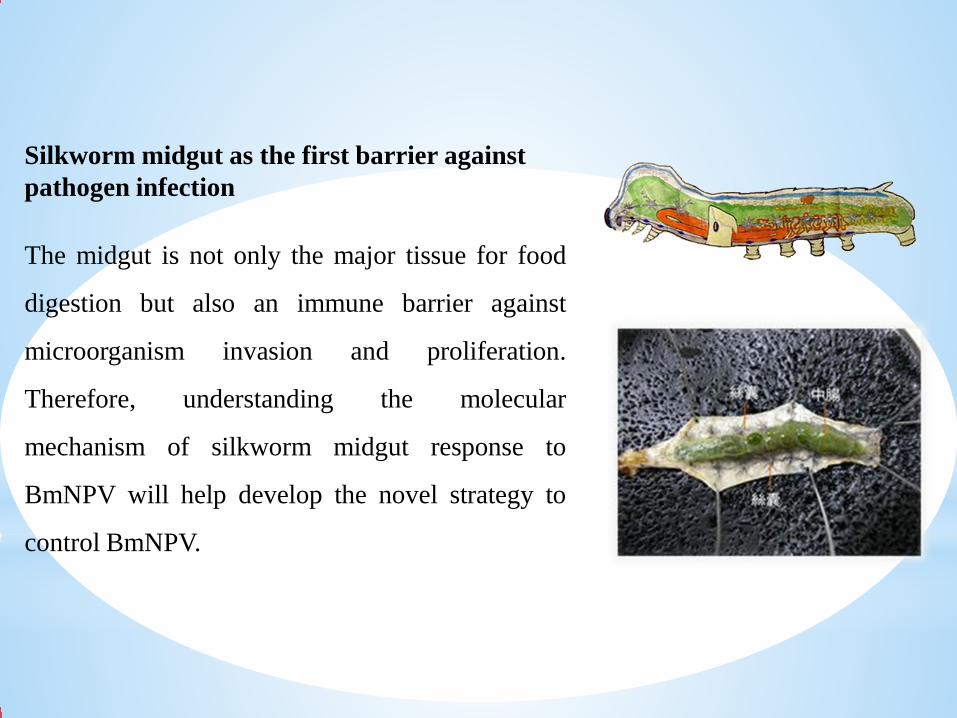
Silkworm midgut as the first barrier against pathogen infection
The midgut is not only the major tissue for food
digestion but also an immune barrier against
microorganism invasion and proliferation.
Therefore, understanding the molecular
mechanism of silkworm midgut response to
BmNPV will help develop the novel strategy to
control BmNPV.
In recent years, the next generation sequencing was used widely
in the research of host cell responses to exogenous pathogenic
infection. For example, several candidate genes, such as BmEts,
BmToll10-3 and Hsp20-1, have been identified in the initial
stage of BmNPV infection by analyzing the global
transcriptional profile of silkworm cell lines and heads
following BmNPV infection (wang et al., 2015; Sagisaka et al.,
2010).

The study of silkworm resistance to NPV infection at protein level
Many digestive enzymes involved inantiviral activity have been cloned andcharacterized, such as red fluorescentprotein (RFP), lipase and serine protease.
Ponnuvel et al., 2003
Hiroshi et al, 2004
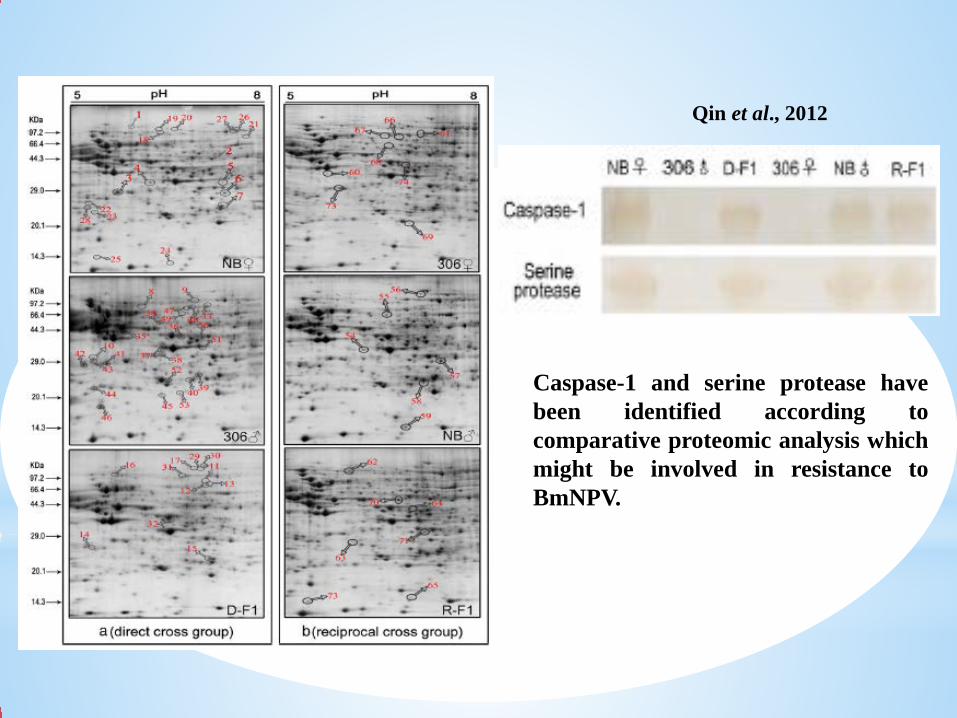
Caspase-1 and serine protease havebeen identified according tocomparative proteomic analysis whichmight be involved in resistance toBmNPV.
Qin et al., 2012
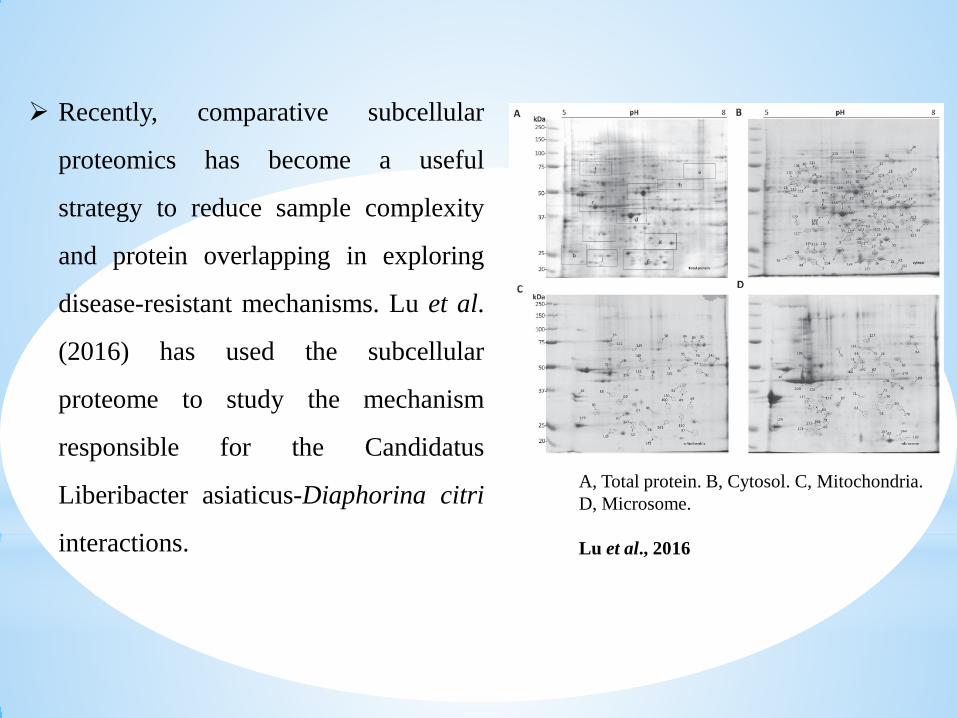
Recently, comparative subcellular
proteomics has become a useful
strategy to reduce sample complexity
and protein overlapping in exploring
disease-resistant mechanisms. Lu et al.
(2016) has used the subcellular
proteome to study the mechanism
responsible for the Candidatus
Liberibacter asiaticus-Diaphorina citri
interactions.
A, Total protein. B, Cytosol. C, Mitochondria. D, Microsome.
Lu et al., 2016
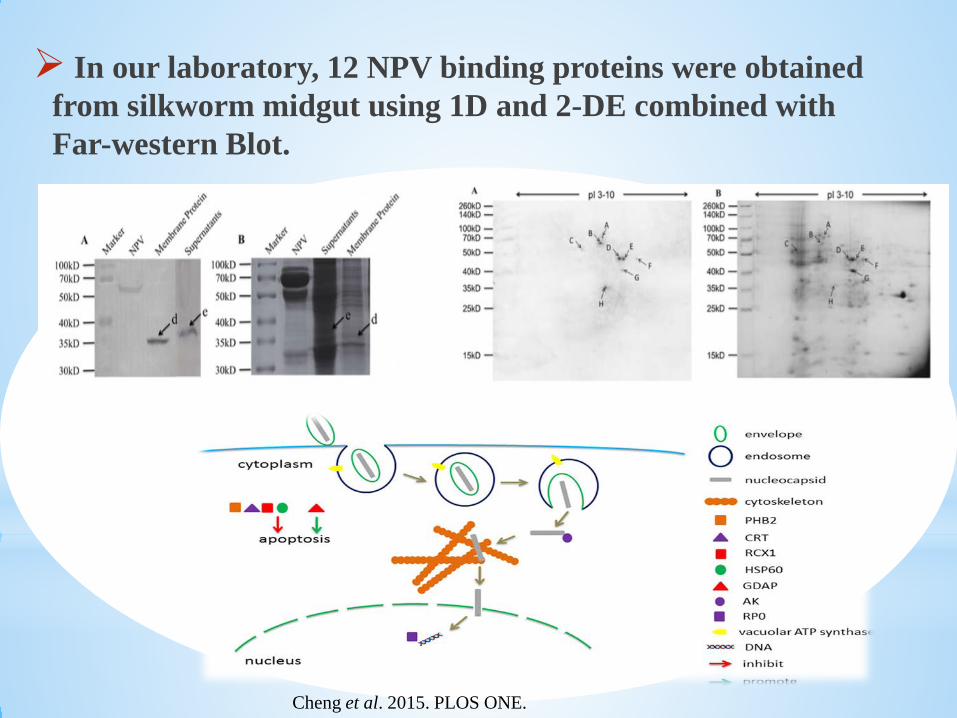
In our laboratory, 12 NPV binding proteins were obtained from silkworm midgut using 1D and 2-DE combined with Far-western Blot.
Cheng et al. 2015. PLOS ONE.
Even though many remarkable results were obtained, the molecularmechanism of silkworm resistance to NPV infection was still unclear.Until now, the study of silkworm resistance to NPV infection usingcomparative transcriptome and proteome to analyze the nearisogenic line and the recurrent parent does not have been reportedyet.
In this study, to clarify the mechanism of silkworm resistance toNPV inifection, comparative transcriptome and subcellular proteomewere adopted to identify the differentilly expressed genes andproteins in the near isogenic line BC9 and the recrrent parent P50.
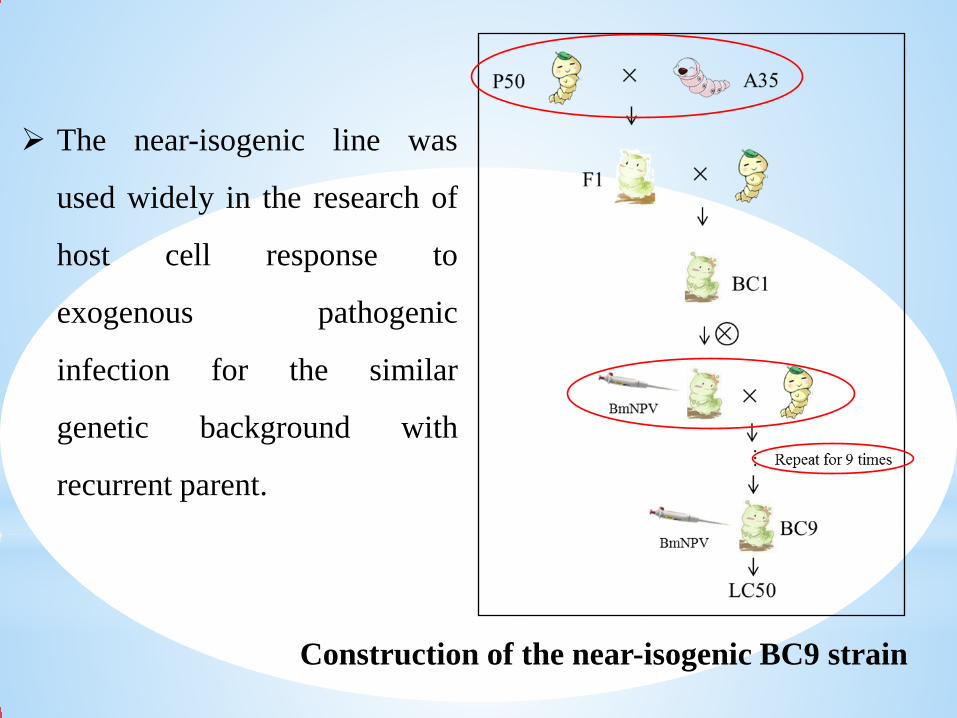
The near-isogenic line was
used widely in the research of
host cell response to
exogenous pathogenic
infection for the similar
genetic background with
recurrent parent.
Construction of the near-isogenic BC9 strain

Strains LC50(OB/mL)
95% fiducial limits
Lower Upper
BC9 2.27×10⁶ 4.58×10⁵ 1.74×10⁷
A35 [Cheng et al., 2015] 5.90×10⁷ 2.14×10⁷ 3.22×10⁸
P50 [Cheng et al., 2015] 1.03×10⁵ 3.96×10⁴ 2.24×10⁵
The LC50 value of B. mori larvae infected with BmNPV
The LC50 value of A35 was 26-fold greater than that of BC9.
The value of BC9 was 23-fold greater than that of P50.
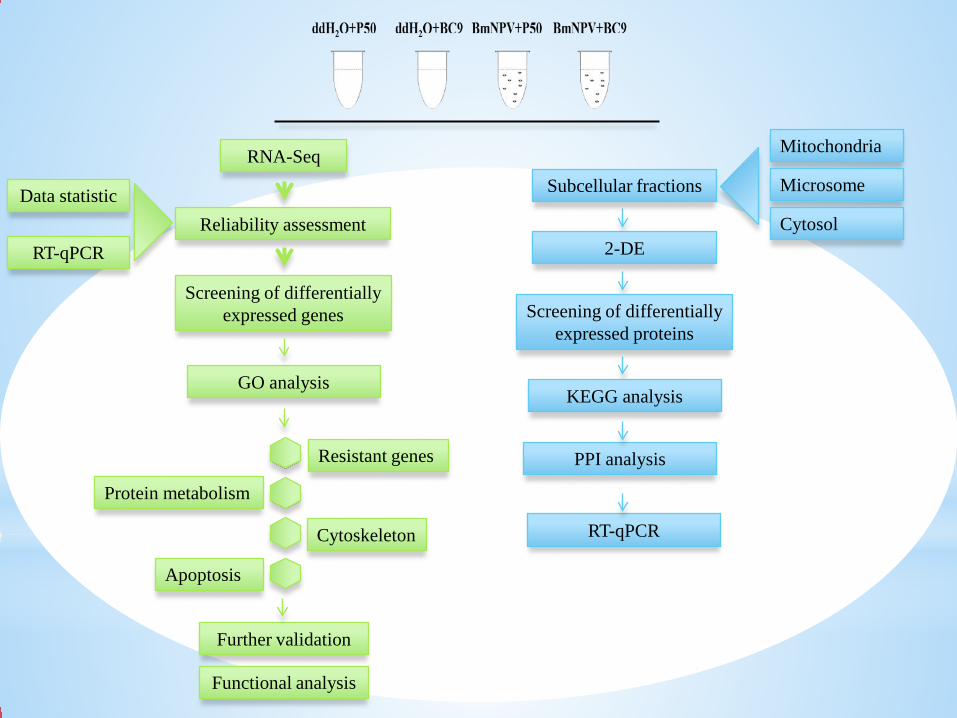
RNA-Seq
Screening of differentially expressed genes
Reliability assessment
GO analysis
Further validation
RT-qPCR
Functional analysis
Resistant genes
Protein metabolism
Cytoskeleton
Apoptosis
Subcellular fractions
Mitochondria
Microsome
Cytosol2-DE
Screening of differentially expressed proteins
KEGG analysis
PPI analysis
Data statistic
RT-qPCR
Transcriptome

P50- P50+ BC9- BC9+
Total Reads 34,202,992 39,598,483 33,696,273 36,941,634
GC Content (%) 48 49 48 48
% ≥ Q30 (%) 91.42 90.74 90.07 90.28
Mapped Reads 27,261,542 31,333,514 26,640,096 29,131,867
Mapped Ratio (%) 79.72 79.08 79.06 78.89
Unique Mapped Reads 23,563,245 26,329,862 23,325,074 25,650,914
Unique Mapped Ratio (%) 68.90 66.51 69.21 69.47
Summary statistics for silkworm genes based on the RNA-seq data.
The GC content of each of the four libraries was approximately 50%, and
CycleQ30% was greater than 90% for each library.
All the unigenes matched previously described sequences with approximately
70% coverage.
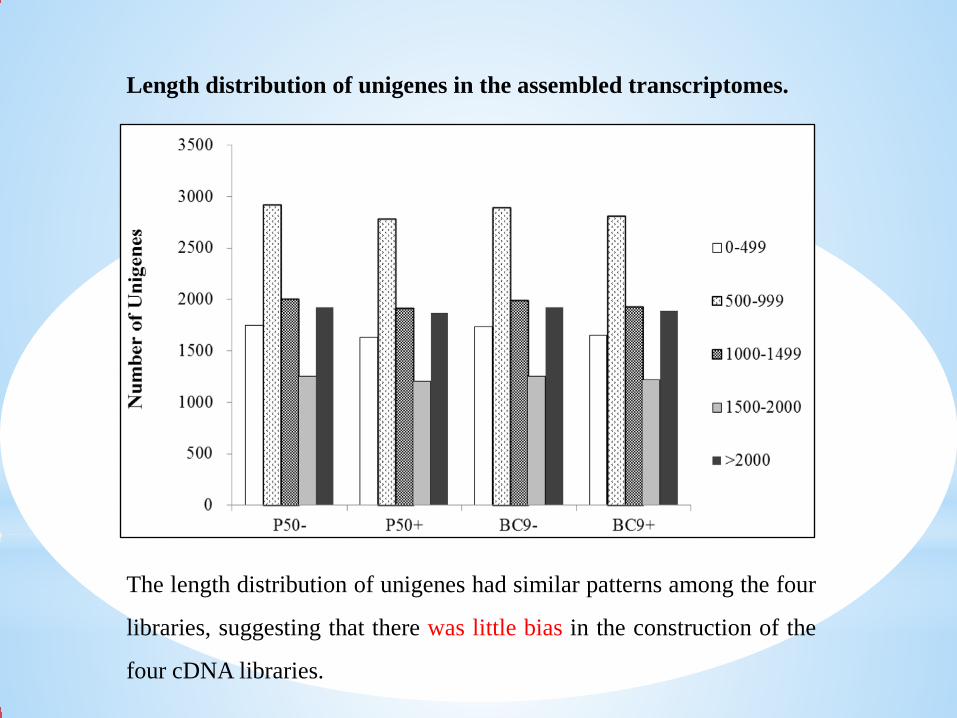
Length distribution of unigenes in the assembled transcriptomes.
The length distribution of unigenes had similar patterns among the four
libraries, suggesting that there was little bias in the construction of the
four cDNA libraries.

Correlation between geneexpression ratios obtained fromtranscriptome data and RT-qPCR.
The relative expression levels of
15 randomly selected genes
were analyzed by RT-qPCR. The
results were consistent with the
transcriptome data.
Linear regression analysis
showed an R2 value of 0.9169,
which suggested a strong
positive correlation between RT-
qPCR and transcriptome data.

Venn diagram showing the DEGs related to BmNPV infection in different resistant strains.
Groups Total Up-regulated
Down-regulated
Unique genes
P50+ vs. P50- 285 122 (43%) 163 (57%) 197
BC9+ vs. BC9- 193 56 (29%) 137 (71%) 119
BC9- vs. P50- 154 78 (51%) 76 (49%) 82
GO analysis
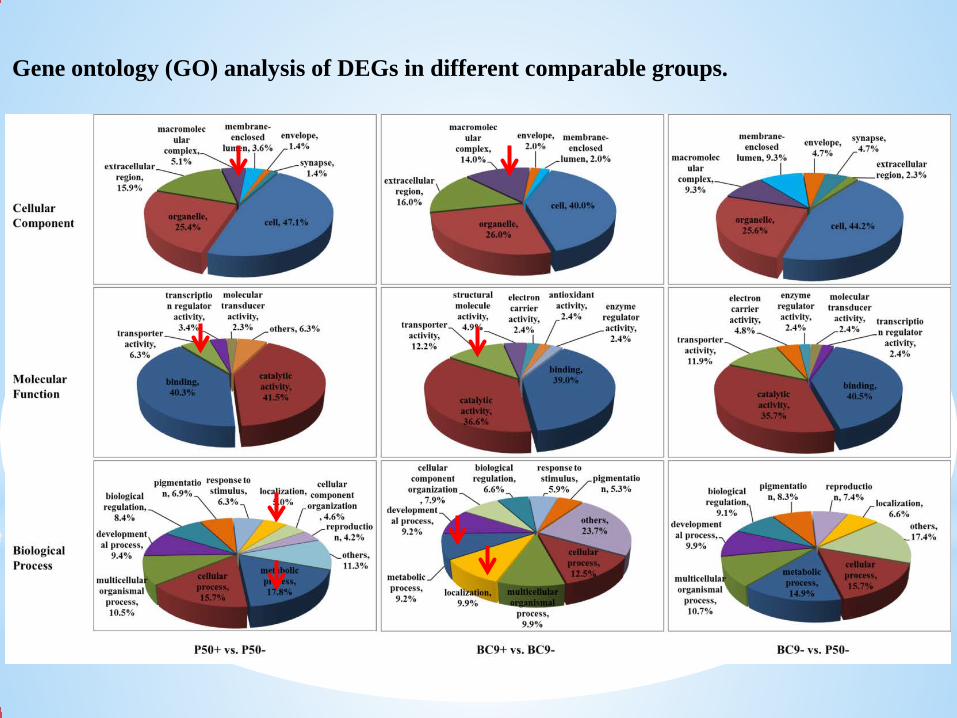
Gene ontology (GO) analysis of DEGs in different comparable groups.
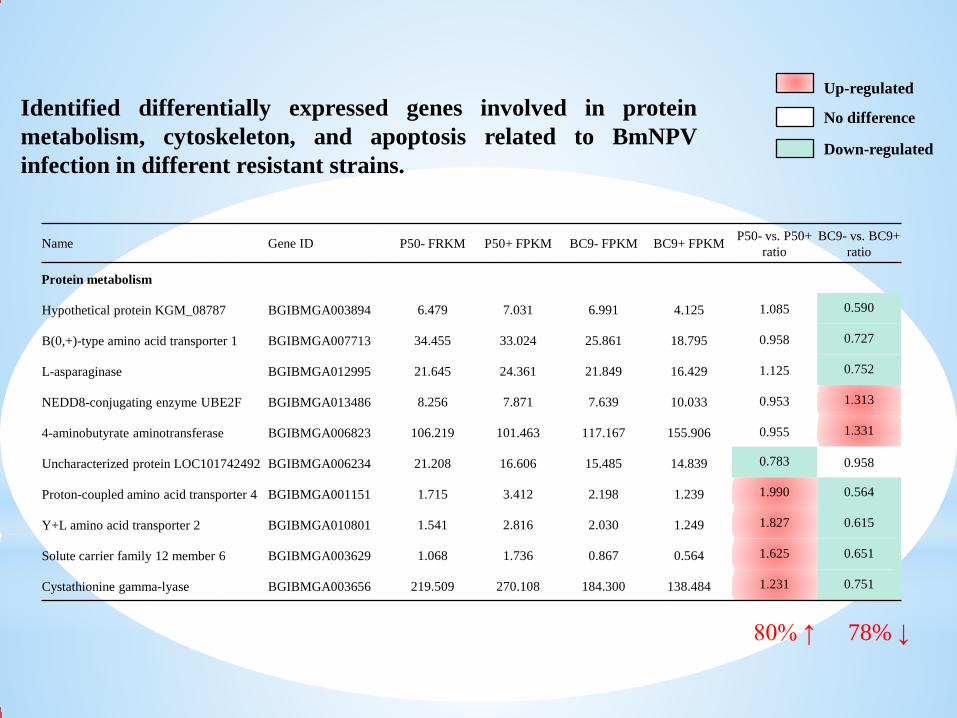
Name Gene ID P50- FRKM P50+ FPKM BC9- FPKM BC9+ FPKM P50- vs. P50+ ratio
BC9- vs. BC9+ratio
Protein metabolism
Hypothetical protein KGM_08787 BGIBMGA003894 6.479 7.031 6.991 4.125 1.085 0.590
B(0,+)-type amino acid transporter 1 BGIBMGA007713 34.455 33.024 25.861 18.795 0.958 0.727
L-asparaginase BGIBMGA012995 21.645 24.361 21.849 16.429 1.125 0.752
NEDD8-conjugating enzyme UBE2F BGIBMGA013486 8.256 7.871 7.639 10.033 0.953 1.313
4-aminobutyrate aminotransferase BGIBMGA006823 106.219 101.463 117.167 155.906 0.955 1.331
Uncharacterized protein LOC101742492 BGIBMGA006234 21.208 16.606 15.485 14.839 0.783 0.958
Proton-coupled amino acid transporter 4 BGIBMGA001151 1.715 3.412 2.198 1.239 1.990 0.564
Y+L amino acid transporter 2 BGIBMGA010801 1.541 2.816 2.030 1.249 1.827 0.615
Solute carrier family 12 member 6 BGIBMGA003629 1.068 1.736 0.867 0.564 1.625 0.651
Cystathionine gamma-lyase BGIBMGA003656 219.509 270.108 184.300 138.484 1.231 0.751
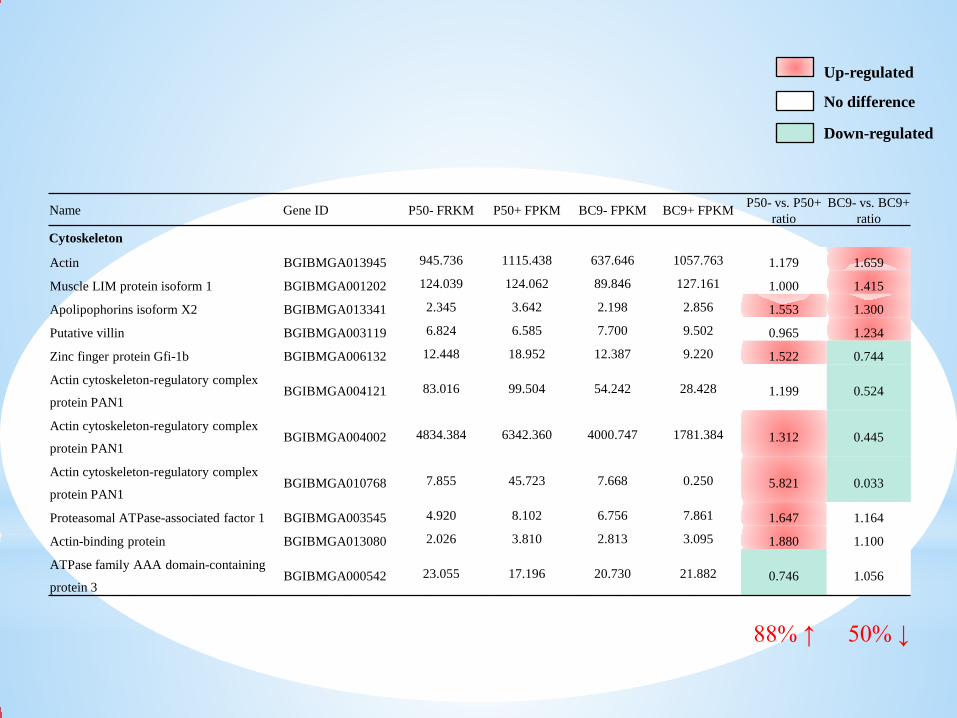
Identified differentially expressed genes involved in proteinmetabolism, cytoskeleton, and apoptosis related to BmNPVinfection in different resistant strains.
No difference
Down-regulated
Up-regulated
78% ↓80% ↑
Name Gene ID P50- FRKM P50+ FPKM BC9- FPKM BC9+ FPKM P50- vs. P50+ ratio
BC9- vs. BC9+ratio
Cytoskeleton
Actin BGIBMGA013945 945.736 1115.438 637.646 1057.763 1.179 1.659
Muscle LIM protein isoform 1 BGIBMGA001202 124.039 124.062 89.846 127.161 1.000 1.415
Apolipophorins isoform X2 BGIBMGA013341 2.345 3.642 2.198 2.856 1.553 1.300
Putative villin BGIBMGA003119 6.824 6.585 7.700 9.502 0.965 1.234
Zinc finger protein Gfi-1b BGIBMGA006132 12.448 18.952 12.387 9.220 1.522 0.744
Actin cytoskeleton-regulatory complex
protein PAN1BGIBMGA004121 83.016 99.504 54.242 28.428 1.199 0.524
Actin cytoskeleton-regulatory complex
protein PAN1BGIBMGA004002 4834.384 6342.360 4000.747 1781.384 1.312 0.445
Actin cytoskeleton-regulatory complex
protein PAN1BGIBMGA010768 7.855 45.723 7.668 0.250 5.821 0.033
Proteasomal ATPase-associated factor 1 BGIBMGA003545 4.920 8.102 6.756 7.861 1.647 1.164
Actin-binding protein BGIBMGA013080 2.026 3.810 2.813 3.095 1.880 1.100
ATPase family AAA domain-containing
protein 3BGIBMGA000542 23.055 17.196 20.730 21.882 0.746 1.056
50% ↓88% ↑
No difference
Down-regulated
Up-regulated
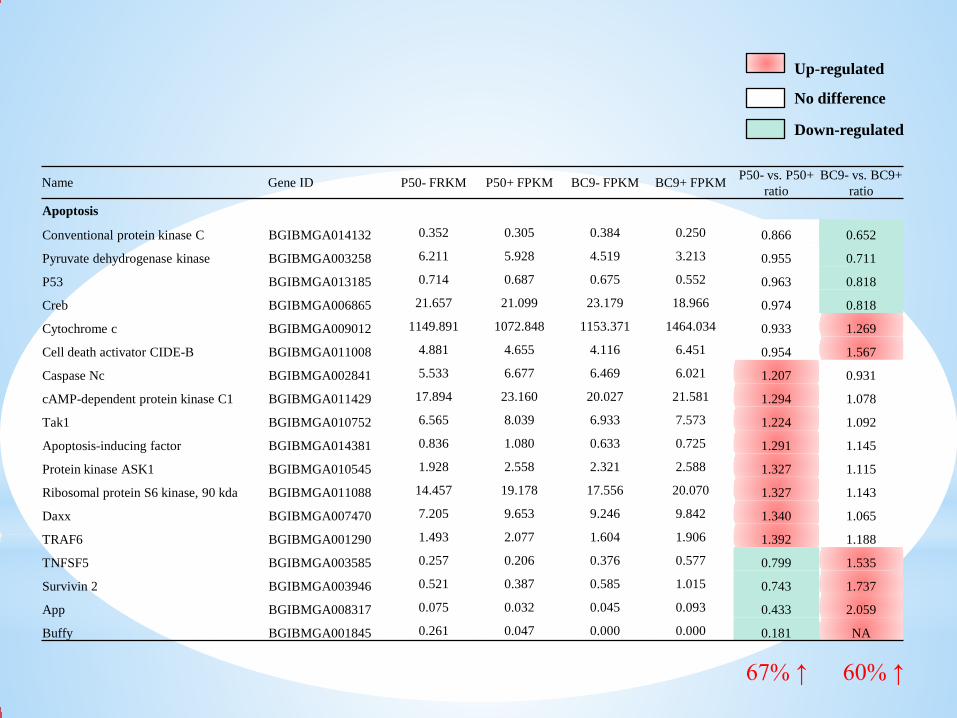
Name Gene ID P50- FRKM P50+ FPKM BC9- FPKM BC9+ FPKM P50- vs. P50+ ratio
BC9- vs. BC9+ratio
Apoptosis
Conventional protein kinase C BGIBMGA014132 0.352 0.305 0.384 0.250 0.866 0.652
Pyruvate dehydrogenase kinase BGIBMGA003258 6.211 5.928 4.519 3.213 0.955 0.711
P53 BGIBMGA013185 0.714 0.687 0.675 0.552 0.963 0.818
Creb BGIBMGA006865 21.657 21.099 23.179 18.966 0.974 0.818
Cytochrome c BGIBMGA009012 1149.891 1072.848 1153.371 1464.034 0.933 1.269
Cell death activator CIDE-B BGIBMGA011008 4.881 4.655 4.116 6.451 0.954 1.567
Caspase Nc BGIBMGA002841 5.533 6.677 6.469 6.021 1.207 0.931
cAMP-dependent protein kinase C1 BGIBMGA011429 17.894 23.160 20.027 21.581 1.294 1.078
Tak1 BGIBMGA010752 6.565 8.039 6.933 7.573 1.224 1.092
Apoptosis-inducing factor BGIBMGA014381 0.836 1.080 0.633 0.725 1.291 1.145
Protein kinase ASK1 BGIBMGA010545 1.928 2.558 2.321 2.588 1.327 1.115
Ribosomal protein S6 kinase, 90 kda BGIBMGA011088 14.457 19.178 17.556 20.070 1.327 1.143
Daxx BGIBMGA007470 7.205 9.653 9.246 9.842 1.340 1.065
TRAF6 BGIBMGA001290 1.493 2.077 1.604 1.906 1.392 1.188
TNFSF5 BGIBMGA003585 0.257 0.206 0.376 0.577 0.799 1.535
Survivin 2 BGIBMGA003946 0.521 0.387 0.585 1.015 0.743 1.737
App BGIBMGA008317 0.075 0.032 0.045 0.093 0.433 2.059
Buffy BGIBMGA001845 0.261 0.047 0.000 0.000 0.181 NA
60% ↑67% ↑
No difference
Down-regulated
Up-regulated

Venn diagram showing the DEGs related to BmNPV infection in different resistant strains.

Expression patterns of the 22 genes related to BmNPV resistance in different resistant strains.
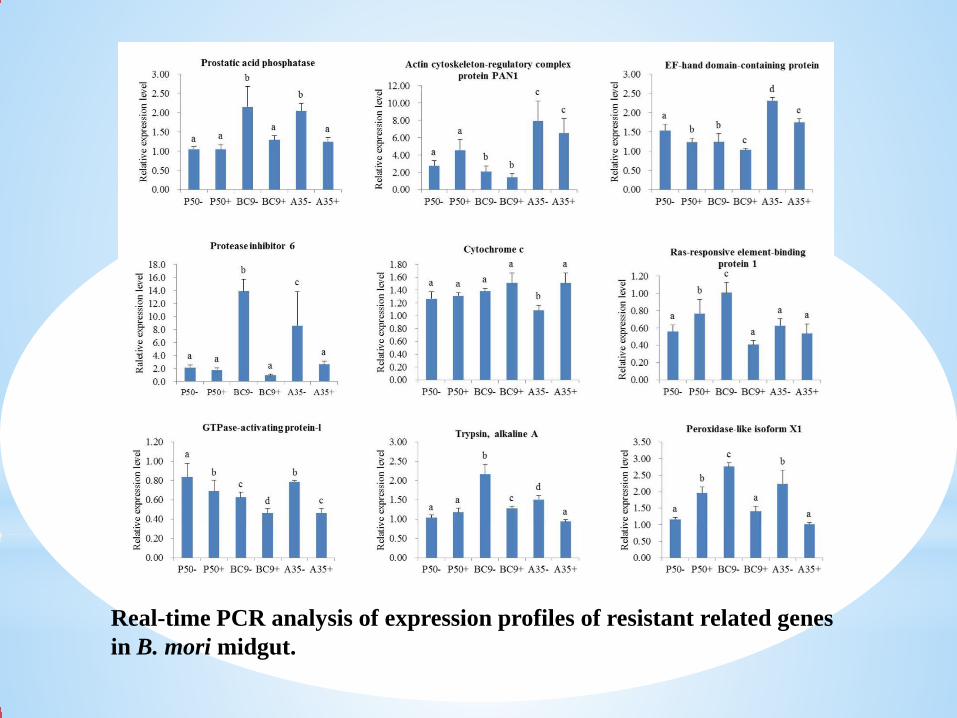
Real-time PCR analysis of expression profiles of resistant related genes in B. mori midgut.
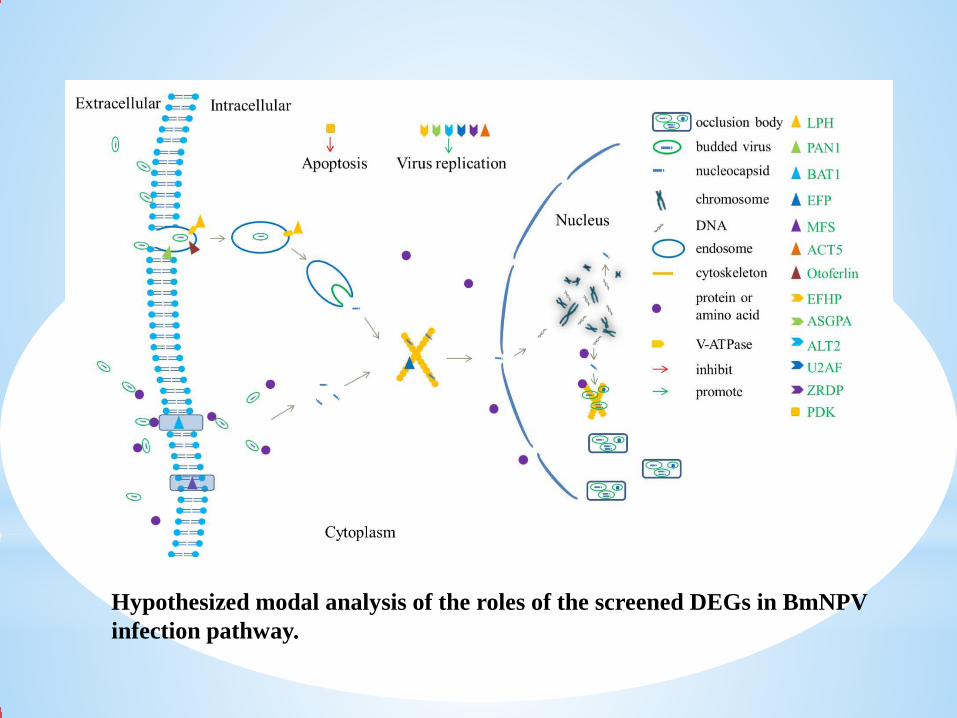
Hypothesized modal analysis of the roles of the screened DEGs in BmNPVinfection pathway.

Proteome

Analysis of subcellular protein fractions of silkworm midgut
1, Marker; 2, total protein; 3, mitochondira; 4, microsome; 5, cytosol.

2-DE images of cytosolic proteinextracts from P50 and BC9 followingBmNPV infection.
A total of 38 spots were determined to
be differentially expressed in the cytosol,
and the results are summarized in Table.

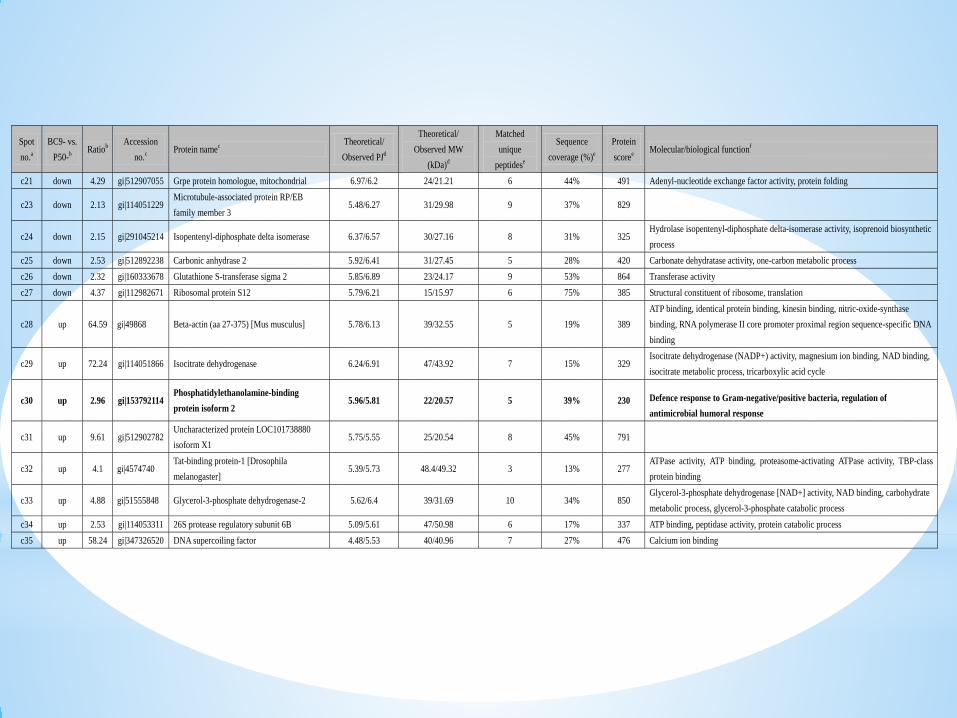
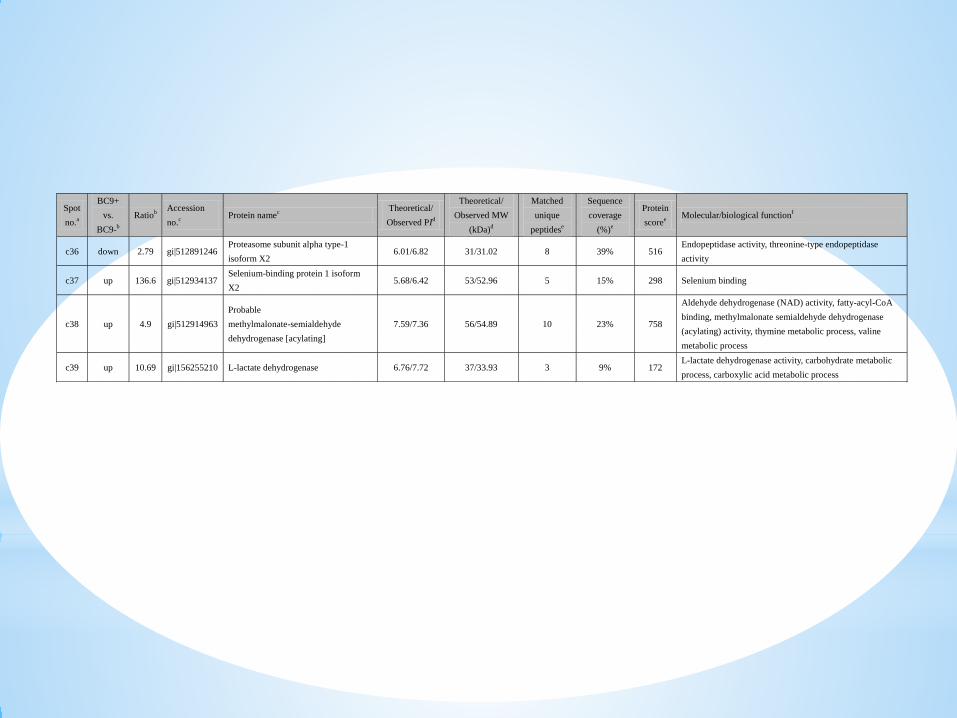
Identified proteins from cytosolic fraction that changed significantly in differentresistant strains following BmNPV infection.
Spot
no.a
P50+
vs.
P50-b
Ratiob Accession
no.c Protein namec
Theoretical/
Observed PId
Theoretical/
Observed MW
(kDa)d
Matched
unique
peptidese
Sequence
coverage
(%)e
Protein
scoree Molecular/biological functionf
c1 down 49.13 gi|255652881 Dnaj (Hsp40) homologue 3 5.56/6.47 40/35.25 6 23% 456 Protein folding
c2 down 65.71 gi|512914963
Probable methylmalonate-semialdehyde
dehydrogenase [acylating], mitochondrial
isoform X1
7.59/7.53 56/57 9 22% 808
Aldehyde dehydrogenase (NAD) activity, fatty-acyl-CoA binding,
methylmalonate semialdehyde dehydrogenase (acylating) activity,
thymine metabolic process, valine metabolic process
c3 down 149.67 gi|512936895 Acetyl-CoA hydrolase 7.67/7.83 52/48.4 8 16% 523 Hydrolase activity, acetyl-CoA metabolic process
c4 down 6.07 gi|512902782 Uncharacterized protein LOC101738880 isoform
X1 5.75/5.72 25/22.73 7 34% 578
c5 down 5.34 gi|17136564 Alpha-tubulin at 84B [Drosophila melanogaster] 5.00/5.62 51/53.44 8 27% 767 GTPase activity, GTP binding, structural constituent of cytoskeleton,
antimicrobial humoral response, mitotic spindle assembly checkpoint
c6 down 2.4 gi|512934077 10 kDa heat shock protein, mitochondrial 6.74/7.38 11/15.22 4 52% 396 ATP binding, protein folding
c7 down 2.86 gi|827563568 Electron transfer flavoprotein subunit alpha,
mitochondrial 8.43/7.2 35/29.68 8 36% 827 Electron carrier activity, flavin adenine dinucleotide binding
c8 down 3.72 gi|827558088 3-hydroxyisobutyryl-CoA hydrolase,
mitochondrial 8.08/7.43 41/35.39 7 27% 584 Hydrolase activity
c9 down 8.15 gi|512898603 Glyoxylate reductase/hydroxypyruvate
reductase-like isoform X1 8.76/7.65 40/36.95 10 33% 849
NAD binding, oxidoreductase activity, acting on the CH-OH group of
donors, NAD or NADP as acceptor
c10 down 148.54 gi|112984390 Elongation factor 1-alpha 9.24/6.69 51/49.5 6 18% 390 GTPase activity, GTP binding, translation elongation factor activity
c11 up 3.09 gi|112983556 90-kDa heat shock protein 4.99/5.52 83/86.37 9 16% 713 ATP binding, response to stress, protein folding
c12 up 5.75 gi|512901366 Aldose reductase-like isoform X1 6.09/6.68 36/31.36 8 30% 491 Oxidoreductase activity
c13 up 4.58 gi|827560339 Prolyl endopeptidase 7.90/6.61 90/76.05 4 6% 309 Serine-type endopeptidase activity, serine-type exopeptidase activity
c14 up 3.66 gi|512888904 Cytoplasmic aconitate hydratase-like isoform X1 5.84/6.73 97/94.81 8 13% 55 Metabolic process
c15 up 5.93 gi|512939991 Cystathionine beta-synthase-like 6.02/6.86 54/54.31 8 18% 481 Cystathionine beta-synthase activity, metal ion binding, pyridoxal
phosphate binding
c16 up 3.12 gi|357613322 26S protease regulatory subunit 6A [Danaus
plexippus] 5.11/5.73 48/49.32 7 23% 493 ATP binding, peptidase activity, protein catabolic process
c17 up 3.14 gi|312597598 Inorganic pyrophosphatase 4.96/5.4 32/29.85 9 28% 452 Inorganic diphosphatase activity, magnesium ion binding,
phosphate-containing compound metabolic process
c18 up 6.1 gi|512923641 Fatty acid-binding protein-like 5.04/6.16 16/18.89 5 38% 296 Lipid binding, transporter activity
c19 up 4 gi|512923641 Fatty acid-binding protein-like 5.04/6.7 16/16.44 5 33% 200 Lipid binding, transporter activity
c20 up 8.06 gi|512917297 Fatty acid-binding protein 1-like isoform X1 6.59/6.67 15/15.61 7 71% 573 Lipid binding, transporter activity
Spot no.a
BC9- vs. P50-b
Ratiob Accession
no.c Protein namec
Theoretical/ Observed PId
Theoretical/ Observed MW
(kDa)d
Matched unique
peptidese
Sequence coverage (%)e
Protein scoree
Molecular/biological functionf
c21 down 4.29 gi|512907055 Grpe protein homologue, mitochondrial 6.97/6.2 24/21.21 6 44% 491 Adenyl-nucleotide exchange factor activity, protein folding
c23 down 2.13 gi|114051229 Microtubule-associated protein RP/EB family member 3
5.48/6.27 31/29.98 9 37% 829
c24 down 2.15 gi|291045214 Isopentenyl-diphosphate delta isomerase 6.37/6.57 30/27.16 8 31% 325 Hydrolase isopentenyl-diphosphate delta-isomerase activity, isoprenoid biosynthetic process
c25 down 2.53 gi|512892238 Carbonic anhydrase 2 5.92/6.41 31/27.45 5 28% 420 Carbonate dehydratase activity, one-carbon metabolic process c26 down 2.32 gi|160333678 Glutathione S-transferase sigma 2 5.85/6.89 23/24.17 9 53% 864 Transferase activity c27 down 4.37 gi|112982671 Ribosomal protein S12 5.79/6.21 15/15.97 6 75% 385 Structural constituent of ribosome, translation
c28 up 64.59 gi|49868 Beta-actin (aa 27-375) [Mus musculus] 5.78/6.13 39/32.55 5 19% 389 ATP binding, identical protein binding, kinesin binding, nitric-oxide-synthase binding, RNA polymerase II core promoter proximal region sequence-specific DNA binding
c29 up 72.24 gi|114051866 Isocitrate dehydrogenase 6.24/6.91 47/43.92 7 15% 329 Isocitrate dehydrogenase (NADP+) activity, magnesium ion binding, NAD binding, isocitrate metabolic process, tricarboxylic acid cycle
c30 up 2.96 gi|153792114 Phosphatidylethanolamine-binding protein isoform 2
5.96/5.81 22/20.57 5 39% 230 Defence response to Gram-negative/positive bacteria, regulation of antimicrobial humoral response
c31 up 9.61 gi|512902782 Uncharacterized protein LOC101738880 isoform X1
5.75/5.55 25/20.54 8 45% 791
c32 up 4.1 gi|4574740 Tat-binding protein-1 [Drosophila melanogaster]
5.39/5.73 48.4/49.32 3 13% 277 ATPase activity, ATP binding, proteasome-activating ATPase activity, TBP-class protein binding
c33 up 4.88 gi|51555848 Glycerol-3-phosphate dehydrogenase-2 5.62/6.4 39/31.69 10 34% 850 Glycerol-3-phosphate dehydrogenase [NAD+] activity, NAD binding, carbohydrate metabolic process, glycerol-3-phosphate catabolic process
c34 up 2.53 gi|114053311 26S protease regulatory subunit 6B 5.09/5.61 47/50.98 6 17% 337 ATP binding, peptidase activity, protein catabolic process c35 up 58.24 gi|347326520 DNA supercoiling factor 4.48/5.53 40/40.96 7 27% 476 Calcium ion binding
Spot no.a
BC9+ vs.
BC9-b Ratiob
Accession no.c
Protein namec Theoretical/ Observed PId
Theoretical/ Observed MW
(kDa)d
Matched unique
peptidese
Sequence coverage
(%)e
Protein scoree
Molecular/biological functionf
c36 down 2.79 gi|512891246 Proteasome subunit alpha type-1 isoform X2
6.01/6.82 31/31.02 8 39% 516 Endopeptidase activity, threonine-type endopeptidase activity
c37 up 136.6 gi|512934137 Selenium-binding protein 1 isoform X2
5.68/6.42 53/52.96 5 15% 298 Selenium binding
c38 up 4.9 gi|512914963 Probable methylmalonate-semialdehyde dehydrogenase [acylating]
7.59/7.36 56/54.89 10 23% 758
Aldehyde dehydrogenase (NAD) activity, fatty-acyl-CoA binding, methylmalonate semialdehyde dehydrogenase (acylating) activity, thymine metabolic process, valine metabolic process
c39 up 10.69 gi|156255210 L-lactate dehydrogenase 6.76/7.72 37/33.93 3 9% 172 L-lactate dehydrogenase activity, carbohydrate metabolic process, carboxylic acid metabolic process
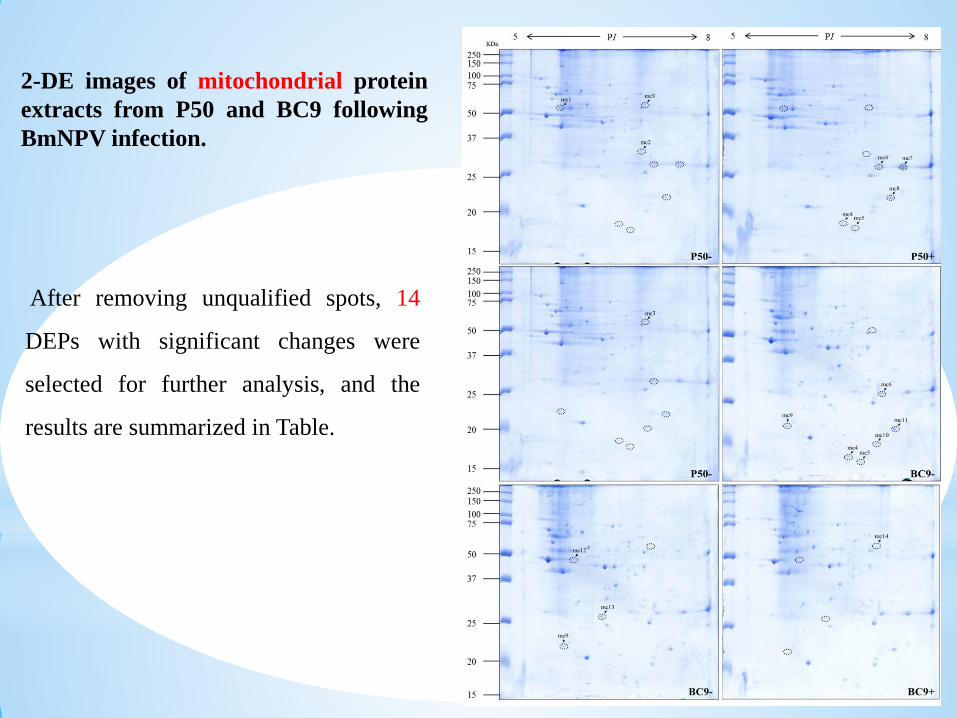
2-DE images of mitochondrial proteinextracts from P50 and BC9 followingBmNPV infection.
After removing unqualified spots, 14
DEPs with significant changes were
selected for further analysis, and the
results are summarized in Table.
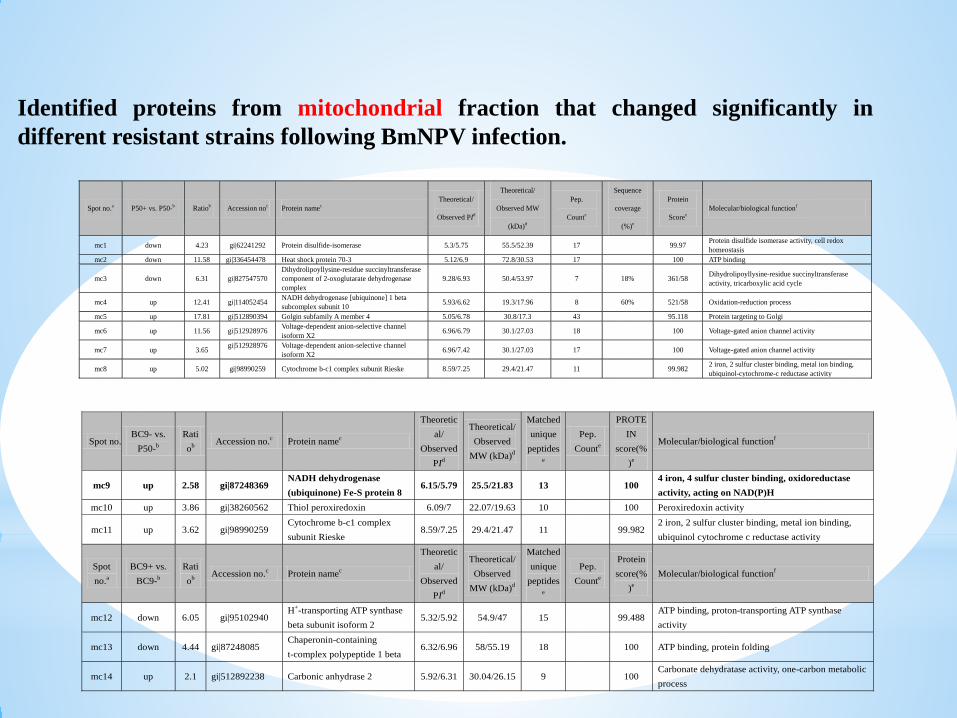
Identified proteins from mitochondrial fraction that changed significantly indifferent resistant strains following BmNPV infection.
Spot no.a P50+ vs. P50-b Ratiob Accession noc Protein namec Theoretical/
Observed PId
Theoretical/
Observed MW
(kDa)d
Pep.
Counte
Sequence
coverage
(%)e
Protein
Scoree Molecular/biological functionf
mc1 down 4.23 gi|62241292 Protein disulfide-isomerase 5.3/5.75 55.5/52.39 17 99.97 Protein disulfide isomerase activity, cell redox homeostasis
mc2 down 11.58 gi|336454478 Heat shock protein 70-3 5.12/6.9 72.8/30.53 17 100 ATP binding
mc3 down 6.31 gi|827547570 Dihydrolipoyllysine-residue succinyltransferase component of 2-oxoglutarate dehydrogenase complex
9.28/6.93 50.4/53.97 7 18% 361/58 Dihydrolipoyllysine-residue succinyltransferase activity, tricarboxylic acid cycle
mc4 up 12.41 gi|114052454 NADH dehydrogenase [ubiquinone] 1 beta subcomplex subunit 10 5.93/6.62 19.3/17.96 8 60% 521/58 Oxidation-reduction process
mc5 up 17.81 gi|512890394 Golgin subfamily A member 4 5.05/6.78 30.8/17.3 43 95.118 Protein targeting to Golgi
mc6 up 11.56 gi|512928976 Voltage-dependent anion-selective channel isoform X2 6.96/6.79 30.1/27.03 18 100 Voltage-gated anion channel activity
mc7 up 3.65 gi|512928976
Voltage-dependent anion-selective channel isoform X2 6.96/7.42 30.1/27.03 17 100 Voltage-gated anion channel activity
mc8 up 5.02 gi|98990259 Cytochrome b-c1 complex subunit Rieske 8.59/7.25 29.4/21.47 11 99.982 2 iron, 2 sulfur cluster binding, metal ion binding, ubiquinol-cytochrome-c reductase activity
Spot no. BC9- vs.
P50-b Ratiob
Accession no.c Protein namec
Theoretical/
Observed PId
Theoretical/ Observed
MW (kDa)d
Matched unique
peptidese
Pep. Counte
PROTEIN
score(%)e
Molecular/biological functionf
mc9 up 2.58 gi|87248369 NADH dehydrogenase (ubiquinone) Fe-S protein 8
6.15/5.79 25.5/21.83 13 100 4 iron, 4 sulfur cluster binding, oxidoreductase activity, acting on NAD(P)H
mc10 up 3.86 gi|38260562 Thiol peroxiredoxin 6.09/7 22.07/19.63 10 100 Peroxiredoxin activity
mc11 up 3.62 gi|98990259 Cytochrome b-c1 complex subunit Rieske
8.59/7.25 29.4/21.47 11 99.982 2 iron, 2 sulfur cluster binding, metal ion binding, ubiquinol cytochrome c reductase activity
Spot no.a
BC9+ vs. BC9-b
Ratiob
Accession no.c Protein namec
Theoretical/
Observed PId
Theoretical/ Observed
MW (kDa)d
Matched unique
peptidese
Pep. Counte
Protein score(%
)e Molecular/biological functionf
mc12 down 6.05 gi|95102940 H+-transporting ATP synthase beta subunit isoform 2
5.32/5.92 54.9/47 15 99.488 ATP binding, proton-transporting ATP synthase activity
mc13 down 4.44 gi|87248085 Chaperonin-containing t-complex polypeptide 1 beta
6.32/6.96 58/55.19 18 100 ATP binding, protein folding
mc14 up 2.1 gi|512892238 Carbonic anhydrase 2 5.92/6.31 30.04/26.15 9 100 Carbonate dehydratase activity, one-carbon metabolic process
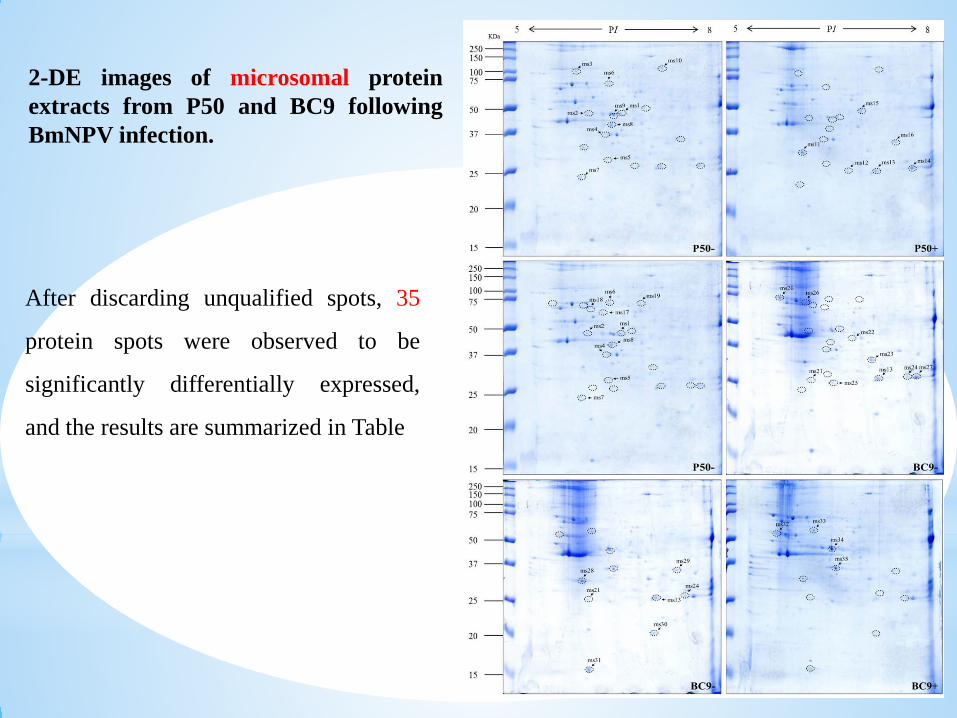
2-DE images of microsomal proteinextracts from P50 and BC9 followingBmNPV infection.
After discarding unqualified spots, 35
protein spots were observed to be
significantly differentially expressed,
and the results are summarized in Table
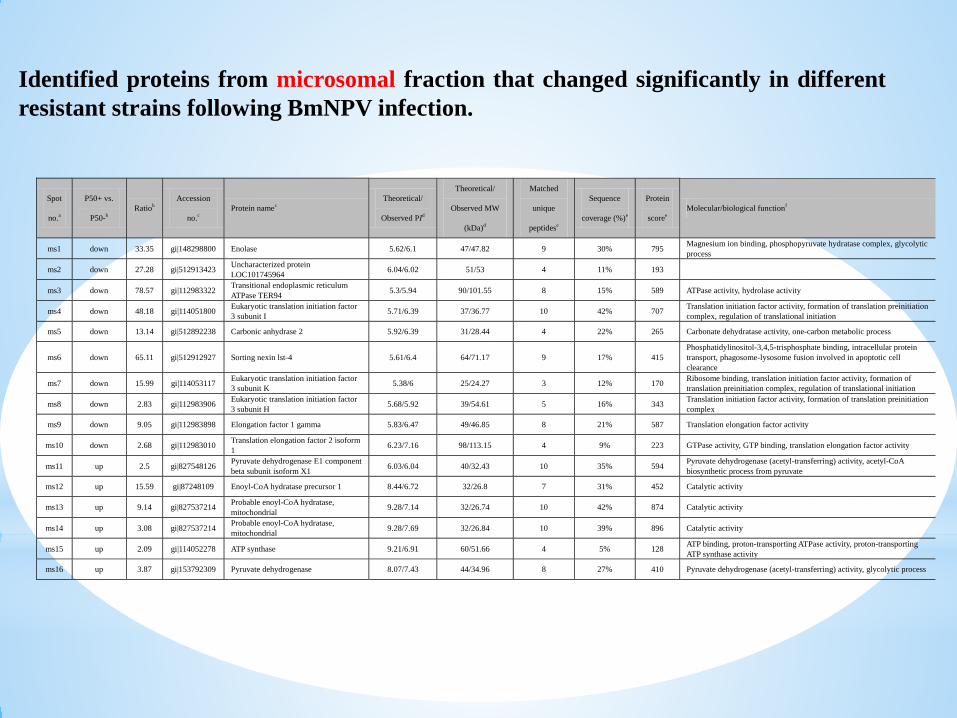
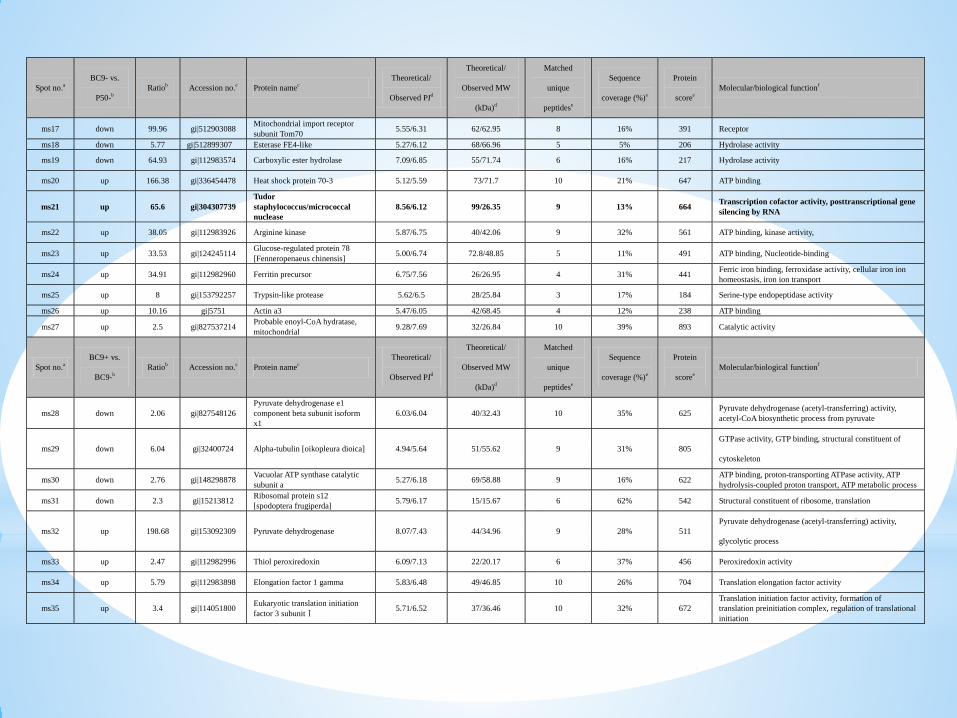
Identified proteins from microsomal fraction that changed significantly in differentresistant strains following BmNPV infection.
Spot
no.a
P50+ vs.
P50-b Ratiob
Accession
no.c Protein namec
Theoretical/
Observed PId
Theoretical/
Observed MW
(kDa)d
Matched
unique
peptidese
Sequence
coverage (%)e
Protein
scoree Molecular/biological functionf
ms1 down 33.35 gi|148298800 Enolase 5.62/6.1 47/47.82 9 30% 795 Magnesium ion binding, phosphopyruvate hydratase complex, glycolytic process
ms2 down 27.28 gi|512913423 Uncharacterized protein LOC101745964 6.04/6.02 51/53 4 11% 193
ms3 down 78.57 gi|112983322 Transitional endoplasmic reticulum ATPase TER94 5.3/5.94 90/101.55 8 15% 589 ATPase activity, hydrolase activity
ms4 down 48.18 gi|114051800 Eukaryotic translation initiation factor 3 subunit I 5.71/6.39 37/36.77 10 42% 707 Translation initiation factor activity, formation of translation preinitiation
complex, regulation of translational initiation
ms5 down 13.14 gi|512892238 Carbonic anhydrase 2 5.92/6.39 31/28.44 4 22% 265 Carbonate dehydratase activity, one-carbon metabolic process
ms6 down 65.11 gi|512912927 Sorting nexin lst-4 5.61/6.4 64/71.17 9 17% 415 Phosphatidylinositol-3,4,5-trisphosphate binding, intracellular protein transport, phagosome-lysosome fusion involved in apoptotic cell clearance
ms7 down 15.99 gi|114053117 Eukaryotic translation initiation factor 3 subunit K 5.38/6 25/24.27 3 12% 170 Ribosome binding, translation initiation factor activity, formation of
translation preinitiation complex, regulation of translational initiation
ms8 down 2.83 gi|112983906 Eukaryotic translation initiation factor 3 subunit H 5.68/5.92 39/54.61 5 16% 343 Translation initiation factor activity, formation of translation preinitiation
complex
ms9 down 9.05 gi|112983898 Elongation factor 1 gamma 5.83/6.47 49/46.85 8 21% 587 Translation elongation factor activity
ms10 down 2.68 gi|112983010 Translation elongation factor 2 isoform 1 6.23/7.16 98/113.15 4 9% 223 GTPase activity, GTP binding, translation elongation factor activity
ms11 up 2.5 gi|827548126 Pyruvate dehydrogenase E1 component beta subunit isoform X1 6.03/6.04 40/32.43 10 35% 594 Pyruvate dehydrogenase (acetyl-transferring) activity, acetyl-CoA
biosynthetic process from pyruvate
ms12 up 15.59 gi|87248109 Enoyl-CoA hydratase precursor 1 8.44/6.72 32/26.8 7 31% 452 Catalytic activity
ms13 up 9.14 gi|827537214 Probable enoyl-CoA hydratase, mitochondrial 9.28/7.14 32/26.74 10 42% 874 Catalytic activity
ms14 up 3.08 gi|827537214 Probable enoyl-CoA hydratase, mitochondrial 9.28/7.69 32/26.84 10 39% 896 Catalytic activity
ms15 up 2.09 gi|114052278 ATP synthase 9.21/6.91 60/51.66 4 5% 128 ATP binding, proton-transporting ATPase activity, proton-transporting ATP synthase activity
ms16 up 3.87 gi|153792309 Pyruvate dehydrogenase 8.07/7.43 44/34.96 8 27% 410 Pyruvate dehydrogenase (acetyl-transferring) activity, glycolytic process
Spot no.a BC9- vs.
P50-b Ratiob Accession no.c Protein namec
Theoretical/
Observed PId
Theoretical/
Observed MW
(kDa)d
Matched
unique
peptidese
Sequence
coverage (%)e
Protein
scoree Molecular/biological functionf
ms17 down 99.96 gi|512903088 Mitochondrial import receptor subunit Tom70 5.55/6.31 62/62.95 8 16% 391 Receptor
ms18 down 5.77 gi|512899307 Esterase FE4-like 5.27/6.12 68/66.96 5 5% 206 Hydrolase activity
ms19 down 64.93 gi|112983574 Carboxylic ester hydrolase 7.09/6.85 55/71.74 6 16% 217 Hydrolase activity
ms20 up 166.38 gi|336454478 Heat shock protein 70-3 5.12/5.59 73/71.7 10 21% 647 ATP binding
ms21 up 65.6 gi|304307739 Tudor staphylococcus/micrococcal nuclease
8.56/6.12 99/26.35 9 13% 664 Transcription cofactor activity, posttranscriptional gene silencing by RNA
ms22 up 38.05 gi|112983926 Arginine kinase 5.87/6.75 40/42.06 9 32% 561 ATP binding, kinase activity,
ms23 up 33.53 gi|124245114 Glucose-regulated protein 78 [Fenneropenaeus chinensis] 5.00/6.74 72.8/48.85 5 11% 491 ATP binding, Nucleotide-binding
ms24 up 34.91 gi|112982960 Ferritin precursor 6.75/7.56 26/26.95 4 31% 441 Ferric iron binding, ferroxidase activity, cellular iron ion homeostasis, iron ion transport
ms25 up 8 gi|153792257 Trypsin-like protease 5.62/6.5 28/25.84 3 17% 184 Serine-type endopeptidase activity
ms26 up 10.16 gi|5751 Actin a3 5.47/6.05 42/68.45 4 12% 238 ATP binding
ms27 up 2.5 gi|827537214 Probable enoyl-CoA hydratase, mitochondrial 9.28/7.69 32/26.84 10 39% 893 Catalytic activity
Spot no.a BC9+ vs.
BC9-b Ratiob Accession no.c Protein namec
Theoretical/
Observed PId
Theoretical/
Observed MW
(kDa)d
Matched
unique
peptidese
Sequence
coverage (%)e
Protein
scoree Molecular/biological functionf
ms28 down 2.06 gi|827548126 Pyruvate dehydrogenase e1 component beta subunit isoform x1
6.03/6.04 40/32.43 10 35% 625 Pyruvate dehydrogenase (acetyl-transferring) activity, acetyl-CoA biosynthetic process from pyruvate
ms29 down 6.04 gi|32400724 Alpha-tubulin [oikopleura dioica] 4.94/5.64 51/55.62 9 31% 805 GTPase activity, GTP binding, structural constituent of
cytoskeleton
ms30 down 2.76 gi|148298878 Vacuolar ATP synthase catalytic subunit a 5.27/6.18 69/58.88 9 16% 622 ATP binding, proton-transporting ATPase activity, ATP
hydrolysis-coupled proton transport, ATP metabolic process
ms31 down 2.3 gi|15213812 Ribosomal protein s12 [spodoptera frugiperda] 5.79/6.17 15/15.67 6 62% 542 Structural constituent of ribosome, translation
ms32 up 198.68 gi|153092309 Pyruvate dehydrogenase 8.07/7.43 44/34.96 9 28% 511 Pyruvate dehydrogenase (acetyl-transferring) activity,
glycolytic process
ms33 up 2.47 gi|112982996 Thiol peroxiredoxin 6.09/7.13 22/20.17 6 37% 456 Peroxiredoxin activity
ms34 up 5.79 gi|112983898 Elongation factor 1 gamma 5.83/6.48 49/46.85 10 26% 704 Translation elongation factor activity
ms35 up 3.4 gi|114051800 Eukaryotic translation initiation factor 3 subunitⅠ 5.71/6.52 37/36.46 10 32% 672
Translation initiation factor activity, formation of translation preinitiation complex, regulation of translational initiation
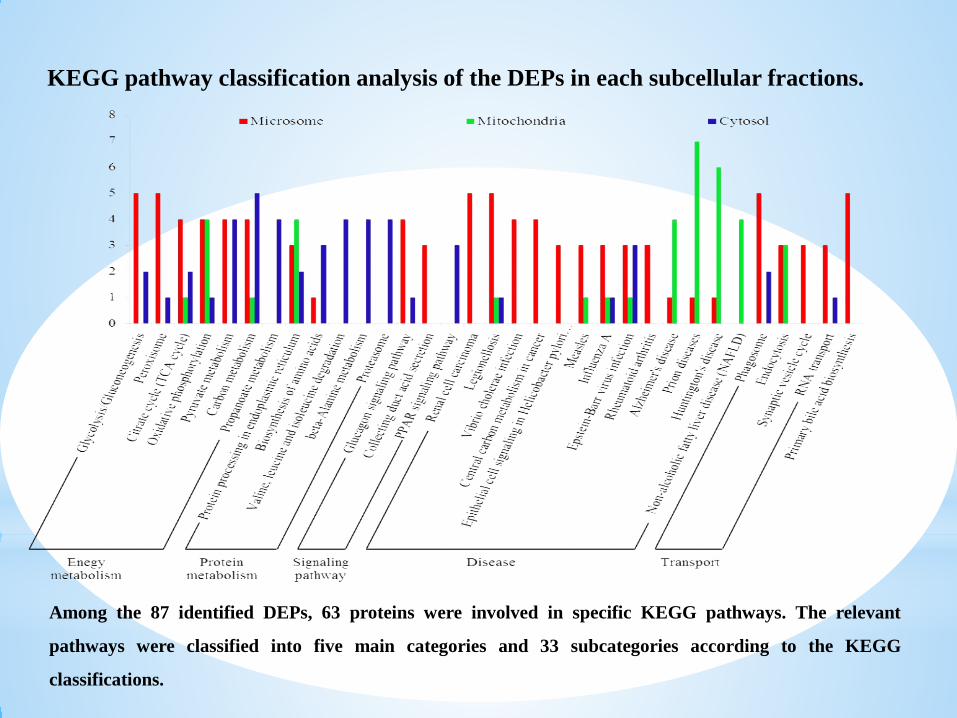
KEGG pathway classification analysis of the DEPs in each subcellular fractions.
Among the 87 identified DEPs, 63 proteins were involved in specific KEGG pathways. The relevant
pathways were classified into five main categories and 33 subcategories according to the KEGG
classifications.
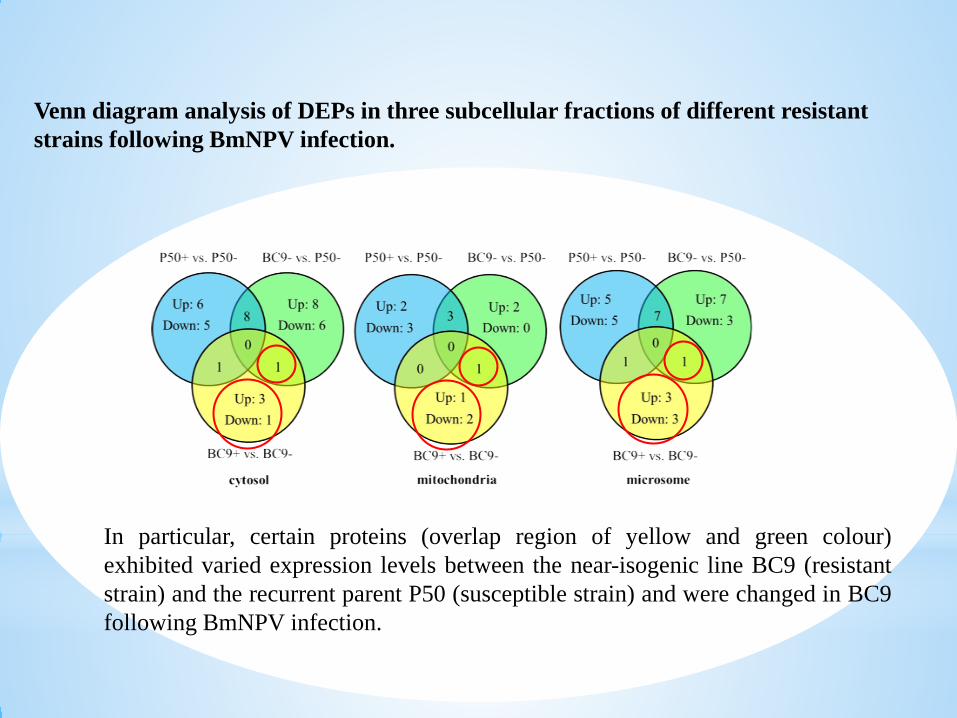
Venn diagram analysis of DEPs in three subcellular fractions of different resistant strains following BmNPV infection.
In particular, certain proteins (overlap region of yellow and green colour)exhibited varied expression levels between the near-isogenic line BC9 (resistantstrain) and the recurrent parent P50 (susceptible strain) and were changed in BC9following BmNPV infection.
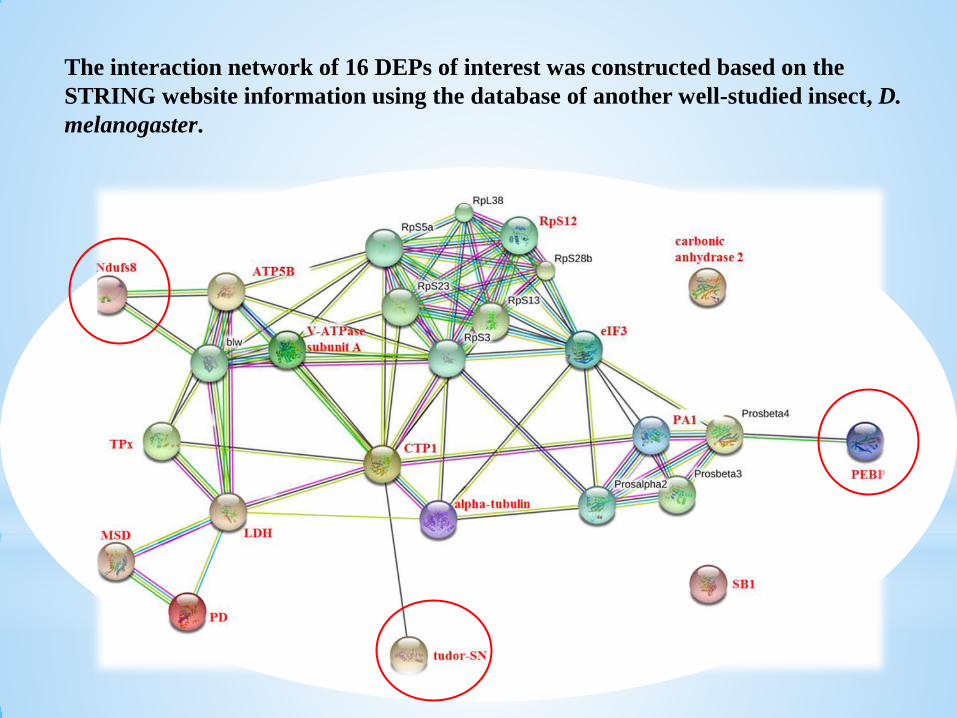
The interaction network of 16 DEPs of interest was constructed based on the STRING website information using the database of another well-studied insect, D. melanogaster.

Enlarged spot images and RT-qPCR analysisof the expression levels of anti-BmNPV-relevant DEPs.
Eight proteins exhibited highly similar
differential expression patterns at the
translational and transcriptional levels in
BC9 following infection. Additionally,
nearly all of these proteins exhibited
significant differences in expression in BC9
following infection.