Oregon State Lotterylibrary.state.or.us/repository/.../audits_pages_state_audits...31.pdfThe Oregon...
63
-
Upload
dangnguyet -
Category
Documents
-
view
218 -
download
3
Transcript of Oregon State Lotterylibrary.state.or.us/repository/.../audits_pages_state_audits...31.pdfThe Oregon...


Oregon State Lottery An Enterprise Fund of the State of Oregon
Comprehensive Annual Financial Report For the Fiscal Year Ended June 30, 2012
Larry Niswender
Director
Kathy Ortega, CPA Chief Financial Officer
Report Prepared by:
Finance and Accounting Support Services Division, Oregon State Lottery
Jean Gabriel, CPA Martha Wildfang
i
COMPREHENSIVE ANNUAL FINANCIAL REPORT For The Fiscal Year Ended June 30, 2012
TABLE OF CONTENTS
Page
Introductory Section
Letter of Transmittal........................................................................................................................................... 2
Certificate of Achievement for Excellence in Financial Reporting ..................................................................... 6
Organization Chart with Principal Officials......................................................................................................... 7
Financial Section
Independent Auditor's Report........................................................................................................................... 10
Management’s Discussion and Analysis ......................................................................................................... 12
Basic Financial Statements:
Balance Sheet ........................................................................................................................................... 18
Statement of Revenues, Expenses and Changes in Fund Net Assets...................................................... 19
Statement of Cash Flows........................................................................................................................... 20
Notes to the Financial Statements............................................................................................................. 21
Required Supplementary Information:
Schedules of Funding Progress – Other Postemployment Benefit Plans ................................................. 38
Supplementary Information:
Budgetary Comparison Schedule.............................................................................................................. 40
Statistical Section
Index ................................................................................................................................................................ 42
Net Assets by Component ............................................................................................................................... 43
Changes in Net Assets .................................................................................................................................... 44
Sales by Product.............................................................................................................................................. 46
Product Percent of Total Sales ........................................................................................................................ 47
Top Ten Retailers ............................................................................................................................................ 48
Number of Lottery Retailers and Sales by County .......................................................................................... 49
Demographic and Economic Data – State of Oregon ..................................................................................... 50
Employment by Industry – State of Oregon..................................................................................................... 51
Demographic Profile of Oregon Lottery Players .............................................................................................. 52
Number of Employees ..................................................................................................................................... 54
Operating Indicators and Capital Asset Information ........................................................................................ 55
Other Reports
Report on Internal Control Over Financial Reporting and Compliance............................................................ 58

Introductory Section

2
November 16, 2012
To the Honorable Governor John A. Kitzhaber and Citizens of the State of Oregon:
We are pleased to provide you with the Comprehensive Annual Financial Report of the Oregon State Lottery (Lottery) for fiscal year ended June 30, 2012. This report is published to meet the requirement in state law for an annual accounting of financial activities.
Lottery management assumes full responsibility for the completeness and reliability of the information contained in this report, based upon a comprehensive framework of internal controls established for this purpose. Because the cost of internal controls should not exceed anticipated benefits, the objective is to provide reasonable rather than absolute assurance that the financial statements are free of any material misstatements.
The Secretary of State Audits Division, the constitutional auditor of public accounts in Oregon, audited the Lottery’s financial statements for the fiscal year ended June 30, 2012. The auditors used generally accepted auditing standards in conducting the engagement. Their unqualified opinion on the financial statements is the first component in the Financial Section of this report.
A narrative analysis of the Lottery’s financial performance for the fiscal year can be found in the Management’s Discussion and Analysis (MD&A) immediately following the independent auditor’s report. This letter of transmittal complements the MD&A and should be read in conjunction with it.
Profile of Oregon State Lottery
The Oregon State Lottery was created through the initiative process in November 1984 when voters approved an amendment to the Oregon Constitution that required the establishment and operation of a State Lottery. Initially, Lottery profits were earmarked to create jobs and further economic development. In May 1995, voters approved a Constitutional amendment allowing Lottery profits to be used for the financing of public education. Similarly, voters added state parks and salmon restoration projects to the list of allowable uses of Lottery proceeds in November 1998. Oregonians have voted to use Lottery profits for things that make Oregon a great place to live. The Lottery was established as a state agency to market and sell Lottery products to the public. Its statutory mandate requires it to operate the Lottery to produce the maximum amount of net revenues for the people of Oregon commensurate with the public good. Development of new products and game enhancements is a continual process in the effort to increase long-term revenues, while taking into consideration the potential impact of game decisions on problem gambling. The Lottery strives to promote responsible gambling by providing public information about problem gambling and the treatment available.
Through a network of 3,907 retailers, the Lottery offers players a broad mix of traditional games as well as
Video LotterySM. Traditional Lottery games include: Scratch-itsSM Instant Tickets, Keno, Powerball®,
MegabucksSM, RaffleSM, Win for LifeSM, Mega Millions®, Lucky LinesSM, and Pick 4SM. Video LotterySM is a product
sold on stand-alone Video LotterySM terminals located in bar and tavern retail establishments. The Lottery has
approximately 12,175 Video LotterySM terminals deployed throughout the state.

3
The Lottery, which is accounted for as a single enterprise fund, is entirely self-financed through its sales. Its operations are designed to fulfill its duty to develop, produce, and market Lottery games; pay winners and operating expenses; and remit the remaining net profits to the State. These net profits are transferred to the Oregon Economic Development Fund and are then distributed by the State to finance the various uses allowed by law. Through its business units, the Lottery provides services that are necessary to operate successfully including security, marketing, retailer support, finance, management and information services. Additional information about the Lottery is available on its web site at: http://www.oregonlottery.org. The Lottery is operated under the direction of a five-member commission, with the commissioners appointed by the Governor and confirmed by the Senate. The Commission directs the activities of the Lottery, including the adoption of rules for the security and integrity of operations. The Governor also appoints a Director, who serves as the chief administrator of the Lottery. The Director is responsible for operating the Lottery in accordance with state law and administrative rules and under the guidance of the Commission. For budgeting purposes, the Commission adopts an annual Financial Plan based on activities identified in Lottery’s annual Business Plan. The Financial Plan uses revenue forecasts prepared by the Oregon Department of Administrative Services, Office of Economic Analysis. Budgeted revenues and direct expenses (prizes, commissions, game vendor charges, and tickets) are revised quarterly for changes in revenue forecasts. Revisions to other expense items in the adopted budget must be approved by the Commission. The budget is prepared on the accrual basis of accounting. Actual expenses are monitored throughout the year for compliance with the approved budget and appropriate adjustments are approved if necessary. By law, expenses to operate the Lottery are limited to no more than 16 percent of total annual revenues. Since the Lottery’s first full year of operation in 1986 through fiscal year 2008, Lottery revenues demonstrated strong and consistent growth. Lottery revenues declined in fiscal year 2009 and 2010 due to the impacts of Oregon’s economic recession and the implementation of a statewide smoking ban in bars and taverns where Lottery products are sold. Revenues stabilized in 2011 with a slight improvement and further improved in 2012.
1Revenues based on gross receipts for traditional games and net receipts (after prizes) for video games.
Economic Condition and Outlook
According to the Oregon Office of Economic Analysis (OEA), Oregon’s job growth outpaced the national average during calendar years 2006 and 2007. During 2008, employment declined in Oregon by 0.7 percent, slightly more than the national decline of 0.6 percent. As the economic recession deepened, further job losses resulted in declines in 2009 and 2010 of 6.2 and 0.7 percent respectively. Job growth in 2011 for Oregon and the nation was 1.2 percent. For 2012, Oregon’s employment growth is expected to continue to be slow, at 1.2 percent, with job gains coming from hiring in the private sector.
-
200
400
600
800
1,000
1,200
1,400
1986
1987
1988
1989
1990
1991
1992
1993
1994
1995
1996
1997
1998
1999
2000
2001
2002
2003
2004
2005
2006
2007
2008
2009
2010
2011
2012
Revenue
s (
in m
illio
ns)
Fiscal Year
Total Oregon Lottery Revenues1 by Fiscal Year (1986 - 2012)

4
Oregon’s personal income is projected to increase from calendar year 2011 to 2012 by 2.9 percent. For 2013, OEA estimates that personal income will increase by 3.7 percent while wage and salary income will increase by 4.1 percent. Personal income is projected to increase by 4.9 percent in 2014, which is higher than the projected 4.6 percent increase for the nation. Wage and salary income in Oregon is expected to grow at a faster rate than the nation in 2014, with a projected increase of 4.6 percent as compared to 4.0 percent. Several factors currently facing the Oregon economy are prolonged housing market instability, European debt concerns and financial market instability, commodity price inflation, and the effects of various global economic issues.
Long-term Financial Planning
On a quarterly basis, the Office of Economic Analysis (OEA) forecasts Lottery earnings and distributions. In the September 2012 Economic and Revenue Forecast, the OEA projected a decrease in Lottery earnings for the 2011-2013 biennium from the prior forecast in June of 2012. The $17.0 million decrease to the forecast is as a result of slightly weaker expectations for consumer spending on Lottery products.
The Lottery uses a five-year Strategic Plan in conjunction with an annual Business Plan and annual budget to
plan and manage its operations. Lottery’s main strategic objective is to generate optimal revenue for public
use by offering a wide variety of market-responsive games that will appeal to diverse consumer markets and
successfully manage a broad distribution network. Among other efforts in support of this objective, the Lottery
is planning for the implementation of a new Video LotterySM central gaming system. This system is expected to
provide new game content and functionality that will increase operational efficiency. The system will also lay a
foundation for the long-term goal to upgrade or replace aging terminals with terminals that are designed on
the open standards G2S protocol. The implementation efforts are expected to occur over the next two fiscal
years.
Relevant Financial Policies
In order to provide resources for current operations and future investment, the Lottery Commission
established a contingency reserve fund. As authorized by the Commission, the available cash portion of this
reserve fund was increased from $55.0 million to $85.0 million during the year in an effort to provide
resources for the planned replacement of Video LotterySM terminals. At fiscal year end, the balance of $84.4
million of this contingency reserve was uncommitted.
The Lottery’s fiscal year 2013 budget is based on the June 2012 Economic and Revenue Forecast. In light of
economic conditions, the budget was developed by balancing the need to responsibly manage expenses
while taking proactive steps to maximize revenues for the State. The 2013 budget is conservative, but does
make investments in new Video LotterySM games to keep players interested and help reduce the impact of the
weak economic recovery on Lottery revenues.
Major Initiatives
The Lottery plans to update its game offerings on the IGT TrimLine, Spielo prodiGiVuTM, and Bally
CineVisionTM Video LotterySM terminals during fiscal year 2013. Some of these new games will continue to offer
players the potential to win prizes up to $10,000. This combination of refreshed games and games with higher
prizes will help to maintain the vitality and continued success of Lottery products.
Lottery is planning several initiatives to reach out to existing and new players. It will conduct a variety of
promotional activities such as on-premise and event-based promotions to create awareness, interest, and trial
of Video LotterySM line games. The Lottery will focus marketing efforts on Powerball® and Mega Millions®
games to increase jackpot visibility and expand playership. Two RaffleSM games will be offered in fiscal year
2013. In addition, the Lottery will continue to work in collaboration with the Oregon Council on Problem
Gambling and the Oregon Health Authority on problem gambling outreach.


7
Principal Officials of Oregon State Lottery
Elisa Dozono Commission Chair
Bill Ihle
Commission Vice Chair
Raul Valdivia Mary Wheat Amy Lowery Commissioner Commissioner Commissioner
Larry Niswender
Director
Organization Chart
Lottery
Commission
Lottery Director
Larry Niswender
D
Department of
State Police
Security Major Craig Durbin Assistant Director
Marketing & Retail Operations Stacy Shaw
Assistant Director
Support Services Jon Clontz
Assistant Director

8
This page intentionally left blank.

Financial Section
Office of the Secretary of State Audits Division Kate Brown Gary Blackmer Secretary of State Director Barry Pack 255 Capitol St. NE, Suite 500 Deputy Secretary of State Salem, OR 97310 (503) 986-2255 fax (503) 378-6767
10
The Honorable John Kitzhaber Governor of Oregon Elisa Dozono, Chair Oregon State Lottery Commission
INDEPENDENT AUDITOR’S REPORT
We have audited the accompanying financial statements of the Oregon State Lottery, as of and for the year ended June 30, 2012, as listed in the table of contents. These financial statements are the responsibility of the Oregon State Lottery’s management. Our responsibility is to express an opinion on these financial statements based on our audit.
We conducted our audit in accordance with auditing standards generally accepted in the United States of America and the standards applicable to financial audits contained in Government Auditing Standards, issued by the Comptroller General of the United States. Those standards require that we plan and perform the audit to obtain reasonable assurance about whether the financial statements are free of material misstatement. An audit includes consideration of internal control over financial reporting as a basis for designing audit procedures that are appropriate in the circumstances, but not for the purpose of expressing an opinion on the effectiveness of the Oregon State Lottery’s internal control over financial reporting. Accordingly, we express no such opinion. An audit also includes examining, on a test basis, evidence supporting the amounts and disclosures in the financial statements, assessing the accounting principles used and significant estimates made by management, as well as evaluating the overall financial statement presentation. We believe that our audit provides a reasonable basis for our opinion.
As discussed in Note 1, the financial statements of the Oregon State Lottery are intended to present the financial position, and the changes in financial position and cash flows that are attributable to the transactions of the Oregon State Lottery. They do not purport to, and do not, present fairly the financial position of the State of Oregon as of June 30, 2012, the changes in its financial position or its cash flows for the year then ended in conformity with accounting principles generally accepted in the United States of America.
In our opinion, the financial statements referred to previously present fairly, in all material respects, the financial position of the Oregon State Lottery as of June 30, 2012, and the changes in financial position and cash flows thereof for the year then ended in conformity with accounting principles generally accepted in the United States of America.
In accordance with Government Auditing Standards, we have also issued our report dated November 16, 2012, on our consideration of the Oregon State Lottery’s internal control over financial reporting and on our tests of its compliance with certain provisions of laws, regulations,
11
contracts, and grant agreements and other matters. The purpose of that report is to describe the scope of our testing of internal control over financial reporting and compliance and the results of that testing, and not to provide an opinion on the internal control over financial reporting or on compliance. That report is an integral part of an audit performed in accordance with Government Auditing Standards and should be considered in assessing the results of our audit. That report is presented separately in the Other Reports section as listed in the table of contents.
Accounting principles generally accepted in the United States of America require that management’s discussion and analysis and the schedules of funding progress as listed on the table of contents be presented to supplement the basic financial statements. Such information, although not a part of the basic financial statements, is required by the Governmental Accounting Standards Board who considers it to be an essential part of financial reporting for placing the basic financial statements in an appropriate operational, economic or historical context. We have applied certain limited procedures to the required supplementary information in accordance with auditing standards generally accepted in the United States of America, which consisted of inquiries of management about the methods of preparing the information and comparing the information for consistency with management’s responses to our inquiries, the basic financial statements, and other knowledge we obtained during our audit of the basic financial statements. We do not express an opinion or provide any assurance on the information because the limited procedures do not provide us with sufficient evidence to express an opinion or provide any assurance.
Our audit was conducted for the purpose of forming an opinion on the financial statements that collectively comprise the Oregon State Lottery’s financial statements. The budgetary comparison schedule, as listed in the table of contents, is presented for purposes of additional analysis and is not a required part of the financial statements. Such information is the responsibility of management and was derived from and relates directly to the underlying accounting and other records used to prepare the financial statements. The information has been subjected to the auditing procedures applied in the audit of the financial statements and certain additional procedures, including comparing and reconciling such information directly to the underlying accounting and other records used to prepare the financial statements or to the financial statements themselves, and other additional procedures in accordance with auditing standards generally accepted in the United States of America. In our opinion, the budgetary comparison schedule is fairly stated in all material respects in relation to the financial statements taken as a whole.
Our audit was conducted for the purpose of forming an opinion on the financial statements that collectively comprise the Oregon State Lottery’s basic financial statements. The introductory and statistical sections as listed in the table of contents are presented for the purposes of additional analysis and are not a required part of the basic financial statements. Such information has not been subjected to the auditing procedures applied in the audit of the basic financial statements, and accordingly, we do not express an opinion or provide any assurance on it.
OREGON AUDITS DIVISION
Kate Brown Secretary of State November 16, 2012

12
Oregon State Lottery Management’s Discussion and Analysis
This section of the Oregon State Lottery’s (Lottery) Comprehensive Annual Financial Report presents our discussion and analysis of the Lottery’s financial performance for the fiscal year ended June 30, 2012. This analysis is to be considered in conjunction with information in the transmittal letter of this report.
Financial Highlights
Sales of all Lottery products were $1.1 billion, an increase of 1.2 percent from fiscal year 2011.
Video LotterySM
revenue increased by $6.6 million from the prior fiscal year, and revenue from traditional games increased by $5.7 million.
Net assets (equity) increased by $3.0 million as a result of fiscal year operations.
The Lottery transferred $523.7 million to Oregon’s Economic Development Fund, which is $23.3 million less than the prior year.
Overview of the Financial Statements In addition to this discussion and analysis, the Financial Section of this annual report contains the basic financial statements, which include the fund financial statements and notes to the financial statements; required supplementary information; and an optional budgetary comparison schedule, which is presented as other supplementary information. The basic financial statements offer short-term and long-term financial information about the Oregon State Lottery, which is structured as a single enterprise fund. The required supplementary information contains a Schedule of Funding Progress and accompanying notes for two other postemployment benefit (OPEB) plans in which the Lottery participates: the Public Employees Benefit Board OPEB Plan and the Retiree Health Insurance Premium Account OPEB Plan. The budgetary comparison schedule presents budgeted and actual revenues and expenses for the fiscal year. In addition, a Statistical Section containing information regarding financial trends and revenue capacity as well as demographic, economic, and operating information is presented following the budgetary comparison schedule. The Balance Sheet provides information about the nature and amounts of investments in resources (assets) and obligations (liabilities) at the end of the fiscal year, with the difference between assets and liabilities reported as net assets (equity). All of the current year’s revenues and expenses are accounted for in the Statement of Revenues, Expenses, and Changes in Fund Net Assets. This statement measures the results of the Lottery’s operations over the past year. The primary purpose of the Statement of Cash Flows is to provide information about the Lottery’s cash receipts and cash payments during the reporting period. This statement reports cash receipts, cash payments, and net changes in cash resulting from operations, investing, and financing activities. The financial statements are prepared on the accrual basis of accounting in accordance with accounting principles generally accepted in the United States of America. Thus, expenses are recorded when liabilities are incurred and revenues are recognized when earned, not when received.

13
Analysis of Financial Position and Operations Total assets at June 30, 2012 were $540.6 million, a decrease of $13.5 million from the prior year. The change in assets consists primarily of a decrease in securities lending cash collateral, a decrease in net capital assets, and an increase in investments. Securities lending activity fluctuates based on the extent this activity is used by the Office of the State Treasurer for cash management purposes. The effect of accumulated depreciation during the year contributed to the net decrease in capital assets. An increase in the fair value of investments contributed to a larger balance of investments reported at year end.
Total liabilities decreased by $16.5 million from the prior year. A decrease of $13.7 million in obligations under securities lending and a decrease of $19.5 million in the amount due to the Economic Development Fund (EDF) contributed to the net change. The amount owed to the EDF at year end represents the fourth quarter earnings not yet transferred plus administrative savings. The amount due to the EDF at the end of fiscal year 2012 was lower than the prior year as a result of several factors. There were no administrative savings accrued for transfer for the fourth quarter of 2012 because the Lottery increased the contingency reserve limit. Revenues from traditional products were slightly lower in the fourth quarter than the prior year and prizes for traditional products were higher than the fourth quarter of the prior year. This reduced the amount of earnings not yet transferred at year end. These decreases in total liabilities were offset primarily by an increase in prize liability. In June 2012, a Win For Life
SM prize of $7.1 million was claimed but not yet paid as of June 30, which
contributed to the increase from the prior year. Lottery’s net assets for the current and prior fiscal year are summarized in Table 1 below:
2012 2011 Change
Current assets 377,528,565$ 385,764,314$ (8,235,749)$
Capital assets 43,161,242 62,805,601 (19,644,359)
Other noncurrent assets 119,864,999 105,525,111 14,339,888
Total assets 540,554,806 554,095,026 (13,540,220)
Current liabilities 274,365,810 313,474,875 (39,109,065)
Noncurrent liabilities 126,594,466 104,021,855 22,572,611
Total liabilities 400,960,276 417,496,730 (16,536,454)
Net assets:
Invested in capital assets, net 43,161,242 62,805,601 (19,644,359)
Unrestricted 96,433,288 73,792,695 22,640,593
Total net assets 139,594,530$ 136,598,296$ 2,996,234$
Table 1: Oregon State Lottery's Net Assets
A portion of the Lottery’s net assets (30.9 percent) reflects its investment in capital assets, primarily Video
LotterySM gaming terminals and ticket vending machines. The Lottery has no outstanding debt associated with
its capital assets.
Of the $96.4 million in unrestricted net assets at year end, $5.3 million was committed for the deployment of
new Video LotterySM games into the market. An additional $933,925 was committed for the purchase of other
capital assets that will be used to support operations.
14
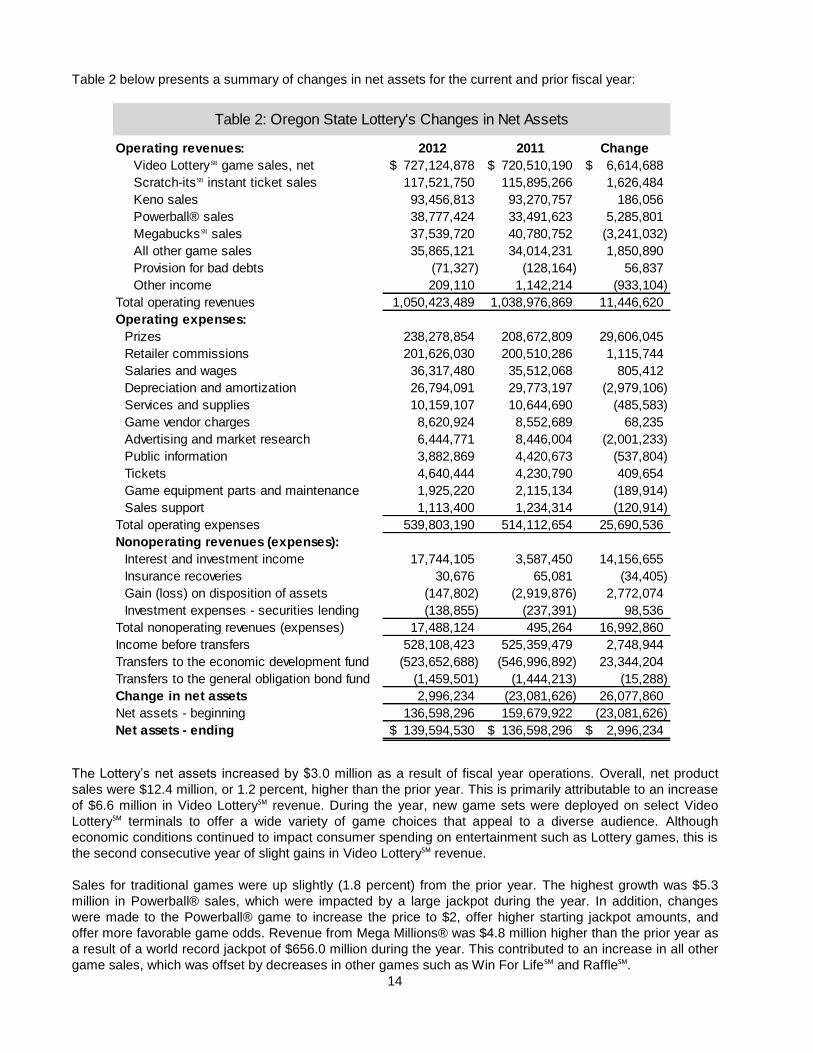
Table 2 below presents a summary of changes in net assets for the current and prior fiscal year:
Operating revenues: 2012 2011 Change
Video Lottery℠ game sales, net 727,124,878$ 720,510,190$ 6,614,688$
Scratch-its℠ instant ticket sales 117,521,750 115,895,266 1,626,484
Keno sales 93,456,813 93,270,757 186,056
Powerball® sales 38,777,424 33,491,623 5,285,801
Megabucks℠ sales 37,539,720 40,780,752 (3,241,032)
All other game sales 35,865,121 34,014,231 1,850,890
Provision for bad debts (71,327) (128,164) 56,837
Other income 209,110 1,142,214 (933,104)
Total operating revenues 1,050,423,489 1,038,976,869 11,446,620
Operating expenses:
Prizes 238,278,854 208,672,809 29,606,045
Retailer commissions 201,626,030 200,510,286 1,115,744
Salaries and wages 36,317,480 35,512,068 805,412
Depreciation and amortization 26,794,091 29,773,197 (2,979,106)
Services and supplies 10,159,107 10,644,690 (485,583)
Game vendor charges 8,620,924 8,552,689 68,235
Advertising and market research 6,444,771 8,446,004 (2,001,233)
Public information 3,882,869 4,420,673 (537,804)
Tickets 4,640,444 4,230,790 409,654
Game equipment parts and maintenance 1,925,220 2,115,134 (189,914)
Sales support 1,113,400 1,234,314 (120,914)
Total operating expenses 539,803,190 514,112,654 25,690,536
Nonoperating revenues (expenses):
Interest and investment income 17,744,105 3,587,450 14,156,655
Insurance recoveries 30,676 65,081 (34,405)
Gain (loss) on disposition of assets (147,802) (2,919,876) 2,772,074
Investment expenses - securities lending (138,855) (237,391) 98,536
Total nonoperating revenues (expenses) 17,488,124 495,264 16,992,860
Income before transfers 528,108,423 525,359,479 2,748,944
Transfers to the economic development fund (523,652,688) (546,996,892) 23,344,204
Transfers to the general obligation bond fund (1,459,501) (1,444,213) (15,288)
Change in net assets 2,996,234 (23,081,626) 26,077,860
Net assets - beginning 136,598,296 159,679,922 (23,081,626)
Net assets - ending 139,594,530$ 136,598,296$ 2,996,234$
Table 2: Oregon State Lottery's Changes in Net Assets
The Lottery’s net assets increased by $3.0 million as a result of fiscal year operations. Overall, net product
sales were $12.4 million, or 1.2 percent, higher than the prior year. This is primarily attributable to an increase
of $6.6 million in Video LotterySM revenue. During the year, new game sets were deployed on select Video
LotterySM terminals to offer a wide variety of game choices that appeal to a diverse audience. Although
economic conditions continued to impact consumer spending on entertainment such as Lottery games, this is
the second consecutive year of slight gains in Video LotterySM revenue.
Sales for traditional games were up slightly (1.8 percent) from the prior year. The highest growth was $5.3
million in Powerball® sales, which were impacted by a large jackpot during the year. In addition, changes
were made to the Powerball® game to increase the price to $2, offer higher starting jackpot amounts, and
offer more favorable game odds. Revenue from Mega Millions® was $4.8 million higher than the prior year as
a result of a world record jackpot of $656.0 million during the year. This contributed to an increase in all other
game sales, which was offset by decreases in other games such as Win For LifeSM and RaffleSM.

15
Retailer commissions were 0.6 percent higher than the prior year generally as a result of increased sales.
Commission rates paid by retailers vary based on the games offered (traditional or video) and the retailers’
sales volume. Traditional prize expenses were $29.6 million higher than the prior year due to a combination of
two main factors. The increase in fair value of investments being held to fund prizes with long-term payments
was greater than the prior year, which resulted in an increase in prize expenses. In addition, a significant Win
For LifeSM jackpot prize was won, resulting in a higher prize expense for that game this year. Since revenues
for Video LotterySM are reported net of prizes awarded, the prize expenses in Table 2 include only traditional
game prizes.
Depreciation expense was $3.0 million lower than last year mainly due to the business decision during the
fiscal year to change the estimated useful life of Video LotterySM terminals from five to seven years. In an effort
to delay outlays needed for replacement, the terminals are generally expected to be in service longer. Advertising and market research expenses were $2.0 million less than last year as a result of decisions made to reduce administrative expenses in the current economic conditions. Interest and investment income increased by $14.2 million as a result of an increase in the market value of investments.
The increase in overall net sales and responsible management of administrative expenses enabled the
Lottery to transfer $523.7 million to Oregon’s Economic Development Fund. The amount transferred was
$23.3 million less than the prior year because the Lottery is retaining working capital for future upgrade and
replacement of Video LotterySM terminals.
Sales Revenue Figure 1 below shows the major sources and percentages of sales revenue for fiscal year 2012:
Video LotterySM remains the largest source of revenue and represents 69.2 percent of total sales revenue. In
fiscal year 2012, the Lottery completed the deployment of new games on select Vidoe LotterySM terminals,
including games that offer prizes up to $10,000. While Video LotterySM remains an excellent source of
continuing revenue for the State, the Lottery actively seeks to promote responsible gambling behavior.
Video LotterySM 69.2%
Scratch-itsSM 11.2%
Keno 8.9%
Powerball® 3.7%
MegabucksSM 3.6%
All Other Games 3.4%
Figure 1: Sales Revenue by Product

16
Sales of Scratch-itsSM
were the second largest source of revenue (11.2 percent) during fiscal year 2012. One of Lottery’s marketing campaigns promoted the Holiday Sweater Scratch-it
SM ticket, which contributed to
successful holiday ticket sales. In addition, the Lottery continued to introduce a variety of new scratch ticket games at various price points in an effort to maximize revenues for the State. Keno represented 8.9 percent of total sales revenue for the fiscal year.
Capital Assets The Lottery’s investment in capital assets for the current and prior fiscal year is shown in Table 3 below. The majority of capital assets used in operations are equipment such as Video Lottery
SM gaming terminals and
ticket vending machines.
2012 2011 Change
Equipment 24,801,137$ 45,214,095$ (20,412,958)$
Computer software 9,727,885 8,450,878 1,277,007
Buildings and improvements 6,742,981 7,152,863 (409,882)
Vehicles 1,870,967 1,925,156 (54,189)
Leasehold improvements 18,272 62,609 (44,337)
Total 43,161,242$ 62,805,601$ (19,644,359)$
Table 3: Oregon State Lottery's Capital Assets, Net of Depreciation
During fiscal year 2012, net capital assets decreased by $19.6 million, a 31.3 percent decline. The net change is primarily attributed to depreciation expense for the year. The overall reduction was offset by an increase in computer software, as new Video Lottery
SM game sets were deployed to replace outdated games. As
previously mentioned, the Lottery had committed $6.2 million for capital expenses at June 30, 2012. Additional information on Lottery’s capital assets can be found in Note 6 of this report.
Factors Relevant to Future Operations The slow economic recovery underway in Oregon is expected to continue having an impact on sales of Lottery products. Oregon’s unemployment rate for August 2012 was 8.9 percent, slightly higher than the past seven months. Job growth for the second quarter of 2012 was 0.6 percent, which was slightly lower than the first quarter. To the extent that future economic conditions continue to impact discretionary consumer spending, net revenues generated through Lottery sales will likely be affected.

Basic
Financial
Statements
18
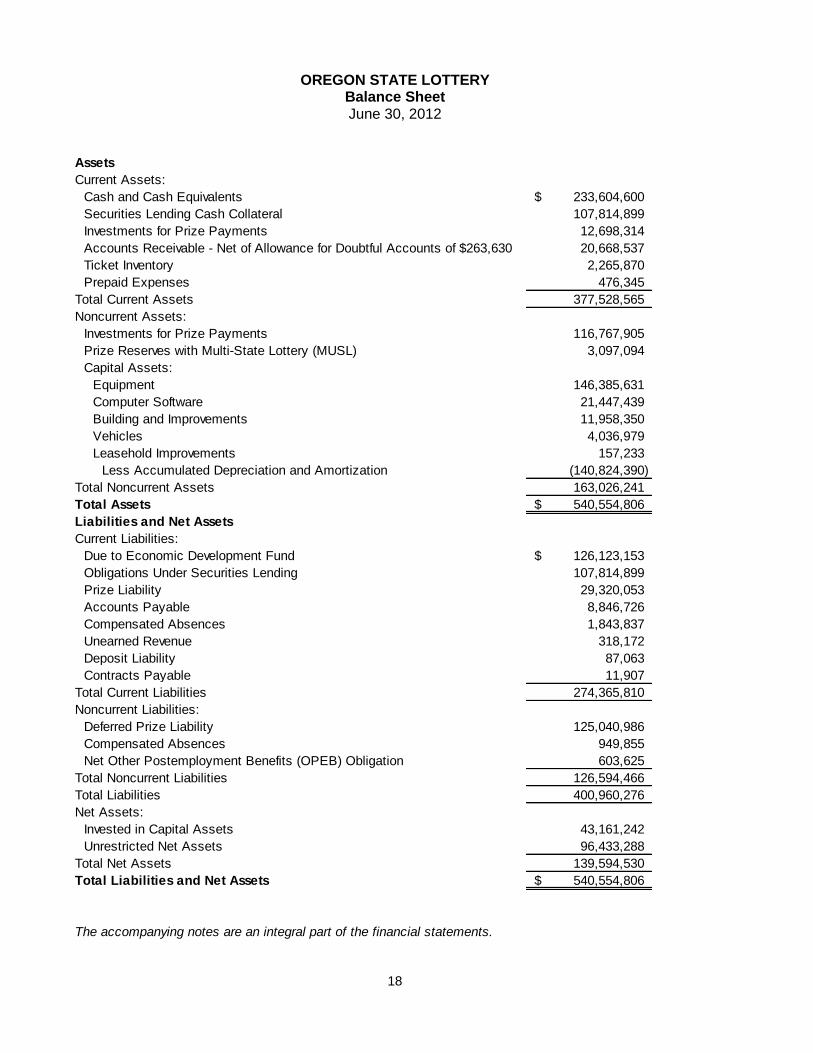
OREGON STATE LOTTERY Balance Sheet June 30, 2012
Assets
Current Assets:
Cash and Cash Equivalents 233,604,600$
Securities Lending Cash Collateral 107,814,899
Investments for Prize Payments 12,698,314
Accounts Receivable - Net of Allowance for Doubtful Accounts of $263,630 20,668,537
Ticket Inventory 2,265,870
Prepaid Expenses 476,345
Total Current Assets 377,528,565
Noncurrent Assets:
Investments for Prize Payments 116,767,905
Prize Reserves with Multi-State Lottery (MUSL) 3,097,094
Capital Assets:
Equipment 146,385,631
Computer Software 21,447,439
Building and Improvements 11,958,350
Vehicles 4,036,979
Leasehold Improvements 157,233
Less Accumulated Depreciation and Amortization (140,824,390)
Total Noncurrent Assets 163,026,241
Total Assets 540,554,806$
Liabilities and Net Assets
Current Liabilities:
Due to Economic Development Fund 126,123,153$
Obligations Under Securities Lending 107,814,899
Prize Liability 29,320,053
Accounts Payable 8,846,726
Compensated Absences 1,843,837
Unearned Revenue 318,172
Deposit Liability 87,063
Contracts Payable 11,907
Total Current Liabilities 274,365,810
Noncurrent Liabilities:
Deferred Prize Liability 125,040,986
Compensated Absences 949,855
Net Other Postemployment Benefits (OPEB) Obligation 603,625
Total Noncurrent Liabilities 126,594,466
Total Liabilities 400,960,276
Net Assets:
Invested in Capital Assets 43,161,242
Unrestricted Net Assets 96,433,288
Total Net Assets 139,594,530
Total Liabilities and Net Assets 540,554,806$
The accompanying notes are an integral part of the financial statements.

19
OREGON STATE LOTTERY Statement of Revenues, Expenses, and Changes in Fund Net Assets
For the Year Ended June 30, 2012
Operating Revenues
Sales:
Video Lottery℠ (Net Receipts) 727,124,878$
Scratch-its℠ Instant Tickets (Net of Returns) 117,521,750
Keno 93,456,813
Powerball® 38,777,424
Megabucks℠ 37,539,720
Mega Millions® 22,208,222
Win For Life℠ 5,545,700
Raffle℠ 4,999,650
Lucky Lines℠ 1,758,800
Pick 4℠ 1,352,749
Provision for Bad Debts (71,327)
Other Income 209,110
Total Operating Revenues 1,050,423,489
Operating Expenses
Prizes 238,278,854
Retailer Commissions 201,626,030
Salaries and Wages 36,317,480
Depreciation and Amortization 26,794,091
Services and Supplies 10,159,107
Game Vendor Charges 8,620,924
Advertising and Market Research 6,444,771
Public Information 3,882,869
Tickets 4,640,444
Game Equipment Parts and Maintenance 1,925,220
Sales Support 1,113,400
Total Operating Expenses 539,803,190
Operating Income 510,620,299
Nonoperating Revenues (Expenses)
Interest and Investment Income 17,744,105
Insurance Recoveries 30,676
Gain (Loss) on Disposition of Assets (147,802)
Investment Expenses - Securities Lending (138,855)
Total Nonoperating Revenues (Expenses) 17,488,124
Income Before Transfers 528,108,423
Transfers to the Economic Development Fund (523,652,688)
Transfers to the General Obligation Bond Fund (1,459,501)
Change in Net Assets 2,996,234
Net Assets - Beginning 136,598,296
Net Assets - Ending 139,594,530$
The accompanying notes are an integral part of the financial statements.
20
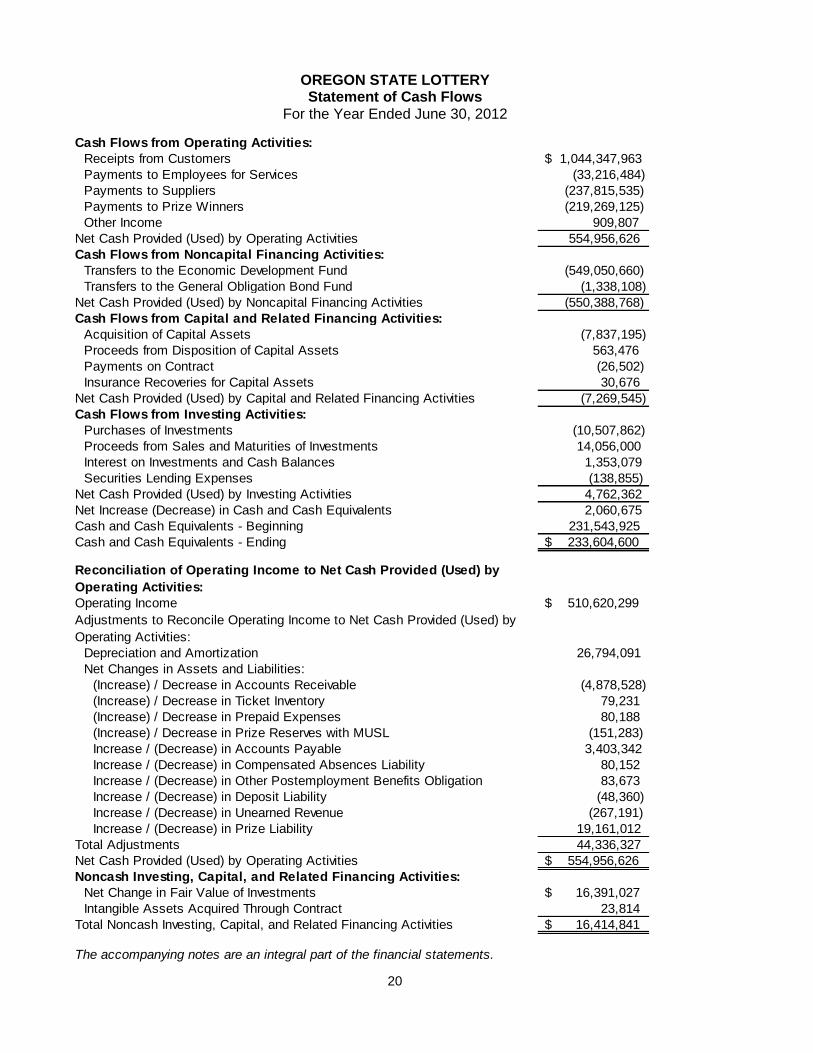
OREGON STATE LOTTERY Statement of Cash Flows
For the Year Ended June 30, 2012
Cash Flows from Operating Activities:
Receipts from Customers $ 1,044,347,963
Payments to Employees for Services (33,216,484)
Payments to Suppliers (237,815,535)
Payments to Prize Winners (219,269,125)
Other Income 909,807
Net Cash Provided (Used) by Operating Activities 554,956,626
Cash Flows from Noncapital Financing Activities:
Transfers to the Economic Development Fund (549,050,660)
Transfers to the General Obligation Bond Fund (1,338,108)
Net Cash Provided (Used) by Noncapital Financing Activities (550,388,768)
Cash Flows from Capital and Related Financing Activities:
Acquisition of Capital Assets (7,837,195)
Proceeds from Disposition of Capital Assets 563,476
Payments on Contract (26,502)
Insurance Recoveries for Capital Assets 30,676
Net Cash Provided (Used) by Capital and Related Financing Activities (7,269,545)
Cash Flows from Investing Activities:
Purchases of Investments (10,507,862)
Proceeds from Sales and Maturities of Investments 14,056,000
Interest on Investments and Cash Balances 1,353,079
Securities Lending Expenses (138,855)
Net Cash Provided (Used) by Investing Activities 4,762,362
Net Increase (Decrease) in Cash and Cash Equivalents 2,060,675
Cash and Cash Equivalents - Beginning 231,543,925
Cash and Cash Equivalents - Ending $ 233,604,600
Reconciliation of Operating Income to Net Cash Provided (Used) by
Operating Activities:
Operating Income $ 510,620,299
Adjustments to Reconcile Operating Income to Net Cash Provided (Used) by
Operating Activities:
Depreciation and Amortization 26,794,091
Net Changes in Assets and Liabilities:
(Increase) / Decrease in Accounts Receivable (4,878,528)
(Increase) / Decrease in Ticket Inventory 79,231
(Increase) / Decrease in Prepaid Expenses 80,188
(Increase) / Decrease in Prize Reserves with MUSL (151,283)
Increase / (Decrease) in Accounts Payable 3,403,342
Increase / (Decrease) in Compensated Absences Liability 80,152
Increase / (Decrease) in Other Postemployment Benefits Obligation 83,673
Increase / (Decrease) in Deposit Liability (48,360)
Increase / (Decrease) in Unearned Revenue (267,191)
Increase / (Decrease) in Prize Liability 19,161,012
Total Adjustments 44,336,327
Net Cash Provided (Used) by Operating Activities $ 554,956,626
Noncash Investing, Capital, and Related Financing Activities:
Net Change in Fair Value of Investments $ 16,391,027
Intangible Assets Acquired Through Contract 23,814
Total Noncash Investing, Capital, and Related Financing Activities $ 16,414,841
The accompanying notes are an integral part of the financial statements.

21
OREGON STATE LOTTERY Notes to the Financial Statements
June 30, 2012
1. Summary of Significant Accounting Policies
A. Reporting Entity
The Oregon State Lottery Commission (Commission) was created as an agency of the State of Oregon by enactment of Article XV, Section 4 (3), of the Oregon Constitution, an initiative measure approved by Oregon voters at the November 1984 general election. The Commission established the Oregon State Lottery (Lottery), which is an enterprise fund of the State of Oregon. The Lottery commenced operations to market and sell Lottery products to the public in January 1985. The net profits of the Lottery are transferred to the Oregon Economic Development Fund and are then distributed by the State of Oregon to finance the various public purposes allowed by law.
B. Measurement Focus, Basis of Accounting, and Financial Statement Presentation
The accompanying financial statements of the Lottery have been prepared in conformity with generally accepted accounting principles as prescribed by the Governmental Accounting Standards Board (GASB) and the Financial Accounting Standards Board (FASB). FASB standards of accounting and financial reporting issued prior to December 1, 1989 are followed for the Lottery’s financial statements to the extent that those standards do not conflict with or contradict GASB pronouncements. As allowed by GASB standards, the Lottery has elected not to follow subsequent FASB guidance.
The Lottery uses an enterprise fund, the Oregon State Lottery Fund, with a self-balancing set of accounts to record its assets, liabilities, net assets, revenues, and expenses. Enterprise funds account for activities that are financed and operated in a manner similar to private business enterprises.
Lottery financial statements are reported using the economic resources measurement focus and accrual basis of accounting. Revenues are recorded when earned and expenses are recorded when a liability is incurred, regardless of the timing of related cash flows.
Revenues and expenses are categorized as operating or nonoperating in the Statement of Revenues, Expenses and Changes in Fund Net Assets. Operating revenues and expenses are those that result from selling Lottery games to the public. Operating revenues include the sale of Lottery products and incidental revenues associated with operating the Lottery. Operating expenses include the cost of sales and services, administrative expenses, and depreciation on capital assets. Revenues and expenses that do not result from selling Lottery games, such as investment income and investment expenses, are reported as nonoperating revenues and expenses.
Assets and liabilities are classified on the Balance Sheet as current and noncurrent. Current assets are available, or will become available, within the next fiscal year to pay operating expenses and liabilities of the Lottery. Current liabilities are due in the next fiscal year. Noncurrent assets are not easily liquidated or are restricted for purposes other than payment of normal operations and liabilities. Noncurrent liability amounts are due in periods following the upcoming fiscal year.
Total net assets are segregated into two categories: invested in capital assets and unrestricted net assets. The Lottery has no outstanding debt associated with its capital assets. Article XV of the Oregon Constitution restricts the use of Lottery revenues for payment of prizes and administrative expenses, and remaining revenues are to be used for public purposes allowed in Article XV. Net proceeds not yet transferred are reflected in liabilities as the amount due to the Economic Development Fund. Net assets reported at year end will be used for Lottery operations.

Notes to the Financial Statements (continued) June 30, 2012
22
C. Sales Revenue
Revenues for MegabucksSM
, Powerball®, Mega Millions
®, Keno, Win for Life
SM, Raffle
SM, Pick 4
SM, and
Lucky LinesSM
(draw games) are recognized when the draws occur. Revenues for instant scratch ticket games are recognized when retailers activate ticket packs for sale to the public. Revenues for Video Lottery
SM games are recognized when sales to the public occur and are reported net of prizes
awarded (refer to Note 8 for more information on Video LotterySM
revenue and prize expense). All revenues are reported net of free plays, discounts, and allowances.
D. Unearned Revenue
All draw games can be purchased in advance of the drawings. When shares are sold in advance of the draw date, sales revenue is not yet earned. Unearned revenue includes revenue associated with shares that have been sold for draw dates after the June 30 fiscal year end.
E. Prize Expense
Instant ticket prize expense is estimated and recognized when ticket packs are activated and is based on the design of the game. Game designs include certain guaranteed prizes in each pack of tickets and prizes placed randomly by the gaming vendor. When validations for the game have ended, differences between estimated and actual prizes awarded for the randomly placed tickets are adjusted to prize expense and prize liability. Guaranteed prizes not claimed by winners are transferred to the Economic Development Fund.
Prize expense for draw games is recognized as drawings are held, based on the shares sold and the estimated or known cost of the prize payments. Prize expense is adjusted as prizes are claimed and the actual cost of the prize is known. Expense for prizes with long-term payments is recognized when the prize liability is recorded at the discounted present value of estimated future cash payments. Video Lottery
SM prize expense is recognized as game play completes and prizes are known. More
detailed information for Video LotterySM
is in Note 8.
The cost of Lottery products distributed through various promotional activities is included in ticket expense and any prizes (actual or estimated) are recorded in prize expense. The sales value of these products for the fiscal year ended June 30, 2012 was $89,158.
F. Prize Liability
Prize liability is recorded when the prize expense is recognized (see Note 1.E.) and is reported at the discounted present value of estimated future cash payments. Estimated and known prize payments due within one year of the financial statement date are recorded as a current liability and payments due later than the upcoming year are classified as a noncurrent liability. Unclaimed prizes (winning shares known to be sold and not presented for payment within one year from the draw date or official end of a game) are reclassified from Prize Liability to Due to Economic Development Fund.
G. Cash and Cash Equivalents
Cash and cash equivalents include cash on hand, test cash held by employees, and cash and investments held in the Oregon Short-Term Fund (OSTF). For purposes of the Statement of Cash Flows, all Lottery moneys held by the Office of the State Treasurer in the OSTF are considered to be cash equivalents. The OSTF is an investment pool that functions as a demand deposit account.
H. Investments
Investments are reported at fair value. The fair value of investments is determined using quoted market prices. Changes in the fair value of investments are recognized as investment income (loss) in the current year.
Notes to the Financial Statements (continued) June 30, 2012
23
I. Securities Lending
Securities lending amounts are reported at the value of the cash collateral received. The security lending liability is reported at the cash amount received as collateral.
J. Accounts Receivable
Accounts receivable is reported net of an allowance for uncollectible accounts. Receivables primarily consist of proceeds due from Lottery retailers. Most retailers selling Lottery products are required to remit weekly proceeds (Sunday through Saturday), less commissions, on the following Wednesday. Corporate accounts with multiple establishments may remit proceeds on the second Wednesday following the end of the business week.
K. Inventories
Inventories are valued at cost using the specific identification method. Ticket inventory consists of Scratch-its
SM instant tickets primarily stored in the Lottery warehouse. A small amount of inventory is
stored at retail establishments. Ticket inventory held in the warehouse is destroyed and recorded as an expense when distributions to retailers are no longer allowed. Tickets not sold at retail establishments are recorded as an expense when activations are no longer allowed.
L. Prize Reserves
Prize reserves held by the Multi-State Lottery (MUSL) are amounts held to indemnify participating lotteries for prizes that may be won. Should the Lottery decide against participation in MUSL, these amounts would be returned.
M. Capital Assets
Capital assets, which mainly include gaming equipment and related software, are reported at historical cost. Physical and intangible assets with a cost of $5,000 or more and a useful life of more than one year are capitalized. Beginning July 1, 2009, the Lottery elected to retroactively report internally generated intangible assets. Capital assets are depreciated using the straight-line method over the following estimated useful lives:
Assets Years
Buildings and improvements 10 to 40
Video lottery terminals 7
Instant ticket vending machines 5
Other machinery and equipment 3 to 8
Leasehold improvements 5
Vehicles 5
Computer hardware and software 3
Licensing agreements Term of contract
During the fiscal year, the estimated useful life of video lottery terminals was changed from five to seven years. This change in estimate increased the change in net assets for the fiscal year by approximately $2,164,000.
N. Compensated Absences
Employees earn annual vacation leave of 10 to 19.34 hours per month, depending upon length of service. All Lottery employees may accumulate a maximum of 350 hours per employee. Accumulated vacation leave and accumulated compensatory time is recorded as an expense and a liability (compensated absences) as the benefits accrue to employees. The compensated absences liability is calculated based upon salary rates in effect at fiscal year end and includes taxes and retirement
Notes to the Financial Statements (continued) June 30, 2012
24
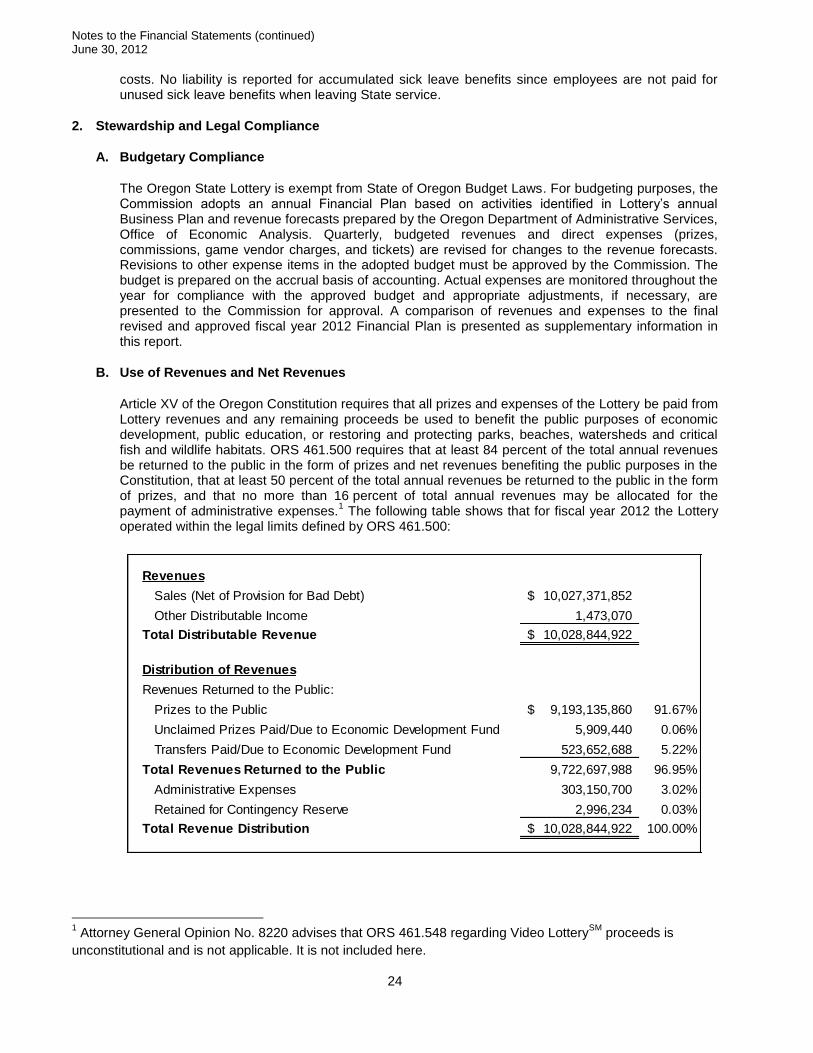
Revenues
Sales (Net of Provision for Bad Debt) 10,027,371,852$
Other Distributable Income 1,473,070
Total Distributable Revenue 10,028,844,922$
Distribution of Revenues
Revenues Returned to the Public:
Prizes to the Public 9,193,135,860$ 91.67%
Unclaimed Prizes Paid/Due to Economic Development Fund 5,909,440 0.06%
Transfers Paid/Due to Economic Development Fund 523,652,688 5.22%
Total Revenues Returned to the Public 9,722,697,988 96.95%
Administrative Expenses 303,150,700 3.02%
Retained for Contingency Reserve 2,996,234 0.03%
Total Revenue Distribution 10,028,844,922$ 100.00%
costs. No liability is reported for accumulated sick leave benefits since employees are not paid for unused sick leave benefits when leaving State service.
2. Stewardship and Legal Compliance
A. Budgetary Compliance
The Oregon State Lottery is exempt from State of Oregon Budget Laws. For budgeting purposes, the Commission adopts an annual Financial Plan based on activities identified in Lottery’s annual Business Plan and revenue forecasts prepared by the Oregon Department of Administrative Services, Office of Economic Analysis. Quarterly, budgeted revenues and direct expenses (prizes, commissions, game vendor charges, and tickets) are revised for changes to the revenue forecasts. Revisions to other expense items in the adopted budget must be approved by the Commission. The budget is prepared on the accrual basis of accounting. Actual expenses are monitored throughout the year for compliance with the approved budget and appropriate adjustments, if necessary, are presented to the Commission for approval. A comparison of revenues and expenses to the final revised and approved fiscal year 2012 Financial Plan is presented as supplementary information in this report.
B. Use of Revenues and Net Revenues
Article XV of the Oregon Constitution requires that all prizes and expenses of the Lottery be paid from Lottery revenues and any remaining proceeds be used to benefit the public purposes of economic development, public education, or restoring and protecting parks, beaches, watersheds and critical fish and wildlife habitats. ORS 461.500 requires that at least 84 percent of the total annual revenues be returned to the public in the form of prizes and net revenues benefiting the public purposes in the Constitution, that at least 50 percent of the total annual revenues be returned to the public in the form of prizes, and that no more than 16 percent of total annual revenues may be allocated for the payment of administrative expenses.
1 The following table shows that for fiscal year 2012 the Lottery
operated within the legal limits defined by ORS 461.500:
1 Attorney General Opinion No. 8220 advises that ORS 461.548 regarding Video Lottery
SM proceeds is
unconstitutional and is not applicable. It is not included here.

Notes to the Financial Statements (continued) June 30, 2012
25
C. Unclaimed Prizes
ORS 461.500 requires all unclaimed prizes to be allocated to the benefit of public purpose. Lottery administrative rules declare a prize as unclaimed when it is known that winning shares have been sold and have not been redeemed within one year of the end of the game, one year from the draw date, or one year from the date of issue. In fiscal year 2012, prizes in the amount of $5,909,440 were determined to be unclaimed and were either transferred or accrued for transfer to the Economic Development Fund.
D. Contingency Reserve
ORS 461.510 (4) and Administrative Rule 177-010-0045 allows for the creation of a contingency reserve. In May 2012, the Lottery Commission approved a contingency reserve amount such that the cash available for future investment does not exceed $85,000,000. The following table shows the liquidity detail of Unrestricted Net Assets shown on the Balance Sheet at June 30, 2012:
Cash Available for Future Investment (Uncommitted Contingency Reserve) 84,373,616$
Committed by Contract for Asset Purchases (See Note 12.A.) 4,642,556
Committed by Commission for Capital Purchases 1,577,807
Inventory, Prepaid Expenses, Prize Reserves 5,839,309
Total Unrestricted Net Assets 96,433,288$
E. Transfers to Economic Development Fund
All income remaining after increasing the contingency reserve (Note 2.D.) and Transfers to the General Obligation Bond Fund was accrued for Transfer to the Economic Development Fund. Actual cash transferred, including unclaimed prizes, during fiscal year 2012 was $549,050,660. The remaining balance is included on the Balance Sheet in liabilities. The following schedule reconciles the amounts:
Balance Owed at
June 30, 2011
Amounts
Accrued
Cash Paid to
Economic
Development
Balance
Remaining at
June 30, 2012
Income 144,657,872$ 523,652,688$ 543,643,419$ 124,667,141$
Unclaimed Prizes 953,813 5,909,440 5,407,241 1,456,012
Total 145,611,685$ 529,562,128$ 549,050,660$ 126,123,153$
3. Deposits
The Office of the State Treasurer maintains the Oregon Short-Term Fund (OSTF), an investment pool available for use by state agencies and local governments. The Lottery uses the OSTF for all deposits. A separate financial report for the OSTF may be obtained from the Office of the State Treasurer, 350 Winter Street NE, Suite 100, Salem, OR 97301-3896 or from the Treasurer’s website at http://treasury.oregon.gov/treasury/Divisions/Investment/Pages/Oregon-Short-Term-Fund-(OSTF).aspx.
The custodial credit risk for deposits is the risk that, in the event of a bank failure, the State Treasurer will not be able to recover deposits or will not be able to recover collateral securities that are in the possession of an outside party. The Lottery does not have a policy regarding custodial credit risk for deposits; however, the insurance and collateral requirements for deposits in the OSTF are established by banking regulations and Oregon law. Where balances exceed the Federal Deposit Insurance amount of $250,000, the balances are covered by collateral held in a multiple financial institution collateral pool administered by the Office of the State Treasurer. Except as provided in Oregon Revised Statute (ORS)
Notes to the Financial Statements (continued) June 30, 2012
26
295.018, a bank depository that holds uninsured public funds deposits is required to pledge collateral with a value at least equal to its minimum collateral requirement and as otherwise prescribed in ORS 295.001 to 295.108.
For a well capitalized bank depository that has not been required to increase its collateral pursuant to ORS 295.018, the minimum collateral requirement is 10 percent of the greater of: all uninsured public funds held by the bank depository as shown on the most recent treasurer report; the average of the balances of uninsured public funds held by the bank depository as shown on the last two immediately preceding treasurer reports; or an amount otherwise prescribed in ORS 295.001 to 295.108. For a well capitalized bank depository that has been required to increase its collateral pursuant to ORS 295.018, the minimum collateral requirement is the percentage required by the State Treasurer pursuant to ORS 295.018 multiplied by the greater of: all uninsured public funds held by the bank depository as shown on the most recent treasurer report; the average of the balances of uninsured public funds held by the bank depository as shown on the last two immediately preceding treasurer reports; or an amount otherwise prescribed in ORS 295.001 to 295.108. The minimum collateral requirement for an adequately capitalized bank depository or an undercapitalized bank depository is 110 percent of the greater of: all uninsured public funds held by the bank depository; or the average of the balances of uninsured public funds held by the bank depository as shown on the last two immediately preceding treasurer reports.
Consequently, the bank balance of all public funds held by the OSTF is insured by the Federal Deposit Insurance Corporation or collateralized.
4. Investments
The State Treasurer is the Investment Officer for the State of Oregon. Investment standards are established in ORS 293.726 and require funds to be managed as a prudent investor would do. The Lottery does not have an investment policy.
A. Custodial Credit Risk
The custodial credit risk for investments is the risk that, in the event of the failure of the counterparty to a transaction, the State Treasurer will not be able to recover the value of investment or collateral securities that are in the possession of an outside party. Lottery’s investments with the Office of the State Treasurer are registered in street name and held with the State Treasurer’s agent in the name of the State of Oregon and segregated in the Treasurer’s records in Lottery’s name.
B. Credit Risk and Concentration of Credit Risk
Credit risk is the risk that an issuer or other counterparty to an investment will not fulfill its obligations. The Lottery holds $24,902,235 of investments in the Resolution Funding Corporation (RFC), a U.S. government agency. These investments are not explicitly guaranteed by the U.S. government. However, interest payments are backed by the U.S. government, and the principal is protected by the purchase of zero-coupon bonds with an equivalent face value.
Concentration of credit risk is the risk of loss attributed to the magnitude of investments in a single issuer. The $24,902,235 of investments in the RFC represents 19.2 percent of the Lottery’s investment holdings.
C. Interest Rate Risk
Interest rate risk is the risk that changes in interest rates will adversely affect the fair value of an investment. The length of time until maturity affects the exposure of the investment to fair value fluctuations. Lottery’s investments are purchased to closely match the liability stream for prize payouts and are intended to be held until maturity.
Notes to the Financial Statements (continued) June 30, 2012
27
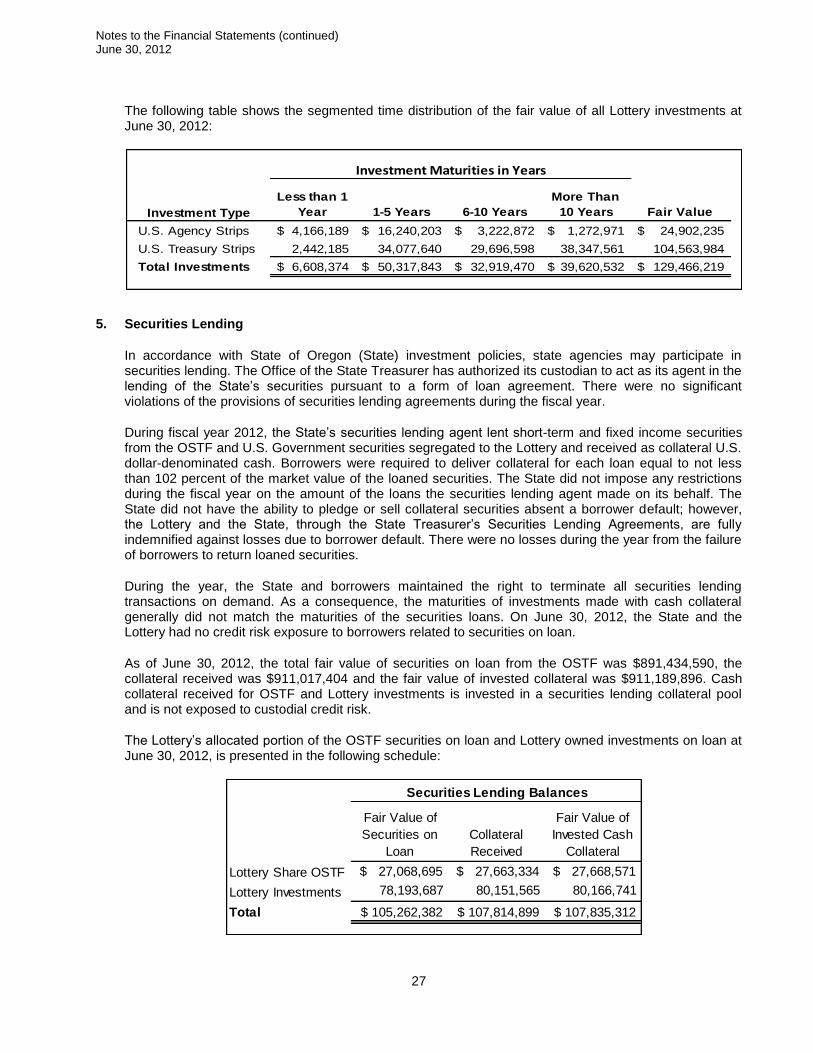
The following table shows the segmented time distribution of the fair value of all Lottery investments at June 30, 2012:
5. Securities Lending
In accordance with State of Oregon (State) investment policies, state agencies may participate in securities lending. The Office of the State Treasurer has authorized its custodian to act as its agent in the lending of the State’s securities pursuant to a form of loan agreement. There were no significant violations of the provisions of securities lending agreements during the fiscal year.
During fiscal year 2012, the State’s securities lending agent lent short-term and fixed income securities from the OSTF and U.S. Government securities segregated to the Lottery and received as collateral U.S. dollar-denominated cash. Borrowers were required to deliver collateral for each loan equal to not less than 102 percent of the market value of the loaned securities. The State did not impose any restrictions during the fiscal year on the amount of the loans the securities lending agent made on its behalf. The State did not have the ability to pledge or sell collateral securities absent a borrower default; however, the Lottery and the State, through the State Treasurer’s Securities Lending Agreements, are fully indemnified against losses due to borrower default. There were no losses during the year from the failure of borrowers to return loaned securities.
During the year, the State and borrowers maintained the right to terminate all securities lending transactions on demand. As a consequence, the maturities of investments made with cash collateral generally did not match the maturities of the securities loans. On June 30, 2012, the State and the Lottery had no credit risk exposure to borrowers related to securities on loan.
As of June 30, 2012, the total fair value of securities on loan from the OSTF was $891,434,590, the collateral received was $911,017,404 and the fair value of invested collateral was $911,189,896. Cash collateral received for OSTF and Lottery investments is invested in a securities lending collateral pool and is not exposed to custodial credit risk.
The Lottery’s allocated portion of the OSTF securities on loan and Lottery owned investments on loan at June 30, 2012, is presented in the following schedule:
Fair Value of
Securities on
Loan
Collateral
Received
Fair Value of
Invested Cash
Collateral
Lottery Share OSTF $ 27,068,695 $ 27,663,334 $ 27,668,571
Lottery Investments 78,193,687 80,151,565 80,166,741
Total $ 105,262,382 $ 107,814,899 $ 107,835,312
Securities Lending Balances
Investment Type
Less than 1
Year 1-5 Years 6-10 Years
More Than
10 Years Fair Value
U.S. Agency Strips 4,166,189$ 16,240,203$ 3,222,872$ 1,272,971$ 24,902,235$
U.S. Treasury Strips 2,442,185 34,077,640 29,696,598 38,347,561 104,563,984
Total Investments 6,608,374$ 50,317,843$ 32,919,470$ 39,620,532$ 129,466,219$
Investment Maturities in Years

Notes to the Financial Statements (continued) June 30, 2012
28
6. Capital Assets
Capital asset activity for the year ended June 30, 2012, is shown in the schedule below:
Beginning
Balance Increases Decreases
Ending
Balance
Depreciable Capital Assets
Equipment 150,239,921$ 667,089$ (4,521,379)$ 146,385,631$
Computer Software 17,976,015 6,709,994 (3,238,570) 21,447,439
Building and Improvements 11,958,350 - - 11,958,350
Vehicles 3,956,646 483,926 (403,593) 4,036,979
Leasehold Improvements 261,892 - (104,659) 157,233
Total Assets Being Depreciated 184,392,824 7,861,009 (8,268,201) 183,985,632
Accumulated Depreciation
Equipment 105,025,825 20,969,519 (4,410,850) 121,584,494
Computer Software 9,525,137 4,958,675 (2,764,258) 11,719,554
Building and Improvements 4,805,487 409,882 - 5,215,369
Vehicles 2,031,491 411,678 (277,157) 2,166,012
Leasehold Improvements 199,283 44,337 (104,659) 138,961
Total Accumulated Depreciation 121,587,223 26,794,091 (7,556,924) 140,824,390
Capital Assets, Net 62,805,601$ (18,933,082)$ (711,277)$ 43,161,242$
7. Long-term Liabilities
As of June 30, 2012, there were 91 Oregon Lottery game winners with long-term annual prize payments. The estimated number of years remaining for payments extends to 53 years. Current prize liability shown on the Balance Sheet includes $16,362,121 in estimated and actual prizes won that have not yet been claimed.
The following schedule presents changes in long-term liabilities as well as the amounts due in the next fiscal year:
Beginning
Balance Increases Decreases
Ending
Balance
Due Within
One Year
Prizes 141,109,467$ 270,838,947$ (257,587,375)$ 154,361,039$ 29,320,053$
Compensated Absences 2,713,540 362,870 (282,718) 2,793,692 1,843,837
Net OPEB Obligation 519,952 83,673 - 603,625 -
Contracts Payable 14,595 23,814 (26,502) 11,907 11,907
Total 144,357,554$ 271,309,304$ (257,896,595)$ 157,770,263$ 31,175,797$
Long-term Liabilities
Notes to the Financial Statements (continued) June 30, 2012
29
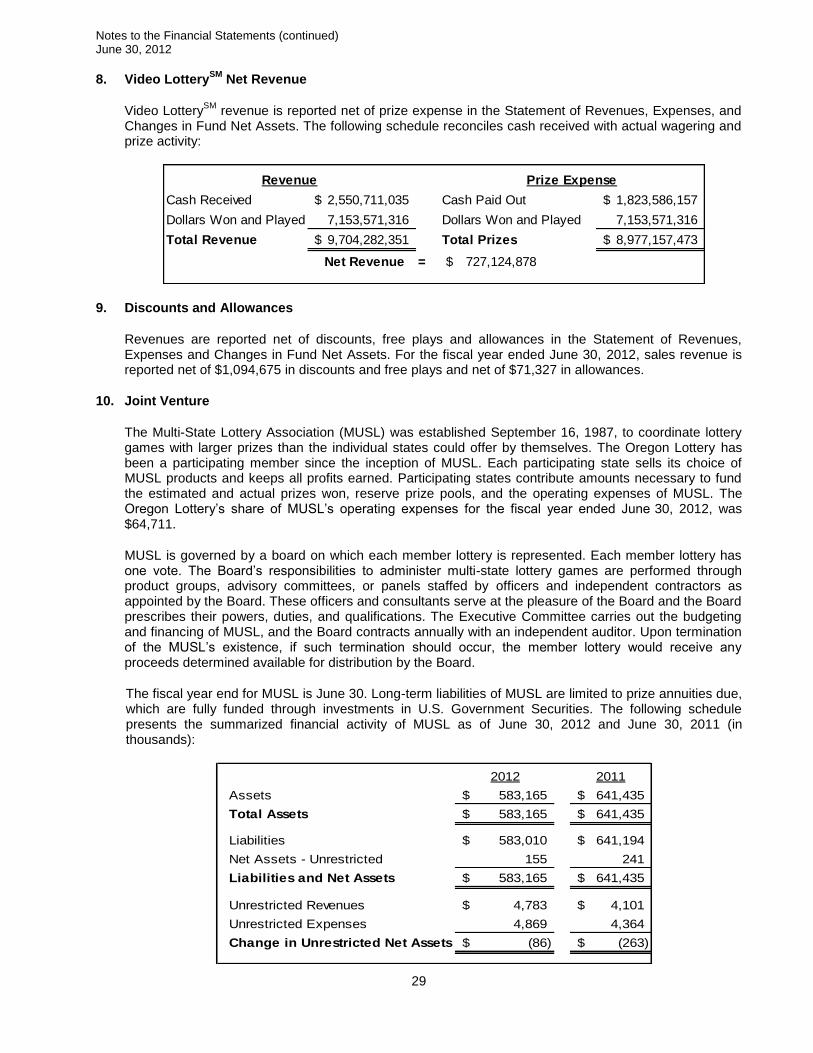
8. Video LotterySM
Net Revenue
Video LotterySM
revenue is reported net of prize expense in the Statement of Revenues, Expenses, and Changes in Fund Net Assets. The following schedule reconciles cash received with actual wagering and prize activity:
Cash Received 2,550,711,035$ Cash Paid Out 1,823,586,157$
Dollars Won and Played 7,153,571,316 Dollars Won and Played 7,153,571,316
Total Revenue 9,704,282,351$ Total Prizes 8,977,157,473$
Net Revenue = 727,124,878$
Revenue Prize Expense
9. Discounts and Allowances
Revenues are reported net of discounts, free plays and allowances in the Statement of Revenues, Expenses and Changes in Fund Net Assets. For the fiscal year ended June 30, 2012, sales revenue is reported net of $1,094,675 in discounts and free plays and net of $71,327 in allowances.
10. Joint Venture
The Multi-State Lottery Association (MUSL) was established September 16, 1987, to coordinate lottery games with larger prizes than the individual states could offer by themselves. The Oregon Lottery has been a participating member since the inception of MUSL. Each participating state sells its choice of MUSL products and keeps all profits earned. Participating states contribute amounts necessary to fund the estimated and actual prizes won, reserve prize pools, and the operating expenses of MUSL. The Oregon Lottery’s share of MUSL’s operating expenses for the fiscal year ended June 30, 2012, was $64,711.
MUSL is governed by a board on which each member lottery is represented. Each member lottery has one vote. The Board’s responsibilities to administer multi-state lottery games are performed through product groups, advisory committees, or panels staffed by officers and independent contractors as appointed by the Board. These officers and consultants serve at the pleasure of the Board and the Board prescribes their powers, duties, and qualifications. The Executive Committee carries out the budgeting and financing of MUSL, and the Board contracts annually with an independent auditor. Upon termination of the MUSL’s existence, if such termination should occur, the member lottery would receive any proceeds determined available for distribution by the Board.
The fiscal year end for MUSL is June 30. Long-term liabilities of MUSL are limited to prize annuities due, which are fully funded through investments in U.S. Government Securities. The following schedule presents the summarized financial activity of MUSL as of June 30, 2012 and June 30, 2011 (in thousands):
2012 2011
Assets 583,165$ 641,435$
Total Assets 583,165$ 641,435$
Liabilities 583,010$ 641,194$
Net Assets - Unrestricted 155 241
Liabilities and Net Assets 583,165$ 641,435$
Unrestricted Revenues 4,783$ 4,101$
Unrestricted Expenses 4,869 4,364
Change in Unrestricted Net Assets (86)$ (263)$

Notes to the Financial Statements (continued) June 30, 2012
30
Separate financial statements for MUSL may be obtained from the Multi-State Lottery Association, Attention: Chuck Strutt, 4400 NW Urbandale Drive, Urbandale, Iowa, 50322.
11. Operating Lease Commitments
Operating leases are agreements for the use of property, plant or equipment. As of June 30, 2012, there were two lease agreements in effect that had a noncancelable lease term in excess of one year. The agreements cover video system equipment and equipment for the traditional (instant and draw game) sales processing system.
The original video agreement began in fiscal year 1996, and the most recent contract amendment extended the agreement through October 4, 2012. The agreement includes all necessary equipment for a central and backup video host system and has flat monthly rates of $147,603.
The traditional system agreement was signed on October 3, 2007. The original agreement was amended in March 2012 and is effective through November 30, 2020. The Lottery currently leases 430 self-service kiosks for $186.75 per month, per kiosk; and 3,100 monitors for $7.50 per monitor, per month.
Lease expense for fiscal year 2012 for the video and traditional system equipment was $3,013,866. Future minimum lease payments for these two lease agreements as of June 30, 2012 are shown in the schedule below:
Year Ending June 30,
Operating
Leases
2013 1,685,439$
2014 1,242,630
2015 1,242,630
2016 1,242,630
2017 1,242,630
2018-2021 4,245,653
Total Future Minimum Lease Payments 10,901,612$
Future Minimum Lease Payments
12. Other Significant Commitments and Contingencies
A. Commitments
At June 30, 2012, the Lottery had contractual commitments of $4,642,556 for the purchase of gaming software and financial software implementation services. The purchases are expected to occur in the upcoming fiscal year. In addition, the Lottery contracts for services and the use of software associated with processing transactions for its traditional products. The contractor is paid a commission of 1.6999 percent of net sales for all traditional products. In fiscal year 2012, the Lottery had expenses of $5,487,058 for traditional product commissions. The amount is included in Game Vendor Charges on the Statement of Revenues, Expenses, and Changes in Fund Net Assets.
B. Unemployment Benefits
State employees who qualify are entitled to benefit payments during periods of unemployment. Each state agency is required to reimburse the Employment Department for benefit payments made to former employees. There is no practical method of estimating the amount of future benefit payments that may be made to former employees for wage credits earned prior to fiscal year end. Consequently, this potential obligation is not reported in the accompanying financial statements. Total reimbursements for unemployment benefits for the fiscal year ended June 30, 2012 were $74,718.
Notes to the Financial Statements (continued) June 30, 2012
31
13. Employee Retirement Plans
The Oregon Public Employees Retirement System (PERS) administers retirement plans for eligible Lottery employees. PERS is administered by the Public Employees Retirement Board (Board), as required by Chapters 238 and 238A of the Oregon Revised Statutes. PERS issues a publicly available financial report that includes financial statements and required supplementary information. That report may be obtained by writing to PERS Fiscal Services Division, PO Box 23700, Tigard, Oregon 97281-3700.
A. Public Employees Retirement System Pension (Chapter 238)
Lottery employees who were plan members before August 29, 2003, participate in the Public Employees Retirement System (PERS) Pension, a cost-sharing multiple-employer defined benefit plan. The PERS retirement allowance is payable monthly for life and may be selected from several retirement benefit options. These options include survivorship benefits and lump sum payments. PERS also provides death and disability benefits. The Legislature has authority to establish and amend PERS pension benefits.
The Board establishes employer contributions based on actuarially determined rates. The funding policies provide for monthly employer contributions. The Lottery is required by statute to contribute actuarially computed amounts. The employer rate for a covered employee’s salary for fiscal year 2012 was 8.8 percent. Lottery contributions for the fiscal year ended June 30, 2012, were approximately $1,438,000. Contributions for fiscal year 2011 were approximately $435,000 and $329,000 for fiscal year 2010. These contributions were equal to the required contributions for each year. Beginning January 1, 2004, plan member contributions were no longer contributed to the PERS plan.
B. Oregon Public Service Retirement Plan (Chapter 238A)
The 2003 Oregon Legislature created the Oregon Public Service Retirement Plan (OPSRP), also a cost-sharing multiple-employer plan. OPSRP is a hybrid pension plan with two components: the Pension Program (defined benefit) and the Individual Account Program (defined contribution). Lottery employees hired after August 28, 2003 participate in OPSRP after completing six months of service. The OPSRP Pension Program provides a monthly pension payable for life as well as death and disability benefits. The Legislature has authority to establish and amend OPSRP pension benefits.
The Board establishes employer contributions based on actuarially determined rates. The funding policies provide for monthly employer contributions. The Lottery is required by statute to contribute actuarially computed amounts. The employer rate for a covered employee’s salary for fiscal year 2012 was 7.44 percent. Lottery contributions for the fiscal year ended June 30, 2012, were approximately $528,000. Contributions for fiscal year 2011 were approximately $189,000 and $156,000 for fiscal year 2010. These contributions were equal to the required contributions for each year.
Beginning January 1, 2004, PERS members became members of the Individual Account Program (IAP) portion of OPSRP. PERS members retain their existing PERS accounts, but member contributions are now deposited in the IAP account rather than into the member’s PERS account. All covered employees are required by state statute to contribute 6.0 percent of their salary to the IAP. Current law permits employers to pay the employee contribution, which the Lottery has elected to do. The amount contributed by Lottery on behalf of employees for the fiscal years ended June 30, 2012, 2011, and 2010 were approximately $1,427,000, $1,456,000, and $1,472,000, respectively. These contributions were equal to the required contributions for each year.
Notes to the Financial Statements (continued) June 30, 2012
32
14. Other Postemployment Benefit Plans
The Public Employees Retirement Board contracts for healthcare insurance coverage on behalf of members of the Public Employees Retirement System (PERS). Retirees who are eligible for PERS healthcare coverage pay their own age-adjusted premiums. PERS administers two separate defined benefit other postemployment benefit (OPEB) plans. The Public Employees Benefit Board (PEBB) also administers an OPEB plan. Lottery retirees may be eligible to participate in any of these three OPEB plans.
A. Retirement Health Insurance Account
Plan Description. The Retirement Health Insurance Account (RHIA) is a cost-sharing multiple-employer defined benefit OPEB plan administered by PERS. As authorized by ORS 238.420, the RHIA plan provides a subsidy payment of up to $60 toward the monthly cost of PERS-sponsored health insurance for eligible PERS members. The Legislature has authority to establish and amend benefit provisions. PERS issues a publicly available report that includes financial statements and required supplementary information. That report may be obtained by writing to PERS Fiscal Services Division, PO Box 23700, Tigard, Oregon 97281-3700.
Funding Policy. ORS 238.420 provides that contribution requirements of the participating employers be established and may be amended by the Public Employees Retirement Board (Board). The Board establishes the employer contribution rate based on the annual required contribution (ARC) of the employers, an amount actuarially determined in accordance with the parameters of GASB Statement No. 45. The ARC represents a level of funding that, if paid on an ongoing basis, is projected to cover normal cost each year and amortize any unfunded actuarial liabilities (or funding excess) over a period not to exceed thirty years. For the fiscal year ended June 30, 2012, the Lottery was required by statute to contribute 0.59 percent of PERS covered payroll and 0.50 percent of OPSRP covered payroll to fund the RHIA. Actual employer contributions made by Lottery for the current year were approximately $132,000. Contributions for fiscal year 2011 and 2010 were approximately $57,000 and $51,000 respectively. Contributions were equal to the required contributions for each year. Plan members do not contribute to the RHIA plan.
B. Retiree Health Insurance Premium Account
Plan Description. The Retiree Health Insurance Premium Account (RHIPA) is a single-employer defined benefit OPEB plan administered by PERS. As authorized by ORS 238.415, the RHIPA plan provides for payment of the average difference between the health insurance premiums paid by retired state employees, under contracts entered into by the Public Employees Retirement Board, and health insurance premiums paid by state employees who are not retired. The Legislature has authority to establish and amend benefit provisions. PERS issues a publicly available report that includes financial statements and required supplementary information. That report may be obtained by writing to PERS Fiscal Services Division, PO Box 23700, Tigard, Oregon 97281-3700.
Funding Policy. ORS 238.415 provides that employer contributions be established and may be amended by the Public Employees Retirement Board (Board). The Board establishes the employer contribution rate based on the annual required contribution (ARC) of the employer, an amount actuarially determined in accordance with the parameters of GASB Statement No. 45. The ARC represents a level of funding that, if paid on an ongoing basis, is projected to cover normal cost each year and amortize any unfunded actuarial liabilities (or funding excess) over a period not to exceed thirty years. For the fiscal year ended June 30, 2012, the Lottery was required by statute to contribute 0.16 percent of PERS covered payroll and 0.11 percent of OPSRP covered payroll to fund the RHIPA. Plan members do not contribute to the RHIPA plan.

Notes to the Financial Statements (continued) June 30, 2012
33
Annual OPEB Cost. For the fiscal year ended June 30, 2012, the Lottery’s annual OPEB cost (expense) was approximately $34,000 for the RHIPA which was equal to the ARC. Fiscal year 2011 and 2010 OPEB costs were approximately $13,000 and $10,000 respectively, and were equal to the ARC for each year. The State of Oregon’s annual OPEB cost, the percentage of annual OPEB cost contributed to the plan, and the net OPEB obligation for fiscal year 2012 and the two preceding years were as follows:
Fiscal Year
Ended
Annual
OPEB Cost
Percentage of
Annual OPEB
Cost Contributed
Net OPEB
Obligation
6/30/2010 1,497,000 100% -$
6/30/2011 1,428,000 100% -
6/30/2012 3,378,000 100% -
RHIPA OPEB Plan - Annual OPEB Cost
Funded Status and Funding Progress. The funded status of the RHIPA plan as of December 31, 2011, the most recent actuarial valuation, was as follows (dollars in millions):
Actuarial Accrued Liability (AAL) 34.4$
Actuarial Value of Plan Assets 4.5
Unfunded Actuarial Accrued Liability (UAAL) 29.9$
Funded Ratio (Actuarial Value of Plan Assets/AAL) 13.1%
Covered Payroll 2,376.9$
UAAL as a Percentage of Covered Payroll 1.3%
RHIPA OPEB Plan - Funded Status
Actuarial valuations involve estimates of the value of reported amounts and assumptions about the probability of events far into the future. Examples include assumptions about future employment, mortality, and the healthcare cost trend. Amounts determined regarding the funded status of the plan and the annual required contributions of the employer are subject to continual revision as actual results are compared with past expectations and new estimates are made about the future. The schedule of funding progress, presented as required supplementary information following the notes to the financial statements, presents multi-year trend information that shows whether the actuarial value of plan assets is increasing or decreasing over time relative to the actuarial accrued liabilities for benefits.
Actuarial Methods and Assumptions. Projections of benefits for financial reporting purposes are based on the substantive plan (the plan as understood by the employer and plan members) and include the types of benefits provided at the time of each valuation and the historical pattern of sharing of benefit costs between the employer and plan members to that point. The actuarial methods and assumptions used include techniques that are designed to reduce short-term volatility in actuarial accrued liabilities and the actuarial value of assets, consistent with the long-term perspective of the calculations.
In the December 31, 2011 actuarial valuation, the projected unit credit actuarial cost method was used. The actuarial value of plan assets is equal to the fair market value of assets on the valuation date. The actuarial assumptions include: an 8.0 percent investment rate of return; projected payroll growth of 3.75 percent; an inflation assumption of 2.75 percent; and an annual healthcare cost trend rate graded from 6.9 percent in 2012 to 4.5 percent in 2029. The unfunded actuarial accrued liability for the RHIPA plan is being amortized as a level percentage of payroll using a remaining closed amortization period of 10 years.
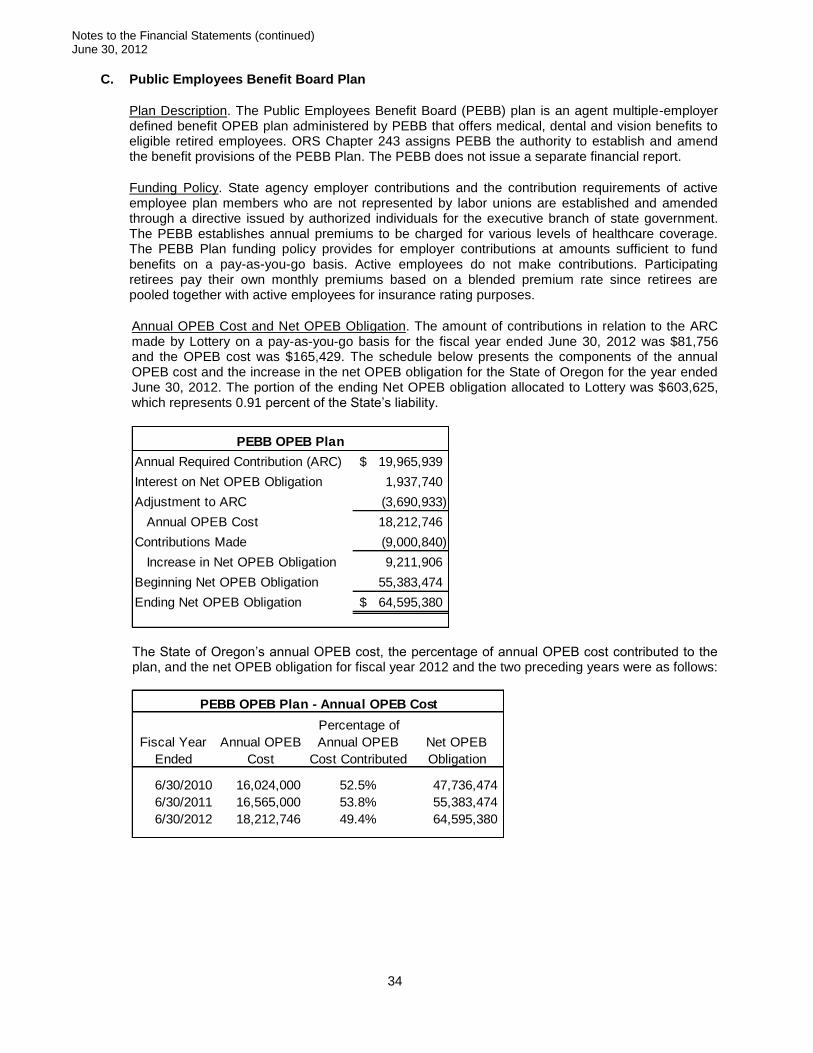
Notes to the Financial Statements (continued) June 30, 2012
34
C. Public Employees Benefit Board Plan
Plan Description. The Public Employees Benefit Board (PEBB) plan is an agent multiple-employer defined benefit OPEB plan administered by PEBB that offers medical, dental and vision benefits to eligible retired employees. ORS Chapter 243 assigns PEBB the authority to establish and amend the benefit provisions of the PEBB Plan. The PEBB does not issue a separate financial report.
Funding Policy. State agency employer contributions and the contribution requirements of active employee plan members who are not represented by labor unions are established and amended through a directive issued by authorized individuals for the executive branch of state government. The PEBB establishes annual premiums to be charged for various levels of healthcare coverage. The PEBB Plan funding policy provides for employer contributions at amounts sufficient to fund benefits on a pay-as-you-go basis. Active employees do not make contributions. Participating retirees pay their own monthly premiums based on a blended premium rate since retirees are pooled together with active employees for insurance rating purposes.
Annual OPEB Cost and Net OPEB Obligation. The amount of contributions in relation to the ARC made by Lottery on a pay-as-you-go basis for the fiscal year ended June 30, 2012 was $81,756 and the OPEB cost was $165,429. The schedule below presents the components of the annual OPEB cost and the increase in the net OPEB obligation for the State of Oregon for the year ended June 30, 2012. The portion of the ending Net OPEB obligation allocated to Lottery was $603,625, which represents 0.91 percent of the State’s liability.
Annual Required Contribution (ARC) 19,965,939$
Interest on Net OPEB Obligation 1,937,740
Adjustment to ARC (3,690,933)
Annual OPEB Cost 18,212,746
Contributions Made (9,000,840)
Increase in Net OPEB Obligation 9,211,906
Beginning Net OPEB Obligation 55,383,474
Ending Net OPEB Obligation 64,595,380$
PEBB OPEB Plan
The State of Oregon’s annual OPEB cost, the percentage of annual OPEB cost contributed to the plan, and the net OPEB obligation for fiscal year 2012 and the two preceding years were as follows:
Fiscal Year
Ended
Annual OPEB
Cost
Percentage of
Annual OPEB
Cost Contributed
Net OPEB
Obligation
6/30/2010 16,024,000 52.5% 47,736,474
6/30/2011 16,565,000 53.8% 55,383,474
6/30/2012 18,212,746 49.4% 64,595,380
PEBB OPEB Plan - Annual OPEB Cost

Notes to the Financial Statements (continued) June 30, 2012
35
Funded Status and Funding Progress. The funded status of the PEBB plan as of July 1, 2011, the most recent actuarial valuation, was as follows (dollars in millions):
Actuarial Accrued Liability (AAL) 154.7$
Actuarial Value of Plan Assets -
Unfunded Actuarial Accrued Liability (UAAL) 154.7$
Funded Ratio (Actuarial Value of Plan Assets/AAL) 0.0%
Covered Payroll 2,647.0$
UAAL as a Percentage of Covered Payroll 5.8%
PEBB OPEB Plan - Funded Status
Actuarial valuations involve estimates of the value of reported amounts and assumptions about the probability of events far into the future. Examples include assumptions about future employment, mortality, and the healthcare cost trend. Amounts determined regarding the funded status of the plan and the annual required contributions of the employer are subject to continual revision as actual results are compared with past expectations and new estimates are made about the future. The schedule of funding progress, presented as required supplementary information following the notes to the financial statements, presents multi-year trend information that shows whether the actuarial value of plan assets is increasing or decreasing over time relative to the actuarial accrued liabilities for benefits.
Actuarial Methods and Assumptions. Projections of benefits for financial reporting purposes are based on the substantive plan (the plan as understood by the employer and plan members) and include the types of benefits provided at the time of each valuation and the historical pattern of sharing of benefit costs between the employer and plan members to that point. The actuarial methods and assumptions used include techniques that are designed to reduce short-term volatility in actuarial accrued liabilities and the actuarial value of assets, consistent with the long-term perspective of the calculations.
In the July 1, 2011 actuarial valuation, the entry age normal actuarial cost method was used. Significant actuarial assumptions include: a 3.5 percent rate of return on the investment of present and future assets; an initial medical healthcare cost trend rate of 4.03 percent and an ultimate rate of 5.5 percent; a dental healthcare cost trend rate of 2.73 percent in 2012 and 5.0 percent in all subsequent years; and an inflation rate of 2.75 percent. The unfunded actuarial accrued liability for the PEBB plan is being amortized using the level percentage amortization method and an open amortization period of 15 years.
15. Risk Financing
The State of Oregon administers property and casualty insurance programs covering State government through its Insurance Fund (included in the Central Services Fund). The Insurance Fund services claims for: direct physical loss or damage to state property; tort liability claims brought against the State, its officers, employees, or agents; workers’ compensation; employee dishonesty; and faithful performance coverage for certain positions required by law to be covered and other key positions.
As a state agency, the Lottery participates in the Insurance Fund. The cost of servicing insurance claims and payments is covered by charging an assessment to each state agency based on its share of services provided in a prior period. The total statewide assessment for each coverage type is based on independent biennial actuarial forecasts and administrative costs, less any available equity in the Insurance Fund from the prior biennium. Lottery’s fiscal year 2012 share of the 2011-2013 biennial assessment was $513,287. For the Lottery, the amount of claim settlements did not exceed insurance coverage for each of the past three fiscal years.

36
This page intentionally left blank.

Required
Supplementary
Information

38
Required Supplementary Information
Schedules of Funding Progress
Other Postemployment Benefit Plans(Dollars in Millions)
Public Employees Benefit Board (PEBB) Plan
Actuarial
Valuation
Actuarial
Value of
Assets
Unfunded
AAL
(UAAL)
Funded
Ratio
Covered
Payroll
Date (a) (b) (b-a) (a/b) (c)
7/1/2007 -$ 323.4$ 323.4$ 0% 2,187.2$ 14.8%
7/1/2009 - 161.7 161.7 0% 2,562.5 6.3%
7/1/2011 - 154.7 154.7 0% 2,647.0 5.8%
Retiree Health Insurance Premium Account (RHIPA) Plan
Actuarial
Valuation
Actuarial
Value of
Assets
Unfunded
AAL
(UAAL)
Funded
Ratio
Covered
Payroll
Date (a) (b) (b-a) (a/b) (c)
12/31/2009 6.4$ 24.5$ 18.1$ 26.1% 2,371.8$ 0.8%
12/31/2010 5.7 33.9 28.2 16.8% 2,379.7 1.2%
12/31/2011 4.5 34.4 29.9 13.1% 2,376.9 1.3%
Notes to the Required Supplementary Information – Schedules of Funding Progress
The Public Employees Benefit Board (PEBB) does not issue a financial report.
The Public Employees Retirement System (PERS) issues a publicly available financial report that
includes financial statements and required supplementary information. That report may be obtained by
writing to PERS Fiscal Services Division, PO Box 23700, Tigard, Oregon 97281-3700.
UAAL as a
% of Covered
Payroll
((b-a)/c)
Actuarial
Accrued
Liability (AAL)
UAAL as a
% of Covered
Payroll
((b-a)/c)
Actuarial
Accrued
Liability (AAL)
Supplementary
Information

40
Oregon State Lottery An Enterprise Fund of the State of Oregon
Budgetary (Non-GAAP) Basis Comparison Schedule For the Fiscal Year Ended June 30, 2012
(See Note 2. A., Budgetary Compliance)
Variance
Favorable/
Actual Budget1 (Unfavorable)
Revenue
Video Lottery℠ (Gross Receipts) 9,704,282,351$ 9,722,066,000$ (17,783,649)$
Scratch-its℠ Instant Tickets 117,521,750 116,742,000 779,750
Keno 93,456,813 93,884,000 (427,187)
Megabucks℠ 37,539,720 38,142,800 (603,080)
Powerball® 38,777,424 38,161,720 615,704
Mega Millions® 22,208,222 21,938,800 269,422
Raffle℠ 4,999,650 5,000,000 (350)
Win For Life℠ 5,545,700 5,624,400 (78,700)
Lucky Lines℠ 1,758,800 1,749,700 9,100
Pick 4℠ 1,352,749 1,354,700 (1,951)
Total Revenue 10,027,443,179 10,044,664,120 (17,220,941)
Prize Expense 9,199,045,301 9,204,117,000 5,071,699
Net Revenue 828,397,878 840,547,120 (12,149,242)
Direct Expenses
Retailer Commissions 201,626,030 203,766,000 2,139,970
Game Vendor Charges 8,620,924 9,053,636 432,712
Tickets 4,640,444 5,099,000 458,556
Advertising 5,946,663 8,760,000 2,813,337
Sales Support 1,113,400 1,723,569 610,169
Game Equipment/Parts & Maintenance 1,925,220 2,264,960 339,740
Research 498,108 1,002,200 504,092
Depreciation 24,506,358 27,014,994 2,508,636
Total Direct Expenses 248,877,147 258,684,359 9,807,212
Gross Profit 579,520,731 581,862,761 (2,342,030)
Indirect Revenue
Other Income (Loss) 1,115,086 951,000 164,086
Indirect Expenses
Public Information 3,882,869 4,644,000 761,131
Personal Services 37,776,981 39,242,684 1,465,703
Services and Supplies 10,039,312 12,981,553 2,942,241
Depreciation 2,287,733 2,730,113 442,380
Total Indirect Expenses 53,986,895 59,598,350 5,611,455
Net Profit 526,648,922$ 523,215,411$ 3,433,511$
1Budget adopted by the Lottery Commission and adjusted by the Economic and Revenue
Forecasts published by the Department of Administrative Services throughout the year.
Statistical Section

42
Statistical Section
Index
This part of the Oregon State Lottery’s comprehensive annual financial report presents detailed information to provide context for understanding what the information in the financial statements and note disclosures say about the Lottery’s overall financial health.
Financial Trends
These schedules contain trend information to help the reader understand how the Lottery’s financial performance has changed over time.
Net Assets by Component Changes in Net Assets
Revenue Capacity
These schedules contain information to help the reader assess the Lottery’s most significant revenue source, Lottery game sales income. The sales amounts reported for the top ten retailers and sales by county are based on Lottery’s business year, which is slightly different than its fiscal year of July 1 through June 30. The business year begins on the Sunday following the last Saturday in June and ends on the last Saturday in the following June.
Sales by Product Product Percent of Total Sales Top Ten Retailers Number of Lottery Retailers and Sales by County
Demographic and Economic Information
These schedules offer demographic and economic indicators to help the reader understand the environment within which the Lottery’s financial activities take place.
Demographic and Economic Data – State of Oregon Employment by Industry – State of Oregon Demographic Profile of Oregon Lottery Players
Operating Information
These schedules contain data to help the reader understand how the information in the Lottery’s financial report relates to the products it provides and the activities it performs. There are many factors that impact the level of demand for Lottery products. Game themes, play-styles, price points, and prize payouts typically impact the sales of instant ticket games. For Video Lottery
SM, the level of demand is generally impacted by
variety of game choices, entertaining and sophisticated graphics, and convenience of available retailer locations.
Number of Employees Operating Indicators and Capital Asset Information
Note: The Lottery does not issue long-term debt; thus, information on debt capacity is not relevant. Sources: Unless otherwise noted, the information in these schedules is derived from the comprehensive annual financial report or the audited financial statements for the applicable year.
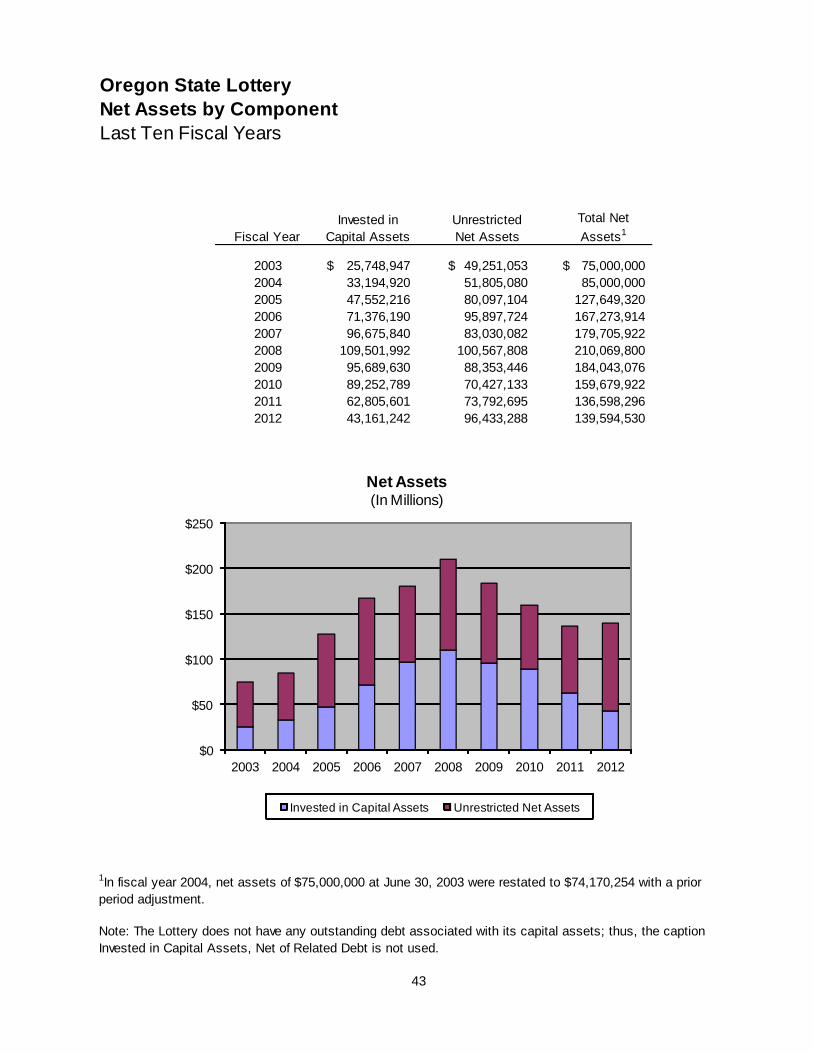
43
Oregon State Lottery
Net Assets by Component
Last Ten Fiscal Years
Fiscal Year
Invested in
Capital Assets
Unrestricted
Net Assets
Total Net
Assets1
2003 25,748,947$ 49,251,053$ 75,000,000$
2004 33,194,920 51,805,080 85,000,000
2005 47,552,216 80,097,104 127,649,320
2006 71,376,190 95,897,724 167,273,914
2007 96,675,840 83,030,082 179,705,922
2008 109,501,992 100,567,808 210,069,800
2009 95,689,630 88,353,446 184,043,076
2010 89,252,789 70,427,133 159,679,922
2011 62,805,601 73,792,695 136,598,296
2012 43,161,242 96,433,288 139,594,530
1In fiscal year 2004, net assets of $75,000,000 at June 30, 2003 were restated to $74,170,254 with a prior
period adjustment.
Note: The Lottery does not have any outstanding debt associated with its capital assets; thus, the caption
Invested in Capital Assets, Net of Related Debt is not used.
$0
$50
$100
$150
$200
$250
2003 2004 2005 2006 2007 2008 2009 2010 2011 2012
Net Assets(In Millions)
Invested in Capital Assets Unrestricted Net Assets
44
Oregon State Lottery
Changes in Net Assets
Last Ten Fiscal Years
2003 2004 2005 2006
Operating Revenues
Sales:
Video LotterySM (Net Receipts) 498,712,314$ 530,966,187$ 579,650,266$ 732,888,437$
Scratch-itsSM Instant Tickets 133,102,008 132,731,374 133,241,896 127,244,323
Keno 111,341,872 116,478,125 122,196,298 116,240,045
Powerball® 45,107,076 45,974,759 35,004,855 59,070,621
MegabucksSM 44,516,150 46,473,330 48,283,356 37,771,877
Sports ActionSM 9,862,974 10,063,790 11,292,930 12,105,674
Mega Millions® - - - -
Win For LifeSM 5,990,520 5,475,972 5,559,882 5,914,469
RaffleSM - - - -
Lucky LinesSM - - - 1,018,520
Pick 4SM 1,591,390 1,381,483 1,386,714 1,405,501
Breakopen Instant Tickets 3,290,487 2,630,176 2,185,157 1,671,571
ScoreboardSM - 1,087,911 1,022,163 643,913
Provision for Bad Debts (154,345) (133,563) (294,516) (29,002)
Other Income 414,175 332,697 361,798 234,719
Total Operating Revenues 853,774,621 893,462,241 939,890,799 1,096,180,668
Operating Expenses
Prizes 248,666,215 232,122,621 245,125,049 236,638,134
Retailer Commissions 190,807,938 200,968,893 195,994,718 218,013,134
Salaries and Wages 25,607,562 24,496,409 23,860,802 25,873,708
Depreciation and Amortization 5,123,916 4,419,544 6,918,109 11,019,875
Services and Supplies 11,673,527 11,400,672 10,143,892 10,902,866
Game Vendor Charges 14,140,775 11,816,144 10,908,009 10,227,113
Advertising and Market Research 6,294,027 6,917,506 7,262,887 7,007,884
Public Information 2,743,140 3,124,828 3,106,149 3,858,646
Tickets 4,372,431 4,459,738 4,318,728 4,461,315
Game Equipment Parts and Maintenance - - - -
Sales Support 1,397,075 1,332,869 1,215,887 1,772,169
Total Operating Expenses 510,826,606 501,059,224 508,854,230 529,774,844
Operating Income 342,948,015 392,403,017 431,036,569 566,405,824
Nonoperating Revenues (Expenses)
Interest and Investment Income (Loss) 16,817,879 (34,460) 15,862,977 8,357,783
Insurance Recoveries - 49,867 69,315 34,111
Gain (Loss) on Disposition of Assets 37,825 32,123 (64,636) (20,653)
Investment Expenses - Securities Lending (483,488) (837,276) (1,525,023) (2,998,549)
Total Nonoperating Revenues (Expenses) 16,372,216 (789,746) 14,342,633 5,372,692
Income Before Transfers 359,320,231 391,613,271 445,379,202 571,778,516
Transfers to Economic Development Fund (358,890,776) (380,579,755) (401,581,250) (531,032,111)
Transfers to General Obligation Bond Fund - (203,770) (1,148,632) (1,121,812)
Change in Net Assets 429,455$ 10,829,746$ 42,649,320$ 39,624,593$

45
2007 2008 2009 2010 2011 2012
853,505,565$ 895,111,696$ 786,746,726$ 706,981,950$ 720,510,190$ 727,124,878$
127,636,964 124,704,686 112,105,703 113,269,602 115,895,266 117,521,750
113,198,024 109,787,942 99,184,396 95,343,654 93,270,757 93,456,813
48,658,403 55,969,079 51,836,316 51,216,021 33,491,623 38,777,424
40,164,337 37,149,930 38,065,424 40,137,180 40,780,752 37,539,720
14,009,541 - - - - -
- - - 3,490,116 17,448,177 22,208,222
5,566,158 6,675,988 6,654,104 6,503,143 5,869,397 5,545,700
- - 2,499,597 7,499,290 7,499,000 4,999,650
2,298,480 2,131,474 2,042,237 1,986,060 1,918,134 1,758,800
1,404,990 1,401,230 1,389,814 1,254,783 1,279,523 1,352,749
1,173,585 857,671 - - - -
512,206 - - - - -
(56,434) (7,797) (128,699) (112,559) (128,164) (71,327)
1,602,185 1,042,747 579,477 251,538 1,142,214 209,110
1,209,674,004 1,234,824,646 1,100,975,095 1,027,820,778 1,038,976,869 1,050,423,489
240,076,739 231,364,323 211,927,565 215,619,096 208,672,809 238,278,854
239,320,032 240,475,998 213,739,988 198,168,503 200,510,286 201,626,030
29,123,801 33,005,670 37,330,819 34,608,905 35,512,068 36,317,480
19,797,789 30,843,314 37,080,300 30,899,860 29,773,197 26,794,091
8,254,418 8,767,744 10,519,566 8,837,913 10,644,690 10,159,107
10,009,601 9,371,513 7,716,930 9,220,784 8,552,689 8,620,924
10,752,331 9,885,584 11,313,552 8,475,107 8,446,004 6,444,771
5,128,899 5,463,575 5,326,746 4,462,400 4,420,673 3,882,869
4,165,283 4,232,601 4,335,016 4,245,963 4,230,790 4,640,444
2,606,119 2,485,770 1,850,765 1,333,034 2,115,134 1,925,220
1,320,416 1,569,079 1,712,391 1,131,956 1,234,314 1,113,400
570,555,428 577,465,171 542,853,638 517,003,521 514,112,654 539,803,190
639,118,576 657,359,475 558,121,457 510,817,257 524,864,215 510,620,299
24,392,398 28,068,310 12,675,701 11,276,393 3,587,450 17,744,105
16,655 25,570 61,973 106,598 65,081 30,676
(517,562) (317,204) (1,767,242) (5,323,677) (2,919,876) (147,802)
(5,352,243) (5,047,007) (808,660) (192,727) (237,391) (138,855)
18,539,248 22,729,669 10,161,772 5,866,587 495,264 17,488,124
657,657,824 680,089,144 568,283,229 516,683,844 525,359,479 528,108,423
(644,030,352) (648,408,187) (592,846,506) (539,582,457) (546,996,892) (523,652,688)
(1,195,464) (1,317,079) (1,463,447) (1,464,541) (1,444,213) (1,459,501)
12,432,008$ 30,363,878$ (26,026,724)$ (24,363,154)$ (23,081,626)$ 2,996,234$
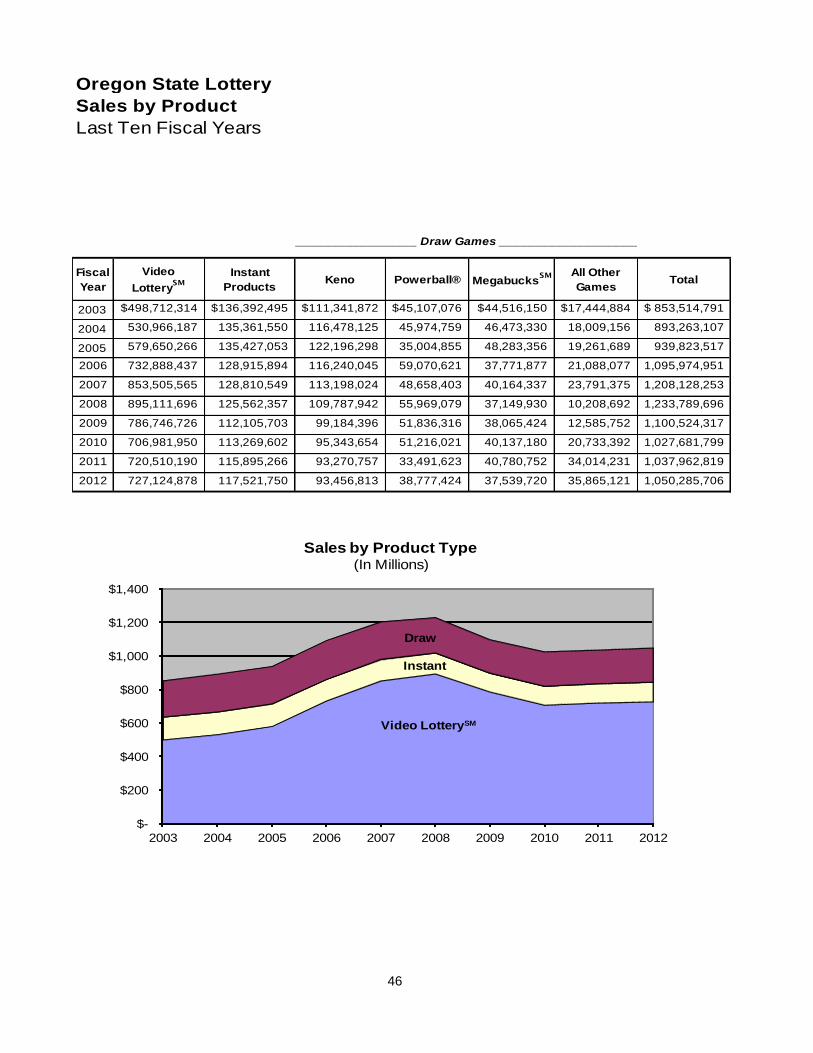
46
Fiscal
Year
Video
LotterySM
Instant
ProductsKeno Powerball® Megabucks
SM All Other
GamesTotal
2003 498,712,314$ 136,392,495$ 111,341,872$ 45,107,076$ 44,516,150$ 17,444,884$ 853,514,791$
2004 530,966,187 135,361,550 116,478,125 45,974,759 46,473,330 18,009,156 893,263,107
2005 579,650,266 135,427,053 122,196,298 35,004,855 48,283,356 19,261,689 939,823,517
2006 732,888,437 128,915,894 116,240,045 59,070,621 37,771,877 21,088,077 1,095,974,951
2007 853,505,565 128,810,549 113,198,024 48,658,403 40,164,337 23,791,375 1,208,128,253
2008 895,111,696 125,562,357 109,787,942 55,969,079 37,149,930 10,208,692 1,233,789,696
2009 786,746,726 112,105,703 99,184,396 51,836,316 38,065,424 12,585,752 1,100,524,317
2010 706,981,950 113,269,602 95,343,654 51,216,021 40,137,180 20,733,392 1,027,681,799
2011 720,510,190 115,895,266 93,270,757 33,491,623 40,780,752 34,014,231 1,037,962,819
2012 727,124,878 117,521,750 93,456,813 38,777,424 37,539,720 35,865,121 1,050,285,706
Oregon State Lottery
Sales by Product
Last Ten Fiscal Years
__________________ Draw Games ____________________
Video LotterySM
Instant
Draw
$-
$200
$400
$600
$800
$1,000
$1,200
$1,400
2003 2004 2005 2006 2007 2008 2009 2010 2011 2012
Sales by Product Type (In Millions)

47
Oregon State Lottery
Product Percent of Total Sales
Last Ten Fiscal Years
Fiscal
Year
Video
LotterySM
Instant
ProductsKeno Powerball® Megabucks
SM
All Other
Draw
Games
2003 58.4% 16.0% 13.1% 5.3% 5.2% 2.0%
2004 59.4% 15.2% 13.1% 5.1% 5.2% 2.0%
2005 61.7% 14.4% 13.0% 3.7% 5.2% 2.0%
2006 66.9% 11.8% 10.6% 5.4% 3.4% 1.9%
2007 70.6% 10.7% 9.4% 4.0% 3.3% 2.0%
2008 72.5% 10.2% 8.9% 4.6% 3.0% 0.8%
2009 71.5% 10.2% 9.0% 4.7% 3.5% 1.1%
2010 68.8% 11.0% 9.3% 5.0% 3.9% 2.0%
2011 69.4% 11.2% 9.0% 3.2% 3.9% 3.3%
2012 69.2% 11.2% 8.9% 3.7% 3.6% 3.4%
Draw Games
$-
$50
$100
$150
$200
$250
2003 2004 2005 2006 2007 2008 2009 2010 2011 2012
Draw Game Sales by Product (In Millions)
Keno Powerball Megabucks All Other
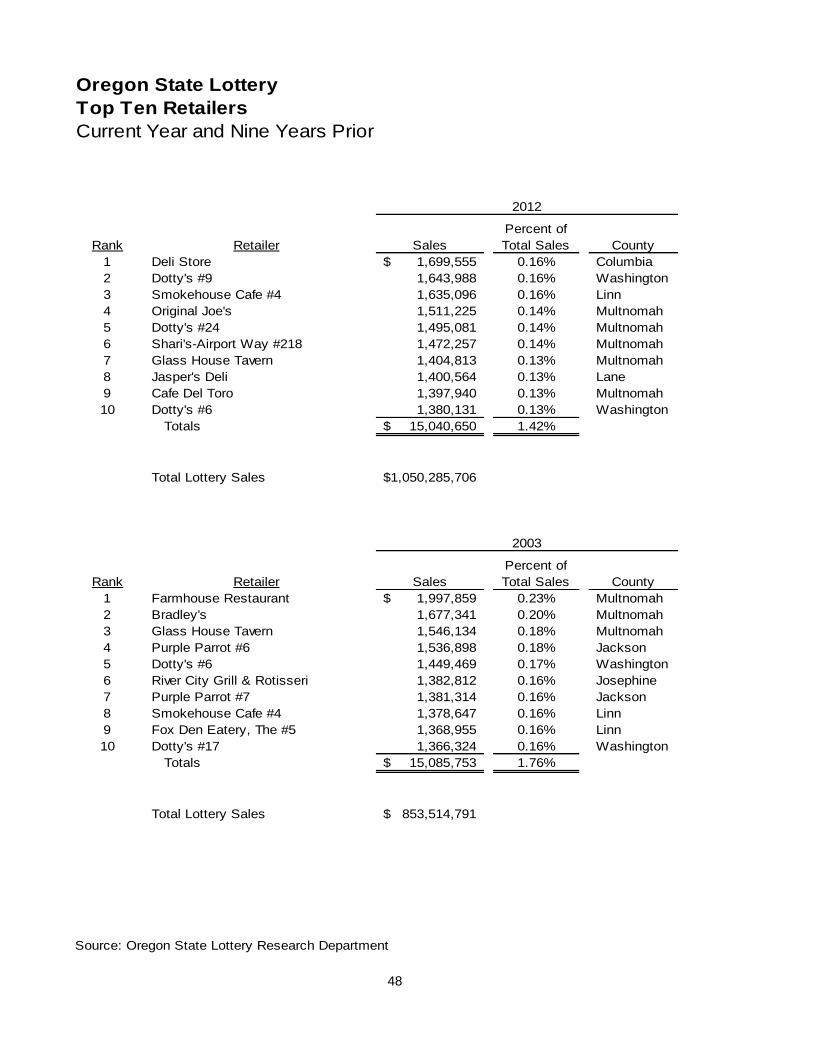
48
Oregon State Lottery
Top Ten Retailers
Current Year and Nine Years Prior
Rank Retailer Sales
Percent of
Total Sales County
1 Deli Store 1,699,555$ 0.16% Columbia
2 Dotty's #9 1,643,988 0.16% Washington
3 Smokehouse Cafe #4 1,635,096 0.16% Linn
4 Original Joe's 1,511,225 0.14% Multnomah
5 Dotty's #24 1,495,081 0.14% Multnomah
6 Shari's-Airport Way #218 1,472,257 0.14% Multnomah
7 Glass House Tavern 1,404,813 0.13% Multnomah
8 Jasper's Deli 1,400,564 0.13% Lane
9 Cafe Del Toro 1,397,940 0.13% Multnomah
10 Dotty's #6 1,380,131 0.13% Washington
Totals 15,040,650$ 1.42%
Total Lottery Sales 1,050,285,706$
Rank Retailer Sales
Percent of
Total Sales County
1 Farmhouse Restaurant 1,997,859$ 0.23% Multnomah
2 Bradley's 1,677,341 0.20% Multnomah
3 Glass House Tavern 1,546,134 0.18% Multnomah
4 Purple Parrot #6 1,536,898 0.18% Jackson
5 Dotty's #6 1,449,469 0.17% Washington
6 River City Grill & Rotisseri 1,382,812 0.16% Josephine
7 Purple Parrot #7 1,381,314 0.16% Jackson
8 Smokehouse Cafe #4 1,378,647 0.16% Linn
9 Fox Den Eatery, The #5 1,368,955 0.16% Linn
10 Dotty's #17 1,366,324 0.16% Washington
Totals 15,085,753$ 1.76%
Total Lottery Sales 853,514,791$
Source: Oregon State Lottery Research Department
2012
2003

49
Oregon State Lottery
Number of Lottery Retailers and Sales by County
For Business Year 2012
County
Business Year
Sales
Percent of
Total
Sales
Number of
Lottery
Retailers
Percent of
Total
Retailers
Multnomah 296,347,642$ 27.87% 947 24.25%
Washington 126,144,651 11.86% 350 8.96%
Clackamas 101,945,254 9.59% 332 8.50%
Marion 89,320,430 8.40% 326 8.34%
Lane 87,437,344 8.22% 351 8.98%
Jackson 49,566,540 4.66% 201 5.14%
Deschutes 36,433,643 3.43% 129 3.30%
Linn 32,954,858 3.10% 135 3.46%
Douglas 23,438,109 2.20% 132 3.38%
Josephine 20,636,446 1.94% 96 2.46%
Columbia 18,605,541 1.75% 62 1.59%
Umatilla 18,369,127 1.73% 78 2.00%
Yamhill 16,850,837 1.58% 79 2.02%
Klamath 16,289,011 1.53% 69 1.77%
Clatsop 16,241,474 1.53% 72 1.84%
Lincoln 13,722,143 1.29% 78 2.00%
Malheur 11,978,080 1.13% 37 0.95%
Coos 10,959,977 1.03% 54 1.38%
Polk 10,806,613 1.02% 56 1.43%
Benton 9,446,512 0.89% 47 1.20%
Tillamook 9,390,212 0.88% 48 1.23%
Wasco 8,646,185 0.81% 29 0.74%
Hood River 6,508,595 0.61% 24 0.61%
Crook 5,773,632 0.54% 27 0.69%
Union 5,547,472 0.52% 30 0.77%
Baker 4,378,091 0.41% 20 0.51%
Jefferson 3,877,191 0.36% 17 0.44%
Curry 3,738,463 0.35% 24 0.61%
Morrow 1,584,622 0.15% 10 0.26%
Grant 1,560,090 0.15% 11 0.28%
Sherman 1,438,835 0.14% 6 0.15%
Lake 1,335,034 0.13% 7 0.18%
Wallowa 886,830 0.08% 9 0.23%
Harney 840,273 0.08% 8 0.20%
Gilliam 206,434 0.02% 4 0.10%
Wheeler 192,171 0.02% 2 0.05%
Total 1,063,398,362$ 100.00% 3,907 100.00%
Source: Oregon State Lottery Research Department
Sales Retailers
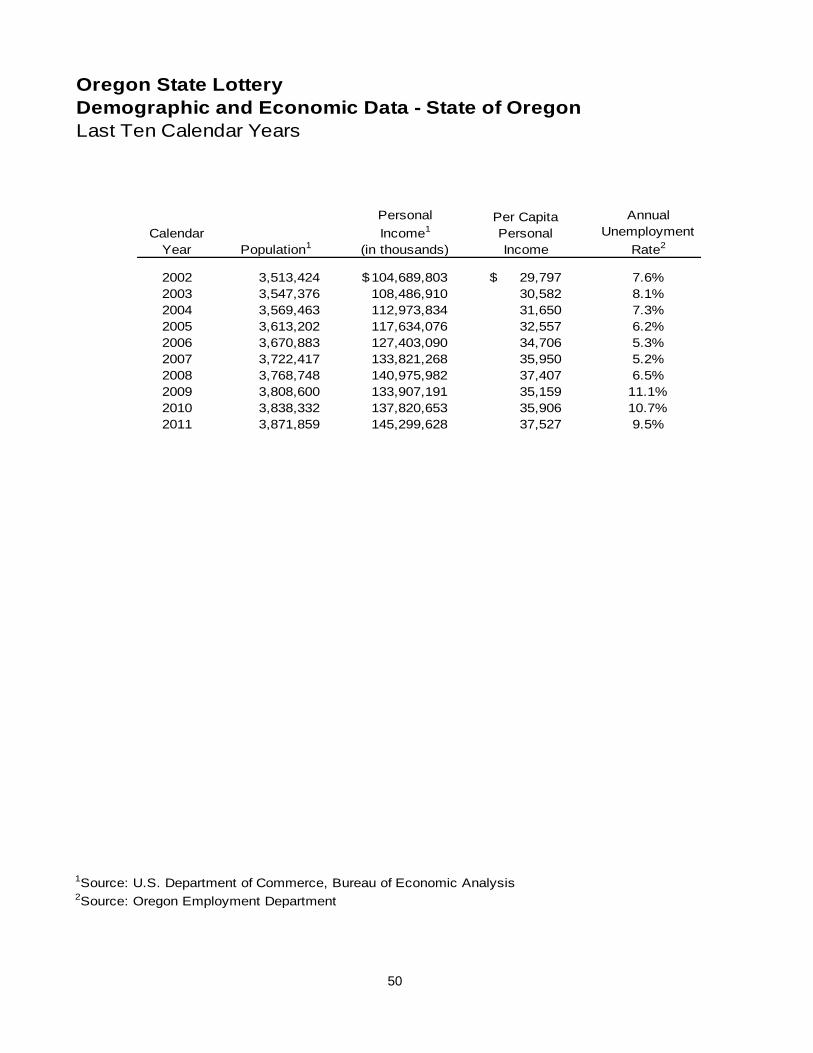
50
Oregon State Lottery
Demographic and Economic Data - State of Oregon
Last Ten Calendar Years
Calendar
Year Population1
Personal
Income1
(in thousands)
Per Capita
Personal
Income
Annual
Unemployment
Rate2
2002 3,513,424 104,689,803$ 29,797$ 7.6%
2003 3,547,376 108,486,910 30,582 8.1%
2004 3,569,463 112,973,834 31,650 7.3%
2005 3,613,202 117,634,076 32,557 6.2%
2006 3,670,883 127,403,090 34,706 5.3%
2007 3,722,417 133,821,268 35,950 5.2%
2008 3,768,748 140,975,982 37,407 6.5%
2009 3,808,600 133,907,191 35,159 11.1%
2010 3,838,332 137,820,653 35,906 10.7%
2011 3,871,859 145,299,628 37,527 9.5%
1Source: U.S. Department of Commerce, Bureau of Economic Analysis2Source: Oregon Employment Department
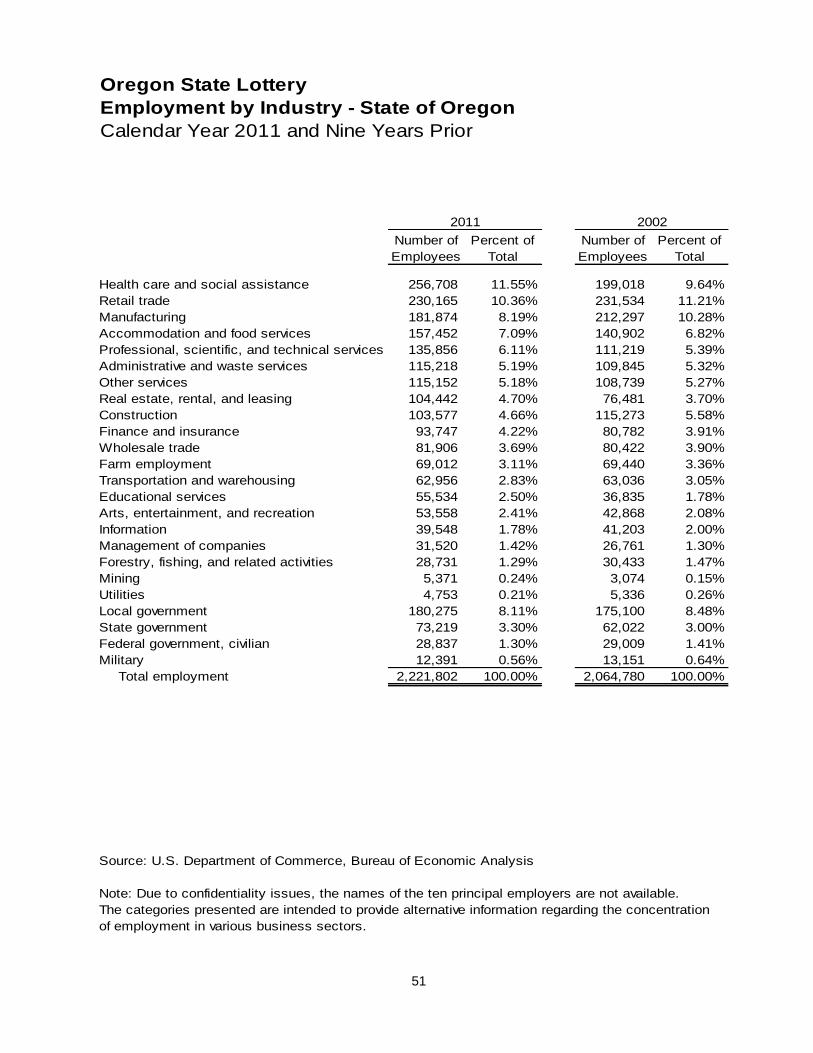
51
Oregon State Lottery
Employment by Industry - State of Oregon
Calendar Year 2011 and Nine Years Prior
Number of
Employees
Percent of
Total
Number of
Employees
Percent of
Total
Health care and social assistance 256,708 11.55% 199,018 9.64%
Retail trade 230,165 10.36% 231,534 11.21%
Manufacturing 181,874 8.19% 212,297 10.28%
Accommodation and food services 157,452 7.09% 140,902 6.82%
Professional, scientific, and technical services 135,856 6.11% 111,219 5.39%
Administrative and waste services 115,218 5.19% 109,845 5.32%
Other services 115,152 5.18% 108,739 5.27%
Real estate, rental, and leasing 104,442 4.70% 76,481 3.70%
Construction 103,577 4.66% 115,273 5.58%
Finance and insurance 93,747 4.22% 80,782 3.91%
Wholesale trade 81,906 3.69% 80,422 3.90%
Farm employment 69,012 3.11% 69,440 3.36%
Transportation and warehousing 62,956 2.83% 63,036 3.05%
Educational services 55,534 2.50% 36,835 1.78%
Arts, entertainment, and recreation 53,558 2.41% 42,868 2.08%
Information 39,548 1.78% 41,203 2.00%
Management of companies 31,520 1.42% 26,761 1.30%
Forestry, fishing, and related activities 28,731 1.29% 30,433 1.47%
Mining 5,371 0.24% 3,074 0.15%
Utilities 4,753 0.21% 5,336 0.26%
Local government 180,275 8.11% 175,100 8.48%
State government 73,219 3.30% 62,022 3.00%
Federal government, civilian 28,837 1.30% 29,009 1.41%
Military 12,391 0.56% 13,151 0.64%
Total employment 2,221,802 100.00% 2,064,780 100.00%
Note: Due to confidentiality issues, the names of the ten principal employers are not available.
The categories presented are intended to provide alternative information regarding the concentration
of employment in various business sectors.
2011 2002
Source: U.S. Department of Commerce, Bureau of Economic Analysis

52
Oregon State Lottery
Demographic Profile of Oregon Lottery Players
Last Ten Calendar Years
2002 2003 2004 2005 2006
Number Surveyed 1,001 1,002 1,000 1,000 1,004
Player Percentage 47.2% 50.8% 50.9% 52.6% 49.0%
Players Players Players Players Players
Gender
Male 56% 53% 40% 51% 51%
Female 45% 47% 60% 49% 49%
Age
18 - 24 9% 11% 14% 11% 14%
25 - 34 21% 18% 18% 18% 20%
35 - 44 23% 24% 17% 21% 19%
45 - 54 22% 21% 24% 18% 22%
55 - 64 13% 14% 14% 13% 13%
65 + 12% 13% 14% 18% 13%
Education
Some High School 3% 5% 3% 2% 6%
High School Graduate 23% 22% 32% 25% 33%
College/Tech School 38% 42% 34% 39% 37%
College Graduate 24% 21% 21% 25% 17%
Graduate School/Degree 11% 11% 9% 9% 7%
Marital Status
Single 22% 21% 23% 21% 22%
Married 56% 60% 65% 55% 54%
Co-habitating 5% 4% 3% 7% 7%
Divorced or Separated 12% 10% 6% 11% 13%
Widowed 5% 5% 3% 6% 4%
Income
Less than $15,000 9% 8% 10% 7% 8%
$15,000 - $49,999 45% 45% 50% 49% 44%
$50,000 - $74,999 21% 19% 16% 16% 20%
$75,000 - $99,999 10% 10% 6% 9% 10%
$100,000 + 9% 8% 7% 7% 6%
Refused/Don't Know 6% 10% 11% 12% 12%
Sources:
Player information from Oregon State Lottery's Tracking Study
State information from U.S. Census Bureau, 2011 American Community Survey
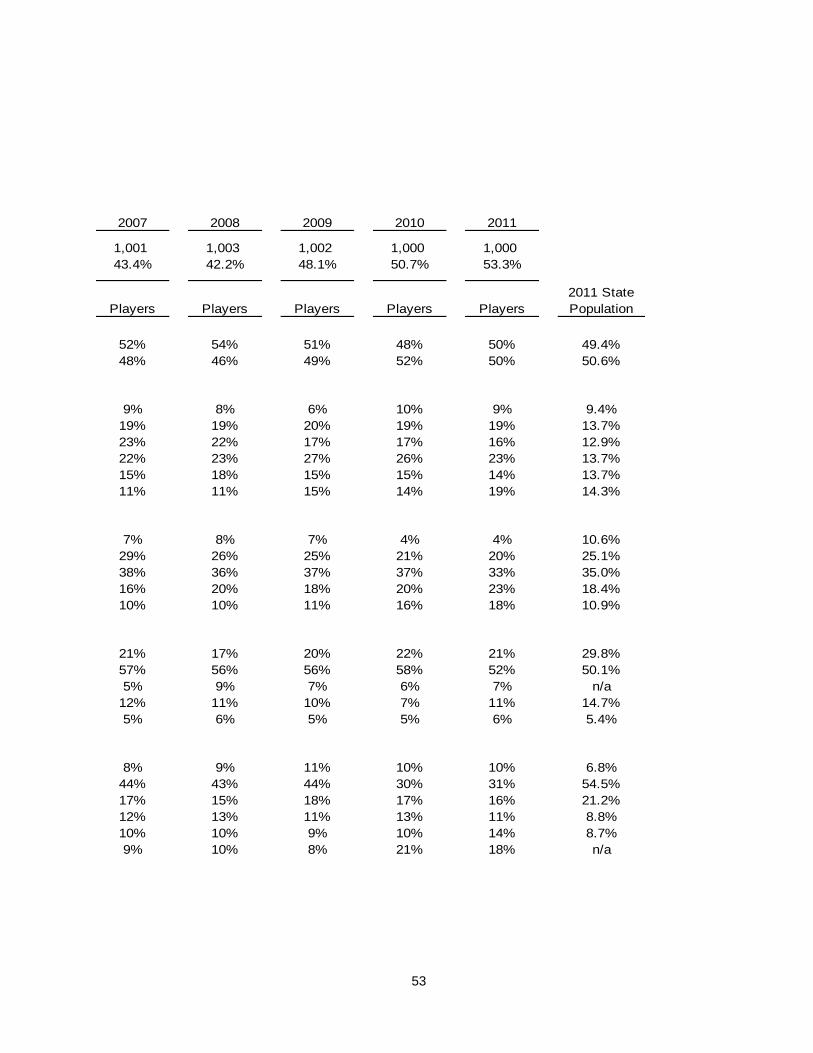
53
2007 2008 2009 2010 2011
1,001 1,003 1,002 1,000 1,000
43.4% 42.2% 48.1% 50.7% 53.3%
Players Players Players Players Players
2011 State
Population
52% 54% 51% 48% 50% 49.4%
48% 46% 49% 52% 50% 50.6%
9% 8% 6% 10% 9% 9.4%
19% 19% 20% 19% 19% 13.7%
23% 22% 17% 17% 16% 12.9%
22% 23% 27% 26% 23% 13.7%
15% 18% 15% 15% 14% 13.7%
11% 11% 15% 14% 19% 14.3%
7% 8% 7% 4% 4% 10.6%
29% 26% 25% 21% 20% 25.1%
38% 36% 37% 37% 33% 35.0%
16% 20% 18% 20% 23% 18.4%
10% 10% 11% 16% 18% 10.9%
21% 17% 20% 22% 21% 29.8%
57% 56% 56% 58% 52% 50.1%
5% 9% 7% 6% 7% n/a
12% 11% 10% 7% 11% 14.7%
5% 6% 5% 5% 6% 5.4%
8% 9% 11% 10% 10% 6.8%
44% 43% 44% 30% 31% 54.5%
17% 15% 18% 17% 16% 21.2%
12% 13% 11% 13% 11% 8.8%
10% 10% 9% 10% 14% 8.7%
9% 10% 8% 21% 18% n/a

54
2003 20042 20052 20062 20073 20084 20095 2010 2011 20126
Retail Operations 215 209 202 211 214 222 218 219 211 202
Support Services 137 126 121 124 135 148 157 151 151 143
Marketing 25 30 26 26 29 29 37 36 37 27
Director's Office 31 25 29 29 30 31 32 30 31 29
Security1 8 9 11 11 12 17 19 17 16 16
Total 416 399 389 401 420 447 463 453 446 417
Source: Oregon State Payroll System
2During fiscal year 2004 to 2006, some vacant positions were eliminated to reduce operating expenses.3Positions were added in fiscal year 2007 to address the growth of the Lottery, to restore some vacant
positions previously eliminated, and to build the infrastructure needed to support future growth.4In fiscal year 2008, positions were added to support the Lottery's business that is driven by technology,
expand into web-based products, and respond to system growth.5During fiscal year 2009, vacant positions in Marketing were filled and some temporary employees were
hired to assist with promotional Marketing activities.6There were a significant number of positions vacant at year end due to a hiring freeze in effect during part
of fiscal year 2012.
Oregon State Lottery
Number of Employees
Last Ten Fiscal Years
1Number of employees for Security excludes employees of the Oregon State Police.
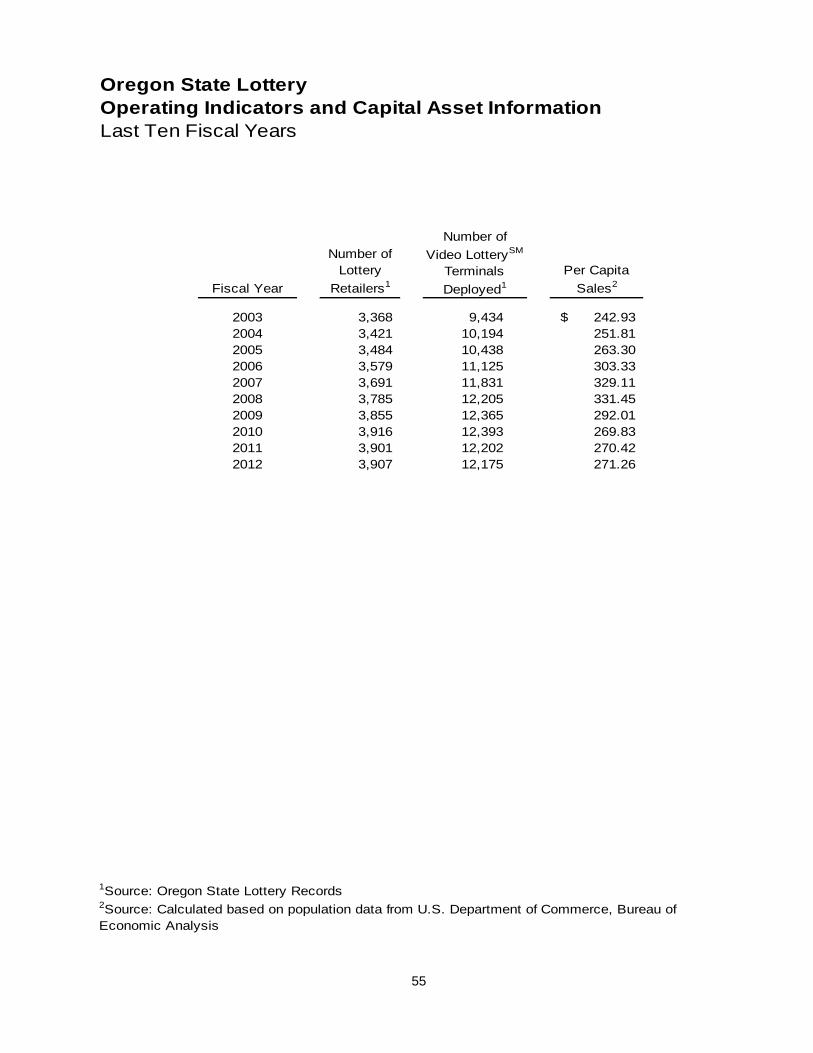
55
Oregon State Lottery
Operating Indicators and Capital Asset Information
Last Ten Fiscal Years
Fiscal Year
Number of
Lottery
Retailers1
Per Capita
Sales2
2003 3,368 9,434 242.93$
2004 3,421 10,194 251.81
2005 3,484 10,438 263.30
2006 3,579 11,125 303.33
2007 3,691 11,831 329.11
2008 3,785 12,205 331.45
2009 3,855 12,365 292.01
2010 3,916 12,393 269.83
2011 3,901 12,202 270.42
2012 3,907 12,175 271.26
1Source: Oregon State Lottery Records2Source: Calculated based on population data from U.S. Department of Commerce, Bureau of
Economic Analysis
Number of
Video LotterySM
Terminals
Deployed1

56
This page intentionally left blank.

Other Reports
Office of the Secretary of State Audits Division Kate Brown Gary Blackmer Secretary of State Director Barry Pack 255 Capitol St. NE, Suite 500 Deputy Secretary of State Salem, OR 97310 (503) 986-2255 fax (503) 378-6767
58
The Honorable John Kitzhaber Governor of Oregon 900 Court Street NE Salem, Oregon 97301-4047 Elisa Dozono, Chair Oregon State Lottery Commission 500 Airport Road SE Salem, Oregon 97301
REPORT ON INTERNAL CONTROL OVER FINANCIAL REPORTING AND ON COMPLIANCE AND OTHER MATTERS BASED ON AN AUDIT OF FINANCIAL STATEMENTS PERFORMED
IN ACCORDANCE WITH GOVERNMENT AUDITING STANDARDS
We have audited the financial statements of the Oregon State Lottery, as of and for the year ended June 30, 2012, and have issued our report thereon dated November 16, 2012. We conducted our audit in accordance with auditing standards generally accepted in the United States of America and the standards applicable to financial audits contained in Government Auditing Standards, issued by the Comptroller General of the United States.
Internal Control Over Financial Reporting
Management of the Oregon State Lottery is responsible for establishing and maintaining effective internal control over financial reporting. In planning and performing our audit, we considered the Oregon State Lottery’s internal control over financial reporting as a basis for designing our auditing procedures for the purpose of expressing our opinion on the financial statements, but not for the purpose of expressing an opinion on the effectiveness of the Oregon State Lottery’s internal control over financial reporting. Accordingly, we do not express an opinion on the effectiveness of the Oregon State Lottery’s internal control over financial reporting.
A deficiency in internal control exists when the design or operation of a control does not allow management or employees, in the normal course of performing their assigned functions, to prevent, or detect and correct misstatements on a timely basis. A material weakness is a deficiency, or combination of deficiencies, in internal control, such that there is
59
a reasonable possibility that a material misstatement of the entity’s financial statements will not be prevented, or detected and corrected on a timely basis.
Our consideration of internal control over financial reporting was for the limited purpose described in the first paragraph of this section and was not designed to identify all deficiencies in internal control over financial reporting that might be deficiencies, significant deficiencies or material weaknesses. We did not identify any deficiencies in internal control over financial reporting that we consider to be material weaknesses, as defined previously. Compliance and Other Matters
As part of obtaining reasonable assurance about whether the Oregon State Lottery’s financial statements are free of material misstatement, we performed tests of its compliance with certain provisions of laws, regulations, contracts, and grant agreements, noncompliance with which could have a direct and material effect on the determination of financial statement amounts. However, providing an opinion on compliance with those provisions was not an objective of our audit, and accordingly, we do not express such an opinion. The results of our tests disclosed no instances of noncompliance or other matters that are required to be reported under Government Auditing Standards. This report is intended solely for the information and use of the Oregon State Lottery Commission, the Oregon State Lottery’s management, others within the entity, the governor of the State of Oregon, and the Oregon Legislative Assembly and is not intended to be and should not be used by anyone other than these specified parties.
OREGON AUDITS DIVISION
Kate Brown Secretary of State November 16, 2012