Optimal Molecular Profiling of Tissue and Tissue …€¦ · Molecular Profiling of Tissue 15 15...
52
15 From: Methods in Molecular Medicine, Vol. 103: Pancreatic Cancer: Methods and Protocols Edited by: G. Su © Humana Press Inc., Totowa, NJ 2 Optimal Molecular Profiling of Tissue and Tissue Components Defining the Best Processing and Microdissection Methods for Biomedical Applications G. Steven Bova, Isam A. Eltoum, John A. Kiernan, Gene P. Siegal, Andra R. Frost, Carolyn J. M. Best, John W. Gillespie, and Michael R. Emmert-Buck Summary Isolation of well-preserved pure cell populations is a prerequisite for sound studies of the molecular basis of pancreatic malignancy and other biological phenomena. This chapter reviews current methods for obtaining anatomically specific signals from molecules isolated from tissues, a basic requirement for productive linking of phenotype and genotype. The quality of samples isolated from tissue and used for molecular analysis is often glossed-over or omitted from publica- tions, making interpretation and replication of data difficult or impossible. Fortunately, recently developed techniques allow life scientists to better document and control the quality of samples used for a given assay, creating a foundation for improvement in this area. Tissue processing for molecular studies usually involves some or all of the following steps: tissue collection, gross dis- section/identification, fixation, processing/embedding, storage/archiving, sectioning, staining, microdissection/annotation, and pure analyte labeling/identification. High-quality tissue micro- dissection does not necessarily mean high-quality samples to analyze. The quality of biomaterials obtained for analysis is highly dependent on steps upstream and downstream from tissue micro- dissection. We provide protocols for each of these steps, and encourage you to improve upon these. It is worth the effort of every laboratory to optimize and document its technique at each stage of the process, and we provide a starting point for those willing to spend the time to opti- mize. In our view, poor documentation of tissue and cell type of origin and the use of nonopti- mized protocols is a source of inefficiency in current life science research. Even incremental improvement in this area will increase productivity significantly. Key Words: Molecular profiling; tissue processing; tissue staining; sample processing; laser microdissection; RNA; DNA; quality control; workflow management.
Transcript of Optimal Molecular Profiling of Tissue and Tissue …€¦ · Molecular Profiling of Tissue 15 15...
Molecular Profiling of Tissue 15
15
From: Methods in Molecular Medicine, Vol. 103: Pancreatic Cancer: Methods and ProtocolsEdited by: G. Su © Humana Press Inc., Totowa, NJ
2
Optimal Molecular Profilingof Tissue and Tissue ComponentsDefining the Best Processing and MicrodissectionMethods for Biomedical Applications
G. Steven Bova, Isam A. Eltoum, John A. Kiernan,Gene P. Siegal, Andra R. Frost, Carolyn J. M. Best,John W. Gillespie, and Michael R. Emmert-Buck
SummaryIsolation of well-preserved pure cell populations is a prerequisite for sound studies of the
molecular basis of pancreatic malignancy and other biological phenomena. This chapter reviews
current methods for obtaining anatomically specific signals from molecules isolated from tissues,
a basic requirement for productive linking of phenotype and genotype. The quality of samples
isolated from tissue and used for molecular analysis is often glossed-over or omitted from publica-
tions, making interpretation and replication of data difficult or impossible. Fortunately, recently
developed techniques allow life scientists to better document and control the quality of samples
used for a given assay, creating a foundation for improvement in this area. Tissue processing for
molecular studies usually involves some or all of the following steps: tissue collection, gross dis-
section/identification, fixation, processing/embedding, storage/archiving, sectioning, staining,
microdissection/annotation, and pure analyte labeling/identification. High-quality tissue micro-
dissection does not necessarily mean high-quality samples to analyze. The quality of biomaterials
obtained for analysis is highly dependent on steps upstream and downstream from tissue micro-
dissection. We provide protocols for each of these steps, and encourage you to improve upon
these. It is worth the effort of every laboratory to optimize and document its technique at each
stage of the process, and we provide a starting point for those willing to spend the time to opti-
mize. In our view, poor documentation of tissue and cell type of origin and the use of nonopti-
mized protocols is a source of inefficiency in current life science research. Even incremental
improvement in this area will increase productivity significantly.
Key Words: Molecular profiling; tissue processing; tissue staining; sample processing; laser
microdissection; RNA; DNA; quality control; workflow management.
16 Bova et al.
1. IntroductionIsolation of well-preserved pure cell populations is a prerequisite for sound
studies of the molecular basis of pancreatic malignancy and other biologicalphenomena. This chapter reviews current methods for obtaining anatomicallyspecific signals from molecules isolated from tissues, a basic requirement forproductive linking of phenotype and genotype.
The quality of samples isolated from tissue and used for molecular analysisis often glossed over or omitted from publications, making interpretation andreplication of data difficult or impossible. Fortunately, recently developed tech-niques allow life scientists to better document and control the quality of samplesused for a given assay, creating a foundation for improvement in this area.
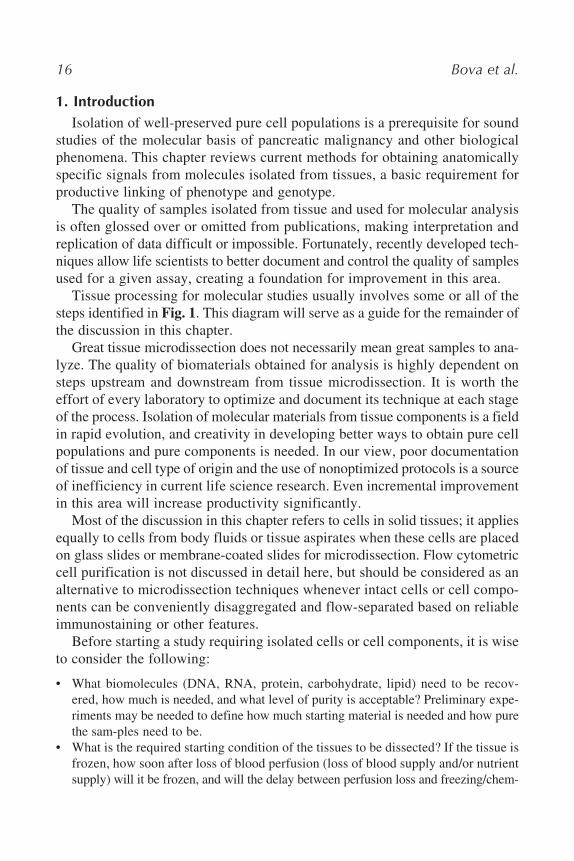
Tissue processing for molecular studies usually involves some or all of thesteps identified in Fig. 1. This diagram will serve as a guide for the remainder ofthe discussion in this chapter.
Great tissue microdissection does not necessarily mean great samples to ana-lyze. The quality of biomaterials obtained for analysis is highly dependent onsteps upstream and downstream from tissue microdissection. It is worth theeffort of every laboratory to optimize and document its technique at each stageof the process. Isolation of molecular materials from tissue components is a fieldin rapid evolution, and creativity in developing better ways to obtain pure cellpopulations and pure components is needed. In our view, poor documentationof tissue and cell type of origin and the use of nonoptimized protocols is a sourceof inefficiency in current life science research. Even incremental improvementin this area will increase productivity significantly.
Most of the discussion in this chapter refers to cells in solid tissues; it appliesequally to cells from body fluids or tissue aspirates when these cells are placedon glass slides or membrane-coated slides for microdissection. Flow cytometriccell purification is not discussed in detail here, but should be considered as analternative to microdissection techniques whenever intact cells or cell compo-nents can be conveniently disaggregated and flow-separated based on reliableimmunostaining or other features.
Before starting a study requiring isolated cells or cell components, it is wiseto consider the following:
• What biomolecules (DNA, RNA, protein, carbohydrate, lipid) need to be recov-
ered, how much is needed, and what level of purity is acceptable? Preliminary expe-
riments may be needed to define how much starting material is needed and how pure
the sam-ples need to be.
• What is the required starting condition of the tissues to be dissected? If the tissue is
frozen, how soon after loss of blood perfusion (loss of blood supply and/or nutrient
supply) will it be frozen, and will the delay between perfusion loss and freezing/chem-
Molecular Profiling of Tissue 17
Fig. 1. Tissue processing for molecular analysis: flow diagram.
ical fixation affect the biomolecules you seek to examine? Will drugs that the tissue
donor has received affect the molecules to be analyzed within the tissue? Does the
tissue have a high level of endogenous or exogenous bacterial or fungal DNase or
18 Bova et al.
RNase activity? Will frozen sections provide adequate histological detail to allow
dissection of the cells of interest? If the tissue was chemically fixed (denoted “fixed”
in the remainder of this chapter), are the target biomolecules in acceptable condi-
tion for the planned assay? For example, synthesis of full-length cDNA would be
unlikely from formalin-fixed tissues, and target structures may not be adequately
visualized from frozen sections, depending on how the structures are to be identi-
fied, and how the tissue sample was frozen.
• What tissue dissection method will be most verifiable (i.e., providing evidence that
the cells targeted were actually obtained without contamination), efficient, eco-
nomical, and best documented?
Combining detailed answers to these questions with informed selection fromthe various options discussed in this chapter will optimize molecular profilingproductivity.
The following information is based on methods currently in use in our labo-ratories. However, it is not meant to be encyclopedic and the cited referencesprovide a good starting point for additional reading. Also note that the historyof tissue fixation and microdissection is not covered here. A brief review ofthis history is contained in a recent review by Eltoum et al. (1) and is touchedon by Srinivasan et al. (2), and some of the key molecular methods discussedhere (and additional topics) are also detailed in articles from the NCI Labora-tory of Pathology Pathogenetics Unit (3–10). Some of the useful textbooks inthe field are also listed in the bibliography (11–14). The books by Kiernan (13,
14) provide valuable information on chemical changes induced by fixation andstaining that may be useful for those wishing to design and test new protocols.An e-mail listserver for broadcasting specific histotechnology-related questions(with a searchable archive of past questions) is also available (15).
1.1. Biosafety Issues
Be sure to consider biosafety needs related to tissue handling in your labo-ratory. Tissues should always be handled using Universal Precautions. Fresh orprocessed tissues or their components should not come in direct contact withskin or mucous membranes, and in situations where tissue components could bereleased in the air, ventilatory isolation (by wearing masks and using biosafetyhoods or other containment devices) should be used. Immunizations for pre-ventable infections such as hepatitis B should be considered if the risk of expo-sure is considered significant. Higher levels of isolation are required if exposureto tuberculosis, prion disease, or other infectious disease is likely. If the tissuesstudied could contain particularly toxic substances (radioactive isotopes, chemo-therapy drugs, etc.), appropriate steps should be taken to prevent significantexposure by laboratory personnel.
Molecular Profiling of Tissue 19
1.2. Tissue Collection and Processing
The best tissue collection method will depend on the specifics of your situ-ation. Interval between loss of blood perfusion and cooling or fixation, methodof fixation, and uniformity of labeling and processing methods are some of thecritical parameters for any study and are discussed in more detail below.
“Fixation” of tissues can occur through freezing and/or through chemicalfixation. We discuss only formaldehyde fixation (because it is still the stan-dard) and alcohol-based tissue fixation (because it is a simple and inexpensivealternative that has worked in our hands), but the reader should be aware that anumber of proprietary fixatives that claim to provide good histologic and molec-ular preservation are also available.
1.3. Staining of Tissue Sections
Hematoxylin and eosin (H&E) staining has been the standard diagnostic tis-sue section staining method for more than a century. For molecular analyses,under the right conditions (see Subheading 3.), DNA and RNA can be obtainedfrom H&E-stained material. Hematoxylin stains negatively charged moleculesincluding nucleic acids and rough endoplasmic reticulum blue-violet, and eosinstains positively charged moieties including positively charged amino acids pink-red. Eosins are halogenated derivatives of fluorescein, and eosin Y is the formof eosin in most common use. Both RNA and DNA can be isolated from H&E-stained sections, if the tissue is well preserved and stained properly. Because itfluoresces, eosin interferes with many protein analyses using fluorescent detec-tion. It should also be noted that Mayer’s hematoxylin itself does not stain tis-sue. In solution, oxidizing agents such as alum (AlK[SO4]2
.12H2O) converthematoxylin to hematein. The correct terminology for this stain is Mayer’s hem-alum, which is a concatenated product of hematein and alum. Other types ofhematoxylin use other oxidizing agents.
Methylene blue is a cationic dye. It stains DNA, RNA, and carbohydratepolyanions. Cytoplasm is strongly stained if a cell is rich in RNA (neurons withNissl substance, secretory cells, etc.) or anionic mucosubstances (heparin in mastcells; many types of mucous). It is used prior to microdissection for DNA andprotein isolation, but not for RNA isolation (16).
Methyl green stains nuclei dark green, cytoplasm light green. According toa credible but nonpeer-reviewed study by Agilent, methyl green was best forRNA isolation when compared to the other stains mentioned here (16); methylgreen is also reportedly compatible with DNA and protein isolation. Please notethat what is currently sold as “methyl green” is actually “ethyl green” chem-ically. True “methyl green” has not been available for about 30 yr (17).
20 Bova et al.
Nuclear fast red stains nuclei dark red, cytoplasm lighter red. It is always usedin conjunction with an aluminum salt, and its mechanism of action is not known.It is important to buy the right dye (Chemical Index or CI 60760) because thesame name is sometimes used to label on other dyes that will not work (17). Inthe same Agilent study, nuclear fast red performed as well as H&E for RNAisolation, but better than methylene blue.
1.3.1. Immunostaining for Microdissection
Tissue microdissection for molecular analysis is frequently limited by thedifficulty in identifying cell types and structures by morphology combined withtinctorial (e.g., H&E) staining alone. The NCI Laboratory of Pathology Patho-genetics Unit and others have developed rapid immunostaining procedures formicrodissection and RNA extraction from frozen sections (6), as summarizedhere. This method allows mRNA analysis of specific cell populations that havebeen isolated according to immunophenotype. Sections fixed in acetone,methanol, or ethanol/acetone give excellent immunostaining after only 12–25min total processing time. Specificity, precision, and speed of microdissectionare markedly increased due to improved identification of desired cell types.
1.4. Preparation of Cytologic Specimens for Microdissection
Cells centrifuged from body fluids or fine-needle aspirates, or cells propa-gated in vitro can be prepared for microdissection by making direct smears orthrough a number of effective proprietary methods for creating thin layers ofcells in designated areas of microscope slides. A subset of less adherent cellswithin fresh tissues can also be rapidly sampled by gentle scraping with a scal-pel blade and then rapidly spreading the scraped sample onto a glass slide withthe blade. The choice of strategy for preparing cell suspensions for microdis-section depends on the anticipated cellularity of the sample. Highly cellularsamples can be prepared as direct smears and effectively utilized for laser micro-dissection, less cellular samples can be concentrated using one of the proprie-tary cell concentration methodologies such as Cytospin® (Thermo Shandon Inc.),or more recent technologies such as ThinPrep (Cytyc Corp.) or AutocytePrep(TriPath Imaging).
1.5. Manual Microdissection of Blocks and Slides
1.5.1. Cryostat-Based Manual Dissection of Frozen Tissue Blocks
It is often possible to obtain sufficient purity and relatively prodigious quan-tities of DNA, RNA, or protein from serial manual dissection of frozen tissueblocks directly on a suitable cryostat. Below we describe a method that can
Molecular Profiling of Tissue 21
increase purity from 10–50% to 75–95% for cell types that grow in macro-scopic clusters.
1.5.2. Manual Microdissection of Tissue Sections on SlidesSeveral manual microdissection methods can be performed on glass slides,
and innovation in manual microdissection methods has continued despite therecent development of laser-based microdissection approaches. Techniquesusing hand-held tools (18), mechanical micromanipulators (19), manually cut-ting out areas of sections mounted on cellophane tape (20), ultrasonic oscillat-ing needles (21), and methods specific to cytology specimens (22,23), havebeen described. Along these lines, Eppendorf has recently marketed a “PiezoPower Micro Dissection (PPMD) System” that is inexpensive relative to thelaser dissection systems, and may work well when small quantities of dissectedmaterial are needed. The advantage of manual dissection is simpler equipmentrequirements, making it accessible to most laboratories. Its disadvantages are asfollows: it is time consuming; it has a steep learning curve; the smallest dis-sectable region of interest (ROI) is generally significantly larger than that rou-tinely obtainable with laser-based approaches; and documentation of manualdissection is usually not of as high a quality because it does not fit easily intothe manual microdissection workflow.
1.6. Laser-Based Tissue Microdissection SystemsArcturus, Leica, and Zeiss/PALM laser-based Tissue Section Microdissec-
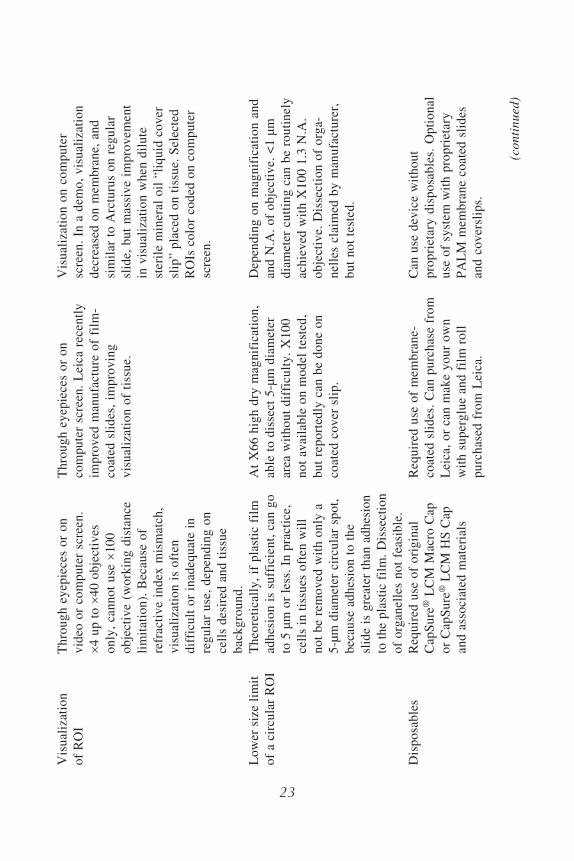
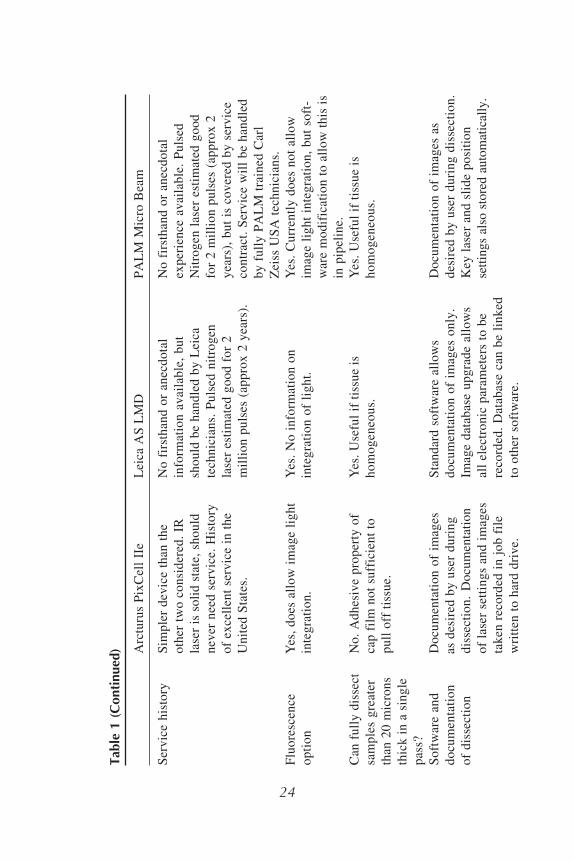
tion Systems are discussed here. All three systems are effective depending onspecific needs of the user, and each instrument has its advantages and disadvan-tages. A comparison of the Arcturus, Leica, and Zeiss/PALM systems is con-tained in Table 1. Laser tissue microdissection systems have also recently beenmade available by Bio-Rad (Hercules, CA) and MMI AG (Glottbrugg, Switzer-land), neither of which is discussed here.
1.6.1. Arcturus PixCell IIe LCM (Laser Capture Microdissection) SystemLCM utilizes an infrared laser integrated into a standard inverted microscope,
and is based on patented “Laser Capture Microdissection”(LCM) technologyoriginally described by Emmert-Buck et al. (24), and licensed to Arcturus Inc.(Santa Clara, CA, USA). Arcturus introduced its first PixCell system based onthis technology in 1996. In LCM, a transparent plastic (CapSure™, Arcturus,Mountain View, CA, USA) cap with attached ethylene vinyl acetate (EVA)transparent thermoplastic membrane is placed on the surface of a non-cover-slipped, stained tissue section mounted on a standard glass slide. The EVA filmis in direct contact (CapSure Macro caps) or slightly above (CapSure HS caps) thetissue section (Fig. 2). CapSure HS caps are designed to reduce or eliminate the

22 Bova et al.
Tabl
e 1
Com
pari
son
of C
riti
cal F
eatu
res
of A
rctu
rus,
Lei
ca, a
nd P
ALM
Tis
sue
Mic
rodi
ssec
tion
Sys
tem
s A
vaila
ble
in 2
003
Arc
turu
s P
ixC
ell
IIe
Lei
ca A
S L
MD
PA
LM
Mic
ro B
eam
Tis
sue
Iso
lati
on
(a)
Use
r m
elts
EV
A (
eth
yl-
(a)
UV
-A L
aser
(3
37
nm
)(a
) N
on
con
tact
tra
nsf
er o
f R
OI
Met
ho
d(s
)en
e v
iny
l ac
etat
e) p
last
iccu
ttin
g o
f ci
rcu
msc
rib
ed R
OI
fro
m s
lid
e su
rfac
e b
y l
aser
on
to R
OI
usi
ng
IR
las
erfr
om
in
ver
ted
mem
bra
ne-
coat
edp
ress
ure
cat
apu
ltin
g (
LP
C)
RO
I:(9
80
–1
06
4 n
m),
slid
es a
nd
co
ver
sli
ps.
(b)
“Co
ld”
abla
tio
n o
f u
nd
esir
ed
Reg
ion
of
inte
rest
pla
stic
is
lift
ed f
rom
sli
de,
(b)
“Co
ld”
abla
tio
n o
f u
nd
esir
edar
eas
wit
h U
V-A
las
er (
33
7 n
m)
and
RO
I re
mai
ns
atta
ched
area
s w
ith
UV
-A l
aser
(3
37
nm
)(c
) U
V-A
las
er c
utt
ing
of
cir-
to E
VA
, w
hil
e re
mai
nd
ercu
msc
ribed
RO
I fr
om
mem
bra
ne-
of
tiss
ue
rem
ain
s o
n s
lid
e.co
ated
sli
des
an
d c
ov
er s
lip
s,
foll
ow
ed b
y l
aser
pre
ssure
cata
pult
ing o
f se
lect
ed m
emb
ran
e
reg
ion
Sel
ecti
on
of
RO
IM
anu
al c
on
tro
l o
f st
age
Au
tom
ated
op
tica
lly
-co
ntr
oll
edA
uto
mat
ed s
tag
e m
oti
on
mo
tio
n l
ink
ed t
o v
ideo
lase
r b
eam
tar
get
ing
co
ntr
oll
ed(s
teppin
g s
ize
128 n
m)
contr
oll
ed
imag
e o
r d
irec
t o
bse
rvat
ion
by
use
r se
lect
ion
of
RO
I o
nb
y u
ser
sele
ctio
n o
f R
OI
on
thro
ug
h m
icro
sco
pe.
com
pu
ter
scre
en (
nei
ther
sta
ge
com
pu
ter
scre
en.
Use
r ca
n s
elec
t
no
r la
ser
mo
ves
). U
ser
can
als
om
ult
iple
co
ded
RO
Is w
ith
in a
nd
vie
w t
hro
ug
h e
yep
iece
s. U
ser
ou
tsid
e in
itia
l im
age
foll
ow
ed b
y
can
sel
ect
mu
ltip
le R
OIs
wit
hin
auto
mat
ed c
oll
ecti
on
pro
cess
.
on
e fi
eld
at
a ti
me.
22
Molecular Profiling of Tissue 23V
isu
aliz
atio
nT
hro
ug
h e
yep
iece
s o
r o
nT
hro
ug
h e
yep
iece
s o
r o
nV
isu
aliz
atio
n o
n c
om
pu
ter
of
RO
Iv
ideo
or
com
pu
ter
scre
en.
com
pu
ter
scre
en.
Lei
ca r
ecen
tly
scre
en.
In a
dem
o,
vis
ual
izat
ion
�4
up
to
�4
0 o
bje
ctiv
esim
pro
ved
man
ufa
ctu
re o
f fi
lm-
dec
reas
ed o
n m
emb
ran
e, a
nd
on
ly,
can
no
t u
se �
10
0co
ated
sli
des
, im
pro
vin
gsi
mil
ar t
o A
rctu
rus
on
reg
ula
r
ob
ject
ive
(wo
rkin
g d
ista
nce
vis
ual
izat
ion
of
tiss
ue.
slid
e, b
ut
mas
siv
e im
pro
vem
ent
lim
itat
ion
). B
ecau
se o
fin
vis
ual
izat
ion
wh
en d
ilu
te
refr
acti
ve
ind
ex m
ism
atch
,st
eril
e m
iner
al o
il “
liq
uid
co
ver
vis
ual
izat
ion
is
oft
ensl
ip”
pla
ced
on
tis
sue.
Sel
ecte
d
dif
ficu
lt o
r in
adeq
uat
e in
RO
Is c
olo
r co
ded
on
co
mp
ute
r
reg
ula
r u
se,
dep
end
ing
on
scre
en.
cell
s d
esir
ed a
nd
tis
sue
bac
kg
rou
nd
.
Lo
wer
siz
e li
mit
Th
eore
tica
lly
, if
pla
stic
fil
mA
t X
66
hig
h d
ry m
agn
ific
atio
n,
Dep
end
ing
on
mag
nif
icat
ion
an
d
of
a ci
rcu
lar
RO
Iad
hes
ion
is
suff
icie
nt,
can
go
able
to
dis
sect
5-µ
m d
iam
eter
and
N.A
. o
f o
bje
ctiv
e. <
1 µ
m
to 5
µm
or
less
. In
pra
ctic
e,ar
ea w
ith
ou
t d
iffi
cult
y.
X1
00
dia
met
er c
utt
ing
can
be
rou
tin
ely
cell
s in
tis
sues
oft
en w
ill
no
t av
aila
ble
on
mo
del
tes
ted
,ac
hie
ved
wit
h X
10
0 1
.3 N
.A.
no
t b
e re
mo
ved
wit
h o
nly
ab
ut
rep
ort
edly
can
be
do
ne
on
ob
ject
ive.
Dis
sect
ion
of
org
a-
5-µ
m d
iam
eter
cir
cula
r sp
ot,
coat
ed c
ov
er s
lip
.n
elle
s cl
aim
ed b
y m
anu
fact
ure
r,
bec
ause
ad
hes
ion
to
th
eb
ut
no
t te
sted
.
slid
e is
gre
ater
th
an a
dh
esio
n
to t
he
pla
stic
fil
m.
Dis
sect
ion
of
org
anel
les
no
t fe
asib
le.
Dis
po
sab
les
Req
uir
ed u
se o
f o
rig
inal
Req
uir
ed u
se o
f m
emb
ran
e-C
an u
se d
evic
e w
ith
ou
t
Cap
Su
re®
LC
M M
acro
Cap
coat
ed s
lid
es.
Can
pu
rch
ase
fro
mp
rop
riet
ary
dis
po
sab
les.
Op
tio
nal
or
Cap
Su
re®
LC
M H
S C
apL
eica
, o
r ca
n m
ake
yo
ur
ow
nu
se o
f sy
stem
wit
h p
rop
riet
ary
and
ass
oci
ated
mat
eria
lsw
ith
su
per
glu
e an
d f
ilm
ro
llP
AL
M m
emb
ran
e co
ated
sli
des
pu
rch
ased
fro
m L
eica
.an
d c
ov
ersl
ips.
(co
nti
nu
ed
)
23
24 Bova et al.
Tabl
e 1
(Con
tinu
ed) A
rctu
rus
Pix
Cel
l II
eL
eica
AS
LM
DP
AL
M M
icro
Bea
m
Ser
vic
e h
isto
ryS
imp
ler
dev
ice
than
th
eN
o f
irst
han
d o
r an
ecd
ota
lN
o f
irst
han
d o
r an
ecd
ota
l
oth
er t
wo
co
nsi
der
ed.
IRin
form
atio
n a
vai
lab
le,
bu
tex
per
ien
ce a
vai
lab
le.
Pu
lsed
lase
r is
so
lid
sta
te,
sho
uld
sho
uld
be
han
dle
d b
y L
eica
Nit
rog
en l
aser
est
imat
ed g
oo
d
nev
er n
eed
ser
vic
e. H
isto
ryte
chn
icia
ns.
Pu
lsed
nit
rog
enfo
r 2
mil
lio
n p
uls
es (
app
rox
2
of
exce
llen
t se
rvic
e in
th
ela
ser
esti
mat
ed g
oo
d f
or
2y
ears
), b
ut
is c
ov
ered
by
ser
vic
e
Un
ited
Sta
tes.
mil
lio
n p
uls
es (
app
rox
2 y
ears
).co
ntr
act.
Ser
vic
e w
ill
be
han
dle
d
by
fu
lly
PA
LM
tra
ined
Car
l
Zei
ss U
SA
tec
hn
icia
ns.
Flu
ore
scen
ceY
es,
do
es a
llo
w i
mag
e li
gh
tY
es.
No
in
form
atio
n o
nY
es.
Cu
rren
tly
do
es n
ot
allo
w
op
tio
nin
teg
rati
on
.in
teg
rati
on
of
lig
ht.
imag
e li
gh
t in
teg
rati
on
, b
ut
soft
-
war
e m
od
ific
atio
n t
o a
llo
w t
his
is
in p
ipel
ine.
Can
fu
lly
dis
sect
No
. A
dh
esiv
e p
rop
erty
of
Yes
. U
sefu
l if
tis
sue
isY
es.
Use
ful
if t
issu
e is
sam
ple
s g
reat
erca
p f
ilm
no
t su
ffic
ien
t to
ho
mo
gen
eou
s.h
om
og
eneo
us.
than
20
mic
ron
sp
ull
off
tis
sue.
thic
k i
n a
sin
gle
pas
s?
So
ftw
are
and
Do
cum
enta
tio
n o
f im
ages
Sta
nd
ard
so
ftw
are
allo
ws
Do
cum
enta
tio
n o
f im
ages
as
do
cum
enta
tio
nas
des
ired
by
use
r d
uri
ng
do
cum
enta
tio
n o
f im
ages
on
ly.
des
ired
by
use
r d
uri
ng
dis
sect
ion
.
of
dis
sect
ion
dis
sect
ion
. D
ocu
men
tati
on
Imag
e d
atab
ase
up
gra
de
allo
ws
Key
las
er a
nd
sli
de
po
siti
on
of
lase
r se
ttin
gs
and
im
ages
all
elec
tro
nic
par
amet
ers
to b
ese
ttin
gs
also
sto
red a
uto
mat
ical
ly.
tak
en r
eco
rded
in
jo
b f
ile
reco
rded
. D
atab
ase
can
be
lin
ked
wri
tten
to
har
d d
riv
e.to
oth
er s
oft
war
e.
24

Molecular Profiling of Tissue 25Q
ual
ity
of
Nu
mer
ou
s p
ub
lica
tio
ns
New
est
inst
rum
ent
of
gro
up
, b
ut
Man
y p
ub
lica
tio
ns
illu
stra
tin
g
dis
sect
edil
lust
rati
ng
iso
lati
on
of
sev
eral
pu
bli
cati
on
s ci
tin
g i
ts u
se.
iso
lati
on
of
var
iou
s ce
ll c
om
po
-
mat
eria
ls f
or
var
iou
s ce
llu
lar
com
po
nen
tsN
o c
lear
in
dic
atio
n t
hat
UV
-An
ents
. N
o c
lear
in
dic
atio
n t
hat
mo
lecu
lar
usi
ng
LC
M.
Bec
ause
dis
-la
ser
cause
s si
gnif
ican
t deg
radat
ion
UV
-A l
aser
cau
ses
sig
nif
ican
t
anal
ysi
sse
ctio
n i
s co
nta
ct-b
ased
, ca
reo
f d
isse
cted
tis
sue
com
po
nen
ts,
deg
rad
atio
n o
f d
isse
cted
tis
sue
mu
st b
e ta
ken
to
av
oid
bu
t th
is h
as n
ot
bee
n r
igo
rou
sly
com
po
nen
ts,
bu
t th
is h
as n
ot
con
tam
inat
ion
of
cap
wit
hte
sted
.b
een
rig
oro
usl
y t
este
d.
un
wan
ted
mat
eria
l; t
his
can
be
avo
ided
wit
h s
pec
ial
LC
M
cap
s w
ith
ou
ter
rail
s. M
icro
-
seco
nd
hea
tin
g o
f ti
ssu
e d
oes
occ
ur
du
rin
g d
isse
ctio
n,
bu
t
do
es n
ot
app
ear
sig
nif
ican
t.
Mu
st d
isso
lve
mat
eria
l o
ff c
ap.
Sp
ecia
l n
ote
sA
rctu
rus
has
dev
elo
ped
an
Can
be
use
d t
o d
isse
ct l
ivin
g c
ells
Can
be
use
d t
o d
isse
ct l
ivin
g
auto
mat
ed s
yst
em f
or
dis
sec-
in c
ult
ure
usi
ng
sp
ecia
l cu
ltu
rece
lls
in s
pec
ial
cult
ure
dis
hes
.
tio
n b
ased
on
sam
e E
VA
dis
hes
. R
ecen
tly i
mpro
ved
qual
ity
Can
dis
sect
tis
sues
co
ver
ed w
ith
mel
tin
g p
rin
cip
les
wit
h s
ame
of
mem
bra
ne
coat
ed s
lid
es,
vas
tly
lig
ht
shee
n o
f m
iner
al o
il a
llow
-
issu
es a
nd
lim
itat
ion
s. T
his
imp
rov
ing
qu
alit
y o
f v
isu
aliz
atio
nin
g b
ette
r v
isu
aliz
atio
n.
Un
clea
r
dev
ice
no
t re
vie
wed
her
ean
d l
aser
cu
ttin
g.
Un
clea
r if
if l
aser
pre
ssure
cat
apult
ing c
ause
s
(co
st i
s sa
id t
o b
e $
18
6K
).ab
lati
on
by
las
er p
rod
uce
s m
icro
-m
icro
aero
sol
of
tiss
ue
par
ticl
es,
aero
sol
that
sh
ou
ld b
e is
ola
ted
and p
oss
ible
res
pir
atory
exposu
re,
fro
m u
ser.
alth
ou
gh
th
is a
pp
ears
po
ssib
le.
Co
st o
fA
pp
rox
$1
24
K w
ith
Ap
pro
x $
90
K b
ase,
ap
pro
xA
pp
rox
$1
60
K
inst
rum
ent
flu
ore
scen
ce.
$1
20
K w
ith
flu
ore
scen
ce a
nd
dat
abas
e so
ftw
are
(co
nti
nu
ed
)
25
26 Bova et al.
Tabl
e 1
(Con
tinu
ed) A
rctu
rus
Pix
Cel
l II
eL
eica
AS
LM
DP
AL
M M
icro
Bea
m
Co
st o
f$3 o
r m
ore
per
cap
dep
endin
gM
emb
ran
e-co
ated
sli
des
req
uir
ed,
No
dis
po
sab
les
req
uir
ed,
bu
t
dis
po
sab
les
on
cap
ty
pe
use
dan
d c
ost
in
ran
ge
of
$3
–4
per
sli
de
mem
bra
ne
coat
ed s
lid
es a
nd
cov
ersl
ips
cost
in
ran
ge
of
$4
each
fro
m P
AL
M,
bu
t ca
n b
e
pu
rch
ased
els
ewh
ere
Bo
tto
m l
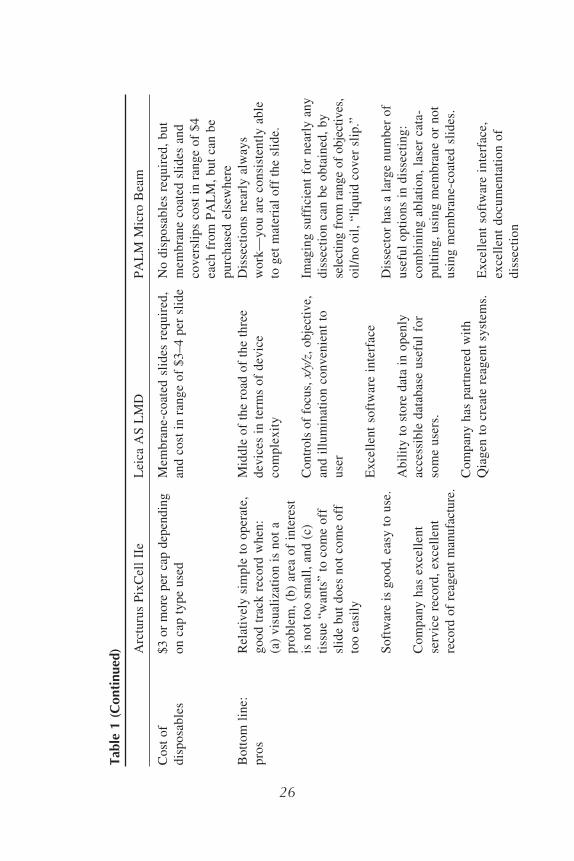
ine:
Rel
ativ
ely
sim
ple
to
op
erat
e,M
idd
le o
f th
e ro
ad o
f th
e th
ree
Dis
sect
ion
s n
earl
y a
lway
s
pro
sg
oo
d t
rack
rec
ord
wh
en:
dev
ices
in
ter
ms
of
dev
ice
wo
rk—
yo
u a
re c
on
sist
entl
y a
ble
(a)
vis
ual
izat
ion
is
no
t a
com
ple
xit
yto
get
mat
eria
l o
ff t
he
slid
e.
pro
ble
m,
(b)
area
of
inte
rest
is n
ot
too
sm
all,
an
d (
c)C
ontr
ols
of
focu
s, x
/y/z
, obje
ctiv
e,Im
agin
g s
uff
icie
nt
for
nea
rly
an
y
tiss
ue
“wan
ts”
to c
om
e o
ffan
d i
llu
min
atio
n c
on
ven
ien
t to
dis
sect
ion
can
be
ob
tain
ed,
by
slid
e b
ut
do
es n
ot
com
e o
ffu
ser
sele
ctin
g f
rom
ran
ge
of
obje
ctiv
es,
too
eas
ily
oil
/no
oil
, “l
iqu
id c
ov
er s
lip
.”
Ex
cell
ent
soft
war
e in
terf
ace
So
ftw
are
is g
oo
d,
easy
to
use
.D
isse
cto
r h
as a
lar
ge
nu
mb
er o
f
Ab
ilit
y t
o s
tore
dat
a in
op
enly
use
ful
op
tio
ns
in d
isse
ctin
g:
Co
mp
any
has
ex
cell
ent
acce
ssib
le d
atab
ase
use
ful
for
com
bin
ing
ab
lati
on
, la
ser
cata
-
serv
ice
reco
rd,
exce
llen
tso
me
use
rs.
pu
ltin
g,
usi
ng
mem
bra
ne
or
no
t
reco
rd o
f re
agen
t m
anufa
cture
.u
sin
g m
emb
ran
e-co
ated
sli
des
.
Co
mp
any
has
par
tner
ed w
ith
Qia
gen
to
cre
ate
reag
ent
syst
ems.
Ex
cell
ent
soft
war
e in
terf
ace,
exce
llen
t d
ocu
men
tati
on
of
dis
sect
ion
26
Molecular Profiling of Tissue 27B
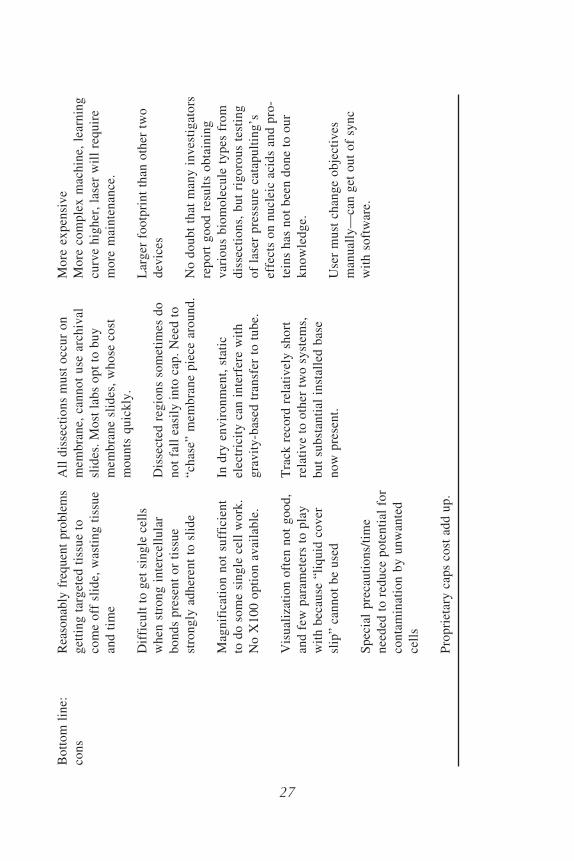
ott
om
lin
e:R
easo
nab
ly f
requen
t pro
ble
ms
All
dis
sect
ion
s m
ust
occ
ur
on
Mo
re e
xp
ensi
ve
con
sg
etti
ng
tar
get
ed t
issu
e to
mem
bra
ne,
can
no
t u
se a
rch
ival
Mo
re c
om
ple
x m
ach
ine,
lea
rnin
g
com
e o
ff s
lid
e, w
asti
ng
tis
sue
slid
es.
Mo
st l
abs
op
t to
bu
ycu
rve
hig
her
, la
ser
wil
l re
qu
ire
and
tim
em
emb
ran
e sl
ides
, w
ho
se c
ost
mo
re m
ain
ten
ance
.
mo
un
ts q
uic
kly
.
Dif
ficu
lt t
o g
et s
ing
le c
ells
Lar
ger
fo
otp
rin
t th
an o
ther
tw
o
wh
en s
tro
ng
in
terc
ellu
lar
Dis
sect
ed r
egio
ns
som
etim
es d
od
evic
es
bo
nd
s p
rese
nt
or
tiss
ue
no
t fa
ll e
asil
y i
nto
cap
. N
eed
to
stro
ng
ly a
dh
eren
t to
sli
de
“ch
ase”
mem
bra
ne
pie
ce a
rou
nd
.N
o d
ou
bt
that
man
y i
nv
esti
gat
ors
rep
ort
go
od
res
ult
s o
bta
inin
g
Mag
nif
icat
ion
no
t su
ffic
ien
tIn
dry
en
vir
on
men
t, s
tati
cv
ario
us
bio
mo
lecu
le t
yp
es f
rom
to d
o s
om
e si
ng
le c
ell
wo
rk.
elec
tric
ity
can
in
terf
ere
wit
hd
isse
ctio
ns,
bu
t ri
go
rou
s te
stin
g
No
X1
00
op
tio
n a
vai
lab
le.
gra
vit
y-b
ased
tra
nsf
er t
o t
ub
e.o
f la
ser
pre
ssu
re c
atap
ult
ing
’s
effe
cts
on
nu
clei
c ac
ids
and
pro
-
Vis
ual
izat
ion
oft
en n
ot
go
od
,T
rack
rec
ord
rel
ativ
ely
sh
ort
tein
s h
as n
ot
bee
n d
on
e to
ou
r
and
few
par
amet
ers
to p
lay
rela
tiv
e to
oth
er t
wo
sy
stem
s,k
no
wle
dg
e.
wit
h b
ecau
se “
liq
uid
co
ver
bu
t su
bst
anti
al i
nst
alle
d b
ase
slip
” ca
nn
ot
be
use
dn
ow
pre
sen
t.U
ser
mu
st c
han
ge
ob
ject
ives
man
ual
ly—
can
get
ou
t o
f sy
nc
Sp
ecia
l p
reca
uti
on
s/ti
me
wit
h s
oft
war
e.
nee
ded
to
red
uce
po
ten
tial
fo
r
con
tam
inat
ion
by
un
wan
ted
cell
s
Pro
pri
etar
y c
aps
cost
ad
d u
p.
27
28 Bova et al.
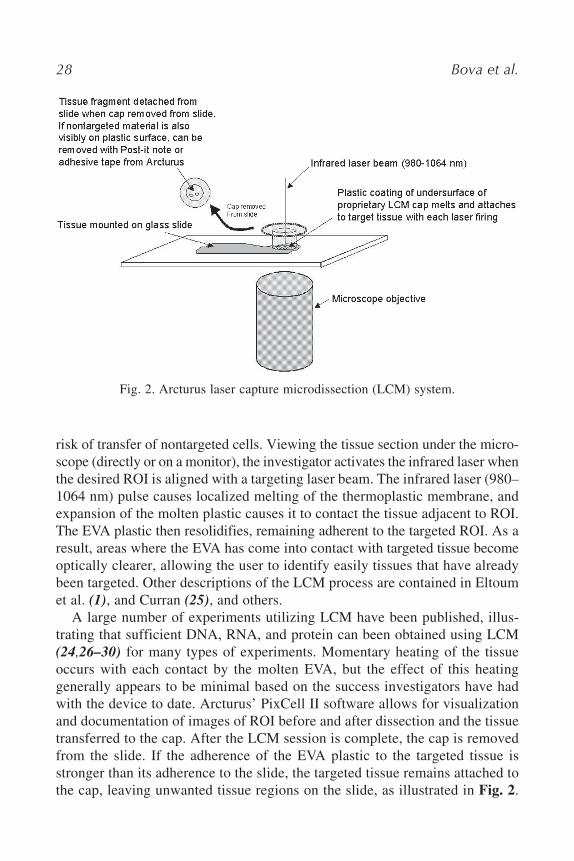
risk of transfer of nontargeted cells. Viewing the tissue section under the micro-scope (directly or on a monitor), the investigator activates the infrared laser whenthe desired ROI is aligned with a targeting laser beam. The infrared laser (980–1064 nm) pulse causes localized melting of the thermoplastic membrane, andexpansion of the molten plastic causes it to contact the tissue adjacent to ROI.The EVA plastic then resolidifies, remaining adherent to the targeted ROI. As aresult, areas where the EVA has come into contact with targeted tissue becomeoptically clearer, allowing the user to identify easily tissues that have alreadybeen targeted. Other descriptions of the LCM process are contained in Eltoumet al. (1), and Curran (25), and others.
A large number of experiments utilizing LCM have been published, illus-trating that sufficient DNA, RNA, and protein can been obtained using LCM(24,26–30) for many types of experiments. Momentary heating of the tissueoccurs with each contact by the molten EVA, but the effect of this heatinggenerally appears to be minimal based on the success investigators have hadwith the device to date. Arcturus’ PixCell II software allows for visualizationand documentation of images of ROI before and after dissection and the tissuetransferred to the cap. After the LCM session is complete, the cap is removedfrom the slide. If the adherence of the EVA plastic to the targeted tissue isstronger than its adherence to the slide, the targeted tissue remains attached tothe cap, leaving unwanted tissue regions on the slide, as illustrated in Fig. 2.
Fig. 2. Arcturus laser capture microdissection (LCM) system.
Molecular Profiling of Tissue 29
When dissection is complete for a given cap, Capsure® Macro caps with attachedmicrodissected cells are placed onto microcentrifuge tubes containing an appro-priate buffer for molecular analysis (caps were engineered to fit Eppendorf brandtubes). Capsure® HS caps must be attached to matching ExtracSure™ extrac-tion devices, which allow extraction in small buffer volumes. The tube is theninverted and incubated as needed to allow microdissected cell components togo into solution.
Positive aspects of the Arcturus LCM technology include:
• Single cells and large areas can be dissected in many situations.
• Single cells can be “cherry-picked” from cell preparation slides.
• Equipment is relatively simple to manage and maintain.
• The laser is solid state and should rarely if ever need replacing.
• The Arcturus company provides generally excellent support including protocols
and kits tailored to the LCM system.
Challenges associated with the LCM technology include:
• Transfer of tissue from slide to LCM cap sometimes requires troubleshooting.
Tissue that is targeted may remain on the slide after the CapSure® cap is removed,
indicating that adhesion between the thermoplastic and the tissue is too weak, or
the adhesion between the tissue and slide is too strong. Insufficient adhesion of the
thermoplastic to the tissue can be caused by insufficient dehydration of the target
tissue, which can sometimes be overcome by repeat immersion of the target slide in
fresh xylene. When adhesion of the tissue to the glass slide is greater than tissue
adhesion to the thermoplastic film, this can be difficult to overcome. Unevenness
of tissue surfaces, caused by wrinkled sections or resulting from marked differ-
ences in tissue firmness (such as with plant tissues where stiff cellulose is next to
soft internal cellular elements, or with tissues containing bone or cartilage), also can
make dissection difficult. In some instances, internal bonding within tissue elements
prevents selective tearing of individual cells from adjacent cells, preventing LCM
altogether.
• It can be costly because of the need to use proprietary Arcturus CapSure® caps,
which cost in the range of $2–3 apiece.
• Minimal dissectable area is variable. Single cells can easily be dissected in some
tissues, while in others single-cell dissection is impossible because of excessive
adhesion to the slide, or because of the above-mentioned resistance to tearing (inter-
nal bonding) of target tissue.
• Visualization in some tissues is not adequate. This is most often due to an index
of refraction mismatch between the tissue section and air between the tissue and
CapSure™ cap. With the PALM Microbeam and Leica LMD systems, with tissue
mounted on membrane-coated slides, a “liquid cover slip” can be placed on the
tissue section to provide visualization similar to ordinary cover-slipped sections,
without interfering with dissection. This is not feasible with the Arcturus IIe LCM
system, as liquid would interfere with adherence between the EVA plastic and the
tissue.
30 Bova et al.
Arcturus recently marketed a new device called Autopix™, which is an auto-mated, enclosed version of the technology contained in the PixCell IIe. Arcturuscontinues to market the PixCell IIe, which at the time of this writing is prob-ably the most prevalent laser-based microdissection technology. Arcturus usesOlympus microscope in its systems, but has its own service and support teamcovering all aspects of its devices.
1.6.2. PALM Micro Beam Research System
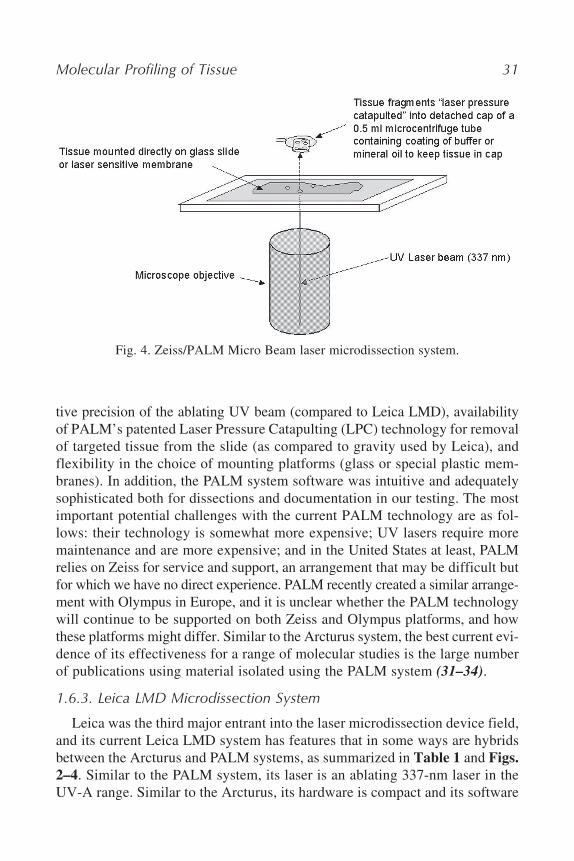
PALM Microlaser Technologies AG (Bernried, Germany), founded in 1993,originally focused on use of microscope-based ultraviolet (UV) lasers in assisted-reproduction technology such as zona pellucida drilling, but moved into the areaof tissue section microdissection when prodded by pathologists and researchersfaced with difficulty in obtaining pure cell samples. PALM marketed its first sys-tem specifically for tissue microdissection around 1994, and its current deviceis called the Micro Beam microdissection system. PALM’s tissue section micro-dissection systems differ in a number of important respects from the Arcturusand Leica technologies, and these differences are illustrated in Figs. 2–4. Themost important positives include the ability to obtain improved visualizationby using a “liquid cover slip,” relative predictability of obtaining targeted ROIs,relative predictability in obtaining ROI in the 2- to 5 µm diameter range, rela-
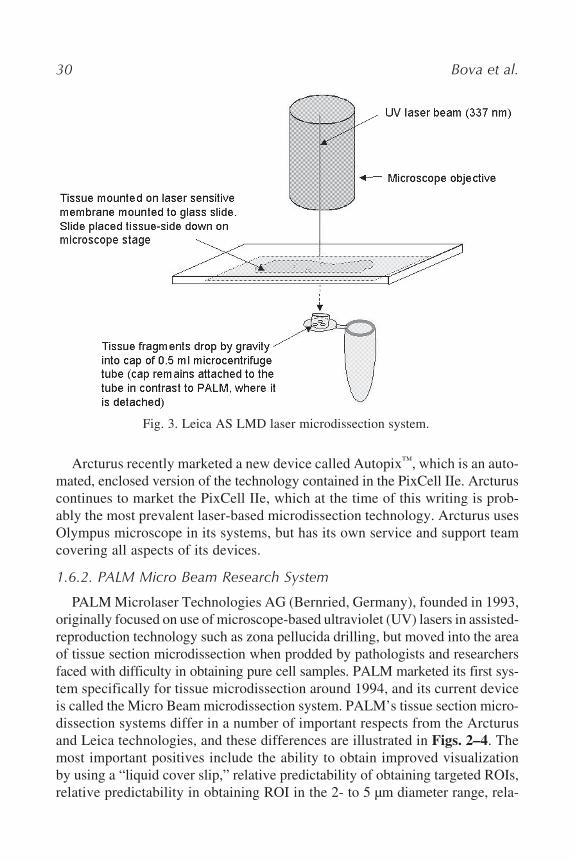
Fig. 3. Leica AS LMD laser microdissection system.
Molecular Profiling of Tissue 31
Fig. 4. Zeiss/PALM Micro Beam laser microdissection system.
tive precision of the ablating UV beam (compared to Leica LMD), availabilityof PALM’s patented Laser Pressure Catapulting (LPC) technology for removalof targeted tissue from the slide (as compared to gravity used by Leica), andflexibility in the choice of mounting platforms (glass or special plastic mem-branes). In addition, the PALM system software was intuitive and adequatelysophisticated both for dissections and documentation in our testing. The mostimportant potential challenges with the current PALM technology are as fol-lows: their technology is somewhat more expensive; UV lasers require moremaintenance and are more expensive; and in the United States at least, PALMrelies on Zeiss for service and support, an arrangement that may be difficult butfor which we have no direct experience. PALM recently created a similar arrange-ment with Olympus in Europe, and it is unclear whether the PALM technologywill continue to be supported on both Zeiss and Olympus platforms, and howthese platforms might differ. Similar to the Arcturus system, the best current evi-dence of its effectiveness for a range of molecular studies is the large numberof publications using material isolated using the PALM system (31–34).
1.6.3. Leica LMD Microdissection System
Leica was the third major entrant into the laser microdissection device field,and its current Leica LMD system has features that in some ways are hybridsbetween the Arcturus and PALM systems, as summarized in Table 1 and Figs.
2–4. Similar to the PALM system, its laser is an ablating 337-nm laser in theUV-A range. Similar to the Arcturus, its hardware is compact and its software
32 Bova et al.
is relatively bare bones compared to the PALM software (the version tested in2003 did not provide more advanced documentation tools, such as allowingdirect annotation of images within the Leica software). Positive attributes includeseveral convenient features including a single manual control box for all majordissection functions. These include integration of objective selection and soft-ware adjustment to a new magnification (not supported in the PALM versiontested), convenient ability to send dissected ROIs from different regions of aslide to separately identified microcentrifuge tubes, and the ability to use ordi-nary intact microcentrifuge tubes for collection of dissected materials (not pos-sible on either the Arcturus or PALM systems tested). Significant challengeswith the Leica system include required use of membrane coated slides, occa-sional failure of the targeted ROI to drop into the collection tube after dissec-tion, relative lack of fine focus of the UV laser beam compared to the PALMsystem, and poor performance when using UV illumination. The Leica LMDsystem is relatively new, but publications citing its use in molecular studies havealready appeared (35,36).
Used carefully, all three of the laser-based tissue microdissection systems dis-cussed provide technology sufficient for isolation of most ROI, obtaining mate-rial of sufficient quality for many if not most downstream molecular analyses.Selection of the best system for an application should be based on one’s speci-fic needs and resources available, taking into consideration the various positiveattributes and challenges listed. Technologies are evolving rapidly, so consult-ing with company websites and representatives is recommended prior to mak-ing purchase decision. More recently marketed tissue microdissection systemsfrom Bio-Rad (Hercules, CA) and MMI AG (Glottbrugg, Switzerland), and othernew entrants have not been reviewed by us but should also be considered.
2. Materials
2.1. Rapid Tissue Freezing
2.1.1. Isopentane Method1. Isopentane.
2. Dry ice.
3. Ice bucket.
4. Metal bowl, 500-mL or larger volume.
5. Metal or Plexiglas basket corresponding to metal bowl to hold tissue while freezing.
2.1.2. Gentle-Jane® Method1. Gentle-Jane® (Instrumedics) snap-freezing device.
2. Liquid nitrogen.
3. OCT (“optimal cutting temperature”) compound (Tissue-Tek, others), Cryogel
(Instrumedics), or other embedding medium.

Molecular Profiling of Tissue 33
2.2. Preparation of Cytologic Specimensfor Microdissection or Direct Molecular Analysis
2.2.1. Tissue Disaggregation Methods
Solid tissues can be disaggregated to obtain pure cell mixtures ready for fur-ther purification and/or live cell experiments or for direct molecular separationand phenotyping.
2.2.1.2. ENZYMATIC AND/OR MECHANICAL DISAGGREGATION
1. Fresh tissue to be disaggregated. (This methods may also work on frozen tissues
[37], and success may be increased if the tissues are frozen in media containing
dimethyl sulfoxide (DMSO), that may protect cell membranes.)
2. Sterile solution compatible with cells of interest such as RPMI-1640 or Hank’s
balanced salt solution (HBSS), with addition of serum, defined additives (growth
factors, insulin, cytokines, etc.), and antibiotics as desired.
3. Enzyme(s) such as collagenase 1A (Sigma, St. Louis, MO, USA) to be used for
disaggregation (see example) if needed.
4. Sterile scalpels and/or automated mechanical disaggregation system (such as Medi-
machine™ marketed by BD (formerly Becton Dickenson, Franklin Lakes, NJ).
2.2.2. Direct Smears of Liquids Containing Suspended Cells
1. Standard (uncoated) glass microscope slides.
2. 50–250 µL of fluid to be smeared.
3. Hemocytometer cover slip or other device narrower than glass slide to use as a
cell spreader.
4. 70% ethanol.
2.2.3. Tissue Scraping
Fresh tissues containing cells that can be detached intact with mild shearingforce can be rapidly sampled by scraping with a sterile scalpel blade and thenrapidly spreading the scraped liquid sample onto a glass slide with the blade. Abasic requirement for use of this technique together with microdissection isthat the intended target cells can be readily identified cytologically or by cytol-ogy together with specific staining characteristics.
2.2.4. Cell Concentration Technologies
2.2.4.1. DENSITY AND SIZE GRADIENT SEPARATIONS
Many types of cells in solution can be separated by density and/or size, with-out significant damage. For example, from disaggregated living liver cells, hepa-tocytes, Kupffer cells, liver endothelial cells, and bile duct epithelial cells can beseparated using density gradients (38):
34 Bova et al.
1. Percoll (Amersham), RediGrad (Amersham), Ficoll-Paque Plus (Amersham), others.
2. Sterile 50-mL conical tubes.
3. Diluent (usually phosphate-buffered saline or similar).
4. Red cell lysis buffer (ACK by Bio-Whittaker, others).
5. Centrifuge.
2.2.4.2. MAGNETIC-BEAD OR OTHER BEAD-BASED SEPARATIONS
Immunobead-based separation has been used effectively for concentratingmultiple myeloma cells from fresh bone marrow aspirates (39) for molecularanalysis. With a well-optimized combination of disaggregation methods andspecific antibodies, other types of fresh or frozen tissue can be separated usinga combination of density gradient and magnetic-bead separations. Methodswill vary depending on tissues separated and target cells desired. Listed here isa general pattern.
1. Aqueous sample containing intact cells of interest admixed with other cells.
2. Erythrocyte lysis buffer (if needed). Two such buffers are: 0.32 M sucrose, 10 mM
Tris-HCl, 5 mM MgCl2, 1% Triton X-100, or alternatively hypotonic solutions (0.15
M NH4Cl in 0.1 mM Tris-HCl).
3. Appropriate nonspecific (blocking) and specific antibodies (multiple suppliers)
for selection of wanted or unwanted cells.
4. Paramagnetic beads coated with secondary antibody specific to the primary anti-
bodies used (Dynal, Oslo, Norway, and others).
5. Magnet (Dynal, others) for separation of beads, leaving target cells in superna-
tant, or on beads as designed.
2.2.4.3. SEMI-AUTOMATED CELL CONCENTRATION METHODS
These include Cytospin® (Thermo Shandon Inc.) preparations, or by moreadvanced thin-layer technology called ThinPrep® (Cytyc Corp.) or AutocytePrep(TriPath Imaging). The Cytospin® technique uses proprietary centrifuge car-tridges to separate cells in suspension and place them on specific areas of amicroscope slide ready for staining. ThinPrep® also uses proprietary solutions(separate protocols for fine-needle aspirates, body fluids, and mucoid samples)and instrumentation to produce cells on slides. Tripath’s solution is targeted atPapanicolau cervical smears but could be modified for other purposes. Consultthe manufacturer’s manual for details.
2.3. Chemical Fixatives
Alcohol-based and formaldehyde-based tissue fixation methods are presented,as they currently come closest to providing both sufficient histologic detail forlight microscopy and sufficiently preserved material for molecular analysis ofvarying types. Metal-based fixatives (Zenker’s, Harris hematoxylin, etc.) can
Molecular Profiling of Tissue 35
provide excellent histology but can interfere with many molecular analysesand are not discussed.
2.3.1. 10% Neutral Buffered Formalin (10% NBF)(see Notes 1 and 2)
Many laboratories purchase 10% NBF ready-made from a wide variety ofsuppliers. It is relatively easy to make, however, and in some instances (see
Notes) making your own may provide significant advantages:
1. Fume hood.
2. 2-L graduated cylinder with stir bar.
3. Magnetic stirring plate.
4. 1 L of 10% formalin (100 mL of 37% formaldehyde diluted 1:10).
5. 4 g of sodium phosphate monobasic (Na2H2PO4.H2O).
6. 6.5 g of sodium phosphate dibasic (anhydrous) (Na2 H2 PO4).
In a fume hood, add stir bar, sodium phosphate monobasic, and sodium phos-phate dibasic to empty graduated cylinder on stir plate (see Note 3). Add 900mL of water followed by 100 mL of 37% formaldehyde (see Note 4). Stir untilphosphate dissolves (see Note 5).
2.3.2. Alcohol-Based Solutions (see Note 6)
1. 70% ethanol (see Note 7). To make 1 L, add 700 mL of 100% ethanol to a grad-
uated cylinder, and add water to 1 L. The amount of water needed to reach 1000
mL will be roughly 330 mL because of volume contraction caused by hydrogen
bond formation.
2. 4.2:2.0:1.8 (v/v/) Ethanol–methanol–water fixative (see Notes 8–10). To make
8 L, to a 10-L graduated cylinder, add 1800 mL of H2O, 2000 mL of 100% metha-
nol, and 4200 mL of 100% ethanol. Mix well with a stir bar and bring the volume
up to 8 L with water) to make up for volume shrinkage due to hydrogen bonding.
2.4. Combined Formalin Fixation/SucroseInfusion for Cryostat Sectioning
In situations in which standard frozen sections may not provide adequatehistology for downstream microdissection, and where standard formalin fixa-tion and paraffin embedding will not provide adequate DNA, RNA, or proteinquality, an alternate approach is to perform short-term fixation with freshlyprepared 2% or 4% buffered formaldehyde (as opposed to using commerciallyprepared 10% formalin, which is 4% formaldehyde but also contains a smallamount of methanol, which coagulates proteins), then rinsing the sample withglycine (to remove excess formaldehyde and inactivate formaldehyde) fol-lowed by sucrose infusion.
36 Bova et al.
1. Fresh 2% or 4% neutral buffered formaldehyde, or modified Millonig formalin
(see Subheading 4.3.1.) if isoosmotic fixation is desired. Note that this freshly
made “formaldehyde” is the same as what many call “paraformaldehyde.”
2. Sterile phosphate-buffered saline (PBS).
3. 0.5 M Sucrose in PBS.
2.5. Standard Automated Clearingand Paraffin Embedding of Fixed Tissues
Most molecular laboratories will work with histology laboratories for tissueclearing (usually with xylenes) and embedding (usually with paraffins). Modernparaffin tissue embedding occurs almost entirely in automated processors undervacuum. Molecular researchers must recognize, however, that standard surgi-cal pathology tissue processors may start with a formalin step, and thus if for-malin exposure is to be avoided, a separate no-formalin processor run must becreated. In addition, processors on which formalin is routinely used may allowformalin exposure even when not selected. Higher temperatures and longerexposure times than desired may also be commonplace. Examination of theseparameters with one’s support laboratory is recommended.
Paraffins for embedding vary in melting temperature and quantity of addedpolymer plastic as stiffening agent. Increased polymer allows greater stiffnessand thinner sectioning, but also increases infiltration time.
2.6. Sectioning of Tissue Blocks for Microdissection
2.6.1. Frozen Sections
1. Cryostat.
2. OCT or other embedding compound.
3. Mounting chucks for cryostat.
4. Dry ice in styrofoam container.
2.6.2. Paraffin Sections
1. Microtome.
2. Water bath filled with deionized/distilled ddH2O for floating sections.
3. Clean, disposable blade.
4. Oven for baking slides.
2.7. Staining of Tissue Sections for Microdissection
2.7.1. Mayer’s Hemalum and Eosin Stainingfor DNA, RNA, and Protein Recovery
1. Fresh xylenes (Sigma, others).
2. Fresh 100%, 95%, 70% ethanol (use diethyl pyrocarbonate [DEPC]-treated water
for dilution of 100% ethanol).
Molecular Profiling of Tissue 37
3. Mayer’s hematoxylin (Sigma, Richard-Allan, others).
4. Eosin Y (Sigma, Richard-Allan, others).
5. Mini-protease inhibitor tablets (Roche) (if protein recovery is desired).
2.7.2. Immunostaining Prior to Laser Microdissection
1. DEPC-treated H2O (Invitrogen/Research Genetics) (for preparation of PBS, alcohols).
2. Superfrost Plus glass slides (Fisher Scientific).
3. Cold acetone.
4. 1X PBS, pH 7.4.
5. DAKO Quick Staining kit (DAKO Corp.), a three-step streptavidin–biotin tech-
nique with prediluted mono- or polyclonal (rabbit) primary antibodies optimized
for very short staining times.
6. Diaminobenzidine (DAB).
7. Hematoxylin solution, Mayer’s (Sigma).
8. 70%, 95%, 100% ethanol.
9. Xylenes, mixed, ACS grade (Sigma).
10. Placental RNase inhibitor (Perkin Elmer, Branchburg).
2.7.3. Methylene Blue Staining
1. Methylene blue (0.05% in water, Sigma 31911-2).
2. DEPC-treated water (Invitrogen/Research Genetics, others).
2.7.4. Methyl Green Staining
1. Methyl green solution (actually “ethyl green;” see Subheading 1.3.) (Dako, S1962).
2. DEPC-treated water (Invitrogen/Research Genetics, others).
2.7.5. Nuclear Fast Red
1. Nuclear fast red solution (Dako, S1963).
2. DEPC-treated water (Invitrogen/Research Genetics, others).
2.8. Manual Microdissection
2.8.1. Cryostat-Based Microdissection of Tissue Blocks
1. Cryostat with blade guards.
2. OCT or other embedding compound.
3. Brightfield microscope.
4. Glass slides.
5. 50-mL conical tubes.
6. 16-in. long smooth forceps.
7. Insulated bucket containing liquid nitrogen.
8. Sterile one-sided straight edge blades.
9. Mayer’s hemalum and eosin slide staining setup.
10. Logbook or computerized logging system.

38 Bova et al.
2.8.2. Manual Microdissection of Tissue Sections on Glass SlidesThe method described is a combination of the one in use in the NCI Patho-
genetics Unit and the one described by Moskaluk and Kern (40):
1. Stained glass-slide-mounted sections without coverslips and adjacent stained,
cover-slipped sections.
2. Dissecting microscope or standard inverted microscope with hydraulic microma-
nipulator arm, if available.
3. Sterile 30-gage needle on syringe.
4. 2.5% Glycerol solution.
5. Agarose and buffers as needed for specific dissections.
2.9. Laser Microdissection of Tissue Sections on Slides
2.9.1. Arcturus LCM System1. LCM device.
2. CapSure dissection caps.
3. Post-It® Notes or Arcturus PrepStrips™.
4. Perkin Elmer/Applied Biosystems GeneAmp 500-µL thin-walled polymerase
chain reaction (PCR) reaction tubes, cat. no. N8010611.
2.9.2. PALM Microbeam System
2.9.3. Leica LMD System
2.10. Isolation of Analyte from Microdissected Materials
2.10.1. Isolation of DNADNA isolation kits are available from a number of manufacturers. For small
samples, kits may be more cost-effective than nonkit methods. For large sam-ples (if >10 µg of DNA will be isolated), we believe nonkit methods are mostcost effective.
2.10.1.1. KIT-BASED METHODS
A number of kits are available for DNA isolation. For LCM-derived mate-rials, we tested Trizol, DNAzol, Trireagent, Easy-DNA (Invitrogen), and theDNeasy kit (Qiagen), against sodium dodecyl sulfate (SDS)–phenol–chloro-form extraction, and Tween-20–phenol–chloroform extraction, and of the kits,the DNeasy kit performed best in our hands (GSB Laboratory), although SDS–phenol–chloroform provided a better yield, in our hands, DNA size is gener-ally larger with DNeasy than with phenol–chloroform extraction. DNeasy isalso easier to use because of its lower toxic chemical content. We describe amethod using the DNeasy kit and LCM caps, although this could be applied tomicrodissected material from any source. Several more recently marketedDNA isolation kits are also available, but have not been tested by us.
Molecular Profiling of Tissue 39
1. DNeasy kit (Qiagen) or similar kit. The DNeasy kit contains 2-mL collection
tubes, a series of proprietary (“black box”) buffers: ATL (lysis buffer), AL (lysis
buffer contains guanidine hydrochloride), AW1 wash buffer (contains guanidine
hydrochloride), AW2 wash buffer, AE elution buffer; also proteinase K (activity
= 600 mAU/mL solution or 40 mAU/mg of protein).
2. LCM cap removal device (if LCM caps are source of DNA).
3. 100% (Absolute) ethanol.
2.10.1.2. SDS/PHENOL–CHLOROFORM EXTRACTION
We compared Tween-20–phenol–chloroform extraction to SDS–phenol–chloroform extraction, and in our hands (GSB laboratory), SDS–phenol–chlo-roform extraction provided double or greater yields, and better quality DNA.Our SDS–phenol–chloroform extraction method is described here and is basedon the method of Goelz et al. (41). The procedure given is for large quantitiesof DNA (10–1000 µg), and can be scaled down for smaller samples.
1. 1 L of DNA digestion buffer.
a. Sterile bottle.
b. 750 mL of sterile, deionized/distilled H2O (ddH2O).
c. 50 mL of 1 M Tris-HCl (pH 8).
d. 100 mL of 0.5 M EDTA, pH 8.
e. 100 mL of 20% SDS.
Combine the ingredients in the bottle. Gently add 20% SDS to avoid foaming.
Gently mix the solution, and label the bottle: DNA extraction buffer: 50 mM Tris-
HCl, 50 mM EDTA, 2% SDS. This can be stored at room temperature. Place 6 mL
in a sterile 50-mL conical tube to isolate DNA from 100 to 300 6-µm frozen tissue
sections. Scale down for smaller amounts of tissue.
2. DNA digestion materials.
a. 5 mL of proteinase K (15.6 mg/mL) (Roche Molecular Biochemicals, cat. no.
1-373-196).
b. Incubator.
c. Rocking device, such as Belly-Button Shaker/Rocker (Stovall Life Science, Inc.).
Set the incubator (or water bath) to 48°C and allow to equilibrate. To each sample
(6 mL), add 38 µL of proteinase K. Incubate on undulating Belly Button (Stovall)
or other gentle agitation device at 48°C for 12–18 h (typically overnight) (see
Notes 11 and 12).
3. 50 mL of LoTE DNA suspension buffer.
a. Sterile 50-mL conical tube.
b. 44.5 mL of ddH2O.
c. 450 µL of 1 M Tris-HCl, pH 8.0.
d. 9 µL of 0.5 M EDTA, pH 8.0.
Add ddH2O, Tris-HCl, and EDTA to a conical tube; mix well. Filter sterilize if
desired. Label tube. Final concentrations are: 10 mM Tris-HCl, 1 mM EDTA. Keep
refrigerated.
40 Bova et al.
4. DNA purification.
a. One box of serum separation tubes (SST) (Becton Dickinson-Vacutainer Sys-
tems, cat. no. 366512). (Also consider using Phase Lock Gel™ tubes of various
sizes, marketed by Eppendorf.)
b. Phenol–chloroform–isoamyl alcohol (25:24:1 v/v/v) (UltraPure Gibco BRL).
c. Sterile 50-mL conical tubes.
d. Centrifuge and rotor capable of handling SST and 50-mL conical tubes.
2.10.2. Isolation of RNA
2.10.2.1. RNASE AWAY™ (MOLECULAR BIOPRODUCTS)OR OTHER RNASE INACTIVATING SOLUTION
2.10.2.2. KIT-BASED METHOD (PICOPURE™ RNA ISOLATION KIT BY ARCTURUS)
This kit contains several proprietary (“black box”) buffers, including condi-tioning buffer (CB), GITC-based extraction buffer (XB), 70% ethanol (EtOH),wash buffer 1 (W1), wash buffer 2 (W2), elution buffer (EB), RNA purificationcolumns, collection tubes, and microcentrifuge tubes. Although the descriptionis focused on material derived from LCM, it is equally applicable to tissue iso-lated using any type of microdissection. Small-quantity RNA isolation kits arealso available from Ambion, Qiagen, and others.
2.10.2.3. PHENOL–CHLOROFORM BASED RNA EXTRACTION METHOD
1. Rnase-free microcentrifuge tubes.
2. DEPC-treated water purchased ready for use (Invitrogen, Sigma, others) or made
by adding 0.2 mL of DEPC (Sigma and others) per 100 mL of ddH2O, shaking
vigorously to get DEPC into solution, and autoclaving to inactivate remaining
DEPC. Caution: Handle DEPC only in a fume hood, as it may be a carcinogen.
3. 30 mL of GITC denaturing solution made with 29.3 mL of ddH20, 1.76 mL of
0.75 M Na citrate, pH 7.0, 2.64 mL of 10% (w/v) N-lauroylsarcosine, 25.0 g of
guanidine thiocyanate (dissolves with stirring at 65°C), and 35 µL of 2-mercapto-
ethanol. Final concentrations are 4 M guanidinium isothiocyanate, 0.5% N-lauroyl-
sarcosine, 25 mM sodium citrate, and 0.1 M 2-mercaptoethanol.
4. 2 M Sodium acetate pH 4 (add 1.64 g of anhydrous sodium acetate to 4 mL of water
and 3.5 mL of glacial acetic acid, and bring the volume to 10 mL with ddH2O).
5. Water-saturated buffered phenol. Dissolve 10 g of phenol crystals in ddH2O at 65°C.
Mix dissolved phenol with 200 mM Tris-base until the aqueous solution reaches
pH 8. Remove the upper water phase and store at 4°C for up to 1 mo.
6. 70% Ethanol (prepared with DEPC-treated water).
7. 49:1 (v/v) chloroform–isoamyl alcohol.
8. 100% isopropanol.
9. Refrigerated microcentrifuge or other refrigerated centrifuge capable of handling
microcentrifuge tubes.
10. Tissue disaggregating device, as needed.
Molecular Profiling of Tissue 41
11. Formamide purchased ready for use (Sigma, Molecular Research Center, others) or
prepare in the laboratory by mixing with 1 g of AG 501-X8 ion-exchange resin (Bio-
Rad, others) per 10 mL of formamide for 45 min and filter at room temperature.
2.10.2.4. DNASE TREATMENT OF TOTAL RNA
1. DEPC-treated ddH2O (see Subheading 2.10.2.3. for recipe).
2. RNase inhibitor (Perkin Elmer).
3. DNase I (GenHunter Inc) and DNase I buffer (GenHunter, Inc.).
2.10.3. Isolation of Protein for 2-Dimensional Gel Electrophoresis
Protein extraction methods vary widely depending on the intended analysismethod and are not detailed here. Recent papers by Ornstein (9), Simone (10),and Emmert-Buck et al. (42) contain useful protocols for protein extraction frommicrodissected frozen tissue material, and a 1998 paper by Ikeda et al. (43)
suggests that paraffin-embedded tissue can also be used for proteomic analysis.
3. Methods
3.1. Rapid Tissue Freezing (see Notes 13 and 14)
3.1.1. Isopentane Method
1. Place 400 mL of isopentane (highly flammable) in metal container large enough
to hold a corresponding Plexiglas or metal basket (see Note 15).
2. Place bed of dry ice in ice bucket.
3. Place the metal container containing isopentane onto dry ice. Allow 15–30 min
for a cool-down period. Put the tissue to be frozen into the metal or Plexiglas basket
long enough for complete freezing, Excess isopentane (highly flammable) can be
removed with a paper towel (see Note 16).
3.1.2. Gentle-Jane® Method
In our hands, because of the rapidity of freezing, this method provides supe-rior frozen section histology, and in some cases provides as good as or betterhistology than from formalin-fixed, paraffin-embedded samples (see Note 17).Rapid freezing reduces ice crystal size, preserving cellular architecture. Sig-nificant drawbacks are covered in the Notes (see Note 18).
1. Place sufficient liquid nitrogen in the Gentle-Jane (Instrumedics) liquid nitrogen
container to cover the metal piston (see Note 19).
2. Wait until liquid nitrogen stops boiling (metal and liquid nitrogen at equal tem-
peratures).
3. Place tissue on freezing pedestal.
4. Move metal piston to piston-holder, and gently lower onto tissue located on the
freezing pedestal.
5. Remove the frozen tissue from the pedestal.
42 Bova et al.
3.2. Preparation of Cytologic Specimens for Microdissection
3.2.1. Tissue Disaggregation Methods
A generic method for tissue disaggregation is defined below. Specific meth-ods will need to be optimized depending on the specific input tissues and out-put needs of the method. The method described is based on reports by Novelliet al. (44) of the use of collagenase and the Medimachine™ for isolation anddownstream analysis of cutaneous lymphocytes (44) and by Brockhoff et al.for isolation of colon carcinoma cells for downstream flow cytometry (37).
3.2.1.1. ENZYMATIC AND/OR MECHANICAL DISAGGREGATION (SEE NOTE 20)
1. Mechanically disaggregate tissue using sterile scalpel blades or the Medimachine™
as recommended by the manufacturer (http://www.bdbiosciences.com/immunocy-
tometry_systems/brochures/pdf/mmach_download.pdf). The Medimachine sys-
tem requires selection of the cutting device (Filcon™) mesh pore size desired (35
or 50 µm; 30 µm is for isolation of nuclei, 50 µm for whole cells), and the specific
filter pore shape (syringe type for larger volumes, cup type for smaller volumes)
and pore size desired (10–500 µm). Alternatively, if manual mechanical disaggre-
gation is performed with sterile scalpel blades, 70-µm (or other) pore size tissue
strainers (Falcon, BD Inc., Franklin Lakes, NJ) can be used.
2. If desired, either prior to (if the tissue sample is very small) or after mechanical
disaggregation, the suspended tissue clumps can be exposed to disaggregating
enzymes such as collagenase 1A (Sigma). Overexposure can lead to decreased
cell integrity and viability, so optimization of exposure duration and temperature
is critical for success.
3.2.2. Direct Smears of Liquids Containing Suspended Cells (see Note 21)1. Place one drop of liquid sample on a glass slide.
2. Drag the hemocytometer cover slip over the liquid sample.
3. Drop immediately (before drying) into fresh 70% ethanol for 10 dips. Then air-
dry or proceed to staining.
3.2.3. Tissue Scraping (see Notes 22 and 23)1. Gently scrape a sterile blade against wet tissue surface to collect fluid on the edge
of the blade.
2. Drag the blade gently across the dry glass slide.
3. Immediately plunge into 70% ethanol for 20 dips, then proceed to staining or air-
dry.
3.2.4. Cell Concentration Technologies
3.2.4.1. DENSITY AND SIZE GRADIENT SEPARATIONS (SEE NOTE 24)
1. Dilute cells, and prepare gradient in 50-mL conical tubes as directed by the manu-
facturer.
Molecular Profiling of Tissue 43
2. Centrifuge the cells as directed by manufacturer (usually approx 10,000g if cells
are in saline), wash if desired, and recentrifuge.
3. Lyse red cells if desired, wash, recentrifuge, resuspend, and count cells before
downstream molecular analysis or further separation by other methods.
3.2.4.2. MAGNETIC-BEAD BASED SEPARATIONS (SEE NOTE 25)
Magnetic-bead (or other bead-based) separations can be used separately ortogether with microdissection-based isolation. For particularly bloody speci-mens, red blood cell lysis agents should be added to bead-based protocols.Density-based separation methods (such as Ficoll gradients) can also add powerto bead-based techniques.
1. Obtain sterile aqueous samples containing intact cells of interest admixed with
other cells.
2. If necessary, use density gradient techniques to remove erythrocytes or use eryth-
rocyte lysis buffer such as those listed.
3. Wash cells and incubate with appropriate nonspecific (blocking) and specific anti-
bodies for selection of wanted or unwanted cells.
4. Wash cells and incubate with paramagnetic beads coated with secondary antibody
directed against the primary antibodies used (Dynal, Oslo, Norway, and others).
5. Magnetic (Dynal, others) separation of beads, leaving target cells in supernatant,
or on beads as desired.
3.2.4.3. SEMI-AUTOMATED CELL CONCENTRATION METHODS (SEE NOTE 26).
For Cytospin® (Thermo Shandon, Inc.), ThinPrep® (Cytyc Corp.), or Auto-cytePrep (TriPath Imaging) contact the manufacturer for specific materials andmethods.
3.3. Combined Formalin Fixation/Sucrose Infusionfor Cryostat Sectioning (see Note 27)
1. Fix samples (dimensions as small as possible to allow rapid penetration of fixa-
tive) in 2% or 4% buffered formaldehyde at 4°C for 4–24 h (duration needs to be
optimized for your tissue/application). When possible, perfuse the entire organ
with saline followed by formaldehyde prior to sectioning and placement in fixa-
tive solution. Usually this can be accomplished only via volume replacement
through the left ventricle.
2. Wash samples with sterile 4°C PBS.
3. Place samples in 0.5 M sucrose in PBS at 4°C. When tissue sinks, infusion is com-
plete. Do not allow the infusion to go longer than 1 d (reduces quality of tissue
morphology).
4. Place tissue samples in OCT or other embedding compound, and freeze rapidly.
Section on a cryostat.

44 Bova et al.
3.4. Standard Automated Clearingand Paraffin Embedding of Fixed Tissues (see Note 31)
See Subheading 2.5. for comments. In terms of standard embedding mate-rials, we have had good results with type VI paraffin (Richard Allan Scientific,Kalamazoo, MI), but many other products are available that are suitable.
3.5. Sectioning of Tissue Blocks for Microdissection
3.5.1. Frozen Sections (see Notes 29 and 30)1. Place a small amount of OCT onto a chuck in the cryostat.
2. Immediately place the frozen tissue block onto the chuck.
3. After the block is adherent to the chuck, place it in position onto the microtome.
4. Proceed to cut tissue sections onto glass slides. Reference H&E slides are cut at 6-
µm thickness, slides for microdissection are typically cut at 8-µm, or thicker if
ROI is still distinguishable at this thickness.
5. Immediately place the slides onto dry ice. Slides can be stained and dissected or
stored at �80°C.
3.5.2. Paraffin Sections (see Notes 31 and 32)1. Place tissue block onto a microtome.
2. Proceed to cut tissue sections.
3. Sections are floated on the surface of a bath containing distilled deionized water
(ddH2O) at 39°C.
4. Floating sections are lifted onto glass slides.
5. Slides are baked at 60°C for 5–10 min, until the wax surrounding the tissue goes
from whitish to translucent.
3.6. Staining of Tissue Sections for Microdissection
3.6.1. Mayer’s Hemalum and Eosin Stainingfor DNA, RNA, and Protein Recovery (see Notes 33 and 34)1. Replace reagents frequently for optimal results, and to reduce the risk of cross
contamination.
2. If protein recovery is desired from sections, add one complete miniprotease inhib-
itor tablet (Roche) per 10 mL of reagent, except xylene.
3. Stain each slide-mounted section as follows (see Notes 35 and 36):
Reagents in order of treatment Time
Fresh xylenes 1 (to remove paraffin) 3 min
Fresh xylenes 2 (to remove paraffin) 2 min
100% ethanol 15 s
95% ethanol 15 s
70% ethanol 15 s
DEPC-treated water 10 s
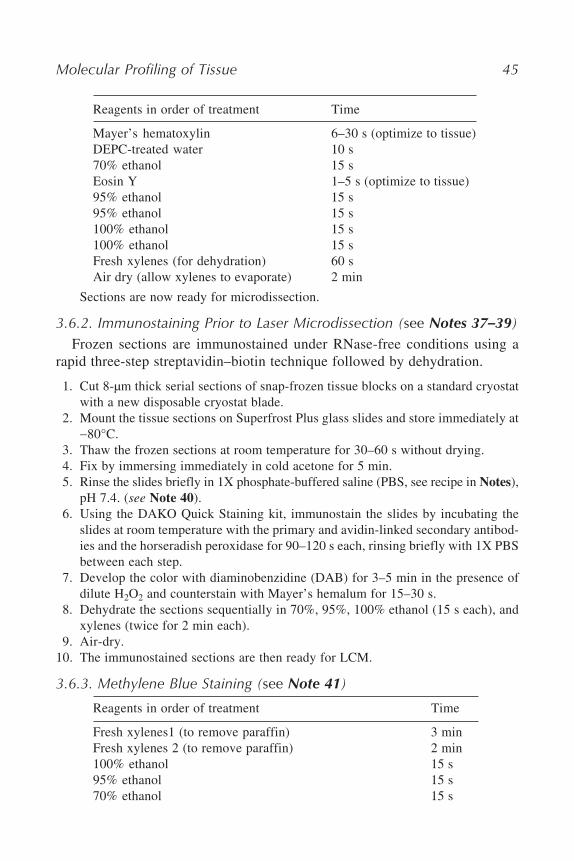
Molecular Profiling of Tissue 45
Reagents in order of treatment Time
Mayer’s hematoxylin 6–30 s (optimize to tissue)
DEPC-treated water 10 s
70% ethanol 15 s
Eosin Y 1–5 s (optimize to tissue)
95% ethanol 15 s
95% ethanol 15 s
100% ethanol 15 s
100% ethanol 15 s
Fresh xylenes (for dehydration) 60 s
Air dry (allow xylenes to evaporate) 2 min
Sections are now ready for microdissection.
3.6.2. Immunostaining Prior to Laser Microdissection (see Notes 37–39)Frozen sections are immunostained under RNase-free conditions using a
rapid three-step streptavidin–biotin technique followed by dehydration.
1. Cut 8-µm thick serial sections of snap-frozen tissue blocks on a standard cryostat
with a new disposable cryostat blade.
2. Mount the tissue sections on Superfrost Plus glass slides and store immediately at
�80°C.
3. Thaw the frozen sections at room temperature for 30–60 s without drying.
4. Fix by immersing immediately in cold acetone for 5 min.
5. Rinse the slides briefly in 1X phosphate-buffered saline (PBS, see recipe in Notes),
pH 7.4. (see Note 40).
6. Using the DAKO Quick Staining kit, immunostain the slides by incubating the
slides at room temperature with the primary and avidin-linked secondary antibod-
ies and the horseradish peroxidase for 90–120 s each, rinsing briefly with 1X PBS
between each step.
7. Develop the color with diaminobenzidine (DAB) for 3–5 min in the presence of
dilute H2O2 and counterstain with Mayer’s hemalum for 15–30 s.
8. Dehydrate the sections sequentially in 70%, 95%, 100% ethanol (15 s each), and
xylenes (twice for 2 min each).
9. Air-dry.
10. The immunostained sections are then ready for LCM.
3.6.3. Methylene Blue Staining (see Note 41)
Reagents in order of treatment Time
Fresh xylenes1 (to remove paraffin) 3 min
Fresh xylenes 2 (to remove paraffin) 2 min
100% ethanol 15 s
95% ethanol 15 s
70% ethanol 15 s
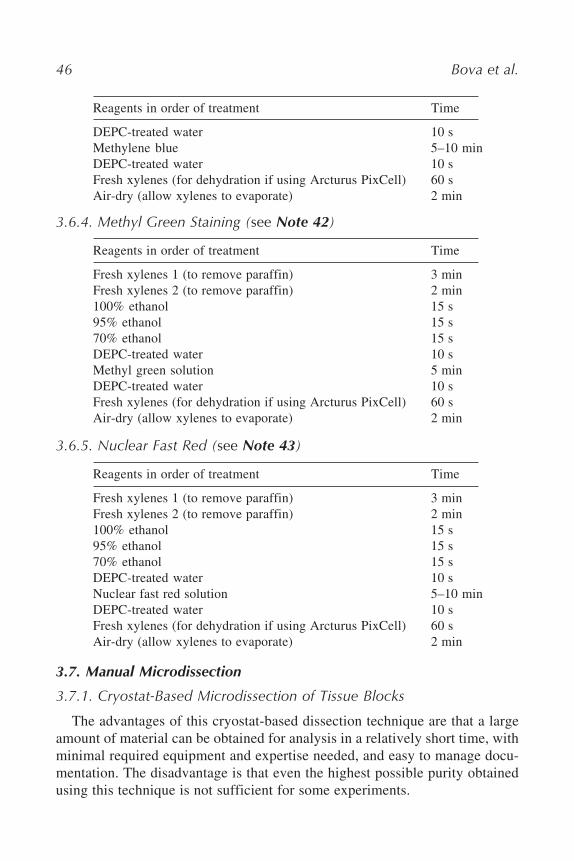
46 Bova et al.
Reagents in order of treatment Time
DEPC-treated water 10 s
Methylene blue 5–10 min
DEPC-treated water 10 s
Fresh xylenes (for dehydration if using Arcturus PixCell) 60 s
Air-dry (allow xylenes to evaporate) 2 min
3.6.4. Methyl Green Staining (see Note 42)
Reagents in order of treatment Time
Fresh xylenes 1 (to remove paraffin) 3 min
Fresh xylenes 2 (to remove paraffin) 2 min
100% ethanol 15 s
95% ethanol 15 s
70% ethanol 15 s
DEPC-treated water 10 s
Methyl green solution 5 min
DEPC-treated water 10 s
Fresh xylenes (for dehydration if using Arcturus PixCell) 60 s
Air-dry (allow xylenes to evaporate) 2 min
3.6.5. Nuclear Fast Red (see Note 43)
Reagents in order of treatment Time
Fresh xylenes 1 (to remove paraffin) 3 min
Fresh xylenes 2 (to remove paraffin) 2 min
100% ethanol 15 s
95% ethanol 15 s
70% ethanol 15 s
DEPC-treated water 10 s
Nuclear fast red solution 5–10 min
DEPC-treated water 10 s
Fresh xylenes (for dehydration if using Arcturus PixCell) 60 s
Air-dry (allow xylenes to evaporate) 2 min
3.7. Manual Microdissection
3.7.1. Cryostat-Based Microdissection of Tissue Blocks
The advantages of this cryostat-based dissection technique are that a largeamount of material can be obtained for analysis in a relatively short time, withminimal required equipment and expertise needed, and easy to manage docu-mentation. The disadvantage is that even the highest possible purity obtainedusing this technique is not sufficient for some experiments.
Molecular Profiling of Tissue 47
1. Mount the block to be dissected in the cryostat using OCT or other mounting
medium. Be sure to surround the block with mounting media so it has a strong base.
2. Cut face section of tissue to be dissected, mount on an ordinary glass slide, stain
with H&E, and cover slip.
3. Examine section microscopically with �4, �10 objectives and clearly mark unwanted
areas with a lab marker. Label slide as section 1 (etc.) and record in the logbook.
4. Remove the cryostat blade, or cover with a knife guard. Lock the reciprocating
block holder in place using the cryostat-locking mechanism. Place the marked glass
slide against the block to identify area to be cut. Draw dots or lines directly on
frozen block with the marker to indicate where cuts should be made.
5. Use new heavy-duty single-edge blade to carefully cut away unwanted tissue, and
trim OCT from edge of block, leaving a wider base of OCT close to the cryostat
chuck (reduces risk that block will pop off chuck after dissection) Caution: Take
great care to avoid cutting yourself (see Note 44).
6. Cut another face section of the block and mark this slide as section 2. Examine to
be sure that all unwanted tissue has been dissected. Repeat dissection and staining
until only desired tissue remains. Estimate the percentage purity of dissected mate-
rial and record in logbook.
7. Cut fifty 6-µm sections serially and allow them to stack on the cryostat cutting plate
(which is kept clean). Place collected sections in a cold sterile prelabeled 50-mL
conical tube using long forceps prechilled by dipping in liquid nitrogen just prior
to collection. Keep everything that contacts the sections frozen to avoid tissue
sticking to the forceps and to the sides of the 50-mL conical tube (see Note 45).
8. To monitor dissection progress, interval sections are mounted on glass slides and
H&E stained (usually before and after each episode of dissection at 300- to 600-µm
intervals). In some cases undesired areas of the frozen block are easy to identify
grossly based on their appearance in the initial face section, allowing continuous
visual monitoring and removal of undesired areas without the need to repeat slide
mounting and staining.
9. A record of estimated purity of the resulting sample, the number of sections, and
cross-sectional area dissected should be kept for reference during analysis of molec-
ular data and for monitoring of the percentage yield in downstream DNA/RNA/pro-
tein isolation protocols (see Note 46).
3.7.2. Manual Microdissection of Tissue Sections on Glass Slides
1. Prepare stained sections 7–10 µm thick, on glass slides without cover slips. For
each section to be dissected, prepare an adjacent stained cover slipped section on a
glass slide as a “scout section.” Prepare a dissection station using a standard inverted
microscope using a 30-gage needle on a syringe as the microdissecting tool (see
Note 47).
2. If desired (test necessity of this step for tissues to be dissected), place sections for
dissection in 2.5% glycerol solution.
3. While viewing the tissue through the microscope, gently scrape the cell popula-
tion of interest with the needle. The dissected cells will become detached from the
48 Bova et al.
slide and form small dark clumps of tissue that can be collected on the needle by
electrostatic attraction. Several small tissue fragments can be procured simultane-
ously. Collection of an initial fragment on the tip of the needle will assist in pro-
curing subsequent tissue.
4. The tip of the needle with the procured tissue fragments should be carefully placed
into a 1.5-mL tube containing the appropriate buffer. Gentle shaking of the tube
will ensure the tissue detaches from the tip of the needle (see Notes 48–51).
3.8. Laser Microdissection of Tissue Sections on Slides
3.8.1. Arcturus LCM System
The described procedure is for use with the Pixcell I or II Laser CaptureMicrodissection System manufactured by Arcturus Corporation (Santa Clara,CA), and assumes rudimentary knowledge of the function of the componentsof the instrument and the software that accompanies the instrument. The pro-cedure can be divided into three basic steps: slide positioning, microdissectingwith the laser, and collecting the microdissected cells. Additional methods infor-mation can be found at the Arcturus Engineering website (www.arctur.com).
3.8.1.1. POSITIONING THE SLIDE FOR MICRODISSECTION
Wear gloves when microdissecting to avoid contamination of LCM speci-mens. Clean the microscope stage and capping station with 95% ethanol beforebeginning the microdissection to reduce the possibility of contamination. Withthe stage vacuum off, place the glass slide with the section to be microdissectedon the microscope stage and identify the target of interest. When viewing uncover-slipped sections for dissection, put the light diffuser piece (white membrane) inplace to improve visualization. If necessary, refer to an adjacent cover slippedsection for orientation. When the target of interest is identified, place the stage-motion joystick so that it is perpendicular to the tabletop and then slide theglass slide so that the target of interest is in the center of the field of view. Turnon the stage vacuum. If the slide does not cover the vacuum chuck holes whencentered, move the slide as little as necessary until it just covers the holes andcontinue to the next step. Identify targets of interest and take “roadmap” imagesof targets of interest if desired using the Arcturus software.
3.8.1.2. MICRODISSECTION
Pick up a CapSure™ LCM cap from the loaded cassette module with the place-ment arm, moving the placement arm toward the caps to ensure that the cas-sette module is engaged so that the first available cap is aligned, and lifting thetransport arm until the cap detaches from the base slide in the cassette module.The arm must then be positioned over the tissue, ensuring that the area to be

Molecular Profiling of Tissue 49
microdissected is still in the microscopic field of view. Finally, the arm isgently lowered so that the cap contacts the tissue section. If there are folds in thetissue, the cap may not make direct contact with the entire surface at that areaand transfer efficiency is compromised. Therefore, it is advisable to inspectthe tissue before placing the cap. If any tissue is mounded or folded, it is bestnot to place the cap over that area. Alternatively, the folded area of the tissuecan be scraped off the slide using a sterile razor blade, leaving only flat portionsof the tissue section. The tissue section must be dry and uncover-slipped duringdissection. Next, enable the diode laser and visualize the tracking beam on themonitor as well as through the eyepieces. Once the laser is focused using thelaser-tracking beam and then the focus of the tissue is adjusted using �20 objec-tive, one is ready for dissection. Refocus the laser beam for each tissue sectionand slide at the 7.5-µm beam setting by turning the laser-focusing wheel untilthe tracking beam shows a bright spot with a well-defined edge. There shouldbe no bright rings surrounding the central spot. There is no need to refocus the15 µm or 30 µm beams. They are automatically calibrated once the 7.5-µm beamis focused. Adjust the laser power and pulse duration settings for the particularspot size following the manufacturer’s recommendation and as needed to obtaingood tissue “wetting” by molten plastic, as indicated by clear areas formed witheach laser pulse. If the edges of the area of clearing are not well delineated,check to make sure the tissue section (where the cap is placed) is flat. If this failsto correct the problem, we recommend increasing the power and/or durationgradually, testing for wetting with higher energy/duration. Move the stage withthe joystick, targeting selected cells by firing the button-actuated laser. Whentargeting is complete, lift the placement arm and inspect the area in which thelaser was fired for removal of cells. Dissected areas should show near totalremoval of tissue. Quality of dissection should be checked occasionally byreleasing the vacuum slide holder, moving the slide so that a clean area with-out tissue is in the microscopic field of view, lowering the cap to the slide, andscanning the surface of the cap. The microdissected tissue should be visible onthe cap surface. If this is not the case, there are several explanations and poten-tial remedies (see Notes 52–61). Avoid lifting and lowering the cap after firingthe laser and capturing tissue. Already-captured tissue attached to the LCMcap will be placed on the histologic section away from its point of origin, result-ing in a layering effect, which can limit contact of the cap with the tissue andcompromise the effectiveness of LCM. However, before proceeding with a large-scale microdissection, we recommend that the user check for quality of dissec-tion after several pulses. This should not interfere with subsequent dissectionand the cap can be placed back in the same position. In addition, dense, dark,or thick samples may occlude the tracking beam. If this occurs, the intensity of
50 Bova et al.
the tracking beam should be increased. Once LCM is achieved successfully withinitial test pulses, the remainder of the desired cells can be efficiently micro-dissected.
3.8.1.3. COLLECTION OF THE MICRODISSECTED CELLS
After the microdissection is completed, the placement arm with the cap ismoved to the “unload platform” and, using the cap insertion tool, the cap isremoved. Cells that were not selected for capture may stick to the surface ofthe cap at random, and it is important to remove this unwanted tissue. This canbe accomplished by using CapSure Pads®, purchased from the manufacturer,which have a sticky surface. A less costly alternative to the CapSure Pad is touse the sticky surface of Post-it® Notes, which can be used after the cap has beenremoved from the unload platform (gently touch the cap three separate timesto clean areas of the Post-it Note, then view the cap microscopically to ensurethat all loose material is removed). To obtain successful removal of unwantedcells, one may have to repeat this two or three times. When removal of unwantedmaterial is complete, use the cap insertion tool to place the LCM cap onto aPerkin Elmer/Applied Biosystems GeneAmp 500-µL thin-walled PCR reac-tion tube (cat. no. N8010611) containing the appropriate amount of lysis buffer.The buffer used will depend upon the analyte, for example, RNA, DNA, or pro-tein, and the method of analysis. Do not seat the LCM cap fully on the micro-centrifuge tube, as this will cause undue stretching and possible reagent leakage.Leave a 2-mm gap between the cap top and the rim of the microcentrifuge tubeto avoid this problem. For best results, use only Eppendorf tubes, as they arewell-matched to the size of the lower portion of the CapSure™ caps. Invert thetube so that lysis buffer contacts the cap surface, and place on ice or refriger-ate until the microdissection session is over, to preserve the analyte. If regularCapSure™ caps are used (not HS caps described later), an exposed blank LCMcap control is recommended for each experiment to ensure that nonspecifictransfer is not occurring during microdissection. This is best performed byplacing an LCM cap on the tissue section being dissected and aiming and fir-ing the laser at regions where there are no cells or structures present, for exam-ple, lumens of large vessels, cystic structures, and so forth (alternatively one canplace a portion of the LCM cap “off” the tissue and target this region). The capshould be processed through the buffer and analysis methodology applied. Thisserves as a negative control.
3.8.2. LCM Method for Epithelial Cell EnrichmentMaitra et al. have described an enhancement to LCM that can be used to
enrich samples for neoplastic cells (45). This method, called “epithelial aggre-gate separation and isolation,” or EASI, is applicable to fresh tissues only.
Molecular Profiling of Tissue 51
1. The tissue is sectioned and gently scraped with the edge of a plain, uncharged, micro-
scope glass slide.
2. The material adherent to this slide is then spread evenly onto the surface of a
second uncharged slide.
3. Slides are immediately fixed in 95% methanol for 2 min and stained with H&E.
4. Epithelial aggregates on these slides can then be microdissected using an LCM.
Alternatively, manual methods can also be used.
5. The advantages of this technique are that the discreteness of the epithelial clusters
helps reduce background inflammatory and stromal elements and that large areas
can be sampled (46).
3.8.3. LCM Dissection of Single or Small Numbers of Cells
Arcturus Engineering has developed a line of related products speciallydesigned for high sensitivity capture and extraction of a single cell or a smallnumber of cells. There are three key components of the system: (1) a prepara-tion strip that flattens the tissue section and removes loose debris, (2) a high-sensitivity transfer cap (CapSure HS™ cap) that keeps the cap surface out ofcontact with the untargeted section surface, and (3) a low-volume reaction cham-ber that fits onto the high sensitivity transfer caps and accepts a low volume oflysis or digestion buffer while sealing out any nonselected material from thecaptured cells. The surface coated with polymer contacts only the tissue in thearea that the laser is fired, thus reducing nonspecific transfer of tissue. Using theHS caps, it is preferable to capture cells as close to the center of the cap as pos-sible. Unlike basic LCM using standard caps, the HS caps can be repositioned asoften as needed to keep the targets toward the center of the cap, the cap surfacedoes not contact the tissue except at the area that the laser is fired. It is importantto stay within the capture ring because areas outside the ring will be excludedfrom the low-volume reaction tube. After the intended microdissection is com-pleted, the HS cap is placed on the unload platform, picked with the cap insertiontool, and placed into the alignment tray. The specialized low-volume reactionchamber is then positioned over the cap. The chamber has a port for insertionof the lysis/digestion buffer. Ten microliters of the desired buffer is deliveredinto the fill port, which is covered securely with a thin-walled Gene-Amp PCRtube.
3.8.4. PALM Microbeam System
Follow the manufacturer’s instructions for general use of the instrument.
3.8.5. Leica LMD System
As for the PALM system, follow the manufacturer’s instructions for generaluse of the instrument.
52 Bova et al.
3.9. Isolation of Analyte from Microdissected Material3.9.1. Isolation of DNA3.9.1.1. KIT-BASED METHOD (BASED ON DNEASY KIT BY QIAGEN)
(This protocol applies to all types of tissue material microdissected fromglass slides. Ignore references to LCM caps if material was manually dissectedor dissected using other devices).
1. Remove the LCM Cap using the cap-removal tool, add 45 µL of proprietary Buffer
ATL and 5 µL of proteinase K mixture (45:5) per cap, and replace the cap, taking
care not to fully seat the cap (causes stretching and later leakage).
2. Mix the solution by vortexing briefly, flick down the tube in an upside down
position so that the cells on the cap make contact with the solution, vortex five
times at 1-s intervals, and incubate at 55°C for 3 h in a Hybaid oven or other oven
that provides gentle rocking motion. Vortex again three times.
3. Centrifuge the tubes at 5000 rpm (2700g) for 5 min at room temperature in a micro-
centrifuge.
4. Heat tubes at 95°C at 600 rpm using a Thermomixer R (Eppendorf) or other heating
device for 10 min to inactivate proteinase K (if sample is to be used directly for PCR).
5. Add 2 µL of 0.5 mg/mL of RNase A, vortex briefly, and incubate at 37°C for 30
min.
6. Combine all samples from each case (if multiple caps per unique case) into a fresh
microcentrifuge tube, add 150 µL of proprietary buffer AL, immediately mix by
vortexing, and incubate at 70°C for 10 min. (White precipitate may form after
addition of AL buffer, but will dissolve while incubating at 70°C.)
7. Add 150 µL of room temperature 100% ethanol and mix thoroughly by vortexing.
8. Transfer the sample into a DNeasy mini-column sitting in the provided 2-mL col-
lection tube and centrifuge at 8000 rpm (6800 g) for 1 min at room temperature.
9. Transfer the column into a fresh collection tube, add 500 µL of buffer AW1, and
centrifuge for 1 min at the same speed.
10. Transfer the column into a fresh collection tube, add 500 µL of buffer AW2, and
centrifuge for 3 min at 17,900g (13,000 rpm with Eppendorf 5417C microcen-
trifuge, using standard fixed angle rotor) to dry the column.
11. To elute DNA from the column, transfer the column into a 1.5-mL microcentrifuge
tube, add 200 µL of buffer AE, and centrifuge for 1 min at 10,600g (10,000 rpm
with Eppendorf 5417C microcentrifuge, using standard fixed angle rotor). To
increase recovery of the DNA, use the buffer containing the DNA after the first
elution to elute the column one more time.
12. Add 1 µL of 20 mg/mL glycogen, 20 µL of 3 M sodium acetate, pH 5.2, 440 µL of
100% ethanol, mix by vortexing and incubate at �20°C for at least 1 h (we are
unable to find a reference supporting an optimal time for precipitation).
13. Centrifuge the sample at 13,000 rpm at +4°C for 30 min, aspirate the supernatant,
and resuspend the pellet in 1 mL of 70% ethanol. Centrifuge the tube for 10 min,
aspirate ethanol, and air-dry the pellet for 5–10 min.
Molecular Profiling of Tissue 53
14. Resuspend each DNA pellet in 5 µL of loTE buffer, pH 7.4 (see recipe below),
combine all the sample in one tube and use 0.5 µL of the sample to quantitate
using pico-green (or other) assay.
3.9.1.2. SDS/PHENOL–CHLOROFORM EXTRACTION
1. Transfer samples to a first SST tube. (This can be performed in 1.5-mL microcen-
trifuge tubes if volume requirements are smaller.)
2. Add 6 mL of phenol–chloroform–isoamyl alcohol (25:24:1) to each tube (see
Note 62).
3. Vortex five times, setting 8.
4. Centrifuge at 2000g (STH-750 rotor), 20 min, room temperature.
5. Transfer the top (aqueous) layer to a second SST tube.
6. Add 6 mL of phenol–chloroform–isoamyl alcohol (25:24:1) to each tube.
7. Vortex five times (VWR vortex Genie, setting 8).
8. Centrifuge at 2000g, 20 min, room temperature.
9. Transfer the aqueous layer to a third SST tube.
10. Add 6 mL of phenol–chloroform–isoamyl alcohol (25:24:1) to each tube.
11. Vortex five times, setting 8.
12. Centrifuge at 2000g, 20 min, room temperature.
13. Transfer the aqueous layer to a 50-mL first sterile blue top conical tube.
14. Add 5.75 mL of chloroform–0.25 mL of isoamyl alcohol to each tube.
15. Vortex five times, setting 8.
16. Centrifuge at 2000g (3100 rpm in Sorvall Super T21 Refrigerated Centrifuge ST-
H750 rotor, swing buckets), 20 min, at room temperature.
17. Transfer the aqueous phase to a second 50-mL conical tube.
18. Add 2.5 mL of ammonium acetate, mix gently.
19. Add 15 mL of “frozen” 100% ethanol, mix gently.
20. Store in −20°C, overnight.
21. Centrifuge at 3800g (4300 rpm in Sorvall Super T21 Refrigerated Centrifuge ST-
H750 rotor, swing buckets), 30 min, 4°C.
22. Discard the supernatant gently into a waste flask, preserving pellet.
23. Wash pellet with 10 mL of 70% EtOH (room temperature), set for 10 min.
24. Centrifuge at 3800g, 10 min, 4°C.
25. Discard the supernatant into the waste flask.
26. Wash with 10 mL of 70% EtOH (room temperature), set for 10 min.
27. Centrifuge at 4300 rpm (STH-750 rotor), 10 min, 4°C.
28. Gently discard the supernatant into the waste flask.
29. Inverted at a 30° angle, air dry for 25 ± min (do not overdry or DNA will not go
into solution).
30. Resuspend in 200–1000 µL or more of LoTE (volume dependent on predicted
yield and desired storage concentration), and store at 4°C, overnight.
31. Gently mix DNA and transfer DNA to a microcentrifuge tube or other storage
device.
54 Bova et al.
3.9.2. Isolation of RNA (see Notes 63 and 64)
We have obtained high-quality total RNA from microdissected samples usinga phenol–chloroform-based approach, and also using the PicoPure RNA isola-tion kit (Arcturus), a column-based approach that is optimized for use withmicrodissected cells. Several other kit-based methods for isolation of totalRNA from small tissue samples are currently on market from companies such asAmbion, Qiagen, and others (47), but we have not had the opportunity to testthem. The phenol–chloroform and Arcturus kit-based methods are covered here.
Prior to performing total RNA extraction of any kind, it is wise to clean allpipettors with a RNase removal product such as RNase AWAY™ (MolecularBioProducts) or RNase ZAP™ (Ambion, Austin, TX).
3.9.2.1. KIT-BASED METHOD (PICOPURE RNA ISOLATION KIT BY ARCTURUS)
1. Dispense extraction buffer (XB) and incubate as follows:
a. Pipet 50 µL of well-mixed XB into a Perkin Elmer/Applied Biosystems GeneAmp
500-µL thin-walled PCR reaction tube (cat. no. N8010611) 0.5-mL microcen-
trifuge tube. This is the only type of tube that Arcturus currently recommends
using with the original non-LCM caps currently, as other tubes vary in diam-
eter and may be more prone to leakage.
b. Place CapSure LCM cap onto the microcentrifuge tube using an LCM cap
insertion tool.
c. Invert the CapSure Cap-microcentrifuge tube assembly. Tap the microcentri-
fuge tube to ensure all XB is covering the CapSure LCM cap.
d. Incubate assembly for 30 min at 42°C.
2. Centrifuge assembly at 800g (approx 3500 rpm) for 2 min to collect cell extract.
3. Remove the LCM cap and save the tube with the extract in it.
4. Proceed with the RNA isolation or freeze the extract at �80°C.
5. Precondition the RNA purification column:
a. Pipet 250 µL conditioning buffer (CB) onto the purification column filter mem-
brane.
b. Incubate the column with conditioning buffer at RT for 5 min.
c. Centrifuge the purification column in the provided collection tube at 16,000g
(approx 14,000 rpm) for 1 min.
6. Pipet 50 µL of 70% ethanol (EtOH) into the cell extract from step 4. Mix well by
pipetting. Do not centrifuge.
7. Pipet the cell extract and EtOH mixture into the preconditioned purification col-
umn. The combined volume will be approx 100 µL.
8. Centrifuge for 2 min at 100g (approx 1200 rpm), immediately followed by 16,000g
(14,000 rpm) for 30 s.
9. Pipet 100 µL of wash buffer 1 (W1) into the purification column and centrifuge for
1 min at 16,000g (approx 14,000 rpm). A DNase step may be performed at this point:
a. DNase treatment (Qiagen RNase-free DNase Set, cat. no. 79254).
Molecular Profiling of Tissue 55
b. Pipet 5 µL of DNase I stock solution into 35 µL of buffer RDD. Mix by inverting.
c. Pipet the 40 µL of DNase incubation mix directly onto the purification column
membrane.
d. Incubate at RT for 15 min.
e. Pipet 40 µL of PicoPure RNA Kit wash buffer 1 (W1) into the purification col-
umn. Centrifuge at 8000g (approx 10,000 rpm) for 15 s.
10. Pipet 100 µL wash buffer 2 (W2) into the purification column and centrifuge for
1 min at 16,000g (approx 14,000 rpm).
11. Pipet another 100 µL of wash buffer 2 into the purification column and spin for 2
min at 16,000g (14,000 rpm). Check the column for any residual wash buffer. If
present, centrifuge for an additional minute.
12. Transfer the purification column to a new microcentrifuge tube provided in the kit.
13. Pipet 11 µL (maximum is 30 µL) elution buffer (EB) directly onto the membrane of
the purification column.
14. Incubate the purification column for 1 min at RT and then centrifuge at 1000g
(approx 3800 rpm) for 1 min and then maximum speed for 1 min to elute RNA. Use
RNA immediately or store at �80°C until use.
3.9.2.2. PHENOL–CHLOROFORM-BASED RNA EXTRACTION METHOD
This method is modified from Chomczynski and Sacchi (48):
1. Ensure an RNase-free environment, including reducing likelihood that pippetors
contain RNases as described in the preceding.
2. Dissolve tissue obtained by microdissection by placing in 200 µL of GITC dena-
turing solution. Invert several times over the course of 2 min to digest the tissue
off the cap. If tissue does not dissolve completely, use an appropriate disaggregat-
ing device to homogenize.
3. For specimens that originated from paraffin-embedded tissue, it is helpful to
include an incubation step (with the tube inverted) of 20 min at 60°C to further
liberate the RNA from the tissue.
4. Remove the solution from the reagent tube and replace it in a sturdy RNase-free
1.5-mL microcentrifuge tube (cap must seal tightly, and must be able to withstand
centrifugation at 10,000g; test this if necessary).
5. Add 20 µL (0.1X volume) of 2 M sodium acetate, pH 4.0.
6. Add 220 µL (1X volume) of water-saturated phenol.
7. Add 60 µL (0.3X volume) of chloroform–isoamyl alcohol.
8. Shake the tube vigorously for 15 s.
9. Place on wet ice for 15 min.
10. Centrifuge at 10,000g for 30 min at 4°C to separate the aqueous and organic
phases.
11. Transfer the upper aqueous layer to a fresh tube (see Note 65).
12. Add to aqueous layer, 1–2 µL of glycogen (10 mg/mL) and 200–300 µL of cold
isopropanol (i.e., equal volume). Glycogen facilitates visualization of the pellet,
which can be problematic when using small amounts of RNA.
56 Bova et al.
13. Place samples at �80°C (some use �20°C) for at least 30 min. It may be left over-night.
14. Before centrifuging, the tubes may need to be thawed slightly if they have solidi-fied during the isopropanol precipitation.
15. Centrifuge for 30 min at 4°C with cap hinges pointing outward so that the locationof the pellet can be better predicted.
16. Remove the supernatant and wash with 300 µL of cold 70% ethanol. Add the alco-hol and centrifuge for 5 min at 4°C.
17. Remove the supernatant.18. Let the pellet air dry on ice to remove any residual ethanol. Overdrying prevents
the pellet from resuspending easily (drying is not necessary however if the RNAis to be resuspended in formamide).
19. The pellet may be stored at �80°C until use or proceed to DNase treatment (see
below).20. Dissolve the RNA pellet in 10–20 µL DEPC-treated water and store at �80°C, or
dissolve in a similar amount of deionized formamide by passing the solution a
few times through a pipett tip and store at �20°C or �80°C.
3.9.2.3. DNASE TREATMENT OF TOTAL RNA(ALTERNATE TO METHOD IN SUBHEADING 3.9.2.1., STEPS 9A–9E)1. DNase treatment is highly recommended for microdissected cells. Genomic DNA
contamination is often problematic with these samples, possibly due to the smallDNA fragments that are created during tissue processing and are difficult to purifyfrom RNA.
2. To an RNA pellet, add 15 µL of DEPC-treated water and 1 µL (20 U/µL) RNaseinhibitor (Perkin Elmer).
3. Gently mix by flicking until the pellet is dissolved.4. Pulse spin on microcentrifuge.5. Add 2 µL of 10X DNase buffer (GenHunter) and 2 µL (10 U/µL) DNase I (GenHunter;
20 U total).6. Incubate at 37°C for 2 h.7. Reextract RNA by adding:
a. 2 µL 2 M sodium acetate, pH 4.0.b. 22 µL of water-saturated phenol.c. 6 µL of chloroform-isoamyl alcohol.
8. Shake vigorously for 15 s.9. Place on wet ice for 5 min.
10. Centrifuge at 10,000g for 10 min at 4°C.11. Transfer upper layer to a fresh tube.12. Continue with RNA extraction from step 12 in Subheading 3.9.2.2., adjusting the
volume of isopropanol accordingly.
4. Notes1. Commercial preparations of 10% neutral buffered formalin contain 1–10% metha-
nol (13). This is added to inhibit polymerization of formaldehyde, which can grad-
Molecular Profiling of Tissue 57
ually precipitate out of solution. Commercially prepared NBF is not used for elec-
tron microscopy because the added methanol can cause coagulation of proteins.
Similarly, molecular laboratories wishing to avoid protein coagulation should con-
sider making formaldehyde solutions from scratch for this reason.
2. Formaldehyde is a carcinogen in rodents and can induce allergies in humans. Use
appropriate means to avoid inhalation and contact exposure under all circumstances.
3. A 37% formaldehyde solution can be prepared by dissolving 37 g of paraformal-
dehyde powder (e.g., Sigma) in 100 mL of water in a fume hood. Heat to 70°C (no
higher—to avoid decomposition) to allow paraformaldehyde to dissolve and dis-
sociate into a mixture of polymeric and nonpolymeric formaldehyde, and cool to
room temperature. Note that many laboratories call any fixative made directly from
paraformaldehyde powder “paraformaldehyde,” which is something of a misnomer
because all formaldehyde solutions are a mixture of formaldehyde and paraformal-
dehyde.
4. The term “formalin” should be abandoned because of the confusion it causes, but
nonetheless is in common usage. “10% formalin” by tradition is what is obtained
when 37% formaldehyde is diluted 1:10. The correct term is 3.7% formaldehyde.
5. The resulting pH of this 10% neutral buffered formalin solution is approx 6.8, and
is hypotonic at approx 165 mosM. Isotonic 3.7% formaldehyde can be prepared by
increasing sodium phosphate monobasic to 18.6 g, eliminating sodium phosphate
dibasic, and adding 4.2 g of NaOH. This is known as Modified Millonig Formalin,
and isotonic (310 mosM), with a pH of 7.2–7.4. It can be used both for histologic
preparation of tissues for light and electron microscopy (12). Note that formalde-
hyde itself is reported not to be osmotically active (49).
6. Molecular studies performed in our laboratories have shown that that both 70%
ethanol and a 4.2:1.8:2.0 (v:v:v) of ethanol–methanol–water provide excellent his-
tologic detail, and markedly improved DNA (7), RNA (7), and protein quality (4)
compared to standard 10% NBF fixation.
7. 70% Ethanol is easy to prepare, but may be open to abuse (human consumption)
in some laboratory environments.
8. The final concentration of ethanol in this mixture is 52.5%, and the final concen-
tration of methanol is 25%. The mixture needs to be marked as toxic, as it can cause
blindness if ingested.
9. Methanol penetrates tissues measurably faster than ethanol in our studies (G. S. B.,
unpublished data).
10. In a blinded survey of practicing pathologists, kidney and prostate histology were
better with this ethanol–methanol mixture than with 70% ethanol, although both
were rated acceptable (7).
11. Complete proteinase K digestion is critical to downstream DNA isolation effi-
ciency. If proteins are inaccessible to proteinase K because of residual paraffin, or
other hydrophobic compounds, DNA recovery will be affected.
12. Even when proteins are accessible to the enzyme, incomplete digestion will also
markedly reduce yield. Well-digested samples are clearer, without clumps, and flow
freely. Add more proteinase K and incubate longer if digestion appears incomplete.

58 Bova et al.
Proteinase K functions at least between 37°C and 55°C, and may function at room
temperature, although we have not tested this. We use 48°C, and this works.
13. Direct immersion of tissue in liquid nitrogen often leads to poor histological pres-
ervation because freezing is not rapid enough to prevent formation of ice crystals
large enough to damage cell morphology, and should be avoided. A jacket of insu-
lating nitrogen gas forms around the tissue after immersion, slowing heat transfer.
Two methods that provide more rapid freezing and better histology are discussed.
14. Tissues thicker than roughly 2 mm tend to crack, probably because of stresses
caused by differential expansion of the tissue as the wave of freezing passes through
the tissue from outside to inside.
15. Multiple blocks can be frozen simultaneously if the basket is large enough
16. If freezing in OCT is desired, plastic cryomolds can be purchased for this pur-
pose. Tissues frozen at �80°C or below for long periods with no covering oil or
other material become severely dessicated (“freezer burn”), which, however, may
also occur in samples stored in OCT over longer periods. Instrumedics (Hacken-
sack, NJ) sells oil for covering tissues to prevent desiccation, but we do not have
independent confirmation that this technique works.
17. This is our preferred method for rapid freezing, because it does not require use of
flammable liquid, and in our hands (G. S. B.) provides histological quality as
good as standard H&E-stained formalin fixed paraffin-embedded sections.
18. Only one block can be frozen at a time (taking 1 min or so per block) using this
device and if many blocks need to be frozen simultaneously, this method can be
prohibitively slow.
19. The device can be used without an embedding compound, but may cause the tis-
sue to stick to the piston or to the base. We always use an embedding compound,
and cut clear plastic from a report cover to approx 3 cm � 3 cm, cover this with
4 mm of embedding compound, freeze enough to make firm (but not crack) and
use this as a base on which to place tissue to be frozen. A layer of embedding
media is put over the entire top and sides of the tissue, and the cold metal piston is
then lowered onto the tissue.
20. The two greatest advantages of disaggregation of tissues are that living cells can
be obtained and that whole cells are recoverable. The disadvantages are that tis-
sue morphology is lost, and a reliable molecular method (usually antibody-speci-
fic staining) is required to identify the cells of interest after disaggregation.
21. The same basic caveats apply to cytologic specimens as to histologic sections:
alcohol fixation is preferred, especially for RNA analysis.
a. Smeared cells should not be allowed to dry on the slide prior to fixation, partic-
ularly for those using LCM (difficult to remove cells from slide surface). Fixed
and stained cells should be adequately dehydrated prior to attempting LCM.
b. We prefer to prepare cytologic smears with a hemocytometer cover (rather than
using a separate glass slide) because the width is slightly less than that of the
standard glass microscopic slide and the resulting smear (and cells) are not
spread to the edge (or off) of the slide, where they are difficult or impossible to
stain and microdissect.
Molecular Profiling of Tissue 59
22. As for direct smears of liquids containing suspended cells, smeared cells should
not be allowed to dry on the slide prior to fixation, particularly for those using
LCM (difficult to remove cells from slide surface). Fixed and stained cells should
be adequately dehydrated prior to attempting LCM.
23. This technique works best when target cells are less adherent to tissue than non-
target cells. Most epithelia are less adherent than underlying stroma for example.
24. Density and size-based separation techniques traditionally has been used to sepa-
rate blood mononuclear cells, cell organelles, and microorganisms, but has not
been used routinely for disaggregated solid tissue cell separation, because of the
time the cells spend unfixed and because of the loss of tissue morphology. Theo-
retically, these problems are surmountable through isosmotic fixation of cells,
and if the cells are phenotypically distinct based on a specific antibody or other
marker, this method may become more useful as specific phenotypic immuno-
markers and other biomarkers are identified. An advantage of this method when
compared to tissue sectioning is that whole cells are obtained.
25. A large amount of pertinent information about magnetic bead-based separations
is contained in the Dynal website (www.dynalbiotech.com). Other manufacturers
also offer bead-based separation systems.
26. Cytospin® preparations can be used for any cytologic sample but are preferred for
samples of low cellularity. Another alternative to handling samples of low cellu-
larity is to centrifuge the sample, pour off the supernatant, and make a direct smear
from the sediment concentrated in a low volume of liquid. Particularly bloody spe-
cimens may benefit from Ficoll separation. If such a separation is used, to avoid
RNA, DNA, or protein degradation, the cytologic samples should be processed and
fixed in 95% ethanol before processing.
27. This method was originally developed for electron microscopy, and can provide
improved histology over standard frozen section techniques, and theoretically will
provide biomolecular integrity intermediate between frozen and formalin-fixed,
paraffin-embedded tissue. We are not aware of its use in molecular studies to date,
but it warrants testing for molecular profiling studies requiring excellent histol-
ogy, moderate biomolecule quality, and avoidance of the relatively high tempera-
ture exposures of standard tissue processing. It is also notable that since proteins
should not be denatured using this technique, and because heating (antigen retrie-
val) can reverse formaldehyde crosslinks, native proteins may be obtainable using
this technique.
28. It is notable that an effort is currently underway by Sakura Finetek (Torrance,
CA) and the University of Miami School of Medicine to replace current standard
surgical pathology tissue processing methods with the goal of reducing time and
to increase the molecular preservation and analyzability of samples (50).
29. Frozen sections allowed to come to room temperature and dry prior to staining
will usually adhere too strongly to the slide, preventing effective LCM. Other types
of microdissection are not affected by drying.
30. If frozen tissue sections are to be used for RNA analysis, it is essential that they be
stored at �80°C and used within 2–3 mo of sectioning. This conclusion is based
60 Bova et al.
an anecdotal experience in which tissue microdissected from frozen sections on
slides stored for 2 yr did not yield high quality RNA (further study may be needed).
31. If slides are to be stored in a slide file, allowed to cool first. Storage in slide boxes
with space between slides is probably optimal to reduce risk of damage to sections
and contamination, but this has not been studied to our knowledge.
32. The need for DEPC-treated water in the section-floating bath to eliminate RNase
exposure and/or use of protease inhibitors in the water bath to eliminate protease
exposure has not been tested to our knowledge. Immunostaining of paraffin sec-
tions floated in ordinary tap water has been the rule for several decades, so it is
likely that paraffin inhibits significant protein degradation, but depending on your
applications, testing under controlled conditions may be warranted for potential
effects of proteases, especially on low-abundance proteins.
33. Use the least amount of Mayer’s hemalum (MH) and eosin necessary for visualiza-
tion of the cells of interest. Recovery of DNA, RNA, and protein is improved as MH
and eosin content decreases. Decreased stain content can be achieved by decreas-
ing time of exposure or by decreasing concentration of stain used. Decreased con-
centration (we use 10% of normal) provides greater control if staining is done
manually.
34. Minimized MH intensity in sections also allows better visualization during micro-
dissection, because MH-stained areas appear much darker than normal when no
coverslip is in place. MH-stained areas in “normally” MH&E stained tissue sec-
tions appear black when no cover slip is present because of light scattering at the
tissue–air interface (scattering occurs because of refractive index mismatch between
air and tissue).
35. Poor LCM (Arcturus PixCell device) transfers will occur if sections are not fully
dehydrated and xylene treated. Be sure that the 100% ethanol used are fresh to
ensure dehydration. Xylenes should be changed when cloudy.
36. The final xylene step is necessary for successful Arcturus LCM, but may not be
necessary for other types of microdissection. Xylene treatment appears to remove
the alcohols more effectively, allowing the LCM EVA plastic to adhere better to
the tissue, although this is not proven. When using membrane-coated slides (with
PALM, Leica devices) with xylene, test blank membrane-coated slides in xylenes
prior to staining sections. Membrane formulations are changing, and some mem-
branes may dissolve in xylenes.
37. The mRNA recovered from tissue with a short blood perfusion-free interval and
that is rapidly frozen and immunostained is generally of high quality. Single-step
PCR allows amplification of fragments of more than 600 bp from both housekeep-
ing genes, for example, �-actin, as well as cell-specific messages, for example,
CD4 or CD19, using cDNA derived from less than 500 immunostained, microdis-
sected cells (NCI Laboratory results).
38. For primary antibodies other than those included in a commercial kit such as in
DAKO Quick Staining kit, the dilutions should be determined individually. Add
placental RNase inhibitor to the primary antibody and the DAB solution in a con-
centration of 200–400 U/mL. All solutions are prepared with DEPC-treated water.
Molecular Profiling of Tissue 61
39. If RNA is to be isolated from dissected material, it is essential that microdissec-
tion proceed immediately after slide preparation since significant RNA degradation
may occur in fully dehydrated tissue sections after just one hour at room tempera-
ture. In addition, captured cells should be extracted with GITC (guanidinium iso-
thiocyanate) buffer as soon as possible.
40. PBS recipe:
a. Dissolve 8 g of NaCl, 0.2 g of KCl, 1.44 g of Na2PO4, and 0.24 g of KH2PO4 in
800 mL of distilled H2O.
b. Adjust pH to 7.4 with HCl.
c. Adjust volume to 1 L with additional distilled H2O.
d. Filter sterilize, or sterilize by autoclaving.
41. Stains nuclei dark blue, stains cytoplasm where there are concentrations of RNA.
As stated in the introduction, methylene blue staining was associated with poor
RNA recovery in one non-peer-reviewed but credible study (16).
42. Stains DNA and RNA greenish blue. Provided best RNA recovery in the same study
mentioned earlier (16).
43. Stains nuclei dark red, cytoplasm lighter red. Performed as well as H&E for RNA
recovery in the same study (16).
44. Be sure to trim away OCT or other mounting medium as much as possible as it
can interfere with downstream protocols.
45. Dissected sections can be retained in 50-mL conical tubes at �80°C for long periods
prior to further processing.
46. If sections need to be placed directly in digestion buffer for DNA, RNA, or pro-
tein isolation, carefully place frozen sections in the bottom of the tube (50-mL
conical tube for large volume of sections, or microcentrifuge tube for small vol-
ume of sections), and use gentle mechanical rocking to get all the sections to go
into solution.
47. If no micromanipulator arm is available, the dissector should prop his or her elbow
on a solid surface adjacent to and at the same height as the stage of the microscope
to stabilize the dissecting hand. It is helpful to rest the ulnar aspect of the dissect-
ing hand on the stage of the microscope and move the needle into the microscopic
field, a few millimeters above the tissue. In this way, the dissecting arm and hand
can be rested on solid support surfaces.
48. Pressing down on the shaft of the syringe to inject an air bubble into the extraction
solution helps to detach the tissue from the needle and prevents any fragments
from remaining lodged in the barrel of the needle.
49. Placement of frozen tissue sections directly on agarose coated slides can be help-
ful in maintaining enzyme stability if the investigator wishes to recover proteins
in native form from a frozen section. In addition, agarose gels can be prepared or
soaked in custom buffers that will bathe the frozen section prior to and during the
microdissection, for example, pH, salt concentration, proteinase inhibitors, and
so forth, can be varied specifically for a given enzyme. Some members of the NCI
group also prefer to use the agarose-coated slide microdissection approach for
recovery of mRNA.
62 Bova et al.
50. Slides for microdissection are prepared by placing 200 µL of warm agarose on
standard uncoated glass slides, covering with a glass slip, and allowing the gel to
polymerize. The glass slip is removed from the slide and the frozen tissue section
is immediately placed onto the agarose gel. For best results, the freshly cut sec-
tion should be transferred directly from the cryostat to the agarose-coated slide.
51. The dissector may find it easier to “tease” the tissue apart since the tissue remains
bathed in the fluid from the gel and can be gently pulled apart. The tissue will also
separate along tissue planes, for example, stroma and epithelium will easily sepa-
rate from each other. The dissected tissue can be gently picked up from the slide
or, alternatively, the dissector can use a needle to physically cut the agarose and
procure both the agarose and the tissue fragment together.
52. Ensure that the slide is completely free of xylene. Use a Cleantex Microduster
(MG Chemicals, others) or other drying mechanism if necessary to dry the slide
thoroughly.
53. Ensure that tissue sections are flat. Wrinkles can be shaved off with sterile razor
blades. The section should be dipped in xylene after shaving the wrinkles to ensure
that no contaminating debris remains on the section.
54. Ensure that silver metal weight on cap support arm is resting freely on slide. Add
additional weight temporarily.
55. Refocus the laser beam. Increase laser power and/or pulse duration.
56. Change the cap. Not all caps perform equally. Cap shelf-life may be important (but
no good data on this is readily available). We recommend buying relatively small
numbers of caps so that one’s stock remains relatively new.
57. Repeat dehydration of the specimen with fresh xylenes. Submerge for 1 min or
more and allow drying in hood for 1–5 min. If LCM is still not successful, pass
the slides through 95% alcohol for 30 s twice, absolute alcohol for 30 s twice, and
then xylenes for 1–5 min.
58. Cut a new tissue section onto a new glass slide, ensuring that the frozen sections
or cytologic specimens have not been allowed to dry on the slide prior to fixation.
For formalin-fixed sections, either do not bake or decrease the baking time.
59. Try a different brand or type of glass slide.
60. Check lab humidity. Under highly humid conditions, water may be transferred to
the tissue rapidly, reducing EVA adhesion to tissue. Attempt to lower humidity if
this could be a problem.
61. If still not successful, talk with other researchers to continue to troubleshoot the
problem. In addition, Arcturus Engineering technical support (easily available on
the WWW) has been very helpful in many situations.
62. Phenol–chloroform–isoamyl alcohol (25:24:1) can be prepared in the laboratory,
but take great care to handle phenol only in a fume hood and with appropriate
protective gear, as it can cause severe burns. Phenol metls at 41°C and boils at
61°C. Phenol must be appropriately pH-buffered prior to mixing.
63. It is estimated that a typical mammalian cell contains 2 pg of total RNA per cell,
therefore, to achieve 5 µg of total RNA, the lower limit for some expression arrays,
Molecular Profiling of Tissue 63
will require the microdissection of 2.5 million cells, a daunting task. Therefore,
some authors have advocated amplification of RNA or resultant cDNA prior to
hybridization with these larger arrays, even though this may introduce some degree
of amplification bias.
64. The duration of the actual microdissection session on each frozen section should
be limited to 15–30 min for optimal RNA preservation. Samples for protein analy-
sis are also best processed as for RNA analysis, but reagents should include pro-
tease inhibitors.
65. If any of the lower organic phase was accidentally transferred during RNA isola-
tion and may be contaminating the aqueous phase, this will interfere with the sub-
sequent isopropanol precipitation. To remove any residual organics from the aqueous
layer, add one volume of 100% chloroform, mix well, and centrifuge for 10 min
at 4°C to again separate the aqueous and organic phases. Transfer the upper layer
to a new tube.
AcknowledgmentsSpecial thanks to Drs. Eun-Chung Park, Douglas P. Clark, and Anirban Maitra
for critical reading and suggestions for improvement of this manuscript, and toSteven H. Chen for technical assistance in preparation of the manuscript.
Portions of the text are adapted from Best and Emmert-Buck (3) with permis-sion of the publisher Future Drugs Ltd. (London, England). Figures 2–5 areadapted from Eltoum, Siegal and Frost (1) with permission of Lippincott Williams& Wilkins (Philadelphia).
References1. Eltoum, I. A., Siegal, G. P., and Frost, A. R. (2002) Microdissection of histologic
sections: Past, present, and future. Adv. Anat. Pathol. 9, 316–322.
2. Srinivasan, M., Sedmak, D., and Jewell, S. (2002) Effect of fixatives and tissue pro-
cessing on the content and integrity of nucleic acids. Am. J. Pathol. 161, 1961–1971.
3. Best, C. J. and Emmert-Buck, M. R. (2001) Molecular profiling of tissue samples
using laser capture microdissection. Expert. Rev. Mol. Diagn. 1, 53–60.
4. Ahram, M., Flaig, M. J., Gillespie, J. W., et al. (2003) Evaluation of ethanol-fixed,
paraffin-embedded tissues for proteomic applications. Proteomics 3, 413–421.
5. Englert, C. R., Baibakov, G. V., and Emmert-Buck, M. R. (2000) Layered expression
scanning: Rapid molecular profiling of tumor samples. Cancer Res. 60, 1526–1530.
6. Fend, F., Emmert-Buck, M. R., Chuaqui, R., et al. (1999) Immuno-LCM: Laser
capture microdissection of immunostained frozen sections for mRNA analysis.
Am. J. Pathol. 154, 61–66.
7. Gillespie, J. W., Best, C. J., Bichsel, V. E., et al. (2002) Evaluation of non-forma-
lin tissue fixation for molecular profiling studies. Am. J. Pathol. 160, 449–457.
8. Gillespie, J. W., Ahram, M., Best, C. J., et al. (2001) The role of tissue microdis-
section in cancer research. Cancer J. 7, 32–39.
64 Bova et al.
9. Ornstein, D. K., Gillespie, J. W., Paweletz, C. P., et al. (2000) Proteomic analysis
of laser capture microdissected human prostate cancer and in vitro prostate cell
lines. Electrophoresis 21, 2235–2242.
10. Simone, N. L., Remaley, A. T., Charboneau, L., et al. (2000) Sensitive immuno-
assay of tissue cell proteins procured by laser capture microdissection. Am. J. Pathol.
156, 445–452.
11. Bancroft, J. D. and Gamble, M. (2002) Theory and Practice of Histological Tech-
niques, 5th ed. Edinburgh: Churchill Livingstone.
12. Carson, F. L. (2003) Histotechnology: A Self Instructional Text, 2nd ed. Chicago:
ASCP Press.
13. Kiernan, J. A. (2001) Histological and Histochemical Methods, 3rd ed. Oxford:
Oxford University Press.
14. Kiernan, J. A. and Mason, I. (eds.) (2002) Microscopy and Histology for Molecu-
lar Biologists: A User’s Guide. London: Portland Press.
15. Histonet Listserver Information http://www.histonet.org/.
16. Gassmann, M. (2003) Quality Assurance of RNA derived from laser microdis-
sected tissue samples obtained by the PALM(R) MicroBeam System using the
RNA 6000 Pico LabChip(R) kit. 1-8. 2003. Agilent Technologies.
17. Horobin, R. W. and Kiernan, J. A. (eds.) (2002) Conn’s Biological Stains: A
Handbook of Dyes, Stains and Fluorochromes for Use in Biology and Medicine,
10th ed. Published for the Biological Stain Commission by BIOS Scientific Pub-
lishers, Distributed in US by Springer-Verlag (U.S.), Oxford, UK.
18. Zhuang, Z., Bertheau, P., Emmert-Buck, M. R., et al. (1995) A microdissection
technique for archival DNA analysis of specific cell populations in lesions <1 mm
in size. Am. J. Pathol. 146, 620–625.
19. Lee, J. Y., Dong, S. M., Kim, S. Y., Yoo, N. J., Lee, S. H., and Park, W. S. (1998)
A simple, precise and economical microdissection technique for analysis of geno-
mic DNA from archival tissue sections. Virchows Arch. 433, 305–309.
20. Gupta, S. K., Douglas-Jones, A. G., and Morgan, J. M. (1997) Microdissection of
stained archival tissue. Mol. Pathol. 50, 218–220.
21. Harsch, M., Bendrat, K., Hofmeier, G., Branscheid, D., and Niendorf, A. (2001)
A new method for histological microdissection utilizing an ultrasonically oscil-
lating needle: Demonstrated by differential mRNA expression in human lung car-
cinoma tissue. Am. J. Pathol. 158, 1985–1990.
22. Beltinger, C. P. and Debatin, K. M. (1998) A simple combined microdissection
and aspiration device for the rapid procurement of single cells from clinical periph-
eral blood smears. Mol. Pathol. 51, 233–236.
23. Zhang, Z., Nakamura, M., Taniguchi, E., Shan, L., Yokoi, T., and Kakudo, K.
(1997) A simple approach to single-cell microdissection and molecular analysis.
Anal. Quant. Cytol. Histol. 19, 514–518.
24. Emmert-Buck, M. R., Bonner, R. F., Smith, P. D., et al. (1996) Laser capture
microdissection [see Comments]. Science 274, 998–1001.
25. Curran, S., McKay, J. A., McLeod, H. L., and Murray, G. I. (2000) Laser capture
microscopy. Mol. Pathol. 53, 64–68.
Molecular Profiling of Tissue 65
26. Goldsworthy, S. M., Stockton, P. S., Trempus, C. S., Foley, J. F., and Maronpot,
R. R. (1999) Effects of fixation on RNA extraction and amplification from laser
capture microdissected tissue. Mol. Carcinog. 25, 86–91.
27. Lawrie, L. C., Curran, S., McLeod, H. L., Fothergill, J. E., and Murray, G. I. (2001)
Application of laser capture microdissection and proteomics in colon cancer. Mol.
Pathol. 54, 253–258.
28. Craven, R. A. and Banks, R. E. (2002) Use of laser capture microdissection to
selectively obtain distinct populations of cells for proteomic analysis. Methods
Enzymol. 356, 33–49.
29. Nakazono, M., Qiu, F., Borsuk, L. A., and Schnable, P. S. (2003) Laser-capture
microdissection, a tool for the global analysis of gene expression in specific plant
cell types: Identification of genes expressed differentially in epidermal cells or
vascular tissues of maize. Plant Cell 15, 583–596.
30. Luzzi, V., Mahadevappa, M., Raja, R., Warrington, J. A., and Watson, M. A.
(2003) Accurate and reproducible gene expression profiles from laser capture
microdissection, transcript amplification, and high density oligonucleotide micro-
array analysis. J. Mol. Diagn. 5, 9–14.
31. Burgemeister, R., Gangnus, R., Haar, B., Schutze, K., and Sauer, U. (2003) High
quality RNA retrieved from samples obtained by using LMPC (laser microdissec-
tion and pressure catapulting) technology. Pathol. Res. Pract. 199, 431–436.
32. Fink, L., Kohlhoff, S., Stein, M. M., Hanze, J., et al. (2002) cDNA array hybridi-
zation after laser-assisted microdissection from nonneoplastic tissue. Am. J. Pathol.
160, 81–90.
33. Cohen, C. D., Grone, H. J., Grone, E. F., Nelson, P. J., Schlondorff, D., and
Kretzler, M. (2002) Laser microdissection and gene expression analysis on form-
aldehyde-fixed archival tissue. Kidney Int. 61, 125–132.
34. Kleeberger, W., Rothamel, T., Glockner, S., Lehmann, U., and Kreipe, H. (2000)
Laser-assisted microdissection and short tandem repeat PCR for the investigation
of graft chimerism after solid organ transplantation. Pathobiology 68, 196–201.
35. Inoue, K., Sakurada, Y., Murakami, M., Shirota, M., and Shirota, K. (2003)
Detection of gene expression of vascular endothelial growth factor and flk-1 in the
renal glomeruli of the normal rat kidney using the laser microdissection system.
Virchows Arch. 442, 159–162.
36. Mori, M., Mimori, K., Yoshikawa, Y., et al. (2002) Analysis of the gene-expres-
sion profile regarding the progression of human gastric carcinoma. Surgery 131,
S39–S47.
37. Brockhoff, G., Fleischmann, S., Meier, A., Wachs, F. P., Hofstaedter, F., and
Knuechel, R. (1999) Use of a mechanical dissociation device to improve stan-
dardization of flow cytometric cytokeratin DNA measurements of colon carcino-
mas. Cytometry 38, 184–191.
38. Pertoft, H. (2000) Fractionation of cells and subcellular particles with Percoll. J.
Biochem. Biophys. Methods 44, 1–30.
39. Tai, Y. T., Teoh, G., Shima, Y., et al. (2000) Isolation and characterization of human
multiple myeloma cell enriched populations. J. Immunol. Methods 235, 11–19.
66 Bova et al.
40. Moskaluk, C. A. and Kern, S. E. (1997) Microdissection and polymerase chain
reaction amplification of genomic DNA from histological tissue sections. Am. J.
Pathol. 150, 1547–1552.
41. Goelz, S. E., Hamilton, S. R., and Vogelstein, B. (1985) Purification of DNA from
formaldehyde fixed and paraffin embedded human tissue. Biochem. Biophys. Res.
Commun. 130, 118–126.
42. Emmert-Buck, M. R., Gillespie, J. W., Paweletz, C. P., et al. (2000) An approach
to proteomic analysis of human tumors. Mol. Carcinog. 27, 158–165.
43. Ikeda, K., Monden, T., Kanoh, T., et al. (1998) Extraction and analysis of diag-
nostically useful proteins from formalin-fixed, paraffin-embedded tissue sections.
J. Histochem. Cytochem. 46, 397–403.
44. Novelli, M., Savoia, P., Cambieri, I., et al. (2000) Collagenase digestion and mech-
anical disaggregation as a method to extract and immunophenotype tumour lym-
phocytes in cutaneous T-cell lymphomas. Clin. Exp. Dermatol. 25, 423–431.
45. Maitra, A., Wistuba, I. I., Virmani, A. K., et al. (1999) Enrichment of epithelial
cells for molecular studies. Nat. Med. 5, 459–463.
46. Guerrero, R. B., Batts, K. P., Brandhagen, D. J., Germer, J. J., Perez, R. G., and
Persing, D. H. (1997) Effects of formalin fixation and prolonged block storage
on detection of hepatitis C virus RNA in liver tissue. Diagn. Mol. Pathol. 6,
277–281.
47. Ohyama, H., Zhang, X., Kohno, Y., and Alevizos, M. (2000) Laser capture micro-
dissection-generated target sample for high-density oligonucleotide array hybrid-
ization. Biotechniques 29, 530–536.
48. Chomczynski, P. and Sacchi, N. (1987) Single-step method of RNA isolation by
acid guanidinium thiocyanate-phenol-chloroform extraction. Anal. Biochem. 162,
156–159.
49. Maunsbach, A. B. (1966) The influence of different fixatives and fixation meth-
ods on the ultrastructure of rat kidney proximal tubule cells. II. Effects of varying
osmolality, ionic strength, buffer system and fixative concentration of glutaralde-
hyde solutions. J. Ultrastruct. Res. 15, 283–309.
50. Morales, A. R., Essenfeld, H., Essenfeld, E., Duboue, M. C., Vincek, V., and
Nadji, M. (2002) Continuous-specimen-flow, high-throughput, 1-hour tissue pro-
cessing. A system for rapid diagnostic tissue preparation. Arch. Pathol. Lab. Med.
126, 583–590.