Gene Profiling of Identified Neurons to Dissect Molecular ...
125
Gene Profiling of Identified Neurons to Dissect Molecular Mechanisms Involved in Spinal Reflex Assembly Inauguraldissertation zur Erlangung der Wuerde eines Doktors der Philosophie vorgelegt der Philosophisch – Naturwissenschaftlichen Fakultaet der Universitaet Basel von Andreas Friese aus Luedenscheid, Deutschland Karlsruhe, 2010
Transcript of Gene Profiling of Identified Neurons to Dissect Molecular ...

Gene Profiling of Identified Neurons to Dissect Molecular Mechanisms Involved in Spinal Reflex
Assembly
Inauguraldissertation
zur
Erlangung der Wuerde eines Doktors der Philosophie
vorgelegt der
Philosophisch – Naturwissenschaftlichen Fakultaet
der Universitaet Basel
von
Andreas Friese
aus Luedenscheid, Deutschland
Karlsruhe, 2010

Genehmigt von der Philosophisch – Naturwissenschaftlichen Fakultaet
der Universitaet Basel
auf Antrag von:
Professor Dr. Silvia Arber (Dissertationsleitung)
Professor Dr. Pico Caroni (Korreferat)
Basel, 11.11.2008
Prof. Dr. Eberhard Parlow (Dekan)

TABLE OF CONTENT Acknowledgements
Chapter I INTRODUCTION
Topic of my PhD Thesis
Abstract of my PhD Project
1
1
12
Chapter II INTRODUCTION
Identification of Neuronal Subtype Specific Genes in the DRG and the
beginning of a never ending story
RESULTS & DISCUSSION
SUMMARY
14
16
58
Chapter III Estrogen – Related Receptor Gamma Marks Gamma Motor Neurons ABSTRACT
INTRODUCTION
RESULTS
DISCUSSION
RESULTS – Figures
60
61
62
64
68
69
Chapter IV Role of Estrogen – Related Receptor Gamma in a Mouse Model of Amyotrophic Lateral Sclerosis ABSTRACT
INTRODUCTION
RESULTS
DISCUSSION
RESULTS – Figures
75
76
77
79
81
83

MATERIALS & METHODS
87
Appendix Further Interesting Gene Expression Profiles Semaphorin and Plexin Expression
GABA Receptor Subunit Expression
Hox Gene Expression in DRG Sensory Neurons
Channel Specificity in DRG Sensory Neurons
REFERENCES
9494
96
97
98
99
107

Acknowledgements
First of all, I would like to express my immense gratitude to Prof. Dr.
Silvia Arber for supervising my PhD dissertation at the Biozentrum and at the
FMI in Basel. During the course of my studies, she was always supportive of
my research projects and offered helpful and critical advice. I am thankful to
Silvia for leaving me the freedom to develop my personal and scientific skills
to pursue a future career in industry.
Also, I would like to thank Prof. Dr. Pico Caroni, Dr. Botond Roska and
Dr. Edward Oakeley for their support of my studies as members of my thesis
committee.
I wish to thank all the current and former members of the Arber lab for
such a nice collaboration and inspiring atmosphere. In particular I would like to
thank Ina Kramer, Vera Niederkofler, Eline Pecho Vrieseling and David Ladle
for teaching me many experiments and keeping me motivated throughout 5
years in Silvia’s lab. Many thanks also to all members of the FMI facilities for
their continuous support being it at the cryostat, microscope or any other state
of the art instrument at FMI.
I am particularly indebted to Monika Mielich. It was a great pleasure
working side by side with her and receiving her support in most of my projects,
in the lab as well as in private life.
Special thanks also to Smita Saxena and Ivan Galimberti from the
group of Pico Caroni for becoming good friends and sharing fantastic
moments, especially beyond the walls of FMI.
I am grateful to my family for their continuous support and effort, which
allowed me to pursue my goals and to accomplish these studies. Thank all of
you!

Chapter I - INTRODUCTION
Topic of my PhD Thesis Over the past decades, the concept has emerged that sophisticated
neuronal circuits in the brain are the cellular correlates of this enormous
repertoire of functions that the brain is capable of performing. However,
very little information is yet available about how neuronal circuits assemble
with such precision during development (Jessell, 2000; McConnell, 1995).
To begin to address these questions, we investigated the development of
the spinal monosynaptic stretch reflex circuit, which represents the basis for
all final common pathways to regulate skeletal muscle contraction and
relaxation (Chen et al., 2003). Due to its relatively simple anatomy with two
main neuronal components and its easy accessibility, the function and thus
the precision in connectivity of this neuronal circuit is well understood. In the
spinal monosynaptic stretch reflex circuit, a subpopulation of dorsal root
ganglia (DRG) sensory neurons (Ia proprioceptive afferents) form direct
synaptic contacts with motor neurons in the ventral spinal cord, which in
turn control the contraction of muscles in the periphery (Eccles et al., 1957).
It therefore represented an ideal system to study molecular pathways
specifying neuronal connectivity in a defined neuronal circuit during
development. The main aim of this project was to enhance our insight in the
genetic cascades controlling the specification and connectivity in
developing neuronal circuits, with a particular emphasis on the spinal
monosynaptic reflex circuit.
Wiring the Central Nervous System Correct wiring of the nervous system is required to respond and interact with a
large number of different environmental cues. The central nervous system
(CNS) consists of two major information processing networks; the brain and
the spinal cord. These two complex relay stations are composed of a vast
repertoire of cell types defined by distinct morphologies, physiological
functions and defined projections into target areas or onto other neurons. The
human brain consists of approximately 100 billion neurons, each connected to
as many as 10.000 other neurons. The brain acts as control center of the CNS
and is responsible for behavior. It is tightly linked to the primary sensory
- 1 -
apparatus of vision, hearing, sense of taste, olfaction etc. The brain controls a
variety of functions automatically without awareness, such as body
homeostasis, blood pressure and body temperature. It is also the site
controlling cognition, perception, attention, memory and emotion. In order to
control movement, the brain possesses multiple parallel neuronal tracts
connected to diverse neuronal cell types in the spinal cord. Different
regulatory areas in the brain control voluntary and involuntary muscle
functions. Certain movements, for example reflexes and locomotion, require
very fast and automatic actions that can be controlled by the spinal cord alone
(Eccles et al., 1957; Sherrington, 1910). All of these functions are carried out
in a precisely timed sequence of events that are regulated by multiple inter -
connected neuronal subpopulations in the mature CNS.
DRG – Dorsal Root Ganglia
DRG are located adjacent to the spinal cord along the whole rostro- to
caudal axis and contain sensory neurons (SNs) projecting peripherally
among other regions to muscles, joints and the skin. Centrally, all of these
sensory neurons innervate the spinal cord. Afferents project to distinct
laminae in the spinal cord (Rexed, 1952; Rexed, 1954). Ia proprioceptive
afferents project specifically to the ventral spinal cord and form direct
connections with motor neurons to form the monosynaptic stretch reflex
circuit, whereas cutaneous afferents mainly terminate in the dorsal to
intermediate spinal cord. The peripheral and central branch of DRG sensory
neurons are also often named distal and proximal nerve branch conducting
action potentials from the periphery to the CNS; the spinal cord. DRG
sensory neurons can be subdivided into three main neuronal
subpopulations based on their capability to communicate distinct peripheral
stimuli to the CNS, such as heat, cold, touch or limb movements.
DRG sensory neurons can be categorized based on their expression of a
particular neurotrophin tyrosine receptor kinase. Most SNs are small
diameter cutaneous neurons and express the TrkA receptor responsive to
nerve growth factor (NGF) (Carroll et al., 1992; Huang and Reichardt, 2003;
Molliver et al., 1997; Patel et al., 2000). Mechanical sensation is conveyed
through larger mechano-responsive neurons, which express TrkB and can
- 2 -

be activated through BDNF and neurotrophin 4 (NT4) (Ehrhard and Otten,
1994). Information about limb movement and spatial positioning is sensed
through a class of large diameter DRG SNs; the TrkC+ proprioceptive
afferents dependent on the neurotrophin 3 (NT3) (Ernfors et al., 1994; Klein
et al., 1994; Oakley et al., 1997). A different class of DRG neurons positive
for the receptor tyrosine kinase Ret, signal through glia cell line derived
neurotrophic factor (GDNF) proteins (Baudet et al., 2000; Haase et al.,
2002; Molliver et al., 1997; Yamamoto et al., 1996).
From Birth to Molecular Classification of DRG SN Subpopulations To date, only a broad classification of neuronal subpopulations in DRG has
been established mainly based on specific termination zones in the
periphery and spinal cord as well as by unique molecular characteristics
(Anderson, 1999; Rexed, 1952; Rexed, 1954). The following paragraphs
will describe the segregation of these DRG subpopulations and key factors
involved in this process during development. All subpopulations are derived
from neural crest cells (NCC) originating from the neural tube and
expressing a common transcription factor called islet1 (Isl1) (Anderson,
1999). DRG neuron differentiation requires precisely timed events of NCC
migration from the neural tube, neurogenesis, subpopulation specification
and axonal outgrowth to target areas. Subpopulation specification takes
place already as early as NCC start migrating ventrally to form the DRG.
Early migrating cells will be the future mechanoreceptive and proprioceptive
large diameter SNs positive for TrkB and TrkC. The larger late migrating
cell population will give rise to small diameter TrkA+ DRG SNs. A group of
basic helix loop helix factors called neurogenins (ngn1 and ngn2) is
required for the determination of DRG SN fate (Ma et al., 1999; Sommer et
al., 1996; Zirlinger et al., 2002). Migrating NCCs express first the bHLH
differentiation factor ngn2 that is extinguished by embryonic day E10.5. In
contrast, Ngn1 expression starts later only after NCCs have reached their
end position where DRG are formed. Mutant analysis showed that ngn1
mutant animals do not show any apparent phenotype in the CNS where
ngns are co-expressed in overlapping regions. This suggests a functional
redundancy of ngn genes at least in some regions of the CNS. In the DRG
- 3 -
however, Ma et al showed in mutant models that ngn1 and ngn2 are
required for two phases of DRG SN differentiation. Loss of ngn2 expression
can be compensated with a delay by ngn1 expression resulting in a loss of
early born ngn2 dependent larger diameter SNs. Ngn1 mutant animals
show a severe decrease in DRG size caused by almost a complete loss of
later born TrkA+ nociceptive DRG SNs. In contrast, the ngn2 dependent
TrkB+ and TrkC+ large diameter population seems to develop normally.
Nevertheless, quantifications showed approximately a 30% reduction in
TrkC+ and TrkB+ cells during embryonic development in ngn1 mutant
animals, suggesting that a small population of TrkC+ and TrkB+ DRG
neurons requires ngn1 (Ma et al., 1999). However, to date there is no
evidence that ngn1 or ngn2 specify DRG SN subpopulations.
Cell Lineage Commitment – “Runx-ing” the DRG In the immune system, Runx proteins have been shown to be responsible
for lineage specification. Runx transcription factors are characterized by a
Runt DNA - binding domain and heterodimerize with a common cofactor
CBFβ (Ito, 2004). In mammals there are three members of the Runt family,
namely Runx1, Runx2 and Runx3. The Runt transcription factors Runx1
and Runx3 have been shown to be selectively expressed in defined subsets
of DRG neurons. At embryonic stages, Runx3 expression has been
reported to be exclusively expressed by TrkC+ proprioceptive afferents. In
contrast, the TrkA+ nociceptive and thermoceptive DRG SN subpopulation
is positive for Runx1. Runx3 deficient mice exhibit severe impairments in
monosynaptic stretch reflex formation and therefore behavioral defects
(Levanon et al., 2002). Gene expression studies showed that Runx
expression occurs soon after DRG neurons are born. However, its
expression with respect to Trk receptor expression was not addressed.
Recent studies indicate that Runx activity could be directly linked to DRG
diversification of cutaneous and proprioceptive subpopulations. Mutant
animal studies showed that Runx3 activity is required for the switch off TrkB
in TrkB/TrkC hybrid cells at early embryonic stages to obtain a pure TrkC
proprioceptive population (Kramer et al., 2006). The larger nociceptive
TrkA+ population (~80% of all DRG SNs) differentiates further into a non-
- 4 -

peptidergic TrkA- population by up-regulation of the glia cell line-derived
neurotrophic factor (GDNF) receptor Ret (Patel et al., 2000) in many
nociceptive DRG neurons. This non-peptidergic cell population also
acquires the ability to bind isolectin B4 (IB4). Recently, it was shown that
NGF is required for the maturation of TrkA-/Ret+ DRG sensory neurons, but
not for the induction of this subpopulation (Luo et al., 2007). The smaller
peptidergic group of nociceptive DRG neurons expresses TrkA, the
receptor for nerve growth factor (NGF). This population also expresses the
neuropeptide calcitonin gene-related peptide (CGRP) and is therefore
called peptidergic neuron population.
Similar to the role of Runx3 in cell lineage determination between TrkC+
and TrkB+ cells, the question arose whether Runx1 plays a role in lineage
fragmentation of nociceptive DRG sensory neurons. At postnatal day P30 a
complete fragmentation took place and TrkA expression is down-regulated
in all Runx1 expressing cells. In contrast, down-regulation of Runx1 leads to
the establishment of stable peptidergic phenotypic cells being TrkA+/Ret+
and Runx1-. Conditional Runx1 elimination from premigratory NCCs
induces a dramatic change in nociceptive DRG SN proportions. As
expected, elimination of Runx1 leads to a significant up-regulation in
expression of TrkA in DRG neurons. Along the same line, Ret expression
which in wild-type animals induced upon down-regulation of TrkA, is
elevated in conditional Runx1 mutant animals (Chen et al., 2006).
- 5 -

In summary, specific waves of ngn1 and ngn2 expression trigger
neurogenesis to guide NCCs into distinct sensory lineages. Later during
development, Runx transcription factors are key molecules involved in the
specification of DRG neuronal cell types.
Cutaneous Afferents Mechano-receptive
Afferents Proprioceptive
Afferents
70-80 % 5-10 % 10-20 %
TrkA+ TrkB+ TrkC+
NGF dependent BDNF & NT 4/5
dependent NT3 dependent
Table 1: Neurotrophin receptor dependent DRG sensory neuron classification. In adult,
cutaneous afferents further subdivide into TrkA-/Runx1+ and TrkA+/Ret+ cell populations.
Formation of the Monosynaptic Stretch Reflex Circuit – What is known? The interplay between sensory and motor components is key to control
precise muscle contraction and relaxation. A muscle stretch results in
lengthening of extrafusal muscle fibers, but also in a lengthening of
intrafusual muscle fibers. Muscle spindles consist of intrafusal muscle fibers
and are arranged in parallel to extrafusual (skeletal) muscle fibers. Muscle
spindles are innervated by Ia proprioceptive afferents and gamma motor
neurons. Stretching of muscle spindles leads to activation of Ia
proprioceptive afferents relaying muscle stretch information from the
periphery to the central nervous system (Landmesser, 2001; Mears and
Frank, 1997; Sanes and Lichtman, 2001). Action potentials propagating
through Ia afferent axons from the action potential initiation site in the
muscle spindle, activate motor neurons at the sensory-motor synapse in the
ventral spinal cord, which project to the same or related muscle (Luscher et
al., 1984). This activation elicits an action potential in α-motor neurons to
induce a muscle contraction in the periphery. Alpha motor neurons
innervate extrafusual muscle fibers and are quite different from intrafusal
musle fibers, which are innervated by gamma motor neurons. Golgi tendon
- 6 -

organs (GTO) located at the insertion point of skeletal muscle fibers are
innervated by Ib proprioceptive afferents (Zelena and Soukup, 1977a;
Zelena and Soukup, 1977b). Muscle tension causes a conformational
change of Ib afferent terminals and results in opening stretch sensitive
cation channels. This causes a depolarization and an action potential is
propagated into the spinal cord where Ib afferents make connections to
interneurons.
To better understand the process of neuronal circuit formation and in
particular formation of the monosynaptic stretch reflex, and its genetic
cascades involved, it is important to first determine the sequential
mechanisms of how neuronal subpopulations in the spinal cord emerge and
how sensory - motor connectivity is established during development. This
paragraph will focus on genes known to be involved in the formation of the
monosynaptic stretch reflex circuit. Figure 1 shows an outline of the basic
neuronal components of the monosynaptic stretch reflex circuit.
Figure 1: Assembly of the monosynaptic stretch reflex circuit. Cutaneous afferents project
to the dorsal spinal cord and peripherally to the skin are outlined in light-blue. Ia
- 7 -

proprioceptive afferents encompass only a small fraction of DRG SNs and form direct
connections to motor neurons; Ia proprioceptive afferents are outlined in dark-blue.
Adapted from (Arber et al., 2000).
In the spinal cord an early sonic-hedgehog signaling pathway initiates the
expression of specific homeodomain transcription factors in neuronal
progenitor domains (Jessell, 2000).
As early as embryonic time point E11.5, before motor neuron axons reach
their target area in the periphery, motor neuron groups projecting to
individual muscles are coupled electrically to each other by gap junctions,
which is necessary for burst generation activity (Chang et al., 1999; Kiehn,
2006; Milner and Landmesser, 1999). Two main phases of motor circuit
formation can be distinguished. The first phase begins shortly after motor
neuron generation at approximately embryonic time point E12.5 in mouse.
The main motor neuron neurotransmitter is acetylcholine, which acts
excitatory. Acetylcholine serves as the basis for motor neuron activation
through connections to other motor and inhibitory neurons. Glycine and
GABA provided by interneurons still have an excitatory mode of action
during this first phase and contribute positively to pattern generation. Burst
alternation however, is not in place at this early time point. One reason
could be the later establishment of postnatal inhibitory transmission, which
is involved in burst alternation patterns (Milner and Landmesser, 1999;
Myers et al., 2005).
The second phase of motor neuron activation is controlled through up-
regulation of the excitatory neurotransmitter glutamate. A shift from
excitatory neurotransmission by Glycine and GABA to inhibition takes place
in interneurons. After the second phase of circuit assembly motor neurons
are matured and processes have been formed to the periphery (~E17.5)
(Mentis et al., 2005; Myers et al., 2005; Nishimaru et al., 2005).
To date it is unclear how the switch and initiation from excitatory to
inhibitory neurotransmission is controlled and what factors are involved in
this process.
Interestingly, this shift is initiated at around the developmental stage when
motor axons reach their target region in the muscles. MN columns can be
- 8 -

specified based on the distinct expression of a combinatorial code of LIM
gene expression. However, to date, the sartorius and femorotibialis motor
neuron pools can not be differentiated based on their transcriptional code,
but already exhibit different burst durations at E4 in the developing chick.
This observation suggests already the existence of selective cell surface
molecules for maintaining these bursting differences (Milner and
Landmesser, 1999) regulated through unknown transcription factors. Ets
genes have been shown to be expressed in subpopulations and more
specifically even in pool restricted manners. The expression onset of these
Ets transcription factors matches well with the time point when axons reach
their targets in the periphery suggesting that target - derived signals are
required for the expression of these genes. In fact, it was shown that limb
ablation in chick prevents the expression of two Ets gene family members,
Er81 and Pea3, in the DRG and MNs (Lin et al., 1998). After induction,
these Ets transcription factors may be required for the regulation of genetic
cascades providing pool specific cell identities initiating the expression of
distinct sets of cell surface markers. Recent work has shown using
transgenic mice that Er81 and Pea3 are both required for correct circuit
assembly of proprioceptive afferents and motor neurons in the developing
spinal cord (Arber et al., 2000; Lin et al., 1998; Vrieseling and Arber, 2006).
Er81-/- mutant animals show severe motor behavior abnormalities. In this
mutant mouse, Ia proprioceptive afferents fail to form functional synapses
with motor neurons in the ventral part of the spinal cord leading to severe
ataxia. In contrast, Pea3 is required for proper elaboration of dendritic trees
of subsets of motor neurons in the spinal cord. Motor neurons of Pea3-/-
mutant animals exhibit alterations in cutaneous maximus dendrite
patterning and receive functionally inappropriate sensory inputs. Moreover,
these motor neurons show altered cell body positioning and defects in
target invasion (Livet et al., 2002; Vrieseling and Arber, 2006). Expression
of Er81 and Pea3 is controlled through neurotrophic factors, GDNF and
NT3 respectively, in the periphery (Haase et al., 2002; Patel et al., 2003).
This principle not only provides evidence that neurotrophic factors are
required for cell survival, but also plays crucial roles in establishing
specificity and connectivity of neuronal subpopulations. Immediately the
- 9 -
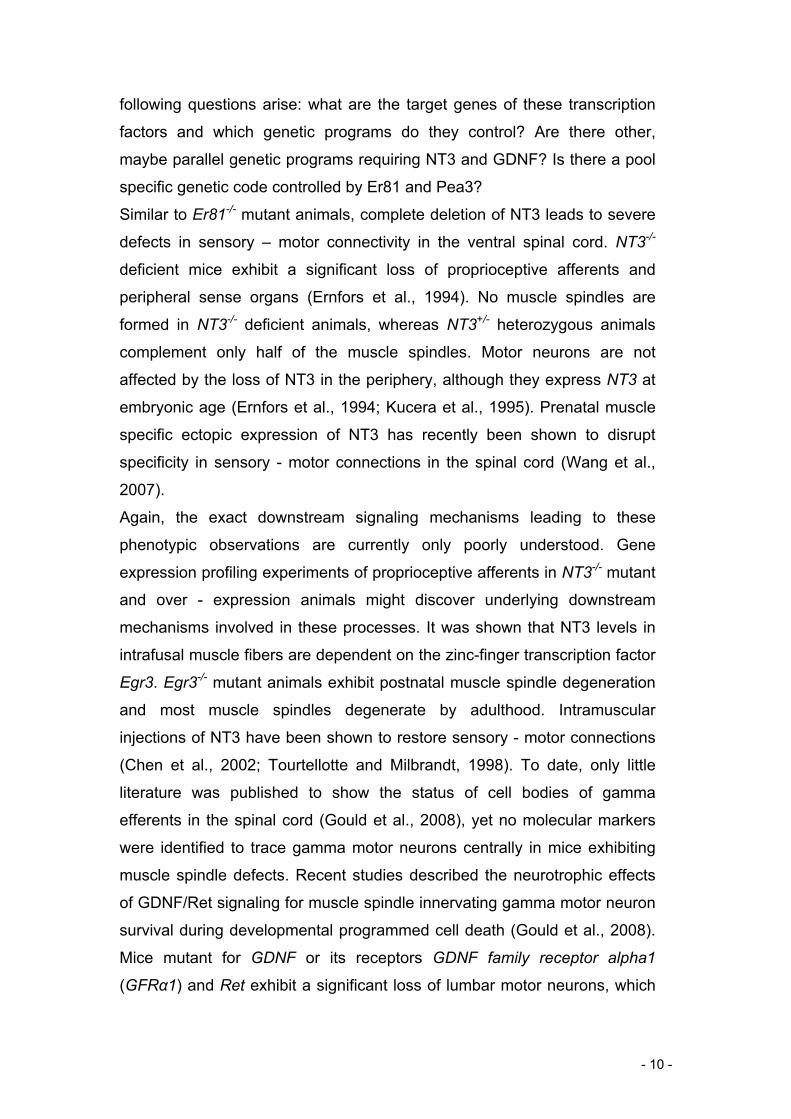
following questions arise: what are the target genes of these transcription
factors and which genetic programs do they control? Are there other,
maybe parallel genetic programs requiring NT3 and GDNF? Is there a pool
specific genetic code controlled by Er81 and Pea3?
Similar to Er81-/- mutant animals, complete deletion of NT3 leads to severe
defects in sensory – motor connectivity in the ventral spinal cord. NT3-/-
deficient mice exhibit a significant loss of proprioceptive afferents and
peripheral sense organs (Ernfors et al., 1994). No muscle spindles are
formed in NT3-/- deficient animals, whereas NT3+/- heterozygous animals
complement only half of the muscle spindles. Motor neurons are not
affected by the loss of NT3 in the periphery, although they express NT3 at
embryonic age (Ernfors et al., 1994; Kucera et al., 1995). Prenatal muscle
specific ectopic expression of NT3 has recently been shown to disrupt
specificity in sensory - motor connections in the spinal cord (Wang et al.,
2007).
Again, the exact downstream signaling mechanisms leading to these
phenotypic observations are currently only poorly understood. Gene
expression profiling experiments of proprioceptive afferents in NT3-/- mutant
and over - expression animals might discover underlying downstream
mechanisms involved in these processes. It was shown that NT3 levels in
intrafusal muscle fibers are dependent on the zinc-finger transcription factor
Egr3. Egr3-/- mutant animals exhibit postnatal muscle spindle degeneration
and most muscle spindles degenerate by adulthood. Intramuscular
injections of NT3 have been shown to restore sensory - motor connections
(Chen et al., 2002; Tourtellotte and Milbrandt, 1998). To date, only little
literature was published to show the status of cell bodies of gamma
efferents in the spinal cord (Gould et al., 2008), yet no molecular markers
were identified to trace gamma motor neurons centrally in mice exhibiting
muscle spindle defects. Recent studies described the neurotrophic effects
of GDNF/Ret signaling for muscle spindle innervating gamma motor neuron
survival during developmental programmed cell death (Gould et al., 2008).
Mice mutant for GDNF or its receptors GDNF family receptor alpha1
(GFRα1) and Ret exhibit a significant loss of lumbar motor neurons, which
- 10 -

could be visualized to affect specifically gamma motor neurons by insertion
of a reporter allele.
In chapter III of this thesis, we identified a molecular marker to specifically
label gamma motor neurons in the lumbar spinal cord. Further analysis
suggests that differentiated muscle spindles are required for gamma motor
neuron survival.
Much progress has been made during the past years to understand the
sequential steps and the required molecules in the formation of the
monosynaptic stretch reflex circuit. In fact, various transcription factors have
been shown to specify distinct aspects of neuronal circuit assembly in the
periphery as well as in the central nervous system. Still, only very little is
known about the underlying downstream cascades of these factors.
Furthermore, there is only limited understanding of how individual sensory –
motor units are formed, innervating distinct muscles or muscle groups.
- 11 -

Abstract of my PhD Project The central question during my PhD studies was to understand the molecular
mechanisms and genetic cascades controlling the sequential specification of
distinct classes of dorsal root ganglia (DRG) sensory neurons, with a
particular focus on genes involved in controlling connectivity between Ia
proprioceptive afferents and motor neurons in the spinal cord. The underlying
genetic mechanisms controlling the formation of specific synaptic connections
between Ia proprioceptive afferents and motor neurons in the lumbar spinal
cord are currently only poorly understood. The main reason for the difficulty of
isolating genes responsible for controlling aspects of connectivity was due to
the fact that an enormous number of distinct subpopulations exist in the
nervous system. In the spinal monosynaptic reflex circuit, proprioceptive
afferents in the dorsal root ganglion (DRG) represent only 10-20% of all
neurons. Moreover, cell bodies of given sensory neuron subpopulations in the
DRG are highly dispersed. Therefore, initial technical difficulties were faced
when performing gene expression analysis experiments of individual neuronal
subtypes. In our study, we have used mouse genetics to selectively label
distinct neuronal subpopulations. These tools allowed purifying defined
populations of DRG sensory neurons (Klein et al., 1994) by Fluorescent
Activated Cell Sorting (FACS) and subsequent gene expression profiling
analysis using Affymetrix GeneChip technology. The aim of the first part of my
PhD was the identification of genes involved in the specification and
differentiation of DRG SN subtypes. The second major part of this project was
the verification of candidate genes isolated from the Affymetrix chip screen
experiments and to perform functional experiments to address their role in
controlling connectivity between Ia proprioceptive afferents and motor neurons
in the spinal cord. First, selected putative regulators were analyzed for their
expression profile using in situ hybridization experiments on wild-type
embryos and TrkC-/- and Er81-/- mutant backgrounds. We focused in particular
on genes that were expressed in subpopulations of DRG neurons in wild-type
embryos, but are not expressed in either TrkC-/- or Er81-/- mutant mice. Such
genes are selectively expressed in proprioceptive DRG neurons or regulated
by the transcription factor Er81 and they therefore represented the most
- 12 -

interesting population of genes to assay for function (Arber et al., 2000; Klein
et al., 1994).
Our initial gene expression profiling analysis was extended to also isolate
novel proprioceptive afferent markers, the expression of which is potentially
restricted to distinct sensory neuron pools. We pushed the technical
limitations further and used methods to profile proprioceptive afferents from
different spinal levels.
Some of the genes identified in our screen were also analyzed functionally.
One of these genes is the orphan nuclear receptor estrogen-related receptor
gamma (Err3). We analyzed its function in proprioceptive afferent neuron
specification and connectivity in greater detail in the third part of my PhD
thesis. Analysis of Err3 expression revealed expression specifically in gamma
motor neurons, a motor neuron subpopulation to which no marker gene has
been correlated to date. We used various mutant animals to show that muscle
spindles are required for gamma motor neuron survival.
Moreover, chapter IV of this thesis addresses a potential role of Err3 in a
neurodegenerative disease model for amyotrophic lateral sclerosis (ALS).
- 13 -

Chapter II –INTRODUCTION Identification of Neuronal Subtype Specific Genes in the DRG and the beginning of a never ending story To understand complex neuronal network assembly, we study the formation of
the monosynaptic stretch reflex circuit. We expect that understanding the
underlying mechanisms within this circuit may show case principle applying
also to more complex neuronal network assembly. The monosynaptic stretch
reflex circuit is easily accessible and consists of two main neuronal
components, the dorsal root ganglia (DRG) sensory neurons (SNs) and the
motor neurons (MNs) in the ventral spinal cord. Only a few neuronal markers
were identified in proprioceptive afferents, whereas no specific molecular
marker is known for subpopulations of proprioceptive afferents, namely Ia, Ib
or II afferents. Identification of markers could facilitate studies of
subpopulation differences of functionally similar classes of neurons such as
proprioceptive afferents. In addition, for example GFP driven tracing
experiments of these markers, might allow differentiating innervation patterns,
axonal morphology or synaptic morphology of these very similar neuronal
groups.
Cell body positioning of DRG SN subpopulations is highly dispersed and
methods to label individual subpopulations are lacking. Profiling of gene
expression of sensory neuron subpopulations has been limited by technical
difficulties to obtain samples of functionally pure populations. During my
thesis, we established techniques to be able to overcome these problems.
Transgenic mouse strains in which specific subpopulations of neurons are
labeled with green fluorescent protein (GFP) allowed us the separation of pure
neuronal subpopulations of DRG neurons. Subsequent RNA isolation and
gene expression profiling studies revealed a number of genes expressed in
distinct patterns in the DRG, but also in the spinal cord. Previous studies also
showed that pure neuronal subpopulations facilitate generation of precise
genetic fingerprints (Arlotta et al., 2005; Loconto et al., 2003; Nelson et al.,
2006; Sugino et al., 2006; Tietjen et al., 2005). Identification of molecular
markers at different developmental time points or of different subpopulations
- 14 -
can help to discover transcriptional networks specifying neuronal
subpopulations.
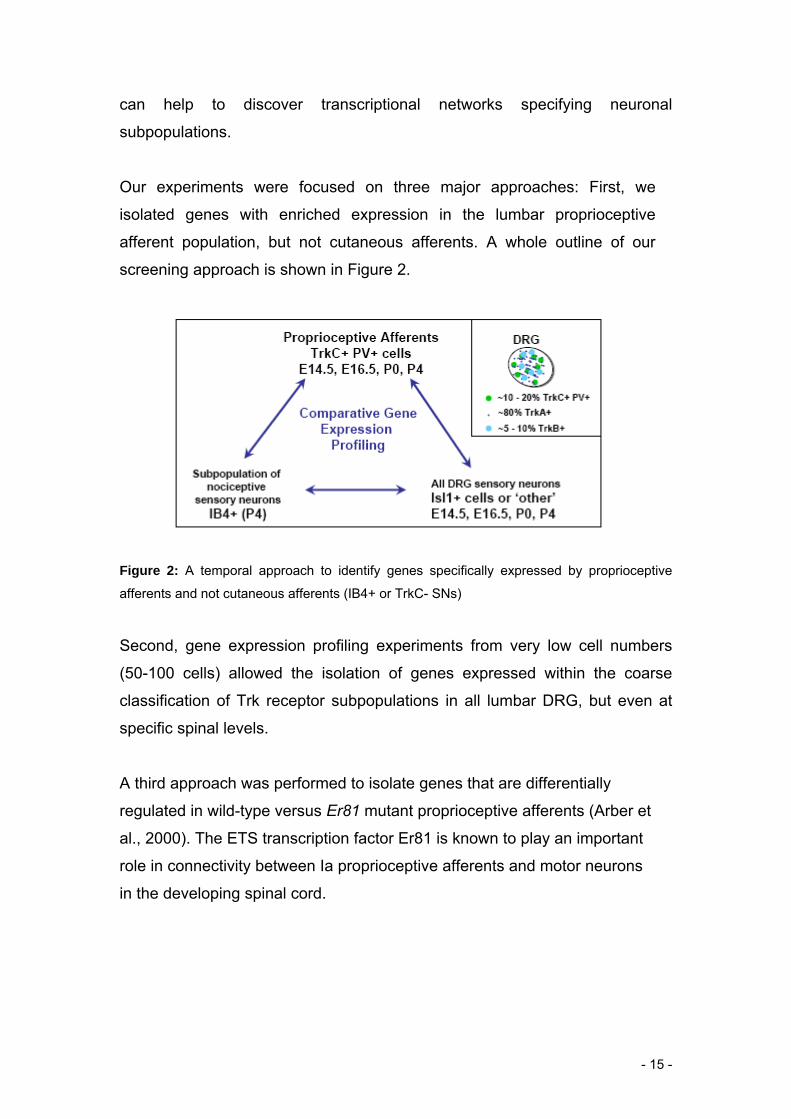
Our experiments were focused on three major approaches: First, we
isolated genes with enriched expression in the lumbar proprioceptive
afferent population, but not cutaneous afferents. A whole outline of our
screening approach is shown in Figure 2.
Figure 2: A temporal approach to identify genes specifically expressed by proprioceptive
afferents and not cutaneous afferents (IB4+ or TrkC- SNs)
Second, gene expression profiling experiments from very low cell numbers
(50-100 cells) allowed the isolation of genes expressed within the coarse
classification of Trk receptor subpopulations in all lumbar DRG, but even at
specific spinal levels.
A third approach was performed to isolate genes that are differentially
regulated in wild-type versus Er81 mutant proprioceptive afferents (Arber et
al., 2000). The ETS transcription factor Er81 is known to play an important
role in connectivity between Ia proprioceptive afferents and motor neurons
in the developing spinal cord.
- 15 -

Chapter II - RESULTS & DISCUSSION Using transgenic mouse lines that express GFP in a number of cell types,
we isolated three main DRG SN subpopulations at different developmental
stages. This enabled us to perform a detailed gene expression profiling
analysis with focus on genes highly expressed by proprioceptive afferents
around the developmental time point when synapses form between sensory
and motor neurons.
GFP Expressing Mouse Lines – the Basis for the Identification and Isolation of Neuronal Subpopulations Previous work has generated several transgenic mouse lines to genetically
label neuronal subpopulations in the DRG. For most of the analysis, we have
used a binary Cre-based genetic system to express GFP selectively in
proprioceptive afferents, but not in other DRG sensory neurons (Figure 3,
(Hippenmeyer et al., 2005)).
Figure 3: Selective labeling of neuronal subpopulations using a binary Cre-based genetic
system. Membrane-linked GFP is activated under the control of the Tau promoter in a
conditional manner by insertion of a floxed - stop - cassette. Two different Cre lines were
used to induce GFP expression. The PV-Cre line activates expression in proprioceptive
afferents and Isl1-Cre mice induce GFP expression in all DRG sensory neurons.
- 16 -

These mouse lines express high levels of membrane-linked GFP under the
control of the Tau locus allowing to visualize GFP+ proprioceptive afferents
and their projections. After cell dissociation procedures of DRG sensory
neurons, GFP positive neurons were isolated to purity using Fluorescent
Activated Cell Sorting (FACS) as shown in Figure 4.
Figure 4: Expression of GFP and PV overlap in the DRG. GFP marks projections into the
periphery innervating muscle spindles and Golgi Tendon Organs (GTOs). Isolation of
GFP+ neurons of DRG subpopulations using fluorescent activated cell sorting (FACS).
Due to very low cell numbers acquired after cell sorting, methods were
established allowing the usage of small RNA quantities in gene profiling
experiments. When we started our gene profiling studies on selective
neuronal subpopulations, unfortunately not many studies were published
describing reproducible whole genome gene expression profiling
experiments using Affymetrix GeneChip technology (Klur et al., 2004;
Tsujino et al., 2000). The general protocols required a minimum of at least
- 17 -

5μg RNA, better 15μg, as starting material for Affymetrix based
hybridization experiments.
Single – cell RNA amplification methods resulted in low “present calls”,
meaning the total number of probe sets predicting a present signal was
lower than known from whole tissue samples. Moreover, in this study less
than 20% of amplified cDNA samples could be used for further gene array
hybridizations due to failing expression of house - keeping genes, which
were used as positive control and quality measure (Tsujino et al., 2000).
Knowing the difficulties with these state of the art experiments, it was
crucial to perform a set of control experiments to address additionally to
previous studies the following issues:
A) The effect of amplified RNA versus non amplified RNA in gene
expression profiling experiments
B) The effect of different RNA quantities as starting material in RNA
amplification reactions for gene expression profiling experiments
C) The effect of fluorescent activated cell sorting (FACS) on gene
expression profiles
Comparative Analysis of Amplified RNA versus non-Amplified RNA in Gene Expression Profiling Experiments Dealing with very low cell numbers, limited the RNA quantities for gene
expression analysis. Consequently, we established RNA amplification
techniques to overcome these limitations to make use of the limited RNA
isolated from DRG subpopulations. Previous studies had shown undesirable
side effects, such as irreproducibility of RNA amplification techniques (Klur et
al., 2004; Tietjen et al., 2003). Therefore, it was crucial to control the effect of
RNA amplification in our experiments. At the beginning of our studies, RNA
amplification protocols had been used in a few labs as mentioned above, but it
was a highly debated topic, because no study focused in detail on the effect of
- 18 -

RNA amplification and on differences between amplified and non amplified
RNA expression profiles.
We isolated RNA from lumbar DRG L1 – L6 of 25 embryos at developmental
stage E16.5. This RNA was isolated using the Qiagen RNA isolation kit.
Subsequently, the RNA was diluted into different aliquots with the
concentration of 10, 100, 1000 and 10,000ng/µl. The 10 and 100ng samples
were amplified prior to cRNA synthesis and compared in gene chip expression
profiling experiments to the non-amplified RNA samples of 1000 and
10000ng/µl RNA as starting material (Figure 5).
Figure 5: Evaluation of a RNA amplification technique. On the y-axis the signal intensity is
shown for given RNA quantities in a log scale. The x-axis represents different RNA
concentrations of starting material. a) 513 genes differentially regulated between the amplified
samples (10 and 100ng/µl). b) 2558 genes differentially regulated between amplified and non-
amplified RNA samples (10 and 1000ng/µl RNA). c) 3062 genes differentially regulated
between lowest amplified and highest non-amplified sample (10 and 10000ng/µl).
We found not only as previously described that genes expressed at a low
level under-amplify and very high expressed genes over-amplify (Klur et al.,
2004). We are able to show that low expressed genes may either over- or
under - amplify and vice versa. The same is true for very high expressed
genes. The effect of differential amplification efficiency may be based on
different GC contents and their secondary structures. Another possibility for
the amplification bias might be the binding strength of the polymerases to
certain templates. We conclude that RNA amplification is a non-linear
process resulting in biased ratios between transcripts after the amplification
reaction.
- 19 -

Due to this amplification bias of different starting quantities, it must be
considered that genes, which appear in a gene expression profile to be many
fold up-regulated, in reality, might simply have the potential to amplify easier
and that there is no underlying biological reason for this up-regulation.
Surprisingly, we also observed a bias within the amplified RNA datasets
(Figure 5). Comparing the gene expression profile of the amplified 10ng and
100ng RNA samples, we see that 513 genes are significantly different
between these two conditions. This means that we not only receive an
amplification bias within non - amplified and amplified RNA samples, but also
within amplified samples of different RNA starting concentrations.
This prompted us to investigate expression profiles from defined cell numbers
isolated from one batch of cells after FACS.
We compared gene expression maps from 300, 1000, 5000 cells. Using the
same batch of cells, we observe again, that some genes have a tendency to
amplify easier than other genes resulting in different transcript concentrations
after the amplification reaction. Interestingly, we are able to show that this
effect is more severe when we analyze expression profiles of very low cell
numbers. Comparing the gene expression profile of 300 versus 1000 cells,
139 genes were at least 2 fold differentially regulated, although the initial
batch of cells was the same. Comparing the expression profile of 300 versus
5000 cells, 439 genes were differentially regulated. Comparing the gene
expression profile of 1000 versus 5000 cells resulted in almost one identical
gene expression profile. Here, 11 genes were at least 2 fold differentially
regulated between these 2 conditions (Figure 6). For all profiling experiments,
we received reproducibly present calls of about 50%.
This would be the expected present call value of non – amplified RNA
samples from whole tissues such as heart or liver. Furthermore, this number
also served as control parameter for all gene array experiments to illustrate
the degree of occurred RNA degradation and to monitor the efficiency of the
RNA amplification reaction.
- 20 -
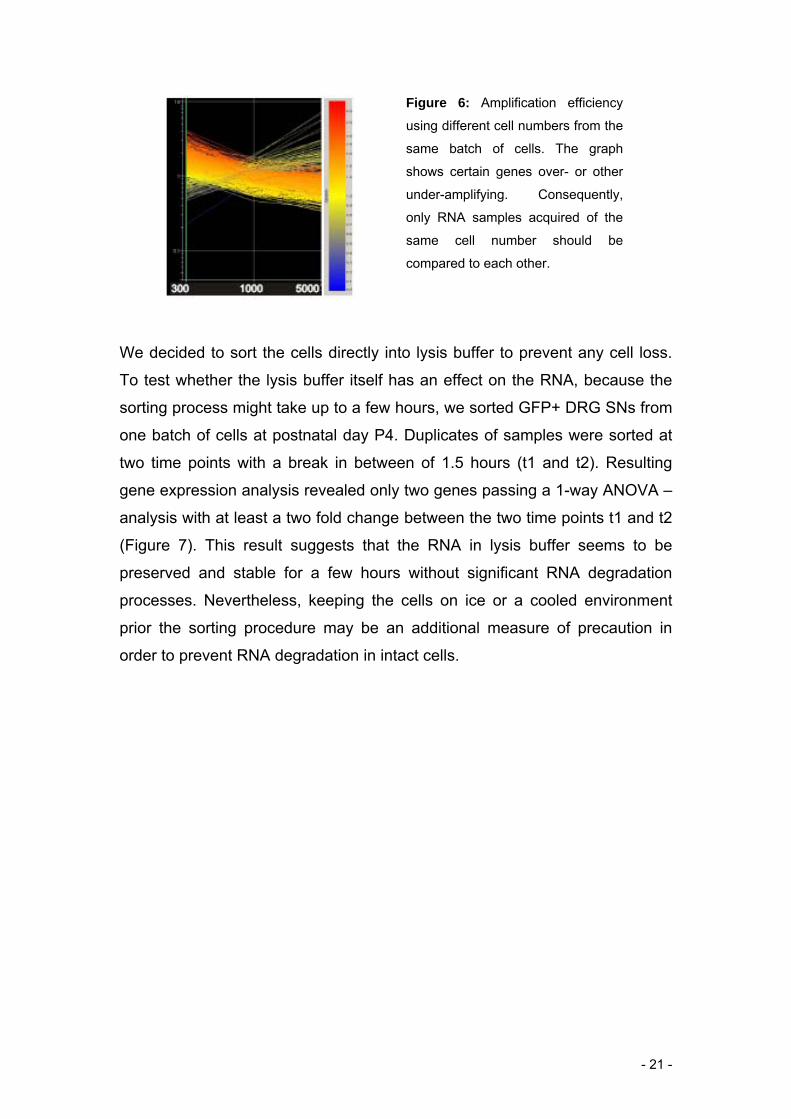
Figure 6: Amplification efficiency
using different cell numbers from the
same batch of cells. The graph
shows certain genes over- or other
under-amplifying. Consequently,
only RNA samples acquired of the
same cell number should be
compared to each other.
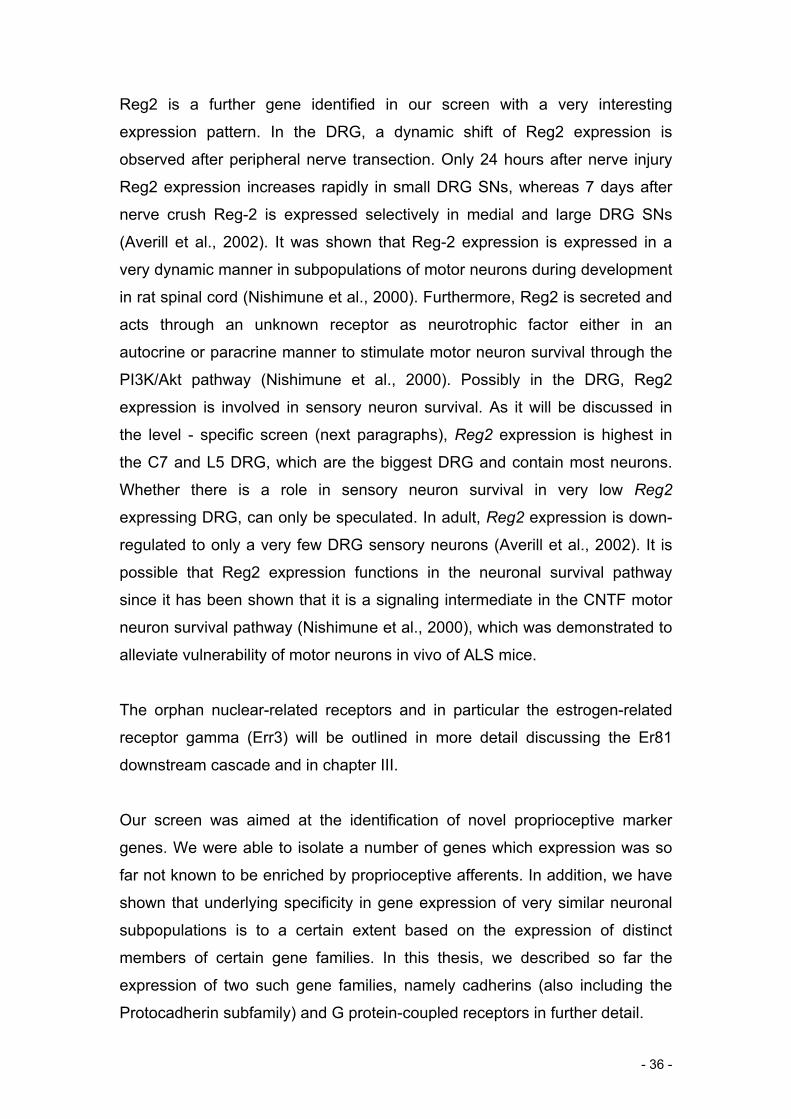
We decided to sort the cells directly into lysis buffer to prevent any cell loss.
To test whether the lysis buffer itself has an effect on the RNA, because the
sorting process might take up to a few hours, we sorted GFP+ DRG SNs from
one batch of cells at postnatal day P4. Duplicates of samples were sorted at
two time points with a break in between of 1.5 hours (t1 and t2). Resulting
gene expression analysis revealed only two genes passing a 1-way ANOVA –
analysis with at least a two fold change between the two time points t1 and t2
(Figure 7). This result suggests that the RNA in lysis buffer seems to be
preserved and stable for a few hours without significant RNA degradation
processes. Nevertheless, keeping the cells on ice or a cooled environment
prior the sorting procedure may be an additional measure of precaution in
order to prevent RNA degradation in intact cells.
- 21 -

1000, time point 2 1000, time point 1
Figure 7: Effect on expression profiles of DRG neurons before and after FACS. Considering
only expression data with a cut-off raw value >50 and a fold change of at least 2, only 78
genes are differentially regulated between t1 and t2. By applying a 1-way ANOVA test only
two genes were differentially regulated between t1 and t2.
Overall, we considered several issues in our expression profiling experiments
to obtain optimum results using RNA amplification techniques. We have
shown that amplified samples should not be compared with non-amplified
samples. If RNA amplifications are used, same concentrations of RNA
samples should be used to minimize the bias due the tendency of over- or
under-amplification. Genes expressed at a low level appear to be more
affected, as our analysis revealed greater variability. The same holds true
when comparing the expression profile of different cell numbers to each other.
The same rules might be the basis for other applications to obtain RNA
quantities from small cell numbers, such as Laser Capture Microscopy (LCM).
By comparing gene expression profiles from whole tissues with our acquired
data on small neuronal subpopulations, we can observe a sensitivity threshold
in the data received from these small neuronal subpopulations. As already
previously described, whole tissue preparations seem to be more stable and
- 22 -

reliable considering whole genome wide analysis (Tietjen et al., 2003). In
contrast to other studies, we describe the limitations of RNA amplification
techniques using a few cells only isolated by FACS for gene expression
profiling experiments. Nevertheless, we are able to show that the RNA amplification method
combined with Affymetrix GeneChip technology are powerful tools to perform
gene expression profiling studies from small cell numbers isolated by FACS
under certain conditions, which should be followed throughout all gene
profiling experiments.
- 23 -

Pinpointing Novel Proprioceptive Markers for further Analysis After establishing gene expression analysis from small cell numbers and
validating various mouse lines aimed at identifying novel marker genes, a
further challenge was to identify the right genes for further analysis. We
decided to focus our initial screens on genes expressed at late embryonic and
early postnatal stages at a time point when proprioceptive afferents form
connections to motor neurons. Genes expressed highly around developmental
time point E16.5 by proprioceptive afferents may play important roles in
synapse formation, whereas genes highly induced shortly after may regulate
synapse strengthening or maintenance (Arber et al., 2000). To get a first
impression about the quality of our gene chip results, we asked whether
known proprioceptive marker genes are expressed in our gene array
experiments in a selective manner as well. We analyzed the expression of 4
genes known to be selectively expressed by proprioceptive afferents; PV,
Runx3, Er81 and TrkC, whereas Er81 is also expressed by a set of cutaneous
neurons from late embryonic stages on (Arber et al., 2000; Kramer et al.,
2006). As shown in Figure 8, these four genes show highly enriched
expression profiles in the GFP+ population after FACS and gene array
analysis.
Gene Fold Change
Raw GFP+ vs GFP- population
Runx3 67.9 Er81 7.7 PV 33.9
TrkC 47.7 Figure 8: Known proprioceptive markers are highly enriched in sorted GFP+ cells.
In contrast, pure cutaneous markers are highly enriched in the GFP negative
population. TrkA is the most enriched gene with a fold change of 100
compared to the GFP positive proprioceptive population. Very similar to TrkA,
the cutaneous marker Runx1 is 50fold up-regulated. After validating our
approach, we sought to identify new markers genes, specifically expressed
- 24 -

within the TrkC positive population. We performed a candidate based gene
approach. Here, we picked genes with high raw values, but also high fold
changes between the GFP positive and negative population. Furthermore, we
aimed to identify genes that potentially regulate developmental processes
such as neuronal diversification, axon guidance and target cell recognition.
To validate the genes identified using an independent method, we focused on
in-situ hybridization (ISH) techniques. Where applicable we also used
antibodies to stain for the protein of interest. Furthermore, we made use of a
strain of mice in which proprioceptive afferents are lacking. These mice are
mutant for the neurotrophin receptor TrkC (Klein et al., 1994). Genes
specifically expressed by proprioceptive afferents should be not expressed in
mutant DRG of this line.
When we compared expression of some of our top candidates between wild-
type and TrkC-/- mutant mice on DRG, we indeed found that many of these
genes are not expressed in DRG neurons of TrkC-/- mutants. On our list, we
identified molecules of the axon guidance family. Figure 9 shows expression
of Slit2 and Robo1. We also found transcription factors previously not known
to be expressed by proprioceptive afferents. As an example, estrogen related
receptor 3 is shown in Figure 9. Interestingly, we also found a number of G-
protein coupled receptors with highly enriched expression patterns (Figure 9).
- 25 -

Figure 9: Validation of genes using in-situ hybridization experiments on lumbar DRG. The
top panel shows genes expressed specifically by proprioceptive afferents confirmed by the
absence of expression in the TrkC-/- mutant mouse line. The bar graphs on the bottom of
the figure represent the raw expression value of the individual gene; in green of PV+ GFP+
cells and in brown of the GFP-, mainly cutaneous DRG population.
A number of other genes (GPR97, Protocadherin 8, Cadherin 13 etc.) have
also been verified by ISH techniques and are listed in the Appendix. Since the
expression of many genes had been confirmed in vivo, it is tempting to
speculate that genes, which expression had not yet been confirmed by ISH
yet, are truly expressed as shown by the expression data.
Of particular interest to us were genes not expressed by all proprioceptive
afferents in order to identify programs involved in neuronal subtype
specification. So far no marker gene has been identified with an expression
pattern restricted to subsets of proprioceptive afferents. These genes could
potentially mark Ia proprioceptive afferents forming direct synapses with motor
neurons in the spinal cord or Ib afferents that connect to interneurons in the
intermediate spinal cord. As discussed already in the introduction,
peripherally, these neurons exhibit distinct termination zones in the muscle. Ia
afferents terminate on muscle spindles, whereas Ib afferents project to the
Golgi Tendon Organs (GTOs) of muscles. Figure 10 shows two such
- 26 -

examples. Reg2, a protein previously implicated in MN survival (Nishimune et
al., 2000) and the well known growth factor IGF1 both showed expression
profiles with restricted proprioceptive afferent association. Reg2 is expressed
exclusively by very few proprioceptive afferents. In contrast, IGF1 is
expressed by subpopulations of proprioceptive afferents but also some other
subpopulations of DRG neurons as became apparent when analyzing its
expression pattern in TrkC mutant mice.
Figure 10: Expression of two genes expressed by subsets of proprioceptive afferents. Reg2
is expressed exclusively in subsets of proprioceptive afferents, whereas Igf1 expression is
also observed in TrkC negative cells. (FC = Fold Change)
Neuronal development and circuit assembly involves a number of defined
mechanisms including cell migration, axon guidance and nerve branching.
Therefore, it was not surprising to us to identify molecules involved in these
processes. Slit proteins and their Robo receptors are known to have crucial
functions in these processes in the brain and spinal cord. Classically, Slit -
Robo signaling was described as a repulsive axon guidance mechanism to
prevent midline crossing and control cell migration (Bagri et al., 2002; Brose et
al., 1999; Kidd et al., 1999; Nguyen-Ba-Charvet et al., 2004; Wang et al.,
1999). Slit2 has been shown to also act positively on axon elongation and
branching of isolated DRG sensory neurons (Wang et al., 1999). During
- 27 -

development, DRG neurons reach the dorsal root entry zone of the rat spinal
cord at developmental time point E12 and bifurcate. Daughter axons run a few
segments along the longitudinal axis, before entering the spinal cord (Altman
and Bayer, 1984). Slit and Robo proteins are expressed in the spinal cord and
DRG neurons. More specifically, expression of Slit proteins in the dorsal
spinal cord along the dorsal root entry zone can be observed in rat at E13.5,
which is the time point when collaterals start to sprout (Brose et al., 1999; Ma
and Tessier-Lavigne, 2007; Wang et al., 1999). Culturing of NGF responsive
DRG neurons, which belong to the class of thermo- and nociceptive neurons,
respond to the addition of Slit2, brain or spinal cord extracts, by an increase to
axon length and branching. The overlapping expression of Slit and Robo
proteins in DRG neurons suggest an autocrine/paracrine mode of action to
promote proper axonal ingrowth into the spinal cord (Wang et al., 1999). Our
data in fact show enriched expression of Slit2 and Robo1 at E16.5 specifically
in mouse proprioceptive afferents (Figures 9 and 11), suggesting that the Slit2
dependent axonal branching of cutaneous DRG neurons is likely to be
dependent on a paracrine and not autocrine mode of action of Slit2 in vivo.
Enriched expression to proprioceptive afferents
Broad expression in DRG SNs
Figure 11: Enriched expression of Slit2 and Robo1 in proprioceptive afferents. In contrast,
Slit1 is likely expressed by all DRG sensory neuron subpopulations.
- 28 -

Analysis of Slit1;Slit2 or Robo1;Robo2 double deficient mice showed recently
that Slit/Robo signaling is not required for the formation of DRG central
collaterals (Ma and Tessier-Lavigne, 2007). Instead, longitudinal expression of
Slit1 and Slit2 at the dorsal root entry zone has been shown to be crucial for
branch repelling actions on DRG neurons. Slit1;Slit2 or Robo1;Robo2 double
mutant mice exhibit severe misprojections of sensory afferents into the dorsal
spinal cord. Thus, Slit/Robo signaling plays a significant role in sensory axon
growth and bifurcation (Brose et al., 1999; Ma and Tessier-Lavigne, 2007;
Wang et al., 1999).
The complexity of Slit/Robo signaling in axon guidance even further expands
as shown recently by the action of two antagonistic isoforms of Robo3. This is
a mechanism described so far only for commissural axons in order to inhibit
pre- and recrossing of the midline by expressing two different Robo3 isoforms
(Chen et al., 2008).
Using our DRG sensory neuron subpopulation specific screening strategy, we
were now able to categorize expression of gene families to defined DRG
sensory subpopulations. Slit and Robo expression is exemplarily depicted and
outlined in Figures 9 and 11.
G protein – coupled receptor Expression in DRG Sensory Neurons Underlying mechanisms of cell – cell interactions can be revealed by specific
secreted molecules such as hormones, neurotransmitters or ions and
corresponding groups of cell surface receptors. In our screen, we have
identified a number of molecules functioning in cell – cell interaction
processes. Cadherins, Protocadherins and various G protein - coupled
receptors (GPRs) are only a few of these classes. In the following paragraphs,
the differences and expression patterns of a number of GPRs in DRG sensory
neurons will be discussed in more detail.
GPRs, also called seven – transmembrane receptors (7TM receptors), have
distinct extracellular domains and ligand binding properties. GPRs comprise a
panel of over 800 genes encoding different receptor proteins that represent an
enormous potential of specific cell signaling players (Robbins et al., 2002;
- 29 -

Robbins et al., 2000; Vassilatis et al., 2003). Based on sequence similarity
GPRs can be categorized into three main distinct families: A, B and C:
Group A represents the largest group of a few hundred members, including
the rhodopsin-like and olfactory subgroup. Members of this subgroup
primarily bind to amines and peptides and have short N termini.
Group B has approximately 25 members, including the secretin-like receptors.
Group C has only few members including the metabotropic-like receptor group
containing the metabotropic glutamate receptor family, gamma-
aminobutyric acid (GABA) receptors, a Ca2+ sensing receptor and taste
receptors. This family is characterized by a very large extracellular
amino terminal domain.
GPRs are activated upon ligand binding, which triggers the release of a G
protein complex activating downstream cascades. To date many of these
receptors are considered orphans as their ligands are still unknown (Gilman,
1987; Rodbell et al., 1971). In our screen, we identified three of these orphan
GPRs. ISH experiments confirmed that GPRC5B, GPR64 and GPR97 are
expressed specifically by proprioceptive afferents at late embryonic stages
(Figure 9). GPRC5B belongs to the family of retinoic acid-inducible receptors
and was first identified by searching for metabotropic glutamate receptor
homologs, which were classified to type C GPRs (Robbins et al., 2002;
Robbins et al., 2000). Retinoic acid affects cell growth, differentiation and
apoptosis. Downstream retinoid signaling involves activation of at least two
known nuclear receptors; namely retinoic acid receptor and retinoid X receptor
(Robbins et al., 2002). Recent studies showed that retinoic acid inducible
GPRs bind to frizzled receptors, which may lead to activation of the non-
canonical Wnt signaling pathway (Harada et al., 2007). Interestingly, it has
been shown that the non-canonical Wnt pathway regulates neural crest
migration in Xenopus (De Calisto et al., 2005). Possibly one can speculate
that this signaling cascade might also be important for neural crest migration
of DRG neurons. GPRC5A and GPRC5C are also expressed in the DRG, but
- 30 -

not specifically by proprioceptive afferents. Unlike GPRC5A and GPRC5C, the
GPRC5B is predominantly expressed in the spinal cord and brain (Robbins et
al., 2002). We obtained the GPRC5B-/- mutant mouse line from Delatgen.
Initial behavior tests showed an increase in their latency to respond to the hot
plate test. It is unlikely that these sensory phenotypic changes are exclusively
due to the loss of GPRC5B expression in proprioceptive afferents, since
GPRC5B is also highly expressed in other brain regions like the cerebellum
and in many neurons of the spinal cord as preliminarily analyzed by Deltagen.
GPR64 (HE6) and GPR97 belong to the subfamily of the adhesion GPRs
(Figures 9 and 12). Both are orphan GPRs, which are characterized by a
distinct long N-terminus containing a number of domains also found in
proteins, such as cadherin, lectin, laminin. This region might confer functional
specificity in cell - cell or cell - extracellular matrix (ECM) interaction
(Bjarnadottir et al., 2004), which are essential for cell communication in the
central nervous system. Interestingly, as shown in Figure 12, GPR97 and
GPR64 can be both categorized into the same phylogenetic cluster within the
adhesion-GPR subfamilies.
- 31 -

Figure 12: Phylogenetic analysis of eight subclasses of adhesion-GPRs in human and
mouse. GPR64 (HE6) and GPR97 both identified in our screens to be specifically expressed
by proprioceptive afferents fall into the same cluster of adhesion-GPRs (Bjarnadottir et al.,
2004).
This clustering is based on structural amino acid similarity. Nevertheless, the
degree of structural similarities within class VIII of the adhesion GPRs might
reflect functional correlation.
GPR64 null mutants have been generated. Hemizygous males display a
severe decreased fertility caused by a dysregulation of fluid absorption within
the efferent ductus leading to a fluid accumulation (Davies B. et al, 2004).
However, the role of GPR64 in proprioceptive neuronal differentiation has not
been analyzed. Broad characterization of mutant animals does not show any
defects in spinal reflex circuit assembly (data not shown). One reason might
be a compensation effect by another closely related GPR, for example
GPR97, which is also exclusively expressed by proprioceptive afferents.
- 32 -

The fourth seven – transmembrane receptor we isolated specifically in
proprioceptive afferents, parathyroid hormone receptor 1 (PTHR1), is also a
member vaguely related to the adhesion GPR family. The PTHR1 is not a
orphan GPR, but binds to parathyroid hormone (Pth) and parathyroid
hormone-related peptide (Pthrp) (Guo et al., 2002; Kobayashi et al., 2002).
Interestingly, our Affymetrix gene expression profiling data show that the
PTHR2 is enriched in the nociceptive DRG neuron subpopulation (data here
not shown). Conditional elimination of PTHR1-/- in developing chondrocytes
reveals a significant role of PTHR1 signaling in chondrocytes differentiation
(Guo et al., 2002; Kobayashi et al., 2002; MacLean and Kronenberg, 2005).
Recently, it has been published that in vitro and in vivo, Pth/Pthrp signaling
through PTHR1 specifically regulates ephrinB2 expression in osteoblasts.
Inhibition of ephrinB2/EphB4 signaling resulted in defects of osteoblast
differentiation (Allan et al., 2008). Interestingly, both ephrinB2 transcripts on
our gene array show extremely elevated signals specific to the proprioceptive
afferent population, whereas ephrinB3 and ephrinA1 show elevated
expression in nociceptive DRG neurons. Therefore, the PTHR1 – ephrinB2
signaling cascade might also play a role in proprioceptive afferent
differentiation.
In contrast to our identified GPRs, several other 7TM receptors had been
found to be expressed in subsets of nociceptive DRG sensory neurons. One
such class of proteins are Mrg genes (Mas-related GPRs) comprising a family
of approximately 50 GPRs (Cox et al., 2008; Dong et al., 2001). Functional
studies revealed the involvement of these GPRs detection of painful stimuli.
Our and published data indicate that various GPRs are expressed in distinct
subsets of DRG sensory neurons and suggest functional specificity in a cell
type specific manner to control distinct signaling cascades.
Our data also identified differential expression of another class of proteins
involved in cell to cell interaction and recognition. This group of proteins is
called cadherins, which comprise a group of more than 100 members. Most of
these cadherins are transmembrane proteins, which undergo either
homophilic or heterophilic interactions. These molecules are characterized by
- 33 -

a repetition of their extracellular domains called cadherin repeats (Overduin et
al., 1995; Shapiro et al., 1995; Wu and Maniatis, 1999). In our screen, we
were able to identify a number of cadherins with enriched expression in
certain subsets of DRG sensory neurons. Protocadherins reflect the largest
subfamily of cadherins. Two such members identified with enriched
expression in proprioceptive afferents are Protocadherin 8 (Pcdh8) and
Cadherin 13 (Cdh13). Their validation by ISH can be found in the Appendix.
In the CNS, cadherins play several roles. On one side newly born neurons
have to aggregate to form precise neuronal groups, such as brain nuclei, DRG
or motor pools (Arndt et al., 1998; Suzuki et al., 1997; Yoon et al., 2000).
For the sensory – motor system, it has been shown that specific cadherin
expression can be correlated to certain motor neuron pools in the developing
chick spinal cord (Price et al., 2002). The expression of multiple cadherins in
subsets of proprioceptive sensory neurons raises the possibility that these
molecules also mark distinct sensory neuron pools and hence play a role in
sensory – motor connectivity. Past studies underlined the hypothesis that
cadherins have important functions in the development of synaptic
connections (Boggon et al., 2002; Carroll et al., 2001; Patel et al., 2006;
Redies, 2000; Wu and Maniatis, 1999). This is in particular interesting,
because specific cadherin molecules could be localized to synaptic complexes
in mouse hindbrain and cerebellum (Inoue et al., 1998) as well as to various
other synaptic complexes in chick at the time or soon before synapses are
formed (Arndt et al., 1998; Wohrn et al., 1998).
Cdh13 was shown to be expressed in cortico-spinal motor neurons (CSMNs)
(Arlotta et al., 2005). A crucial aspect of these neurons is the ability to grow
their extremely long axonal projections precisely to the termination zone in
order to form connections to specific target cells. Strikingly, Cdh13 is
expressed by CSMNs and proprioceptive afferents, two cell types both
forming connections with motor neurons in the ventral spinal cord. Therefore,
it is tempting to speculate that expression of molecules such as Cdh13 is
involved in such cell-cell interaction processes during the formation of the
spinal reflex circuit.
- 34 -

More recently, it has been shown in chicken embryos that Pcdh1 is expressed
in developing chick DRG and plays a crucial role in localizing neural crest
cells to DRG (Bononi et al., 2008).
Interestingly, Pcdh8 is among others a Pcdh member for which RNA splicing
yields to a neural-specific variant (Makarenkova et al., 2005). Furthermore, a
Pcdh8 – like molecule was identified to be induced in brain neurons upon
synaptic activity. Blocking of this molecule using antibodies causes a
reduction in the excitatory postsynaptic potential amplitude and blockage of
long – term potentiation in hippocampal slice cultures (Redies, 2000;
Yamagata et al., 1999). Future work with this respect could address the
question whether Pcdh8 expression in subsets of proprioceptive afferents
plays a role in synaptic activity of sensory – motor connections of the
monosynaptic stretch reflex circuit.
Considering the vast repertoire of Pcdhs and their potential splice variants, it
has been postulated that these molecules play a similar role in the vertebrate
nervous system like DSCAM molecules in Drosophila. Studies over the past
years identified that splicing variants of the Drosophila Dscam (Down
syndrome cell-adhesion molecule) gene give rise to a vast number of cell
surface proteins with distinct recognition properties. The variable domains
utilize a vast majority of alternative exons encoding in total 19008 different
ectodomains (Kohmura et al., 1998; Wojtowicz et al., 2007; Wu and Maniatis,
1999). The divergent expression of cadherins in the DRG might therefore
represent a vast repertoire of underlying cell to cell interaction molecules,
which possibly plays an important role in the specification of sensory - motor
system.
As shown in Figure 10, we identified the Igf1 gene to be expressed in
subpopulations of DRG sensory neurons. Igf1 is known as a potent growth
factor and plays important roles in mammalian growth and development. In
the CNS, Igf1 was described to function as survival factor, to be involved in
sensory map formation, axon guidance and synapse maturation (Chiu et al.,
2008; Leinninger et al., 2004; Scolnick et al., 2008). A more precise role of
Igf1 will be discussed with respect to the level specific screen.
- 35 -
Reg2 is a further gene identified in our screen with a very interesting
expression pattern. In the DRG, a dynamic shift of Reg2 expression is
observed after peripheral nerve transection. Only 24 hours after nerve injury
Reg2 expression increases rapidly in small DRG SNs, whereas 7 days after
nerve crush Reg-2 is expressed selectively in medial and large DRG SNs
(Averill et al., 2002). It was shown that Reg-2 expression is expressed in a
very dynamic manner in subpopulations of motor neurons during development
in rat spinal cord (Nishimune et al., 2000). Furthermore, Reg2 is secreted and
acts through an unknown receptor as neurotrophic factor either in an
autocrine or paracrine manner to stimulate motor neuron survival through the
PI3K/Akt pathway (Nishimune et al., 2000). Possibly in the DRG, Reg2
expression is involved in sensory neuron survival. As it will be discussed in
the level - specific screen (next paragraphs), Reg2 expression is highest in
the C7 and L5 DRG, which are the biggest DRG and contain most neurons.
Whether there is a role in sensory neuron survival in very low Reg2
expressing DRG, can only be speculated. In adult, Reg2 expression is down-
regulated to only a very few DRG sensory neurons (Averill et al., 2002). It is
possible that Reg2 expression functions in the neuronal survival pathway
since it has been shown that it is a signaling intermediate in the CNTF motor
neuron survival pathway (Nishimune et al., 2000), which was demonstrated to
alleviate vulnerability of motor neurons in vivo of ALS mice.
The orphan nuclear-related receptors and in particular the estrogen-related
receptor gamma (Err3) will be outlined in more detail discussing the Er81
downstream cascade and in chapter III.
Our screen was aimed at the identification of novel proprioceptive marker
genes. We were able to isolate a number of genes which expression was so
far not known to be enriched by proprioceptive afferents. In addition, we have
shown that underlying specificity in gene expression of very similar neuronal
subpopulations is to a certain extent based on the expression of distinct
members of certain gene families. In this thesis, we described so far the
expression of two such gene families, namely cadherins (also including the
Protocadherin subfamily) and G protein-coupled receptors in further detail.
- 36 -

We next used our knowledge of how to acquire gene expression profiles from
small numbers of cells to analyze genetic profiles of even smaller sensory
neuron subpopulations. In this approach we profiled DRG sensory neuron
populations of defined segmental levels throughout the entire anterior to
posterior axis.
Level Specific Gene Expression Profiling of Proprioceptive Afferents After establishing techniques to find novel proprioceptive markers, we pushed
our analysis even further to perform a screen to isolate proprioceptive markers
of specific segmental levels along the entire rostro - caudal axis. This strategy
allowed us to enrich for genetic fingerprints associated with so called sensory
neuron (SN) pools at different spinal levels. SN pools are associated with MN
pools and project to defined motor neurons or muscles in the periphery. So far
it has been shown by retrograde cell tracing experiments that motor neurons
in the spinal cord are stereotypically organized into MN pools (Landmesser,
2001).
In contrast to the well arranged patterns of motor neurons into pools, DRG
sensory neurons projecting to defined muscles in the periphery are
intermingled, yet are found roughly in DRG at levels adjacent to MN pools in
the spinal cord.
We reasoned that genes isolated through this level specific approach might be
involved in specifying intrinsic cues programming proprioceptive afferents to
innervate distinct muscles or muscle groups. As outlined in Figure 13, much
progress has been made over the past years in the identification of molecular
pathways specifying motor neuron subpopulations. Transcriptional programs
such as the Hox, Ets and Pou class transcription factors are linked to specific
MN pools (Dasen et al., 2008; Dasen et al., 2005; Vrieseling and Arber, 2006;
Wu et al., 2008). It is known that there is a high degree of selectivity in
sensory - motor connectivity centrally with preferential connections between
sensory- and MNs projecting to the same muscle peripherally.
- 37 -

Figure 13: MNs in the ventral spinal
cord are organized into so called
MN pools and project to defined
muscles in the periphery (upper
panel). These MN pools express
distinct transcription programs such
as Hox, POU and Ets transcription
factors.
In DRG, DRG sensory neurons
projecting to one muscle are not
clustered.
The following paragraph will outline the organization of MN pools in the spinal
cord and the underlying transcriptional programs involved in their
development.
Hox’ing Motor- and DRG Neuron Identity According to their nomenclature, Hox genes encode a number of
homeodomain transcription factors. In Drosophila, these factors were shown
to control transcriptional programs along the anterior to posterior body axis of
animals in order to specify functionally distinct body regions on different
segmental levels (Gehring, 1993; Schier and Gehring, 1992). These proteins
can either function as activators by enhancing expression of genes to specify
a particular body part and they repress transcription of undesired genes,
which are relevant to form other body parts.
In the mammalian nervous system it has been shown that a Hox regulatory
network specifies postmitotic MN pool identities, such as specific target
innervation patterns, expression of distinct molecular profiles and stereotypic
cell body positioning in the spinal cord. Hox genes are expressed in distinct
motor neuron columns and pools. The lateral motor column (LMC) is specified
by Hox6 and Hox10 expression in the brachial and thoracic region,
respectively. Preganglionic motor neurons (PGC) in the thoracic level are
- 38 -

specified by Hox9 expression. More specifically, a hox combinatorial code
also defines MN subpopulations. As described for the brachial MN pools,
further Hox specific clusters specify MN pool identity (Dasen et al., 2008;
Dasen et al., 2005).
Manipulating Hox expression in specific MN pools, consequently changes
patterns of connectivity and muscle innervation (Dasen et al., 2005). For
example, mouse mutants for Hoxc10 and Hoxd10 show severe hindlimb
locomotor defects due to failures in MN pool organization, specifically in the
lumbar spinal cord (Wu et al., 2008). Recent studies showed that the
transcription factor FoxP1 is a key regulator in establishing motor columnar
identity during development. FoxP1-/- deletion results in non-diversifying MNs,
which lack multiple characteristic molecular markers. On the other hand
blockade of Hox activity eliminates FoxP1 expression (Dasen et al., 2008;
Rousso et al., 2008).
These data show the necessity for a precisely controlled Hox regulatory
network to establish MN pool identities, which form selective connections to
their target muscles.
Within the DRG, such transcriptional networks to set up SN pools have not
been described, yet. We will address the question, whether we can identify
similar genetic programs in DRG subpopulations, which potentially might be
involved in sensory neuron diversification as it has been found for motor
neurons. To isolate level – specific sensory neurons, we purified
proprioceptive afferents from defined segmental levels, in order to perform
subsequent Affymetrix gene expression analysis. We decided to profile
proprioceptive afferents from six segmental levels in the spinal cord as
outlined in Figure 14.
- 39 -

Figure 14: Strategy to specifically isolate proprioceptive
afferents from six spinal segments; Cervical 6 & 7; Thoracic 4
& 10; Lumbar 1 & 5.
On the bottom panel, the expression of three known
proprioceptive markers is shown encompassing the entire
rostro to caudal proprioceptive afferent population in DRG of
various segmental levels.
The samples from each segmental level are shown in
triplicates, split in GFP+ and GFP-, representing proprioceptive
and non-proprioceptive afferent population of DRG neurons
respectively.
To profile the segmental levels indicated in Figure 14, we used 8 DRG from
four animals dissected bilaterally in triplicates. Due to the fact that the number
of isolated proprioceptive afferents from non – limb - level DRG was very low,
we decided to use not more than 100 cells isolated from any segmental level.
This strategy is based on our initial findings (Chapter II) that approximately the
same cell number should be used in comparative gene expression profiling
- 40 -

experiments. Since we had no experience with gene expression analysis of
such low cell numbers, we first analyzed genes, the expression of which we
knew encompasses the entire rostro to caudal proprioceptive afferent
population in the mouse. We focused our analysis on the expression of
Parvalbumin, Runx3, Er81 (etv1) and the newly identified transcription factor
Err3. As illustrated in Figure 14, we obtained stable expression of all three
triplicates for each gene in the GFP+ and GFP- population for all DRG
sensory neuron subpopulations analyzed. It is important to note that the level
of contamination by proprioceptive afferents into the GFP- cell population is
negligible. No signal for Parvalbumin, Runx3 and Err3 was detected over
threshold in the GFP- cell population. In contrast, a low Er81 signal was
observed within the GFP- cell population, which can be explained by
expression of Er81 in the cutaneous cell population at late embryonic stages.
These data are the basis for a further much more sensitive analysis to isolate
genes with varying expression in proprioceptive afferents in rostro to caudal
DRGs. As mentioned above, one set of candidates, which we analyzed in
more detail were the genes of the Hox family. Previous studies described the
expression of Hox genes in defined MN pools organized in a longitudinal
manner in the spinal cord. Figure 15 outlines the expression of some selected
Hox genes in DRG sensory neurons.
The first view illustrates quite diverse expression patterns of different Hox
genes. Further Hox expression patterns are outlined in the Appendix.
Intriguingly, we observe highest expression of HoxA10 in lumbar DRG. This
correlates very well with the observations of Dasen et al, 2005 described
already for lumbar motor neuron pools. In contrast to Hox9 paralog expression
in PGC motor neurons (thoracic levels), in DRG sensory neurons HoxD9 and
HoxA9 expression is highest in lumbar DRG (Figure 15 and Appendix). Hox9
and Hox10 paralogs are expressed independently of the cell type in the DRG
(cutaneous or proprioceptive), but show rather increasing expression towards
distinct segmental levels. In contrast, subpopulations of brachial motor
neurons express pool spanning Hox6, Hox3, Hox4 and Hox7 paralogs, which
can be clustered into bigger MN pools based on expression of HoxC8 and
HoxA5 (Dasen et al., 2008; Dasen et al., 2005).
- 41 -

HoxC8 expression causes a cell - autonomous repression of HoxA5 and
therefore forming sharp borders between two very similar neuronal
subpopulations to form distinct rostro to caudal motor neuron pool identities.
Very similar to the pool specific expression of HoxC8 and HoxC5 in motor
neurons (Dasen et al., 2005), we also observe a very sharp border in
expression of HoxC8 and HoxC5 among proprioceptive afferents in brachial
and thoracic levels.
Figure 15: The left panel illustrates Hox gene clusters with increasing expression in
cutaneous and proprioceptive afferents from anterior to posterior DRG, here depicted HoxA5,
or vice versa as shown for HoxA6 and HoxA10 DRG. On the right side of the graph, we found
HoxC5 expression specifically by anterior proprioceptive afferents, whereas HoxC8
expression declines in proprioceptive afferents from thoracic to lumbar levels. (Colors in bar
graphs match with colors and segmental levels in Figure 15).
Brachial proprioceptive afferents express high levels of HoxC5 diminishing
posteriorally towards thoracic DRG. Proprioceptive afferents at the segmental
level T4 express high levels of HoxC8, where HoxC5 expression is lowest,
and declines towards lumbar levels. The GFP- cutaneous afferent population
- 42 -

does not show any specific patterns of these genes. Transcripts for Hox6 are
not present on the gene array; therefore we cannot analyze its expression in
DRG sensory neurons. However, just like in motor neurons, Hox3 and Hox7
paralogs do not show any particular expression either towards a certain DRG
sensory neuron subpopulation nor expression restricted to DRG on certain
segmental spinal levels.
In summary, we discovered very intriguing Hox gene expression patterns in
DRG along various segmental levels and also within distinct DRG sensory
neuron subpopulations. We found Hox genes with restricted expression
patterns towards caudal or rostral DRG. More importantly, the two genes
Hoxc8 and Hoxa5, in our experimental setup show expression patterns with
very similar characteristics as previously described to establish motor neuron
pool identity. This raises the question of whether these genes play similar
roles in the DRG to specify proprioceptive afferent subpopulations at different
rostro-caudal levels.
- 43 -

Other Factors with Restricted Expression Patterns Along the Rostro– Caudal Axis In our level-specific screen, we not only identified novel proprioceptive afferent
markers. As shown in Figure 10, Reg2 and Igf1 were found already before to
be expressed in subsets of proprioceptive afferents. Our level specific
approach though revealed expression of Reg2 mainly in C7 and L5 DRG
(Figure 16 and 17). Igf1 shows clear enriched expression in L5 and C7 DRG,
but with no restriction to the proprioceptive afferent population as shown
before already in Figure 10. A third gene we found to be expressed
specifically by proprioceptive afferents in a level - specific manner is the
Gamma-aminobutyric acid receptor, gamma-1 (Gabrg1).
Figure 16: Analysis for three genes with a differentially regulated expression in rostro to
caudal DRG. The GFP+ population represents the proprioceptive afferent population isolated
by FACS. The GFP- population represents the remaining, mainly cutaneous afferent
population.
ISH experiments for Reg2 and Gabrg1 focusing on lumbar DRG confirm the
gene array data as shown in Figure 17. We reproduced the anterior to
- 44 -

posterior differences in gene expression as discovered by gene array
analysis. Figure 17: Increasing expression of
Gabrg1 and Reg2 in lumbar anterior
to lumbar posterior DRG. Note the
increase in expression from L1 and
L3 to L5 DRG. Note the expression
in subsets of proprioceptive
afferents by comparing the TrkC
staining with Reg2 and Gabrg1
expression. (ISH slides with Gabrg
staining kindly provided by Jun Lee)
Certainly, Reg2 and Gabrg1 expression does not reflect the total Ia
proprioceptive afferent population that forms direct monosynaptic connections
onto MNs. The Ia sensory afferent population is much bigger than the Reg2
and Gabrg1 positive cell population. Especially the absence of Reg2
expressing cells in L1 DRG suggests that Reg2 cannot label Ia proprioceptive
afferents. Proprioceptive afferents are present throughout all anterior to
posterior DRG. It is rather likely that these two genes represent a marker for
sensory pools projecting to individual muscles or onto distinct motor pools.
We characterized the expression of Igf1 in more detail. First, we validated the
elevated expression of Igf1 in L5 DRG compare to all other levels analyzed
also in our gene expression arrays. Figure 18 represents a quantitative graph
obtained by counting Igf1+ cells in ISH experiments.
- 45 -
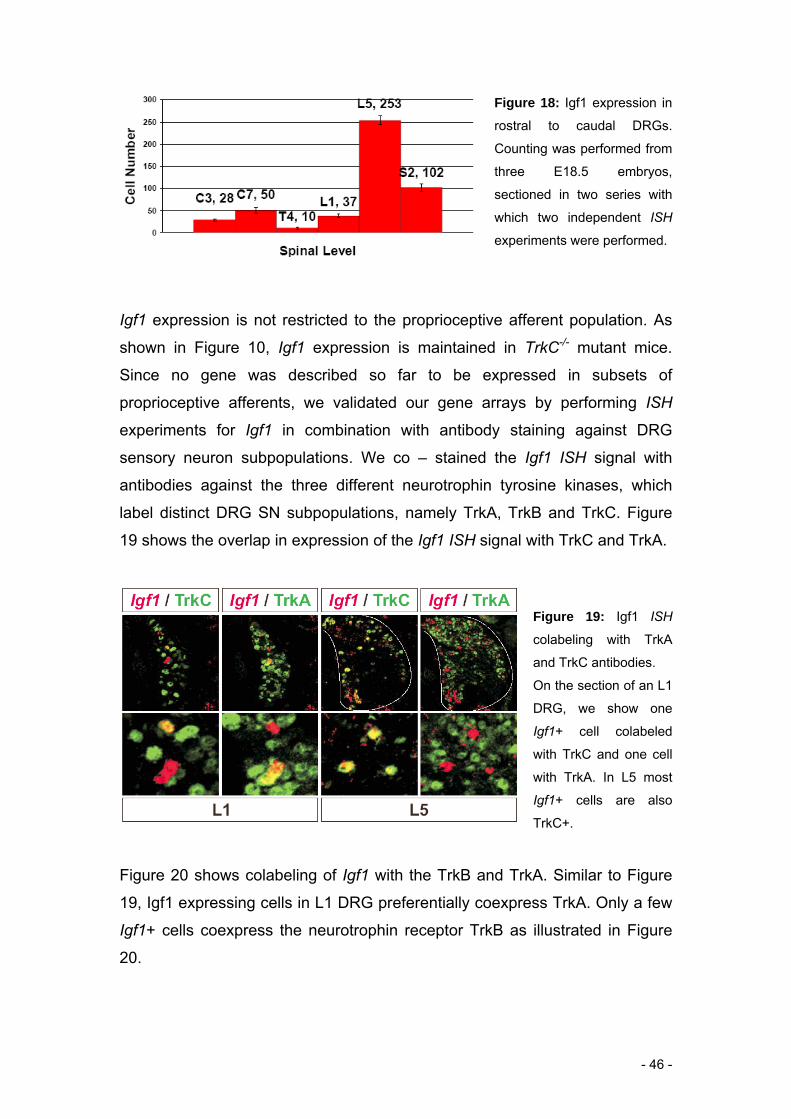
Figure 18: Igf1 expression in
rostral to caudal DRGs.
Counting was performed from
three E18.5 embryos,
sectioned in two series with
which two independent ISH
experiments were performed.
Igf1 expression is not restricted to the proprioceptive afferent population. As
shown in Figure 10, Igf1 expression is maintained in TrkC-/- mutant mice.
Since no gene was described so far to be expressed in subsets of
proprioceptive afferents, we validated our gene arrays by performing ISH
experiments for Igf1 in combination with antibody staining against DRG
sensory neuron subpopulations. We co – stained the Igf1 ISH signal with
antibodies against the three different neurotrophin tyrosine kinases, which
label distinct DRG SN subpopulations, namely TrkA, TrkB and TrkC. Figure
19 shows the overlap in expression of the Igf1 ISH signal with TrkC and TrkA.
Figure 19: Igf1 ISH
colabeling with TrkA
and TrkC antibodies.
On the section of an L1
DRG, we show one
Igf1+ cell colabeled
with TrkC and one cell
with TrkA. In L5 most
Igf1+ cells are also
TrkC+.
Figure 20 shows colabeling of Igf1 with the TrkB and TrkA. Similar to Figure
19, Igf1 expressing cells in L1 DRG preferentially coexpress TrkA. Only a few
Igf1+ cells coexpress the neurotrophin receptor TrkB as illustrated in Figure
20.
- 46 -

Figure 20: Igf1 ISH
colabeling with TrkA
and TrkB antibodies.
In the L1 DRG, we
show one Igf1+ cell
colabeled with TrkA.
On the section of an L1
DRG, most Igf1+ are
negative for TrkA and
TrkB, suggesting that
these cells are TrkC+
as depicted already in
Figure 19.
We also quantified the ratios of Igf1/TrkA, Igf1/TrkB and Igf1/TrkC expressing
cells in L1 and L5 DRG. As already visible from Figure 19 and 20, we observe
a very interesting distribution in that most Igf1+ cells in DRG L1 colabel with
TrkA, whereas most Igf1+ cells in TrkC colabel with TrkC (data not shown).
In summary, the expression of Igf1 represents a very interesting expression
pattern. Igf1 is expressed in subsets of proprioceptive afferents and numbers
also increase in a rostro to caudal gradient. Its expression exhibits very
selective changes in the association with different DRG subpopulations. Igf1
expression in certain DRG sensory subpopulations at different segmental
levels seems to be tightly regulated.
In additional experiments, we also assessed by real-time PCR, whether DRG
neurons express a particular isoform of Igf1. There are two distinct Igf1
isoforms. One form is described as the circulating class of Igf1, which is
predominantly expressed in the liver. The second isoform is described as a
local form of Igf1 and referred as muscle-restricted Igf1 (m-Igf1) (Dobrowolny
et al., 2005). m-Igf1 is expressed by many tissues, but remains confined to
the tissue of expression. Our real-time PCR experiments revealed expression
of both Igf1 isoforms in the DRG, which increases the complexity of Igf1 and
its role in DRG sensory neurons.
- 47 -

A role for Igf1 in DRG sensory neuron survival has been described already in
vitro (Leinninger et al., 2004). In this study, apoptosis in DRG neurons was
induced by application of high glucose levels. It was shown that Igf1 mediated
signaling regulates the PI3K/Akt pathway to prevent apoptosis caused by high
glucose levels. Igf1 also protects DRG sensory neurons from apoptosis upon
NGF abolition and promotes axonal extension (Camarero et al., 2001; Jones
et al., 2003; Ozdinler and Macklis, 2006; Rabinovsky et al., 2003). The in-vivo
effect of Igf1 was further investigated using Igf1 null mice. These mice exhibit
a significant decline in neuron cell number in various brain regions analyzed
(Beck et al., 1995; Camarero et al., 2001). In disease, a protective role for m-
Igf1 was described in a mouse model for amyotrophic lateral sclerosis (ALS),
which exhibits selective degeneration of motor neurons (Dobrowolny et al.,
2005; Pun et al., 2006).
To date, most studies of Igf1 focused in neuronal survival and growth-
promoting effects. A different role for Igf1 has been recently described for
olfactory sensory map formation. In this study, Igf1 was described to function
as chemoattractant and to be involved in axon guidance to innervate
specifically the lateral olfactory bulb (Scolnick et al., 2008). In a further study,
blockage of insulin receptor in retino - tectal neurons of Xenopus, resulted in
defects in synapse number and maturation, dendritic arborizations and
functional deficits such as light evoked responses (Chiu et al., 2008).
As described above, Igf1 signaling fulfills various functions in the developing
CNS and in diseased stage. Therefore, future work in our laboratory focuses
on the question whether tissue specific over-expression or deletion of Igf1 in
vivo will alter the effect of natural occurring cell death and therefore cause
changes in numbers of DRG sensory neurons. Using these genetic tools,
various approaches of previous studies could be analyzed in more detail, for
example whether Igf1 expression in DRG sensory neurons is required for the
ingrowth of Igf1 receptor expressing cortico – spinal motor neurons into the
spinal cord (Ozdinler and Macklis, 2006). Further experiments could focus on
possible roles of Igf1 in the formation of sensory – motor connections in the
spinal cord.
- 48 -

- 49 -
Dissecting the Er81 Downstream Cascade in Proprioceptive Afferents Previous work has addressed the role of the transcription factor Er81 in
proprioceptive afferents during monosynaptic stretch reflex circuit assembly
(Arber et al., 2000). In the introduction, I described the induction of Er81 by
peripheral NT3 expressed in muscles. It was also found that over-expression
of NT3 leads to a disruption in specificity in the formation of sensory – motor
connections in the spinal cord (Wang et al., 2007). These observations raise
the interest to analyze the downstream signaling cascade of Er81 to further
dissect its role in stretch reflex assembly. Our aim was to isolate genes
downstream of Er81 to find molecules involved in synapse formation of Ia
proprioceptive afferents and motor neurons. Moreover, we aimed to use
pathway analysis software (Ingenuity) to better understand signaling cascades
regulating axon growth to the ventral spinal cord and synapse formation. For
this reason, we performed gene expression profiling experiments of wt and
Er81-/- mutant proprioceptive afferents at developmental time point E14.5 and
E16.5 (Arber et al., 2000). This time point represents developmental stages
after Er81 is fully expressed to fulfill its function.
As previously described, we validated our gene expression results by ISH and
IHC experiments. Initially, we focused our analysis on genes down-regulated
or not expressed in the absence of Er81. Except for parvalbumin (Arber et al.,
2000), no further downstream gene of Er81 has been described so far. Table
2 represents genes with the biggest fold changes between wild-type and
Er81-/- mutant proprioceptive afferents, which show enriched expression in
proprioceptive afferents in wild-type conditions.
Table 2: Genes with enriched expression in proprioceptive afferents and down-regulated
expression in Er81-/- proprioceptive afferents at E16.5
Name (Access. #)
Description (Gene)
Fold Change wt vs Er81-/-
1417894_at G protein- coupled receptor 97 32.6
1422607_at Ets variant gene 1 (Er81) 27.1
1420402_at
ATPase, Ca++ transporting, plasma
12.3

membrane 2
1455361_at diacylglycerol kinase, beta 11.5
1437434_a_at RIKEN cDNA 5031439A09 gene 11.5
1435941_at rhomboid, veinlet-like 4 (Drosophila) 10.2
1428664_at vasoactive intestinal polypeptide 9.8
1417653_at parvalbumin 9.2
1437268_at
LanC lantibiotic synthetase component C-
like 3 (bacterial) 9.1
1444736_at cadherin 7, type 2 6.4
1424767_at cadherin 22 5.9
1450120_at sodium channel, voltage-gated, type I,
alpha polypeptide 5.6
1417051_at protocadherin 8 4.8
1421027_a_at myocyte enhancer factor 2C 4.2
1455267_at estrogen-related receptor gamma 4.0
1423367_at wingless-related MMTV integration site 7A 3.1
• genes with fold changes > 6.5 are appeared consecutively in initial list; genes with fold
changes < 6.5 had been selectively picked to be illustrated in Table 2.
All genes listed in Table 2 also show decreased expression in Er81-/- mutant
proprioceptive afferents at E14.5. One indication to trust the gene expression
data received, is the fact that the gene deleted, Er81, appeared as one of the
most down-regulated genes. Interestingly, many of the top hits have been
discovered and validated in previous screens already to be specifically
expressed by proprioceptive afferents. Figure 21 shows two such examples.
As indicated by the gene chip results, antibody staining for Err3 and Wnt7a
ISH show a complete down-regulation on Er81-/- mutant tissue.
- 50 -

Figure 21: Down-regulation of Wnt7a and Err3 in Er81-/- mutant tissue. Wnt7a shows ISH
signal and Err3 IHC signal, whereas Runx3 marks the entire proprioceptive afferent
population. Note the remaining expression of Err3 in ventral motor neurons.
In contrast, many of other described proprioceptive marker genes, such as
TrkC, GPR64, Robo1, Runx3 are not significantly differentially regulated
comparing wild-type and Er81-/- mutant animal expression profiles. A slight
down-regulation in Er81-/- mutant proprioceptive afferents can be observed for
PTHR1 and Slit2 with a fold change of 2.5 and 2.1, respectively.
The absence of Wnt7a in Er81-/- mutant tissue is in particular exciting,
because Wnt signaling has previously been implicated in the process of
synaptogenesis between proprioceptive afferents and motor neurons (Krylova
et al., 2002). In vivo studies show that secreted Wnt3a by motor neurons
elicits axon branching and growth cone maturation on NT3 responsive, hence
Ia proprioceptive, DRG sensory neurons. A very similar retrograde acting
mechanism has been found for the cerebellum. Here, Wnt7a is secreted by
granule cells to regulate axon and growth cone remodeling in mossy fibers to
- 51 -

induce synaptic differentiation (Hall et al., 2000). In Drosophila, it has also
been shown that Wnt signaling controls in an anterograde manner the
assembly of the neuromuscular synapse (Packard et al., 2002). An
anterograde or autocrine mode of action of Wnt7a in proprioceptive afferents
has not been investigated yet and will hopefully be studied in the future.
The second gene we validated from our functional gene chip approach is Err3.
At E14.5, there is clear Err3 ISH signal left on Er81-/- mutant tissue in the
DRG. In contrast, we observe a severe down-regulation of Err3 at E16.5.
Between E14.5 and E16.5, Ia proprioceptive afferents innervate the ventral
spinal cord to form synapses with motor neurons, which represents the time
window of Err3 down-regulation in proprioceptive afferents. Err3-/- mutants do
not exhibit the same or a similar phenotype as observed in Er81-/- mutants
and are also not ataxic. The proprioceptive afferent projections of these
animals look like wild-type (data not shown). Therefore, Err3 may not be a
direct target gene of Er81, but it is directly or indirectly controlled by Er81. Not
much is known about Err3 in neuronal development or synapse formation.
Solely the cofactor Peroxisome proliferator-activated receptor-gamma,
coactivator 1, alpha (PGC-1alpha) binding to Err3, but also to other nuclear
receptors, has recently been studied in more detail. We also found PGC-
1alpha to be enriched in proprioceptive afferents and 3 fold down-regulated in
Er81-/- mutant proprioceptive afferents, although we were never able to
validate these date by ISH or IHC due to a lack of a working AB and in situ
probe. PGC-1alpha is known to regulate various levels of energy metabolism
involving defects in mitochondrial biogenesis and respiration in muscle and
heart tissue (Finck, 2006; Finck and Kelly, 2006; Leone et al., 2005; Wu et al.,
1999). Therefore, there is an increasing interest to dissect the role of nuclear
receptors and PGC-1 in various neurodegenerative diseases involving
metabolic disorders. Since another member of the estrogen-related receptor
family, namely estrogen-related receptor alpha (Err1), has been shown to
interact with PGC-1alpha to regulate transcriptional control of energy
metabolism, it is tempting to speculate that Err3 achieves similar functions in
proprioceptive afferents (Huss et al., 2004).
- 52 -

Moreover, we have identified a number of other genes that might be
downstream effectors of Er81 signaling. Cadherins for example as discussed
previously, potentially play import roles in specific cell to cell interactions of
proprioceptive afferents (Table 2). We also found genes to which we did not
pay much attention so far. As seen in Table 2, one particular member of the
sodium channel family, namely SCN1A, was specifically down-regulated in
Er81-/- mutant proprioceptive DRG sensory neurons.
We observed in wild-type condition that certain members of gene families
seem to have very interesting, but distinct, expression profiles, such as certain
Hox genes, GPR64, PTHR1, Gabrg1 and others. We became interested to
study the expression patterns of all members of whole gene families that
might play a role in neuronal circuit formation and function. This analysis was
focused on ion channels, GABA receptors, semaphorins and plexins.
Surprisingly, a high degree of specificity in expression towards DRG SN cell
type and/or anterior to posterior DRG positioning can be observed, which we
analyzed in more detail in the next paragraphs.
- 53 -

Channel Specificity in DRG Sensory Neurons We detected the sodium channel, voltage gated type I, alpha polypeptide
(SCN1A) in our Er81-/- mutant proprioceptive afferent screen to be 5.6 fold
down-regulated and under wild-type conditions highly enriched in
proprioceptive afferents. Specific expression of voltage-gated Na+ channels is
essential to modulate an appropriate cell membrane potential and cell to cell
action-potential (AP) propagation. There is a variety of Na+ channel subtypes
expressed specifically by different tissues. SCN4A for example is expressed
in heart, whereas SCN8A is broadly expressed in the CNS, PNS, heart glia
and nodes of Ranvier (Chahine et al., 2005).
To increase complexity of channel modulation, these channels heterodimerize
with β-subunits and associate with a variety of protein kinase C (PKC) and
PKA isoforms as well as with G proteins, receptors, cytoskeletal elements an
others (Chahine et al., 2005). Sensory neurons express several Na+ channel
isoforms as it has been published and detected in our screens. So far, SCN1A
expression has been described in the CNS, PNS and heart. In contrast to
SCN1A, other voltage-gated Na+ channels show no specificity to any DRG
sensory neuron subpopulation and seem not to be affected by the loss of Er81
in DRG as shown in Figure 22.
Figure 22: Na+ channel expression in wt and
Er81-/- mutant DRG sensory neuron
subpopulations at E14.5 and E16.5. ‘other cells’
represent the GFP-, mainly cutaneous, cell
population.
SCN1A
SCN1A is up-regulated at E14.5 and down-
regulated at E16.5 in Er81-/- mutant proprioceptive
afferents
- 54 -

SCN6A
SCN6A expression is not restricted to a certain
DRG sensory neuron subpopulation and is not
affected by the loss of Er81.
SCN3A
SCN3A expression is not restricted to a certain
DRG sensory neuron subpopulation and is not
affected by the loss of Er81.
As outlined in the Appendix, in contrast to SCN1A, the Na+ subunits SCN10A
and SCN11A shows restricted expression to the GFP-, mainly cutaneous
afferent DRG sensory neuron subpopulation.
We not only find defined sodium channel expression patterns, but also
observe similar expression patterns for K+ channels and K+ channel
interacting proteins as we summarize in the Appendix.
Correct channel expression is in particular important to modulate voltage
thresholds of AP in individual fiber types. It was reported that multiple sodium
channel isoforms and types contribute to electrical activity in DRG sensory
neurons (Catterall et al., 2005; Yu et al., 2005). Proprioceptive afferents are
present in all DRG sensory neurons along the entire anterior to posterior axis.
Given the fact that proprioceptive afferents from various levels innervate a
vast repertoire of different muscles throughout the body over various
distances, exact channel expression and modulation is imperative for precise
functionality and AP propagation over the axon. Therefore, it can be
postulated that there must me a high degree of channel specificity not only
between two distinct subsets of neurons, e.g. TrkA and TrkC cells as shown
above, but also within one cell type, e.g. proprioceptive DRG neurons. Our
level specific screen indeed exhibits anterior to posterior regulated expression
of sodium and potassium channel subtypes. In Figure 23, we see a trend that
- 55 -

SCN1A expression is modulated among different DRG, whereas SCN1A
expression in TrkC- cells remains unchanged. In comparison members of the
type 4 family, namely SCN2B and SCN4B show elevated expression in C7
and L5 DRG. More specifically, SCN2B expression is restricted to spinal level
C7, but is not restricted to any DRG sensory neuron subpopulation.
Figure 23: Gene expression analysis
of GFP+ (TrkC+) and GFP- (TrkC-)
cells of different anterior to posterior
DRG.
SCN1A
Specific expression of SCN1A in
proprioceptive afferents along rostral
to caudal DRG. It seems like SCN1A
is higher expressed in anterior versus
posterior DRG.
SCN4B
SCN4B expression is significantly
enriched in C7 and L5 proprioceptive
afferents, but at moderate levels also
expressed in the GFP-
subpopulation.
SCN2B
SCN2B expression is expressed
specifically in C7 DRG, but not
restricted to DRG sensory neuron
subpopulations.
Together, we demonstrate a cell type and level specific expression of voltage-
gated Na+ channels to modulate signal transduction properties from DRG
sensory neurons. Similar specificity in expression can be detected for other
- 56 -

ion channel families and their binding proteins, for examples potassium
channels, which are summarized in the Appendix.
Potential role of SCN1A in DRG proprioceptive afferents Specific expression of voltage-gated Na+ channels is essential to modulate an
appropriate cell membrane potential and cell to cell action potential (AP)
propagation. There is a variety of Na+ channel isoforms expressed specifically
by various tissues, but also in our experiments in specific patterns in the DRG.
Moreover, we show that SCN1A is responsive to Er81 and expressed by
proprioceptive afferents in a level-specific manner. Yu et al described that
correct expression of voltage-gated Na+ channels is required for the initiation
of action potentials in GABAergic interneurons (Yu et al., 2006). A family of
voltage-gated sodium channel binding proteins has recently been studied to
control neuronal excitability through modulation of Na+ channels (Goldfarb et
al., 2007).
Very similar to the Er81-/- mutant mouse, SCN1A-/- mutant mice display severe
ataxia and die around postnatal day P15. Dependent on the background, 20 –
80% of the SCN1A+/- haplo-insufficient heterozygous mice died between the
third and fifteenth postnatal week. A reduction in functional SCN1A in
heterozygous animals leads to epileptic seizures in the fourth postnatal week
that can be explained by a hyper-excitability in these animals phenocopying in
humans the disease called severe myoclonic epilepsy in infancy (SMEI).
Ogiwara et al described that in the developing neocortex, SCN1A is clustered
around the axon initial segments (AIS) of parvalbumin positive interneurons
(Ogiwara et al., 2007). As described earlier, proprioceptive afferents also
express parvalbumin. Ogiwara et al show also that homoyzgous knockout
animals develop unstable tonic-clonic and polyspike-wave seizures in the
second postnatal week, suggesting SCN1A to be an imperative factor for AP
initiation at the AIS. Moreover, it was reported that increasing input currents to
generate spike bursts in dissociated hippocampal neurons, results in a decline
of the AP number and amplitude during the bursts in SCN1A heterozygous
- 57 -

and homozygous animals (Yu et al., 2006). Very similar to this phenomenon,
Ia afferents in Er81-/- animals also fail to respond to high frequency stimulation
via muscle tapping (Arber et al., 2000).
Supporting this hypothesis, the mechano-sensitivity of voltage gated sodium
channels has been studied by expressing a human heart channel subunits in
oocytes (Morris and Juranka, 2007). The phenotypic observations (ataxia and
muscle tremors) in SCN1A-/- mutant animals might be explained by action
potential decrement from muscles. Therefore, SCN1A might be a key
molecule involved in the generation of stretch induced action potentials in
proprioceptive afferents.
In summary, SCN1A is a very interesting molecule that might be crucial for AP
initiation in proprioceptive afferents in response to stretch. If that was true,
future functional analysis could prove the significance of SCN1A in the
monosynaptic stretch reflex circuit functioning.
Chapter II – SUMMARY Our screening strategy provided insights and evidence about molecular
components expressed in specific components of the monosynaptic stretch
reflex circuit. Identification and validation of many novel markers expressed by
proprioceptive afferents slowly decode a gene expression based matrix to
further specify and characterize proprioceptive afferents.
In addition, we were able to isolate genes downstream of Er81, a crucial
transcription factor expressed in the DRG, imperative to form functional
connections between proprioceptive sensory neurons and motor neurons in
the spinal cord. By pushing our technical limitations even further, we were
able to dissect genes expressed in very small neuronal subpopulations in
DRG restricted by expression in rostro to caudal patterns. Interestingly, we
have identified a number of genes the expression of which shows patterns in
multiple DRG subpopulations, for example Igf1. Our screens detected also
genes, which possibly play important functions in neuronal excitability, action
potential initiation, propagation and transmission, such as various ion-, GABA
channel- and G protein-coupled receptors.
- 58 -

Moreover, it can be speculated that a similar Hox based transcriptional code is
involved in sensory neuron pool diversification, as it has been described
already for motor neuron pools. Finally, we established tools and conditions to
reliably perform RNA amplification techniques and presented convincing data
arguing that when acquiring gene expression profiles from the nervous
system, isolation of pure neuronal subpopulations is key to success.
- 59 -

Estrogen – Related Receptor Gamma Marks Gamma Motor Neurons
Andreas Friese*1,2, Julia Kaltschmidt*3, David Ladle*1,2, Monika
Mielich1,2, Thomas M. Jessell3 & Silvia Arber1,2
*equal contribution 1Biozentrum, Department of Cell Biology, University of Basel, Switzerland 2Friedrich - Miescher Institute for Biomedical Research, Basel, Switzerland 3Howard Hughes Medical Institute, Department of Biochemistry and Molecular
Biophysics, Center for Neurobiology and Behavior, Columbia University,
USA
- 60 -

- 61 -
Muscle spindles reside within muscles and provide information about changes
in muscle length to the CNS. They are innervated by two main neuronal
components. Proprioceptive sensory afferents forward information about axial
and limb positioning to the CNS. Gamma motor neurons project to the
peripheral domain of intrafusal muscle fibers and elicit small contractions of
intrafusal muscle fibers to modify the sensitivity of the muscle spindle to
stretch. Due to missing molecular markers, identification of gamma motor
neurons in the central nervous system so far was only based on their smaller
cell size. Previous studies focused on the formation and connectivity of
muscle spindles in the periphery using various transgenic mouse lines. Here,
we identify gamma motor neurons in the central nervous system on an
anatomical and molecular basis.
We made use of three transgenic mouse lines
(PV-Cre;Isl2-DTX, Egr3-/-, Er81-/-), mutants exhibiting muscle spindle defects
of different severity. We identified motor neurons by using the backfilling
technique with Rhodamine-Dextran and up-regulating the activating
transcription factor 3 (ATF3) two days after nerve lesions. PV-Cre;Isl2-DTX
mice, in which muscle spindles fail to differentiate due to the loss of
proprioceptive innervation, showed loss of all gamma motor neurons in the
spinal cord. Furthermore, we quantified the number of motor neurons
projecting to quadriceps muscles and analyzed the loss of gamma motor
neurons during muscle spindle degeneration in the Egr3-/- mutant mouse line.
Our results demonstrate that muscle spindles are required for gamma motor
neuron survival and identify a novel molecular fingerprint for gamma motor
neurons.
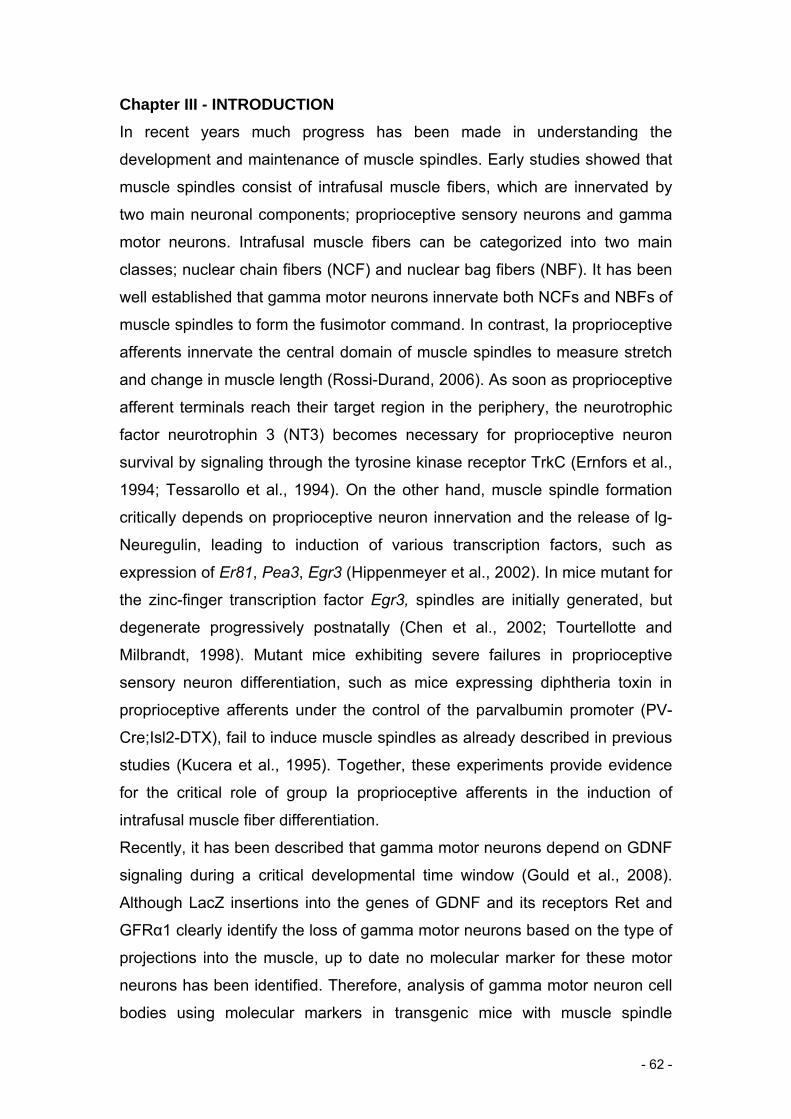
Chapter III - INTRODUCTION In recent years much progress has been made in understanding the
development and maintenance of muscle spindles. Early studies showed that
muscle spindles consist of intrafusal muscle fibers, which are innervated by
two main neuronal components; proprioceptive sensory neurons and gamma
motor neurons. Intrafusal muscle fibers can be categorized into two main
classes; nuclear chain fibers (NCF) and nuclear bag fibers (NBF). It has been
well established that gamma motor neurons innervate both NCFs and NBFs of
muscle spindles to form the fusimotor command. In contrast, Ia proprioceptive
afferents innervate the central domain of muscle spindles to measure stretch
and change in muscle length (Rossi-Durand, 2006). As soon as proprioceptive
afferent terminals reach their target region in the periphery, the neurotrophic
factor neurotrophin 3 (NT3) becomes necessary for proprioceptive neuron
survival by signaling through the tyrosine kinase receptor TrkC (Ernfors et al.,
1994; Tessarollo et al., 1994). On the other hand, muscle spindle formation
critically depends on proprioceptive neuron innervation and the release of lg-
Neuregulin, leading to induction of various transcription factors, such as
expression of Er81, Pea3, Egr3 (Hippenmeyer et al., 2002). In mice mutant for
the zinc-finger transcription factor Egr3, spindles are initially generated, but
degenerate progressively postnatally (Chen et al., 2002; Tourtellotte and
Milbrandt, 1998). Mutant mice exhibiting severe failures in proprioceptive
sensory neuron differentiation, such as mice expressing diphtheria toxin in
proprioceptive afferents under the control of the parvalbumin promoter (PV-
Cre;Isl2-DTX), fail to induce muscle spindles as already described in previous
studies (Kucera et al., 1995). Together, these experiments provide evidence
for the critical role of group Ia proprioceptive afferents in the induction of
intrafusal muscle fiber differentiation.
Recently, it has been described that gamma motor neurons depend on GDNF
signaling during a critical developmental time window (Gould et al., 2008).
Although LacZ insertions into the genes of GDNF and its receptors Ret and
GFRα1 clearly identify the loss of gamma motor neurons based on the type of
projections into the muscle, up to date no molecular marker for these motor
neurons has been identified. Therefore, analysis of gamma motor neuron cell
bodies using molecular markers in transgenic mice with muscle spindle
- 62 -

defects was not possible. Experiments to differentiate between alpha and
gamma motor neurons classically included ultrastructural analysis only on a
cellular level (Ichiyama et al., 2006).
Here, we identified a specific marker to characterize in detail lumbar gamma
motor neurons on an anatomical and molecular level. First, we show that
gamma motor neurons express the orphan nuclear receptor, estrogen-related
receptor gamma (Err3) and quantified the size and number of gamma motor
neurons within a defined motor neuron pool in the spinal cord. We used a
technique to specifically up-regulate the activating transcription factor 3
(ATF3) upon quadriceps nerve lesion. Using this method, we further
monitored a significant loss of gamma motor neurons in mouse models
revealing muscle spindle defects.
- 63 -

Chapter III – RESULTS
Expression of Err3 by motor neurons By IHC we localized Err3 in the lumbar spinal cord. In the juvenile and adult
mouse spinal cord, Err3 shows selective expression to subsets of motor
neurons and interneurons. To determine the exact cell type in which Err3 is
expressed, we stained mouse spinal cord with various motor neuron markers
and neuronal nuclei (NeuN) at juvenile age (~P20). A strong expression of
Err3 was observed in cells located in the ventral lumbar spinal cord in the area
of motor neurons. To confirm the expression of Err3 to motor neurons, we
performed co-staining with various motor neuron markers. Vesicular
acetylcholine transporter (vAChT), choline actetyl transferase (ChAT) and the
receptor tyrosine kinase Ret are known to be expressed by motor neurons
(Dupuis et al., 2008; Gould et al., 2008; Salomon et al., 1998) and allowing us
to use them for our co-localization experiments with Err3. Most Err3
expressing cells in the ventral horn of the spinal cord can be allocated to
motor neurons using vAChT, ChAT and Ret as motor neuron markers (Figure
1 and S1). NeuN is known to label all neurons in the brain and spinal cord.
Interestingly, the strongest Err3 stained cells express no or only very low
levels of NeuN (Err3+;NeuN-); nevertheless can be clearly identified as motor
neurons. L4 ventral root backfills with rhodamine-dextran confirmed that the
Err3+;NeuN- cells projecting outside the spinal cord represent motor neurons.
Again, clear identification of the Err3+;NeuN-;Rhd+ cells is possible,
confirming again these cells to be motor neurons (Figure 1c).
Motor neuron size distribution of lumbar motor neurons The patterns of Err3+;NeuN- expressing cells let us assume that these cells
fall into a class of small sized motor neurons. Therefore, we performed a
motor neuron size distribution analysis. Motor neuron size was determined by
quantitative analysis of randomly sampled motor neurons at posterior lumbar
levels. As described in previous studies (Ichiyama et al., 2006), the motor
neurons mean diameter plotted in a histogram, results in a bimodal
distribution. Since the mean diameter does not represent the motor neuron
size, we determined the maximum crossectional frequency of motor neuron
- 64 -

areas, which also resulted in a bimodal distribution (Figure 2). The maximum
crossectional area of motor neurons was determined using the imaging
software ImageJ. Subsequent clustering of these cells into NeuN strong and
NeuN weak expressing or negative cells, clearly shows that the ChAT+;NeuN-
cells fall into a small sized motor neuron population, whereas ChAT+;NeuN+
cells are of bigger size in average. The small sized strong Err3 expressing
motor neuron population represents 27% of the motor neurons quantified.
Therefore, the small sized Err3+;NeuN- cells might represent the gamma
motor neuron subpopulation. To investigate whether the
Err3+;ChAT+;vAChT+;NeuN- cell population reflects the putative gamma
motor neuron cell population, we next analyzed vGlut1 input onto these cells.
Gamma motor neurons receive inhibitory input through the neurotransmitters
gamma aminobutyric acid (GABA) and/or Glycine as well as excitatory input
by glutamate. This glutamatergic input is not mediated by synapses from Ia
proprioceptive afferents (Hatabu et al., 1996; Ornung et al., 1998). If the
Err3+:NeuN- motor neuron population indeed reflect gamma motor neurons
based in cell fraction and size, these motor neurons should also have less
vesicular glutamate transporter signal (vGlut1) than the strong NeuN
expressing motor neurons. As shown in Figure 2, the mean vGlut1 synaptic
density on ChAT+;NeuN+ cells is 0.5±0.1 synapses per 100µm2 (n=33). In
contrast the terminal density on ChAT+;NeuN- cells is approximately 6.25
times lower (n=13), suggesting that these strong Err3 expressing cells might
indeed represent the gamma motor neuron population.
Analysis of gamma motor neurons in mouse models with spindle defects The molecular and anatomical characterization of these putative gamma
motor neurons raises the question of the fate of these cells in mice exhibiting
defects in muscle spindle differentiation (Kucera et al., 1995). PV-Cre;Isl2-
DTX mice do not have proprioceptive afferents and therefore never induce
muscle spindle differentiation. In our experiments, loss of muscle spindles
results in a total loss of the ChAT+;NeuN- putative gamma motor neuron
population (Figure 3A). Therefore, we can conclude that strong Err3
expressing, in this experiment ChAT+;NeuN-, cells are in fact gamma motor
- 65 -
neurons. Er81-/- mutant animals, exhibiting severe defects in the central
projections of proprioceptive afferents, also display failures in muscle spindle
differentiation (Arber et al., 2000). Similar to PV-Cre;Isl2-DTX animals, Er81-/-
mutant mice also lack most gamma motor neurons (Figure 3B). In order to
validate that the loss of the gamma motor neuron subpopulation is due to
peripheral spindle defects and not caused by genetic alterations leading to
defects of proprioceptive input, we analyzed gamma motor neurons in the
area of the cutaneous maximus (CM) motor neuron pool, which in the wild-
type does not receive proprioceptive afferent input (Vrieseling and Arber,
2006). Clearly, gamma motor neurons can be identified based on their
molecular characteristics expressing high levels of Err3 and no or low levels of
NeuN (Figure 3).
Analysis of gamma motor neurons projecting to the quadriceps muscle The data suggest that gamma motor neurons do not die due to the loss of
proprioceptive input, but rather due to peripheral spindle defects. To further
investigate the loss of gamma motor neurons due to failures in muscle spindle
differentiation, we analyzed Egr3-/- mutant mice in greater detail. These mice
exhibit a muscle spindle degeneration defect, causing impairments of
intrafusal muscle fiber development and subsequent Ia proprioceptive afferent
denervation (Tourtellotte and Milbrandt, 1998). We focused our analysis on
defined motor neuron pools projecting to the quadriceps muscles. We decided
to label motor neurons projecting to the quadriceps muscle group by up-
regulation of the activating transcription factor 3 (ATF3) after quadriceps nerve
lesion (Huang et al., 2006; Tsujino et al., 2000). As shown in Figure 4, up-
regulation of ATF3 in small sized and big NeuN+ motor neurons works equally
well. This technique was further used to compare the number of ATF3
expressing cells in wt and Egr3-/- mutant mice (Figure 5). In average we
quantified 254 motor neurons expressing ATF3 under wild-type conditions, of
which 72 (28%) were identified as gamma motor neurons based on their
molecular identity (ATF3+;ChaAT+;NeuN-). In Egr3-/- mutant animals, the total
number of ATF3 expressing cells dropped to 195 cells, of which 15 cells (8%)
were identified as gamma motor neurons. Consequently, the loss of ATF3+
motor neurons is likely to the gamma motor neuron population. As shown in
- 66 -

Figure S2, the small sized gamma motor neuron population, by determining
the crossectional area and the NeuN status, cannot be detected anymore.
Moreover, in P35 old Egr3-/- mutant animals, only 2% of gamma motor
neurons could be detected; hence with increasing spindle degeneration, more
gamma motor neurons die.
Chapter III – DISCUSSION To date, only little is known about molecular differences of motor neuron
types. Recent studies mainly focused on transcriptional differences between
motor neuron pools and motor neuron columns within the spinal cord during
development. Yet, basic principles between different motor neuron types,
such as alpha and gamma motor neurons, are only poorly understood. Known
studies are mainly based on their distinct innervation patterns into muscles or
based on their synaptic inputs determined through ultrastructural
classification.
In this study, we were able to specifically identify gamma motor neurons in
wild-type and mutant conditions. We performed an anatomical and molecular
characterization to prove that small sized strong Err3 and no or low NeuN
expressing motor neurons are indeed gamma motor neurons.
In order to quantify distinct motor neurons projecting to a particular muscle,
we used the methodology of ATF3 up-regulation upon quadriceps nerve
lesion. This technique is in particular powerful, because ATF3 is not
expressed in motor neurons of uninjured animals. The reproducibility of ATF3
expression after axotomy lies almost at 100% as shown by Tsujino et al and
therefore provides an ideal technique to monitor neuronal cell numbers
(Tsujino et al., 2000). Our results led to the conclusion that mouse mutants
with severe defects in muscle spindle differentiation exhibit a significant loss
of gamma motor neurons. These findings suggest that gamma motor neurons
depend on the expression of intrafusal muscle fibers specific genes, which are
lacking in Egr3-/- mutant mice (Chen et al., 2002). In contrast, upon gamma
motor degeneration from spindles, their neuronal somata disappear as proven
by a significant loss of motor neuron cell number. This means, there are
certain aspects of proprioceptive afferents that will allow these cells to survive
in the absence of NT3 in muscle spindles (Chen et al., 2002). Gamma motor
- 67 -

neurons apparently do not share these features, since these neurons
denervate and die in Egr3-/- mutant animals. One possible mechanism could
be the downregulation of GDNF in muscle spindles (Gould et al., 2008). To
dissect the exact reasons for gamma motor neuron death compared to the
maintenance of proprioceptive afferents, will require further studies. It will be
interesting to understand whether there are factors expressed other than NT3
and GDNF by normal muscle spindles, required for postnatal proprioceptive
afferent survival in Egr3-/- mutant animals. Identification of factors expressed
by muscle spindles required for gamma motor neuron survival will provide
insight into new molecular mechanisms involved in subtype specific motor
neuron survival and hence, might shine light into the selective vulnerability of
motor neurons in disease state.
- 68 -

Chapter III – RESULTS (Figures)
Figure 1: Err3 expression in a subset of motor neurons in the lumbar ventral spinal cord.
(A) Err3 is highly expressed in a subset of motor neurons in the spinal cord and co-expresses
the motor neuron marker gene vAChT. These motor neurons express low level or no NeuN.
(B) Motor neurons are stained for ChAT, a different motor neuron marker gene. The same
subpopulation of motor neurons can be identified to be negative for NeuN. Co-labeling with
Err3 is not possible due to cross-reactivity of antibodies of the same species.
(C) L4 ventral root backfill with Rhodamine-Dextran also clearly reveals both NeuN negative
and NeuN positive motor neurons.
- 69 -

vGlut1 terminal density:
0.5±0.1synapses/100µm2
vGlut1 terminal density:
0.08 synapses/100µm2
Figure 2: Motor neuron size quantification based on ChAT and NeuN expression.
(A) We performed blind motor neuron size quantification of 219 ChAT+ motor neurons.
Afterwards we checked expression of these motor neurons for NeuN in order to analyze the
size of the ChAT+;NeuN- motor neuron subpopulation compared to rest of all motor neurons.
ChAT+ motor neurons expressing no or low levels of NeuN clearly fall into a cluster of motor
neurons small in size.
(B) Motor neurons which are NeuN- and small in size receive no or very little vGlut1 input.
- 70 -

Figure 3: Analysis of small sized motor neurons in mice lacking Ia proprioceptive afferent
input and muscle spindles. (A) Complete loss of small sized motor neuron subpopulation due
to early loss of proprioceptive afferents and consequently muscle spindle differentiation in PV-
Cre;Isl2-DTX mice. (B) Reduced number of small sized Err3+;NeuN- motor neurons in
Er81-/- mutant mice exhibiting reduced muscle spindles and loss of Ia proprioceptive afferent
input. (C) Identification of Err3+;NeuN- motor neurons in the cutaneous maximus (CM) motor
neuron pool region, which does not receive monosynaptic input.
- 71 -

Figure 4: Labeling of motor neurons after nerve lesion.
(A) Retrograde labeling of motor neurons from L4 ventral roots include both large and small
motor neurons; Err3-;Rhod+;NeuN+ and Err3+;Rhod+NeuN- motor neurons respectively. (B)
2 days after quadriceps nerve lesion, ATF3 is up-regulated in motor neurons projecting to the
quadriceps muscle group. The same motor neuron subpopulation can be determined as
described in (A).
- 72 -

Figure 5: Analysis of putative gamma motor neuron fate in mice exhibiting muscle spindle
degeneration defects. 2 days after quadriceps lesion, in wild-type conditions 70%,
approximately 200 cells, of all motor neurons are ATF3+;NeuN+. Only a minor fraction of 25-
30%, approximately 70 cells, falls into the class of putative gamma motor neurons. At ~P20 in
Egr3-/- mice, almost the entire small sized putative gamma motor neuron subpopulation die;
roughly 7% of the cells are maintained (n ≥ 3 animals for each bar graph). Data (here not
shown) of a P35 Egr3-/- mutant mouse reveals that the loss of putative gamma motor neurons
is progressing slowly. At P35, still 2% of this motor neuron subpopulation is present.
- 73 -

Chapter III – SUPPLEMENT
Figure S1: As described in Figure 1A, the high Err3 expressing motor neuron
subpopulation can be co-labeled with a third motor neuron marker; Ret. The Err3+; Ret+:
motor neuron subpopulation expresses low level or no NeuN.
Figure S2: Motor neuron size quantification of motor neurons in Egr3-/- mutant mouse. The
fraction of small sized gamma motor neurons is not present anymore.
- 74 -
Role of Estrogen – Related Receptor Gamma in a Mouse Model of Amyotrophic
Lateral Sclerosis
in collaboration with
Smita Saxena & Pico Caroni
- 75 -

Amyotrophic lateral sclerosis (ALS) is a common, but only poorly
understood form of a fatal neuromuscular disease, which causes
progressive degeneration of motor neurons in the brain and spinal cord.
This process of degeneration results in worsening of paralysis and
terminates with the death of the patient.
The G93A SOD1 mouse line is a well established model to study an
inherited form of ALS. We used this mouse model in our analysis. Previous
studies described that onset and progression of disease is tightly linked to
different types of motor neuron populations, exhibiting selective temporal
axonal vulnerability. Underlying mechanisms contributing to selective
axonal vulnerability are however only poorly understood.
Here, we show that the transcription factor estrogen-related receptor
gamma (Err3), a member of the nuclear receptor superfamily, may play a
crucial role in motor neuron disease and more specifically in axonal
vulnerability. We demonstrate that mainly small sized Err3+ gamma motor
neurons resist disease progression until the mouse dies. Moreover,
SOD/Err3+/- double transgenic mice exhibit a significant decrease in muscle
strength compared to pure SOD or Err3+/- heterozygous mice. Nuclear
receptor signaling pathways were shown to control various aspects of
regulation on energy metabolism and mitochondrial biogenesis. We suggest
that the disruption of these signaling cascades are possibly more affected in
G93A/Err3+/- mice compared to pure G93A animals.
- 76 -

Chapter IV - INTRODUCTION To date, onset and progression of many neurodegenerative diseases are
only poorly understood. Two distinct forms of ALS have been described:
First, a sporadic form possibly caused by neurotoxins, heavy metals or
enzymatic dysfunctions. A second form of ALS is inherited and is therefore
called familial amyotrophic lateral sclerosis (FALS), which accounts for
approximately 5% - 10% of all ALS patients. 20% of these FALS cases
were shown to have a mutation in the gene encoding copper/zinc
superoxide dismutase (SOD1). Established mouse lines to study this
neuromuscular disease, express a human mutated form of SOD, analogous
with familial amyotrophic lateral sclerosis (ALS).
In this study, we used the G93A SOD1 fast progressing disease model,
which exhibit first clinical signs of paralysis around postnatal day P85 with a
live expectancy of these animals of 136 ± 5 days (Bruijn et al., 2004;
Gurney et al., 1994; Pun et al., 2006).
The temporal sequence of selective, reproducible synapse loss and axonal
degeneration has been well established (Pun et al., 2006). However, the
underlying molecular mechanisms leading to a selective vulnerability of
motor neurons are not characterized well to date. Generally, motor neuron
dysfunction has been linked to alterations of various cellular events such as
mitochondrial dysfunctions (Wong et al., 1995), axonal transport defects
(Collard et al., 1995) or endoplasmic reticulum stress (Nishitoh et al., 2008;
Sekine et al., 2006).
Recent studies described the involvement of key transcriptional regulators
in these metabolic abnormalities in neurodegenerative diseases. One such
gene is the peroxisome proliferator-activated receptor gamma coactivator-
1alpha (PGC-1α) (Cui et al., 2006; St-Pierre et al., 2006). Mitochondrial
metabolism is the source of many reactive oxygen species (ROS), which
can further react with oxygen to superoxide (Balaban et al., 2005).
Superoxide interacts with DNA, proteins and lipids to fulfill important cellular
functions. Therefore, the level of superoxide is crucial for regular cell
functioning and must be tightly controlled. Activation of mitochondrial
biogenesis results from transcriptional activation of PGC-1α with nuclear
receptors, for example estrogen related receptor alpha (Err1) and gamma
- 77 -

(Err3) or the nuclear respiratory factor 2 (NRF-2) in high energy demanding
tissues like heart, skeletal muscle or the nervous system (Dufour et al.,
2007; Huss et al., 2007; Leone et al., 2005; Mootha et al., 2004; Rangwala
et al., 2007; Wu et al., 1999). As we have shown in previous studies, Err3 is
selectively expressed in subpopulations of sensory and motor neurons,
hence we became interested in analyzing the role of Err3 in motor neurons
subpopulations in a disease model for ALS. We speculated that the
temporal sequence of synaptic loss in G93A SOD mice could possibly be
achieved through molecular and/or anatomical properties regulated through
nuclear receptor signaling in subsets of motor neurons.
In this study, we demonstrate the significance of Err3 expression in motor
neurons of G93A SOD mice in various aspects. We show that G93A SOD
mice carrying only a Err3+/- heterozygous allele exhibit more severe
behavioral impairments during disease progression. Moreover, many of the
neurons still present in the spinal cord at very late stage of disease in SOD
mice, express high levels of Err3 and can be clearly identified as gamma
motor neurons as described in chapter III. Our data suggest a selective role
for Err3 in metabolic processes in a mouse model for familial amyotrophic
lateral sclerosis and possibly other neurodegenerative diseases.
- 78 -

Chapter IV - RESULTS Gamma motor neurons resist until endstage of disease in ALS mice First, we aimed to identify and characterize the types of motor neurons,
which are capable to resist motor neuron disease to late stages. We
believed that it is important to know which motor neurons survive in order to
understand the selective vulnerability of motor neurons in disease in more
detail. Performing co-labeling experiments using vAChT as a motor neuron
marker (Gould et al., 2008), we were able to show that motor neurons
surviving disease to late endstage, express high levels of Err3 (Figure 1).
Comparing wild-type and SOD animals at P130, it is obvious that most
large sized motor neurons are absent in SOD mice.
We described in previous studies that gamma motor neurons can be
identified based on their cell body size and their molecular profile by
expressing high levels of Err3, but expressing only low or no levels of
NeuN. Next, we asked the question, whether this is also the case for the
remaining cells in the ventral spinal cord of the transgenic disease model.
As shown in Figure 2, the majority of all motor neurons left in the LMC in a
P130 diseased SOD mouse, are NeuN-;Err3+ small sized cells. Therefore,
we can conclude that these cells belong indeed to the category of gamma
motor neurons.
Behavioral Analysis of SOD;Err3+/- mice To address the question whether a decreased expression of Err3 has an
effect in SOD mice, we analyzed the SOD;Err3+/- double transgenic line in
more detail. Err3-/- null mice are lethal a few hours after birth and therefore
cannot be used in this approach. However, previous studies have shown
that heart defects are even present in Err3+/- heterozygous mice (Dufour et
al., 2007).
Figure 3 shows one SOD and one SOD;Err3+/- male mouse. Many of the
double transgenic animals exhibit an earlier and more severe state of
paralysis compared to pure SOD mice. Earlier paralysis was also monitored
by analyzing footprint walking patterns of wild-type, SOD and SOD;Err3+/-
- 79 -

animals as shown in Figure 4. Already at P91, SOD;Err3+/- mice show
impaired walking behavior compared to wild-type and SOD mice. Walking
patterns of SOD/Err3+/- mice analyzed at P111, show complete hindlimb
paralysis, whereas SOD mice are not as severely affected. The early
paralysis pointed us towards the direction to analyze SOD/Err3+/- mice at
earlier stages.
We performed loaded grid tests of wild-type, Err3+/-, SOD, and SOD;Err3+/-
animals from the age of 5 weeks onwards as shown in Figure 5. We
reasoned that a potential role of Err3 in SOD disease could be detected in
loaded grid tests by one-allelic deletion of Err3 function in heterozygous
animals. The loaded grid test is designed to detect muscle force changes
between mice (Barneoud et al., 1997). We detected significant muscle force
difference between male SOD and SOD;Err3+/- mice for week 5c, 6 and 10
(p < 0.02). Our results suggest that this difference is not due to impairments
of Err3+/- mice, because these animals perform in this test at least as good
as wild-type males. As illustrated by Figure 5, the muscle force difference
between SOD and SOD;Err3+/- seems to peek at the age of week 6 and 11.
Whether these time windows represent an earlier selective loss of synaptic
vesicles or a pre-onset of nerve denervation can at this point only be
speculated.
Survival analysis of SOD and SOD;Err3+/- animals Based on the Kaplan-Meier plot, we can conclude that the elimination of
one Err3 allele in SOD animals has no effect on the survival rate (Figure 6).
This can also be supported, because the most significant difference in
muscle force behavior can only be detected within a distinct time window
(week 5c, 6 and 10 Figure 5) .
- 80 -

Chapter IV - DISCUSSION
In recent years much progress has been made to better understand the motor
neuron disease familial amyotrophic lateral sclerosis (FALS). On the one
hand, studies focused on disease progression, in particular to dissect
differences of vulnerable versus resistant motor neurons. On the other hand,
much research was performed using various strategies to ameliorate disease
in mice. Compounds such as ciliary neurotrophic factor (CNTF) or growth
factors like the insulin-like growth factor 1 (Igf1) and vascular endothelial
growth factor (VEGF) have been shown to have neuroprotective properties
under pathological conditions in mouse models for ALS (Azzouz et al., 2004;
Dobrowolny et al., 2005; Kaspar et al., 2003; Pun et al., 2006; Sagot et al.,
1998). These substances, if not delivered retrograde using viral systems,
exhibit many disadvantages, such as strong side effects or the limiting access
to motor neurons (Mitchell et al., 2002). In contrast, we showed in our study
that decreasing the action of the metabolic regulator Err3 in SOD;Err3+/-
animals leads to a more severe phenotype. To our knowledge, this is the only
study in which a worsening of the phenotype of the G93A SOD motor neuron
disease model can be observed by interaction with a metabolic pathway.
Molecular features for this observation could possibly be explained by the
inability of SOD;Err3+/- motor neurons to cope with stress as efficiently as pure
SOD animals. It is tempting to speculate that the metabolic regulator Err3
plays an important role in motor neurons metabolism.
The loaded grid test analysis of Err3+/- heterozygous mice did not reveal
significant differences in muscle strength. Therefore, we can exclude that
Err3+/- heterozygous mice are less strong than wild-type animals and
therefore double transgenic SOD;Err3+/- animals mice are in fact weaker
than pure SOD mice.
Interestingly, most motor neurons in the lateral motor column, which survive
disease to the stage when the mouse dies, express high levels of Err3 and
can therefore be identified as gamma motor neurons. We speculate that Err3
may be marking disease resistant motor neurons and possibly also exhibit a
role in protecting them from disease.
Ligands for Err3 have not yet been identified. However, it is known that
tamoxifen binds to Err3 and inhibits transcription (Coward et al., 2001).
- 81 -

Inhibition of Err3 by tamoxifen injections into SOD mice, could confirm its
relevance in SOD mice as described previously using double transgenic
SOD;Err3+/- animals. Moreover, viral retrograde delivery of Err3 to all motor
neurons, might be key to success to ameliorate motor neuron disease by
providing artificially an imperative metabolic regulator.
The question remains whether our molecular and behavior analysis reflect an
earlier or more severe disease progression of SOD;Err3+/- animals. Future
experiments will address these issues and hopefully point out the significance
of metabolic regulators in neurodegenerative diseases.
- 82 -

Chapter IV – RESULTS (Figures)
Figure 1: Analysis of motor neurons in wild-type and G93A SOD mice at P130. As
shown in wild-type animals, strong Err3 expression is restricted to subsets of motor
neurons in the posterior lumbar spinal cord. Note, other motor neurons express no or low
levels of Err3. At late stages of disease, the majority of cells maintained in the spinal cord
are small sized Err3+ putative gamma motor neurons.
- 83 -

Figure 2: Gamma motor neuron cell bodies survive to endstage of SOD disease. At
late stages of disease progression, most motor neurons denervated from the periphery and
the cell bodies disappear in the spinal cord. The main fraction of motor neurons maintained
in G93A SOD mice at P130, can be clearly identified as small sized NeuN negative gamma
motor neurons in the region of the lateral motor column (LMC). Note, the presence of
ChaT+;NeuN+ motor neurons belonging to the medial motor column (MMC).
- 84 -

Figure 3: Degree of paralysis in SOD;Err3+/- (left) and pure SOD (right) mice at P125. Many SOD;
Err3+/- mice exhibit an
earlier, more severe degree
of paralysis during disease
progression and
consequently a stronger
weight loss likely due to
atrophic muscles.
P91
P111
wt SOD SOD;Err3+/- SOD SOD;Err3+/-
Figure 4: Footprints of wild-type, SOD and SOD;Err3+/- mice at intermediate and late stages of disease progression. At P91, footprint walking patterns of wild-type and SOD
mice appear to be very similar. In comparison, SOD;Err3+/- mice show at this age already
an increased stride length. At P111, the stride length of SOD mice is still very similar
compared to P91, whereas many of the SOD;Err3+/- mice already suffer of severe
paralysis.
- 85 -

Figure 5: Muscle force measurement of SOD and SOD;Err3+/- mice during disease progression. Already at early age, SOD;Err3+/- animals suffer of lower muscle strength
compared to pure SOD mice (n < 0.02 for week 5c, 6 and 10). Note, Err3+/- heterozygous
mice tend to score in this test at least as good as wild-type animals at the age analyzed. (n
= 8-15 animals for all genotypes, except for Err3+/- mice)
Figure 6: Cumulative survival plot of SOD and SOD;Err3+/- animals. There is no significant
difference in the day of
death between the two
genotypes.
n[SOD] = 12
n[SOD;Err3+/-] = 7
- 86 -

MATERIALS & METHODS List of Antibodies The neurotrophin receptor tyrosine kinase (Trk–ABs) antibodies and the
islet1 antibody were used as described in (Kramer et al., 2006).
The estrogen - related receptor gamma Err3 (Err3-AB) antibody was
purchased from Perseus Proteomics (cat. #: PP-H6812-00) and used with a
dilution of 1:100 for three consecutive nights at 4dC. As secondary antibody
the Alexa Fluorophore 488 was used from Invitrogen at 1:1000 (cat.#: A-
21131)
Upregulation of activating transcription factor 3 (ATF3) was detected 2 days
after quadriceps nerve lesion using a Santa Cruz antibody (cat. #: SC-188)
at a dilution of 1:1000.
Further antibodies used:
Goat anti ChAT; Chemicon; cat. #: AB144P; dilution 1:100
Guinea pig anti Isl1: (Kramer et al., 2006)
Guinea pig anti vGlut1: Chemicon; cat. #: AB5905; dilution 1:20’000
Mouse anti NeuN; Chemicon; cat. #: MAB 377; dilution 1:1000
Rabbit anti vAChT; Sigma; cat. #: V5387; dilution 1:1000
Rabbit anti Ret: IBL; cat. #: 18121; dilution 1:100
Rabbit anti Runx3: (Kramer et al., 2006)
Any regular secondary antibodies can be used, for example from Invitrogen
(Molecular Probes)
ISH pocedure: (Arber et al., 2000; Hippenmeyer et al., 2007; Hippenmeyer
et al., 2005).
Mouse lines used: The initial proprioceptive specific screen was performed using the Cre -
based binary genetic system (Hippenmeyer et al., 2005). Using this mouse
- 87 -

line, also most novel TrkC markers were identified. The level specific
screen was performed using the BAC TrkC-eGFP mouse line from
GENESAT. The expression of GFP was confirmed and mainly restricted to
the TrkC+ population. FACS analysis and subsequent gene expression
profiling confirmed the usefulness of this mouse line for further gene
profiling experiments. This line was used to perform the level specific DRG
screen.
The G93A SOD mouse line was purchased from the Jackson Laboratories.
Gene expression profiling of Er81-/- mutant DRG sensory neurons Due to decreased parvalbumin levels in Er81-/- mutant mice (Arber et al.,
2000), we established a method to isolate Er81-/- mutant proprioceptive
afferents by FACS using a biotinylated TrkC antibody.
Goat anti mTrkC, biotinylated; R&D, cat.#: BAF1404; dilution 1:100
Streptavidin – Allophycocyanin, eBioscience, cat. #: 17-4317-82; dilution
1:1000
Gene Expression Profiling Analysis We used two gene expression profiling softwares:
Expressionist version 5
Gene Spring version 6
Expression Profiling of <10000 cells obtained by FACS
1.) The neurons are directly sorted into lysis buffer using the Absolutely
RNA Nanoprep Kit from Stratagene (#400753)
2.) Elution is performed using elution buffer warmed up to 60°C
3.) After elution the total volume of 9.5µl is reduced using a cryo
speedvac at medium temperature 4.0µl. This process takes ideally
~5min to prevent RNA degradation.
- 88 -

Expression Profiling of a Single DRG
1.) Isolation of dextral L5 DRG in PBS
2.) Transfer of the single DRG using fine forceps to a 1.5ml reaction
tube containing 100 μl lysis buffer
3.) Continue with Absolutely RNA Nanoprep Kit from Stratagene
(#400753)
4.) After elution the total volume of 9.5µl is reduced using a cryo
speedvac at medium temperature 4.0µl. This process takes ideally
~5min to prevent RNA degradation.
Expression Profiling of 12 DRG (single embryo lumbar level)
1.) Isolation of DRG in PBS
2.) Transfer of DRG into a 1.5ml reaction tube containing PBS
3.) Removal of PBS
4.) Addition of 100 μl RLT/MeETOH
5.) Continue RNeasy Mini Kit from Qiagen (Cat. # 74104)
After isolation of RNA, the standard Affymetrix “Two Cycle Target Labeling” Method was followed (P/N 900494).
- 89 -

Fluorescent Acivated Cell Sorting
MoFlo (DAKO) high-speed 4-way cell sorter
The machine used has a 3-laser set-up: two water-cooled Coherent
EnterpriseII lasers (one Model610 emitting at 488nm and one Model653
allowing UV excitation) and one air-cooled Spectra Physics Helium-Neon
laser emitting at 633nm.
Prior the cell sorting process, the cell suspension was filtered through a self-
made 40um filter. To sort DRG sensory neurons, a 100μm nozzle was used at
20psi.
Dorsal Root Ganglia Dissection and Dissociation If a certain subpopulation of DRG will be isolated based on antibody staining using a Trk receptor antibody, then follow also blue instructions.
1.) Isolation of DRG - Ideally, the laminectomy should be performed in ice cold HBSS
medium w/o Ca2+/Mg2+.
- The FACS tube was first coated with sterile filtered FCS.
- After isolating DRG, they are transferred into a FACS tube with some
ice cold HBSS medium w/o Ca2+/Mg2+. Easiest, the DRG can be
transferred by sucking them into a 1000 µl siliconized pipette tip, from
which the tip was cut off. During collection of the DRG, the FACS tube
should be kept on ice.
- For expression profiling experiments, first all vertebral columns should
be dissected, before continuing collection of the DRG. In the
- 90 -

meanwhile, the vertebral columns should be covered with HBSS
medium w/o Ca2+/Mg2+ medium in a Petri dish, which also should be
kept on ice.
2.) Trypsin / Collagenase H Treatment - The HBSS solution must be removed. Use a fine pipette in order to
remove most of the supernatant, carefully. Avoid loosing DRG or
tissue.
- Add 1 ml 0.25% trypsin solution and 100 µl Collagenase H enzyme
solution (final concentration 0.1%). Thaw the enzyme right before use.
- Mix gently by flipping with fingers the bottom of the tube.
- Incubate the mix for 10 minutes at 37°C. Occasionally, flip the tube
carefully.
- Stop digestion by adding 2.5 ml HBSS.
- Mix gently and centrifuge the mix for 7 minutes at 800 rpm.
- Discard the supernatant using a fine pipette.
- Resuspend the pellet in 1 ml ice cold HBSS medium w/o Ca2+/Mg2+. Do
not wonder if cell clumps are formed.
3.) Trituration
- Dissociate cells by drawing them through a fire – polished Pasteur
pipette tip and expelling them along the Falcon tube. Repeat this step
approximately 20 times until the tissue is dissociated.
- 91 -

- Check under the binocular dissecting microscope if a single cell
suspension is obtained. Otherwise, the dissociation step might be
repeated.
- Centrifuge cells for 7 minutes at 800 rpm and take off as much
supernatant as possible.
- 1st Antibody: Add up to 1 ml PBS and incubate for 1 h on ice with 40 ul
biotinylated anti mTrkC AB (1:25)
- Gently turn the suspension once in a while.
- Centrifuge cells for 7 minutes at 800 rpm and take off as much
supernatant as possible.
- Add 750 ul PBS shake and centrifuge cells for 7 minutes at 800 rpm.
Take off as much supernatant as possible.
- 2ary Antibody: Add up to 400 ul PBS and incubate for 15 minutes on ice
with 1 ul streptavidin-Allophycocyanin (1:400).
- Centrifuge cells for 7 minutes at 800 rpm and take off as much
supernatant as possible.
- Add 1 ml PBS to the suspension, centrifuge cells for 7 minutes at 800
rpm and take off as much supernatant as possible.
- Add 2 ml PBS to the suspension and turn the suspension for
approximately 15 min in the cold room using a turning wheel.
- Centrifuge the cells for 7 minutes at 800 rpm, discard the supernatant
and resuspend the pellet in an appropriate medium for further use (eg
HBSS or PBS). After dissociation of the pellet check under the
binocular again, whether a single cell suspension is maintained.
- 92 -

Material
• Binocular dissecting microscope
• Dissection tools
• Incubator 37°C
• 1000 µl pipette with regular and siliconized tips
• Centrifuge for 15 mlreaction tubes, 800 rpm
• Fire – polished Pasteur pipette
• Turning Wheel
Media / Solutions
• Hank’s modified solution, Hank’s balanced salt solution (HBSS)
medium w/o Ca2+/Mg2+, Gibco Nr. 14170-138, store at 4°C
• Fetal Calf Serum, Amimed, Bioconcepts, 500 ml, heat inactivate for 30
minutes in 56°C, store at -20°C in appropriate aliquots
• Trypsin 0.25%, Amimed, Bioconcepts Nr. 5-50 F00-H07, 100 ml, or
Sigma Nr. T-8253, store at -20°C in appropriate aliquots
• 1 g Collagenase H, Boehringer Mannheim Nr. 1074032, dilute to 1% in
HBSS medium w/o Ca2+/Mg2+, sterilization of the medium through 0.45
µm filter under a laminar flow hood, store 100 µl aliquots at -20°C
- 93 -

Appendix – FURTHER INTERESTING GENE EXPRESSION PROFILES Our gene expression studies led to the identification of various genes and
gene expression patterns mainly discussed throughout this thesis. In the
following paragraph, further genes and gene families with enriched
expression in the proprioceptive afferent population will be listed and briefly
discussed.
Right bar TrkC+ population,- blue bar TrkC- DRG sensory neurons, mainly cutaneous
afferents:
Cadherin 13
Expression not restricted to TrkC population –
remaining signal on TrkC-/- mutant tissue.
Chromogranin B Expression not restricted to TrkC population –
remaining signal on TrkC-/- mutant tissue.
Protocadherin 8
Clear expression in subpopulations of
proprioceptive afferents.
One cut domain, family member 1 Some signal left on TrkC-/- mutant tissue.
Thyroid hormone receptor interactor 10
Expression not restricted to TrkC+ population –
remaining signal on TrkC-/- mutant tissue.
- 94 -

G-protein coupled receptor 97
Expression restricted to the proprioceptive
afferent population.
Down-regulated on Er81-/- mutant tissue.
Figure 24: Genes with enriched expression in proprioceptive afferents.
In-Situ Hybridization Experiments of Protocadherin 8
Figure 25: Expression of
Protocadherin 8 in subpopulation of
lumbar proprioceptive afferents.
- 95 -

Semaphorin and Plexin Expression Sema – Plexin interactions are mainly known as repulsive guidance events.
As described throughout this thesis, functional specificity in the sensory -
motor system is highly selective and until to date only poorly understood.
Recent work also focuses on interactions within the sensory - motor system
mediated by Sema – Plexin signaling (Chauvet et al., 2007; Gu et al.,
2005).
In our screen we were able to identify a number of such genes potentially
involved in the generation of specific connections between proprioceptive
afferents and motor neurons in the spinal cord. Afterwards, PlexinA1 has
been described to be expressed by proprioceptive DRG neurons and to be
involved in the segregation of proprioceptive afferents in the spinal cord
(Yoshida et al., 2006). Recent work from our lab suggests that PlexinD1–
Sema3E signaling plays a role in gating specific sensory to motor
connections (Pecho-Vrieseling et al, unpublished observation).
Interestingly, there are still a number of similar molecules expressed by
DRG neurons, with enriched expression in proprioceptive, but also
cutaneous subpopulations.
Surprisingly, Plexins are not exclusively expressed by proprioceptive
afferents and the corresponding Sema molecules within the target area.
Our screen also reveals expression of certain semaphorins with enriched
expression in proprioceptive afferents: Sema5a (46fold), Sema3d (11fold),
Sema3a (14fold) enrichment. Future studies will be necessary to dissect the
diverse mechanisms of other Sema – Plexin signaling cascades involved in
the formation of sensory – motor connectivity in the spinal cord.
- 96 -

GABA Receptor Subunit Expression We identified GABA A receptor, subunit gamma 1 (Gabrg1) to be
expressed in subpopulations of proprioceptive afferents with enriched
expression in L5 and C7 DRG as previously discussed and also validated
by ISH experiments. Further, our gene expression analysis reveals Gabra5
to be expressed by proprioceptive afferents in all rostro to caudal DRG. In
contrast, the GABA BR 1, GABA BR binding proteins and GABA AR
associated protein are expressed on high levels by all DRG sensory
neurons, without particular expression patterns.
Figure 26: Heat map of GABA receptor gene expression profiles in anterior to posterior
DRG sensory neuron subpopulations. Red squares indicate high expression; blue squares
indicate low expression. Left squares represent the profile of expression of posterior DRG,
right squares represent the expression of anterior DRG, separated in triplicates of the
GFP+;TrkC+ and GFP- cell population.
- 97 -

Hox Gene Expression in DRG Sensory Neurons
Figure 27: Expression of Hox genes in DRG sensory neuron subpopulations. Note, the
expression of some Hox genes in specific subpopulations of DRG or in anterior to posterior
restricted patterns (Colors in bar graphs match with colors and segmental levels in Figure
15).
- 98 -

Sodium and Potassium Channel Specificity in DRG Sensory Neurons The following section summarizes the expression patterns of voltage-gated
sodium and potassium channels in DRG sensory neurons (for detailed
information read ‘Channel Specificity in DRG Sensory Neurons’; page 54).
- 99 -

100
E16.5: 20 fold TrkC specificE16.5: 6 fold down-regulated in Er81-/- mutant miceE14.5: 7 fold TrkC specificE14.5: ~40% up regulated Er81-/- mutant miceP0: 27 fold TrkC specific
66
P0: highly TrkC specific on all rostro - caudal levels
E16.5: highly TrkC specificP0: only 3 fold TrkC specific considering L1 – L5 TrkC+ cells
P0: enriched expression in TrkC cells at levels C7 and L5
Sodium Channel Expression

101
Sodium Channel Expression
P0: highly enriched in all DRG SNs at spinal level C7E16.5: expression 50% reduced in TrkC- cells (also sodium-gated, type II, beta)
66
Not TrkC cell specific at E16.5At P0 still 14 fold specific to TrkC- cells
Not TrkC cell specific at E16.5At P0 still 14 fold specific to TrkC- cells

102
Sodium Channel Expression
Down regulated at E16.5 in Er81-/- mutant proprioceptive afferents,but not yet at E14.5.
Highly expressed at E14.5 in TrkC+ cells and low in TrkC- cells, down regulated at E16.5 in TrkC+ cells,-P0: still 9 fold TrkC specific

103
Sodium Channel Expression
Highly expressed in all DRG SNs at E16.5 & E14.5 in wt and Er81-/- mutants

104
Potassium Channel Expression
Expression increases from E14.5 until P0, TrkC specificP0: 75 fold TrkC specific, high raw valuesE16.5: 50% down regulated in Er81-/- mutant TrkC cells, not yet at E14.5
Specific expression to proprioceptive afferents, with decreased expression to caudal levels.
66

105
Potassium Channel Expression
P0: Enriched expression to cutaneous afferentsubpopulation.
66
Not TrkC specific, but 3 fold up regulated in Er81-/- mutant TrkC cells at E16.5
potassium channel, subfamily T, member 1Highly enriched to the TrkC- cell populations at E14.5 and E16.52 fold up in Er81-/- mutant TrkC cells at E16.5

106
Potassium Channel Expression
In wild-type Kvcnip1 is higher expressed at E14.5 compared to E16.5, whereas it is not TrkC specifically regulated Interestingly, it is up regulated at E16.5 in TrkC cells and in non-TrkC cells
In contrast Kvcnip2 is TrkC specifically regulated. It is also ~50% down regulated in Er81-/- mutant TrkC cells. (other Kv channel interacting proteins are not present on the chips)
66
Kv channel-interacting proteins also exhibit interesting expression pattterns with enriched expression to distinct DRG subpopulations.

Appendix – REFERENCES
Allan, E.H., K.D. Hausler, T. Wei, J.H. Gooi, J.M. Quinn, B. Crimeen-Irwin, S. Pompolo, N.A. Sims, M.T. Gillespie, J.E. Onyia, and T.J. Martin. 2008. EphrinB2 regulation by PTH and PTHrP revealed by molecular profiling in differentiating osteoblasts. J Bone Miner Res. 23:1170-81.
Altman, J., and S.A. Bayer. 1984. The development of the rat spinal cord. Adv Anat Embryol Cell Biol. 85:1-164.
Anderson, D.J. 1999. Lineages and transcription factors in the specification of vertebrate primary sensory neurons. Curr Opin Neurobiol. 9:517-24.
Arber, S., D.R. Ladle, J.H. Lin, E. Frank, and T.M. Jessell. 2000. ETS gene Er81 controls the formation of functional connections between group Ia sensory afferents and motor neurons. Cell. 101:485-98.
Arlotta, P., B.J. Molyneaux, J. Chen, J. Inoue, R. Kominami, and J.D. Macklis. 2005. Neuronal subtype-specific genes that control corticospinal motor neuron development in vivo. Neuron. 45:207-21.
Arndt, K., S. Nakagawa, M. Takeichi, and C. Redies. 1998. Cadherin-defined segments and parasagittal cell ribbons in the developing chicken cerebellum. Mol Cell Neurosci. 10:211-28.
Averill, S., D.R. Davis, P.J. Shortland, J.V. Priestley, and S.P. Hunt. 2002. Dynamic pattern of reg-2 expression in rat sensory neurons after peripheral nerve injury. J Neurosci. 22:7493-501.
Bagri, A., O. Marin, A.S. Plump, J. Mak, S.J. Pleasure, J.L. Rubenstein, and M. Tessier-Lavigne. 2002. Slit proteins prevent midline crossing and determine the dorsoventral position of major axonal pathways in the mammalian forebrain. Neuron. 33:233-48.
Balaban, R.S., S. Nemoto, and T. Finkel. 2005. Mitochondria, oxidants, and aging. Cell. 120:483-95.
Barneoud, P., J. Lolivier, D.J. Sanger, B. Scatton, and P. Moser. 1997. Quantitative motor assessment in FALS mice: a longitudinal study. Neuroreport. 8:2861-5.
Baudet, C., A. Mikaels, H. Westphal, J. Johansen, T.E. Johansen, and P. Ernfors. 2000. Positive and negative interactions of GDNF, NTN and ART in developing sensory neuron subpopulations, and their collaboration with neurotrophins. Development. 127:4335-44.
Beck, K.D., L. Powell-Braxton, H.R. Widmer, J. Valverde, and F. Hefti. 1995. Igf1 gene disruption results in reduced brain size, CNS
- 107 -

hypomyelination, and loss of hippocampal granule and striatal parvalbumin-containing neurons. Neuron. 14:717-30.
Bjarnadottir, T.K., R. Fredriksson, P.J. Hoglund, D.E. Gloriam, M.C. Lagerstrom, and H.B. Schioth. 2004. The human and mouse repertoire of the adhesion family of G-protein-coupled receptors. Genomics. 84:23-33.
Boggon, T.J., J. Murray, S. Chappuis-Flament, E. Wong, B.M. Gumbiner, and L. Shapiro. 2002. C-cadherin ectodomain structure and implications for cell adhesion mechanisms. Science. 296:1308-13.
Bononi, J., A. Cole, P. Tewson, A. Schumacher, and R. Bradley. 2008. Chicken protocadherin-1 functions to localize neural crest cells to the dorsal root ganglia during PNS formation. Mech Dev.
Brose, K., K.S. Bland, K.H. Wang, D. Arnott, W. Henzel, C.S. Goodman, M. Tessier-Lavigne, and T. Kidd. 1999. Slit proteins bind Robo receptors and have an evolutionarily conserved role in repulsive axon guidance. Cell. 96:795-806.
Bruijn, L.I., T.M. Miller, and D.W. Cleveland. 2004. Unraveling the mechanisms involved in motor neuron degeneration in ALS. Annu Rev Neurosci. 27:723-49.
Camarero, G., C. Avendano, C. Fernandez-Moreno, A. Villar, J. Contreras, F. de Pablo, J.G. Pichel, and I. Varela-Nieto. 2001. Delayed inner ear maturation and neuronal loss in postnatal Igf-1-deficient mice. J Neurosci. 21:7630-41.
Carroll, P., O. Gayet, C. Feuillet, S. Kallenbach, B. de Bovis, K. Dudley, and S. Alonso. 2001. Juxtaposition of CNR protocadherins and reelin expression in the developing spinal cord. Mol Cell Neurosci. 17:611-23.
Carroll, S.L., I. Silos-Santiago, S.E. Frese, K.G. Ruit, J. Milbrandt, and W.D. Snider. 1992. Dorsal root ganglion neurons expressing trk are selectively sensitive to NGF deprivation in utero. Neuron. 9:779-88.
Catterall, W.A., A.L. Goldin, and S.G. Waxman. 2005. International Union of Pharmacology. XLVII. Nomenclature and structure-function relationships of voltage-gated sodium channels. Pharmacol Rev. 57:397-409.
Chahine, M., R. Ziane, K. Vijayaragavan, and Y. Okamura. 2005. Regulation of Na v channels in sensory neurons. Trends Pharmacol Sci. 26:496-502.
Chang, Q., M. Gonzalez, M.J. Pinter, and R.J. Balice-Gordon. 1999. Gap junctional coupling and patterns of connexin expression among neonatal rat lumbar spinal motor neurons. J Neurosci. 19:10813-28.
- 108 -

Chauvet, S., S. Cohen, Y. Yoshida, L. Fekrane, J. Livet, O. Gayet, L. Segu, M.C. Buhot, T.M. Jessell, C.E. Henderson, and F. Mann. 2007. Gating of Sema3E/PlexinD1 signaling by neuropilin-1 switches axonal repulsion to attraction during brain development. Neuron. 56:807-22.
Chen, C.L., D.C. Broom, Y. Liu, J.C. de Nooij, Z. Li, C. Cen, O.A. Samad, T.M. Jessell, C.J. Woolf, and Q. Ma. 2006. Runx1 determines nociceptive sensory neuron phenotype and is required for thermal and neuropathic pain. Neuron. 49:365-77.
Chen, H.H., S. Hippenmeyer, S. Arber, and E. Frank. 2003. Development of the monosynaptic stretch reflex circuit. Curr Opin Neurobiol. 13:96-102.
Chen, H.H., W.G. Tourtellotte, and E. Frank. 2002. Muscle spindle-derived neurotrophin 3 regulates synaptic connectivity between muscle sensory and motor neurons. J Neurosci. 22:3512-9.
Chen, Z., B.B. Gore, H. Long, L. Ma, and M. Tessier-Lavigne. 2008. Alternative splicing of the Robo3 axon guidance receptor governs the midline switch from attraction to repulsion. Neuron. 58:325-32.
Chiu, S.L., C.M. Chen, and H.T. Cline. 2008. Insulin receptor signaling regulates synapse number, dendritic plasticity, and circuit function in vivo. Neuron. 58:708-19.
Collard, J.F., F. Cote, and J.P. Julien. 1995. Defective axonal transport in a transgenic mouse model of amyotrophic lateral sclerosis. Nature. 375:61-4.
Cox, P.J., T. Pitcher, S.A. Trim, C.H. Bell, W. Qin, and R.A. Kinloch. 2008. The effect of deletion of the orphan G - protein coupled receptor (GPCR) gene MrgE on pain-like behaviours in mice. Mol Pain. 4:2.
Cui, L., H. Jeong, F. Borovecki, C.N. Parkhurst, N. Tanese, and D. Krainc. 2006. Transcriptional repression of PGC-1alpha by mutant huntingtin leads to mitochondrial dysfunction and neurodegeneration. Cell. 127:59-69.
Dasen, J.S., A. De Camilli, B. Wang, P.W. Tucker, and T.M. Jessell. 2008. Hox repertoires for motor neuron diversity and connectivity gated by a single accessory factor, FoxP1. Cell. 134:304-16.
Dasen, J.S., B.C. Tice, S. Brenner-Morton, and T.M. Jessell. 2005. A Hox regulatory network establishes motor neuron pool identity and target-muscle connectivity. Cell. 123:477-91.
De Calisto, J., C. Araya, L. Marchant, C.F. Riaz, and R. Mayor. 2005. Essential role of non-canonical Wnt signalling in neural crest migration. Development. 132:2587-97.
- 109 -

Dobrowolny, G., C. Giacinti, L. Pelosi, C. Nicoletti, N. Winn, L. Barberi, M. Molinaro, N. Rosenthal, and A. Musaro. 2005. Muscle expression of a local Igf-1 isoform protects motor neurons in an ALS mouse model. J Cell Biol. 168:193-9.
Dong, X., S. Han, M.J. Zylka, M.I. Simon, and D.J. Anderson. 2001. A diverse family of GPCRs expressed in specific subsets of nociceptive sensory neurons. Cell. 106:619-32.
Dufour, C.R., B.J. Wilson, J.M. Huss, D.P. Kelly, W.A. Alaynick, M. Downes, R.M. Evans, M. Blanchette, and V. Giguere. 2007. Genome-wide orchestration of cardiac functions by the orphan nuclear receptors ERRalpha and gamma. Cell Metab. 5:345-56.
Dupuis, L., M. Pehar, P. Cassina, F. Rene, R. Castellanos, C. Rouaux, M. Gandelman, L. Dimou, M.E. Schwab, J.P. Loeffler, L. Barbeito, and J.L. Gonzalez de Aguilar. 2008. Nogo receptor antagonizes p75NTR-dependent motor neuron death. Proc Natl Acad Sci U S A. 105:740-5.
Eccles, J.C., R.M. Eccles, and A. Lundberg. 1957. The convergence of monosynaptic excitatory afferents on to many different species of alpha motoneurones. J Physiol. 137:22-50.
Ehrhard, P.B., and U. Otten. 1994. Postnatal ontogeny of the neurotrophin receptors trk and trkB mRNA in rat sensory and sympathetic ganglia. Neurosci Lett. 166:207-10.
Ernfors, P., K.F. Lee, J. Kucera, and R. Jaenisch. 1994. Lack of neurotrophin-3 leads to deficiencies in the peripheral nervous system and loss of limb proprioceptive afferents. Cell. 77:503-12.
Finck, B.N. 2006. Effects of PPARalpha on cardiac glucose metabolism: a transcriptional equivalent of the glucose-fatty acid cycle? Expert Rev Cardiovasc Ther. 4:161-71.
Finck, B.N., and D.P. Kelly. 2006. PGC-1 coactivators: inducible regulators of energy metabolism in health and disease. J Clin Invest. 116:615-22.
Gehring, W.J. 1993. Exploring the homeobox. Gene. 135:215-21.
Gilman, A.G. 1987. G proteins: transducers of receptor-generated signals. Annu Rev Biochem. 56:615-49.
Goldfarb, M., J. Schoorlemmer, A. Williams, S. Diwakar, Q. Wang, X. Huang, J. Giza, D. Tchetchik, K. Kelley, A. Vega, G. Matthews, P. Rossi, D.M. Ornitz, and E. D'Angelo. 2007. Fibroblast growth factor homologous factors control neuronal excitability through modulation of voltage-gated sodium channels. Neuron. 55:449-63.
- 110 -

Gould, T.W., S. Yonemura, R.W. Oppenheim, S. Ohmori, and H. Enomoto. 2008. The neurotrophic effects of glial cell line-derived neurotrophic factor on spinal motoneurons are restricted to fusimotor subtypes. J Neurosci. 28:2131-46.
Gu, C., Y. Yoshida, J. Livet, D.V. Reimert, F. Mann, J. Merte, C.E. Henderson, T.M. Jessell, A.L. Kolodkin, and D.D. Ginty. 2005. Semaphorin 3E and plexin-D1 control vascular pattern independently of neuropilins. Science. 307:265-8.
Guo, J., U.I. Chung, H. Kondo, F.R. Bringhurst, and H.M. Kronenberg. 2002. The PTH/PTHrP receptor can delay chondrocyte hypertrophy in vivo without activating phospholipase C. Dev Cell. 3:183-94.
Gurney, M.E., H. Pu, A.Y. Chiu, M.C. Dal Canto, C.Y. Polchow, D.D. Alexander, J. Caliendo, A. Hentati, Y.W. Kwon, H.X. Deng, and et al. 1994. Motor neuron degeneration in mice that express a human Cu,Zn superoxide dismutase mutation. Science. 264:1772-5.
Haase, G., E. Dessaud, A. Garces, B. de Bovis, M. Birling, P. Filippi, H. Schmalbruch, S. Arber, and O. deLapeyriere. 2002. GDNF acts through PEA3 to regulate cell body positioning and muscle innervation of specific motor neuron pools. Neuron. 35:893-905.
Hall, A.C., F.R. Lucas, and P.C. Salinas. 2000. Axonal remodeling and synaptic differentiation in the cerebellum is regulated by WNT-7a signaling. Cell. 100:525-35.
Harada, Y., C. Yokota, R. Habas, D.C. Slusarski, and X. He. 2007. Retinoic acid-inducible G protein-coupled receptors bind to frizzled receptors and may activate non-canonical Wnt signaling. Biochem Biophys Res Commun. 358:968-75.
Hatabu, H., J. Gaa, D. Kim, W. Li, P.V. Prasad, and R.R. Edelman. 1996. Pulmonary perfusion: qualitative assessment with dynamic contrast-enhanced MRI using ultra-short TE and inversion recovery turbo FLASH. Magn Reson Med. 36:503-8.
Hippenmeyer, S., R.M. Huber, D.R. Ladle, K. Murphy, and S. Arber. 2007. ETS transcription factor Erm controls subsynaptic gene expression in skeletal muscles. Neuron. 55:726-40.
Hippenmeyer, S., N.A. Shneider, C. Birchmeier, S.J. Burden, T.M. Jessell, and S. Arber. 2002. A role for neuregulin1 signaling in muscle spindle differentiation. Neuron. 36:1035-49.
Hippenmeyer, S., E. Vrieseling, M. Sigrist, T. Portmann, C. Laengle, D.R. Ladle, and S. Arber. 2005. A developmental switch in the response of DRG neurons to ETS transcription factor signaling. PLoS Biol. 3:e159.
- 111 -
Huang, E.J., and L.F. Reichardt. 2003. Trk receptors: roles in neuronal signal transduction. Annu Rev Biochem. 72:609-42.
Huang, W.L., D. Robson, M.C. Liu, V.R. King, S. Averill, P.J. Shortland, and J.V. Priestley. 2006. Spinal cord compression and dorsal root injury cause up-regulation of activating transcription factor-3 in large-diameter dorsal root ganglion neurons. Eur J Neurosci. 23:273-8.
Huss, J.M., K. Imahashi, C.R. Dufour, C.J. Weinheimer, M. Courtois, A. Kovacs, V. Giguere, E. Murphy, and D.P. Kelly. 2007. The nuclear receptor ERRalpha is required for the bioenergetic and functional adaptation to cardiac pressure overload. Cell Metab. 6:25-37.
Huss, J.M., I.P. Torra, B. Staels, V. Giguere, and D.P. Kelly. 2004. Estrogen-related receptor alpha directs peroxisome proliferator-activated receptor alpha signaling in the transcriptional control of energy metabolism in cardiac and skeletal muscle. Mol Cell Biol. 24:9079-91.
Ichiyama, R.M., J. Broman, V.R. Edgerton, and L.A. Havton. 2006. Ultrastructural synaptic features differ between alpha- and gamma-motoneurons innervating the tibialis anterior muscle in the rat. J Comp Neurol. 499:306-15.
Inoue, T., T. Tanaka, S.C. Suzuki, and M. Takeichi. 1998. Cadherin-6 in the developing mouse brain: expression along restricted connection systems and synaptic localization suggest a potential role in neuronal circuitry. Dev Dyn. 211:338-51.
Ito, Y. 2004. Oncogenic potential of the RUNX gene family: 'overview'. Oncogene. 23:4198-208.
Jessell, T.M. 2000. Neuronal specification in the spinal cord: inductive signals and transcriptional codes. Nat Rev Genet. 1:20-9.
Jones, D.M., B.A. Tucker, M. Rahimtula, and K.M. Mearow. 2003. The synergistic effects of NGF and IGF-1 on neurite growth in adult sensory neurons: convergence on the PI 3-kinase signaling pathway. J Neurochem. 86:1116-28.
Kidd, T., K.S. Bland, and C.S. Goodman. 1999. Slit is the midline repellent for the robo receptor in Drosophila. Cell. 96:785-94.
Kiehn, O. 2006. Locomotor circuits in the mammalian spinal cord. Annu Rev Neurosci. 29:279-306.
Klein, R., I. Silos-Santiago, R.J. Smeyne, S.A. Lira, R. Brambilla, S. Bryant, L. Zhang, W.D. Snider, and M. Barbacid. 1994. Disruption of the neurotrophin-3 receptor gene trkC eliminates la muscle afferents and results in abnormal movements. Nature. 368:249-51.
- 112 -

Klur, S., K. Toy, M.P. Williams, and U. Certa. 2004. Evaluation of procedures for amplification of small-size samples for hybridization on microarrays. Genomics. 83:508-17.
Kobayashi, T., U.I. Chung, E. Schipani, M. Starbuck, G. Karsenty, T. Katagiri, D.L. Goad, B. Lanske, and H.M. Kronenberg. 2002. PTHrP and Indian hedgehog control differentiation of growth plate chondrocytes at multiple steps. Development. 129:2977-86.
Kohmura, N., K. Senzaki, S. Hamada, N. Kai, R. Yasuda, M. Watanabe, H. Ishii, M. Yasuda, M. Mishina, and T. Yagi. 1998. Diversity revealed by a novel family of cadherins expressed in neurons at a synaptic complex. Neuron. 20:1137-51.
Kramer, I., M. Sigrist, J.C. de Nooij, I. Taniuchi, T.M. Jessell, and S. Arber. 2006. A role for Runx transcription factor signaling in dorsal root ganglion sensory neuron diversification. Neuron. 49:379-93.
Krylova, O., J. Herreros, K.E. Cleverley, E. Ehler, J.P. Henriquez, S.M. Hughes, and P.C. Salinas. 2002. WNT-3, expressed by motoneurons, regulates terminal arborization of neurotrophin-3-responsive spinal sensory neurons. Neuron. 35:1043-56.
Kucera, J., G. Fan, R. Jaenisch, S. Linnarsson, and P. Ernfors. 1995. Dependence of developing group Ia afferents on neurotrophin-3. J Comp Neurol. 363:307-20.
Landmesser, L.T. 2001. The acquisition of motoneuron subtype identity and motor circuit formation. Int J Dev Neurosci. 19:175-82.
Leinninger, G.M., C. Backus, M.D. Uhler, S.I. Lentz, and E.L. Feldman. 2004. Phosphatidylinositol 3-kinase and Akt effectors mediate insulin-like growth factor-I neuroprotection in dorsal root ganglia neurons. FASEB J. 18:1544-6.
Leone, T.C., J.J. Lehman, B.N. Finck, P.J. Schaeffer, A.R. Wende, S. Boudina, M. Courtois, D.F. Wozniak, N. Sambandam, C. Bernal-Mizrachi, Z. Chen, J.O. Holloszy, D.M. Medeiros, R.E. Schmidt, J.E. Saffitz, E.D. Abel, C.F. Semenkovich, and D.P. Kelly. 2005. PGC-1alpha deficiency causes multi-system energy metabolic derangements: muscle dysfunction, abnormal weight control and hepatic steatosis. PLoS Biol. 3:e101.
Levanon, D., D. Bettoun, C. Harris-Cerruti, E. Woolf, V. Negreanu, R. Eilam, Y. Bernstein, D. Goldenberg, C. Xiao, M. Fliegauf, E. Kremer, F. Otto, O. Brenner, A. Lev-Tov, and Y. Groner. 2002. The Runx3 transcription factor regulates development and survival of TrkC dorsal root ganglia neurons. EMBO J. 21:3454-63.
- 113 -

Lin, J.H., T. Saito, D.J. Anderson, C. Lance-Jones, T.M. Jessell, and S. Arber. 1998. Functionally related motor neuron pool and muscle sensory afferent subtypes defined by coordinate ETS gene expression. Cell. 95:393-407.
Livet, J., M. Sigrist, S. Stroebel, V. De Paola, S.R. Price, C.E. Henderson, T.M. Jessell, and S. Arber. 2002. ETS gene Pea3 controls the central position and terminal arborization of specific motor neuron pools. Neuron. 35:877-92.
Loconto, J., F. Papes, E. Chang, L. Stowers, E.P. Jones, T. Takada, A. Kumanovics, K. Fischer Lindahl, and C. Dulac. 2003. Functional expression of murine V2R pheromone receptors involves selective association with the M10 and M1 families of MHC class Ib molecules. Cell. 112:607-18.
Luo, W., S.R. Wickramasinghe, J.M. Savitt, J.W. Griffin, T.M. Dawson, and D.D. Ginty. 2007. A hierarchical NGF signaling cascade controls Ret-dependent and Ret-independent events during development of nonpeptidergic DRG neurons. Neuron. 54:739-54.
Luscher, H.R., J. Mathis, and E. Henneman. 1984. Wiring diagrams of functional connectivity in monosynaptic reflex arcs of the spinal cord. Neurosci Lett. 45:217-22.
Ma, L., and M. Tessier-Lavigne. 2007. Dual branch-promoting and branch-repelling actions of Slit/Robo signaling on peripheral and central branches of developing sensory axons. J Neurosci. 27:6843-51.
Ma, Q., C. Fode, F. Guillemot, and D.J. Anderson. 1999. Neurogenin1 and neurogenin2 control two distinct waves of neurogenesis in developing dorsal root ganglia. Genes Dev. 13:1717-28.
MacLean, H.E., and H.M. Kronenberg. 2005. Localization of Indian hedgehog and PTH/PTHrP receptor expression in relation to chondrocyte proliferation during mouse bone development. Dev Growth Differ. 47:59-63.
Makarenkova, H., H. Sugiura, K. Yamagata, and G. Owens. 2005. Alternatively spliced variants of protocadherin 8 exhibit distinct patterns of expression during mouse development. Biochim Biophys Acta. 1681:150-6.
McConnell, S.K. 1995. Strategies for the generation of neuronal diversity in the developing central nervous system. J Neurosci. 15:6987-98.
Mears, S.C., and E. Frank. 1997. Formation of specific monosynaptic connections between muscle spindle afferents and motoneurons in the mouse. J Neurosci. 17:3128-35.
- 114 -

Mentis, G.Z., F.J. Alvarez, A. Bonnot, D.S. Richards, D. Gonzalez-Forero, R. Zerda, and M.J. O'Donovan. 2005. Noncholinergic excitatory actions of motoneurons in the neonatal mammalian spinal cord. Proc Natl Acad Sci U S A. 102:7344-9.
Milner, L.D., and L.T. Landmesser. 1999. Cholinergic and GABAergic inputs drive patterned spontaneous motoneuron activity before target contact. J Neurosci. 19:3007-22.
Molliver, D.C., D.E. Wright, M.L. Leitner, A.S. Parsadanian, K. Doster, D. Wen, Q. Yan, and W.D. Snider. 1997. IB4-binding DRG neurons switch from NGF to GDNF dependence in early postnatal life. Neuron. 19:849-61.
Mootha, V.K., C. Handschin, D. Arlow, X. Xie, J. St Pierre, S. Sihag, W. Yang, D. Altshuler, P. Puigserver, N. Patterson, P.J. Willy, I.G. Schulman, R.A. Heyman, E.S. Lander, and B.M. Spiegelman. 2004. Erralpha and Gabpa/b specify PGC-1alpha-dependent oxidative phosphorylation gene expression that is altered in diabetic muscle. Proc Natl Acad Sci U S A. 101:6570-5.
Morris, C.E., and P.F. Juranka. 2007. Nav channel mechanosensitivity: activation and inactivation accelerate reversibly with stretch. Biophys J. 93:822-33.
Myers, C.P., J.W. Lewcock, M.G. Hanson, S. Gosgnach, J.B. Aimone, F.H. Gage, K.F. Lee, L.T. Landmesser, and S.L. Pfaff. 2005. Cholinergic input is required during embryonic development to mediate proper assembly of spinal locomotor circuits. Neuron. 46:37-49.
Nelson, S.B., K. Sugino, and C.M. Hempel. 2006. The problem of neuronal cell types: a physiological genomics approach. Trends Neurosci. 29:339-45.
Nguyen-Ba-Charvet, K.T., N. Picard-Riera, M. Tessier-Lavigne, A. Baron-Van Evercooren, C. Sotelo, and A. Chedotal. 2004. Multiple roles for slits in the control of cell migration in the rostral migratory stream. J Neurosci. 24:1497-506.
Nishimaru, H., C.E. Restrepo, J. Ryge, Y. Yanagawa, and O. Kiehn. 2005. Mammalian motor neurons corelease glutamate and acetylcholine at central synapses. Proc Natl Acad Sci U S A. 102:5245-9.
Nishimune, H., S. Vasseur, S. Wiese, M.C. Birling, B. Holtmann, M. Sendtner, J.L. Iovanna, and C.E. Henderson. 2000. Reg-2 is a motoneuron neurotrophic factor and a signalling intermediate in the CNTF survival pathway. Nat Cell Biol. 2:906-14.
Nishitoh, H., H. Kadowaki, A. Nagai, T. Maruyama, T. Yokota, H. Fukutomi, T. Noguchi, A. Matsuzawa, K. Takeda, and H. Ichijo. 2008. ALS-linked
- 115 -

mutant SOD1 induces ER stress- and ASK1-dependent motor neuron death by targeting Derlin-1. Genes Dev. 22:1451-64.
Oakley, R.A., F.B. Lefcort, D.O. Clary, L.F. Reichardt, D. Prevette, R.W. Oppenheim, and E. Frank. 1997. Neurotrophin-3 promotes the differentiation of muscle spindle afferents in the absence of peripheral targets. J Neurosci. 17:4262-74.
Ogiwara, I., H. Miyamoto, N. Morita, N. Atapour, E. Mazaki, I. Inoue, T. Takeuchi, S. Itohara, Y. Yanagawa, K. Obata, T. Furuichi, T.K. Hensch, and K. Yamakawa. 2007. Na(v)1.1 localizes to axons of parvalbumin-positive inhibitory interneurons: a circuit basis for epileptic seizures in mice carrying an Scn1a gene mutation. J Neurosci. 27:5903-14.
Ornung, G., O.P. Ottersen, S. Cullheim, and B. Ulfhake. 1998. Distribution of glutamate-, glycine- and GABA-immunoreactive nerve terminals on dendrites in the cat spinal motor nucleus. Exp Brain Res. 118:517-32.
Overduin, M., T.S. Harvey, S. Bagby, K.I. Tong, P. Yau, M. Takeichi, and M. Ikura. 1995. Solution structure of the epithelial cadherin domain responsible for selective cell adhesion. Science. 267:386-9.
Ozdinler, P.H., and J.D. Macklis. 2006. IGF-I specifically enhances axon outgrowth of corticospinal motor neurons. Nat Neurosci. 9:1371-81.
Packard, M., E.S. Koo, M. Gorczyca, J. Sharpe, S. Cumberledge, and V. Budnik. 2002. The Drosophila Wnt, wingless, provides an essential signal for pre- and postsynaptic differentiation. Cell. 111:319-30.
Patel, S.D., C. Ciatto, C.P. Chen, F. Bahna, M. Rajebhosale, N. Arkus, I. Schieren, T.M. Jessell, B. Honig, S.R. Price, and L. Shapiro. 2006. Type II cadherin ectodomain structures: implications for classical cadherin specificity. Cell. 124:1255-68.
Patel, T.D., A. Jackman, F.L. Rice, J. Kucera, and W.D. Snider. 2000. Development of sensory neurons in the absence of NGF/TrkA signaling in vivo. Neuron. 25:345-57.
Patel, T.D., I. Kramer, J. Kucera, V. Niederkofler, T.M. Jessell, S. Arber, and W.D. Snider. 2003. Peripheral NT3 signaling is required for ETS protein expression and central patterning of proprioceptive sensory afferents. Neuron. 38:403-16.
Price, S.R., N.V. De Marco Garcia, B. Ranscht, and T.M. Jessell. 2002. Regulation of motor neuron pool sorting by differential expression of type II cadherins. Cell. 109:205-16.
Pun, S., A.F. Santos, S. Saxena, L. Xu, and P. Caroni. 2006. Selective vulnerability and pruning of phasic motoneuron axons in motoneuron disease alleviated by CNTF. Nat Neurosci. 9:408-19.
- 116 -

Rabinovsky, E.D., E. Gelir, S. Gelir, H. Lui, M. Kattash, F.J. DeMayo, S.M. Shenaq, and R.J. Schwartz. 2003. Targeted expression of IGF-1 transgene to skeletal muscle accelerates muscle and motor neuron regeneration. FASEB J. 17:53-5.
Rangwala, S.M., X. Li, L. Lindsley, X. Wang, S. Shaughnessy, T.G. Daniels, J. Szustakowski, N.R. Nirmala, Z. Wu, and S.C. Stevenson. 2007. Estrogen-related receptor alpha is essential for the expression of antioxidant protection genes and mitochondrial function. Biochem Biophys Res Commun. 357:231-6.
Redies, C. 2000. Cadherins in the central nervous system. Prog Neurobiol. 61:611-48.
Rexed, B. 1952. The cytoarchitectonic organization of the spinal cord in the cat. J Comp Neurol. 96:414-95.
Rexed, B. 1954. A cytoarchitectonic atlas of the spinal cord in the cat. J Comp Neurol. 100:297-379.
Robbins, M.J., K.J. Charles, D.C. Harrison, and M.N. Pangalos. 2002. Localisation of the GPRC5B receptor in the rat brain and spinal cord. Brain Res Mol Brain Res. 106:136-44.
Robbins, M.J., D. Michalovich, J. Hill, A.R. Calver, A.D. Medhurst, I. Gloger, M. Sims, D.N. Middlemiss, and M.N. Pangalos. 2000. Molecular cloning and characterization of two novel retinoic acid-inducible orphan G-protein-coupled receptors (GPRC5B and GPRC5C). Genomics. 67:8-18.
Rodbell, M., L. Birnbaumer, S.L. Pohl, and F. Sundby. 1971. The reaction of glucagon with its receptor: evidence for discrete regions of activity and binding in the glucagon molecule. Proc Natl Acad Sci U S A. 68:909-13.
Rossi-Durand, C. 2006. Proprioception and myoclonus. Neurophysiol Clin. 36:299-308.
Rousso, D.L., Z.B. Gaber, D. Wellik, E.E. Morrisey, and B.G. Novitch. 2008. Coordinated actions of the forkhead protein Foxp1 and Hox proteins in the columnar organization of spinal motor neurons. Neuron. 59:226-40.
Salomon, R., T. Attie, J. Amiel, A. Pelet, P. Niaudet, and S. Lyonnet. 1998. RET proto-oncogene: role in kidney development and molecular pathology. Adv Nephrol Necker Hosp. 28:401-17.
Sanes, J.R., and J.W. Lichtman. 2001. Induction, assembly, maturation and maintenance of a postsynaptic apparatus. Nat Rev Neurosci. 2:791-805.
- 117 -

Schier, A.F., and W.J. Gehring. 1992. Direct homeodomain-DNA interaction in the autoregulation of the fushi tarazu gene. Nature. 356:804-7.
Scolnick, J.A., K. Cui, C.D. Duggan, S. Xuan, X.B. Yuan, A. Efstratiadis, and J. Ngai. 2008. Role of IGF signaling in olfactory sensory map formation and axon guidance. Neuron. 57:847-57.
Sekine, Y., K. Takeda, and H. Ichijo. 2006. The ASK1-MAP kinase signaling in ER stress and neurodegenerative diseases. Curr Mol Med. 6:87-97.
Shapiro, L., A.M. Fannon, P.D. Kwong, A. Thompson, M.S. Lehmann, G. Grubel, J.F. Legrand, J. Als-Nielsen, D.R. Colman, and W.A. Hendrickson. 1995. Structural basis of cell-cell adhesion by cadherins. Nature. 374:327-37.
Sherrington, C.S. 1910. Flexion-reflex of the limb, crossed extension-reflex, and reflex stepping and standing. J Physiol. 40:28-121.
Sommer, L., Q. Ma, and D.J. Anderson. 1996. neurogenins, a novel family of atonal-related bHLH transcription factors, are putative mammalian neuronal determination genes that reveal progenitor cell heterogeneity in the developing CNS and PNS. Mol Cell Neurosci. 8:221-41.
St-Pierre, J., S. Drori, M. Uldry, J.M. Silvaggi, J. Rhee, S. Jager, C. Handschin, K. Zheng, J. Lin, W. Yang, D.K. Simon, R. Bachoo, and B.M. Spiegelman. 2006. Suppression of reactive oxygen species and neurodegeneration by the PGC-1 transcriptional coactivators. Cell. 127:397-408.
Sugino, K., C.M. Hempel, M.N. Miller, A.M. Hattox, P. Shapiro, C. Wu, Z.J. Huang, and S.B. Nelson. 2006. Molecular taxonomy of major neuronal classes in the adult mouse forebrain. Nat Neurosci. 9:99-107.
Suzuki, S.C., T. Inoue, Y. Kimura, T. Tanaka, and M. Takeichi. 1997. Neuronal circuits are subdivided by differential expression of type-II classic cadherins in postnatal mouse brains. Mol Cell Neurosci. 9:433-47.
Tessarollo, L., K.S. Vogel, M.E. Palko, S.W. Reid, and L.F. Parada. 1994. Targeted mutation in the neurotrophin-3 gene results in loss of muscle sensory neurons. Proc Natl Acad Sci U S A. 91:11844-8.
Tietjen, I., J. Rihel, and C.G. Dulac. 2005. Single-cell transcriptional profiles and spatial patterning of the mammalian olfactory epithelium. Int J Dev Biol. 49:201-7.
Tietjen, I., J.M. Rihel, Y. Cao, G. Koentges, L. Zakhary, and C. Dulac. 2003. Single-cell transcriptional analysis of neuronal progenitors. Neuron. 38:161-75.
- 118 -

Tourtellotte, W.G., and J. Milbrandt. 1998. Sensory ataxia and muscle spindle agenesis in mice lacking the transcription factor Egr3. Nat Genet. 20:87-91.
Tsujino, H., E. Kondo, T. Fukuoka, Y. Dai, A. Tokunaga, K. Miki, K. Yonenobu, T. Ochi, and K. Noguchi. 2000. Activating transcription factor 3 (ATF3) induction by axotomy in sensory and motoneurons: A novel neuronal marker of nerve injury. Mol Cell Neurosci. 15:170-82.
Vassilatis, D.K., J.G. Hohmann, H. Zeng, F. Li, J.E. Ranchalis, M.T. Mortrud, A. Brown, S.S. Rodriguez, J.R. Weller, A.C. Wright, J.E. Bergmann, and G.A. Gaitanaris. 2003. The G protein-coupled receptor repertoires of human and mouse. Proc Natl Acad Sci U S A. 100:4903-8.
Vrieseling, E., and S. Arber. 2006. Target-induced transcriptional control of dendritic patterning and connectivity in motor neurons by the ETS gene Pea3. Cell. 127:1439-52.
Wang, K.H., K. Brose, D. Arnott, T. Kidd, C.S. Goodman, W. Henzel, and M. Tessier-Lavigne. 1999. Biochemical purification of a mammalian slit protein as a positive regulator of sensory axon elongation and branching. Cell. 96:771-84.
Wang, Z., L.Y. Li, M.D. Taylor, D.E. Wright, and E. Frank. 2007. Prenatal exposure to elevated NT3 disrupts synaptic selectivity in the spinal cord. J Neurosci. 27:3686-94.
Wohrn, J.C., L. Puelles, S. Nakagawa, M. Takeichi, and C. Redies. 1998. Cadherin expression in the retina and retinofugal pathways of the chicken embryo. J Comp Neurol. 396:20-38.
Wojtowicz, W.M., W. Wu, I. Andre, B. Qian, D. Baker, and S.L. Zipursky. 2007. A vast repertoire of Dscam binding specificities arises from modular interactions of variable Ig domains. Cell. 130:1134-45.
Wong, P.C., C.A. Pardo, D.R. Borchelt, M.K. Lee, N.G. Copeland, N.A. Jenkins, S.S. Sisodia, D.W. Cleveland, and D.L. Price. 1995. An adverse property of a familial ALS-linked SOD1 mutation causes motor neuron disease characterized by vacuolar degeneration of mitochondria. Neuron. 14:1105-16.
Wu, Q., and T. Maniatis. 1999. A striking organization of a large family of human neural cadherin-like cell adhesion genes. Cell. 97:779-90.
Wu, Y., G. Wang, S.A. Scott, and M.R. Capecchi. 2008. Hoxc10 and Hoxd10 regulate mouse columnar, divisional and motor pool identity of lumbar motoneurons. Development. 135:171-82.
Wu, Z., P. Puigserver, U. Andersson, C. Zhang, G. Adelmant, V. Mootha, A. Troy, S. Cinti, B. Lowell, R.C. Scarpulla, and B.M. Spiegelman. 1999.
- 119 -

- 120 -
Mechanisms controlling mitochondrial biogenesis and respiration through the thermogenic coactivator PGC-1. Cell. 98:115-24.
Yamagata, K., K.I. Andreasson, H. Sugiura, E. Maru, M. Dominique, Y. Irie, N. Miki, Y. Hayashi, M. Yoshioka, K. Kaneko, H. Kato, and P.F. Worley. 1999. Arcadlin is a neural activity-regulated cadherin involved in long term potentiation. J Biol Chem. 274:19473-1979.
Yamamoto, M., G. Sobue, K. Yamamoto, S. Terao, and T. Mitsuma. 1996. Expression of mRNAs for neurotrophic factors (NGF, BDNF, NT-3, and GDNF) and their receptors (p75NGFR, trkA, trkB, and trkC) in the adult human peripheral nervous system and nonneural tissues. Neurochem Res. 21:929-38.
Yoon, M.S., L. Puelles, and C. Redies. 2000. Formation of cadherin-expressing brain nuclei in diencephalic alar plate divisions. J Comp Neurol. 427:461-80.
Yoshida, Y., B. Han, M. Mendelsohn, and T.M. Jessell. 2006. PlexinA1 signaling directs the segregation of proprioceptive sensory axons in the developing spinal cord. Neuron. 52:775-88.
Yu, F.H., M. Mantegazza, R.E. Westenbroek, C.A. Robbins, F. Kalume, K.A. Burton, W.J. Spain, G.S. McKnight, T. Scheuer, and W.A. Catterall. 2006. Reduced sodium current in GABAergic interneurons in a mouse model of severe myoclonic epilepsy in infancy. Nat Neurosci. 9:1142-9.
Yu, F.H., V. Yarov-Yarovoy, G.A. Gutman, and W.A. Catterall. 2005. Overview of molecular relationships in the voltage-gated ion channel superfamily. Pharmacol Rev. 57:387-95.
Zelena, J., and T. Soukup. 1977a. The development of Golgi tendon organs. J Neurocytol. 6:171-94.
Zelena, J., and T. Soukup. 1977b. The ultrastructural development of Golgi tendon organs. Folia Morphol (Praha). 25:76-8.
Zirlinger, M., L. Lo, J. McMahon, A.P. McMahon, and D.J. Anderson. 2002. Transient expression of the bHLH factor neurogenin-2 marks a subpopulation of neural crest cells biased for a sensory but not a neuronal fate. Proc Natl Acad Sci U S A. 99:8084-9.