Profiling immune cells in the kidney using tissue ...
31
Profiling immune cells in the kidney using tissue cytometry and machine learning Seth Winfree 1 , Mohammad Al Hasan 2 and Tarek M. El-Achkar 1,3 1- Department of Medicine Division of Nephrology, Indiana University, Indianapolis 2- Department of Computer Science, Indiana University-Purdue University, Indianapolis 3- Indianapolis VA Medical Center, Indianapolis Correspondence: Tarek M. El-Achkar (Ashkar), MD 950 W Walnut St, R2-202 Division of Nephrology Indiana University Indianapolis, 46202 Email: [email protected] Kidney360 Publish Ahead of Print, published on February 11, 2021 as doi:10.34067/KID.0006802020 Copyright 2021 by American Society of Nephrology.
Transcript of Profiling immune cells in the kidney using tissue ...
Profiling immune cells in the kidney using tissue cytometry and
machine learning
Seth Winfree1, Mohammad Al Hasan2 and Tarek M. El-Achkar1,3
1- Department of Medicine Division of Nephrology, Indiana University, Indianapolis
2- Department of Computer Science, Indiana University-Purdue University, Indianapolis
3- Indianapolis VA Medical Center, Indianapolis
Correspondence:
Tarek M. El-Achkar (Ashkar), MD
950 W Walnut St, R2-202 Division of Nephrology Indiana University Indianapolis, 46202 Email: [email protected]
Kidney360 Publish Ahead of Print, published on February 11, 2021 as doi:10.34067/KID.0006802020
Copyright 2021 by American Society of Nephrology.

Abstract
The immune system governs key functions that maintain renal homeostasis through
various effector cells that reside in or infiltrate the kidney. These immune cells play an
important role in shaping adaptive or maladaptive responses to local or systemic stress
and injury. We increasingly recognize that microenvironments within the kidney are
characterized by unique distribution of immune cells, the function of which depends on
this unique spatial localization. Therefore, quantitative profiling of immune cells in intact
kidney tissue becomes essential, particularly at a scale and resolution that allow the
detection of differences between the various “nephro-ecosystems” in health and
disease. In this review, we discuss advancements in tissue cytometry of the kidney,
performed through multiplexed confocal imaging and analysis using the Volumetric
tissue exploration and analysis (VTEA) software. We highlight how this tool has
improved our understanding of the role of the immune system in the kidney and its
relevance in pathobiology of renal disease. We also discuss how the field is increasingly
incorporating machine learning to enhance the analytical potential of the imaging data
and provide unbiased methods to explore and visualize multidimensional data. Such
novel analytical methods could be particularly relevant when applied to profiling immune
cells. Furthermore, machine learning approaches applied to cytometry could present
venues for non-exhaustive exploration and classifications of cells from existing data and
improving tissue economy. Therefore, tissue cytometry is transforming what used to be
a qualitative assessment of the kidney into a highly quantitative imaging-based “omics”
assessment that compliments other advanced molecular interrogation technologies.
Importance of the immune system in the kidney
The human kidney comprises at least 18 types of cells that are organized spatially in
unique structures and zones within the kidney (1). This unique distribution allows the
performance of specialized physiological functions and shape the response to disease
(2). Cells of immune system are distributed throughout the renal interstitium and are in
intimate cross-talk with other cell types such as the tubular epithelium (3-6). Immune
cells are key regulators of the renal milieu in homeostatic conditions (5-8). They
comprise resident phagocytes such as macrophages and dendritic cells, but also
occasional “visiting cells”, such as neutrophils and lymphocytes that may marginate and
cross over from the microcirculation in response to local signals (5, 9, 10). Example of
homeostatic functions include immune monitoring and tolerance to non-harmful
antigens and maintaining infection defense capability (5, 6, 8, 11).
In disease, systemic and local events alter the composition, phenotype and function of
resident cells (6, 12, 13). For example, activated antigen presenting cells travel to
regional lymph nodes (14). Resident dendritic cells and macrophages activate gene
expression programs driven by cues from other cells and the environment (15). In
addition, chemokines release by injured or stressed cells will attract more cells from the
circulation, such as neutrophils, monocytes, natural killer cells and lymphocytes (16,
17). Upon entering the kidney milieu, many cells undergo phenotype switching (18). For
instance, responding to environmental cues, monocyte transform into specific
macrophage phenotypes. Many of these cells could also start proliferating within the
kidney, providing additional “clones for the war” (12, 19). The dynamics and fate of
these infiltrating cells will depend on the course and severity of disease.

In an adaptive response, the disease is controlled, and the function of immune cells
changes from danger mitigation to promotion of healing (18, 20). Such transformation
requires curtailing cells that could become dangerous to self, if left unchecked, such as
neutrophils which are directed to die or leave the kidney (21). Furthermore,
macrophages shift to a healing phenotype, by removing dead cells, debris, and
secreting anti-inflammatory signals (20, 22, 23). Non-immune cells can then regenerate
and restore other functions (24). In a maladaptive response, which could result from a
persistent or very severe injury, persistently activated immune cells can cause damage
to bystanders and perpetuate the injury (18, 22, 25). The result could be a migrating
pattern of injury, leaving behind fibrosis and on-going damage. Such a model is thought
to be a key pathogenic feature of chronic disease and in progression from acute to
chronic disease. Therefore, the immune system is a key regulator of kidney health and
disease.
Available methods to assess immune cells within the kidney and the importance
of spatial information
Technologies to quantitatively survey the type of immune cells and their changes within
the kidney have experienced revolutionary growth over the last decade. The application
of flow cytometry, transcriptomics and more recently single-cell transcriptomics of cells
from homogenized kidney tissues have provided important advancements to our
understanding of the role of the immune system in the kidney (5, 12, 13, 26-29). The
identification of profiles of resident and infiltrating immune cells in health and disease
based on specific markers have been crucial for progress (5, 6, 12, 15, 29). Moreover,
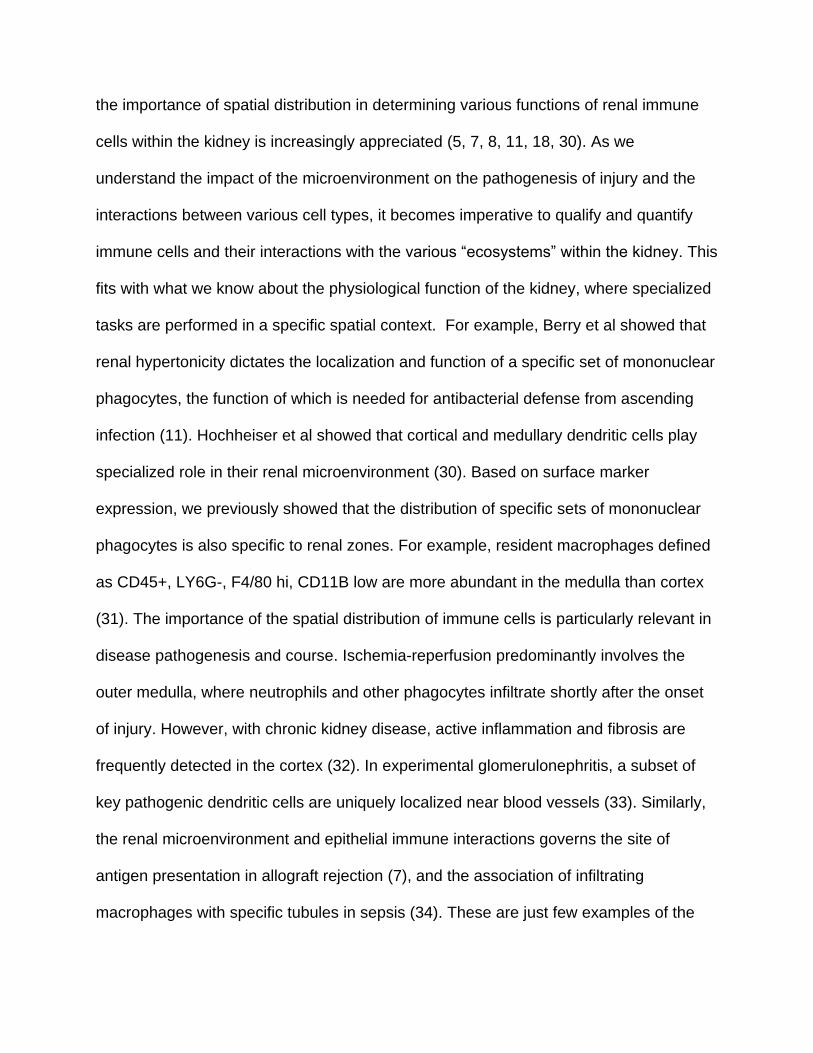
the importance of spatial distribution in determining various functions of renal immune
cells within the kidney is increasingly appreciated (5, 7, 8, 11, 18, 30). As we
understand the impact of the microenvironment on the pathogenesis of injury and the
interactions between various cell types, it becomes imperative to qualify and quantify
immune cells and their interactions with the various “ecosystems” within the kidney. This
fits with what we know about the physiological function of the kidney, where specialized
tasks are performed in a specific spatial context. For example, Berry et al showed that
renal hypertonicity dictates the localization and function of a specific set of mononuclear
phagocytes, the function of which is needed for antibacterial defense from ascending
infection (11). Hochheiser et al showed that cortical and medullary dendritic cells play
specialized role in their renal microenvironment (30). Based on surface marker
expression, we previously showed that the distribution of specific sets of mononuclear
phagocytes is also specific to renal zones. For example, resident macrophages defined
as CD45+, LY6G-, F4/80 hi, CD11B low are more abundant in the medulla than cortex
(31). The importance of the spatial distribution of immune cells is particularly relevant in
disease pathogenesis and course. Ischemia-reperfusion predominantly involves the
outer medulla, where neutrophils and other phagocytes infiltrate shortly after the onset
of injury. However, with chronic kidney disease, active inflammation and fibrosis are
frequently detected in the cortex (32). In experimental glomerulonephritis, a subset of
key pathogenic dendritic cells are uniquely localized near blood vessels (33). Similarly,
the renal microenvironment and epithelial immune interactions governs the site of
antigen presentation in allograft rejection (7), and the association of infiltrating
macrophages with specific tubules in sepsis (34). These are just few examples of the

importance of accurately identifying the spatial distribution and neighborhoods of
resident and infiltrating immune cells in health and disease.
To perform such a task, tissue preserving strategies that survey immune cells in situ are
needed. This is performed by an imaging approach that is linked to an analytical
pipeline that can process the imaging data through an intuitive and interactive interface,
which can provide quantitative outputs. Many such approaches have been described
and have advantages and limitations (35-50). We recently reviewed such approaches
and would refer the reader to these previous works (51, 52). In the current review, we
will focus on tissue cytometry of the kidney using large scale 3D confocal fluorescence
imaging and tissue cytometry. Our group developed the Volumetric Tissue Exploration
and Analysis (VTEA) software, a tool that could be used to analyze 3D image volumes
from kidney tissue (51, 53). We will describe the workflow and application of 3D
cytometry using VTEA to analyze the immune system within the kidney. We previously
demonstrated the importance of imaging in 3D, particularly for immune cells, whereby
the expression of surface markers used for identification can be unevenly distributed
across the cell (53). Therefore, capturing entire cells and structures in 3D will enhance
the accuracy of classification.
Tissue cytometry description- VTEA workflow
Tissue preparation and imaging: Large scale 3D imaging of kidney tissue can be
obtained from frozen sections or from formalin fixed and vibratome-sectioned tissue. For
abundant tissue sources such as experimental murine kidneys, we prefer vibratome

sections (54), since the morphology is exceptionally preserved by immediate fixation
and avoidance of freezing. However, for sparse tissues such as human kidney biopsies,
we frequently share the tissue with clinical applications and use optimal cutting
temperature compound (OCT)-embedded frozen sections, since they are the most
compatible with our imaging process (53, 55). Frozen specimen can be sectioned into
50 um-thick sections and immediately fixed with paraformaldehyde to prepare the tissue
for staining. The detection of immune and other cells within the kidney depends on the
availability of reliable markers and antibodies that produce rigorous and reproducible
results (56). This is a major rate limiting step on the type of cells that can be detected by
this technology (i.e. subpopulations and various subtypes). Although standard confocal
microscopy can simultaneously detect up to 4 labels spread across the fluorescence
spectrum without any significant bleed through between acquisition channels, it is
possible to increase the number of simultaneously detected fluorophores up to 8 with
spectral deconvolution (52, 55). To efficiently perform 3D tissue cytometry, a channel
must be dedicated to stain the nuclei, which will serve as fiduciaries to survey all the
cells. Large scale 3D imaging is performed by tile scanning and digital stitching of the
acquired volume. Such an approach will assure mesoscale imaging at a subcellular
resolution, a great strength of this technology (51-53). The process for staining and
imaging has been standardized and is made available on protocols.io
(dx.doi.org/10.17504/protocols.io.9avh2e6).
Image analysis and cytometry: VTEA was designed and built as a plugin for the
commonly used ImageJ/FIJI tool for image analysis (51-53). VTEA is meant to be
intuitive, where all the steps needed from visualization, image processing and analysis

can be done in a single space (Figure 1). The workflow of VTEA is bidirectional
(between image processing and analysis), whereby the flexibility of its design allows for
real-time adjustments of parameters in the pre-processing and segmentation to optimize
the analysis. The premise of the analysis is that every nucleus can be segmented
automatically using built in functions within VTEA and ImageJ. Each surveyed nucleus
becomes a surrogate for its cell, to which the location (coordinates) and marker staining
around or within the nucleus can be registered. This captured information can be
classified as label-based (e.g. fluorescence mean intensity, intensity distribution,
texture, etc.), spatially-based (e.g. X, Y, Z coordinates, neighborhoods, etc.), or
combined (e.g. directionality of the intensity). These three classes of information
become measured variables (features) associated with each nucleus/cell. The number
of features associated with each cell can be expanded experimentally by applying
multiple fluorescent labels (more primary variables) or computationally by inferring new
features from existing labels and spatial distribution (more derived variables).
Consequently, the feature space is potentially limitless. However, for a directed
analysis, we tend to focus on specific features such as the mean intensity fluorescence
of each marker associated with each cell (53, 55). The data (objects where each dot
represents a cell) is plotted as a scatter plot where the X and Y axis each present a
feature, and the color can be used to represent a third feature (Figure 1D). Cells of
interest can then be identified by these features, and a gate drawn to perform
quantitation. An important characteristic of VTEA is that it allows back-mapping of the
analysis onto the image volumes, so that the cell of interest identified by a gate are
directly visualized as colored overlays on the image, with the corresponding displayed

statistics (Figure 1D and E) (31, 51-53, 55). This functionality allows the immediate
interpretation and validation of the gates. In addition, direct gating on the image can be
performed, which can trace all the cells within the chosen region-of-interest back to the
data display on the scatter plot (Figure 1F and G). Such a back-and-forth interplay
between the image volumes and the quantitative plots allows the interactive exploration
and analysis of the data.
Limitations of cytometry with VTEA: Although VTEA includes a suite of state-of-the-art
tools for visualization, image processing and analysis, these tools may not be the best
solution for all circumstances. We understood this limitation early in developing VTEA
and have implemented an extensible framework. Therefore, VTEA can be dynamically
extended with emerging and potentially more effective tools for visualization, image
processing and analysis (52). Furthermore, the workflow is adaptable as segmentations
and features may be imported from other software or workflows (e.g. CellProfiler and
other FIJI plugins such as MorphoLibJ) (57, 58) for use in VTEA. These capabilities will
be described in further detail in an upcoming publication.
Profiling the immune system with tissue cytometry in experimental mouse and
human disease
We have applied tissue cytometry to survey immune cells in various experimental
settings in animal models and human specimens. In mouse kidneys, we used VTEA to
quantify the distribution of various subtypes of immune cells based on MHCII and
CD11C staining and determined that the cortex and medulla have a differential

distribution of renal mononuclear phagocytes based on these two markers (53).
Furthermore, we determine that deficiency of uromodulin, a protein uniquely produced
by the thick ascending limbs and early distal tubules, causes a selective deficiency of
phagocytes in the inner stripe of the outer medulla (53). Furthermore, we used VTEA to
quantify the interaction between uromodulin and CD11C+ cells and showed that 13% of
CD11C+ cells also had evidence of uromodulin staining (31), suggesting significant
uptake of uromodulin within the interstitium by these phagocytes. This is of great
biological relevance because uromodulin is an important determinant of the number and
function of mononuclear phagocytes within the kidney (31). Using VTEA, we also
developed an in vivo quantitative phagocytosis assay by injecting fluorescent beads in
live mice and quantifying the uptake of beads by MHCII+ cells in specific renal regions
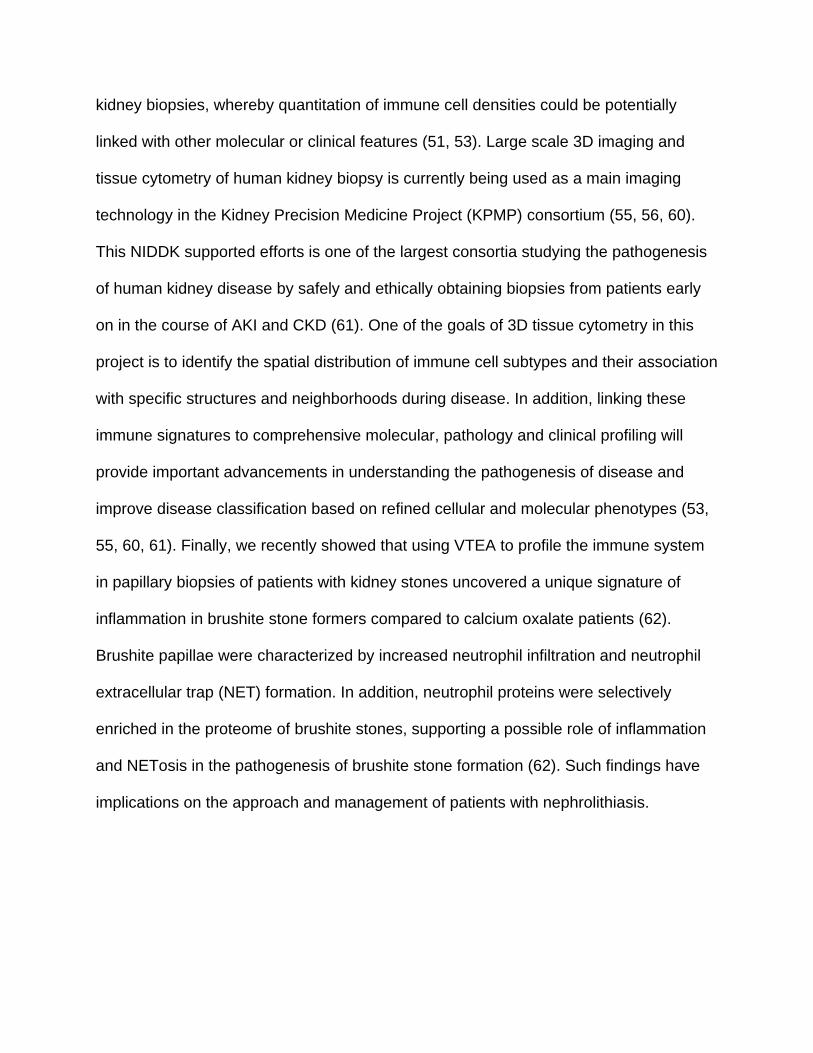
(31). Ongoing efforts are underway to characterize the spatial distribution of various
immune cells during various types of kidney injury (ischemic, sepsis, nephrotoxic) and
link the distribution of immune cells to injury signals from the subtypes of tubular
epithelium (Figure 2). Finally, we have also started applying cytometry to pathway
imaging, by labeling for activated proteins in the kidney (52). For example, we showed
that activation of p-c-Jun can be quantified in the kidney using tissue cytometry (59).
Such approach could be very useful in profiling the activity of immune cells in the kidney
during disease.
Large scale 3D imaging and tissue cytometry is also being used in quantifying immune
cell abundance and distribution in human kidney tissue, in health and disease (Figure
3). We previously showed that this approach could be used in archived frozen human
kidney biopsies, whereby quantitation of immune cell densities could be potentially
linked with other molecular or clinical features (51, 53). Large scale 3D imaging and
tissue cytometry of human kidney biopsy is currently being used as a main imaging
technology in the Kidney Precision Medicine Project (KPMP) consortium (55, 56, 60).
This NIDDK supported efforts is one of the largest consortia studying the pathogenesis
of human kidney disease by safely and ethically obtaining biopsies from patients early
on in the course of AKI and CKD (61). One of the goals of 3D tissue cytometry in this
project is to identify the spatial distribution of immune cell subtypes and their association
with specific structures and neighborhoods during disease. In addition, linking these
immune signatures to comprehensive molecular, pathology and clinical profiling will
provide important advancements in understanding the pathogenesis of disease and
improve disease classification based on refined cellular and molecular phenotypes (53,
55, 60, 61). Finally, we recently showed that using VTEA to profile the immune system
in papillary biopsies of patients with kidney stones uncovered a unique signature of
inflammation in brushite stone formers compared to calcium oxalate patients (62).
Brushite papillae were characterized by increased neutrophil infiltration and neutrophil
extracellular trap (NET) formation. In addition, neutrophil proteins were selectively
enriched in the proteome of brushite stones, supporting a possible role of inflammation
and NETosis in the pathogenesis of brushite stone formation (62). Such findings have
implications on the approach and management of patients with nephrolithiasis.

Tissue cytometry, big data and machine learning.
Large scale 3D imaging and tissue cytometry surveys tens to hundred thousand cells.
Out of these, the proportion and distribution of immune cells vary depending on the
renal area but still likely be in the range of thousands (55). Multiplex labeling of a kidney
tissue will increase the label-based features associated with a single cell and will
exponentially increase the derived features based on label and spatial information. In
fact, with seven markers, the resulting feature space just based on primary labels and
spatial features already exceeds 50 variables per cell. As derived variables are added,
we become faced with interrogating and visualizing hyperdimensional data for
thousands of cells, a true “Big Data” problem. Although directed approaches and
various sub-gating strategies can still be applied for specific variables, such methods
would only allow a peripheral exploration of the data, and likely not capitalize on
exploring the complex spatial relationships between various cells. Furthermore, an
unbiased interrogation may not be possible using these traditional approaches.
Therefore, to enhance the ability to analyze and visualize hyperdimensional data,
various clustering and classification strategies using machine learning tools are being
implemented in the VTEA analysis pipeline. These tools can allow the unbiased
classification of cells based on multiple features (these new classes become
themselves new derived features), visualization of hyperdimensional data using
dimensionality reduction, and mapping cells back to the tissue based on these new
derived features. Based on cell distributions within the tissue, cell neighborhoods can
also be defined and quantitatively interrogated (36, 49) (Figure 4). These approaches
are particularly useful for assessing immune cell involvement in pathology, including the

role of signaling in immune cell infiltration and the impact of immune cells on tissue
injury or repair.
In situ cell classification based on 3D nuclear staining using VTEA and deep
learning
Classifying cells type and subtypes based on imaging data typically requires validated
markers. For example, subtypes of immune cells are characterized by the expression of
unique cell surface markers (26, 63), and more recently also on defining transcriptomic
profile (which still requires additional validation by RNA or protein detection) (29).
Despite advances in multiplexing, a challenge remains that only a finite number of cell-
associated markers can be obtained from a single experiment. In addition, each time a
new marker is discovered or needed, new experiments on additional tissue sections are
required. For sparse tissue such as a kidney biopsy or unique experimental conditions,
this could lead to tissue exhaustion. Furthermore, because multiplexing is performed at
the experimental level, re-classification of cells using prospectively discovered markers
is not feasible except with new experiments, which will lead to missed opportunities for
many already imaged kidney specimens.
Recently, we investigated whether 3D nuclear staining with 4′,6-diamidino-2-
phenylindole (DAPI) (64), a nuclear stain commonly used in most fluorescence imaging
methods contains enough information for reliable classification of human kidney cells in
situ using a supervised learning framework (65). DAPI is commonly used in multiple
platforms of research and can be easily performed as part of large-scale 3D imaging. In

addition, immune cells are frequently described based on their nuclear morphology. We
first developed a machine learning approach using 3D cytometry with VTEA to generate
a large training dataset comprising of 230,000 image volumes of nuclei (65), organized
into cell types based on concurrent staining with validated markers (Figure 5). The
development of such ground-truth library was only feasible because of the semi-
automated workflow of VTEA, which mitigated costly efforts of manual annotation and
allowed us to develop this library within few weeks. We then devised a CNN
(Convolutional Neural Network) based deep learning approach to classify cells based
on their 3D nuclear staining (Figure 5). Such an approach was successful in classifying
8 different cells types (various epithelial, immune and endothelial classes) with high
accuracy (up to 84% balanced accuracy with maximal training), and then mapped back
for visualization in the tissue (65). In our work we have used a standard CNN
architecture for classification, but the accuracy of our proposed classification approach
can likely be improved by developing custom-made deep learning methodologies.
Furthermore, including concurrent staining with additional markers could potentially
improve and expand such classification. Nevertheless, the promising results of our
framework show that, imaging data from tissue stained with DAPI has a potential to
become a rich source of data that will suffice for comprehensive cell classification.
Furthermore, we envision that this methodology will have useful application for
classifying immune cell subtypes. Combining cell classification with the VTEA
cytometry interface will allow mapping of the identified cells and facilitate their biological
interpretation in the context of tissue microenvironment. This unique approach enables
the development of a ground truth library and the continued re-evaluation of existing

data, thereby lessening the need for more tissue. As new cell markers emerge, new
training datasets can be generated from an abundant source of tissue. This learning can
then be imputed on existing data sets from sparse tissue without the need for additional
experimentation (Figure 6).
Future outlook, challenges and conclusions
In this review, we highlighted the emerging role of tissue cytometry in profiling immune
cells within the kidney. New imaging and analytical tools, such as VTEA, have
transformed imaging of kidney tissue into multidimensional “omics” data with rich
information at the cell level. Such an approach will not only complement other
innovative cell-based molecular technologies but will also help anchor the findings in
situ and enhance the biological interpretation.
There are outstanding challenges for tissue cytometry, particularly in the areas of image
processing, analysis and the computation and visualization of big data. For example, in
the setting of disease, segmentation approaches need to be improved and refined to
ensure accurate and robust data. Analytically, we need a thorough assessment of
neighborhood approaches to better understand their application to the study of tissue
microenvironments. Researchers also need the tools to explore and analyze the big
data generated by national and international efforts such as the KPMP consortium
through distributed cloud-based tissue cytometry platforms.
The output from tissue cytometry is expected to further increase, especially with
advances in tissue clearing methods that allow mesoscale imaging (35, 49, 66).
Fortunately, advances in computational analysis and implementation of machine
learning tools will enhance our ability to classify cells within the tissue and detect early
changes in disease. For example, using the deep learning approach discussed above, it
may become possible to detect early signatures of stress induced by disease and
visualize the affected cells within the kidney using VTEA. Such advances will enhance
the role of imaging and cytometry tools for discovery in nephrology.

Disclosures
S. Winfree reports Consultancy Agreements: QCDx LLC; Honoraria: University of
Chicago, Marine Biological Laboratories, Course Instructor. T. El-Achkar reports
Scientific Advisor or Membership: Frontiers renal pharmacology; Other
Interests/Relationships: American Physiological Society, American College of
Physicians, American Urological Association. The remaining author has nothing to
disclose.
Funding
This work was supported by funding from the Veteran Affairs (Merit Award to T.M.E.),
the National Institute of Diabetes and Digestive and Kidney Diseases (1R01DK111651
to T.M.E), and P30DK079312- Indiana University O’Brien Center for Advanced Renal
Microscopic Analysis.
Acknowledgements
The authors would like to thank Drs. Katherine J. Kelly and Daria Barwinska for
assistance in experiments and the Indiana Center for Biological Microscopy for imaging
support in the Division of Nephrology and Hypertension at the Indiana University School
of Medicine.
Author contributions
S Winfree: Conceptualization; Data curation; Formal analysis; Software; Writing - review
and editing
M Al Hasan: Conceptualization; Writing - review and editing
T El-Achkar: Conceptualization; Data curation; Funding acquisition; Methodology;
Writing - original draft; Writing - review and editing

References
1. Hato T, El-Achkar TM, Dagher PC: Sisters in arms: myeloid and tubular epithelial cells shape renal innate immunity. Am J Physiol Renal Physiol, 304: F1243-1251, 2013 10.1152/ajprenal.00101.2013
2. El-Achkar TM, Dagher PC: Tubular cross talk in acute kidney injury: a story of sense and sensibility. Am J Physiol Renal Physiol, 308: F1317-1323, 2015 10.1152/ajprenal.00030.2015
3. Kaissling B, Le Hir M: The renal cortical interstitium: morphological and functional aspects. Histochem Cell Biol, 130: 247-262, 2008 10.1007/s00418-008-0452-5
4. Soos TJ, Sims TN, Barisoni L, Lin K, Littman DR, Dustin ML, Nelson PJ: CX3CR1+ interstitial dendritic cells form a contiguous network throughout the entire kidney. Kidney Int, 70: 591-596, 2006 10.1038/sj.ki.5001567
5. Stewart BJ, Ferdinand JR, Young MD, Mitchell TJ, Loudon KW, Riding AM, Richoz N, Frazer GL, Staniforth JUL, Vieira Braga FA, Botting RA, Popescu DM, Vento-Tormo R, Stephenson E, Cagan A, Farndon SJ, Polanski K, Efremova M, Green K, Del Castillo Velasco-Herrera M, Guzzo C, Collord G, Mamanova L, Aho T, Armitage JN, Riddick ACP, Mushtaq I, Farrell S, Rampling D, Nicholson J, Filby A, Burge J, Lisgo S, Lindsay S, Bajenoff M, Warren AY, Stewart GD, Sebire N, Coleman N, Haniffa M, Teichmann SA, Behjati S, Clatworthy MR: Spatiotemporal immune zonation of the human kidney. Science, 365: 1461-1466, 2019 10.1126/science.aat5031
6. Teteris SA, Engel DR, Kurts C: Homeostatic and pathogenic role of renal dendritic cells. Kidney Int, 80: 139-145, 2011 10.1038/ki.2011.129
7. Chessa F, Mathow D, Wang S, Hielscher T, Atzberger A, Porubsky S, Gretz N, Burgdorf S, Grone HJ, Popovic ZV: The renal microenvironment modifies dendritic cell phenotype. Kidney Int, 89: 82-94, 2016 10.1038/ki.2015.292
8. Stamatiades EG, Tremblay ME, Bohm M, Crozet L, Bisht K, Kao D, Coelho C, Fan X, Yewdell WT, Davidson A, Heeger PS, Diebold S, Nimmerjahn F, Geissmann F: Immune Monitoring of Trans-endothelial Transport by Kidney-Resident Macrophages. Cell, 166: 991-1003, 2016 10.1016/j.cell.2016.06.058
9. Kolaczkowska E, Kubes P: Neutrophil recruitment and function in health and inflammation. Nat Rev Immunol, 13: 159-175, 2013 10.1038/nri3399
10. Nelson PJ, Rees AJ, Griffin MD, Hughes J, Kurts C, Duffield J: The renal mononuclear phagocytic system. J Am Soc Nephrol, 23: 194-203, 2012 10.1681/ASN.2011070680
11. Berry MR, Mathews RJ, Ferdinand JR, Jing C, Loudon KW, Wlodek E, Dennison TW, Kuper C, Neuhofer W, Clatworthy MR: Renal Sodium Gradient Orchestrates a Dynamic Antibacterial Defense Zone. Cell, 170: 860-874 e819, 2017 10.1016/j.cell.2017.07.022
12. Lever JM, Hull TD, Boddu R, Pepin ME, Black LM, Adedoyin OO, Yang Z, Traylor AM, Jiang Y, Li Z, Peabody JE, Eckenrode HE, Crossman DK, Crowley MR, Bolisetty S, Zimmerman KA, Wende AR, Mrug M, Yoder BK, Agarwal A, George JF: Resident macrophages reprogram toward a developmental state after acute kidney injury. JCI Insight, 4, 2019 10.1172/jci.insight.125503
13. Li L, Okusa MD: Macrophages, dendritic cells, and kidney ischemia-reperfusion injury. Semin Nephrol, 30: 268-277, 2010 10.1016/j.semnephrol.2010.03.005
14. Dong X, Swaminathan S, Bachman LA, Croatt AJ, Nath KA, Griffin MD: Antigen presentation by dendritic cells in renal lymph nodes is linked to systemic and local injury to the kidney. Kidney Int, 68: 1096-1108, 2005 KID502 [pii] 10.1111/j.1523-1755.2005.00502.x

15. Salei N, Rambichler S, Salvermoser J, Papaioannou NE, Schuchert R, Pakalniskyte D, Li N, Marschner JA, Lichtnekert J, Stremmel C, Cernilogar FM, Salvermoser M, Walzog B, Straub T, Schotta G, Anders HJ, Schulz C, Schraml BU: The Kidney Contains Ontogenetically Distinct Dendritic Cell and Macrophage Subtypes throughout Development That Differ in Their Inflammatory Properties. J Am Soc Nephrol, 31: 257-278, 2020 10.1681/ASN.2019040419
16. Chung AC, Lan HY: Chemokines in renal injury. J Am Soc Nephrol, 22: 802-809, 2011 10.1681/ASN.2010050510
17. Schlondorff D, Nelson PJ, Luckow B, Banas B: Chemokines and renal disease. Kidney Int, 51: 610-621, 1997 10.1038/ki.1997.90
18. Anders HJ, Ryu M: Renal microenvironments and macrophage phenotypes determine progression or resolution of renal inflammation and fibrosis. Kidney Int, 80: 915-925, 2011 10.1038/ki.2011.217
19. Zhang MZ, Yao B, Yang S, Jiang L, Wang S, Fan X, Yin H, Wong K, Miyazawa T, Chen J, Chang I, Singh A, Harris RC: CSF-1 signaling mediates recovery from acute kidney injury. J Clin Invest, 122: 4519-4532, 2012 60363 [pii] 10.1172/JCI60363
20. Watanabe S, Alexander M, Misharin AV, Budinger GRS: The role of macrophages in the resolution of inflammation. J Clin Invest, 129: 2619-2628, 2019 10.1172/JCI124615
21. Doran AC, Yurdagul A, Tabas I: Efferocytosis in health and disease. Nature Reviews Immunology, 20: 254-267, 2020 10.1038/s41577-019-0240-6
22. Chen T, Cao Q, Wang Y, Harris DCH: M2 macrophages in kidney disease: biology, therapies, and perspectives. Kidney Int, 95: 760-773, 2019 10.1016/j.kint.2018.10.041
23. Lee S, Huen S, Nishio H, Nishio S, Lee HK, Choi BS, Ruhrberg C, Cantley LG: Distinct macrophage phenotypes contribute to kidney injury and repair. J Am Soc Nephrol, 22: 317-326, 2011 22/2/317 [pii] 10.1681/ASN.2009060615
24. Humphreys BD: Kidney injury, stem cells and regeneration. Curr Opin Nephrol Hypertens, 23: 25-31, 2014 10.1097/01.mnh.0000437332.31418.e0
25. Zhang JD, Patel MB, Griffiths R, Dolber PC, Ruiz P, Sparks MA, Stegbauer J, Jin H, Gomez JA, Buckley AF, Lefler WS, Chen D, Crowley SD: Type 1 angiotensin receptors on macrophages ameliorate IL-1 receptor-mediated kidney fibrosis. J Clin Invest, 124: 2198-2203, 2014 10.1172/JCI61368
26. George JF, Lever JM, Agarwal A: Mononuclear phagocyte subpopulations in the mouse kidney. Am J Physiol Renal Physiol, 312: F640-F646, 2017 10.1152/ajprenal.00369.2016
27. Kurts C, Panzer U, Anders H-J, Rees AJ: The immune system and kidney disease: basic concepts and clinical implications. Nature Reviews Immunology, 13: 738-753, 2013 10.1038/nri3523
28. Micanovic R, Chitteti BR, Dagher PC, Srour EF, Khan S, Hato T, Lyle A, Tong Y, Wu XR, El-Achkar TM: Tamm-Horsfall Protein Regulates Granulopoiesis and Systemic Neutrophil Homeostasis. J Am Soc Nephrol, 26: 2172-2182, 2015 ASN.2014070664 [pii] 10.1681/ASN.2014070664
29. Zimmerman KA, Bentley MR, Lever JM, Li Z, Crossman DK, Song CJ, Liu S, Crowley MR, George JF, Mrug M, Yoder BK: Single-Cell RNA Sequencing Identifies Candidate Renal Resident Macrophage Gene Expression Signatures across Species. J Am Soc Nephrol, 30: 767-781, 2019 10.1681/ASN.2018090931
30. Hochheiser K, Heuser C, Krause TA, Teteris S, Ilias A, Weisheit C, Hoss F, Tittel AP, Knolle PA, Panzer U, Engel DR, Tharaux PL, Kurts C: Exclusive CX3CR1 dependence of kidney DCs impacts glomerulonephritis progression. J Clin Invest, 123: 4242-4254, 2013 10.1172/JCI70143
31. Micanovic R, Khan S, Janosevic D, Lee ME, Hato T, Srour EF, Winfree S, Ghosh J, Tong Y, Rice SE, Dagher PC, Wu XR, El-Achkar TM: Tamm-Horsfall Protein Regulates

Mononuclear Phagocytes in the Kidney. J Am Soc Nephrol, 29: 841-856, 2018 10.1681/ASN.2017040409
32. Liu J, Kumar S, Dolzhenko E, Alvarado GF, Guo J, Lu C, Chen Y, Li M, Dessing MC, Parvez RK, Cippa PE, Krautzberger AM, Saribekyan G, Smith AD, McMahon AP: Molecular characterization of the transition from acute to chronic kidney injury following ischemia/reperfusion. JCI Insight, 2, 2017 10.1172/jci.insight.94716
33. Brahler S, Zinselmeyer BH, Raju S, Nitschke M, Suleiman H, Saunders BT, Johnson MW, Bohner AMC, Viehmann SF, Theisen DJ, Kretzer NM, Briseno CG, Zaitsev K, Ornatsky O, Chang Q, Carrero JA, Kopp JB, Artyomov MN, Kurts C, Murphy KM, Miner JH, Shaw AS: Opposing Roles of Dendritic Cell Subsets in Experimental GN. J Am Soc Nephrol, 29: 138-154, 2018 10.1681/ASN.2017030270
34. Hato T, Zollman A, Plotkin Z, El-Achkar TM, Maier BF, Pay SL, Dube S, Cabral P, Yoshimoto M, McClintick J, Dagher PC: Endotoxin Preconditioning Reprograms S1 Tubules and Macrophages to Protect the Kidney. J Am Soc Nephrol, 29: 104-117, 2018 10.1681/ASN.2017060624
35. Gerner MY, Kastenmuller W, Ifrim I, Kabat J, Germain RN: Histo-cytometry: a method for highly multiplex quantitative tissue imaging analysis applied to dendritic cell subset microanatomy in lymph nodes. Immunity, 37: 364-376, 2012 10.1016/j.immuni.2012.07.011
36. Goltsev Y, Samusik N, Kennedy-Darling J, Bhate S, Hale M, Vazquez G, Black S, Nolan GP: Deep Profiling of Mouse Splenic Architecture with CODEX Multiplexed Imaging. Cell, 174: 968-981 e915, 2018 10.1016/j.cell.2018.07.010
37. Liarski VM, Kaverina N, Chang A, Brandt D, Yanez D, Talasnik L, Carlesso G, Herbst R, Utset TO, Labno C, Peng Y, Jiang Y, Giger ML, Clark MR: Cell distance mapping identifies functional T follicular helper cells in inflamed human renal tissue. Sci Transl Med, 6: 230ra246, 2014 10.1126/scitranslmed.3008146
38. Moreau HD, Lemaitre F, Terriac E, Azar G, Piel M, Lennon-Dumenil AM, Bousso P: Dynamic in situ cytometry uncovers T cell receptor signaling during immunological synapses and kinapses in vivo. Immunity, 37: 351-363, 2012 10.1016/j.immuni.2012.05.014
39. de Chaumont F, Dallongeville S, Chenouard N, Herve N, Pop S, Provoost T, Meas-Yedid V, Pankajakshan P, Lecomte T, Le Montagner Y, Lagache T, Dufour A, Olivo-Marin JC: Icy: an open bioimage informatics platform for extended reproducible research. Nat Methods, 9: 690-696, 2012 10.1038/nmeth.2075
40. Dobosz M, Ntziachristos V, Scheuer W, Strobel S: Multispectral fluorescence ultramicroscopy: three-dimensional visualization and automatic quantification of tumor morphology, drug penetration, and antiangiogenic treatment response. Neoplasia, 16: 1-13, 2014 10.1593/neo.131848
41. Ecker RC, Rogojanu R, Streit M, Oesterreicher K, Steiner GE: An improved method for discrimination of cell populations in tissue sections using microscopy-based multicolor tissue cytometry. Cytometry A, 69: 119-123, 2006 10.1002/cyto.a.20219
42. Ecker RC, Steiner GE: Microscopy-based multicolor tissue cytometry at the single-cell level. Cytometry A, 59: 182-190, 2004 10.1002/cyto.a.20052
43. Haubold C, Schiegg M, Kreshuk A, Berg S, Koethe U, Hamprecht FA: Segmenting and Tracking Multiple Dividing Targets Using ilastik. Adv Anat Embryol Cell Biol, 219: 199-229, 2016 10.1007/978-3-319-28549-8_8
44. Kankaanpaa P, Paavolainen L, Tiitta S, Karjalainen M, Paivarinne J, Nieminen J, Marjomaki V, Heino J, White DJ: BioImageXD: an open, general-purpose and high-throughput image-processing platform. Nat Methods, 9: 683-689, 2012 10.1038/nmeth.2047
45. Ollion J, Cochennec J, Loll F, Escude C, Boudier T: Analysis of nuclear organization with TANGO, software for high-throughput quantitative analysis of 3D fluorescence

microscopy images. Methods Mol Biol, 1228: 203-222, 2015 10.1007/978-1-4939-1680-1_16
46. Peng H, Bria A, Zhou Z, Iannello G, Long F: Extensible visualization and analysis for multidimensional images using Vaa3D. Nat Protoc, 9: 193-208, 2014 10.1038/nprot.2014.011
47. Rizk A, Paul G, Incardona P, Bugarski M, Mansouri M, Niemann A, Ziegler U, Berger P, Sbalzarini IF: Segmentation and quantification of subcellular structures in fluorescence microscopy images using Squassh. Nat Protoc, 9: 586-596, 2014 10.1038/nprot.2014.037
48. Schindelin J, Arganda-Carreras I, Frise E, Kaynig V, Longair M, Pietzsch T, Preibisch S, Rueden C, Saalfeld S, Schmid B, Tinevez JY, White DJ, Hartenstein V, Eliceiri K, Tomancak P, Cardona A: Fiji: an open-source platform for biological-image analysis. Nat Methods, 9: 676-682, 2012 10.1038/nmeth.2019
49. Stoltzfus CR, Filipek J, Gern BH, Olin BE, Leal JM, Wu Y, Lyons-Cohen MR, Huang JY, Paz-Stoltzfus CL, Plumlee CR, Poschinger T, Urdahl KB, Perro M, Gerner MY: CytoMAP: A Spatial Analysis Toolbox Reveals Features of Myeloid Cell Organization in Lymphoid Tissues. Cell Rep, 31: 107523, 2020 10.1016/j.celrep.2020.107523
50. Wan Y, Otsuna H, Chien CB, Hansen C: FluoRender: An Application of 2D Image Space Methods for 3D and 4D Confocal Microscopy Data Visualization in Neurobiology Research. IEEE Pac Vis Symp: 201-208, 2012 10.1109/pacificvis.2012.6183592
51. Winfree S, Dagher PC, Dunn KW, Eadon MT, Ferkowicz M, Barwinska D, Kelly KJ, Sutton TA, El-Achkar TM: Quantitative Large-Scale Three-Dimensional Imaging of Human Kidney Biopsies: A Bridge to Precision Medicine in Kidney Disease. Nephron, 140: 134-139, 2018 10.1159/000490006
52. Winfree S, Ferkowicz MJ, Dagher PC, Kelly KJ, Eadon MT, Sutton TA, Markel TA, Yoder MC, Dunn KW, El-Achkar TM: Large-scale 3-dimensional quantitative imaging of tissues: state-of-the-art and translational implications. Transl Res, 189: 1-12, 2017 10.1016/j.trsl.2017.07.006
53. Winfree S, Khan S, Micanovic R, Eadon MT, Kelly KJ, Sutton TA, Phillips CL, Dunn KW, El-Achkar TM: Quantitative Three-Dimensional Tissue Cytometry to Study Kidney Tissue and Resident Immune Cells. J Am Soc Nephrol, 28: 2108-2118, 2017 10.1681/ASN.2016091027
54. El-Achkar TM, Huang X, Plotkin Z, Sandoval RM, Rhodes GJ, Dagher PC: Sepsis induces changes in the expression and distribution of Toll-like receptor 4 in the rat kidney. Am J Physiol Renal Physiol, 290: F1034-1043, 2006
55. Ferkowicz M, Winfree S, Sabo A, Kamocka MM, Khochare S, Barwinska D, Eadon MT, Cheng Y, Phillips CL, Sutton TA, Kelly KJ, Dagher PC, El-Achkar TM, Dunn KW: Large-scale, three-dimensional tissue cytometry of the human kidney: a complete and accessible pipeline Lab Invest, 2020
56. El-Achkar TM, Eadon MT, Menon R, Lake BB, Sigdel TK, Alexandrov T, Parikh S, Zhang G, Dobib D, Dunn KW, Otto EA, Anderton CR, Carson JM, Luo J, Park C, Hamidi H, Zhou J, Hoover P, Schroeder A, Joanes M, Azeloglu EU, Sealfon R, Winfree S, Steck B, He Y, D'Agati VD, Iyengar R, Troyanskaya OG, Barisoni L, Gaut J, Zhang K, Laszik Z, Rovin B, Dagher PC, Sharma K, Sarwal M, Hodgin JB, Alpers CE, Kretzer M, Jain S, The Kidney Precision Medicine Project F: A Multimodal and Integrated Approach to Interrogate Human Kidney Biopsies with Rigor and Reproducibility: Guidelines from the Kidney Precision Medicine Project. Physiol Genomics, 2020 10.1152/physiolgenomics.00104.2020
57. Carpenter AE, Jones TR, Lamprecht MR, Clarke C, Kang IH, Friman O, Guertin DA, Chang JH, Lindquist RA, Moffat J, Golland P, Sabatini DM: CellProfiler: image analysis software

for identifying and quantifying cell phenotypes. Genome Biol, 7: R100, 2006 10.1186/gb-2006-7-10-r100
58. Legland D, Arganda-Carreras I, Andrey P: MorphoLibJ: integrated library and plugins for mathematical morphology with ImageJ. Bioinformatics, 32: 3532-3534, 2016 10.1093/bioinformatics/btw413
59. LaFavers KA, Macedo E, Garimella PS, Lima C, Khan S, Myslinski J, McClintick J, Witzmann FA, Winfree S, Phillips CL, Hato T, Dagher PC, Wu XR, El-Achkar TM, Micanovic R: Circulating uromodulin inhibits systemic oxidative stress by inactivating the TRPM2 channel. Sci Transl Med, 11, 2019 10.1126/scitranslmed.aaw3639
60. Hansen J, Sealfon R, Menon R, Eadon MT, Lake BB, Steck B, Dobi D, Parikh S, Sidgel TK, Alexandrov T, Schroeder A, Otto EA, Anderton CR, Barwinska D, Zheng G, Rose MP, Shapiro JP, Velickovic D, Pamreddy A, Winfree S, He Y, de Boer IH, Hodgin JB, Nair A, Sharma K, Sarwal M, Zhang K, Himmelfarb J, Laszik Z, Rovin B, Dagher PC, He JC, El-Achkar TM, Jain S, Troyanskaya OG, Kretzler M, Iyengar R, Azeloglu EU: Towards Building a Smart Kidney Atlas: Network-based integration of multimodal transcriptomic, proteomic, metabolomic and imaging data in the Kidney Precision Medicine Project. bioRxiv: 2020.2007.2023.216507, 2020 10.1101/2020.07.23.216507
61. de Boer IH, Alpers CE, El-Achkar TM, Azeloglu E, Balis UG, Barasch J, Barisoni L, Blank K, Bomback AS, Brown K, Dagher PC, Dighe AL, Eadon MT, Gaut J, Hacohen N, He Y, Hodgin JB, Jain S, Kellum JA, Kiryluk K, Knoght R, Laszik Z, Lienczewski C, Mariani LH, Mcclelland RL, Menez S, Moledina D, Mooney SD, O'Toole J, Palevsky P, Parikh CR, Poggio E, Rosas S, Rosengart MR, Sarwal M, Schaub JA, Sedor JR, Sharma K, Steck B, Toto R, Troyanskaya OG, Tuttle KR, Vazquez M, Waikar SS, Williams K, Wilson FP, Zhang K, Iyengar R, Kretzler M, Himmelfarb J: The Kidney Precision Medicine Project: rationale and design. Kidney Int, 2020
62. Makki MS, Winfree S, Lingeman JE, Witzmann FA, Worcester EM, Krambeck AE, Coe FL, Evan AP, Bledsoe S, Bergsland KJ, Khochare S, Barwinska D, Williams JC, Jr., El-Achkar TM: A Precision Medicine Approach Uncovers a Unique Signature of Neutrophils in Patients With Brushite Kidney Stones. Kidney Int Rep, 5: 663-677, 2020 10.1016/j.ekir.2020.02.1025
63. Bohner AMC, Viehmann SF, Kurts C: Unraveling the Complexity of the Renal Mononuclear Phagocyte System by Genetic Cell Lineage Tracing. J Am Soc Nephrol, 31: 233-235, 2020 10.1681/ASN.2019121295
64. Kapuscinski J: DAPI: a DNA-specific fluorescent probe. Biotech Histochem, 70: 220-233, 1995 10.3109/10520299509108199
65. Woloshuk A, Khochare S, Almulhim AF, McNutt AT, Dean D, Barwinska D, Ferkowicz MJ, Eadon MT, Kelly KJ, Dunn KW, Hasan MA, El-Achkar TM, Winfree S: In Situ Classification of Cell Types in Human Kidney Tissue Using 3D Nuclear Staining. Cytometry A, 2020 10.1002/cyto.a.24274
66. Klingberg A, Hasenberg A, Ludwig-Portugall I, Medyukhina A, Mann L, Brenzel A, Engel DR, Figge MT, Kurts C, Gunzer M: Fully Automated Evaluation of Total Glomerular Number and Capillary Tuft Size in Nephritic Kidneys Using Lightsheet Microscopy. J Am Soc Nephrol, 28: 452-459, 2017 10.1681/ASN.2016020232

Figure legends
Figure 1. Overview of tissue cytometry with VTEA. A. Two or three-dimensional
multichannel images of fluorescently stained tissue, including DAPI and cell markers,
are imaged by high resolution microscopy. B. These datasets are imported into VTEA
and processed for noise, background correction, etc. and segmented into individual
cells based on DAPI stained nuclei. C. Segmented nuclei are processed and the
intensity of the pixels surrounding each nucleus are measured and summarized
statistically. D. Per segmented nuclei, the summary statistics and other image features
can be plotted, gated and quantitated. E. Gated cells are assessed and confirmed in
tissue volume by dynamic mapping-back of selected cells to the imaged volume. F and
G. Within the imaged volume, a region-of-interest can be added to determine where
spatially localized cells are found in the analytic space. H. These groups of cells can
be used to classify cells for use in additional unsupervised and neighborhood analyses.
Figure 2. Profiling immune cells in mouse kidneys following ischemic injury using
3D tissue cytometry. A. Whole kidney section stained for MHCII (magenta) and with
DAPI (nuclei, gray) and phalloidin (F-actin, yellow), was imaged by confocal microscopy
with tile-scanning after which image volumes were stitched together. A single optical
slice is shown. Inset (a) at right is a maximum z-projection from the region indicated.
Scale bars = 1 mm (A) and 100 microns (a). B. Cells were segmented and quantitated
with VTEA yielding 124,548 cells. A gate was used to identify MHCII+ cells that were
mapped back to the tissue (left and middle panel respectively) and presented in the
same volume given in inset (a) from panel A (right panel). Scale bar = 1 mm.

Figure 3. Quantitation of immune cell infiltrate in reference nephrectomy tissue.
Fixed human cortical nephrectomy tissue was stained with antibodies against CD45,
CD31, and Nestin and with DAPI. This tissue was imaged by confocal fluorescence
microscopy and analyzed with VTEA. All images are maximum z-projections. A.
Stitched confocal volumes with glomeruli (Nestin, magenta), a network of endothelial
cells (CD31, yellow) and infiltrating immune cells (CD45, green) throughout the tissue.
Scale bar = 100 microns. B. Immune cells are associated with and away from CD31+
cells-see inset (a). (Scale bar = 50 microns). C. Tissue cytometry quantitatively
identifies immune cells (CD45+) near CD31+ cells (red gate) or far from CD31+ cells
(cyan gate). D and E. Overlay of gated cells from panel C highlights the distributions of
the two populations.
Figure 4. Incorporating spatial context with neighborhood analysis. A. Cells are
first classified by using either a supervised gating strategy or an unsupervised clustering
approach. B. These classified cells are grouped into non-exclusive overlapping
neighborhoods by neighborhood building algorithms such as space dividing (left panel)
or cell centric approaches such as cells within a given distance or the k-nearest
neighbors of a reference cell (center and right panels respectively). C. The composition
of these neighborhood can be interrogated based on classification and connectivity with
network analyses.

Figure 5: Workflow for in situ classification of cells using 3D nuclear staining:
This approach combines tissue cytometry (VTEA) with deep leaning using a
convolutional neural network. VTEA allows ground truth validation of cell types and
subtypes based on specific markers and generation of ground truth library. Currently,
such library encompasses 270,000 image volumes of nuclei for 8 different classes of
cells. This ground truth library allows the training, validation and testing of a deep
learning approach to classify cells based only on the 3D nuclear staining pattern. The
classified cells can then be mapped back in the tissue with VTEA to visualize and
interpret the biological context.
Figure 6. Multiplexed imaging of sparse tissue: challenges and solutions. A. a
typical workflow for large scale imaging and analysis. As novel markers emerge, there is
a need to re-stain or incorporate markers into a congested processing pipeline with new
experiments. This process is limited by the number of markers used and will deplete the
tissue as new markers become available. B. implementing VTEA with deep learning to
classify cells based on 3D nuclear staining. The nuclear signature of new cell types can
be validated in abundant sources of tissue and imputed on the sparce tissue. This
allows the extraction of novel data from already imaged sparse tissue and provides a
non-exhaustive source for discovery with benefits on tissue economy.

Figure 1
Figure 2

Figure 3

Figure 4
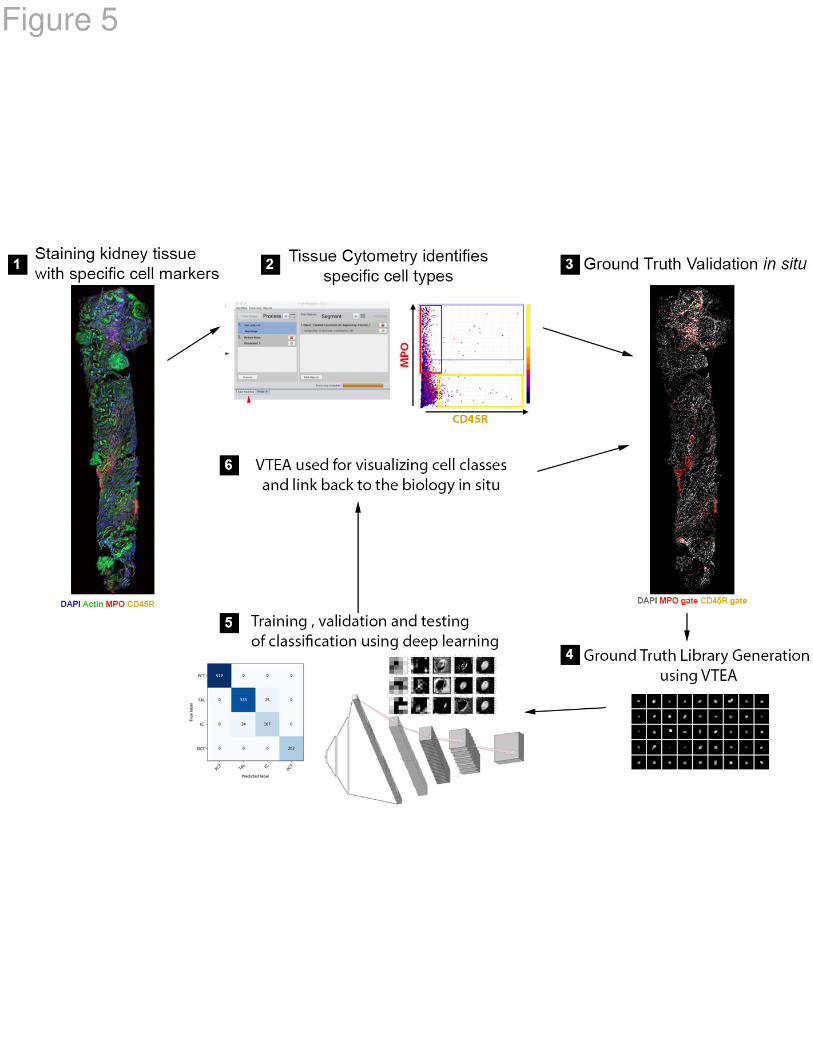
Figure 5

Figure 6