Opportuniteiten en Beperkingen voor een Belgische milieufiscaliteit
292
Onderzoeksproject HL/DD/04 : Internationale Economische Orde : Opportuniteiten en Beperkingen voor een Belgische milieufiscaliteit BIJLAGEN Onderdeel van het programma “Hefbomen voor een beleid gericht op duurzame ontwikkeling” Promotor : Prof. dr. M. DE CLERCQ VAKGROEP ALGEMENE ECONOMIE FACULTEIT ECONOMIE EN BEDRIJFSKUNDE UNIVERSITEIT GENT HOVENIERSBERG 24 9000 GENT TEL : 09/264 34 78 FAX : 09/264 35 99
Transcript of Opportuniteiten en Beperkingen voor een Belgische milieufiscaliteit

Onderzoeksproject HL/DD/04 :
Internationale Economische Orde : Opportuniteiten en
Beperkingen voor een Belgische milieufiscaliteit
BIJLAGEN
Onderdeel van het programma “Hefbomen voor een
beleid gericht op duurzame ontwikkeling”
Promotor :Prof. dr. M. DE CLERCQ
VAKGROEP ALGEMENE ECONOMIEFACULTEIT ECONOMIE EN BEDRIJFSKUNDEUNIVERSITEIT GENTHOVENIERSBERG 249000 GENTTEL : 09/264 34 78FAX : 09/264 35 99
Bijlagen
Bijlage I : Programma van de conferentie ‘Instruments for Climate Policy :Limited versus Unlimited Flexibility?’
Bijlage II : Lijst van publicaties die het resultaat zijn van het onderzoeksproject.
Bijlage III : Gedetailleerde onderzoeksresultaten.
Bijlagen 2
Bijlage I : Programma van de conferentie ‘Instruments for Climate Policy :Limited versus Unlimited Flexibility?’
Het programma van de conferentie is eveneens terug te vinden op :http://fetew.rug.ac.be/ceem/nl/climpolprog.htm
Doel van de conferentie :Deze conferentie kadert in de presentatie van de onderzoeksresultaten aan de buitenwereld.Verder bood de conferentie de kans om mensen uit verschillende socio-economische groepenaan het woord te laten. Zo waren er in de eerste plaats academici die hun eigen onderzoekm.b.t. het klimaatbeleid toelichtten. Verder waren er ook mensen uit het bedrijfslevenvertegenwoordigd. Tot slot kwamen ook een aantal mensen aan het woord die nauwverbonden zijn met het beleid.
Bijlagen 3
Programma van de conferentie ‘Instruments for Climate Policy:Limited versus Unlimited Flexibility?’
Thursday, October 19th9.00 - 9.30 Registration
Room 'Refter'9.30 Welcome address
Marc De Clercq, Ghent UniversityChair: Marc De Clercq, Ghent University9.45 The EU perspective on climate policy instruments and strategies
Peter Zapfel (European Commission, DG Environment)10.15 The US perspective on climate policy instruments and strategies
David Gardiner, Executive Director, White House Climate Change Task Force, USGovernment,Washington
10.45 Questions and discussion11.00 BreakChair: Bart Ameels, Ghent University11.15 Emission trading - from the virtual to the real? The EURELECTRIC energy and emission
trading simulation (GETS)John Scowcroft, Eurelectric, Brussels
11.45 Which strategies are available when you are a known large emitter of GHG in a competitiveenvironment?Jean-Claude Steffens, Electrabel (Head of European & Institutional Affairs), Brussels
12.15 Emission trading and large energy consumersJan-Peter Huges, ENERG8
12.45 Questions13.00 LunchChair: André Suck, Ghent University14.15 Diverging business strategies towards climate change. A USA-Europe comparison for four
major sectors of industryFrans van der Woerd, Kathy de Wit, Ans Kolk, David L. Levy - IVM, Institute forEnvironmental Studies, Vrije Universiteit Amsterdam, Amsterdam (The Netherlands)
14.45 Implementing the Kyoto Mechanisms: Potential contributions by banks and insurancecompaniesJozef Janssen – Institute for Economy and the Environment (IWOe-HSG), University of St.Gallen (Switzerland)
15.15 Questions15.30 Break15.45 A theoretical and empirical analysis of the reasons for the EU to propose a ceiling on the use
of Kyoto mechanismsEdwin Woerdman - University of Groningen (RuG), Faculty of Law, Groningen (TheNetherlands)
16.15 On the optimal timing of reductions of CO2 emissions. A survey of the debate on 'whenflexibility'Henri L.F. de Groot - CPB (Netherlands Bureau of Economic Policy Analysis) and VrijeUniversiteit Amsterdam, Amsterdam (The Netherlands)
16.45 Questions17.00 End of first day19.30 Dinner
Bijlagen 4
Friday, October 20thHet Pand, Room 'Refter'Chair: Igor Struyf, Ghent University9.30 A multi-gas approach to climate policy
Richard Richels – EPRI, Palo Alto, California (USA)10.00 Questions10.15 Break10.30 Parallel sessions IA and IB
IA Room 'Refter' - Limited FlexibilityChair: Khalil Helioui - CIRED-CNRS, Nogent-sur-Marne (France)10.30 The supplementary condition: a device to reconcile the precautionary and the flexibility
principles?Khalil Helioui – CIRED-CNRS, Nogent-sur-Marne (France)
11.00 Potential limits imposed by the multinational trading system in implementing flexibilitymechanismsJoy Aeree Kim – Climatic Research Unit, University of East Anglia (England)
11.30 Efficiency and equity in the EU Bubble AgreementJohan Eyckmans and Jan Cornillie - Katholieke Universiteit Leuven (CES-ETM), Leuven(Belgium)
12.00 Questions12.15 Lunch
IB Room 'Louis XVI' - Clean Development Mechanism & Joint ImplementationChair: Jyoti P. Painuly - UNEP Collaborating Centre on Energy and Environment, RISO NationalLaboratory, Roskilde (Denmark)10.30 The Clean Development Mechanism: potential, promise and limitations
Jyoti P. Painuly – UNEP Collaborating Centre on Energy and Environment, RISO NationalLaboratory, Roskilde (Denmark)
11.00 Can portfolio diversification reduce the risks of the Kyoto mechanisms? Evidence from theSwedish AIJ ProgrammeUrs Springer – Institute for Economy and the Environment, University of St. Gallen(Switzerland)
11.30 Carbon taxes and Joint Implementation: an applied CGE analysis for Germany and IndiaAndreas Löschel, Christoph Boehringer, Klaus Conrad - ZEW, Centre for European EconomicResearch, Environmental and Research Economics, Mannheim (Germany); MannheimUniversity (Germany)
12.00 Questions12.15 Lunch13.45 Parallel session IIA and IIB
IIA Room 'Refter' - Voluntary Agreements and emission tradingChair: Rory Sullivan, University of London13.45 Voluntary approaches for climate policy: lessons learned from the Australian greenhouse
challengeRory Sullivan and Robin Ormerod - University of London; Pacific Air and Environment(Australia)
14.15 Voluntary agreements - an effective tool for enhancing organisational learning and improvingclimate policy-makingStephan Ramesohl and Kora Kristof - Wuppertal Institute for Climate, Environment, Energy,Wuppertal (Germany)
14.45 Questions15.00 Break15.15 The political economy of international emissions trading scheme choice: empirical evidence
Jan-Tjeerd Boom and Gert Tinggaard Svendsen, University of Groningen, Faculty of Law,Groningen (The Netherlands)
15.45 Economic efficiency of cross-sectoral emission trading of CO2 emission in the EuropeanUnionPantelis Capros, Leonidas Mantzos, Matti Vainio and Peter Zapfel - National TechnicalUniversity of Athens (Greece); European Commission, DG Environment, Brussels
16.15 Industry-level emission trading in the EU under the Kyoto ProtocolChristoph Böhringer - ZEW, Centre for European Economic Research, Environmental and
Bijlagen 5
Resource Economics, Mannheim (Germany)16.45 Questions
II.B. Room 'Louis XVI' – Efficiency and social contractsChair: Michael Finus, Institute of Economic Theory, Hagen (Germany)13.45 Quotas may beat taxes in a global emission game
Alfred Endres and Michael Finus - Institute of Economic Theory, Hagen (Germany)14.15 Climate politics and international institutions: supporters of global ecological cooperation
Banu Bayramoglu-Lise, IVM, Amsterdam14.45 Questions15.00 Break15.15 Negotiating climate change as a social situation
Wietze Lise, Bob van der Zwaan and Richard Tol - IVM, Institute of Economic Studies, VrijeUniversiteit Amsterdam; Stanford University (USA); Carnegie Mellon University, Pittsburgh(USA) and Hamburg University (Germany)
15.45 QuestionsEnd of this session - Session in Refter continuesRoom 'Refter'
17.00 Closing of the conferenceMarc De Clercq – Ghent University
17.15 Reception
Bijlagen 6
Bijlage II : Lijst van publicaties die het resultaat zijn van het onderzoeksproject
De papers die opgenomen zijn in de onderstaande lijst zijn terug te vinden in Bijlage III vanhet onderzoeksproject.
• Albrecht, J. en De Clercq, M., 1998, Milieu en competitiviteit, Energie & Milieu 14(3),mei/juni 1998, pp. 143-146.
• Albrecht, J. en François, D., 2001, Voluntary Agreements with Emission Trading Optionsin Climate Policy, European Environment, Vol.11(4), pp.185-196.
• Albrecht, J., 1998, Environmental Consumer Subsidies and Potential Reductions of CO2Emissions, paper gepresenteerd op de conferentie “Greening the Budget” van het Institutfür Wirtschaftsforschung, te München (11 en 12 mei 1998).
• Albrecht, J., 1998, Environmental Policy and the Inward Investment Position of US“Dirty” Industries, Intereconomics Vol 33(4), July/august 1998, pp. 186-194.
• Albrecht, J., 1998, Environmental Regulation, Comparative Advantage and the PorterHypothesis, Note di Lavore 59.98 op de website op de website van de Fondazione EniEnrico Mattei (www.feem.it).
• Albrecht, J., 1998, Green policies – from ecotaxes to extended producer responsibility : aninstitutional search for policy autonomy from the EU and WTO frameworks, in bundelDWTC workshop dd. 22 september 1998.
• Albrecht, J., 1999, Environmental Agreements and Sectoral Performance : Cases of theCFC Phase-out and the US Toxic Release Inventory, CAVA Working Paper n° 89/11/11.
• Albrecht, J., 1999, Making CO2 Emission Trading More Effective : Integrating Cross-sectoral Energy Efficiency Opportunities, Note di Lavoro 47.99 op de website van deFondazione Eni Enrico Mattei (www.feem.it) en opgenomen in: Carraro C. (ed.),Efficiency and Equity of Climate Change Policy (Kluwer, London), 156-177
• Albrecht, J., 1999, Policy Instruments and Incentives for Environmental R&D: A Market-Driven Approach, Note di Lavoro 17.99 op de website van de Fondazione Eni EnricoMattei (www.feem.it).
• Albrecht, J., 2000, Environmental policy and new technologies : to create or to scrap ?
• Albrecht, J., 2000, The diffusion of cleaner vehicles in CO2 emission trading designs,Transportation Research Part D5, 385-401.
Bijlagen 7
Bijlage III : Gedetailleerde onderzoeksresultaten
In deze Bijlage zijn de verschillende publicaties van het onderzoeksproject terug te vinden. Zezijn zo geordend dat ze aansluiten bij de structuur van het eindverslag.
Bijlage III – A :
Environmental Regulation, Comparative Advantage and the Porter HypothesisJohan Albrecht (1998)
Note di Lavoro 59.98, deze paper is gepubliceerd op de website van de Fondazione EniEnrico Mattei.
Deze paper hoort bij deel A.1 : De belangrijkste bevindingen van ons onderzoek naar derelatie tussen milieudoelstellingen en de internationale competitiviteit.

Bijlagen 8
Bijlage III – B :
Environmental Policy and the Inward Investment Position of US “Dirty” IndustriesJohan Albrecht (1998)
Gepubliceerd in Intereconomics Vol 33(4), July/august 1998, pp. 186-194.
Deze paper hoort bij deel A.1 : De belangrijkste bevindingen van ons onderzoek naar derelatie tussen milieudoelstellingen en de internationale competitiviteit.

Bijlagen 9
Bijlage III – C :
Milieu en CompetitiviteitJohan Albrecht en Marc De Clercq (1998)
Gepubliceerd in Energie & Milieu 14(3), mei/juni 1998, pp. 143-146.
Deze paper hoort bij deel A.1 : De belangrijkste bevindingen van ons onderzoek naar derelatie tussen milieudoelstellingen en de internationale competitiviteit.

Bijlagen 10
Bijlage III – D :
Environmental Agreements and Sectoral Performance : Cases of the CFC Phase-out andthe US Toxic Release InventoryJohan Albrecht (1999)
CAVA Working Paper n° 89/11/11.
Deze paper hoort bij deel A.1 : De belangrijkste bevindingen van ons onderzoek naar derelatie tussen milieudoelstellingen en de internationale competitiviteit.

Bijlagen 11
Bijlage III – E :
Green policies – from ecotaxes to extended producer responsibility : an institutional searchfor policy autonomy from the EU and WTO frameworksJohan Albrecht (1998)
Deze tekst hoort bij deel A.2 : Analyse van de Internationale Economische Orde.
Bijlagen 12
Bijlage III – F :
Environmental Consumer Subsidies and Potential Reductions of CO2 EmissionsJohan Albrecht (1998)
Deze paper werd gepresenteerd op conferentie “Greening the Budget” van het Institut fürWirtschaftsforschung, te München (11 en 12 mei 1998).
Deze paper hoort bij deel B.2.2 : Beleidsondersteunende maatregelen en concrete voorstelleninzake het technologisch beleid.

Bijlagen 13
Bijlage III – G :
Policy Instruments and Incentives for Environmental R&D: A Market-Driven ApproachJohan Albrecht (1999)
Note di Lavoro 17.99, deze paper is gepubliceerd op de website van de Fondazione EniEnrico Mattei.
Deze paper hoort bij deel B.2.2 : Beleidsondersteunende maatregelen en concrete voorstelleninzake het technologisch beleid.

Bijlagen 14
Bijlage III – H :
Environmental policy and new technologies : to create or to scrap ?Johan Albrecht (2000)
Deze paper hoort bij deel B.2.2 : Beleidsondersteunende maatregelen en concrete voorstelleninzake het technologisch beleid.
Bijlagen 15
Bijlage III – I :
Making CO2 Emission Trading More Effective : Integrating Cross-sectoral EnergyEfficiency OpportunitiesJohan Albrecht (1999)
Note di Lavoro 47.99, deze paper is gepubliceerd op de website van de Fondazione EniEnrico Mattei en in: Carraro C. (ed.), Efficiency and Equity of Climate Change Policy(Kluwer, London), 156-177
Een herwerkte versie van deze paper werd eveneens gepubliceerd :Albrecht, J., 2000, The diffusion of cleaner vehicles in CO2 emission trading designs,Transportation Research Part D5, 385-401.
Deze paper hoort bij deel B.2.2 : Beleidsondersteunende maatregelen en concrete voorstelleninzake het technologisch beleid.

Bijlagen 16
Bijlage III – J :
Voluntary Agreements with Emission Trading Options in Climate PolicyJohan Albrecht en Delphine François (2001)
Gepubliceerd in European Environment, Vol.11(4), pp.185-196.
Deze paper hoort bij deel B.2.2 : Beleidsondersteunende maatregelen en concrete voorstelleninzake het technologisch beleid.
Environmental Regulation, Comparative Advantage and thePorter Hypothesis
Johan Albrecht, University of Ghent1
Faculty of Economics and Applied Economics, Hoveniersberg 4, 9000 Ghent, BelgiumTel : ++32 (0)9 264 35 10 / Fax : ++32 (0)9 264 34 78 / [email protected]
JEL Classification :F14, F21; L52, O32, Q28
Keywords : Environmental regulation; Industrial flight; Comparative advantage ; Exportdiversification ; Porter hypothesis
Short Abstract :Empirical surveys find no significant impact of environmental regulation and environmentalcosts on international competitiveness. In the literature, we can find three hypotheses on theimpact of environmental regulation. For the industrial-flight and pollution-haven hypothesis,there is no clear empirical evidence. We show that this is a logical consequence of theprinciple of comparative advantage. Another explanation can be that developed countrieshave very diversified exports and most surveys do not link regulation to specific products. Wetherefore investigate the link between export diversification and two measures of laborproductivity. The Porter hypothesis - the third or revisionist hypothesis in our overview -states that environmental regulation can lead to improved competitiveness. Many authors onlyfind ‘anecdotal’ evidence for this hypothesis but we show that when regulation is linked tospecific products, there is clear evidence for the Porter hypothesis. In our model, we workwith international CFC-regulation (chlorofluorocarbons) and the export performance of CFC-using industries like refrigerators, freezers and air conditioning machines. A final section doesfocus on the tradition of cartelization that has been typical in many of the old - and ‘dirty’ -industries.
1* Funded by the OSTC (Belgian Federal Office for Scientific, Technological and Cultural Affairs) Programmeon Sustainable DevelopmentI want to thank Koen Schoors (University of Ghent) and Tom Verbeke (FWO Vlaanderen, University of Ghent)for their useful comments.
2
Non-technical AbstractEmpirical surveys find no significant impact of environmental regulation and environmentalcosts on international competitiveness. This is rather surprising because considerations oncompetitiveness strongly influence many national and international environmentalagreements and measures. In the literature, we can find three hypotheses on the impact ofenvironmental regulation. For the industrial-flight and pollution-haven hypothesis, there is noclear empirical evidence. We show that this is a logical consequence of the principle ofcomparative advantage. This principle is used to illustrate that for each product that a countryexports, the impact of environmental costs will be different. Since these products all havedifferent comparative advantages, some will loose their advantage as a result of newregulation while other products will be able to maintain their advantage. As a consequence, acountry will never loose an important part of its exports as a result of an increase in regulatorycosts.This could however be the case for countries that have very concentrated trade flows and areas such vulnerable for product-specific regulations. Another explanation can be thatdeveloped countries have very diversified exports and most surveys on environmentalregulation and competitiveness do not link regulation to specific products. Most surveys workwith total exports or with sectoral exports. Again, this is not the best approach since sectorslike the chemical industry make hundreds or even thousands - depending on the level ofanalysis - of products that are on a different way vulnerable for changes in environmentalregulation.In a next section, we investigate the link between export diversification and two measures oflabor productivity. Other variables in our analysis are income pro capita and the inward FDI-stock. We find that productivity explains diversification of exports. We can conclude that themost productive countries have the most means to cope with costly regulation while they arethe least vulnerable for new regulation. The weak impact of regulation on competitiveness canbe explained in part by this finding.The Porter hypothesis - the third or revisionist hypothesis in our overview - states thatenvironmental regulation can lead to improved competitiveness : efficient regulations mayactually stimulate innovation, efficiency gains, industrial growth and competitiveness. Manyauthors only find ‘anecdotal’ evidence for this hypothesis but we show that when regulation islinked to specific products - the best approach for estimating the direct impact of regulation -,there is clear evidence for the Porter hypothesis. In our model, we work with internationalCFC-regulation (chlorofluorocarbons) and the export performance of CFC-using industrieslike refrigerators, freezers and air conditioning machines. Since all industrial nations signedthe Montreal Protocol on Substances that Deplete the Ozone Layer, they all had to imposeregulation in line with the agreed CFC-phase-out schedules. We find that the two countrieswith the most pro-active CFC-policy (the US and Denmark) experienced better export growthfor their CFC-using industries than countries that reacted later and with less convincinginstruments.

3
In a final section, we focus on the tradition of cartelization that has been typical in many ofthe old - and ‘dirty’ - industries in our analysis. Due to their market power, these industrieshad the capability to influence the regulatory process. Drastic actions that strongly harmedcompetitiveness are as such very scarce..

4
1.Introduction
Since the 1960s, the institutionalisation of environmental issues gained momemtum anddeveloped into a World Environmental Regime. Compared to international trade policy, thisenvironmental framework is of very recent date and as such subject to constant changes. This‘green’ regime has however its origins in the late nineteenth century when the firstinternational environmental associations and environmental treaties saw light. After WorldWar II, environmental intergovernmental organizations were established and the first nationalenvironmental ministries date from the early 1970s (Meyer, 1997). Since then, environmentalregulation developed into a complex and diversified body that affected all layers of society. Interms of financial impacts, pollution abatement and control expenditures in mostindustrialized countries increased on average to some 2-3% of GDP (Kalt, 1988).In an era of globalization, measured by increasing transnational trade and investments, it isnot surprising that industrial leaders and policy makers are very sensitive to a possibledeterioration of national competitiveness as a consequence of environmental regulation that isrelatively more stringent compared to other nations. The argument of competitiveness has notonly been used to oppose national and supranational environmental legislation (like the USClean Air Act or the proposed European CO2-tax), it also strongly influenced negotiations onglobal issues like stratospheric ozone, acid rain and climate change. The 1997 Kyoto Protocolto the United Nations Framework Convention on Climate Change has clearly been shaped byconsiderations on possible losses of competitiveness vis-à-vis developing countries that wouldnot incur similar greenhouse abatement expenditures.Is competitiveness a political issue because of an accellerating globalization or is there clearevidence of a negative impact of environmental regulation on national or regional economicperformance? This needs further research because if undesirable impacts of stricter regulationare recognized in advance, environmental policies can be redesigned to reduce them toacceptable levels.In the next sections, we will present the hypotheses on the impacts of environmentalregulation. After an overview of the empirical findings, we will focus on the essence ofcomparative advantage and add aspects of product differentiation and of exportdiversification. Our findings will be used to shape the optimal framework for an empirical testof the Porter hypothesis for the sectors that are directly influenced by specific environmentalregulation or agreements.We conclude with some considerations on the nature of competition among major ‘dirty’industries.
2.The hypotheses on environment and competitivity
From an impressive body of surveys (more than hundred (Jaffe, 1995)) on the link betweenenvironmental regulation and competitiveness, we can extract three hypotheses :
5
- the industrial-flight hypothesis : environmental regulation would push an increasing numberof industries out of the advanced industrial countries ;- the pollution-haven hypothesis : less-developed countries would use lenient environmentalregulations to attract multinational industries ;- the Porter hypothesis : efficient regulation may stimulate innovation, productivity andcompetitivity.
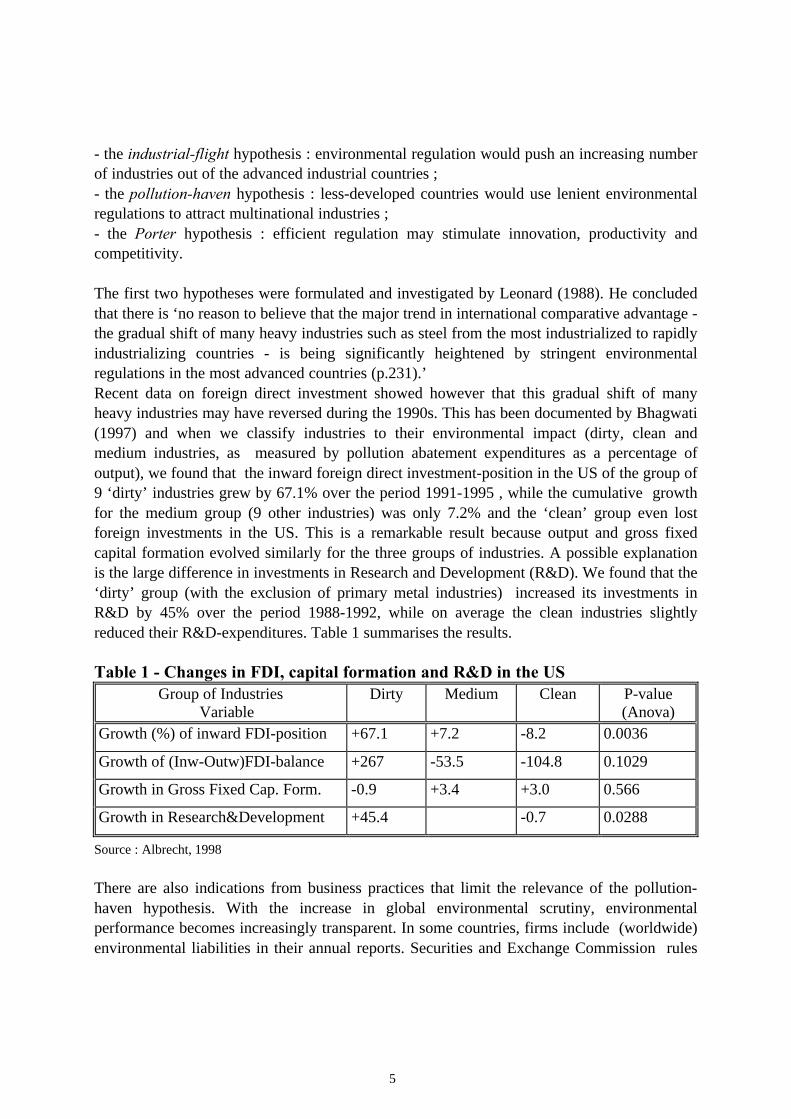
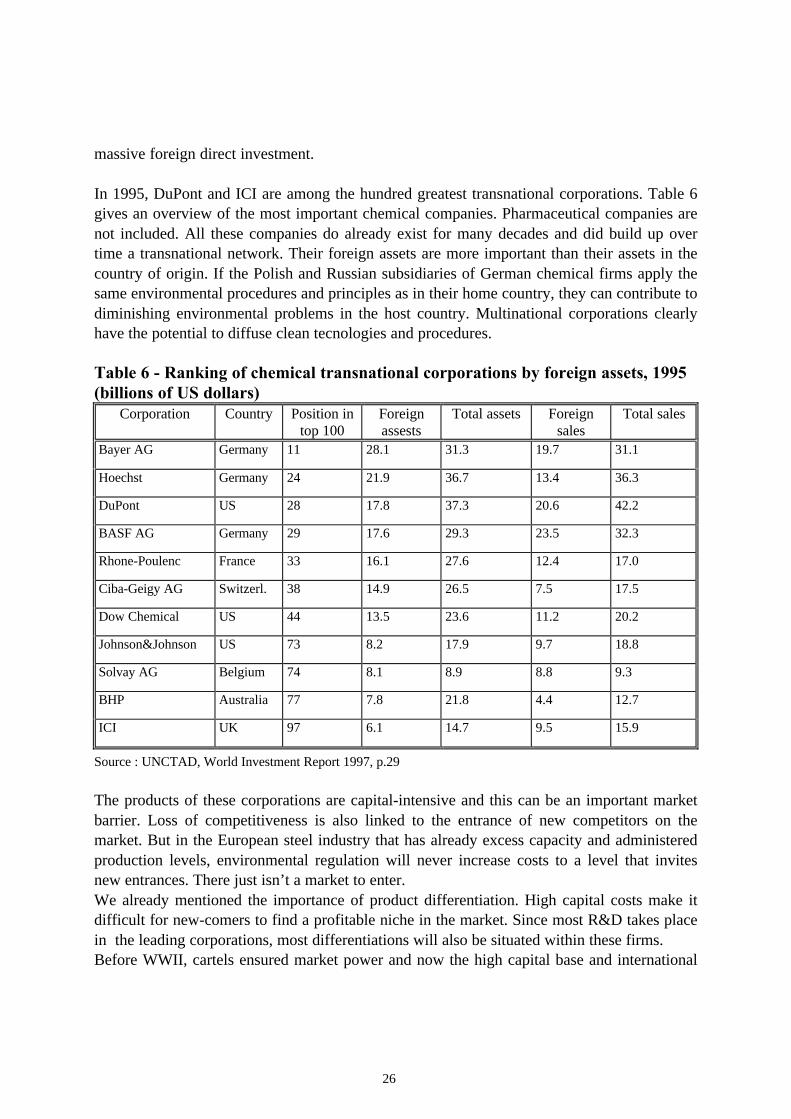
The first two hypotheses were formulated and investigated by Leonard (1988). He concludedthat there is ‘no reason to believe that the major trend in international comparative advantage -the gradual shift of many heavy industries such as steel from the most industrialized to rapidlyindustrializing countries - is being significantly heightened by stringent environmentalregulations in the most advanced countries (p.231).’Recent data on foreign direct investment showed however that this gradual shift of manyheavy industries may have reversed during the 1990s. This has been documented by Bhagwati(1997) and when we classify industries to their environmental impact (dirty, clean andmedium industries, as measured by pollution abatement expenditures as a percentage ofoutput), we found that the inward foreign direct investment-position in the US of the group of9 ‘dirty’ industries grew by 67.1% over the period 1991-1995 , while the cumulative growthfor the medium group (9 other industries) was only 7.2% and the ‘clean’ group even lostforeign investments in the US. This is a remarkable result because output and gross fixedcapital formation evolved similarly for the three groups of industries. A possible explanationis the large difference in investments in Research and Development (R&D). We found that the‘dirty’ group (with the exclusion of primary metal industries) increased its investments inR&D by 45% over the period 1988-1992, while on average the clean industries slightlyreduced their R&D-expenditures. Table 1 summarises the results.
Table 1 - Changes in FDI, capital formation and R&D in the USGroup of Industries
VariableDirty Medium Clean P-value
(Anova)Growth (%) of inward FDI-position +67.1 +7.2 -8.2 0.0036
Growth of (Inw-Outw)FDI-balance +267 -53.5 -104.8 0.1029
Growth in Gross Fixed Cap. Form. -0.9 +3.4 +3.0 0.566
Growth in Research&Development +45.4 -0.7 0.0288
Source : Albrecht, 1998
There are also indications from business practices that limit the relevance of the pollution-haven hypothesis. With the increase in global environmental scrutiny, environmentalperformance becomes increasingly transparent. In some countries, firms include (worldwide)environmental liabilities in their annual reports. Securities and Exchange Commission rules
6
in the United States, for example, dictate that companies clearly must state potentialenvironmental liabilities.In the aftermath of the Bhophal disaster at a Union Carbide subsidiary in India, a growingnumber of American chemical plants have made it company policy to apply the same rulesand environmental standards worldwide (Cairncross, 1992). Dunning (1993, p.539) refers to aGerman study which demonstrated that 90% of the firms surveyed claimed to use the sameenvironmental techniques in developing countries as in West- Germany. If this principlewould be adopted in national legislations or in supranational agreements, some environmentalincentives to move to less stringent countries might be eliminated.Some industrializing countries and their business associations explicitly demand the use ofclean production technologies in investment projects of multinationals. The ThailandLeadership Initiave solicited commitment of multinational companies to halt their use ofozone-depleting substances and the Vietnam Pledge by more than forty multinationalcompanies from seven countries was to invest only in modern, environmentally acceptabletechnology in their Vietnam projects (Fujimoto, 1997)
3.How have the three hypotheses been tested?
We gave already some indications on the (limited) validity of the pollution-haven hypothesisfor the US. Broader overviews can be obtained from Rausher (1997), Jaffe (1995),Markandya (1994) and The World Bank (1992, edited by Patrick Low).The World Bank (p.13) draws a number of tentative general conclusions from the analysedsurveys :
- dirty industries have expanded faster in developing countries than the average rate for allindustries but this pattern can merely reflect growth or industrial migration as well ;- pollution abatement and control expenditures by firms do not appear to have a significanteffect on competitiveness in most industries which suggests that national differences inenvironmental regulations have not been a major explanatory factor in the changinginternational pattern of location of dirty industries ;- pollution intensity per capita appears to fall as income rises (the green Kuznets-curve) ;- the effects of growth and trade liberalization on environmental quality are ambiguous ;- fast-growing economies with liberal trade policies have experienced less pollution-intensivegrowth than closed economies, and- firms seem to have good reason not to transfer dirtier technologies to lower incomecountries when they invest in these countries.
Markandya (1994) answers the related question ‘is free trade compatible with sustainabledevelopment’ with a (slightly) qualified ‘yes’. Most conflicts between environmental andtrade concerns can be resolved by the choice of appropriate instruments in global tradeframeworks like the World Trade Organization (WTO).
7
In their analysis of the maquiladora programme, Grossman and Krueger (1992) find thatpollution abatement costs were not a significant determinant of US-Mexican trade. Jaffe(1995) concludes that there is relatively little evidence to support any of the three hypotheses.He states that the literature on the Porter hypothesis remains one ‘with a high ratio ofspeculation and anecdote to systematic evidence (p.157).’Some possible explanations for the weak empirical link are also given : limited ability tomeasure the relative stringency of environmental regulations, the relatively small cost ofcomplying with environmental regulation, relatively small differences between regulations inthe US and in the other western industrial democracies and the fact that multinationals shouldbe reluctant to build less-than-state-of-the-art plants in foreign countries.Similar conclusions are presented by Rauscher (1997). He also stresses two importantproblems intrinsic to the input-output or Leontief approach that is used in many surveys. First,most analyses are only bivariate and neglect as such many other factors. Secondly, pollutionabatement data are only considered for the country under consideration but not for its tradingpartners. This is a practice that not only depends on the problems with comparing nationalregulations, but also on the limited information on the enforcement of regulations in manycountries with a less explicit environmental profile. There is also the fact that manyenvironmental investments have a ‘once-and-for-all’ character, especially when industries optfor end-of-pipe clean-up investments (UNIDO, 1990). When regulators impose stricterstandards, industries make an adapting investment. This means that the environmentalexpenditures are relatively high in the first years after the new regulations. As a result, whencost profiles or export performances of industries are compared, the period of analysis iscrucial when different countries have different periods of regulatory implementation. Andthis problem is probably too complicated to be captured with lead- and lag-variables inempirical surveys.Rauscher also mentions the survey of Rowland and Feiock (1991) that concludes thatenvironmental regulation affected investment decisions of the chemical industry in the UnitedStates. The relationship is non-linear : there should be a threshold value of pollution-abatement expenditures below which dislocation effects of changes in environmental policycannot be observed.A general remark on these (and most of the other) surveys is that environmental costs arerarely directly linked to specific products. Most authors work with ‘dirty’ industries like steel,chemicals and paper. This approach reduces environmental costs to a part of generaloverheads (like administration). We think it is better to link environmental costs to specificproducts like detailed chemical subsectors or specific steel or paper products. In a later test ofthe Porter hypothesis, this product-specific link will generate good results.
A crucial survey (cited in Jaffe), for its methodology and interpretation by other authors, hasbeen made by Kalt (1988). Kalt gives an overview of the environmental regulatory costs andcalculates these for 78 SIC-industries making use of input-output tables. Starting from aHeckscher-Ohlin-Leamer framework, Kalt explains the variation in net export performance
8
for 1977 by using as independent variables pollution abatement costs, capital, R&D, humancapital and unskilled labor. Without a correction for heteroscedasticity, the environmentalvariable (pollution abatement) was only significant for manufacturing and not for all input-output industries. With the heteroscedasticity correction, pollution abatement proved only tobe significant for manufacturing without chemicals. The coefficient was negative as expected.The other significant variables were R&D and human capital. Rather surprisingly, the sign ofhuman capital was negative. Kalt concludes that environmental regulations had in 1977 aclear negative impact on US trade performance.Most authors that review the survey of Kalt do not come to the same conclusions. They do notfocus on the year 1977 of which Kalt clearly states that, at that time, the fraction of theresources in the US devoted to abatement were ‘at the upper end of the distribution’ of privatesector investments in pollution control in 10 industrialized countries. This suggests howeverthat if the same analysis was made 5 or 10 years later, the results could be different.Jaffe (1995) states that ‘it is troubling however, that the magnitude and significance of theeffect [of the environmental variable] was increased even further when the chemical industrywas excluded from the sample, because this is an industry with relatively high environmentalcompliance costs (p.143).’ If the impact of pollution abatement would be significant for allindustries (what it almost is with a t-statistic of -1.93), most authors would probably agreewith Kalt. And this is a recurrent objective of most of the empirical surveys : there should be aclear link between environmental regulation and the (export) performance of all ‘dirty’industries. In our opinion, this is not a good test.Since the starting point of many of these surveys is an interpretation of the H-O-framework,why are the results not interpreted according to the fundamentals of the principle ofcomparative advantage? If a country performs worst in all industries (for reasons of extremelyhigh environmental costs), it will still have a comparative advantage in some of thoseindustries while other activities might be taken over by countries with less stringentregulations.The findings of Kalt could be interpreted as a clear comparative advantage of the US inchemicals compared to the other industries that have to face environmental expenditures.Similarly, if there is clear evidence of a relocation of wood furniture firms from California toMexico, or from Germany to Poland, this should not be considered as a ‘too specific’ case,not suitable for generalizations. Wood furniture is clearly one of the industries in which thecomparative advantage is lost to countries that offer a mixture of cost advantages of whichenvironmental costs are a part of. That other sectors do not migrate is not a counterargumentbut an expected logical consequence of the H-O-framework. In a next section, we willdiscuss the weight of a sector like wood furniture in total trade performance.
4.Comparative advantage and environmental costs
The main conclusion of the Heckscher-Ohlin model (and extensions like Leamer, Vanek) isthat countries export commodities that are relatively intensive in the relatively abundant factor
9
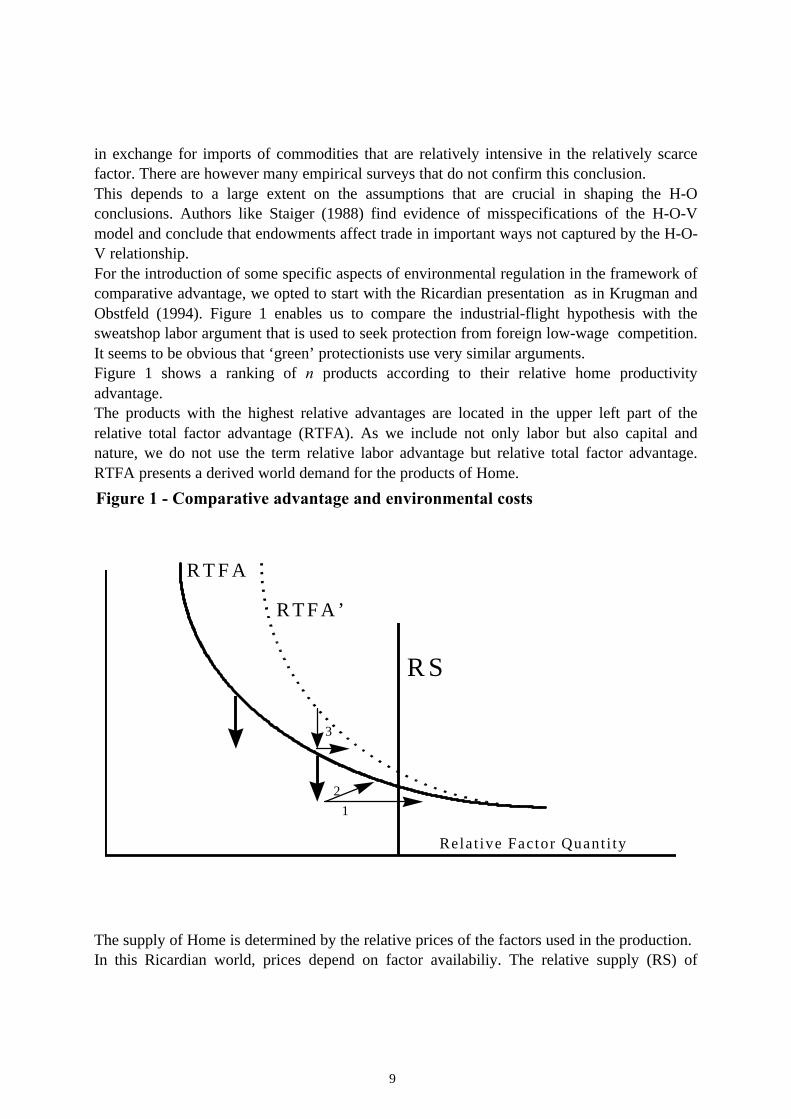
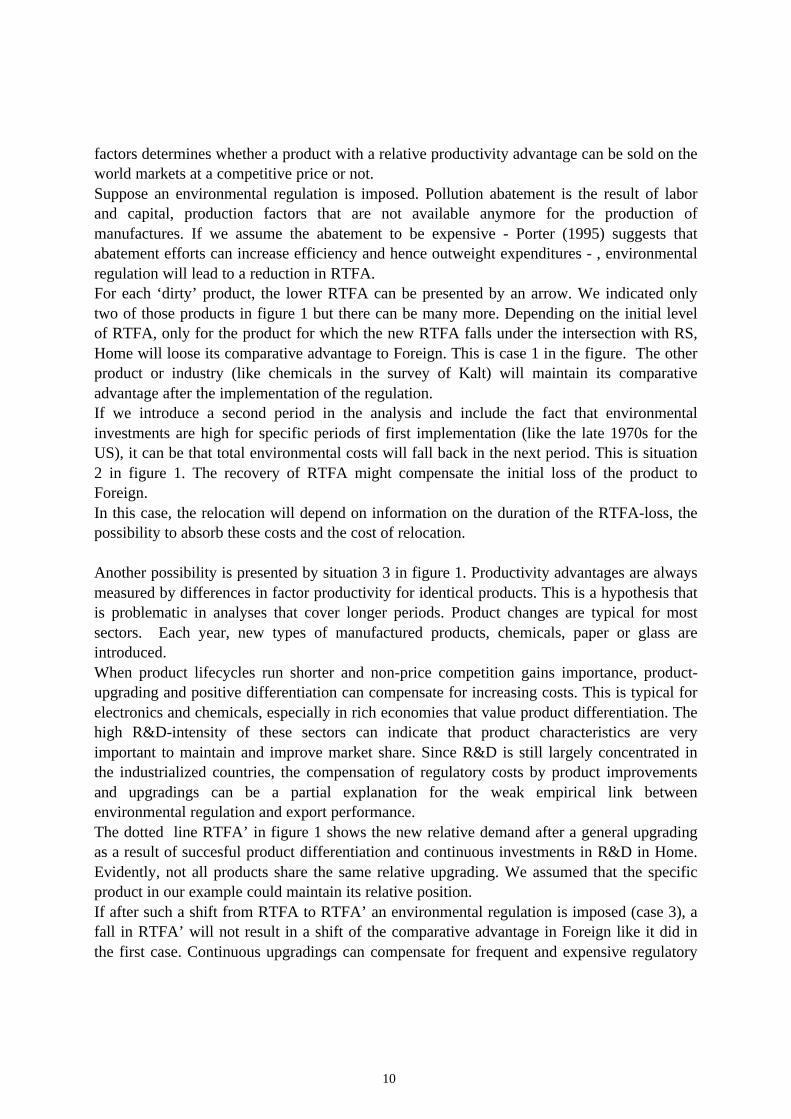
in exchange for imports of commodities that are relatively intensive in the relatively scarcefactor. There are however many empirical surveys that do not confirm this conclusion.This depends to a large extent on the assumptions that are crucial in shaping the H-Oconclusions. Authors like Staiger (1988) find evidence of misspecifications of the H-O-Vmodel and conclude that endowments affect trade in important ways not captured by the H-O-V relationship.For the introduction of some specific aspects of environmental regulation in the framework ofcomparative advantage, we opted to start with the Ricardian presentation as in Krugman andObstfeld (1994). Figure 1 enables us to compare the industrial-flight hypothesis with thesweatshop labor argument that is used to seek protection from foreign low-wage competition.It seems to be obvious that ‘green’ protectionists use very similar arguments.Figure 1 shows a ranking of n products according to their relative home productivityadvantage.The products with the highest relative advantages are located in the upper left part of therelative total factor advantage (RTFA). As we include not only labor but also capital andnature, we do not use the term relative labor advantage but relative total factor advantage.RTFA presents a derived world demand for the products of Home.
The supply of Home is determined by the relative prices of the factors used in the production.In this Ricardian world, prices depend on factor availabiliy. The relative supply (RS) of
Figure 1 - Comparative advantage and environmental costs
12
3
R S
Relat ive Factor Quant i ty
R T F A
R T F A ’
10
factors determines whether a product with a relative productivity advantage can be sold on theworld markets at a competitive price or not.Suppose an environmental regulation is imposed. Pollution abatement is the result of laborand capital, production factors that are not available anymore for the production ofmanufactures. If we assume the abatement to be expensive - Porter (1995) suggests thatabatement efforts can increase efficiency and hence outweight expenditures - , environmentalregulation will lead to a reduction in RTFA.For each ‘dirty’ product, the lower RTFA can be presented by an arrow. We indicated onlytwo of those products in figure 1 but there can be many more. Depending on the initial levelof RTFA, only for the product for which the new RTFA falls under the intersection with RS,Home will loose its comparative advantage to Foreign. This is case 1 in the figure. The otherproduct or industry (like chemicals in the survey of Kalt) will maintain its comparativeadvantage after the implementation of the regulation.If we introduce a second period in the analysis and include the fact that environmentalinvestments are high for specific periods of first implementation (like the late 1970s for theUS), it can be that total environmental costs will fall back in the next period. This is situation2 in figure 1. The recovery of RTFA might compensate the initial loss of the product toForeign.In this case, the relocation will depend on information on the duration of the RTFA-loss, thepossibility to absorb these costs and the cost of relocation.
Another possibility is presented by situation 3 in figure 1. Productivity advantages are alwaysmeasured by differences in factor productivity for identical products. This is a hypothesis thatis problematic in analyses that cover longer periods. Product changes are typical for mostsectors. Each year, new types of manufactured products, chemicals, paper or glass areintroduced.When product lifecycles run shorter and non-price competition gains importance, product-upgrading and positive differentiation can compensate for increasing costs. This is typical forelectronics and chemicals, especially in rich economies that value product differentiation. Thehigh R&D-intensity of these sectors can indicate that product characteristics are veryimportant to maintain and improve market share. Since R&D is still largely concentrated inthe industrialized countries, the compensation of regulatory costs by product improvementsand upgradings can be a partial explanation for the weak empirical link betweenenvironmental regulation and export performance.The dotted line RTFA’ in figure 1 shows the new relative demand after a general upgradingas a result of succesful product differentiation and continuous investments in R&D in Home.Evidently, not all products share the same relative upgrading. We assumed that the specificproduct in our example could maintain its relative position.If after such a shift from RTFA to RTFA’ an environmental regulation is imposed (case 3), afall in RTFA’ will not result in a shift of the comparative advantage in Foreign like it did inthe first case. Continuous upgradings can compensate for frequent and expensive regulatory
11
changes.In figure 1, we worked with downward arrows to illustrate the introduction of environmentalcosts. Similar results could be obtained when shifting RS to the right : pollution abatementextracts factors from the pool of available resources for production.These three aspects of environmental costs illustrate that it is far from easy to integrate allthese considerations in a conclusive empirical test.
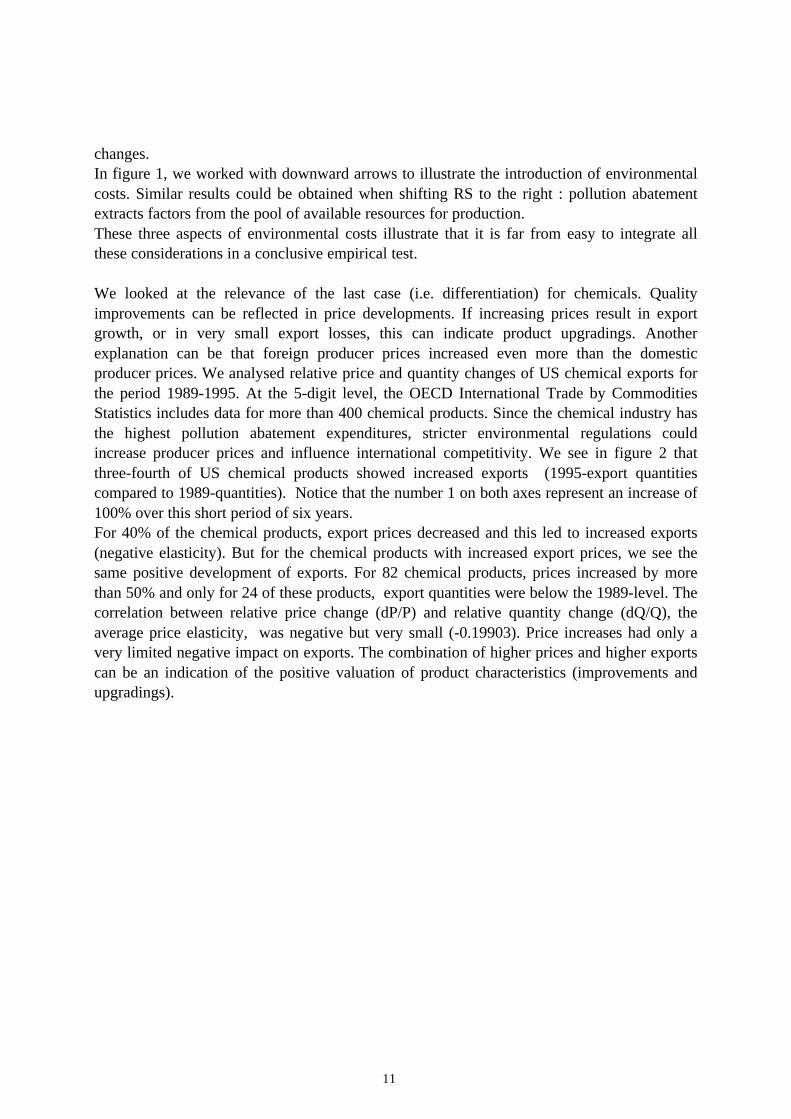
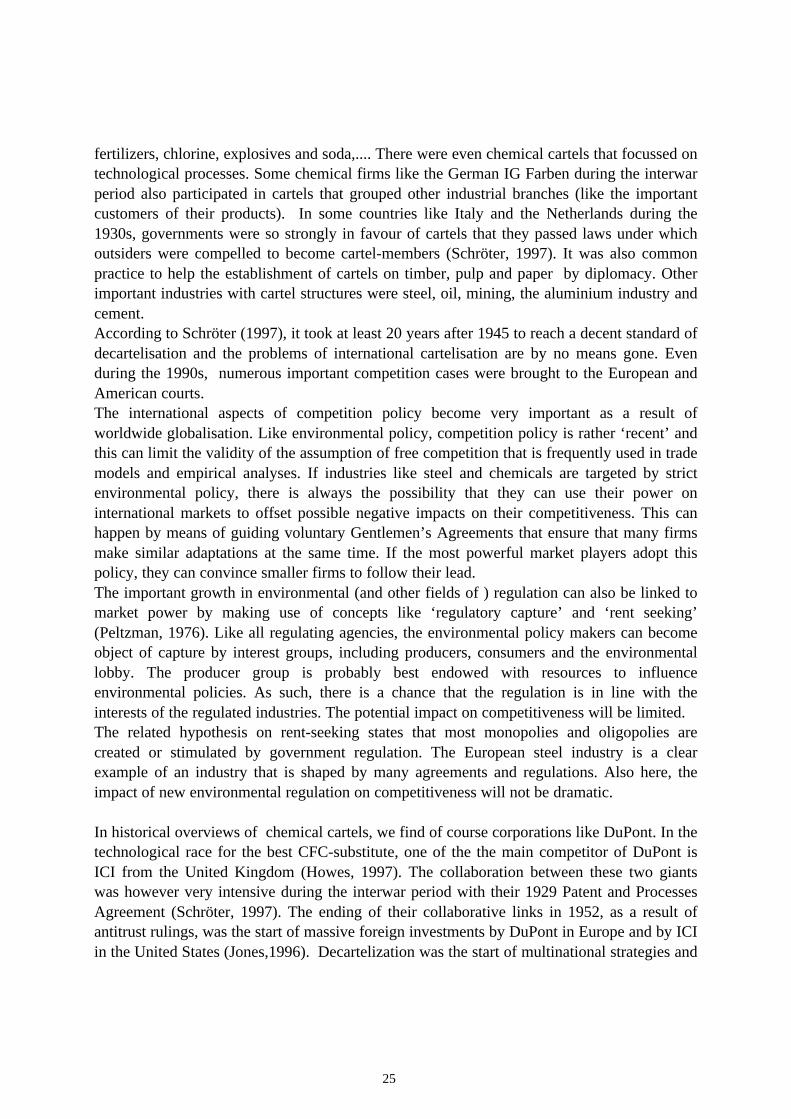
We looked at the relevance of the last case (i.e. differentiation) for chemicals. Qualityimprovements can be reflected in price developments. If increasing prices result in exportgrowth, or in very small export losses, this can indicate product upgradings. Anotherexplanation can be that foreign producer prices increased even more than the domesticproducer prices. We analysed relative price and quantity changes of US chemical exports forthe period 1989-1995. At the 5-digit level, the OECD International Trade by CommoditiesStatistics includes data for more than 400 chemical products. Since the chemical industry hasthe highest pollution abatement expenditures, stricter environmental regulations couldincrease producer prices and influence international competitivity. We see in figure 2 thatthree-fourth of US chemical products showed increased exports (1995-export quantitiescompared to 1989-quantities). Notice that the number 1 on both axes represent an increase of100% over this short period of six years.For 40% of the chemical products, export prices decreased and this led to increased exports(negative elasticity). But for the chemical products with increased export prices, we see thesame positive development of exports. For 82 chemical products, prices increased by morethan 50% and only for 24 of these products, export quantities were below the 1989-level. Thecorrelation between relative price change (dP/P) and relative quantity change (dQ/Q), theaverage price elasticity, was negative but very small (-0.19903). Price increases had only avery limited negative impact on exports. The combination of higher prices and higher exportscan be an indication of the positive valuation of product characteristics (improvements andupgradings).
12
Figure 2 - Relative changes in export prices and quantities for US chemicals andrelated products, 1989-1995
But if we assume that some industries like wood furniture migrate to or grow faster indeveloping countries, the fundamental question remains : is this the result from a pattern ofgrowth in developing countries or is it the result of differences in environmental regulation?The first scenario could be the result of a pattern of global convergence in industrial activity.Empirical research can not confirm a trend of global convergence. Verspagen (1995)concludes in his historical overview on convergence of national pro capita incomes that thereis no global trend. In the post-war period, convergence only took place in the OECDcountries.More related to our analysis of comparative advantage, Bernard and Jones (1996) find for 14OECD countries during 1970-1987 that manufacturing ( including the dirty industries) showslittle or no evidence of convergence in labor or multifactor productivity, even after theintroduction of a new measure of multifactor productivity.For other sectors, especially services, they found strong evidence in favor of convergence.When we compare OECD countries to developing countries, the differences are expected tobe more pronounced. As a general indicator of convergence or divergence, we can useindices of export diversification. Does export diversification follow the same pattern in OECDand developing countries or not? In the a section, we will link this index to labor productivity.
5.Diversification of exports
Most surveys cited in section 3 analyse exports of chemicals, paper, iron and steel and somemanufactured goods. We already suggested that analyses at the level of the product should bepreferred. Only a few surveys make use of sectoral classifications at the 2-digit level. Using
-1
0
1
2
3
4
5
-1 0 1 2 3
dP/P
dQ/Q
13
the OECD International Trade by Commodities Statistics ITCS/SITC, Revision 3, this level ofdetail (2-digit) results in trade-data for 72 products or sectors. At the 3-digit level, the OECDITCS includes trade data for 312 products, at the 4-digit level 1170 products are defined andthe 5-digit level includes data for 2831 products. The chemical industry should be the mostdirty industry. But what part of the chemical industry is dirty and are there clean chemicalsubsectors? At the 4-digit level of analysis we have already 141 chemical products, at the 5-digit level even 443.Some manufactured goods are also considered as dirty. But, as an example, wood furniture isonly one of the 249 products at the 4-digit level, and one (with subclassifications) of the 804products at the 5-digit level.We can conclude that surveys at the 1 or 2-digit level can only generate rather crudeapproximations of what is the impact of environmental regulations on ‘dirty’ industries.A second conclusion is that the loss of a significant part of the wood furniture industry is verybad news for the concerned workers and firms but for the record of national exportperformance, it will not have a dramatic impact. If the US or Germany would loose over aperiod of 20 years their comparative advantage for some 20 to 30 chemical subsectors, is thisa problem if over the same period 40 new subsectors have been created and developed, or iffor some 15 other subsectors the comparative advantage was regained? Recoveries of lostexports are not exceptional ; the product ‘sulphides : polysulphides’ (ITCS 52315) wasimported in the US since 1978 and it entered US exports only in 1989 ($ 12.8 mill.).
UNCTAD calculates an index of export diversification at the three-digit SITC, Revision 2.This index is based on 239 products and is Hirschmann-normalized to calculate valuesranking from 0 (perfect diversification, no concentration) to 1 (complete concentration, nodiversification), according to the formula :
Hj
xX
i
i=
−
−=
∑( ( ) ) /
/
212
1
239
1 239
1 1 239
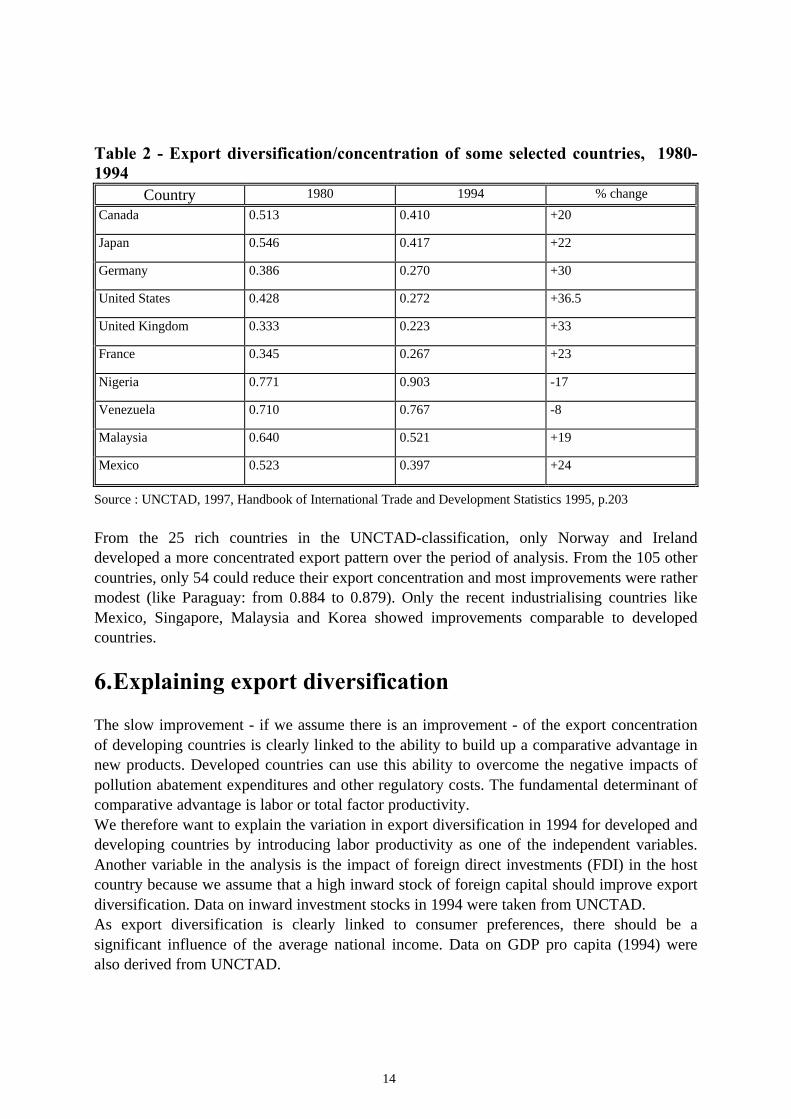
where j is the country index, xi the value of exports of commodity i and X is total exports ofcountry j.If we compare indices of diversification for 1980 and 1994, table 2 shows that there is astriking difference between developed and developing countries. The right colum calculatesthe relative improvement in terms of more diversification (here a reduction in Hj).
14
Table 2 - Export diversification/concentration of some selected countries, 1980-1994
Country 1980 1994 % changeCanada 0.513 0.410 +20
Japan 0.546 0.417 +22
Germany 0.386 0.270 +30
United States 0.428 0.272 +36.5
United Kingdom 0.333 0.223 +33
France 0.345 0.267 +23
Nigeria 0.771 0.903 -17
Venezuela 0.710 0.767 -8
Malaysia 0.640 0.521 +19
Mexico 0.523 0.397 +24
Source : UNCTAD, 1997, Handbook of International Trade and Development Statistics 1995, p.203
From the 25 rich countries in the UNCTAD-classification, only Norway and Irelanddeveloped a more concentrated export pattern over the period of analysis. From the 105 othercountries, only 54 could reduce their export concentration and most improvements were rathermodest (like Paraguay: from 0.884 to 0.879). Only the recent industrialising countries likeMexico, Singapore, Malaysia and Korea showed improvements comparable to developedcountries.
6.Explaining export diversification
The slow improvement - if we assume there is an improvement - of the export concentrationof developing countries is clearly linked to the ability to build up a comparative advantage innew products. Developed countries can use this ability to overcome the negative impacts ofpollution abatement expenditures and other regulatory costs. The fundamental determinant ofcomparative advantage is labor or total factor productivity.We therefore want to explain the variation in export diversification in 1994 for developed anddeveloping countries by introducing labor productivity as one of the independent variables.Another variable in the analysis is the impact of foreign direct investments (FDI) in the hostcountry because we assume that a high inward stock of foreign capital should improve exportdiversification. Data on inward investment stocks in 1994 were taken from UNCTAD.As export diversification is clearly linked to consumer preferences, there should be asignificant influence of the average national income. Data on GDP pro capita (1994) werealso derived from UNCTAD.
15
For the data on labor productivity, we followed the Cobb-Douglas approach by Hall andJones (1997). The main problem with Cobb-Douglas production functions (see formula 6.1)that are used to make comparisons of productivity across many countries, is that the parameter� mostly differs. As a result, entering identical inputs will then produce different output,mostly for reasons of different technological infrastructures. Therefore, we need to find ameasure to capture different technological capabilities across countries.Hall and Jones introduce in the production function the amount of human capital-augmentedlabor (Hi) and a ‘basic’ labour-augmenting measure of productivity (Ai).
Y K A Hi i i i= −α α( )1
Output Yi in country i is then produced according towhere Ki denotes the stock of physical capital.The value of the human capital-augmented labor is depending on the years of schooling foreach country.Hall and Jones rewrite the production function in terms of output per worker (yi =Y/L), withLi as homogeneous labor ;
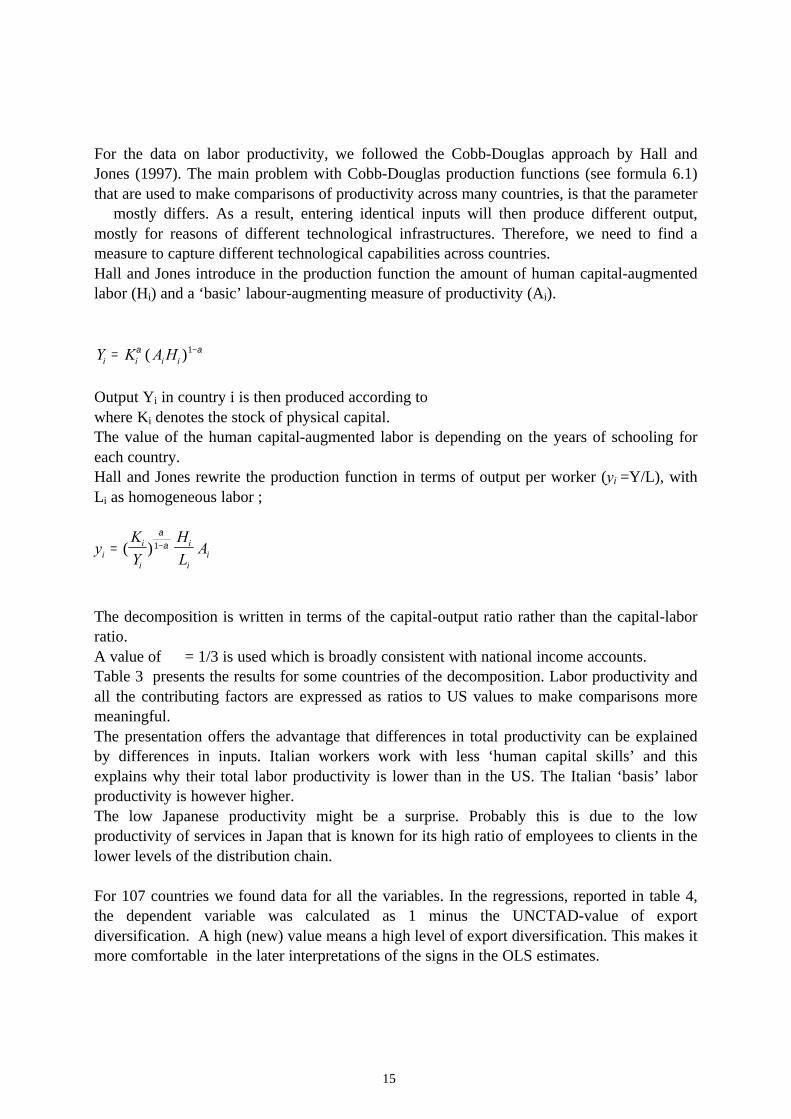
The decomposition is written in terms of the capital-output ratio rather than the capital-laborratio.A value of ∀ = 1/3 is used which is broadly consistent with national income accounts.Table 3 presents the results for some countries of the decomposition. Labor productivity andall the contributing factors are expressed as ratios to US values to make comparisons moremeaningful.The presentation offers the advantage that differences in total productivity can be explainedby differences in inputs. Italian workers work with less ‘human capital skills’ and thisexplains why their total labor productivity is lower than in the US. The Italian ‘basis’ laborproductivity is however higher.The low Japanese productivity might be a surprise. Probably this is due to the lowproductivity of services in Japan that is known for its high ratio of employees to clients in thelower levels of the distribution chain.
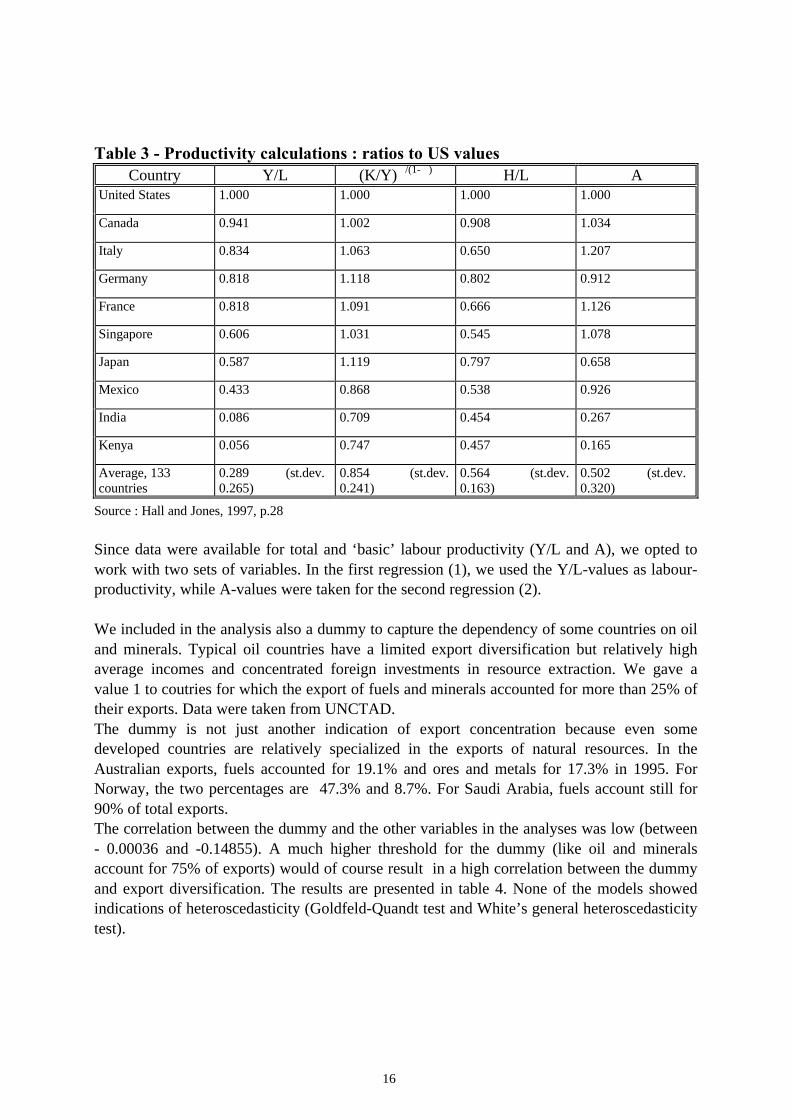
For 107 countries we found data for all the variables. In the regressions, reported in table 4,the dependent variable was calculated as 1 minus the UNCTAD-value of exportdiversification. A high (new) value means a high level of export diversification. This makes itmore comfortable in the later interpretations of the signs in the OLS estimates.
yKY
HL
Aii
i
i
ii= −( )
αα1
16
Table 3 - Productivity calculations : ratios to US valuesCountry Y/L (K/Y)�/(1-�) H/L A
United States 1.000 1.000 1.000 1.000
Canada 0.941 1.002 0.908 1.034
Italy 0.834 1.063 0.650 1.207
Germany 0.818 1.118 0.802 0.912
France 0.818 1.091 0.666 1.126
Singapore 0.606 1.031 0.545 1.078
Japan 0.587 1.119 0.797 0.658
Mexico 0.433 0.868 0.538 0.926
India 0.086 0.709 0.454 0.267
Kenya 0.056 0.747 0.457 0.165
Average, 133countries
0.289 (st.dev.0.265)
0.854 (st.dev.0.241)
0.564 (st.dev.0.163)
0.502 (st.dev.0.320)
Source : Hall and Jones, 1997, p.28
Since data were available for total and ‘basic’ labour productivity (Y/L and A), we opted towork with two sets of variables. In the first regression (1), we used the Y/L-values as labour-productivity, while A-values were taken for the second regression (2).
We included in the analysis also a dummy to capture the dependency of some countries on oiland minerals. Typical oil countries have a limited export diversification but relatively highaverage incomes and concentrated foreign investments in resource extraction. We gave avalue 1 to coutries for which the export of fuels and minerals accounted for more than 25% oftheir exports. Data were taken from UNCTAD.The dummy is not just another indication of export concentration because even somedeveloped countries are relatively specialized in the exports of natural resources. In theAustralian exports, fuels accounted for 19.1% and ores and metals for 17.3% in 1995. ForNorway, the two percentages are 47.3% and 8.7%. For Saudi Arabia, fuels account still for90% of total exports.The correlation between the dummy and the other variables in the analyses was low (between- 0.00036 and -0.14855). A much higher threshold for the dummy (like oil and mineralsaccount for 75% of exports) would of course result in a high correlation between the dummyand export diversification. The results are presented in table 4. None of the models showedindications of heteroscedasticity (Goldfeld-Quandt test and White’s general heteroscedasticitytest).
17
Table 4 - OLS estimates for export diversification (107 countries)(t-statistics in parentheses, 5%-level of significance)Variable (1) OLS with Basic Labor
Productivity (A)(2) OLS with Total LaborProductivity (Y/L)
Constant -0.2262(-4.391)
-0.0754(-2.381)
LN(GDP pro capita) 0.0213(2.173)
Labor productivity 0.1279(2.416)
0.2840(6.201)
LN(Inward FDI-stock) 0.0412(8.333)
0.0399(8.400)
Dummy (fuels & minerals) -0.1094(-5.139)
-0.1097(-5.322)
Adjusted R2 0.7454 0.7593
F-value 78.591 112.507
Sign.F 2.77E-30 2.25E-32
Number of observations 107 107
In the second regression, the variable LN(GDP pro capita) was excluded because this resultedin a clear case of multicollinearity. In a first estimate of the regression, we found contrary toour expectations, that the coefficient of LN(GDP pro capita) was not significant (t-statistic : -0.2225) and the sign was negative. The very high correlation (0.886) between Y/L andLN(GDP pro capita) was responsible for this result. In regression (1) the basic laborproductivity A clearly did not capture the same income-effect (in terms of available humanand non-human capital). The correlation with LN(GDP pro capita) is not disturbing. The signof the coefficient of LN(GDP pro capita) in (1) is positive and the t-statistic is good.From the results it is clear that labour productivity (both total and ‘basic’) is a crucial factorin explaining export diversification. Using Y/L gave the best results. The high laborproductivity in developed countries will as such guarantee high levels of exports for longperiods of time. Total productivity is clearly linked to the level of income and this can explainwhy rich countries do not face en masse migrations of major industries. The results also showthat inward FDI can help to improve export diversification. As expected, the sign of thedummy is negative.
7.The Porter Hypothesis
In the previous section, we illustrated that the diversified export patterns of developedcountries are only to a very limited extent vulnerable for the negative impacts of
18
environmental regulation. This conclusion was in fact the expected result of the greatdifferences in labour productivity and the interpretation of the Heckscher-Ohlin model.Many authors do not consider the H-O-conclusions and link the not finding of a clear negativeimpact to the hypothesis articulated by Porter (1990,1995) : efficient regulations may actuallystimulate innovation, efficiency gains, industrial growth and competitiveness. This is as suchnot an appropriate test of the latter hypothesis.This positive effect of environmental regulation can be expected for the industries thatdirectly benefit from stricter regulations like manufacturers of filters and purificationequipment or importers of low-sulphur-content-coal. But also for firms in the steel, paper andchemical industry, there is clear case-evidence of reduced total costs as a result ofinvestments in cleaner production methods (UNIDO, UNEP). For these firms, environmentalregulation might bring a ‘free lunch’.There are however no surveys that present a general test of the Porter hypothesis for specificsectors or products. Some indications in favour of the Porter hypothesis for the US are offeredby Stephen Meyer (1992). He finds that US States with strict environmental laws do notdemonstrate poorer economic performance compared to less stringent US States. Jaffe (1995)suggests however that the conclusions of Meyer could indicate spurious correlation : thestrongest nations can easily invest in environmental protection while other nations have otherpriorities. But this remark is of equal importance for any test because if the most competitivenations have the most effective and the most expensive environmental policy, can we everexpect to find clear evidence for the industrial-flight or pollution-haven hypothesis?Organisations like the International Institute for Management Development (IMD) presentevery year a ranking of national competitiveness that is frequently cited in the financial press.As could be expected, the countries with the clearest environmental profile are on top of thisranking.The conclusions from the previous sections on the hypotheses of industrial flight anddelocalisation are also valid for a test of the Porter hypothesis. Export gains or losses willonly be relevant for some specific industries and it is important to work with nationalenvironmental regulations that are comparable. The regulations have to be installed andimplemented at the same moment, for the same period of time and with similar environmentalobjectives. Other important considerations should be given to enforceability of the regulationsand possible exceptions for specific firms or sectors.All this conditions make it very difficult to find a general test-case for any of the threehypothesis. In our opinion, the 1987 Montreal Protocol on Substances that Deplete the OzoneLayer (Montreal Protocol), with subsequent amendments, could be an ideal test-case for thehypotheses.
7.1. The Montreal Protocol and policy responses
In 1974, the worldwide scientific community accepted the Rowland-Molina hypothesis thatthe thin layer of stratospheric ozone could be depleted by emissions of chlorine. After the
19
announcement in 1985 of the existence of a ‘hole’ in the atmospheric ozone layer near theSouth Pole, worldwide concerns were almost immediately followed by clear actions by theinternational environmental community. The 1985 Vienna Convention for the Protection ofthe Ozone Layer was followed by the 1987 Montreal Protocol on Substances that Deplete theOzone Layer. The Montreal Protocol imposed concrete obligations to reduce production anduse of chlorine-based ozone-depleting substances (ODSs), with a grace period for developingcountries. The most important ODSs are chlorofluorocarbons (CFCs), bromofluorocarbons(halons), methyl chloroform, carbon tetrachloride, methyl bromide andhydrochlorofluorocarbons (HCFCs).Since 1987, new substances have been added and phase-out commitments have been seriouslystrenghtened. Export and import of controlled substances to non-parties were prohibited. Amultilateral fund to support phase-outs in developing countries has been established.Ten years after the signing, 162 countries did ratify the Montreal Protocol. Most developedcountries ratified in 1988, countries like Argentina, Chile, Brazil and Poland followed in 1990and the latest ratifications were made by Senegal in 1993 and Morocco in 1995 (UNEP,1998). All new supplies of ODSs, except HCFCs and methyl bromide, were phased out bydeveloped countries starting January 1, 1996. The respective phase-out deadlines for the latterare 2030 and 2010.The ratification of the Montreal Protocol ensures that all developed countries face the sametechnological substitution costs at the same time and this is one of the conditions for anoptimal test of any hypothesis on the impact of environmental regulation on specific sectors.The phasing-out of CFCs had significant consequences for the producing chemicals firms andall the industries that use CFCs. Du Pont (US) was the worldwide leading firm in theproduction of CFCs with a global market share around 20%, followed by Elf-Atochem,Allied-Signal, ICI, Solvay, Hoechst, Ausimont, Daikin and some other firms. Du Pont playeda crucial role in the implementation of the Montreal Protocol (Haas, 1992).Already in 1979, the firm developed an in-house state-of-the-art atmospheric computer modelto evaluate the potential problems associated with CFC emissions. This investment ensuredthe ability to evaluate the most recent scientific findings and to develop a pro-active strategicpolicy. In 1988 alone, DuPont spent more than $30 million for process development, marketresearch, applications testing, and small-lot production of CFC substitutes (Haas, p.214) andshortly after the release of the Ozone Trends Panel report in March 1988, the companyannounced to completely phase out the production of CFCs before the end of the century (seeappendix A for the actual position of DuPont). And of equal importance, DuPont would assistits customers in converting to chemical substitutes. The most important substitute for DuPontwas HCFCs for which the company gained important patents already in the early 1980s(Howes, 1997). This proved the long-term view of Du Pont because it clearly did not opt toenjoy the higher profits on CFCs that would follow due to the enforced scarcity ofchlorofluorocarbons. Since the sales by DuPont of CFCs totalled $600 million in 1987, TheNew York Times headed «Why DuPont Gave Up $600 Million».By its announcement, DuPont accelerated the projected phase-out what resulted in less time
20
for its competitors to find the needed CFC-substitutes. It also increased the attractiveness ofthe substitutes (mainly HCFCs) that DuPont could present to its customers. The unilateralmeasures attributed also to the public image of the firm that was the target of severalenvironmental pressure group actions around that time.The impact of DuPont as the most important market-player is also visible in the Americanimplementation of the Montreal Protocol. As a consequence of the Protocol, the US enactedmandatory controls on CFCs. In order to stimulate substitutions, the Congress passed anexcise tax on certain ozone-depleting chemicals sold or used by the manufacturer, producer orimporter (Westin,1997). The amount of the tax is determined by multiplying a base taxamount (that is every year increased) by an ‘ozone-depleting factor’ that reflects the potentialozone depletion of the chemical. This US Tax on Ozone Depleting Chemicals increasedprices of CFCs significantly. HCFCs are excluded from the tax, despite their limited but clearozone-depleting potential. Westin states that this is ‘a questionable decision (p.36)’. DuPont,as a producer of HCFCs, clearly will not regret this exception.In this perspective, it is interesting to note that the unlimited use of HCFCs is also stronglydefended by the Air-Conditioning and Refrigeration Institute (ARI, Virginia). The membersof ARI manufacture 90% of US production of refrigerators and air conditioning equipment.The ARI strongly opposed Congress proposals to establish an excise tax on HCFC, either on aper-pound basis or weighted according to ozone depletion potential. And after the EuropeanUnion proposed, at the end of 1997, an accelerated phase-out of HCFCs by 2015, the ARIwas one of the most active groups against this proposal. According to ARI (1998), theEuropean proposal could disturb the transition by equipment owners away from the moreenvironmentally-damaging CFCs. Besides, in 1996 the US consumption of HCFC was at 82%of the allowable cap amount.
Of course, the impact of industry on politics is not limited to the United States. In France, theIndustry Ministry defended strongly the benefits of Elf-Atochem that tried to delay anysubstitution. Unlike DuPont, Atochem did not have substitutes that could be marketed in avery short period. The French environmental minister even denied in 1987 any definitive linkbetween CFCs and ozone depletion (Haas, p.210). Similar practices are noticed in the SovietUnion, Japan and the United Kingdom.In 1997, the Montreal Protocol is called by the World Bank (1997) ‘the major bright spot inglobal environmental efforts’. Actual progress is being undermined by excessive CFC-production of lower quality in Russia and black market smuggling. Not every country has aneffective enforcement programme to limit these practices (see appendix B for enforcementactions by the US Environmental Protection Agency). The World Bank, in collaboration withproduction factories and the Russian government, has developed a plan to eliminate allproduction of CFCs in Russia by the year 2000.
21
7.2. Export performance of CFC-using industries
The substitution of CFCs provided an opportunity for firms that invested first in substitutingR&D and could influence the political priorities and framework that followed the MontrealProtocol. Ozone policies can provide as such a competitive advantage for the early adaptors.One could see this as an illustration of the Porter hypothesis.But assuming this pro-active strategy paid well for DuPont, did CFC-using industries alsobenefit from US policies? Otherwise, if only one industry or firm did benefit and otherindustries had to pay an ‘expensive lunch’, this is not at all a confirmation of the Porterhypothesis.CFCs are mainly used for the production of refrigerators, air conditioning equipment, fireextinguishers, foams, aerosols and solvents (used to clean many types of electronicequipment like computers).Manufacturers of refrigerating equipment will face the highest substitution costs, followed bythe manufacturers of (mainly mobile) air conditioning equipment. In the US, these two sectorsform a seventeen billion dollar industry which employs more than 136000 men and women(ARI, 1997).Since this will be the case for all the industrial countries, we will investigate whether theactive national ozone-policies of some countries did improve the competitivity of their mainCFC-using manufacturers. If this should be the case, we have a product-specific confirmationof the Porter hypothesis.
According to Haas (1992, p.206), the US position during the Montreal negotiations wassupported by Canada, Denmark, Finland, the Netherlands, New Zealand, Norway andSweden. Most countries of the EC-12, led by Britain and France, favoured only a productioncap to minimize the costs to their CFC producers. In the analysis, we therefore take the USand Denmark as the countries that favoured a pro-active strategy. Like the US, Denmark hasalso a tax on CFC and halon, a statutory order gradually banning the use of ODSs for specificpurposes and a development programme to support non-ODS technology (Danish EPA,1995).We selected France, Germany and Japan as the countries that were more hesitating about thephase-out of CFCs. For France, we referred already to Elf-Atochem, while the Japanesefeared especially the ban of CFC-solvents in their computer industry. The five selectedcountries represent a significant part of world trade in the related sectors.Since the protocol went into force on 1 January 1988, we will analyse changes in bilateraltrade flows of these five countries to their major trade partners. These trade partners differ ofcourse for each country but it is important to note that they contain also countries like Canada,Sweden, Norway, Finland, the Netherlands and New Zealand that also favoured an earlyphase-out policy. The other developed countries (Italy, Switzerland, Belgium, Spain, ...) arealso included in the analysis next to a number of developing countries like Morocco andAlgeria (trade partners of France), Mexico, Brazil, Ecuador and Venezuela (trade partners of
22
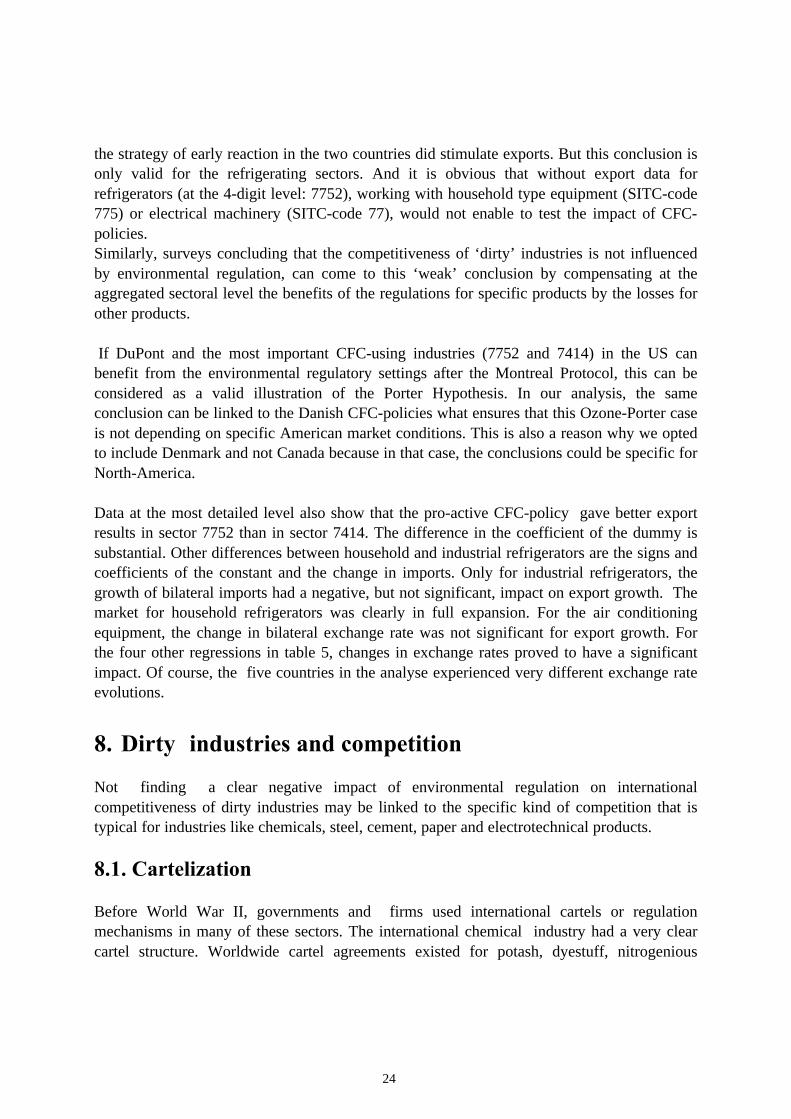
the US).We analysed trade flows for the three most important sectors that use of CFCs : householdtype refrigerators and food freezers (SITC-code 7752), refrigerators and refrigeratingequipment, except households (SITC 7414) and air conditioning machines, self-contained andparts (SITC 7415). The industrial refrigerators are used in meat industries, cold storagewarehouses, transport refrigeration, vending machines and retail food refrigeration.We used OECD-data (Rev.3) for the period 1989-1995 (not all data for 1996 were available atthe moment of the analysis). Only when trade exceeded a minimum level of $50000, thebilateral flows were included in the data sample.
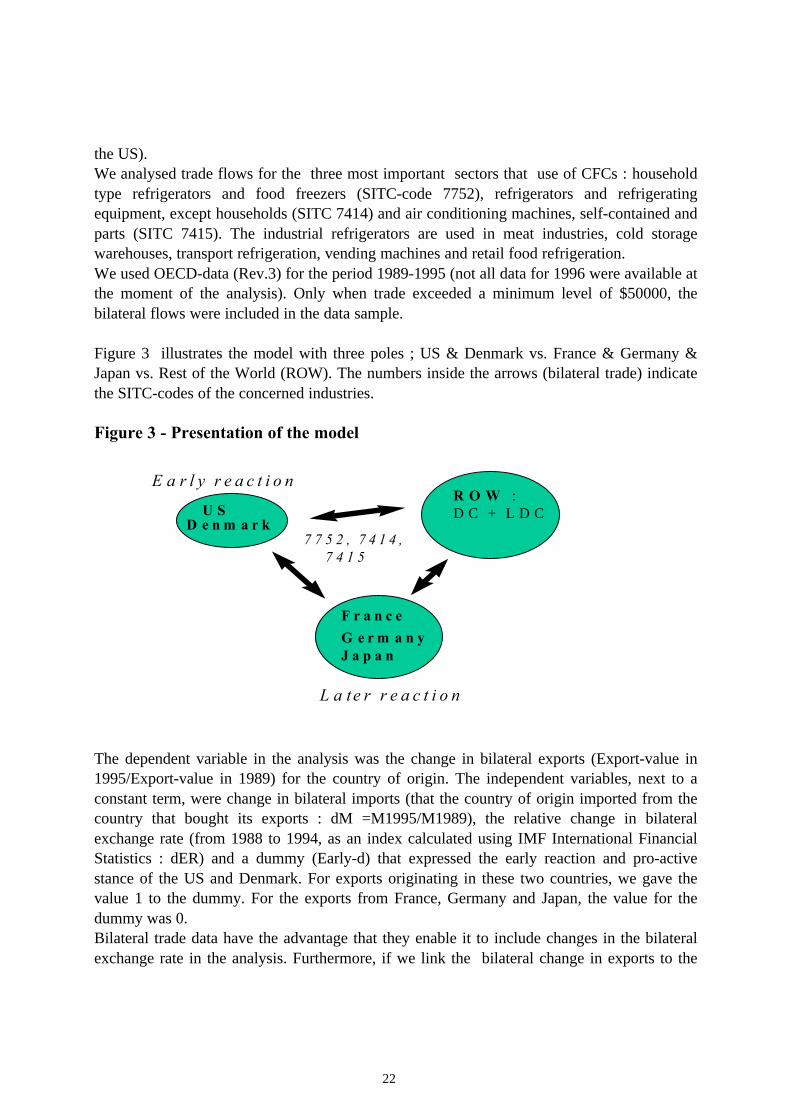
Figure 3 illustrates the model with three poles ; US & Denmark vs. France & Germany &Japan vs. Rest of the World (ROW). The numbers inside the arrows (bilateral trade) indicatethe SITC-codes of the concerned industries.
Figure 3 - Presentation of the model
The dependent variable in the analysis was the change in bilateral exports (Export-value in1995/Export-value in 1989) for the country of origin. The independent variables, next to aconstant term, were change in bilateral imports (that the country of origin imported from thecountry that bought its exports : dM =M1995/M1989), the relative change in bilateralexchange rate (from 1988 to 1994, as an index calculated using IMF International FinancialStatistics : dER) and a dummy (Early-d) that expressed the early reaction and pro-activestance of the US and Denmark. For exports originating in these two countries, we gave thevalue 1 to the dummy. For the exports from France, Germany and Japan, the value for thedummy was 0.Bilateral trade data have the advantage that they enable it to include changes in the bilateralexchange rate in the analysis. Furthermore, if we link the bilateral change in exports to the
U SD e n m a r k
F r a n c e
G e r m a n yJ a p a n
R O W :D C + L D C
7 7 5 2 , 7 4 1 4 , 7 4 1 5
E a r l y r e a c t i o n
L a te r r e a c t i o n
23
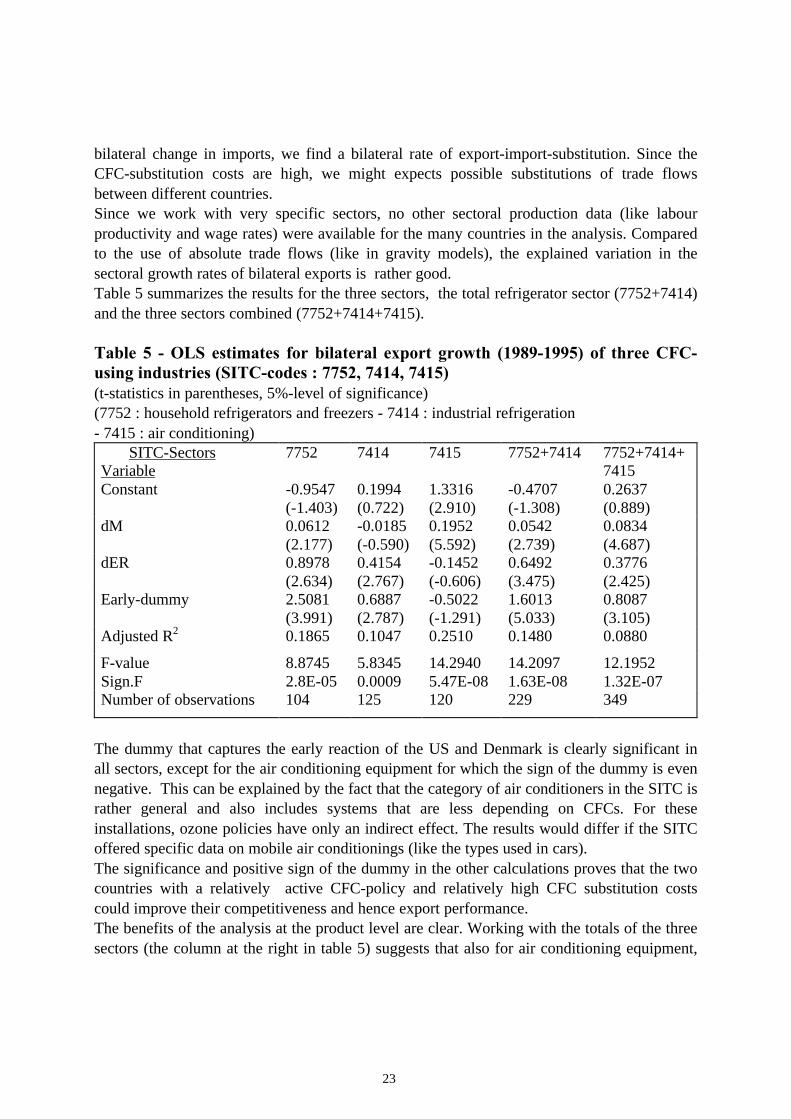
bilateral change in imports, we find a bilateral rate of export-import-substitution. Since theCFC-substitution costs are high, we might expects possible substitutions of trade flowsbetween different countries.Since we work with very specific sectors, no other sectoral production data (like labourproductivity and wage rates) were available for the many countries in the analysis. Comparedto the use of absolute trade flows (like in gravity models), the explained variation in thesectoral growth rates of bilateral exports is rather good.Table 5 summarizes the results for the three sectors, the total refrigerator sector (7752+7414)and the three sectors combined (7752+7414+7415).
Table 5 - OLS estimates for bilateral export growth (1989-1995) of three CFC-using industries (SITC-codes : 7752, 7414, 7415)(t-statistics in parentheses, 5%-level of significance)(7752 : household refrigerators and freezers - 7414 : industrial refrigeration- 7415 : air conditioning) SITC-SectorsVariable
7752 7414 7415 7752+7414 7752+7414+7415
Constant -0.9547(-1.403)
0.1994(0.722)
1.3316(2.910)
-0.4707(-1.308)
0.2637(0.889)
dM 0.0612(2.177)
-0.0185(-0.590)
0.1952(5.592)
0.0542(2.739)
0.0834(4.687)
dER 0.8978(2.634)
0.4154(2.767)
-0.1452(-0.606)
0.6492(3.475)
0.3776(2.425)
Early-dummy 2.5081(3.991)
0.6887(2.787)
-0.5022(-1.291)
1.6013(5.033)
0.8087(3.105)
Adjusted R2 0.1865 0.1047 0.2510 0.1480 0.0880
F-valueSign.F
8.87452.8E-05
5.83450.0009
14.29405.47E-08
14.20971.63E-08
12.19521.32E-07
Number of observations 104 125 120 229 349
The dummy that captures the early reaction of the US and Denmark is clearly significant inall sectors, except for the air conditioning equipment for which the sign of the dummy is evennegative. This can be explained by the fact that the category of air conditioners in the SITC israther general and also includes systems that are less depending on CFCs. For theseinstallations, ozone policies have only an indirect effect. The results would differ if the SITCoffered specific data on mobile air conditionings (like the types used in cars).The significance and positive sign of the dummy in the other calculations proves that the twocountries with a relatively active CFC-policy and relatively high CFC substitution costscould improve their competitiveness and hence export performance.The benefits of the analysis at the product level are clear. Working with the totals of the threesectors (the column at the right in table 5) suggests that also for air conditioning equipment,
24
the strategy of early reaction in the two countries did stimulate exports. But this conclusion isonly valid for the refrigerating sectors. And it is obvious that without export data forrefrigerators (at the 4-digit level: 7752), working with household type equipment (SITC-code775) or electrical machinery (SITC-code 77), would not enable to test the impact of CFC-policies.Similarly, surveys concluding that the competitiveness of ‘dirty’ industries is not influencedby environmental regulation, can come to this ‘weak’ conclusion by compensating at theaggregated sectoral level the benefits of the regulations for specific products by the losses forother products.
If DuPont and the most important CFC-using industries (7752 and 7414) in the US canbenefit from the environmental regulatory settings after the Montreal Protocol, this can beconsidered as a valid illustration of the Porter Hypothesis. In our analysis, the sameconclusion can be linked to the Danish CFC-policies what ensures that this Ozone-Porter caseis not depending on specific American market conditions. This is also a reason why we optedto include Denmark and not Canada because in that case, the conclusions could be specific forNorth-America.
Data at the most detailed level also show that the pro-active CFC-policy gave better exportresults in sector 7752 than in sector 7414. The difference in the coefficient of the dummy issubstantial. Other differences between household and industrial refrigerators are the signs andcoefficients of the constant and the change in imports. Only for industrial refrigerators, thegrowth of bilateral imports had a negative, but not significant, impact on export growth. Themarket for household refrigerators was clearly in full expansion. For the air conditioningequipment, the change in bilateral exchange rate was not significant for export growth. Forthe four other regressions in table 5, changes in exchange rates proved to have a significantimpact. Of course, the five countries in the analyse experienced very different exchange rateevolutions.
8.‘Dirty’ industries and competition
Not finding a clear negative impact of environmental regulation on internationalcompetitiveness of dirty industries may be linked to the specific kind of competition that istypical for industries like chemicals, steel, cement, paper and electrotechnical products.
8.1. Cartelization
Before World War II, governments and firms used international cartels or regulationmechanisms in many of these sectors. The international chemical industry had a very clearcartel structure. Worldwide cartel agreements existed for potash, dyestuff, nitrogenious
25
fertilizers, chlorine, explosives and soda,.... There were even chemical cartels that focussed ontechnological processes. Some chemical firms like the German IG Farben during the interwarperiod also participated in cartels that grouped other industrial branches (like the importantcustomers of their products). In some countries like Italy and the Netherlands during the1930s, governments were so strongly in favour of cartels that they passed laws under whichoutsiders were compelled to become cartel-members (Schröter, 1997). It was also commonpractice to help the establishment of cartels on timber, pulp and paper by diplomacy. Otherimportant industries with cartel structures were steel, oil, mining, the aluminium industry andcement.According to Schröter (1997), it took at least 20 years after 1945 to reach a decent standard ofdecartelisation and the problems of international cartelisation are by no means gone. Evenduring the 1990s, numerous important competition cases were brought to the European andAmerican courts.The international aspects of competition policy become very important as a result ofworldwide globalisation. Like environmental policy, competition policy is rather ‘recent’ andthis can limit the validity of the assumption of free competition that is frequently used in trademodels and empirical analyses. If industries like steel and chemicals are targeted by strictenvironmental policy, there is always the possibility that they can use their power oninternational markets to offset possible negative impacts on their competitiveness. This canhappen by means of guiding voluntary Gentlemen’s Agreements that ensure that many firmsmake similar adaptations at the same time. If the most powerful market players adopt thispolicy, they can convince smaller firms to follow their lead.The important growth in environmental (and other fields of ) regulation can also be linked tomarket power by making use of concepts like ‘regulatory capture’ and ‘rent seeking’(Peltzman, 1976). Like all regulating agencies, the environmental policy makers can becomeobject of capture by interest groups, including producers, consumers and the environmentallobby. The producer group is probably best endowed with resources to influenceenvironmental policies. As such, there is a chance that the regulation is in line with theinterests of the regulated industries. The potential impact on competitiveness will be limited.The related hypothesis on rent-seeking states that most monopolies and oligopolies arecreated or stimulated by government regulation. The European steel industry is a clearexample of an industry that is shaped by many agreements and regulations. Also here, theimpact of new environmental regulation on competitiveness will not be dramatic.
In historical overviews of chemical cartels, we find of course corporations like DuPont. In thetechnological race for the best CFC-substitute, one of the the main competitor of DuPont isICI from the United Kingdom (Howes, 1997). The collaboration between these two giantswas however very intensive during the interwar period with their 1929 Patent and ProcessesAgreement (Schröter, 1997). The ending of their collaborative links in 1952, as a result ofantitrust rulings, was the start of massive foreign investments by DuPont in Europe and by ICIin the United States (Jones,1996). Decartelization was the start of multinational strategies and
26
massive foreign direct investment.
In 1995, DuPont and ICI are among the hundred greatest transnational corporations. Table 6gives an overview of the most important chemical companies. Pharmaceutical companies arenot included. All these companies do already exist for many decades and did build up overtime a transnational network. Their foreign assets are more important than their assets in thecountry of origin. If the Polish and Russian subsidiaries of German chemical firms apply thesame environmental procedures and principles as in their home country, they can contribute todiminishing environmental problems in the host country. Multinational corporations clearlyhave the potential to diffuse clean tecnologies and procedures.
Table 6 - Ranking of chemical transnational corporations by foreign assets, 1995(billions of US dollars)
Corporation Country Position intop 100
Foreignassests
Total assets Foreignsales
Total sales
Bayer AG Germany 11 28.1 31.3 19.7 31.1
Hoechst Germany 24 21.9 36.7 13.4 36.3
DuPont US 28 17.8 37.3 20.6 42.2
BASF AG Germany 29 17.6 29.3 23.5 32.3
Rhone-Poulenc France 33 16.1 27.6 12.4 17.0
Ciba-Geigy AG Switzerl. 38 14.9 26.5 7.5 17.5
Dow Chemical US 44 13.5 23.6 11.2 20.2
Johnson&Johnson US 73 8.2 17.9 9.7 18.8
Solvay AG Belgium 74 8.1 8.9 8.8 9.3
BHP Australia 77 7.8 21.8 4.4 12.7
ICI UK 97 6.1 14.7 9.5 15.9
Source : UNCTAD, World Investment Report 1997, p.29
The products of these corporations are capital-intensive and this can be an important marketbarrier. Loss of competitiveness is also linked to the entrance of new competitors on themarket. But in the European steel industry that has already excess capacity and administeredproduction levels, environmental regulation will never increase costs to a level that invitesnew entrances. There just isn’t a market to enter.We already mentioned the importance of product differentiation. High capital costs make itdifficult for new-comers to find a profitable niche in the market. Since most R&D takes placein the leading corporations, most differentiations will also be situated within these firms.Before WWII, cartels ensured market power and now the high capital base and international
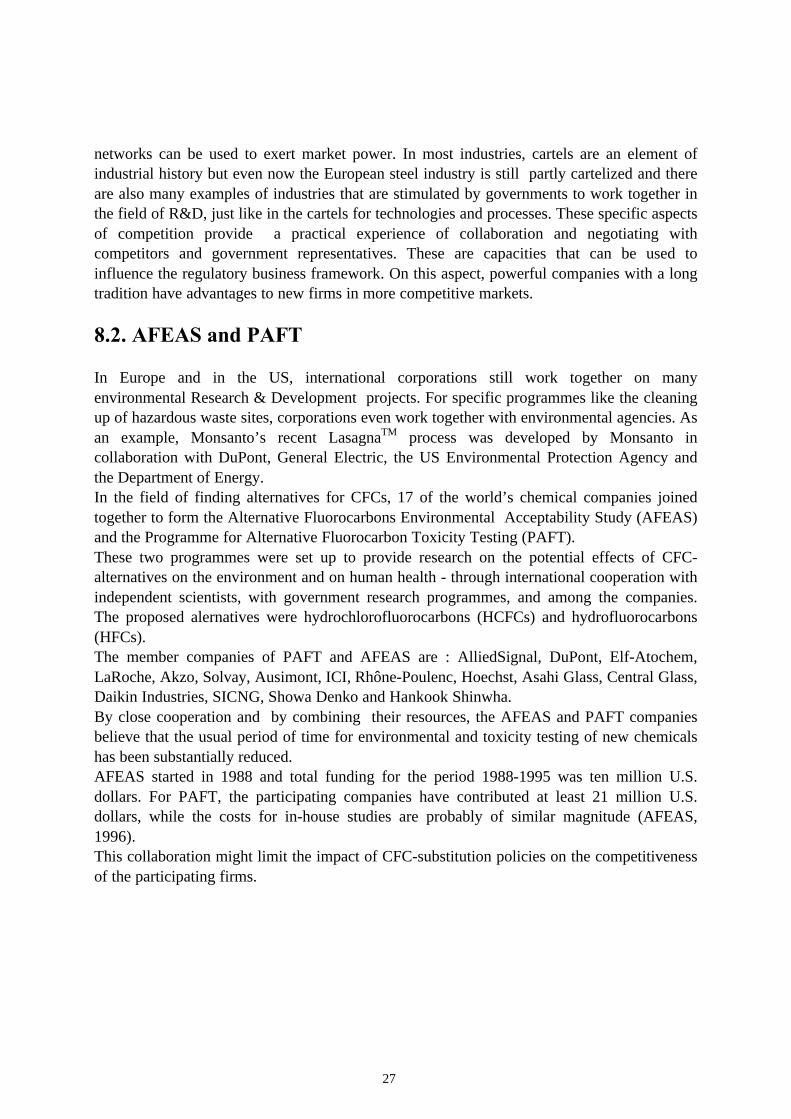
27
networks can be used to exert market power. In most industries, cartels are an element ofindustrial history but even now the European steel industry is still partly cartelized and thereare also many examples of industries that are stimulated by governments to work together inthe field of R&D, just like in the cartels for technologies and processes. These specific aspectsof competition provide a practical experience of collaboration and negotiating withcompetitors and government representatives. These are capacities that can be used toinfluence the regulatory business framework. On this aspect, powerful companies with a longtradition have advantages to new firms in more competitive markets.
8.2. AFEAS and PAFT
In Europe and in the US, international corporations still work together on manyenvironmental Research & Development projects. For specific programmes like the cleaningup of hazardous waste sites, corporations even work together with environmental agencies. Asan example, Monsanto’s recent LasagnaTM process was developed by Monsanto incollaboration with DuPont, General Electric, the US Environmental Protection Agency andthe Department of Energy.In the field of finding alternatives for CFCs, 17 of the world’s chemical companies joinedtogether to form the Alternative Fluorocarbons Environmental Acceptability Study (AFEAS)and the Programme for Alternative Fluorocarbon Toxicity Testing (PAFT).These two programmes were set up to provide research on the potential effects of CFC-alternatives on the environment and on human health - through international cooperation withindependent scientists, with government research programmes, and among the companies.The proposed alernatives were hydrochlorofluorocarbons (HCFCs) and hydrofluorocarbons(HFCs).The member companies of PAFT and AFEAS are : AlliedSignal, DuPont, Elf-Atochem,LaRoche, Akzo, Solvay, Ausimont, ICI, Rhône-Poulenc, Hoechst, Asahi Glass, Central Glass,Daikin Industries, SICNG, Showa Denko and Hankook Shinwha.By close cooperation and by combining their resources, the AFEAS and PAFT companiesbelieve that the usual period of time for environmental and toxicity testing of new chemicalshas been substantially reduced.AFEAS started in 1988 and total funding for the period 1988-1995 was ten million U.S.dollars. For PAFT, the participating companies have contributed at least 21 million U.S.dollars, while the costs for in-house studies are probably of similar magnitude (AFEAS,1996).This collaboration might limit the impact of CFC-substitution policies on the competitivenessof the participating firms.
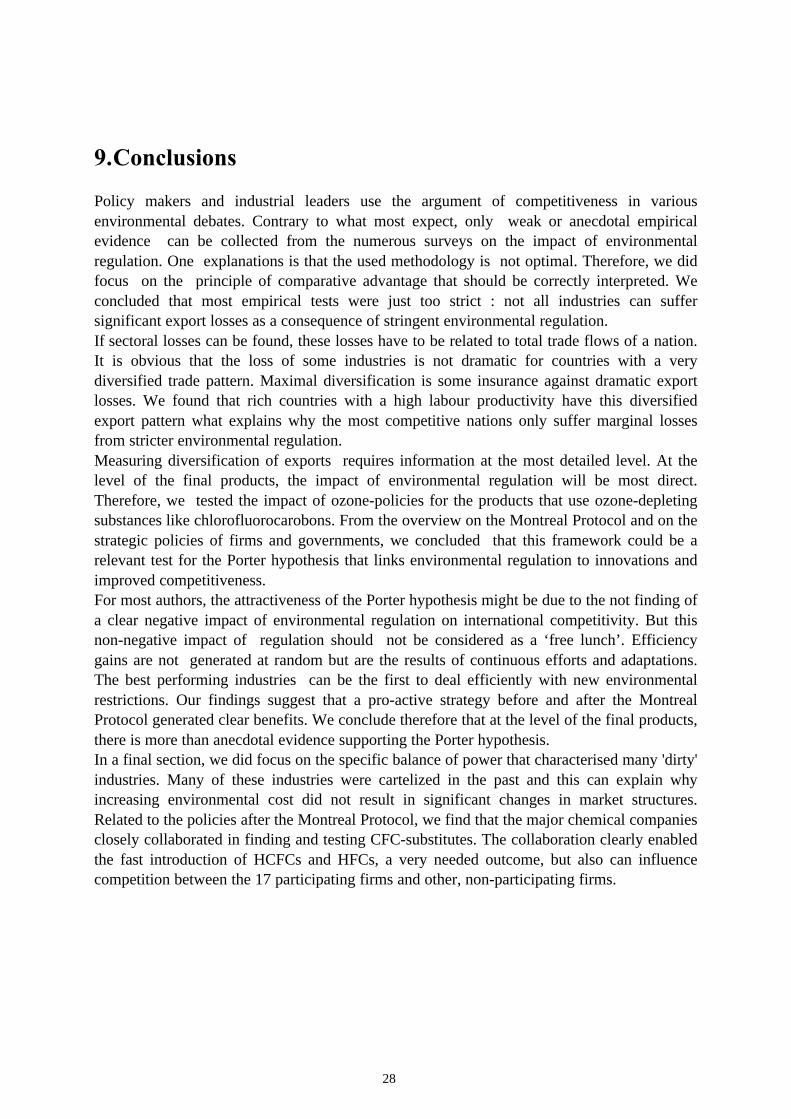
28
9.Conclusions
Policy makers and industrial leaders use the argument of competitiveness in variousenvironmental debates. Contrary to what most expect, only weak or anecdotal empiricalevidence can be collected from the numerous surveys on the impact of environmentalregulation. One explanations is that the used methodology is not optimal. Therefore, we didfocus on the principle of comparative advantage that should be correctly interpreted. Weconcluded that most empirical tests were just too strict : not all industries can suffersignificant export losses as a consequence of stringent environmental regulation.If sectoral losses can be found, these losses have to be related to total trade flows of a nation.It is obvious that the loss of some industries is not dramatic for countries with a verydiversified trade pattern. Maximal diversification is some insurance against dramatic exportlosses. We found that rich countries with a high labour productivity have this diversifiedexport pattern what explains why the most competitive nations only suffer marginal lossesfrom stricter environmental regulation.Measuring diversification of exports requires information at the most detailed level. At thelevel of the final products, the impact of environmental regulation will be most direct.Therefore, we tested the impact of ozone-policies for the products that use ozone-depletingsubstances like chlorofluorocarobons. From the overview on the Montreal Protocol and on thestrategic policies of firms and governments, we concluded that this framework could be arelevant test for the Porter hypothesis that links environmental regulation to innovations andimproved competitiveness.For most authors, the attractiveness of the Porter hypothesis might be due to the not finding ofa clear negative impact of environmental regulation on international competitivity. But thisnon-negative impact of regulation should not be considered as a ‘free lunch’. Efficiencygains are not generated at random but are the results of continuous efforts and adaptations.The best performing industries can be the first to deal efficiently with new environmentalrestrictions. Our findings suggest that a pro-active strategy before and after the MontrealProtocol generated clear benefits. We conclude therefore that at the level of the final products,there is more than anecdotal evidence supporting the Porter hypothesis.In a final section, we did focus on the specific balance of power that characterised many 'dirty'industries. Many of these industries were cartelized in the past and this can explain whyincreasing environmental cost did not result in significant changes in market structures.Related to the policies after the Montreal Protocol, we find that the major chemical companiesclosely collaborated in finding and testing CFC-substitutes. The collaboration clearly enabledthe fast introduction of HCFCs and HFCs, a very needed outcome, but also can influencecompetition between the 17 participating firms and other, non-participating firms.
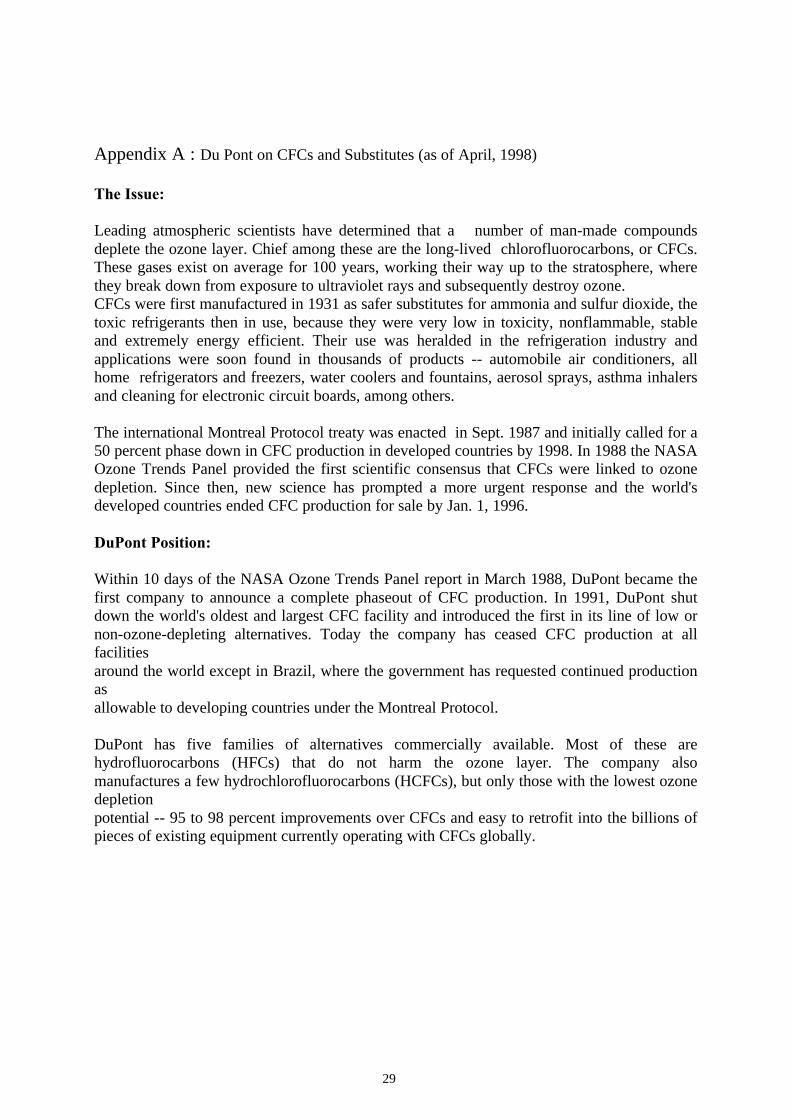
29
Appendix A : Du Pont on CFCs and Substitutes (as of April, 1998)
The Issue:
Leading atmospheric scientists have determined that a number of man-made compoundsdeplete the ozone layer. Chief among these are the long-lived chlorofluorocarbons, or CFCs.These gases exist on average for 100 years, working their way up to the stratosphere, wherethey break down from exposure to ultraviolet rays and subsequently destroy ozone.CFCs were first manufactured in 1931 as safer substitutes for ammonia and sulfur dioxide, thetoxic refrigerants then in use, because they were very low in toxicity, nonflammable, stableand extremely energy efficient. Their use was heralded in the refrigeration industry andapplications were soon found in thousands of products -- automobile air conditioners, allhome refrigerators and freezers, water coolers and fountains, aerosol sprays, asthma inhalersand cleaning for electronic circuit boards, among others.
The international Montreal Protocol treaty was enacted in Sept. 1987 and initially called for a50 percent phase down in CFC production in developed countries by 1998. In 1988 the NASAOzone Trends Panel provided the first scientific consensus that CFCs were linked to ozonedepletion. Since then, new science has prompted a more urgent response and the world'sdeveloped countries ended CFC production for sale by Jan. 1, 1996.
DuPont Position:
Within 10 days of the NASA Ozone Trends Panel report in March 1988, DuPont became thefirst company to announce a complete phaseout of CFC production. In 1991, DuPont shutdown the world's oldest and largest CFC facility and introduced the first in its line of low ornon-ozone-depleting alternatives. Today the company has ceased CFC production at allfacilitiesaround the world except in Brazil, where the government has requested continued productionasallowable to developing countries under the Montreal Protocol.
DuPont has five families of alternatives commercially available. Most of these arehydrofluorocarbons (HFCs) that do not harm the ozone layer. The company alsomanufactures a few hydrochlorofluorocarbons (HCFCs), but only those with the lowest ozonedepletionpotential -- 95 to 98 percent improvements over CFCs and easy to retrofit into the billions ofpieces of existing equipment currently operating with CFCs globally.
30
Appendix B : EPA Enforcement Actions under the regulation on ozone-depletingsubstances
The US Environmental Protection Agency (EPA) has issued several regulations under TitleVI of the Clean Air Act designed to protect the ozone layer and to provide for a smoothtransition away from the ozone-depleting substances. EPA is also charged with enforcingthese regulations. Some information is featured about enforcement actions, ranging from civilfines to criminal prosecutions. No information is presented here about ongoing investigations.From a long list, we selected the following cases:
January 26, 1998: EPA Cites U.S. Mint For Clean Air Act Violations
The U.S. Environmental Protection Agency announced that it has cited the U. S. Treasury forClean Air Act violations at the United States Mint in Philadelphia. In the administrativecomplaint issued January 23, 1998, EPA charges the Mint violated regulations governing theemission of chromium compounds and chlorofluorocarbons (CFCs). EPA alleged that thecoin-making site violated testing, monitoring, and operation and maintenance requirementsfor chromium electroplating since January 1997. The October 23 inspection also uncoveredviolations of Clean Air Act regulations on the repair and servicing of equipment containingCFC-based refrigerants. Specifically, EPA alleged that Mint employees serviced airconditioners and water coolers without using required CFC recovery and recycling equipmentand that the Mint used an uncertified technician. The complaint also alleged that the Mintfailed to evacuate CFCs to required levels before servicing refrigerant containing equipment.EPA seeks a $129,400 penalty for these violations.
January 21, 1998: Philadelphia Scrap Metal Company to Pay $30,000 For CFC Violations
The U.S. Environmental Protection Agency announced that S.D. Richman Sons Inc., aPhiladelphia scrap metal company, will pay a $30,000 penalty for violating regulations on thedisposal of equipment containing chloroflorocarbons (CFCs).
September 12, 1997: California Men Charged For Installing HC-12a®
Two men who allegedly installed a flammable refrigerant known as "HC-12a®" in the airconditioners of motor vehicles have been indicted in one of the first criminal cases of its kind.
September 12, 1997: Issuing False Technician Certifications Leads to Guilty Plea
Charles Warren Joseph of Houston, Texas admitted to participating in a scheme that resultedin approximately 100 false chloroflurocarbon (CFC) technician certificates being issuedbetween June 1994 and November 1995. His co-conspirator, Herman Brodzenski of Canton,Ohio, pleaded guilty to charges on June 19.
31
September 5, 1997: President of Refrigeration U.S.A. Corp. Jailed and Fined $375,000
Roland Wood, President of Refrigeration U.S.A. of Hallandale, Fla., pled guilty for his role ina CFC smuggling operation. Also see the related story below about Refrigeration U.S.A.On Aug. 29, Roland Wood of North Miami Beach, Fla., was sentenced to serve 37 months inprison and three years supervised release and was ordered to pay a $375,000 fine by the U.S.District Court for the Southern District of Florida in Miami. As part of his guilty plea, Woodwill forfeit over $13 million in assets including: property in Miami valued in excess of $1.5million; 11,200 thirty-pound cylinders of chloroflurocarbon gas worth over $6.7 million;almost $5 million in illegal proceeds held in European Banks; an apartment in London valuedat $395,000 and stock in a local bank worth over $80,000. Wood, President of RefrigerationU.S.A. of Hallandale, Fla., previously pleaded guilty to illegally diverting 4,000 tons ofozone-depleting CFC refrigerants into commerce in the United States. The case wasinvestigated by EPA's Criminal Investigation Division, the U.S. Customs Service and theInternal Revenue Service.
August 29 , 1997: Refrigeration U.S.A. Corp. Fined $37 million
Refrigeration U.S.A. previously pleaded guilty to 129 felony counts, and employeespreviously pleaded guilty to conspiracy to violate the Clean Air Act in connection with ascheme to divert 4,000 tons of CFCs into commerce in the United States.
CFC Smuggling - 1995
United States v. Adi Dara Dubash and Homi Patel (S.D. FL): Adi Dara Dubash was sentencedon July 24, 1995, after pleading guilty to smuggling 8,400 cylinders of the ozone depletingrefrigerant gas dichlorodifluoromethane (known as "CFC-12") into the United States inviolation of the Clean Air Act. He was sentenced to 22 months of imprisonment, 3 years ofprobation and a $6,000 fine.
32
References
Albrecht, J., 1998, Environmental policy and the inward investment position of US ‘dirty’ industries,Intereconomics Vol.33(4), July/August, pp.186-194
Air-Conditioning & Refrigeration Institute, 1997 and 1998, <http://www.ari.org/issues/>
Alternative Fluorocarbons Environmental Acceptability Study, 1996, <http://afeas.org/>
Bernard, A., B. and Jones, C., I., 1996, Comparing apples to oranges : productivity convergence andmeasurement across industries and countries, American Economic Review 86 (5), pp.1216-1238
Bhagwati, J., 1997,Writings on International Economics (Oxford University Press, Oxford)
Cairncross, F., 1992, The freedom to be dirtier than the rest. Why differing environmental priorities causeproblems for trade, The Economist 323 (30 May).
Danish Environmental Protection Agency, 1995, Going towards natural refrigerants (Environmental ProjectNo.301, Copenhagen)
Dunning, J., H., 1993, Multinational enterprises and the global economy (Addison-Weslay Publishers,Wokingham)
Environment Canada , 1998, Canada’s national environmental indicator series : stratopheric ozone depletion,<http://www.ec.gc.ca/ozone/>
Fujimoto, Yuichi, 1997, at the Conference on Ozone Layer Protection,<http://www.ec.gc.ca/ozone/choices/sect2_e.html>
Grossman, G. And Krueger, A., 1992, Environmental impacts of a North American Free Trade Agreement, in:Garber, P., The U.S.-Mexico free trade agreement (MIT Press, Cambridge), pp.13-56.
Haas, Peter M., 1992, Banning chlorofluorocarbons : epistemic community efforts to protect stratospheric ozone,International Organization 46(1), pp.187-224
Hall, R., E. and Jones, C., I., 1997, Fundamental determinants of output per worker across countries, StanfordWorking Paper 97-021 (August 22, 1997 - Version 3.0)
Howes, R., Skea, J. and Whelan, B., 1997, Clean and competitive? Motivating environmental performance inindustry (Earthscan Publications, London)
Jaffe, A., Peterson, S., Portney, P. and Stavins, R., 1995, Environmental regulation and the competitiveness ofU.S. manufacturing : what does the evidence tell us?, Journal of Economic Literature 33, pp.132-163.
Jones; Geoffrey, 1996, The evolution of international business (Routledge, London)
Kalt, J., P., 1988, The impact of domestic environmental regulatory policies on U.S. internationalcompetitiveness, in: Spence, A., M. and Hazard, H. (eds), International competitiveness (Harper and Row,Cambridge MA), pp.221-262.
Krugman, P., R., and Obstfeld, M., 1994, International economics. Theory and policy (HarperCollins, NY).
33
Leonard, H., J., 1988, Pollution and the struggle for the world product (Cambridge University Press,Cambridge).Low, P., 1992, International trade and the environment, World Bank Discussion Papers 159 (The World Bank,Washington, D.C.).
Markandya, A., 1994, Is free trade compatible with sustainable development?, UNCTAD Review, pp.9-22.
Meyer, J., Frank, D., Hironaka, A., Schofer, E. and Tuma A., 1997, The structuring of a World EnvironmentalRegime, 1870-1990, International Organization 51(4), pp.623-651.
Meyer, Stephen M., 1992, Environmentalism and economic prosperity : testing the environmental impacthypothesis (MIT Mimeo, Cambridge)
New York Times, 10 April 1988, section 3, p.2
Peltzman, S., 1976, Toward a more general theory of regulation, Journal of Law and Economics 19(2)
Porter, M., 1990, The competitive advantage of nations (Macmillan, London)
Porter, M.E. and van der Linde, C., 1995, Toward a new conception of the environment-competitivenessrelationship, Journal of Economic Perspectives 6(4), pp.119-132
Rauscher, M., 1997, International trade, factor movements and the environment (Clarendon Press, Oxford).
Rowland, C., K. and Feiock, R., 1991, Environmental regulation and economic development : the movement ofchemical production among States, in: Dubnick, M. and Gitelson, A. (eds), Public policy and economicinstitutions (JAI Press, Greenwich), pp.205-218.
Schröter, Harm G., 1997, Fields of competition and of cooperation : cartel structures in the internationalchemical industry, in: Pohl, Hans (Ed.), Competition and cooperation of enterprises on national and internationalmarkets (Franz Steiner Verlag, Stuttgart)
Staiger, R., W., 1988, A specification test of the Heckscher-Ohlin theory, Journal of International Economics 25,pp.129-141.
United Nations Conference on Trade and Development, 1997, Handbook of International Trade andDevelopment Statistics 1995 (UN, NY)
United Nations Conference on Trade and Development, 1997, World investment report (UN, Geneva)
United Nations Environmental Programme (The Ozone Secretariat), 1998, Status ofratification/accession/acceptance/approval of the agreements on the protection of the stratospheric ozone layer(as of February 19, 1988, New York),<http://www.unep.ch/ozone/ratif.htm>
United Nations Environmental Programme, 1998, The International Cleaner Production InformationClearinghouse (ICPIC), <http://www.unepie.org/icpic/icpic.html>
United Nations Industrial Development Organization,1990, Industry and development. Global report 1990/1991(UNIDO, Vienna).
Verspagen, B., 1995, Convergence in the global economy. A broad historical viewpoint, Structural Change andEconomic Dynamics 6, pp.143-165.
Westin, Richard A., 1997, Environmental tax initiatives and multilateral trade agreements : dangerous collisions

34
(Kluwer, The Hague)
The World Bank Group, 1997, World Bank tells UN Earth Summit of new actions to sageguard environment,News Release No.97/1405/5
Environmental Policy and the Inward Investment Position of US 'Dirty' Indu-stries.
Johan Albrecht*, University of Ghent
1. Introduction
It has become increasingly apparent that there is a widespread political and public
concern with environmental issues. The environmental effects of economic activity tend to
be very diverse and vary between sectors and locations.
Local policies aimed at specific sectors lead to pollution abatement and control expendi-
tures (PAC) that can vary significantly between countries for reasons of differences in
natural endowments and assimilative capacities, types of pollution (from very toxic and
carcinogenic pollution versus levels of acceptable noise pollution or landscape distortion),
the structure of industry and services, evolutions of political priorities and policy models,
attitudes of consumers and pressure groups, possible policy implementation limitations,
effective enforceability of regulation, applicability of environmental and economic
instruments and so on.
Differences in environmental costs might influence the relative prices of natural assets.
This has consequences for industries that are nature-intensive.
We may assume that environmental control costs encourage reduced specialization in the
production of pollution-intensive outputs in countries with stringent environmental
regulations while countries with lax environmental regulation can build up a comparative
advantage in these industries.
Since chemical industries, micro-electronics, pulp and paper, oil refining, iron and steel,
and many other so-called 'dirty' industries are responsible for a very important share in
national value added and employment, any new measure that increases environmental *Funded by the OSTC (Belgian Federal Office for Scientific, Technological and Cultural Affairs) Programme onSustainable Development.I want to thank Tom Verbeke (Univ.Ghent, NFWO) for his insightful remarks.
2
(and other) costs, faces a strong opposition from groups advocating that the implemen-
tation of stiffer measures will reduce the competitiveness of the targeted industries, what
could lead to the forced migration of these industries (industrial flight).
This competitivity issue has been studied by many authors. Complex theoretical models
suggest that competitiveness could be at stake depending on many parameters but
surprisingly, there has been very little empirical support, nor when changes in trade flows
have been studied, nor in surveys on the migration (industrial flight hypothesis) or
attraction (pollution haven hypothesis) of pollution-intensive industries.
In her often cited1 survey of the existing literature ('Trade and Environment: A Survey of the
Literature') Judith M.Dean concludes that the many empirical surveys on diverse competi-
tiveness-related hypotheses show no evidence to support them. She adds as a partial
explanation that there may be room for better estimates of actual environmental control
costs incurred by firms, and for estimates by industry of actual losses in output due to
these costs.
A recent survey of the literature is made by Michael Rauscher2 and gave comparable
results. Specific surveys for the US were made by Jaffe3 en Kalt4.
Most surveys – starting with Arthur Andersen & Co. in 1979, followed by Worldbank,
UNCTAD and many authors - estimate environmental costs around 1 to 3% of GDP for
industrial countries. These rather low figures are based on sectoral studies for chemicals,
metals, paper,... But when we consider the social and environmental cost of only the
transport sector, the OECD gives an estimate of 5% of GDP5. The inclusion of health
aspects and costs could clearly result in higher figures.
Patrick Low and Alexander Yeats6 make use of a RCA (revealed comparative advantage)
1 World Bank Policy Research Working Paper 966 (1992) or see World Bank Discussion Papers 159 (1992),International Trade and the Environment, pp.15-28
2 Rauscher M. (1997), International Trade, Factor Movements, and the Environment.
3 Jaffe, Adam B. et al. (1995), Environmental Regulation and the Competitiveness of the United StatesManufacturing : What Does the Evidence Tell Us, Journal of Economic Literature 33 (1), pp.132-163
4 Kalt, Joseph P. (1985), The Impact of Domestic Regulatory on International Competitiveness, HarvardInstitute of Economic Research, Discussion Paper No.1411
5 European Commission (1997), Statements on Sustainable Development, p.17
6 Patrick Low (ed) (1992), 'Do dirty industries migrate?', World Bank Paper 159, International Trade and theEnvironment, pp.89-103
3
analysis that enables them to conlude that dirty industries account for a growing share of
exports of some developing countries together with an overall world wide reduction of
dirty exports. Of course, many other factors could be responsible for this shift over a
period of 20 years. They also suggest that production and FDI-data would enable a better
analysis.
James A.Tobey7 in his analysis of world trade makes use of the Walter and Ugelow index
of the degree of stringency of environmental policy . This index ranges from tolerant (index
value 1) to strict (index value 7). The environmental policy of only three countries (the US,
Sweden and Japan) is considered as strict. Finland, Norway and Singapore follow closely.
Including a dummy based on this index in his analysis on net exports of certain commo-
dities yielded no signifant results. Although Tobey concludes that the empirical effects of
domestic policies are not significant, he remarks that trade surveys are in many cases
biased by trade barriers that are difficult to deal with at the empirical level.
If we can assume that the US have a very strict environmental policy and data on
production and FDI-flows offer an alternative for analysis that excludes problems with
trade data (trade barriers, strongly differing 'openess to trade'-ratio's,...), a sectoral
analysis of these FDI-flows could give us valuable insights in the possible consequences of
strict environmental policies on industrial location patterns.
2. Foreign Direct Investments (FDI) and dirty industries
We want to analyse to what extent recent FDI-patterns in and outside the US could be
influenced by the strict environmental policy that is maintained. We do not want to explain
investment patterns by means of a multivariate analysis including variables like market
size, factor prices, corporate taxes ans tax holidays, government grants, rates of return on
foreign investments, and transportation costs. For this kind of analysis, Tobey illustrates
that differences in environmental regulation are not easily quantifiable.
The US has been chosen because of the data-availability : FDI , production, gross fixed
capital formation and R&D are provided on a sectoral base.
Data sets were taken from Survey of Current Business, the UNIDO Industrial Statistics
Database (3 digit SITC) and the World Bank Discussion Papers 159 (International Trade 7 Tobey, James A. (1990), The Effects of Domestic Environmental Policies on Patterns of World Trade : AnEmpirical Test, Kyklos, vol.43, no.2, pp.191-209
4
and Environment).
3. The assumptions on location patterns of dirty industries
Following standard theory, environmental regulation will lead to pollution abatement
expenditures that increase input and output price. In competitive markets, increasing
production prices will lead to diminishing profits if international competitors do not have to
internalize to the same extent the cost-increasing externalities.
Depending on profit margins and the possibilities of reducing pollution by new technolo-
gies and new product designs, some sectors or firms will face too high additional
environmental costs when standards are increased. In very competitive global markets
this can force them to relocate their production facilities in regions with less environmental
constraints, due to different assimilative capabilities or the lack of enforceable environ-
mental regulation.
Of course, this possible relocation will hardly ever take place immediatelly after the
implementation of a new environmental measure. The firm can make some 'easy' end-of-
pipe abatement investments that at the end do not fulfill legal requirements. In other
cases, standards included in the legislation could change after some years and pose from
that moment a serious problem.
We therefore assume that the impact of many new environmental measures during the
1980's becomes visible during the early 1990's or still did not take place.
Why not compare the diffusion of environmental legislation and its enforceability to the
diffusion of information technology (IT) or other major innovations or breakthroughs like
electricity? The real impact of IT and electricity was delayed by decades. According to
some observers8, the real IT-shock still has to take place.
In the next sections, we study inward and outward US FDI-flows during the early 1990's
and analyse the impact of strict environmental regulation : do dirty industries leave the US
and do the US attract clean industries?
To complete the picture, it is interesting to note that Bartik9 and Levinson10 examined
8 The Economist (1996), Survey of the World Economy (1-8), New technology and globalisation are changingthe world.
9 Bartik, Timothy (1988), The Effects of Environmental Regulation on Business Location in the United States,
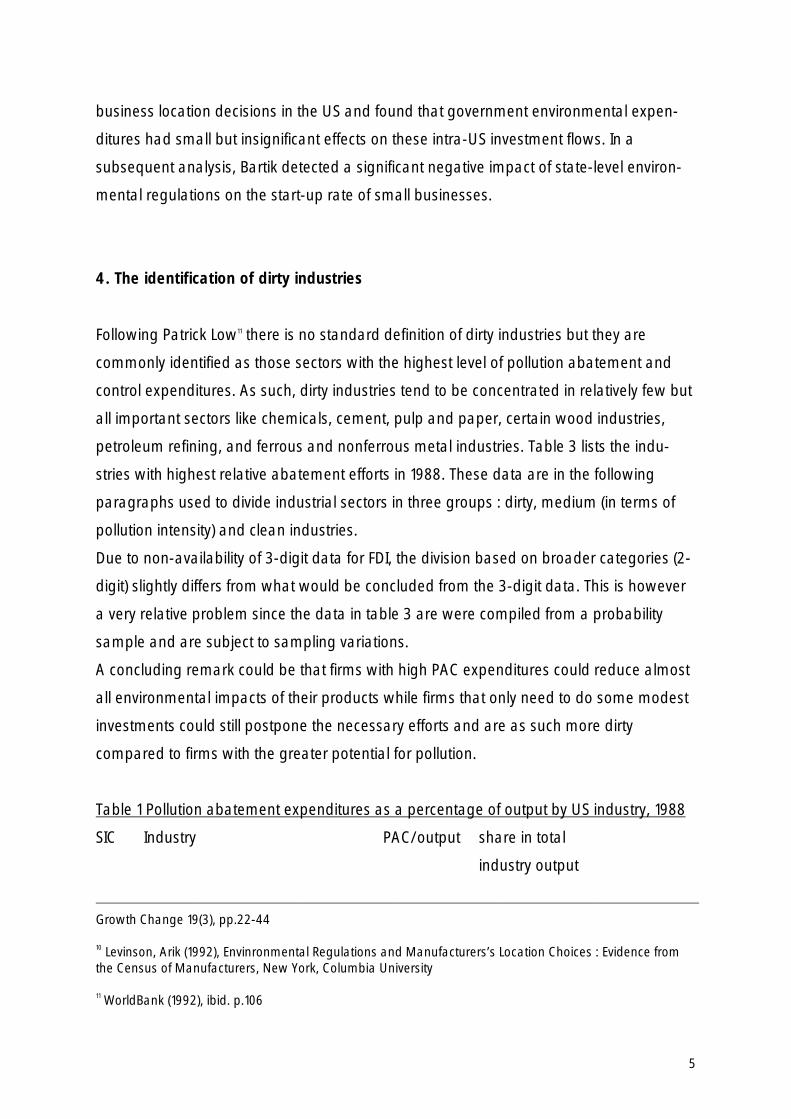
5
business location decisions in the US and found that government environmental expen-
ditures had small but insignificant effects on these intra-US investment flows. In a
subsequent analysis, Bartik detected a significant negative impact of state-level environ-
mental regulations on the start-up rate of small businesses.
4. The identification of dirty industries
Following Patrick Low11 there is no standard definition of dirty industries but they are
commonly identified as those sectors with the highest level of pollution abatement and
control expenditures. As such, dirty industries tend to be concentrated in relatively few but
all important sectors like chemicals, cement, pulp and paper, certain wood industries,
petroleum refining, and ferrous and nonferrous metal industries. Table 3 lists the indu-
stries with highest relative abatement efforts in 1988. These data are in the following
paragraphs used to divide industrial sectors in three groups : dirty, medium (in terms of
pollution intensity) and clean industries.
Due to non-availability of 3-digit data for FDI, the division based on broader categories (2-
digit) slightly differs from what would be concluded from the 3-digit data. This is however
a very relative problem since the data in table 3 are were compiled from a probability
sample and are subject to sampling variations.
A concluding remark could be that firms with high PAC expenditures could reduce almost
all environmental impacts of their products while firms that only need to do some modest
investments could still postpone the necessary efforts and are as such more dirty
compared to firms with the greater potential for pollution.
Table 1 Pollution abatement expenditures as a percentage of output by US industry, 1988
SIC Industry PAC/output share in total
industry output
Growth Change 19(3), pp.22-44
10 Levinson, Arik (1992), Envinronmental Regulations and Manufacturers’s Location Choices : Evidence fromthe Census of Manufacturers, New York, Columbia University
11 WorldBank (1992), ibid. p.106
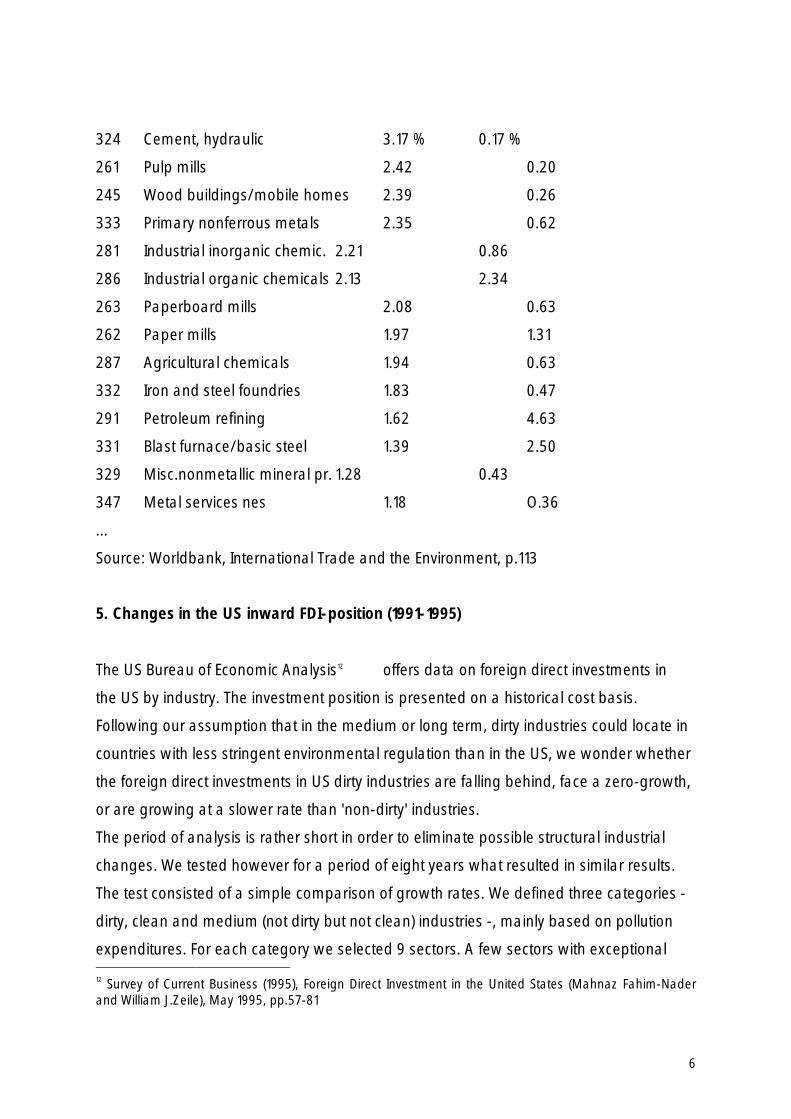
6
324 Cement, hydraulic 3.17 % 0.17 %
261 Pulp mills 2.42 0.20
245 Wood buildings/mobile homes 2.39 0.26
333 Primary nonferrous metals 2.35 0.62
281 Industrial inorganic chemic. 2.21 0.86
286 Industrial organic chemicals 2.13 2.34
263 Paperboard mills 2.08 0.63
262 Paper mills 1.97 1.31
287 Agricultural chemicals 1.94 0.63
332 Iron and steel foundries 1.83 0.47
291 Petroleum refining 1.62 4.63
331 Blast furnace/basic steel 1.39 2.50
329 Misc.nonmetallic mineral pr. 1.28 0.43
347 Metal services nes 1.18 O.36
...
Source: Worldbank, International Trade and the Environment, p.113
5. Changes in the US inward FDI-position (1991-1995)
The US Bureau of Economic Analysis12 offers data on foreign direct investments in
the US by industry. The investment position is presented on a historical cost basis.
Following our assumption that in the medium or long term, dirty industries could locate in
countries with less stringent environmental regulation than in the US, we wonder whether
the foreign direct investments in US dirty industries are falling behind, face a zero-growth,
or are growing at a slower rate than 'non-dirty' industries.
The period of analysis is rather short in order to eliminate possible structural industrial
changes. We tested however for a period of eight years what resulted in similar results.
The test consisted of a simple comparison of growth rates. We defined three categories -
dirty, clean and medium (not dirty but not clean) industries -, mainly based on pollution
expenditures. For each category we selected 9 sectors. A few sectors with exceptional 12 Survey of Current Business (1995), Foreign Direct Investment in the United States (Mahnaz Fahim-Naderand William J.Zeile), May 1995, pp.57-81
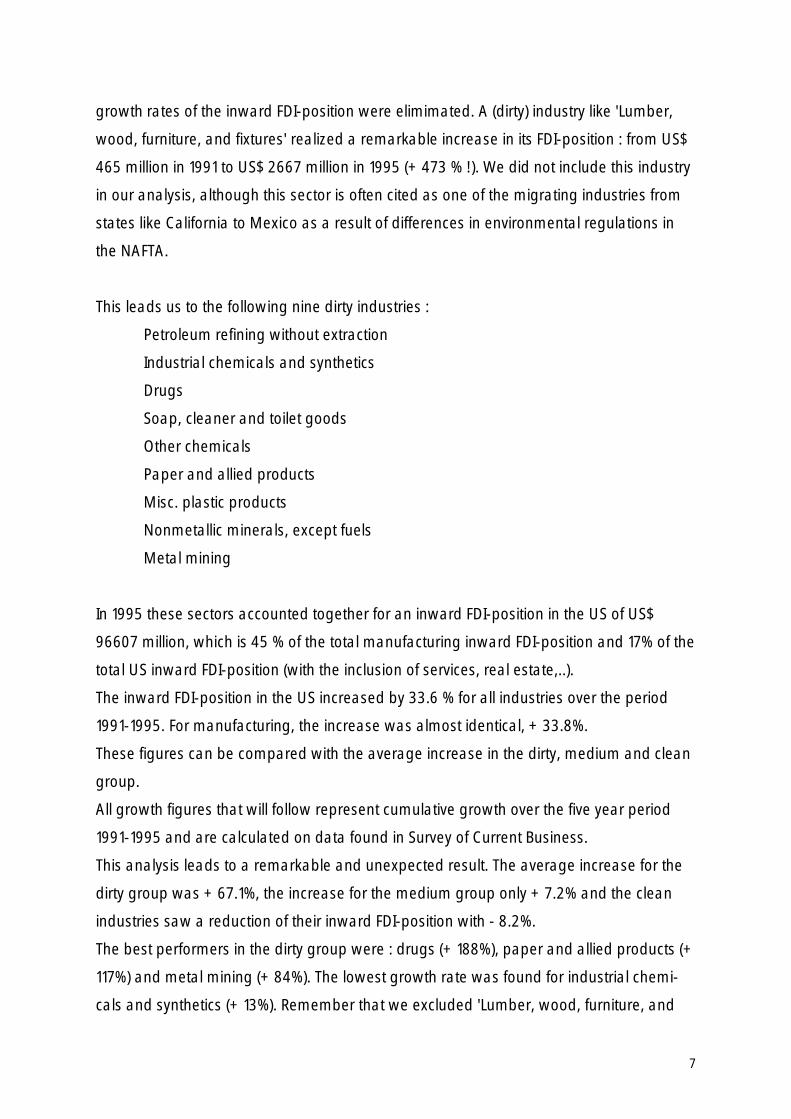
7
growth rates of the inward FDI-position were elimimated. A (dirty) industry like 'Lumber,
wood, furniture, and fixtures' realized a remarkable increase in its FDI-position : from US$
465 million in 1991 to US$ 2667 million in 1995 (+ 473 % !). We did not include this industry
in our analysis, although this sector is often cited as one of the migrating industries from
states like California to Mexico as a result of differences in environmental regulations in
the NAFTA.
This leads us to the following nine dirty industries :
Petroleum refining without extraction
Industrial chemicals and synthetics
Drugs
Soap, cleaner and toilet goods
Other chemicals
Paper and allied products
Misc. plastic products
Nonmetallic minerals, except fuels
Metal mining
In 1995 these sectors accounted together for an inward FDI-position in the US of US$
96607 million, which is 45 % of the total manufacturing inward FDI-position and 17% of the
total US inward FDI-position (with the inclusion of services, real estate,..).
The inward FDI-position in the US increased by 33.6 % for all industries over the period
1991-1995. For manufacturing, the increase was almost identical, + 33.8%.
These figures can be compared with the average increase in the dirty, medium and clean
group.
All growth figures that will follow represent cumulative growth over the five year period
1991-1995 and are calculated on data found in Survey of Current Business.
This analysis leads to a remarkable and unexpected result. The average increase for the
dirty group was + 67.1%, the increase for the medium group only + 7.2% and the clean
industries saw a reduction of their inward FDI-position with - 8.2%.
The best performers in the dirty group were : drugs (+ 188%), paper and allied products (+
117%) and metal mining (+ 84%). The lowest growth rate was found for industrial chemi-
cals and synthetics (+ 13%). Remember that we excluded 'Lumber, wood, furniture, and
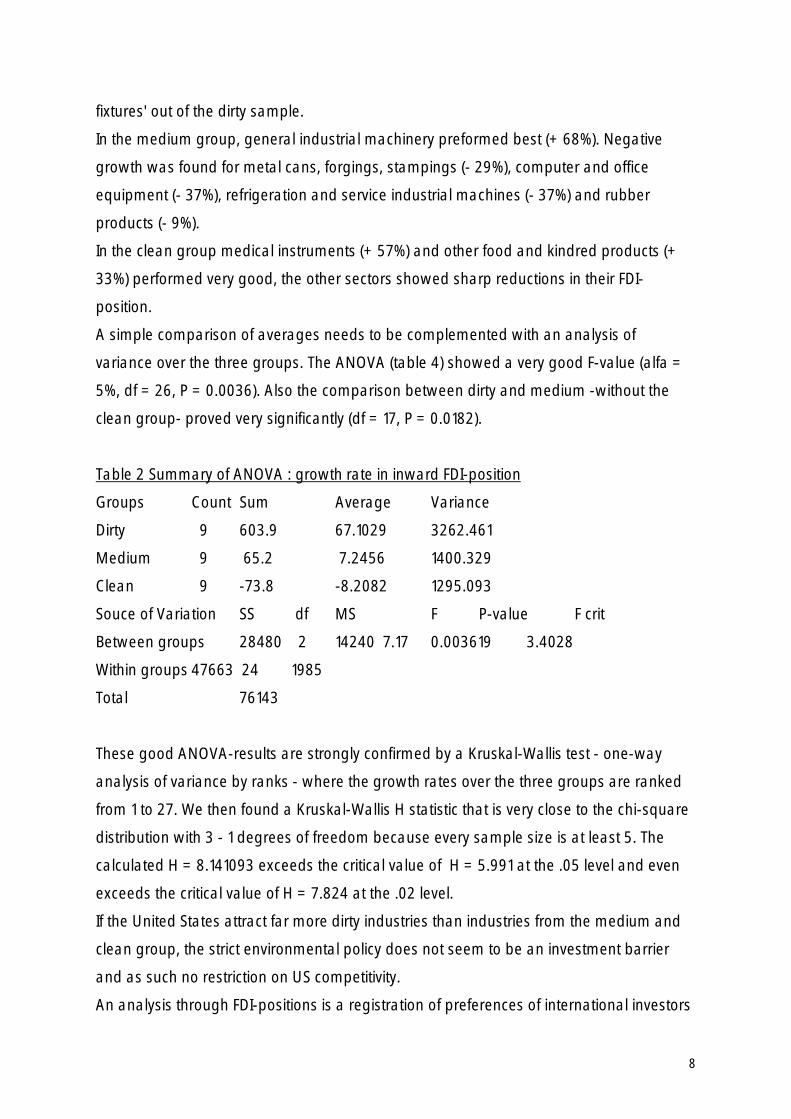
8
fixtures' out of the dirty sample.
In the medium group, general industrial machinery preformed best (+ 68%). Negative
growth was found for metal cans, forgings, stampings (- 29%), computer and office
equipment (- 37%), refrigeration and service industrial machines (- 37%) and rubber
products (- 9%).
In the clean group medical instruments (+ 57%) and other food and kindred products (+
33%) performed very good, the other sectors showed sharp reductions in their FDI-
position.
A simple comparison of averages needs to be complemented with an analysis of
variance over the three groups. The ANOVA (table 4) showed a very good F-value (alfa =
5%, df = 26, P = 0.0036). Also the comparison between dirty and medium -without the
clean group- proved very significantly (df = 17, P = 0.0182).
Table 2 Summary of ANOVA : growth rate in inward FDI-position
Groups Count Sum Average Variance
Dirty 9 603.9 67.1029 3262.461
Medium 9 65.2 7.2456 1400.329
Clean 9 -73.8 -8.2082 1295.093
Souce of Variation SS df MS F P-value F crit
Between groups 28480 2 14240 7.17 0.003619 3.4028
Within groups 47663 24 1985
Total 76143
These good ANOVA-results are strongly confirmed by a Kruskal-Wallis test - one-way
analysis of variance by ranks - where the growth rates over the three groups are ranked
from 1 to 27. We then found a Kruskal-Wallis H statistic that is very close to the chi-square
distribution with 3 - 1 degrees of freedom because every sample size is at least 5. The
calculated H = 8.141093 exceeds the critical value of H = 5.991 at the .05 level and even
exceeds the critical value of H = 7.824 at the .02 level.
If the United States attract far more dirty industries than industries from the medium and
clean group, the strict environmental policy does not seem to be an investment barrier
and as such no restriction on US competitivity.
An analysis through FDI-positions is a registration of preferences of international investors
9
that have the necessary home country-expertise and experience and could as such be
better than an analysis based on distorted trade figures where we have to include a lot of
other explaining variables like labour cost differences, changes in exchange rates,
government support, regional trage agreements, etc..
FDI lead to local production (same factor renumeration and legal constraints as domestic
firms), in direct and fair competition with existing domestic producers.
Of course, it could be possible that dirty industries grow faster in the US than clean
industries. This could then be already a partial explanation for the impressive growth rate
of inward FDI in dirty industries.
However, data from Survey of Current Business and UNIDO Industrial Statistics (3-digit)
showed no significant difference in growth rates of output and gross fixed capital
formation for dirty and clean industries. To the contrary, UNIDO-data showed that the
output growth rate of dirty industries is somewhat smaller than the growth rate of other
industries ( + 14% compared to + 18%). The ANOVA showed no significant difference in
output growth rate. This makes our FDI-findings even more interesting.
UNIDO-data on Gross Fixed Capital Formation (GFCF) for the 22 manufacturing sectors
showed that the capital formation over the period 1989-1993 decreased for the dirty
industries (with the exclusion of petroleum industries) on average with - 0.9% while the
other (clean and 'medium') industries had a modest increase of + 3.2%. The difference
proved not to be significant (df = 21, F = 0.34, P = 0.566). This result is in line with the
findings resulting from the output data.
6. The US outward FDI-position
In the previous section, we found that the US attracted more dirty manufacturing indu-
stries than not-dirty industries, while these sectors showed a slightly decreasing national
capital formation.
To complete the picture, we need to analyse the US outward FDI-position because it could
be that dirty industries leave the US to a greater extent than that they are attracted by the
US. Some dirty FDI will always take place for reasons of scale of the home market and
transaction costs.
We should also remember that our sectors could consist of some specific subsectors (4-
digit level) that do not fit in our a priori categorization of dirty, medium and clean. Even
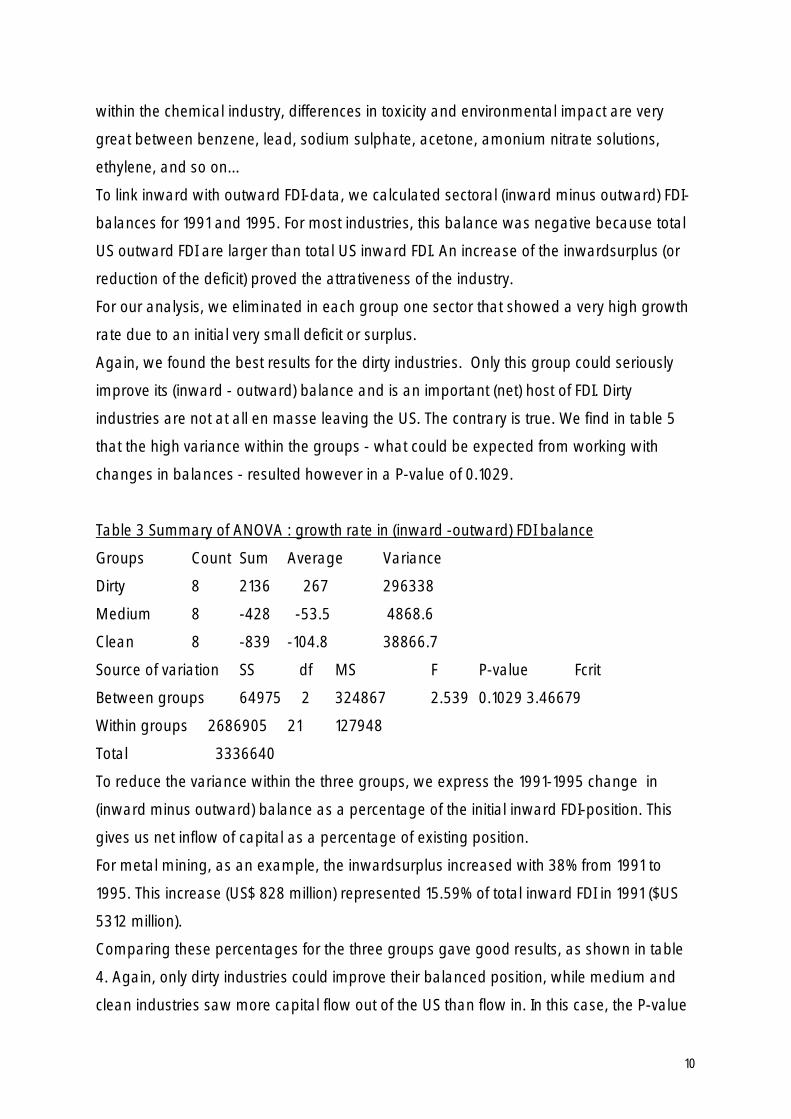
10
within the chemical industry, differences in toxicity and environmental impact are very
great between benzene, lead, sodium sulphate, acetone, amonium nitrate solutions,
ethylene, and so on...
To link inward with outward FDI-data, we calculated sectoral (inward minus outward) FDI-
balances for 1991 and 1995. For most industries, this balance was negative because total
US outward FDI are larger than total US inward FDI. An increase of the inwardsurplus (or
reduction of the deficit) proved the attrativeness of the industry.
For our analysis, we eliminated in each group one sector that showed a very high growth
rate due to an initial very small deficit or surplus.
Again, we found the best results for the dirty industries. Only this group could seriously
improve its (inward - outward) balance and is an important (net) host of FDI. Dirty
industries are not at all en masse leaving the US. The contrary is true. We find in table 5
that the high variance within the groups - what could be expected from working with
changes in balances - resulted however in a P-value of 0.1029.
Table 3 Summary of ANOVA : growth rate in (inward -outward) FDI balance
Groups Count Sum Average Variance
Dirty 8 2136 267 296338
Medium 8 -428 -53.5 4868.6
Clean 8 -839 -104.8 38866.7
Source of variation SS df MS F P-value Fcrit
Between groups 64975 2 324867 2.539 0.1029 3.46679
Within groups 2686905 21 127948
Total 3336640
To reduce the variance within the three groups, we express the 1991-1995 change in
(inward minus outward) balance as a percentage of the initial inward FDI-position. This
gives us net inflow of capital as a percentage of existing position.
For metal mining, as an example, the inwardsurplus increased with 38% from 1991 to
1995. This increase (US$ 828 million) represented 15.59% of total inward FDI in 1991 ($US
5312 million).
Comparing these percentages for the three groups gave good results, as shown in table
4. Again, only dirty industries could improve their balanced position, while medium and
clean industries saw more capital flow out of the US than flow in. In this case, the P-value
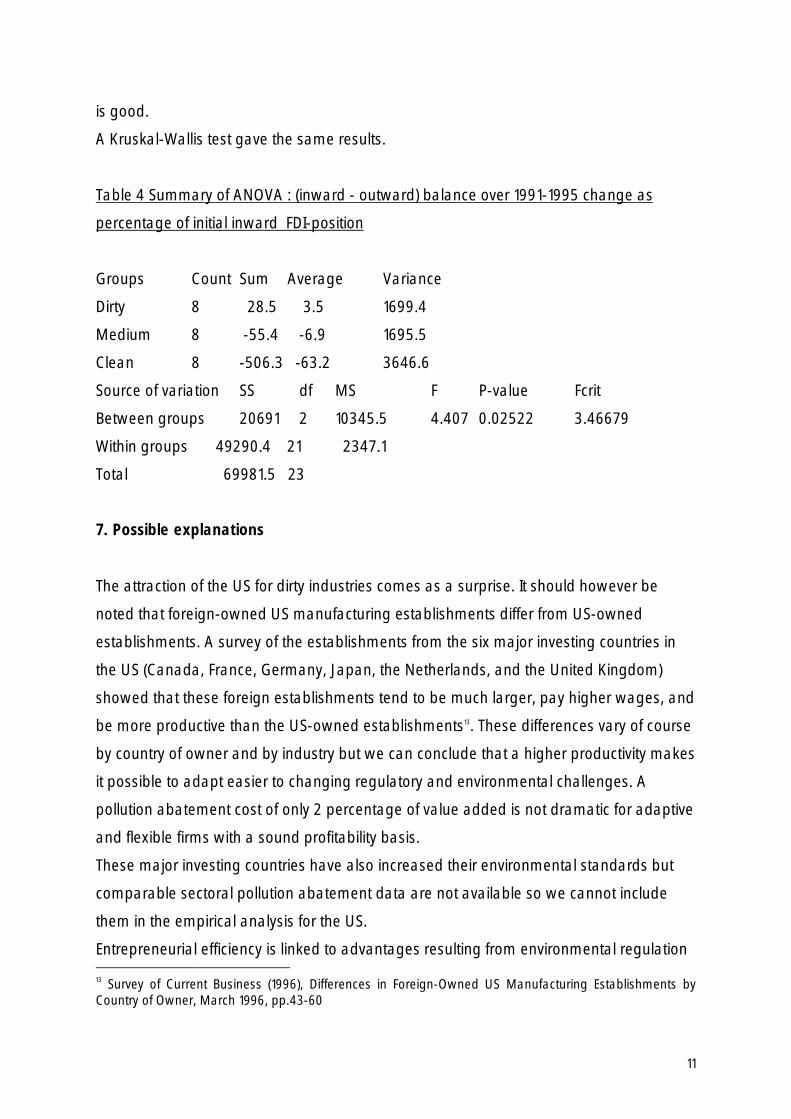
11
is good.
A Kruskal-Wallis test gave the same results.
Table 4 Summary of ANOVA : (inward - outward) balance over 1991-1995 change as
percentage of initial inward FDI-position
Groups Count Sum Average Variance
Dirty 8 28.5 3.5 1699.4
Medium 8 -55.4 -6.9 1695.5
Clean 8 -506.3 -63.2 3646.6
Source of variation SS df MS F P-value Fcrit
Between groups 20691 2 10345.5 4.407 0.02522 3.46679
Within groups 49290.4 21 2347.1
Total 69981.5 23
7. Possible explanations
The attraction of the US for dirty industries comes as a surprise. It should however be
noted that foreign-owned US manufacturing establishments differ from US-owned
establishments. A survey of the establishments from the six major investing countries in
the US (Canada, France, Germany, Japan, the Netherlands, and the United Kingdom)
showed that these foreign establishments tend to be much larger, pay higher wages, and
be more productive than the US-owned establishments13. These differences vary of course
by country of owner and by industry but we can conclude that a higher productivity makes
it possible to adapt easier to changing regulatory and environmental challenges. A
pollution abatement cost of only 2 percentage of value added is not dramatic for adaptive
and flexible firms with a sound profitability basis.
These major investing countries have also increased their environmental standards but
comparable sectoral pollution abatement data are not available so we cannot include
them in the empirical analysis for the US.
Entrepreneurial efficiency is linked to advantages resulting from environmental regulation 13 Survey of Current Business (1996), Differences in Foreign-Owned US Manufacturing Establishments byCountry of Owner, March 1996, pp.43-60
12
by the Porter hypothesis. An efficient regulation that reduces uncertainty, creates maxi-
mum opportunity for innovation and fosters continuous improvements can results in clear
advantages over non-regulated firms and regions14.
An illustration of the Porter hypothesis can be found in the fact that the most competitive
environmental industries are found in countries with stringent environmental regulations.
According to Rolf-Ulrich Sprenger15 from IFO (Munich), one of the major reasons for
Germany's success in exports of environmental goods and technology is that exacting
national policies on environmental protection created an early domestic demand, which
ultimately gave a technological edge over its competitors.
If we link this with the estimates from MITI, Miller and Moore16 that in the first half of the 21st
century 40% of global economic output will be from environment- or energy-linked
products and technologies, the development of efficient regulation will be a crucial factor.
The choice of instruments that stimulate innovations and improvements will be important.
Performance standards, pollution charges, information disclosure and subsidies for
environmental R&D are expected to perform better than standards, emissions trading and
voluntary agreements.
We will focus on environmental R&D expenditures and try to distinguish dirty from clean
industries. We can assume that firms with high R&D expenditures make these efforts for
specific reasons like the development of new products and new designs but also for
modifications and improvements of the production process.
An important part of the new technologies can be seen as clean technologies, just
because environmental considerations are integrated in the R&D objectives. It is obvious
that clean technologies offer an important cost-decreasing opportunity in industries with
high pollution abatement costs.
The link between global R&D expenditures and cost savings by means of clean technolo-
gies is of course complicated and depending on many factors. Investing in new technolo-
gies is always a risky and costly engagement for several years during which new
14 Porter and Van der Linden (1995), Toward a New Conception of the Environment-CompetitivenessRelationship, Journal of Economic Perspectives
15 Rolf-Ulrich Sprenger (1996), Environmental Policy and International Competitiveness : the Case of Germany,IFO Paper, p.32
16 Miller and Moore (1994), Strengths and Limitation of Governmental Support for Environmental Technologyin Japan, Industrial and Environmental Crisis Quaterly
13
oppurtunities can rise. Many entrepreneurs could therefore opt to wait and invest when
the clean technologies improve overall efficiency.
These 'economics of waiting' are not the only limiting factor in the diffusion of clean
technologies. Not all firms are aware of the latest technological innovations and possibili-
ties, nor have the means to conduct own R&D. In many cases, their interaction with the
economic environment is limited to a fixed number of other entreprises, federations,
suppliers, customers, government agencies, banks, lawyers, etc. In order to be aware of
recent scientific and technological developments, they should find a network that can
provide them recent information. And even when firms are aware of latest technological
possibilities, their followed technological trajectories in the past can make it impossible or
very expensive to install new technologies.
Another limitation for the introduction of clean technologies could be a limited willingness
to innovate. This willingness to innovate can strongly differ among industries. Determi-
nants can be : past experiences with innovations, long-term perspective of the actual
capital structure, uncertain appropriability of new technologies or licenses, legal or
regulatory uncertainty that necessitates investors to wait, difficult to estimate investment
risks, general uncertainty, conjectural market problems, ...
However, we can suppose that large scale firms with high productivity (and hence
profitability) that take the risk to invest in a competitive economy with a strict regulatory
framework, have the necessary means and entrepreneurial spirit to undertake the
needed research and development.
7.1 Some selected cases on cleaner technologies and lower costs
The following benefits of introducing clean technologies through process modifications
have been identified in most surveys on the subject by UNEP17 :
(a) Savings in raw material and energy ;
(b) Decreased waste management costs ;
(c) Improved product quality ;
(d) Enhanced productivity ;
(e) Decreased down-time ; 17 D.Huisingh (1989), 'Cleaner technologies through process modifications, material substitutions andecologically based ethical values', in UNEP Industry and Environment, pp.4-8
14
(f) Reduced worker health risks and environmental hazards ;
(g) Decreased long-term liability for clean-up of waste-materials that might
otherwise have been buried ;
(h) Improved image for the company ;
The authors of the UNIDO Global Report 1990/1991, Industry and Development, state that
the numerous case-studies at the plant level do suggest that the pollution-prevention
investment in clean technologies can lower production costs and at the same time reduce
emissions. Of course, this conclusion cannot not be generalized across industries and
countries. We present a case from the metal industry and one from the paper industry..
In environmental literature on the opportunities and limitations of BATNEEC (Best Available
Technology Not Entailing Excessive Costs) and BPEO (Best Practicable Environmental
Option), cases like Ciba-Ceigny illustrate improvements to the following technologies with
environmental impact resulting from general R&D programmes.
The list of improvements is long : chemical and biological effluent treatment,
biodegradation of special wastes, wet air oxidation of non-biodegradable wastes,
incineration of wastes, biofiltration for waste air purification/deodorization, off-gas
purification by absorption, catalytic oxidation, incineration, flue-gas purification, immobili-
zation and stabilization of slags and ashes, site remediation, groundwater decontamina-
tion, ecotoxicology, environmental trace analysis, biospheric monitoring and noise
abatement18.
7.2 Do R&D expenditures distinguish dirty from clean and medium industries?
Case studies suggest that R&D can lead to clean and cost-saving technologies. Of course,
data on R&D-expenditures do not distinguish between product or process-oriented R&D,
neither between clean or not-clean technologies.
The R&D part of total pollution abatement expenditures seems to be non-constant and
can depend on regulatory requirements or cost-reducing opportunities. Unfortunately, we
have no sectoral data on environmental R&D.
We then studied the sectoral expenditures for total R&D (also other R&D than for PA). The
Bureau of Economic Analysis19 presents data for most manufacturing sectors (2-digit level). 18 Hutchinson and Hutchinson (1997), Environmental Business Management, p.267
19 Survey of Current Business (1994), A Satellite Account for Research and Development, pp.37-71
15
Data on R&D expenditures performed outside the US by US companies and foreign
subsidiaries were also available.
When we concentrate on the 5-year period 1988-1992, we analyse the growth in R&D
expenditures for the group of dirty and the group of clean industries. The period of
analysis partly preceeds and overlaps the period of the inward and outward investment
analysis.
It is not surprising that capital-intensive industries have the highest R&D expenditures. In
1992, US$ 16835 million was spent by the chemical (and allied products) industry, US$
15303 million by 'industrial machinery and equipment', US$ 13634 million by 'electronic
and electric equipment', and so on.
Nentjes and Wiersma20 observed already during the 1980s that the most active sectors in
environmental-related industrial R&D are machinery, chemicals, petroleum and motor
vehicles. The relation between green R&D and general R&D seems to be obvious.
The growth rate of R&D expenditures over the 1988-1992 period was calculated for the
group of dirty and clean industries.
The difference was great. On average R&D expenditures in the US by dirty industries (that
were already impressive) increased by 29%, while on average the clean industries
reduced R&D expenditures by -1%. The variance within the groups is however too great (F
= 3.05663, P-value = 0.11854, F crit = 5.31764).
A very significant result was obtained by excluding primary metal industries from the
group of dirty industries (R&D opportunities are less available for primary industries) and
by including R&D performed outside the US by US companies and the foreign subsidia-
ries. We can assume that R&D is managed on a transnational basis. We found that the
dirty industries invested very strong in R&D : on average + 45.4% for the period 1988-1992!
The clean industries reduced R&D expenditures by - 0.7 %. The difference proved to be
very significant : P-value = 0.02828.
8. The same story for the EU?
We wonder whether our findings for the US also hold for the situation in Europe.
A simple comparison between the US and EU makes no sense. The EU consists of 15 20 Nentjes, Andries and Doede, Wiersma (1987), Innovation and Pollution Control, International Journal ofSocial Economics, Vol.15, pp.51-71
16
relatively small countries that experienced specific interactions due to the gradual
integration into the EEC/EU. Since the EU increased step by step, investment patterns
among EU and non-EU European countries changed significantly for non-endogenous
reasons.
Baldwin, Forslid and Haaland21 analysed investment creation and diversion in Europe with
special focus on the consequences of EU membership for the former EFTA-countries. They
calibrated EU-integration effects for 15 sectors (with monopolistic competition) with steady-
state capital stock and found that the process of trade cost reduction and integrated
market prices (market fragmentation, the procompetitive mechanism and scale effects)
will lead to an overall increase of 1.8 % for the EU-capital base. The sectors with the
highest increases in production and investment (FDI-included) were chemicals, food
products, rubber and plastic products, transport equipment, electrical goods, agricultural
and industrial machines. These sectors make intensive use of capital and nature.
It is clear that inward FDI in EU-countries are influenced by integration scenario's. We
should be aware of this when we analyse FDI-patterns in Europe.
Eurostat22 offers electronic data on direct investments flows in the EU for the period 1984-
1993. The data were however not detailed enough to include them into the empirical
analysis for the US.
We analysed inward investment flows for chemicals and machinery. Data were available
for Germany, Denmark, Spain, France, the UK and Italy. Two sources for the inward FDI-
flows were also given : intra-EU (Germany invests in Spain,..) and extra-EU (Japan invests
in Belgium).
Table 5 Inward EU-FDI in mill.ECU in selected sectors, 1984-1993
EU Germany Denmark Spain France UK Italy
Chemicals
Intra-EU 12080 -1071 -14 1596 1536 2025 1181
Extra-EU 5263 -803 413 1193 1226 2512 1726
Total 17343 -1874 399 2789 2762 4537 2907
21 Richard E. Baldwin, Rikard Forslid and Jan I.Haaland (1996), Investment Creation and Diversion in Europe,The World Economy, Vol.19, No.6, pp.635-659
22 Eurostat (1996), Statistical Office of the European Communities, FDI European Union Direct Investment1984-1993, Theme 2, Series D, Luxembourg
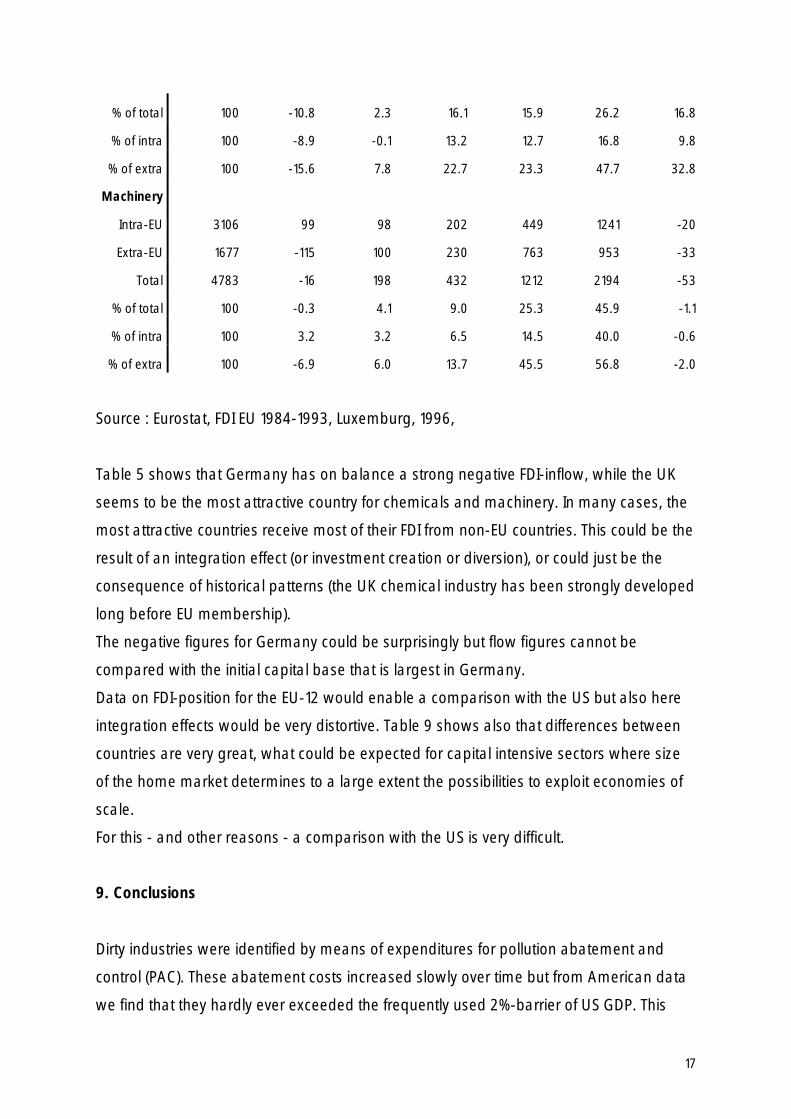
17
% of total 100 -10.8 2.3 16.1 15.9 26.2 16.8
% of intra 100 -8.9 -0.1 13.2 12.7 16.8 9.8
% of extra 100 -15.6 7.8 22.7 23.3 47.7 32.8
Machinery
Intra-EU 3106 99 98 202 449 1241 -20
Extra-EU 1677 -115 100 230 763 953 -33
Total 4783 -16 198 432 1212 2194 -53
% of total 100 -0.3 4.1 9.0 25.3 45.9 -1.1
% of intra 100 3.2 3.2 6.5 14.5 40.0 -0.6
% of extra 100 -6.9 6.0 13.7 45.5 56.8 -2.0
Source : Eurostat, FDI EU 1984-1993, Luxemburg, 1996,
Table 5 shows that Germany has on balance a strong negative FDI-inflow, while the UK
seems to be the most attractive country for chemicals and machinery. In many cases, the
most attractive countries receive most of their FDI from non-EU countries. This could be the
result of an integration effect (or investment creation or diversion), or could just be the
consequence of historical patterns (the UK chemical industry has been strongly developed
long before EU membership).
The negative figures for Germany could be surprisingly but flow figures cannot be
compared with the initial capital base that is largest in Germany.
Data on FDI-position for the EU-12 would enable a comparison with the US but also here
integration effects would be very distortive. Table 9 shows also that differences between
countries are very great, what could be expected for capital intensive sectors where size
of the home market determines to a large extent the possibilities to exploit economies of
scale.
For this - and other reasons - a comparison with the US is very difficult.
9. Conclusions
Dirty industries were identified by means of expenditures for pollution abatement and
control (PAC). These abatement costs increased slowly over time but from American data
we find that they hardly ever exceeded the frequently used 2%-barrier of US GDP. This
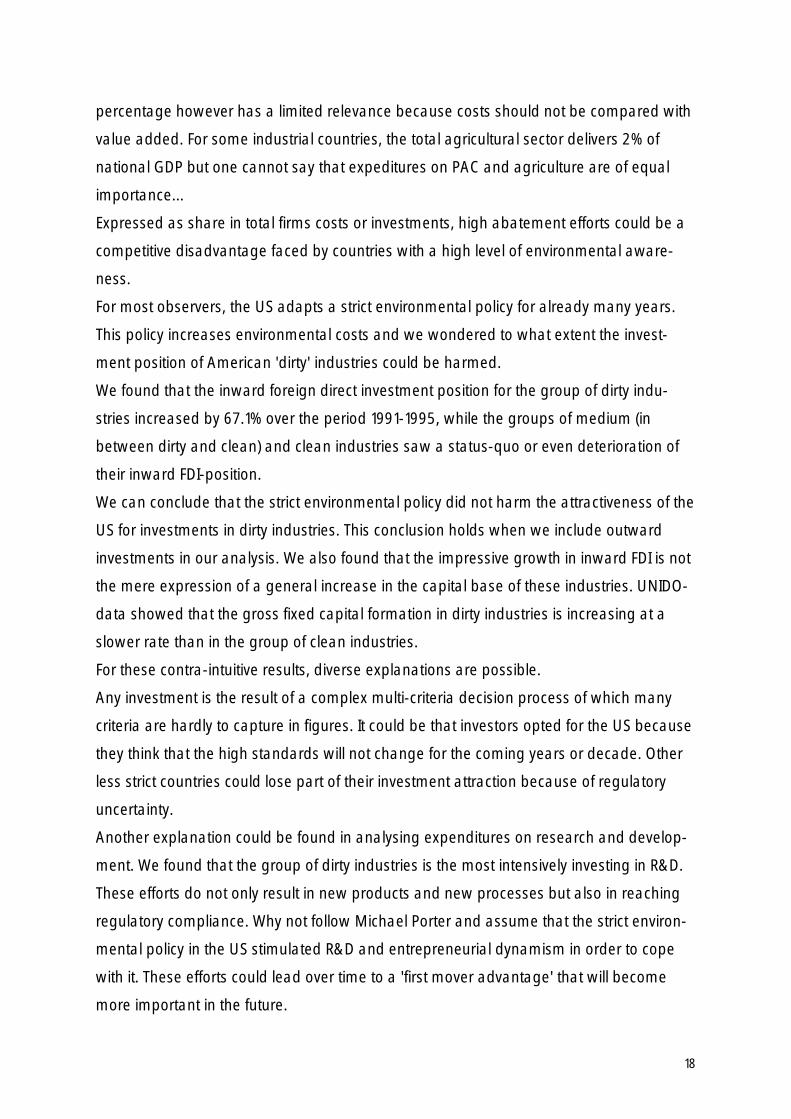
18
percentage however has a limited relevance because costs should not be compared with
value added. For some industrial countries, the total agricultural sector delivers 2% of
national GDP but one cannot say that expeditures on PAC and agriculture are of equal
importance...
Expressed as share in total firms costs or investments, high abatement efforts could be a
competitive disadvantage faced by countries with a high level of environmental aware-
ness.
For most observers, the US adapts a strict environmental policy for already many years.
This policy increases environmental costs and we wondered to what extent the invest-
ment position of American 'dirty' industries could be harmed.
We found that the inward foreign direct investment position for the group of dirty indu-
stries increased by 67.1% over the period 1991-1995, while the groups of medium (in
between dirty and clean) and clean industries saw a status-quo or even deterioration of
their inward FDI-position.
We can conclude that the strict environmental policy did not harm the attractiveness of the
US for investments in dirty industries. This conclusion holds when we include outward
investments in our analysis. We also found that the impressive growth in inward FDI is not
the mere expression of a general increase in the capital base of these industries. UNIDO-
data showed that the gross fixed capital formation in dirty industries is increasing at a
slower rate than in the group of clean industries.
For these contra-intuitive results, diverse explanations are possible.
Any investment is the result of a complex multi-criteria decision process of which many
criteria are hardly to capture in figures. It could be that investors opted for the US because
they think that the high standards will not change for the coming years or decade. Other
less strict countries could lose part of their investment attraction because of regulatory
uncertainty.
Another explanation could be found in analysing expenditures on research and develop-
ment. We found that the group of dirty industries is the most intensively investing in R&D.
These efforts do not only result in new products and new processes but also in reaching
regulatory compliance. Why not follow Michael Porter and assume that the strict environ-
mental policy in the US stimulated R&D and entrepreneurial dynamism in order to cope
with it. These efforts could lead over time to a 'first mover advantage' that will become
more important in the future.

19
Based on investment data, we therefore conclude that a strict environmental policy does
not necesarily harm national competitivity. Of course, this will not be guaranteed for each
country but the US case could be inspiring for governments that want to integrate
environmental priorities in the business environment.

20
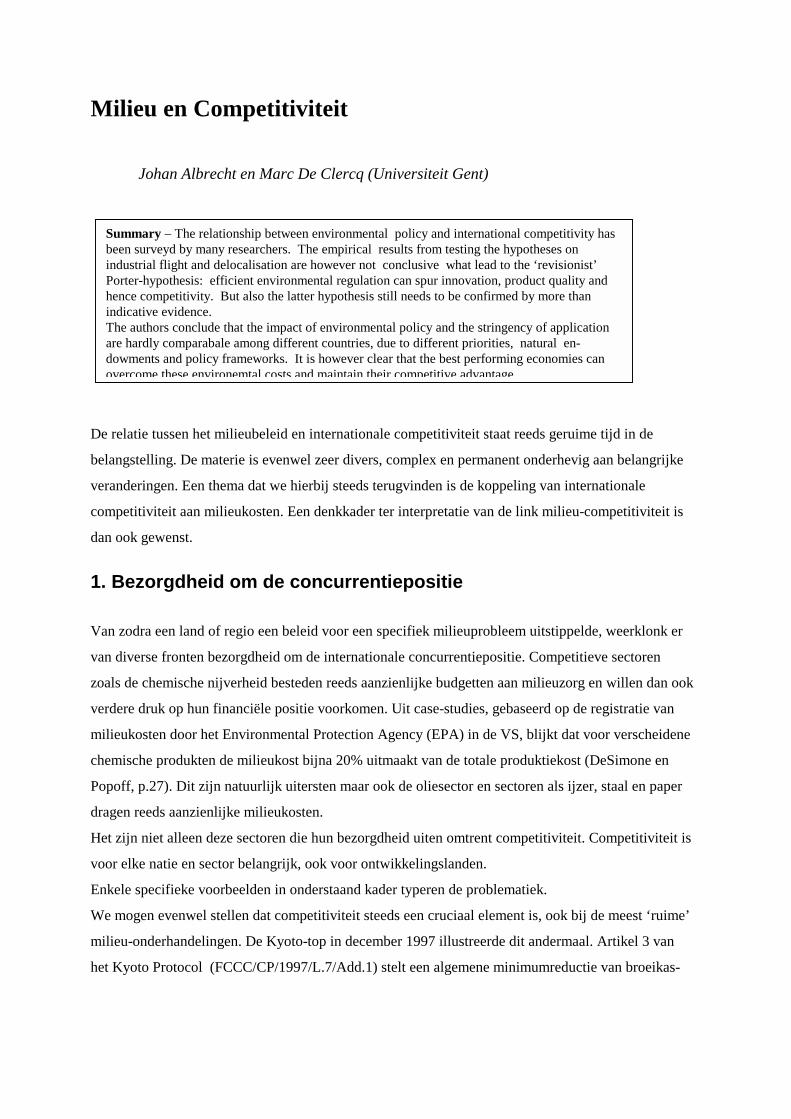
Milieu en Competitiviteit
Johan Albrecht en Marc De Clercq (Universiteit Gent)
D
b
v
c
d
1
V
v
zo
v
m
c
P
d
H
v
E
W
m
h
Summary – The relationship between environmental policy and international competitivity hasbeen surveyd by many researchers. The empirical results from testing the hypotheses onindustrial flight and delocalisation are however not conclusive what lead to the ‘revisionist’Porter-hypothesis: efficient environmental regulation can spur innovation, product quality andhence competitivity. But also the latter hypothesis still needs to be confirmed by more thanindicative evidence.The authors conclude that the impact of environmental policy and the stringency of applicationare hardly comparabale among different countries, due to different priorities, natural en-dowments and policy frameworks. It is however clear that the best performing economies canovercome these environemtal costs and maintain their competitive advantage.
e relatie tussen het milieubeleid en internationale competitiviteit staat reeds geruime tijd in de
elangstelling. De materie is evenwel zeer divers, complex en permanent onderhevig aan belangrijke
eranderingen. Een thema dat we hierbij steeds terugvinden is de koppeling van internationale
ompetitiviteit aan milieukosten. Een denkkader ter interpretatie van de link milieu-competitiviteit is
an ook gewenst.
. Bezorgdheid om de concurrentiepositie
an zodra een land of regio een beleid voor een specifiek milieuprobleem uitstippelde, weerklonk er
an diverse fronten bezorgdheid om de internationale concurrentiepositie. Competitieve sectoren
als de chemische nijverheid besteden reeds aanzienlijke budgetten aan milieuzorg en willen dan ook
erdere druk op hun financiële positie voorkomen. Uit case-studies, gebaseerd op de registratie van
ilieukosten door het Environmental Protection Agency (EPA) in de VS, blijkt dat voor verscheidene
hemische produkten de milieukost bijna 20% uitmaakt van de totale produktiekost (DeSimone en
opoff, p.27). Dit zijn natuurlijk uitersten maar ook de oliesector en sectoren als ijzer, staal en paper
ragen reeds aanzienlijke milieukosten.
et zijn niet alleen deze sectoren die hun bezorgdheid uiten omtrent competitiviteit. Competitiviteit is
oor elke natie en sector belangrijk, ook voor ontwikkelingslanden.
nkele specifieke voorbeelden in onderstaand kader typeren de problematiek.
e mogen evenwel stellen dat competitiviteit steeds een cruciaal element is, ook bij de meest ‘ruime’
ilieu-onderhandelingen. De Kyoto-top in december 1997 illustreerde dit andermaal. Artikel 3 van
et Kyoto Protocol (FCCC/CP/1997/L.7/Add.1) stelt een algemene minimumreductie van broeikas-
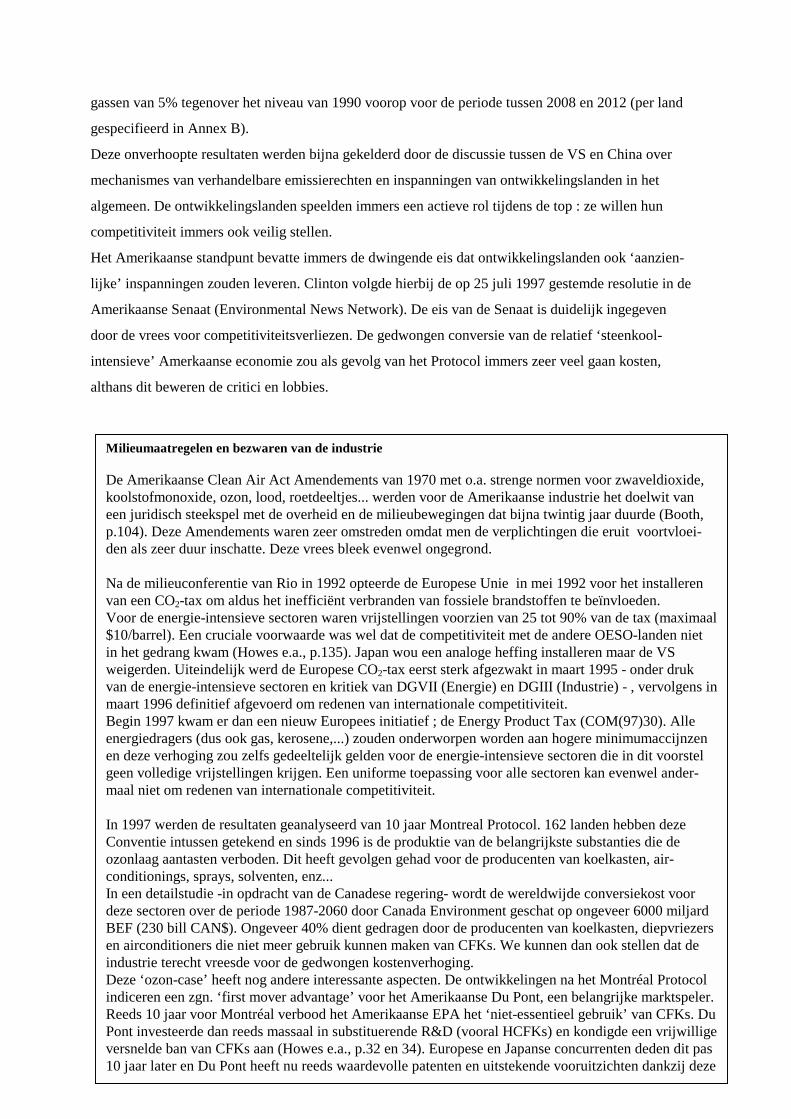
gassen van 5% tegenover het niveau van 1990 voorop voor de periode tussen 2008 en 2012 (per land
gespecifieerd in Annex B).
Deze onverhoopte resultaten werden bijna gekelderd door de discussie tussen de VS en China over
mechanismes van verhandelbare emissierechten en inspanningen van ontwikkelingslanden in het
algemeen. De ontwikkelingslanden speelden immers een actieve rol tijdens de top : ze willen hun
competitiviteit immers ook veilig stellen.
Het Amerikaanse standpunt bevatte immers de dwingende eis dat ontwikkelingslanden ook ‘aanzien-
lijke’ inspanningen zouden leveren. Clinton volgde hierbij de op 25 juli 1997 gestemde resolutie in de
Amerikaanse Senaat (Environmental News Network). De eis van de Senaat is duidelijk ingegeven
door de vrees voor competitiviteitsverliezen. De gedwongen conversie van de relatief ‘steenkool-
intensieve’ Amerkaanse economie zou als gevolg van het Protocol immers zeer veel gaan kosten,
althans dit beweren de critici en lobbies.
Milieumaatregelen en bezwaren van de industrie
De Amerikaanse Clean Air Act Amendements van 1970 met o.a. strenge normen voor zwaveldioxide,koolstofmonoxide, ozon, lood, roetdeeltjes... werden voor de Amerikaanse industrie het doelwit vaneen juridisch steekspel met de overheid en de milieubewegingen dat bijna twintig jaar duurde (Booth,p.104). Deze Amendements waren zeer omstreden omdat men de verplichtingen die eruit voortvloei-den als zeer duur inschatte. Deze vrees bleek evenwel ongegrond.
Na de milieuconferentie van Rio in 1992 opteerde de Europese Unie in mei 1992 voor het installerenvan een CO2-tax om aldus het inefficiënt verbranden van fossiele brandstoffen te beïnvloeden.Voor de energie-intensieve sectoren waren vrijstellingen voorzien van 25 tot 90% van de tax (maximaal$10/barrel). Een cruciale voorwaarde was wel dat de competitiviteit met de andere OESO-landen nietin het gedrang kwam (Howes e.a., p.135). Japan wou een analoge heffing installeren maar de VSweigerden. Uiteindelijk werd de Europese CO2-tax eerst sterk afgezwakt in maart 1995 - onder drukvan de energie-intensieve sectoren en kritiek van DGVII (Energie) en DGIII (Industrie) - , vervolgens inmaart 1996 definitief afgevoerd om redenen van internationale competitiviteit.Begin 1997 kwam er dan een nieuw Europees initiatief ; de Energy Product Tax (COM(97)30). Alleenergiedragers (dus ook gas, kerosene,...) zouden onderworpen worden aan hogere minimumaccijnzenen deze verhoging zou zelfs gedeeltelijk gelden voor de energie-intensieve sectoren die in dit voorstelgeen volledige vrijstellingen krijgen. Een uniforme toepassing voor alle sectoren kan evenwel ander-maal niet om redenen van internationale competitiviteit.
In 1997 werden de resultaten geanalyseerd van 10 jaar Montreal Protocol. 162 landen hebben dezeConventie intussen getekend en sinds 1996 is de produktie van de belangrijkste substanties die deozonlaag aantasten verboden. Dit heeft gevolgen gehad voor de producenten van koelkasten, air-conditionings, sprays, solventen, enz...In een detailstudie -in opdracht van de Canadese regering- wordt de wereldwijde conversiekost voordeze sectoren over de periode 1987-2060 door Canada Environment geschat op ongeveer 6000 miljardBEF (230 bill CAN$). Ongeveer 40% dient gedragen door de producenten van koelkasten, diepvriezersen airconditioners die niet meer gebruik kunnen maken van CFKs. We kunnen dan ook stellen dat deindustrie terecht vreesde voor de gedwongen kostenverhoging.Deze ‘ozon-case’ heeft nog andere interessante aspecten. De ontwikkelingen na het Montréal Protocolindiceren een zgn. ‘first mover advantage’ voor het Amerikaanse Du Pont, een belangrijke marktspeler.Reeds 10 jaar voor Montréal verbood het Amerikaanse EPA het ‘niet-essentieel gebruik’ van CFKs. DuPont investeerde dan reeds massaal in substituerende R&D (vooral HCFKs) en kondigde een vrijwilligeversnelde ban van CFKs aan (Howes e.a., p.32 en 34). Europese en Japanse concurrenten deden dit pas10 jaar later en Du Pont heeft nu reeds waardevolle patenten en uitstekende vooruitzichten dankzij deze
i i
2. Milieu en competitiviteit : empirisch onderzoek
Wanneer de Europese CO2-tax afgevoerd werd en als we zien hoe stroef en langzaam bepaalde landen
maatregelen van diverse Conventies implementeren, hoe bevochten de consensus in Kyoto was en hoe
heftig lobbiegroepen zich hebben gekant tegen ogenschijnlijk neutrale maatregelen zoals bijvoorbeeld
de Europese labels voor energiezuinige produkten, dan verwachten we duidelijke empirische verban-
den tussen milieu- en energiekosten en de internationale competitiviteit.
Het tegendeel is echter waar. De eerste (internationale) onderzoeken naar de link tussen milieu en
competitiviteit dateren van begin jaren ‘80 en komen steeds tot dezelfde conclusie : milieuzorg
schaadt de competitiviteit niet. De meeste studies behandelen vooral de impact van ‘command and
control’ wetgeving. Een goed overzicht vindt men in de bekende overzichtsstudie van Judith M.Dean
uit 1992. Het niet kunnen ondersteunen van de hypotheses van competitiviteitsverlies en het delocali-
seren van vervuilende sectoren naar landen met een minder streng milieubeleid, kan volgens Dean te
wijten zijn aan de gebrekkige berekening van milieukosten door bedrijven.
Een recent overzicht met vergelijkbare conclusies vinden we bij Michael Rauscher.
Specifiek voor de VS zijn er studies van Jaffe, Grossman en Krueger (analyse maquiladora-
programma met Mexico) en Kalt. Hierbij worden Input/Output-analyses gebruikt wat een vollediger
beeld geeft. De resultaten kunnen geen duidelijk negatief verband aantonen. Er zijn wel beperkte
indicaties.
Voor het Verenigd Koninkrijk is er de recente studie van Smith en een Nederlandstalig overzicht
vinden we bij Komen en Folmer. Ook zij concluderen dat bedrijven blijkbaar niet vluchten voor een
streng milieubeleid.
Indicaties voor het tegendeel (strengere milieubescherming en betere exportprestaties) vinden we o.a.
in enkele overzichtsstudies van de Europese Commissie (EC, p.146) en bij David Pearce.
Enkele studies verdienen extra aandacht. Patrick Low van de Wereldbank maakt gebruik van indices
van comparatief voordeel (RCA : revealed comparative advantage) om aan te tonen dat over een
periode van 20 jaar het terugvallend aandeel van de vervuilende sectoren in de wereldhandel gepaard
gaat met een toenemend aandeel van ontwikkelingslanden in deze specifieke handelsstromen. Dit kan
een indicatie zijn van een delocalisatie van vervuilende sectoren naar regio’s met minder milieure-
glementering. Het kan evenwel ook gewoonweg het gevolg zijn van industriële ontwikkeling binnen
deze regio’s of van het inspelen op loonkostverschillen.
Sterk vergelijkbare resultaten vinden we in een UNCTAD-studie voor de periode 1981-1991. Hierin
wordt nagegaan in welke mate sectoren met een hoge milieukost - in termen van uitgaven ter
bestrijding van de milieuverontreiniging (pollution abatement cost)- hun aandeel kunnen uitbreiden in
intra-OESO handelsstromen. Vervolgens wordt voor dezelfde periode gekeken naar de regio’s die hun
aandeel in deze exporten van vervuilende produkten kunnen uitbreiden. Uit de resultaten, gepresen-
teerd in ‘competitiveness matrices’, blijkt dat vooral ontwikkelingslanden hun aandeel hebben kunnen
uitbreiden in deze sectoren die als groep voor de OESO van minder belang geworden zijn.
Een andere bekende studie is deze van James A.Tobey. Hij gebruikt een index van milieustrengheid,
samengesteld door Walter en Ugelow, om landen een ranking te geven van 1 (zeer tolerant) tot 7 (zeer
streng). Drie landen halen de hoogste score : de VS, Zweden en Japan. Drie landen halen de op één na
hoogste score : Finland, Noorwegen en Singapore. De empirische analyse toont echter aan dat de
index van milieustrengheid niet significant bijdraagt tot het verklaren van de exportstromen. Tobey
ziet in marktbarrières een verklaring voor de ‘tegenvallende’ resultaten. Een oplossing kan zijn het
werken met investeringsgevens in plaats van met exportgegevens.
Tenslotte dienen we te onderstrepen dat bijna al deze geciteerde studies competitviteit meten door
gebruik te maken van handelsstromen. Wanneer we evenwel studies analyseren die de impact bestu-
deren van milieumaatregelen op de nationale werkgelegenheid, dan is de conclusie veelal dat de
verminderde werkgelegenheid in de vervuilende sectoren meer dan gecompenseerd wordt de sterke
groei van de nieuwe milieusectoren (EC, COM(95)396). Deze zouden in Europa goed zijn voor
minimum 1,6 miljoen banen (hoofdzakelijk afvalwaterzuivering en afvalverwijdering). Deze econo-
mische activiteit vinden we maar in zeer beperkte mate terug in de handelsstromen wat indiceert dat
handelscijfers alleen onvoldoende informatie bevatten om sluitende conclusies te trekken.
3. Een index voor milieustrengheid
Er is maar één studie die een significant verband vindt tussen een streng milieubeleid en uitvoerpres-
taties. Deze studie van Cees Van Beers en Jeroen van den Bergh lijkt sterk op de studie van Tobey. Ze
onderzoeken bilaterale handel tussen OESO-landen en maken ook gebruik van een maatstaf voor
striktheid van milieubeleid. De ranking als gevolg van deze index is evenwel het zwakke element in
deze studie. Deze is zeker voor discussie vatbaar. Oostenrijk zou het strengste milieubeleid hebben
binnen de OESO, gevolgd door Nederland, Duitsland, Denemarken, Japan, Zweden, Zwitserland,
Canada, enzovoort. Het meest lakse milieubeleid wordt toegeschreven aan de VS, Spanje, Finland,
Noorwegen, Portugal, Griekenland en Italië. Daarnaast is er nog een tweede ranking (de ‘enge’
indicator), uitsluitend gebaseerd op verandering in het energiegebruik tussen 1981 en 1991 en op het
niveau van energiegebruik in 1980. Hierbij staat zelfs België in het koppeleton en bengelen zoals
verwacht Australië, Canada en de Scandinavische landen onderaan. Ook de VS ‘scoort’ slecht.
Deze ranking is bijna het spiegelbeeld van deze van Tobey en de resultaten zijn dan ook verschillend.
De auteurs stellen dat, gebruik makend van deze enge indicator, de hypothese dat een streng milieu-
beleid een negatieve invloed uitoefent op exporten niet kan worden verworpen.
De relevantie van deze resultaten is aanvechtbaar. Een index van milieustrengheid per land blijft in
een grote mate arbitrair. Deze index laten afhangen van de toename van het energiegebruik is zeer
eenzijdig.
De ideale ranking bestaat natuurlijk niet. Rijke landen treden als eerste in de fase van vergevorderde
industriële verontreiniging en moeten dan ook als eerste maatregelen uitwerken. De eerste wet ter
beperking van toxische emissies - de Engelse Alkali Act uit 1863 - kwam er omdat de regio rond het
Engelse Widnes als eerste de alkali-industrie zag ontwikkelen rond het midden van de vorige eeuw
(Gottlieb, p.210). Het is dan ook vrij logisch dat landen als de VS, Canada en Duitsland op vele
domeinen een aanzienlijke voorsprong hebben op landen met een eerder middelmatig milieuprofiel
zoals België. Dit is moeilijk in cijfers uit te drukken.
4. De analyse op het niveau van landen en de Porter-hypothese
Na het overzicht van de empirische studies, dienen we twee fundamentele vragen te stellen : bestaat er
competitie tussen landen en wat is daarbij de rol van milieuzorg?
De eerste vraag is het uitgangspunt van The Competitive Advantage of Nations van Michael Porter.
Volgens hem zijn het immers bedrijven die met elkaar concurreren en is de rol van de overheid vooral
ondersteunend. Het overheid dient een ruim kader te creëren en te bestendigen waarbinnen bedrijven
kunnen evolueren tot kwalitatieve marktspelers. De cruciale variabelen hiertoe zijn vooral arbeidspro-
duktiviteit, kwaliteit en relatieve kostprijs van de productiefactoren, het wetgevend kader en investe-
ringen in onderwijs, R&D en infrastructuur. Milieuregulering is een deel van het wetgevende kader en
dient dus ook efficiënt en effectief geconcipieerd te zijn.
Binnen deze context is het belangrijk dat de traditionele handelsbelemmeringen zoals tarieven en
quota langzaam maar zeker volledig uitdoven waardoor de liberalisatie-inspanningen verschuiven naar
verschillen in produktstandaarden en de wetgevende omgeving. De mogelijke barrières als gevolg van
een strikt milieubeleid worden dus belangrijker omdat de traditionele beperkingen weggewerkt
worden.
In later werk stellen Porter en van der Linden dat de hypothese van de nadelige impact van milieure-
glementering op de competitiviteit moet vervangen worden door deze waarbij efficiënte wetgeving
resulteert in duidelijke voordelen voor de gereguleerde sectoren. Dit is de Porter-hypothese die in het
begin van de jaren ‘90 in enkele papers uitgewerkt werd. Het voorbeeld van de pro-actieve strategie
van Du Pont kan als een illustratie van deze hypothese gezien worden. Enkele cases zijn natuurlijk
geen afdoen bewijs want er zijn natuurlijk ook tegenvoorbeelden aan te halen (zie hiervoor Walley
and Whitehead).
Het testen van de hypothese veronderstelt dat het onderscheid kan gemaakt worden tussen efficiënte
en niet-efficiënte wetgeving. Dit is niet eenvoudig en zeer moeilijk te kwantificeren.
De meeste auteurs geven dan ook alleen maar indicaties ter ondersteuning van de Porter-hypothese.
Zo gaat Meyer (1993) na of de Amerikaanse Staten met de strengste milieunormen hierdoor in hun
economische ontwikkeling geremd worden. Het tegendeel blijkt waar te zijn. Een logische verklaring
hiervoor is dat vooral staten met goede economische vooruitzichten kunnen investeren in milieuzorg.
Analoog stelt Rolf-Ulrich Sprenger van IFO (München) dat het internationale succes van de Duitse
eco-business te wijten is aan de strenge Duitse wetgeving, die voorliep op de meeste omliggende
landen en daardoor als eerste een duidelijke binnenlandse vraag naar milieu-technologie en -
consultancy in het leven riep. Ook de Europese Commissie heeft reeds herhaaldelijk benadrukt dat de
Duitse exportcompetitiviteit zeker niet geschaad is geweest door de strenge milieuwetgeving. Deze
vaststelling geldt ook voor de Verenigde Staten (Wereldbank).
Een meer algemene ‘indicatie’ is gewenst en we kunnen deze vinden in een analyse van investerings-
gegevens. Investeerders beoordelen immers de globale aantrekkelijkheid van een land of regio.
Investeringsgegevens zijn echter niet voor alle landen beschikbaar. We beperken ons tot de VS
waarvoor het US Bureau of Economic Analysis (in Survey of Current Business) per sector de inko-
mende investeringsstromen publiceert. Ons baserend op kosten ter voorkoming of opruiming van
vervuiling per sector, vormen we 3 groepen die elk bestaande uit 9 Amerikaanse sectoren : dirty, clean
en medium (tussengroep) industries.
We hebben niet de bedoeling om een globale verklaring van de Amerikaanse inkomende investerings-
stromen te geven : we vertrekken van het standpunt dat de VS reeds lang een beleid hebben dat de
milieu-impact van de meest vervuilende sectoren wil beperken (en daar in slaagt ook), en aldus kan de
aantrekkelijkheid van deze sectoren voor buitenlandse investeerders een goede indicatie zijn van de
link tussen milieubeleid en competitiviteit.
Als de vervuilende sectoren (dirty groep) massaal wegtrekken uit de VS, dan is er wellicht een
negatief verband. Wanneer deze meest vervuilende sectoren evenzeer buitenlands kapitaal als de
andere groepen aantrekken, is het verband neutraal. Wanneer ze beter presteren dan de medium en
‘propere’ groep, dan lijkt de Porter-hypothese ook op macro-niveau relevant te zijn.
De resultaten zijn onverwacht sterk. Over de periode 1991-1995 namen de inkomende buitenlandse
investeringen met 33.8% toe voor de globale Amerikaanse industrie, maar voor de groep van de meest
vervuilende sectoren was de toename echter veel groter : +67.1%. De tussengroep kende een toename
van 7.2% en voor de minst milieubelastende sectoren verminderden de buitenlandse investeringen met
8.2%. Een variantie-analyse over deze drie groepen toonde aan dat deze verschillen significant waren
(P-waarde van 0.003619). Een Kruskal-Wallis test bevestigde deze resultaten.
Dit onverwachte resultaat is niet het gevolg van een sterke binnenlandse toename van de kapitaalbasis
van de vervuilende sectoren. UNIDO-data toonden aan dat de vervuilende sectoren over dezelfde
periode zelfs een kleinere binnenlandse groei van de kapitaalbasis kenden vergeleken met de andere
sectoren. De sterk gereguleerde Amerikaanse sectoren zijn dus blijkbaar zeer aantrekkelijk voor
buitenlandse investeerders. In dezelfde studie (Albrecht,Working Paper UGent),vonden we tevens dat
de ‘dirty ‘ groep significant meer investeerde in R&D dan de andere sectoren. Dit is eigenlijk het
tweede luik van de Porter-hypothese : voorsprong door continue innovatie.
Natuurlijk zijn we er ons van bewust dat deze resultaten op zich niet volstaan om de Porter-hypothese
al dan niet te verwerpen. Hiertoe is een analyse van investeringsstromen en van het milieubeleid in
meerdere landen nodig. Sterk verschillende nationale doelstelllingen en omstandigheden beperken
evenwel de vergelijkbaarheid tussen landen.
Bij deze analyses die gebruik maken van milieukosten, dienen we tevens steeds voor ogen te houden
dat milieuregulering in vele gevallen een éénmalige investering vraagt die dan het normale patroon
van andere kapitaalgoederen volgt (onderhoud, bediening van de installatie, vervanging en reparaties).
Vele sectoren hebben dus maar gedurende enkele jaren sterk verhoogde milieukosten. Eens de
aanpassingen zijn gebeurd, dalen de kosten (ook door verbeterde milieu-efficiëntie). Dit is een
algemene vaststelling (UNIDO) en blijkt bijvoorbeeld ook voor België uit de conjunctuurenquêtes van
de NBB.
Op lange termijn wordt efficiënte milieuzorg een belangrijke pijler van de Amerikaanse en Europese
competitiviteit. De meest acute milieuproblemen doen zich momenteel voor in Azië, Oost-Europa en
bepaalde gebieden in Latijns-Amerika en Afrika (UNEP). Eens daar het gemiddelde welvaartsniveau
gestegen zal zijn tot het niveau waar meer rijkdom meer milieuzorg betekent, zullen deze regio’s sterk
gaan investeren in deze eco-sectoren waarin het rijke Westen tegen dan een comparatief voordeel
opgebouwd zal hebben. Aldus ontstaan elders markten wanneer bij ons milieuzorg algemeen verspreid
zal zijn.
5. Besluit
De relatie milieu-competitiviteit is een permanent element in politieke discussies maar is moeilijk
empirisch te ondersteunen. Milieukosten zijn niet marginaal maar wel tijds- en situatiegebonden.
Weinig landen acteren tevens op hetzelfde niveau van milieuzorg en vergelijkingen zijn dan ook
moeilijk te maken, laat staan te kwantificeren. De Porter-hypothese (als alternatief voor de hypothese
van de negatieve impact van milieukosten op de competitiviteit) kan anderzijds wel steunen op enkele
indicaties maar ook hier is een veralgemening voorbarig.
Bij al de studies moeten we steeds de vraag stellen wat we eigenlijk meten. Indien de belangrijkste
economieën sterk blijven presteren ondanks aanzienlijke milieukosten, is de conclusie dan dat milieu-

kosten niet belangrijk zijn of dat de meest efficiënte economieën deze beperkte tijdelijke handicap
kunnen overwinnen en in bepaalde gevallen zelfs kunnen ombuigen tot een troef op langere termijn?
De tweede visie lijkt ons juister.
Geraadpleegde literatuur
Albrecht, J (1997), Environmental Policy and the Inward Investment Position of US ‘Dirty’ Industries, FaculteitEconomische en Toegepaste Wetenschappen, Working Paper 97/39
Booth, Douglas E.(1998), The Environmental Consequences of Growth, Routledge, London,
Canada Environment (1998), The Right Choice at the Right Time, The Costs and Benefits of the MontrealProtocol, 1998,<Green Lane ; http://www.ec.gc.ca/ozone/choices/sect3_e.html >
Dean, Judith M (1992), Trade and Environment : A Survey of the Literature, World Bank Policy ResearchWorking Paper 966, en in World Bank Discussion Papers (159), International Trade and the Environment, pp.15-28
DeSimone, Livio en Popoff, Frank (1997), Eco-efficiency. The Business Link to Sustainable Development, TheMIT Press, Cambridge, Massachusetts
Easterbrook, Gregg (1995), A Moment on the Earth, Penguin Books USA, New York
European Commission (1997), COM(97)30 Proposal for an Energy product tax
Europese Commissie (1996), Werkgelegenheid in Europa (COM(95)396)), Luxemburg
Gottlieb, R (ed.) (1995), Reducing Toxics. A New Approach to Policy and Industrial Decisionmaking. IslandPress, Washington
Grossman, G. en Krueger, A. (1992), Environmental Impacts of a North American Free Trade Agreement, inGarber, P.(ed.), The US-Mexico Free Trade Agreement, MIT Press, Cambridge
Howes, Rupert, Skea, John en Whelan, Bob (1997), Clean & Competitive? Motivating Environmental Perfor-mance in Industry, Earthscan Publications, London
Jaffe, Adam B et al (1995), Environmental Regulation and the Competitiveness of United States Manufacturing:What Does the Evidence Tell Us, Journal of Economic Literature 33 (1), pp.132-163
Kalt, Joseph P. (1985), The Impact of Domestic Regulatory Policies on International Competitiveness, HarvardInstitute of Economic Research, Discussion Paper No.1411
Komen M. en Folmer H. (1995), Vluchten bedrijven voor milieubeleid?, ESB 15 februari 1995, pp.148-152
Low, Patrick (1992), Do Dirty Industries Migrate?, in World Bank Discussion Papers (159), International Tradeand the Environment, pp.89-103
Meyer, S.M. (1993), Environmentalism and Economic Prosperity : Testing the Environmental Impact Hypothe-sis, MIT Working Paper, Cambridge
Porter, M. (1990), The Competitive Advantage of Nations, Macmillan, London
Porter, M.E. (1991), America’s Green Strategy, Scientific American 168
Porter, M.E. and C. van der Linde (1995), Toward a New Conception of the Environment-CompetitivenessRelationship, Journal of Economic Perspectives, 6(4), pp.119-132
Porter, M.E. and C. van der Linde (1995), Green and Competitive : Ending the Stalemate, Harvard BusinessReview, 73(5), Sept-Oct, pp.120-134
Rauscher, M. (1997), International Trade, Factor Movements, and the Environment, Clarendon Press, Oxford
Smith, A P (1997), Integrated Pollution Control: Change and Continuity in UK Industrial Pollution Regulation,Averbury Press, Aldershot
Sprenger, R-U (1996), Environmental Policy and International Competitiveness : the Case of Germany, IFOPaper
Survey of Current Business (1995), Foreign Direct Investment in the United States, May, pp.57-81
Tobey, James A.(1990), The Effects of Domestic Environmental Policies on Patterns of World Trade: AnEmpirical Test, Kyklos, Vol.43, No.2, pp.191-209
United Nations Environment Programme (1997), Global Environment Outlook (“for life on Earth”), OxfordUniversity Press, New York
United Nations Conference on Trade and Development (1994), Sustainable Development: Trade and Environ-ment - The Impact of Environment-Related Policies on Export Competitiveness and Market Access,TD/B/41(1)/4/Add1, 29 August 1994
United Nations Framework Convention on Climate Change, Kyoto Protocol to the UNFCCC, Conference of theParties, FCCC/CP/1997/L.7/Add.1, 10 December 1997
United Nations Industrial Development Organization (1990-1996), Industry and Development. Global Report
Van Beers, C. en van den Bergh, J.C.J.M (1996), The Impact of Environmental Policy on Trade Flows : AnEmpirical Analysis, Leiden University Research Paper 96.05
Walley, N and Whitehead (1994), It’s Not Easy Being Green, Harvard Business Review, 72(3) March-June, p.46
White House, Office of the Press Secretary (1997), ‘President Clinton’s Climate Change Proposal’ en ‘Remarksby the President on Global Climate Change’, October 22, 1997, Washington DC
C A V A W o r k i n g P a p e r
n o 9 8 / 1 1 / 1 1
E n v i r o n m e n t a l A g r e e m e n t s a n dS e c t o r a l P e r f o r m a n c e : C a s e s o f t h e C F CP h a s e - o u t a n d t h e U S T o x i c R e l e a s eI n v e n t o r y
J o h a n A l b r e c h t
January 1999
C A V A i s t h e E u r o p e a n R e s e a r c h N e t w o r k o nV o l u n t a r y A p p r o a c h e s f o r E n v i r o n m e n t a l P r o t e c t i o n . I t
a i m s a t a c h i e v i n g s y n e r g i e s b e t w e e n r e s e a r c h e r s a n dp r o v i d i n g a n e f f i c i e n t i n t e r f a c e t o p o l i c y m a k e r s . C A V A
i s s t e e r e d b y U n i v e r s i t y C o l l e g e D u b l i n ( I r e l a n d ) ,U n i v e r s i t y o f G e n t ( B e l g i u m ) , F o n d a z i o n e E N I E n r i c o
M a t t e i ( I t a l y ) , Ö k o - I n s t i t u t ( G e r m a n y ) , A K F ( D e n m a r k )a n d C E R N A a t t h e E c o l e d e s M i n e s d e P a r i s ( F r a n c e ,C o o r d i n a t o r ) . T h e N e t w o r k i s f u n d e d b y D G X I I o f t h e
E u r o p e a n C o m m i s s i o n . F o r m o r e i n f o r m a t i o n a b o u t t h eC A V A N e t w o r k p l e a s e g o t o :
ht tp : / /www.ensmp. f r /Fr /CERNA/CERNA/Progeuropeens/CAVA/ index.html
o r c o n t a c t c h i d i a k @ c e r n a . e n s m p . f r
C A V A W o r k i n g P a p e r n o 9 8 / 1 1 / 1 1
J a n u a r y 1 9 9 9 3
This paper was presented at the CAVA workshop "The world-wide use of voluntary approaches -
State of the Art and National Patterns", 26-27 November 1998, Gent, Belgium. The workshop has
been organised by the Centre for Environmental Economics and Environmental Management
(CEEM) at the University of Gent.
A b s t r a c t
Voluntary approaches are considered as a relatively new instrument for
specific environmental policies. It is still too early to present a general evaluation of the
instrument and we therefore present two cases of successful realization of environmental
objectives for which voluntary approaches proved valuable. Industry took up its
responsibility in voluntarily phasing out the production and use of CFCs and in reducing
toxic releases in the US. There are however clear differences. In the case of CFCs, the
complementarity of pro-active national strategies for the CFC-using industries proved to
result in comparative advantages for the US and Denmark.
In the second case, our analysis showed that some US industries could reduce
toxic emissions at a low cost. But probably this was not the most important motive to
invest in pollution reduction. The availability of emission data in the US makes it possible
to identify the biggest polluters and suggest the link between pollution and health
problems in the surroundings of the facility. We can assume that pollution reduction was
an option to avoid costs of liabilities in the future.
In the two cases, there was a clear regulatory threat that could contribute to the
success of the agreements with industry. We should also mention that the targets in both
EAs were not determined by industry.
Johan Albrecht
CEEM – University of Ghent.Hoveniersberg 24
9000 GentBelgium
Tel.: +32 9 264 35 10Fax: +32 9 264 35 99
e-mail: [email protected]
C A V A W o r k i n g P a p e r n o 1 1
J a n u a r y 1 9 9 9 4
1. Introduction
It is obvious that in many environmental debates, the role of industry is of crucial importance.
Industry has a clear information advantage over regulators and pressure groups and has probably the
best competencies to develop the new technologies and structures that will be needed to tackle
complex environmental problems. As a consequence, the position and goodwill of industry can
contribute strongly to the environmental effectiveness of possible solutions and policies. When
industry accepts this ‘shared responsibility’, Environmental Agreements (EAs) - or Voluntary
Agreements (VAs) - can bring about very effective measures, even in advance of detailed legislation.
There are however limitations to the ‘problem-solving’ potential of EAs and in COM(96)561, we
read that EAs ‘are not a panacea and need to be applied in a mix of policy instruments, i.e. as a
supplement to legislation and environmental taxes.’
The intention of the European Commission not to operate EAs in isolation from other policy
instruments, is not always shared by all industrial federations. CEFIC, the European Chemical
Industry Council, clearly links the continuation of its Voluntary Energy Efficiency Program (VEEP)
- that will further improve energy efficiency of the chemical industry by an additional 20% over the
years 1990-2005 - with the proviso that no new taxes are levied on energy (CEFIC, 1998).
Industry is clearly in favour of EAs because this instrument would allow flexibility to adjust
environmental investments to the medium term capital investments. Compared to tax and quantity
instruments, voluntary approaches are probably much less costly. Another advantage is the limited
administrative cost for industry as well as for government agencies. We will therefore investigate,
in two distinct cases, whether this potential cost-effectiveness of the instrument did lead to a negative
or positive impact on sectoral performance, measured by changes in bilateral export flows and in
abatement costs. We will also consider briefly the environmental effectiveness of the two EAs.
In the first case, we investigate the impact of the limitations of the use of chlorofluorocarbons
(CFCs) on the export performance of the most important CFC-using industries. The Montreal
Protocol is one of the most significant ‘global’ voluntary agreements that has ever been
implemented. The implementation of this international agreement was to a large extent depending
on voluntary initiatives. We work out a product-specific test of the Porter hypothesis that links
environmental legislation to innovations and productivity and will analyse whether countries and
sectors with a pro-active CFC-strategy and management did overcome the imposed limitations and
could establish a competitive advantage.
In the second case, we will calculate the marginal costs of pollution abatement for the industries that
could strongly reduce their total emissions under the Toxic Release Inventory (TRI) of the US
C A V A W o r k i n g P a p e r n o 1 1
J a n u a r y 1 9 9 9 5
Environmental Protection Agency (EPA). We will show that many efforts by industry were the
consequence of the TRI’s subprogram Voluntary 33/50. We also analyse the significant differences
resulting from defining industries as ‘dirty’ by making use of emission data or by using pollution
abatement and control expenditures.
In the final section, we present our conclusion. Without having the intention to generalize, we argue
that selective and monitored use of EAs can result in impressive environmental records next to
competitive advantages.
2. The Montreal Protocol and the phase-out of CFCs
2.1 The history of the Protocol
In 1974, the world-wide scientific community accepted the Rowland-Molina hypothesis that the
thin layer of stratospheric ozone could be depleted by emissions of chlorine. After the
announcement in 1985 of the existence of a ‘hole’ in the atmospheric ozone layer near the South
Pole, world-wide concerns were almost immediately followed by clear actions by the
international environmental community. The 1985 Vienna Convention for the Protection of the
Ozone Layer was followed by the 1987 Montreal Protocol on Substances that Deplete the Ozone
Layer. The Montreal Protocol imposed concrete obligations to reduce production and use of
chlorine-based ozone-depleting substances (ODSs), with a grace period for developing countries.
The most important ODSs are chlorofluorocarbons (CFCs), bromofluorocarbons (halons), methyl
chloroform, carbon tetrachloride, methyl bromide and hydrochlorofluorocarbons (HCFCs).
Since 1987, new substances have been added and phase-out commitments have been seriously
strengthened. Export and import of controlled substances to non-parties were prohibited. A
multilateral fund to support phase-outs in developing countries has been established. Ten years after
the signing, 162 countries did ratify the Montreal Protocol. Most developed countries ratified already
in 1988. Countries like Argentina, Chile, Brazil and Poland followed in 1990 and the latest
ratifications were made by Senegal in 1993 and Morocco in 1995 (UNEP, 1998).
In Europe, the first Council resolution on the issue dates from October 1988. In this resolution, we
find explicitly the term ‘voluntary agreement’: ‘The Commission invites, in co-operation with the
Member States, to initiate discussions on voluntary agreements at the Community level with all the
industries concerned, wherever feasible to substitute chlorofluorocarbons and halons in products
(Official Journal, 1988).’ The production caps in the Montreal Protocol introduced also the first
experience in Europe with the ‘grandfathering principle’ when allocating quotas for the market of

C A V A W o r k i n g P a p e r n o 1 1
J a n u a r y 1 9 9 9 6
HCFCs to nine European chemical manufacturers and importers (Lorenz-Meyer, 1998). The first
allocation in 1996 was very difficult to agree because the HCFC business is highly competitive and
past production data needed to be handled in confidentiality.
It is also clear that initiatives at the level of the Member States are of equal importance. A country
like Denmark elaborated a comprehensive national CFC-policy while other Member States were
rather passive.
All new supplies of ODSs, except HCFCs and methyl bromide, were phased out by developed
countries starting January 1, 1996. The respective phase-out deadlines for the latter are 2030 and
2010. We do not consider the grace period for developing countries as an important source of free
riding. Since CFCs were banned in developed countries, the CFC-market for free riders was limited
to developing countries.
The ratification of the Montreal Protocol ensures that all developed countries face the same
technological substitution costs at the same time and this is one of the conditions for an optimal test
of any hypothesis on the impact of environmental regulation on specific sectoral performance
(Albrecht, 1998).
2.2 The role of the chemical industry
The chemical industry has been an active stakeholder in the scientific debate on ozone and related
problems. Since 1976, the chemical industry has voluntarily reported the production and sales of
fluorocarbons through a survey compiled by an independent accountant (Grant Thornton LLP). The
purpose of the survey was to provide the scientific community with data on the atmospheric release
of CFCs and the alternative fluorocarbons (AFEAS, 1997). Another purpose of this industry
initiative was to provide the own researchers with good information.
The phasing-out of CFCs had significant consequences for the producing chemicals firms and all
the industries that use CFCs. Du Pont (US) was the worldwide leading firm in the production of
CFCs with a global market share around 20%, followed by Elf-Atochem, Allied-Signal, ICI, Solvay,
Hoechst, Ausimont, Daikin and some other firms. Du Pont played a crucial role in the
implementation of the Montreal Protocol (Haas, 1992).
Already in 1979, the firm developed an in-house state-of-the-art atmospheric computer model to
evaluate the potential problems associated with CFC emissions. This investment ensured the ability
to evaluate the most recent scientific findings and to develop a pro-active strategic policy. In 1988
alone, DuPont spent more than $30 million for process development, market research, applications
testing, and small-lot production of CFC substitutes (Haas, 1992) and shortly after the release of the
Ozone Trends Panel report in March 1988, the company announced to completely phase out the
C A V A W o r k i n g P a p e r n o 1 1
J a n u a r y 1 9 9 9 7
production of CFCs before the end of the century1. And of equal importance, DuPont would assist
its customers in converting to chemical substitutes. The most important substitute for DuPont was
HCFCs for which the company gained important patents already in the early 1980s (Howes, 1997).
This proved the long-term view of DuPont because it clearly did not opt to enjoy the higher profits
on CFCs that would follow due to the enforced scarcity of chlorofluorocarbons. Since the sales by
DuPont of CFCs totalled $600 million in 1987, The New York Times headed “Why DuPont Gave
Up $600 Million”.
By its announcement, DuPont accelerated the projected phase-out what resulted in less time for its
competitors to find the needed CFC-substitutes. It also increased the attractiveness of the substitutes
(mainly HCFCs) that DuPont could already present to its customers. DuPont created a gigantic
retrofit market on which it could sell the relatively expensive HCFCs to replace old CFCs. The
unilateral measures attributed also to the public image of the firm that was the target of several
environmental pressure group actions around that time.
The impact of DuPont as the most important market-player is also visible in the implementation of
the Montreal Protocol by the US. As a consequence of the Protocol, the US enacted mandatory
controls on CFCs. In order to stimulate substitutions, the Congress passed an excise tax on certain
ozone-depleting chemicals sold or used by the manufacturer, producer or importer (Westin,1997).
The amount of the tax is determined by multiplying a base tax amount (that is every year increased)
by an ‘ozone-depleting factor’ that reflects the potential ozone depletion of the chemical. This US
Tax on Ozone Depleting Chemicals increased prices of CFCs significantly. HCFCs are excluded
from the tax, despite their limited but clear ozone-depleting potential. Westin (1997) states that this
is ‘a questionable decision’. DuPont, as a producer of HCFCs, clearly will not regret this exception.
In this perspective, it is interesting to note that the unlimited use of HCFCs is also strongly defended
by the Air-Conditioning and Refrigeration Institute (ARI, Virginia). The members of ARI
manufacture 90% of US production of refrigerators and air conditioning equipment. The ARI
strongly opposed Congress proposals to establish an excise tax on HCFC, either on a per-pound
basis or weighted according to ozone depletion potential. And after the European Union proposed
at the end of 1997 an accelerated phase-out of HCFCs by 2015, the ARI was one of the most active
groups against this proposal. According to ARI (1998), the European proposal could disturb the
transition by equipment owners away from the more environmentally-damaging CFCs. Besides, in
1 Currently, DuPont still produces CFCs in countries like Brazil because the company was asked
by the Brazilian government to continue the production. The first multinationals that completed the phase-out of CFCs were Hoechst and Solvay. These two firms decided also in 1988 to stop production and withthe closing down of the Solvay CFC unit in Torrelavaga (Spain), Solvay completed the phase-out in May1994 (personal communication from Pierre Coërs [Solvay Communication Manager Environment &Safety], April 10, 1998). Hoechst stopped producing CFCs in April 1994, even in countries like Brazilthat were allowed to continue producing CFCs until 2010 (Hoechst, 1996).
C A V A W o r k i n g P a p e r n o 1 1
J a n u a r y 1 9 9 9 8
1996 the US consumption of HCFC was at 82% of the allowable cap amount.
Of course, the impact of industry on politics is not limited to the United States. In France, the
Industry Ministry defended strongly the benefits of Elf-Atochem that tried to delay any substitution.
Unlike DuPont, Atochem did not have substitutes that could be marketed in a very short period. The
French environmental minister even denied in 1987 any definitive link between CFCs and ozone
depletion (Haas, 1992). Similar practices are noticed in the Soviet Union, Japan and the United
Kingdom.
2.3 On the environmental effectiveness
In 1997, the Montreal Protocol is called by the World Bank (1997) ‘the major bright spot in global
environmental efforts’. At the latest Ozone Day (September 16, 1998), the chairman of the Global
Environmental Facility, Mohamed T. El-Ashry, opened his speech by confirming that the
concentration of some of the ozone-related chemicals in the atmosphere started to decline (GEF,
1998). Considering the long presence of CFCs in the atmosphere (CFC-11 : 75 year / CFC-12 : 111
year / CFC-114 : 185 year / CFC-115 : 380 year /...(TNO, 1989)), this decline in concentrations
came earlier than in the most optimistic simulations. These trends are confirmed by data from
AFEAS (1998), the organization that collects and calculates the annual ODP weighted CFC
production. There are however still some problems. Actual progress in developed countries is being
undermined by excessive CFC production of lower quality in Russia and China and black market
smuggling. Not every country has an effective enforcement program to limit these practices. The
World Bank, in collaboration with production factories and the Russian government, has developed
a plan to eliminate all production of CFCs in Russia by the year 2000.
Some authors have a different opinion on the environmental effectiveness of the Montreal Protocol.
Murdoch and Sandler (1997) analyse emission data for 61 countries and conclude that there is only
a very limited environmental impact of the Montreal Protocol. An opposite conclusion is reached
by Swanson and Mason (1998). They conclude that in absence of the Protocol, production and
emissions of CFCs would have increased by a factor of five over the next fifty years.
2.4 Export performance of CFC-using industries
The substitution of CFCs provided an opportunity for firms that invested first in CFC-substituting
R&D and were able to influence the political priorities and framework that resulted from the
Montreal Protocol. Ozone policies can provide as such a competitive advantage for the early
adapters. One could see this as an illustration of the Porter hypothesis ; effective regulation can
C A V A W o r k i n g P a p e r n o 1 1
J a n u a r y 1 9 9 9 9
trigger innovation and productivity (Porter and van der Linde, 1995) .
But assuming this pro-active strategy paid well for DuPont, did CFC-using industries also benefit
from US policies? Otherwise, if only one industry or firm did benefit and other industries had to pay
an ‘expensive lunch’, this is not at all a confirmation of the Porter hypothesis.
CFCs are mainly used for the production of refrigerators, air conditioning equipment, fire
extinguishers, foams, aerosols and solvents (used to clean many types of electronic components and
processes). Manufacturers of refrigerating equipment will face the highest substitution costs,
followed by the manufacturers of (mainly mobile) air conditioning equipment. In the US, these two
sectors form a seventeen billion dollar industry which employs more than 136000 men and women
(ARI, 1997).
Since this substitution will take place in all the industrial countries, we will investigate whether the
active national ozone-policies of some countries did improve the competitivity of their main CFC-
using manufacturers. If this should be the case, we have a product-specific confirmation of the Porter
hypothesis.
According to Haas (1992), the US position during the Montreal negotiations was supported by
Canada, Denmark, Finland, the Netherlands, New Zealand, Norway and Sweden. Most countries
of the EC-12, led by Britain and France, favoured only a production cap to minimize the costs to
their CFC producers and users. In the analysis, we therefore take the US and Denmark as the
countries that favoured a pro-active strategy. Like the US, Denmark has also a tax on CFC and halon
with a border tax adjustment, a statutory order gradually banning the use of ODSs for specific
purposes and a development program to support non-ODS technology (Danish EPA, 1995).
We selected France, Germany and Japan as the countries that were more hesitating about the phase-
out of CFCs. For France, we referred already to Elf-Atochem, while the Japanese feared especially
the ban of CFC-solvents in their computer industry. The five selected countries all have a
manufacturing industry with similar technological capabilities and an excellent reputation. They
represent a significant part of world trade in the related sectors.
Since the Protocol went into force on 1 January 1988, we will analyse changes in bilateral trade
flows since 1989 of these five countries to their major trade partners. These trade partners differ of
course for each country but it is important to note that they contain countries like Canada, Sweden,
Norway, Finland, the Netherlands and New Zealand that also favoured an early phase-out policy.
The other developed countries (Italy, Switzerland, Belgium, Spain, ...) are also included in the
analysis next to a number of developing countries like Morocco and Algeria (trade partners of
France), Mexico, Brazil, Ecuador and Venezuela (trade partners of the US).
We analysed trade flows for the three most important sectors that make use of CFCs : household type
refrigerators and food freezers (SITC-code 7752), refrigerators and refrigerating equipment, except
households (SITC 7414), and air conditioning machines, self-contained and parts (SITC 7415). The
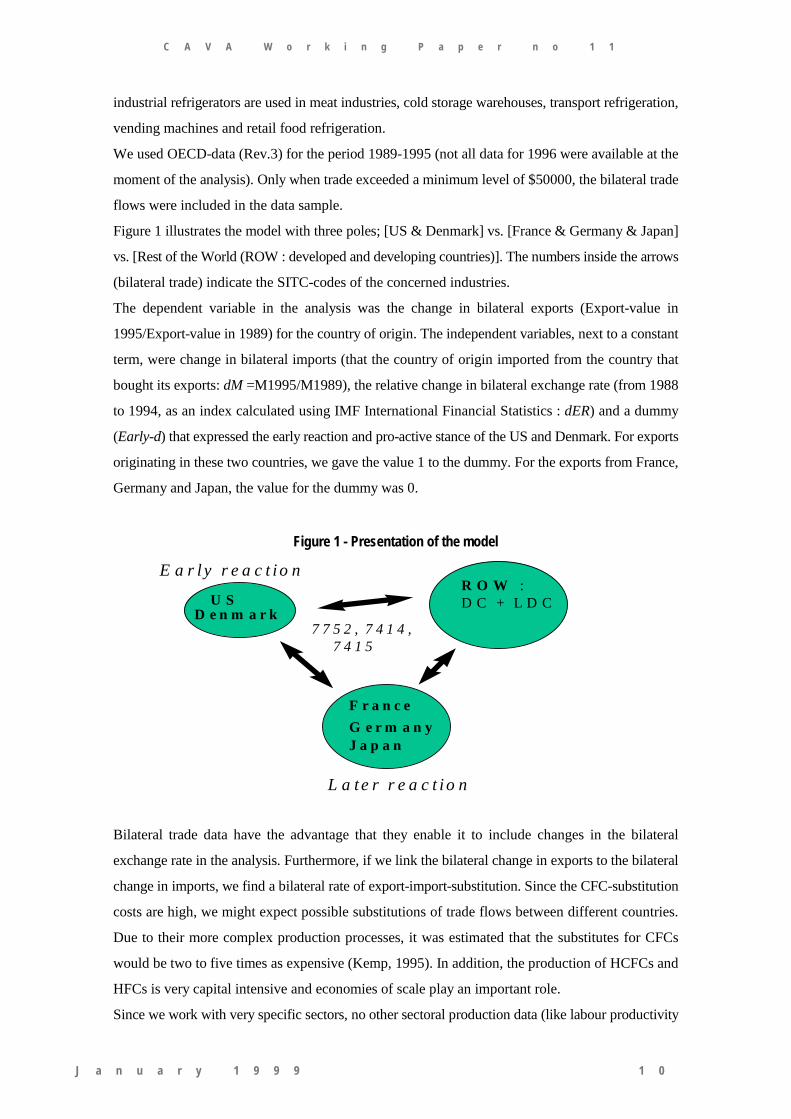
C A V A W o r k i n g P a p e r n o 1 1
J a n u a r y 1 9 9 9 1 0
industrial refrigerators are used in meat industries, cold storage warehouses, transport refrigeration,
vending machines and retail food refrigeration.
We used OECD-data (Rev.3) for the period 1989-1995 (not all data for 1996 were available at the
moment of the analysis). Only when trade exceeded a minimum level of $50000, the bilateral trade
flows were included in the data sample.
Figure 1 illustrates the model with three poles; [US & Denmark] vs. [France & Germany & Japan]
vs. [Rest of the World (ROW : developed and developing countries)]. The numbers inside the arrows
(bilateral trade) indicate the SITC-codes of the concerned industries.
The dependent variable in the analysis was the change in bilateral exports (Export-value in
1995/Export-value in 1989) for the country of origin. The independent variables, next to a constant
term, were change in bilateral imports (that the country of origin imported from the country that
bought its exports: dM =M1995/M1989), the relative change in bilateral exchange rate (from 1988
to 1994, as an index calculated using IMF International Financial Statistics : dER) and a dummy
(Early-d) that expressed the early reaction and pro-active stance of the US and Denmark. For exports
originating in these two countries, we gave the value 1 to the dummy. For the exports from France,
Germany and Japan, the value for the dummy was 0.
Figure 1 - Presentation of the model
Bilateral trade data have the advantage that they enable it to include changes in the bilateral
exchange rate in the analysis. Furthermore, if we link the bilateral change in exports to the bilateral
change in imports, we find a bilateral rate of export-import-substitution. Since the CFC-substitution
costs are high, we might expect possible substitutions of trade flows between different countries.
Due to their more complex production processes, it was estimated that the substitutes for CFCs
would be two to five times as expensive (Kemp, 1995). In addition, the production of HCFCs and
HFCs is very capital intensive and economies of scale play an important role.
Since we work with very specific sectors, no other sectoral production data (like labour productivity
U SD e n m a r k
F r a n c eG e r m a n yJ a p a n
R O W :D C + L D C
7 7 5 2 , 7 4 1 4 , 7 4 1 5
E a r l y r e a c t i o n
L a t e r r e a c t i o n
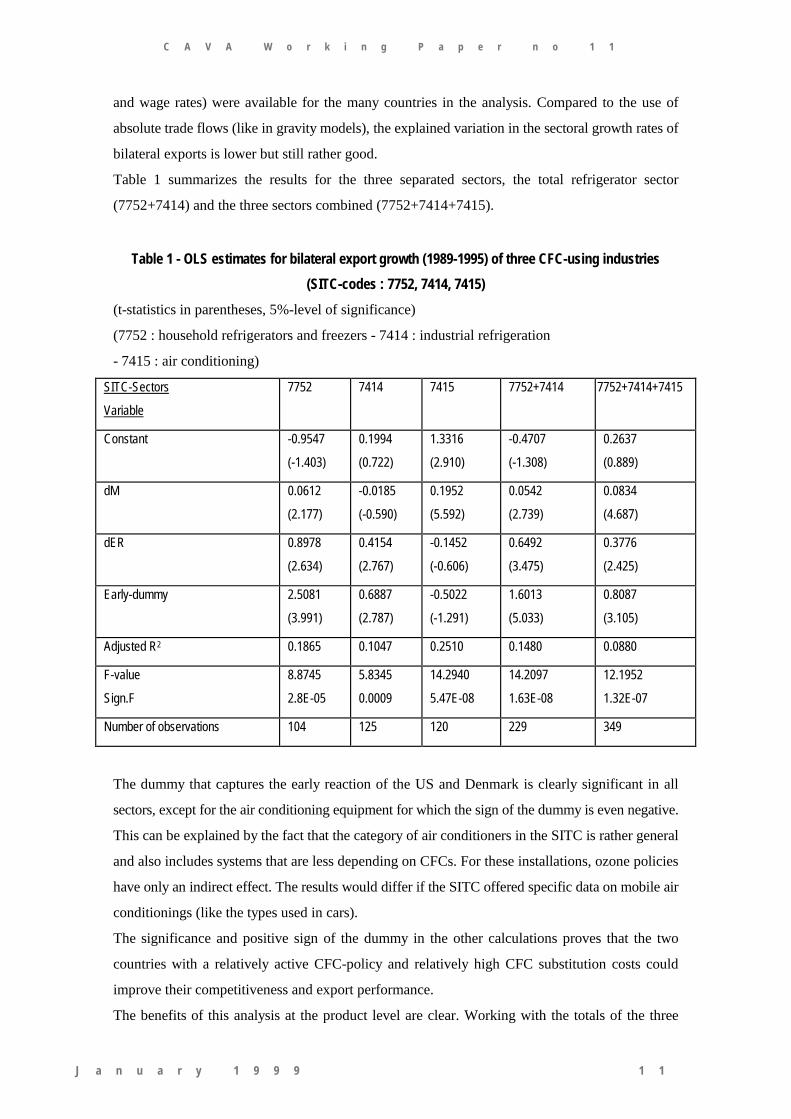
C A V A W o r k i n g P a p e r n o 1 1
J a n u a r y 1 9 9 9 1 1
and wage rates) were available for the many countries in the analysis. Compared to the use of
absolute trade flows (like in gravity models), the explained variation in the sectoral growth rates of
bilateral exports is lower but still rather good.
Table 1 summarizes the results for the three separated sectors, the total refrigerator sector
(7752+7414) and the three sectors combined (7752+7414+7415).
Table 1 - OLS estimates for bilateral export growth (1989-1995) of three CFC-using industries(SITC-codes : 7752, 7414, 7415)
(t-statistics in parentheses, 5%-level of significance)
(7752 : household refrigerators and freezers - 7414 : industrial refrigeration
- 7415 : air conditioning)
SITC-Sectors
Variable
7752 7414 7415 7752+7414 7752+7414+7415
Constant -0.9547
(-1.403)
0.1994
(0.722)
1.3316
(2.910)
-0.4707
(-1.308)
0.2637
(0.889)
dM 0.0612
(2.177)
-0.0185
(-0.590)
0.1952
(5.592)
0.0542
(2.739)
0.0834
(4.687)
dER 0.8978
(2.634)
0.4154
(2.767)
-0.1452
(-0.606)
0.6492
(3.475)
0.3776
(2.425)
Early-dummy 2.5081
(3.991)
0.6887
(2.787)
-0.5022
(-1.291)
1.6013
(5.033)
0.8087
(3.105)
Adjusted R2 0.1865 0.1047 0.2510 0.1480 0.0880
F-value
Sign.F
8.8745
2.8E-05
5.8345
0.0009
14.2940
5.47E-08
14.2097
1.63E-08
12.1952
1.32E-07
Number of observations 104 125 120 229 349
The dummy that captures the early reaction of the US and Denmark is clearly significant in all
sectors, except for the air conditioning equipment for which the sign of the dummy is even negative.
This can be explained by the fact that the category of air conditioners in the SITC is rather general
and also includes systems that are less depending on CFCs. For these installations, ozone policies
have only an indirect effect. The results would differ if the SITC offered specific data on mobile air
conditionings (like the types used in cars).
The significance and positive sign of the dummy in the other calculations proves that the two
countries with a relatively active CFC-policy and relatively high CFC substitution costs could
improve their competitiveness and export performance.
The benefits of this analysis at the product level are clear. Working with the totals of the three
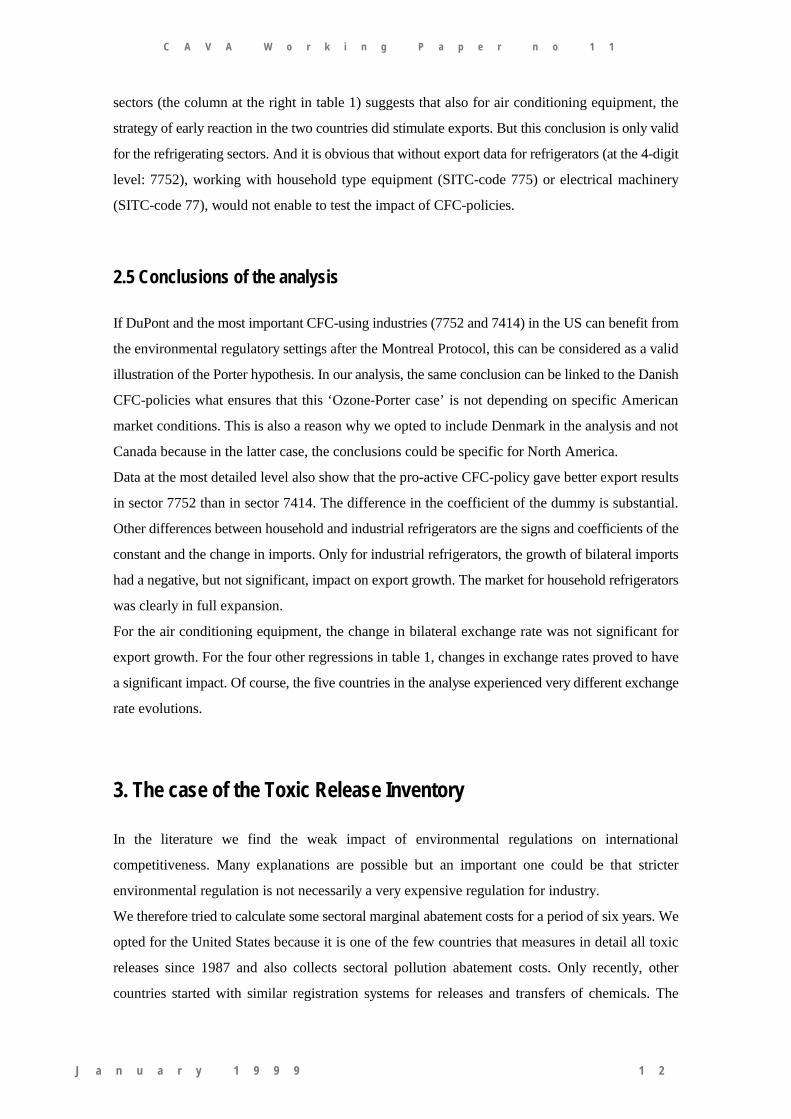
C A V A W o r k i n g P a p e r n o 1 1
J a n u a r y 1 9 9 9 1 2
sectors (the column at the right in table 1) suggests that also for air conditioning equipment, the
strategy of early reaction in the two countries did stimulate exports. But this conclusion is only valid
for the refrigerating sectors. And it is obvious that without export data for refrigerators (at the 4-digit
level: 7752), working with household type equipment (SITC-code 775) or electrical machinery
(SITC-code 77), would not enable to test the impact of CFC-policies.
2.5 Conclusions of the analysis
If DuPont and the most important CFC-using industries (7752 and 7414) in the US can benefit from
the environmental regulatory settings after the Montreal Protocol, this can be considered as a valid
illustration of the Porter hypothesis. In our analysis, the same conclusion can be linked to the Danish
CFC-policies what ensures that this ‘Ozone-Porter case’ is not depending on specific American
market conditions. This is also a reason why we opted to include Denmark in the analysis and not
Canada because in the latter case, the conclusions could be specific for North America.
Data at the most detailed level also show that the pro-active CFC-policy gave better export results
in sector 7752 than in sector 7414. The difference in the coefficient of the dummy is substantial.
Other differences between household and industrial refrigerators are the signs and coefficients of the
constant and the change in imports. Only for industrial refrigerators, the growth of bilateral imports
had a negative, but not significant, impact on export growth. The market for household refrigerators
was clearly in full expansion.
For the air conditioning equipment, the change in bilateral exchange rate was not significant for
export growth. For the four other regressions in table 1, changes in exchange rates proved to have
a significant impact. Of course, the five countries in the analyse experienced very different exchange
rate evolutions.
3. The case of the Toxic Release Inventory
In the literature we find the weak impact of environmental regulations on international
competitiveness. Many explanations are possible but an important one could be that stricter
environmental regulation is not necessarily a very expensive regulation for industry.
We therefore tried to calculate some sectoral marginal abatement costs for a period of six years. We
opted for the United States because it is one of the few countries that measures in detail all toxic
releases since 1987 and also collects sectoral pollution abatement costs. Only recently, other
countries started with similar registration systems for releases and transfers of chemicals. The
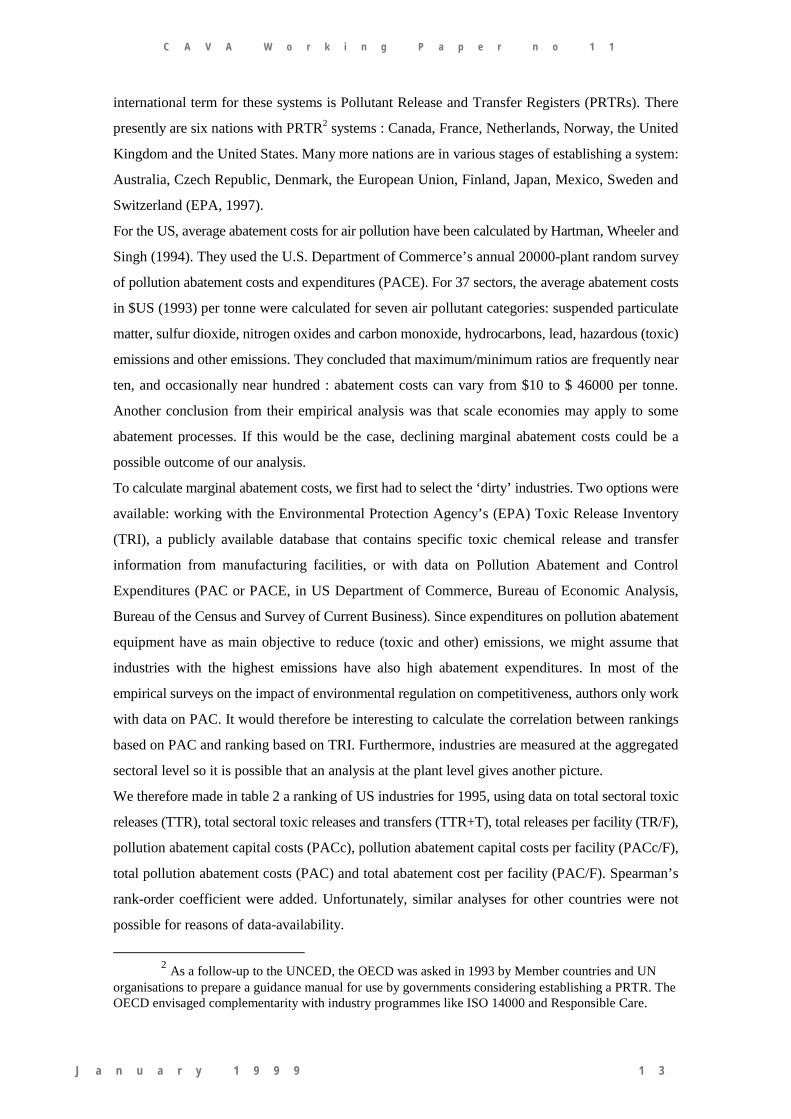
C A V A W o r k i n g P a p e r n o 1 1
J a n u a r y 1 9 9 9 1 3
international term for these systems is Pollutant Release and Transfer Registers (PRTRs). There
presently are six nations with PRTR2 systems : Canada, France, Netherlands, Norway, the United
Kingdom and the United States. Many more nations are in various stages of establishing a system:
Australia, Czech Republic, Denmark, the European Union, Finland, Japan, Mexico, Sweden and
Switzerland (EPA, 1997).
For the US, average abatement costs for air pollution have been calculated by Hartman, Wheeler and
Singh (1994). They used the U.S. Department of Commerce’s annual 20000-plant random survey
of pollution abatement costs and expenditures (PACE). For 37 sectors, the average abatement costs
in $US (1993) per tonne were calculated for seven air pollutant categories: suspended particulate
matter, sulfur dioxide, nitrogen oxides and carbon monoxide, hydrocarbons, lead, hazardous (toxic)
emissions and other emissions. They concluded that maximum/minimum ratios are frequently near
ten, and occasionally near hundred : abatement costs can vary from $10 to $ 46000 per tonne.
Another conclusion from their empirical analysis was that scale economies may apply to some
abatement processes. If this would be the case, declining marginal abatement costs could be a
possible outcome of our analysis.
To calculate marginal abatement costs, we first had to select the ‘dirty’ industries. Two options were
available: working with the Environmental Protection Agency’s (EPA) Toxic Release Inventory
(TRI), a publicly available database that contains specific toxic chemical release and transfer
information from manufacturing facilities, or with data on Pollution Abatement and Control
Expenditures (PAC or PACE, in US Department of Commerce, Bureau of Economic Analysis,
Bureau of the Census and Survey of Current Business). Since expenditures on pollution abatement
equipment have as main objective to reduce (toxic and other) emissions, we might assume that
industries with the highest emissions have also high abatement expenditures. In most of the
empirical surveys on the impact of environmental regulation on competitiveness, authors only work
with data on PAC. It would therefore be interesting to calculate the correlation between rankings
based on PAC and ranking based on TRI. Furthermore, industries are measured at the aggregated
sectoral level so it is possible that an analysis at the plant level gives another picture.
We therefore made in table 2 a ranking of US industries for 1995, using data on total sectoral toxic
releases (TTR), total sectoral toxic releases and transfers (TTR+T), total releases per facility (TR/F),
pollution abatement capital costs (PACc), pollution abatement capital costs per facility (PACc/F),
total pollution abatement costs (PAC) and total abatement cost per facility (PAC/F). Spearman’s
rank-order coefficient were added. Unfortunately, similar analyses for other countries were not
possible for reasons of data-availability.
2 As a follow-up to the UNCED, the OECD was asked in 1993 by Member countries and UN
organisations to prepare a guidance manual for use by governments considering establishing a PRTR. TheOECD envisaged complementarity with industry programmes like ISO 14000 and Responsible Care.
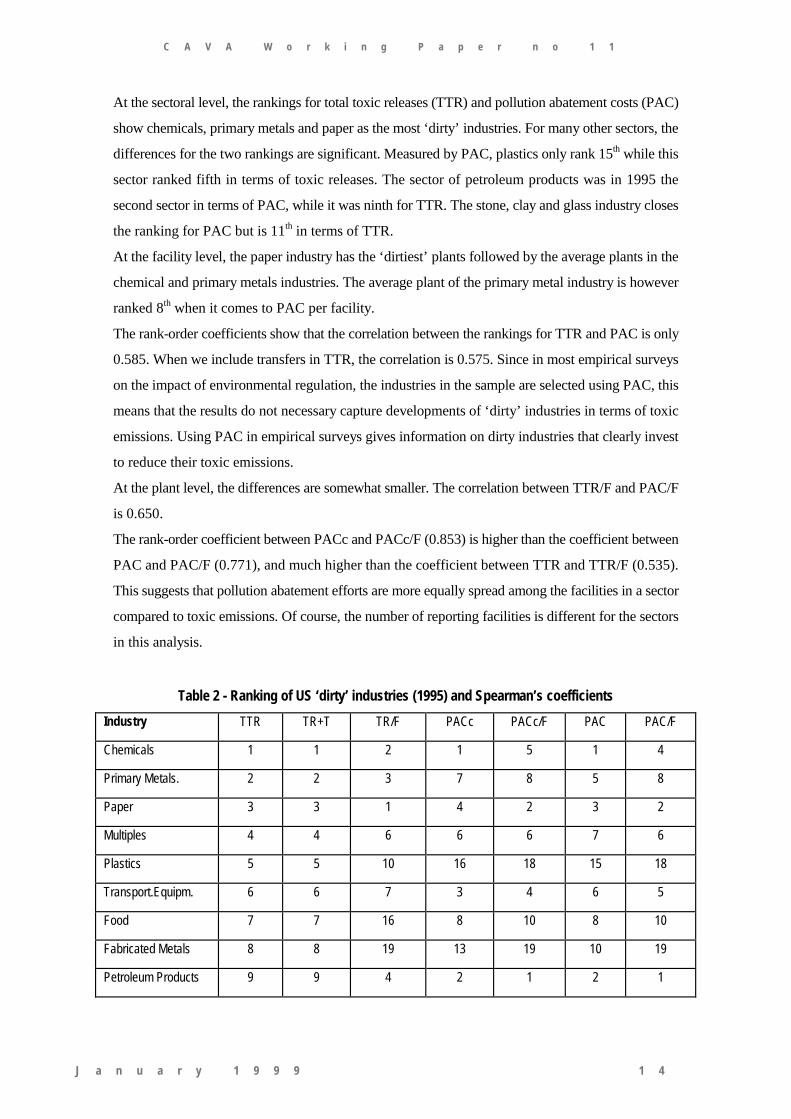
C A V A W o r k i n g P a p e r n o 1 1
J a n u a r y 1 9 9 9 1 4
At the sectoral level, the rankings for total toxic releases (TTR) and pollution abatement costs (PAC)
show chemicals, primary metals and paper as the most ‘dirty’ industries. For many other sectors, the
differences for the two rankings are significant. Measured by PAC, plastics only rank 15th while this
sector ranked fifth in terms of toxic releases. The sector of petroleum products was in 1995 the
second sector in terms of PAC, while it was ninth for TTR. The stone, clay and glass industry closes
the ranking for PAC but is 11th in terms of TTR.
At the facility level, the paper industry has the ‘dirtiest’ plants followed by the average plants in the
chemical and primary metals industries. The average plant of the primary metal industry is however
ranked 8th when it comes to PAC per facility.
The rank-order coefficients show that the correlation between the rankings for TTR and PAC is only
0.585. When we include transfers in TTR, the correlation is 0.575. Since in most empirical surveys
on the impact of environmental regulation, the industries in the sample are selected using PAC, this
means that the results do not necessary capture developments of ‘dirty’ industries in terms of toxic
emissions. Using PAC in empirical surveys gives information on dirty industries that clearly invest
to reduce their toxic emissions.
At the plant level, the differences are somewhat smaller. The correlation between TTR/F and PAC/F
is 0.650.
The rank-order coefficient between PACc and PACc/F (0.853) is higher than the coefficient between
PAC and PAC/F (0.771), and much higher than the coefficient between TTR and TTR/F (0.535).
This suggests that pollution abatement efforts are more equally spread among the facilities in a sector
compared to toxic emissions. Of course, the number of reporting facilities is different for the sectors
in this analysis.
Table 2 - Ranking of US ‘dirty’ industries (1995) and Spearman’s coefficientsIndustry TTR TR+T TR/F PACc PACc/F PAC PAC/F
Chemicals 1 1 2 1 5 1 4
Primary Metals. 2 2 3 7 8 5 8
Paper 3 3 1 4 2 3 2
Multiples 4 4 6 6 6 7 6
Plastics 5 5 10 16 18 15 18
Transport.Equipm. 6 6 7 3 4 6 5
Food 7 7 16 8 10 8 10
Fabricated Metals 8 8 19 13 19 10 19
Petroleum Products 9 9 4 2 1 2 1
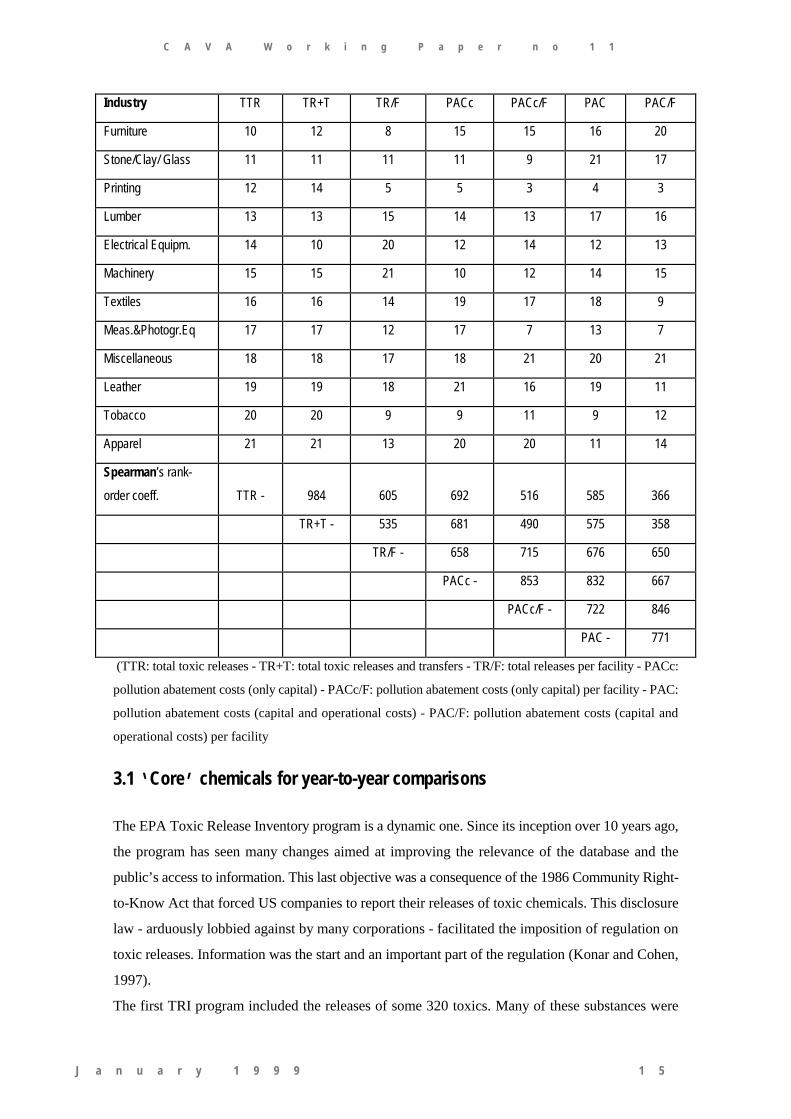
C A V A W o r k i n g P a p e r n o 1 1
J a n u a r y 1 9 9 9 1 5
Industry TTR TR+T TR/F PACc PACc/F PAC PAC/F
Furniture 10 12 8 15 15 16 20
Stone/Clay/ Glass 11 11 11 11 9 21 17
Printing 12 14 5 5 3 4 3
Lumber 13 13 15 14 13 17 16
Electrical Equipm. 14 10 20 12 14 12 13
Machinery 15 15 21 10 12 14 15
Textiles 16 16 14 19 17 18 9
Meas.&Photogr.Eq 17 17 12 17 7 13 7
Miscellaneous 18 18 17 18 21 20 21
Leather 19 19 18 21 16 19 11
Tobacco 20 20 9 9 11 9 12
Apparel 21 21 13 20 20 11 14
Spearman’s rank-
order coeff. TTR - 984 605 692 516 585 366
TR+T - 535 681 490 575 358
TR/F - 658 715 676 650
PACc - 853 832 667
PACc/F - 722 846
PAC - 771
(TTR: total toxic releases - TR+T: total toxic releases and transfers - TR/F: total releases per facility - PACc:
pollution abatement costs (only capital) - PACc/F: pollution abatement costs (only capital) per facility - PAC:
pollution abatement costs (capital and operational costs) - PAC/F: pollution abatement costs (capital and
operational costs) per facility
3.1 ‘Core’ chemicals for year-to-year comparisons
The EPA Toxic Release Inventory program is a dynamic one. Since its inception over 10 years ago,
the program has seen many changes aimed at improving the relevance of the database and the
public’s access to information. This last objective was a consequence of the 1986 Community Right-
to-Know Act that forced US companies to report their releases of toxic chemicals. This disclosure
law - arduously lobbied against by many corporations - facilitated the imposition of regulation on
toxic releases. Information was the start and an important part of the regulation (Konar and Cohen,
1997).
The first TRI program included the releases of some 320 toxics. Many of these substances were
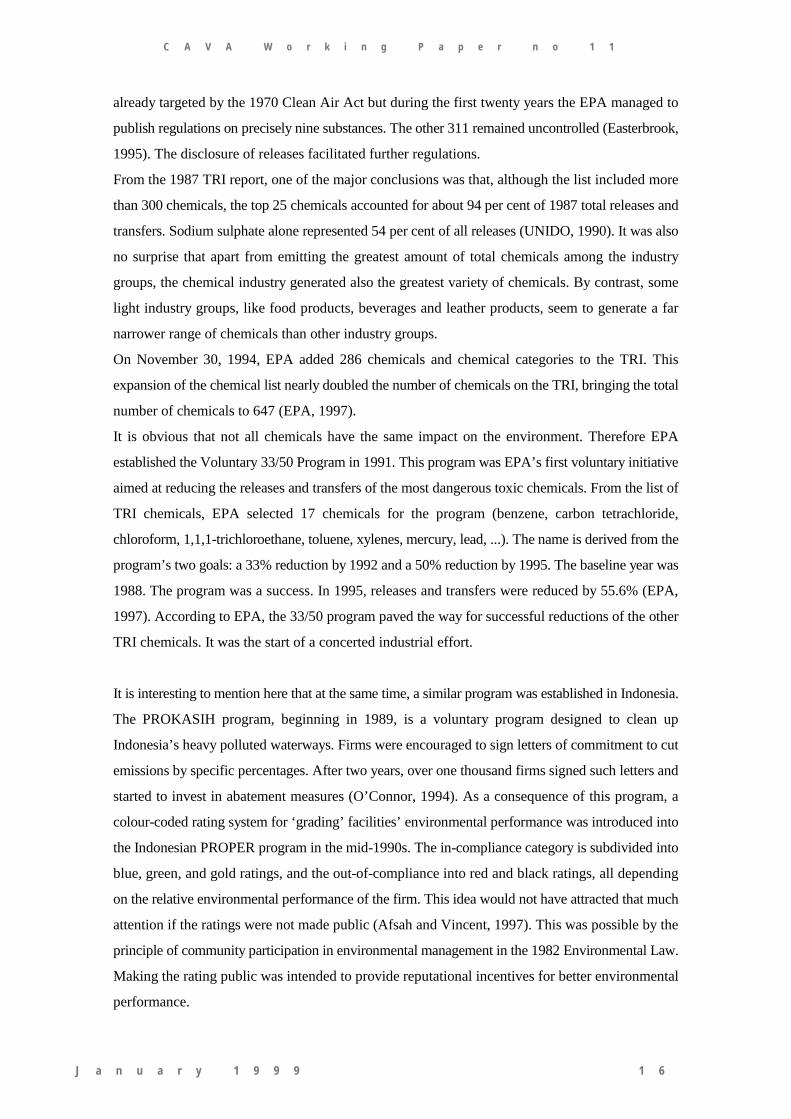
C A V A W o r k i n g P a p e r n o 1 1
J a n u a r y 1 9 9 9 1 6
already targeted by the 1970 Clean Air Act but during the first twenty years the EPA managed to
publish regulations on precisely nine substances. The other 311 remained uncontrolled (Easterbrook,
1995). The disclosure of releases facilitated further regulations.
From the 1987 TRI report, one of the major conclusions was that, although the list included more
than 300 chemicals, the top 25 chemicals accounted for about 94 per cent of 1987 total releases and
transfers. Sodium sulphate alone represented 54 per cent of all releases (UNIDO, 1990). It was also
no surprise that apart from emitting the greatest amount of total chemicals among the industry
groups, the chemical industry generated also the greatest variety of chemicals. By contrast, some
light industry groups, like food products, beverages and leather products, seem to generate a far
narrower range of chemicals than other industry groups.
On November 30, 1994, EPA added 286 chemicals and chemical categories to the TRI. This
expansion of the chemical list nearly doubled the number of chemicals on the TRI, bringing the total
number of chemicals to 647 (EPA, 1997).
It is obvious that not all chemicals have the same impact on the environment. Therefore EPA
established the Voluntary 33/50 Program in 1991. This program was EPA’s first voluntary initiative
aimed at reducing the releases and transfers of the most dangerous toxic chemicals. From the list of
TRI chemicals, EPA selected 17 chemicals for the program (benzene, carbon tetrachloride,
chloroform, 1,1,1-trichloroethane, toluene, xylenes, mercury, lead, ...). The name is derived from the
program’s two goals: a 33% reduction by 1992 and a 50% reduction by 1995. The baseline year was
1988. The program was a success. In 1995, releases and transfers were reduced by 55.6% (EPA,
1997). According to EPA, the 33/50 program paved the way for successful reductions of the other
TRI chemicals. It was the start of a concerted industrial effort.
It is interesting to mention here that at the same time, a similar program was established in Indonesia.
The PROKASIH program, beginning in 1989, is a voluntary program designed to clean up
Indonesia’s heavy polluted waterways. Firms were encouraged to sign letters of commitment to cut
emissions by specific percentages. After two years, over one thousand firms signed such letters and
started to invest in abatement measures (O’Connor, 1994). As a consequence of this program, a
colour-coded rating system for ‘grading’ facilities’ environmental performance was introduced into
the Indonesian PROPER program in the mid-1990s. The in-compliance category is subdivided into
blue, green, and gold ratings, and the out-of-compliance into red and black ratings, all depending
on the relative environmental performance of the firm. This idea would not have attracted that much
attention if the ratings were not made public (Afsah and Vincent, 1997). This was possible by the
principle of community participation in environmental management in the 1982 Environmental Law.
Making the rating public was intended to provide reputational incentives for better environmental
performance.
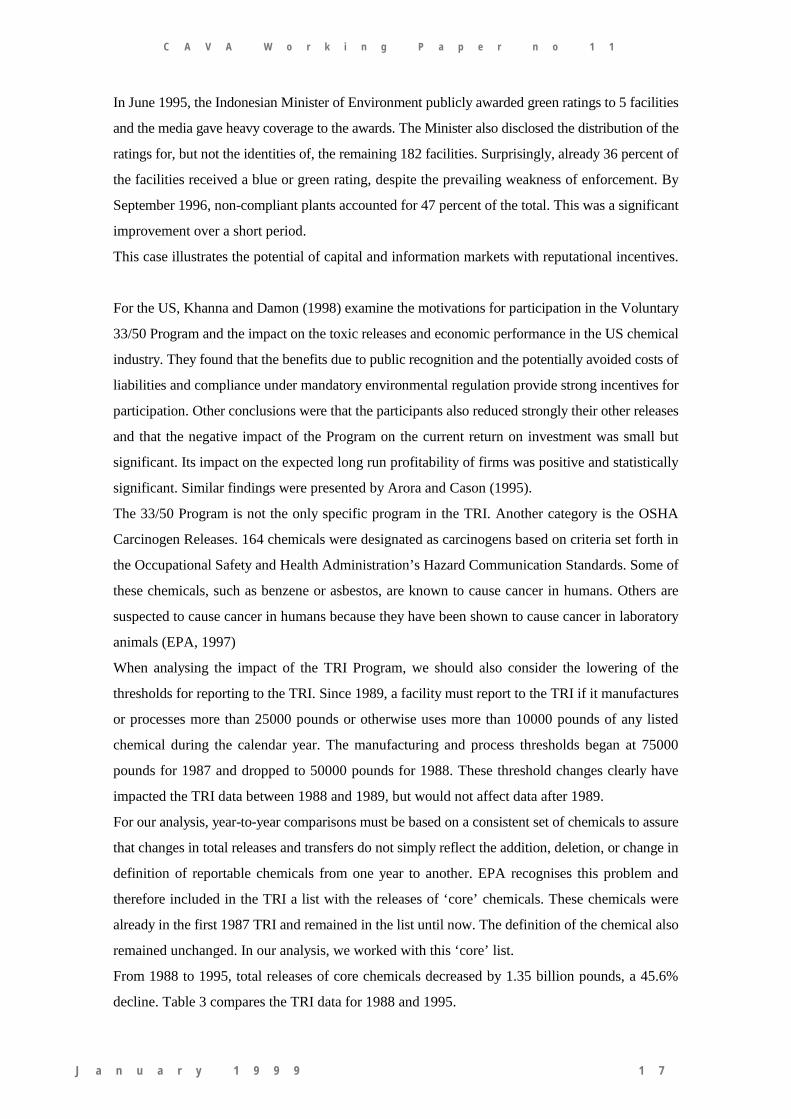
C A V A W o r k i n g P a p e r n o 1 1
J a n u a r y 1 9 9 9 1 7
In June 1995, the Indonesian Minister of Environment publicly awarded green ratings to 5 facilities
and the media gave heavy coverage to the awards. The Minister also disclosed the distribution of the
ratings for, but not the identities of, the remaining 182 facilities. Surprisingly, already 36 percent of
the facilities received a blue or green rating, despite the prevailing weakness of enforcement. By
September 1996, non-compliant plants accounted for 47 percent of the total. This was a significant
improvement over a short period.
This case illustrates the potential of capital and information markets with reputational incentives.
For the US, Khanna and Damon (1998) examine the motivations for participation in the Voluntary
33/50 Program and the impact on the toxic releases and economic performance in the US chemical
industry. They found that the benefits due to public recognition and the potentially avoided costs of
liabilities and compliance under mandatory environmental regulation provide strong incentives for
participation. Other conclusions were that the participants also reduced strongly their other releases
and that the negative impact of the Program on the current return on investment was small but
significant. Its impact on the expected long run profitability of firms was positive and statistically
significant. Similar findings were presented by Arora and Cason (1995).
The 33/50 Program is not the only specific program in the TRI. Another category is the OSHA
Carcinogen Releases. 164 chemicals were designated as carcinogens based on criteria set forth in
the Occupational Safety and Health Administration’s Hazard Communication Standards. Some of
these chemicals, such as benzene or asbestos, are known to cause cancer in humans. Others are
suspected to cause cancer in humans because they have been shown to cause cancer in laboratory
animals (EPA, 1997)
When analysing the impact of the TRI Program, we should also consider the lowering of the
thresholds for reporting to the TRI. Since 1989, a facility must report to the TRI if it manufactures
or processes more than 25000 pounds or otherwise uses more than 10000 pounds of any listed
chemical during the calendar year. The manufacturing and process thresholds began at 75000
pounds for 1987 and dropped to 50000 pounds for 1988. These threshold changes clearly have
impacted the TRI data between 1988 and 1989, but would not affect data after 1989.
For our analysis, year-to-year comparisons must be based on a consistent set of chemicals to assure
that changes in total releases and transfers do not simply reflect the addition, deletion, or change in
definition of reportable chemicals from one year to another. EPA recognises this problem and
therefore included in the TRI a list with the releases of ‘core’ chemicals. These chemicals were
already in the first 1987 TRI and remained in the list until now. The definition of the chemical also
remained unchanged. In our analysis, we worked with this ‘core’ list.
From 1988 to 1995, total releases of core chemicals decreased by 1.35 billion pounds, a 45.6%
decline. Table 3 compares the TRI data for 1988 and 1995.
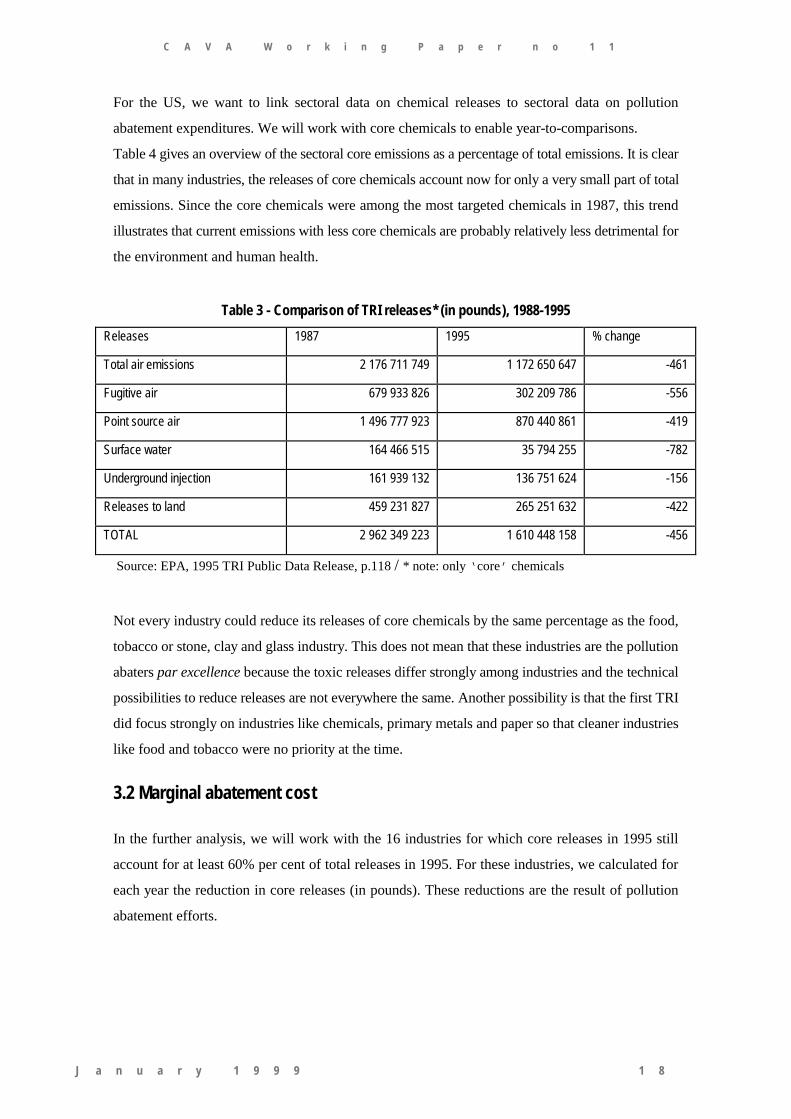
C A V A W o r k i n g P a p e r n o 1 1
J a n u a r y 1 9 9 9 1 8
For the US, we want to link sectoral data on chemical releases to sectoral data on pollution
abatement expenditures. We will work with core chemicals to enable year-to-comparisons.
Table 4 gives an overview of the sectoral core emissions as a percentage of total emissions. It is clear
that in many industries, the releases of core chemicals account now for only a very small part of total
emissions. Since the core chemicals were among the most targeted chemicals in 1987, this trend
illustrates that current emissions with less core chemicals are probably relatively less detrimental for
the environment and human health.
Table 3 - Comparison of TRI releases* (in pounds), 1988-1995Releases 1987 1995 % change
Total air emissions 2 176 711 749 1 172 650 647 -461
Fugitive air 679 933 826 302 209 786 -556
Point source air 1 496 777 923 870 440 861 -419
Surface water 164 466 515 35 794 255 -782
Underground injection 161 939 132 136 751 624 -156
Releases to land 459 231 827 265 251 632 -422
TOTAL 2 962 349 223 1 610 448 158 -456
Source: EPA, 1995 TRI Public Data Release, p.118 / * note: only ‘core’ chemicals
Not every industry could reduce its releases of core chemicals by the same percentage as the food,
tobacco or stone, clay and glass industry. This does not mean that these industries are the pollution
abaters par excellence because the toxic releases differ strongly among industries and the technical
possibilities to reduce releases are not everywhere the same. Another possibility is that the first TRI
did focus strongly on industries like chemicals, primary metals and paper so that cleaner industries
like food and tobacco were no priority at the time.
3.2 Marginal abatement cost
In the further analysis, we will work with the 16 industries for which core releases in 1995 still
account for at least 60% per cent of total releases in 1995. For these industries, we calculated for
each year the reduction in core releases (in pounds). These reductions are the result of pollution
abatement efforts.
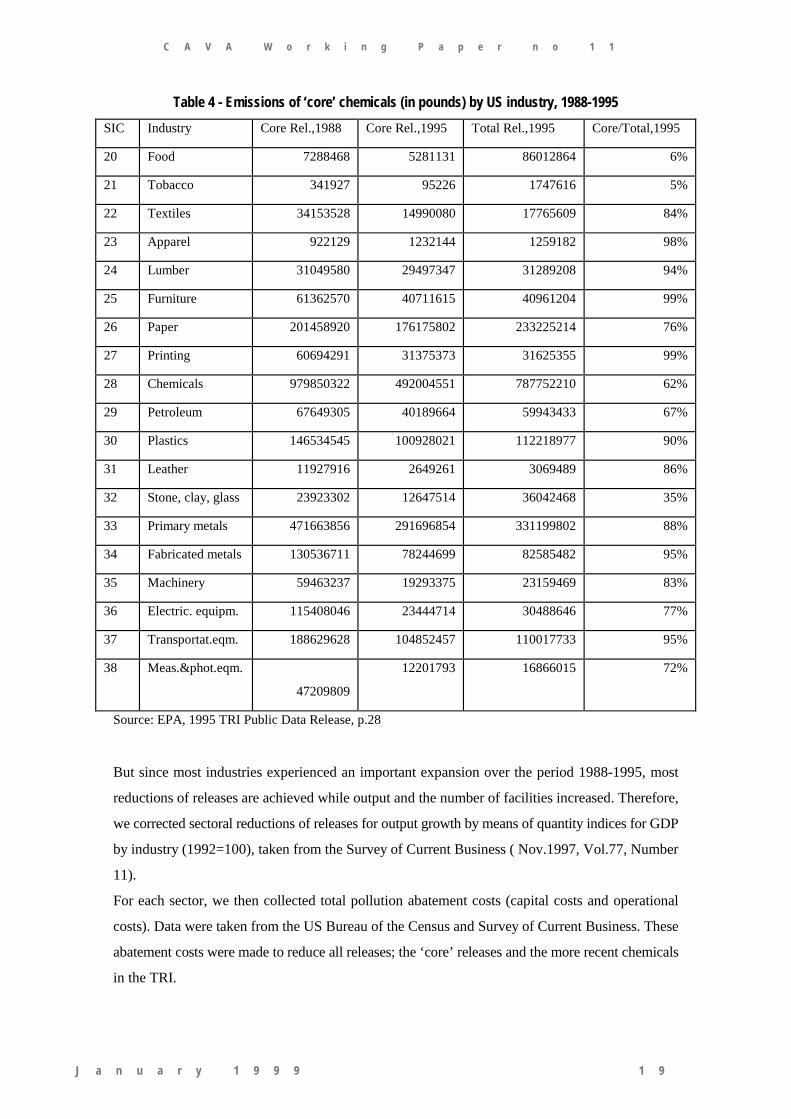
C A V A W o r k i n g P a p e r n o 1 1
J a n u a r y 1 9 9 9 1 9
Table 4 - Emissions of ‘core’ chemicals (in pounds) by US industry, 1988-1995SIC Industry Core Rel.,1988 Core Rel.,1995 Total Rel.,1995 Core/Total,1995
20 Food 7288468 5281131 86012864 6%
21 Tobacco 341927 95226 1747616 5%
22 Textiles 34153528 14990080 17765609 84%
23 Apparel 922129 1232144 1259182 98%
24 Lumber 31049580 29497347 31289208 94%
25 Furniture 61362570 40711615 40961204 99%
26 Paper 201458920 176175802 233225214 76%
27 Printing 60694291 31375373 31625355 99%
28 Chemicals 979850322 492004551 787752210 62%
29 Petroleum 67649305 40189664 59943433 67%
30 Plastics 146534545 100928021 112218977 90%
31 Leather 11927916 2649261 3069489 86%
32 Stone, clay, glass 23923302 12647514 36042468 35%
33 Primary metals 471663856 291696854 331199802 88%
34 Fabricated metals 130536711 78244699 82585482 95%
35 Machinery 59463237 19293375 23159469 83%
36 Electric. equipm. 115408046 23444714 30488646 77%
37 Transportat.eqm. 188629628 104852457 110017733 95%
38 Meas.&phot.eqm.
47209809
12201793 16866015 72%
Source: EPA, 1995 TRI Public Data Release, p.28
But since most industries experienced an important expansion over the period 1988-1995, most
reductions of releases are achieved while output and the number of facilities increased. Therefore,
we corrected sectoral reductions of releases for output growth by means of quantity indices for GDP
by industry (1992=100), taken from the Survey of Current Business ( Nov.1997, Vol.77, Number
11).
For each sector, we then collected total pollution abatement costs (capital costs and operational
costs). Data were taken from the US Bureau of the Census and Survey of Current Business. These
abatement costs were made to reduce all releases; the ‘core’ releases and the more recent chemicals
in the TRI.
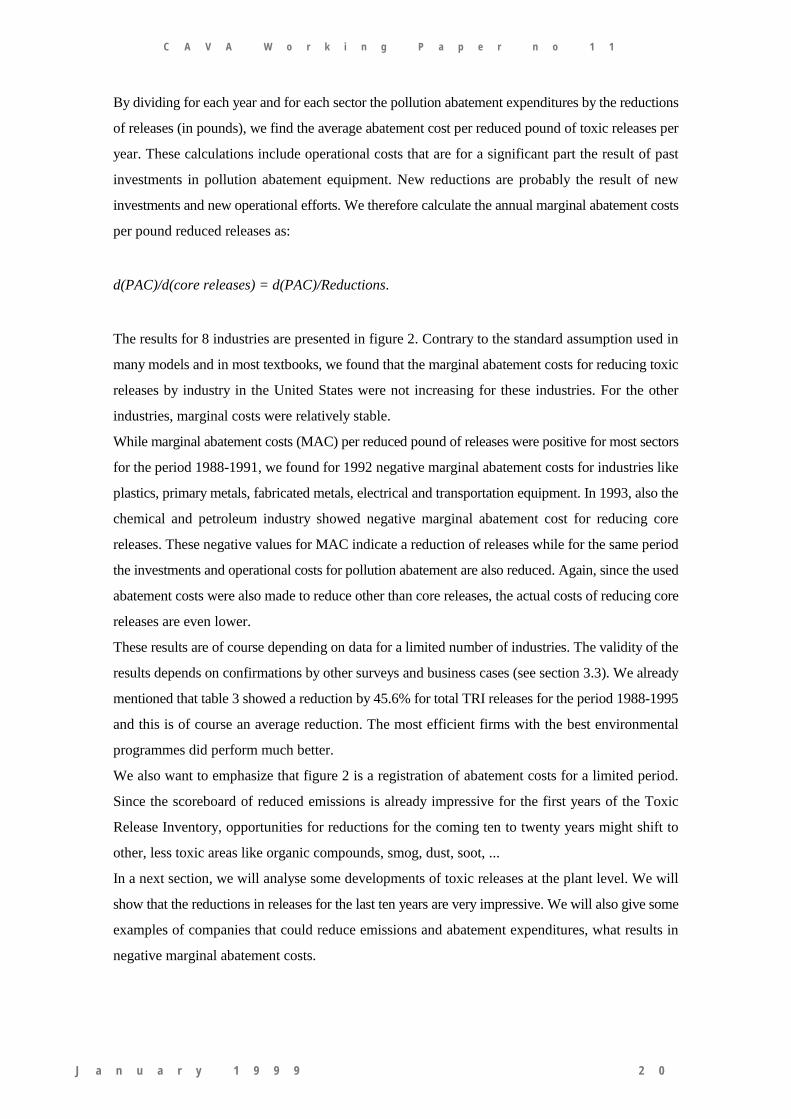
C A V A W o r k i n g P a p e r n o 1 1
J a n u a r y 1 9 9 9 2 0
By dividing for each year and for each sector the pollution abatement expenditures by the reductions
of releases (in pounds), we find the average abatement cost per reduced pound of toxic releases per
year. These calculations include operational costs that are for a significant part the result of past
investments in pollution abatement equipment. New reductions are probably the result of new
investments and new operational efforts. We therefore calculate the annual marginal abatement costs
per pound reduced releases as:
d(PAC)/d(core releases) = d(PAC)/Reductions.
The results for 8 industries are presented in figure 2. Contrary to the standard assumption used in
many models and in most textbooks, we found that the marginal abatement costs for reducing toxic
releases by industry in the United States were not increasing for these industries. For the other
industries, marginal costs were relatively stable.
While marginal abatement costs (MAC) per reduced pound of releases were positive for most sectors
for the period 1988-1991, we found for 1992 negative marginal abatement costs for industries like
plastics, primary metals, fabricated metals, electrical and transportation equipment. In 1993, also the
chemical and petroleum industry showed negative marginal abatement cost for reducing core
releases. These negative values for MAC indicate a reduction of releases while for the same period
the investments and operational costs for pollution abatement are also reduced. Again, since the used
abatement costs were also made to reduce other than core releases, the actual costs of reducing core
releases are even lower.
These results are of course depending on data for a limited number of industries. The validity of the
results depends on confirmations by other surveys and business cases (see section 3.3). We already
mentioned that table 3 showed a reduction by 45.6% for total TRI releases for the period 1988-1995
and this is of course an average reduction. The most efficient firms with the best environmental
programmes did perform much better.
We also want to emphasize that figure 2 is a registration of abatement costs for a limited period.
Since the scoreboard of reduced emissions is already impressive for the first years of the Toxic
Release Inventory, opportunities for reductions for the coming ten to twenty years might shift to
other, less toxic areas like organic compounds, smog, dust, soot, ...
In a next section, we will analyse some developments of toxic releases at the plant level. We will
show that the reductions in releases for the last ten years are very impressive. We will also give some
examples of companies that could reduce emissions and abatement expenditures, what results in
negative marginal abatement costs.
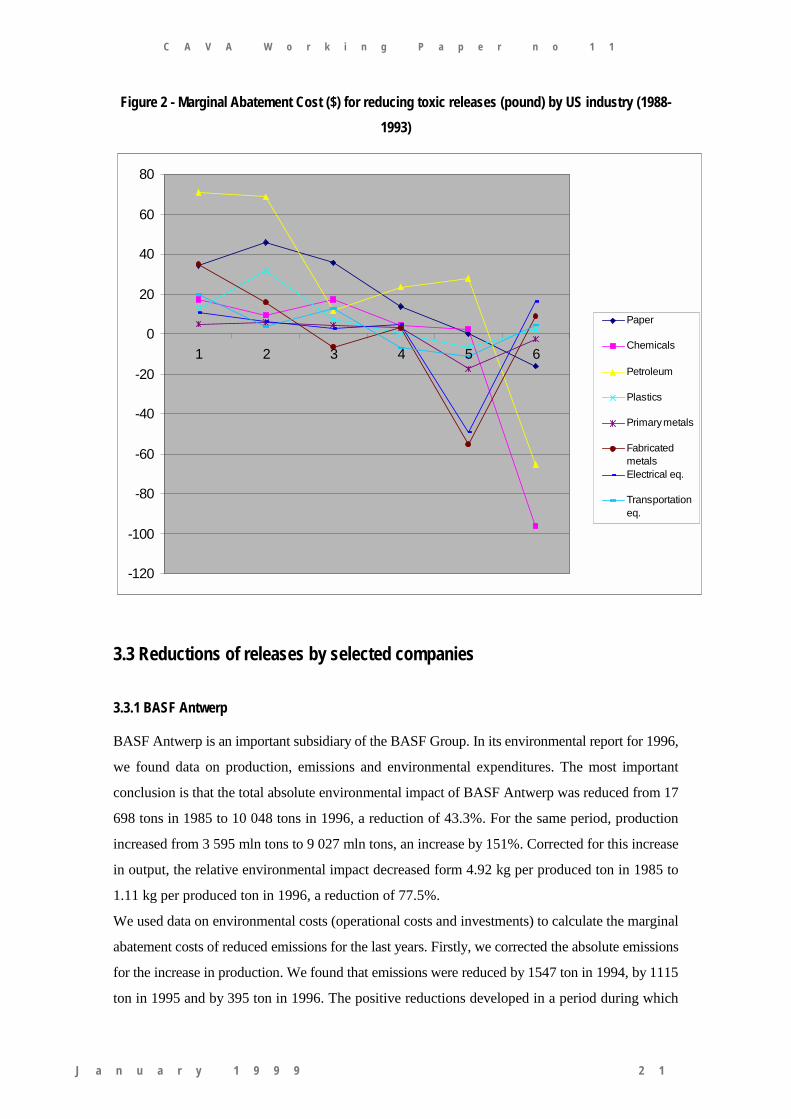
C A V A W o r k i n g P a p e r n o 1 1
J a n u a r y 1 9 9 9 2 1
Figure 2 - Marginal Abatement Cost ($) for reducing toxic releases (pound) by US industry (1988-1993)
3.3 Reductions of releases by selected companies
3.3.1 BASF Antwerp
BASF Antwerp is an important subsidiary of the BASF Group. In its environmental report for 1996,
we found data on production, emissions and environmental expenditures. The most important
conclusion is that the total absolute environmental impact of BASF Antwerp was reduced from 17
698 tons in 1985 to 10 048 tons in 1996, a reduction of 43.3%. For the same period, production
increased from 3 595 mln tons to 9 027 mln tons, an increase by 151%. Corrected for this increase
in output, the relative environmental impact decreased form 4.92 kg per produced ton in 1985 to
1.11 kg per produced ton in 1996, a reduction of 77.5%.
We used data on environmental costs (operational costs and investments) to calculate the marginal
abatement costs of reduced emissions for the last years. Firstly, we corrected the absolute emissions
for the increase in production. We found that emissions were reduced by 1547 ton in 1994, by 1115
ton in 1995 and by 395 ton in 1996. The positive reductions developed in a period during which
-120
-100
-80
-60
-40
-20
0
20
40
60
80
1 2 3 4 5 6
Paper
Chemicals
Petroleum
Plastics
Primary metals
FabricatedmetalsElectrical eq.
Transportationeq.
C A V A W o r k i n g P a p e r n o 1 1
J a n u a r y 1 9 9 9 2 2
BASF Antwerp first reduced its environmental costs in 1994 - compared to 1993 - and but then
clearly increased its environmental expenditures.
As a result of this reduction in environmental costs in 1994, we found for that year a negative
marginal abatement cost of -617 970 BEF per reduced ton emissions. For 1995 and 1996, we found
respectively 771 000 BEF and 1 572 000 BEF per reduced ton emissions.
Also of interest, the environmental charges and taxed paid by BASF Antwerp increased from 133.6
mln BEF in 1993 to 204.3 mln BEF in 1996, an increase by 52.9% while emissions where strongly
reduced (BASF, 1997a).
For the BASF Group world-wide, we found some other illustrations of excellent environmental
performances:
- Chattanooga, USA: 70% reduction of styrene in offgas wastewater ;
- Ludwigshaven, Germany: 90% reduction of atmospheric emissions of nitrous oxide;
- Schwarzheide, Germany: 50% reduction of the nitrogen load in wastewater ;
- Seal Sands, UK: 95% reduction of VOC and CO emissions.
The operational costs for the BASF Group’s environmental protection facilities amounted to DM
1 621 million in 1996. In the same period, DM 233 million was spent on capital expenditures for
environmental protection. Research into eco-friendly products and processes again required a high
level of financing. In the last 5 years, BASF has invested world-wide DM 1.85 billion in
environmental protection facilities (BASF, 1997b).
3.3.2 Solvay
Solvay’s unified and verified emissions reporting system SERF (Solvay Environmental Release File)
covers the emissions of the 94 Solvay plants across 17 countries. In the last consolidation in 1997,
figures from 1988 to 1996 were given. While production increased by 17%, the weighted index of
air emissions was reduced by 42%. For volatile organic compounds (VOCs), the reduction was 54%,
and emissions of heavy metals and sulfur dioxide were both reduced world-wide by 37%.
For the same period, the weighted index for water emissions has fallen by 77%. The reduction of
‘priority substances (excl. heavy metals)’ was even 91%.
Concerning waste, the quantity of waste classified as hazardous disposed of away from the
production site has dropped by 46% since 1988. The chlorinated organic residue internal ’full-
recovery’ progamme was successfully implemented with a recovery rate of 100% (Solvay, 1997).
C A V A W o r k i n g P a p e r n o 1 1
J a n u a r y 1 9 9 9 2 3
3.3.3 ICI
In its 1997 Safety, Health and Environment Performance Report, ICI states that the company remains
close to the goal of total compliance with local regulations and emissions consents, wherever ICI
operates. For air emissions, the compliance rate in 1997 was 99.5%, for water emissions it was
99.1%.
ICI developed an own scientific method to measure optimally the environmental impact of its
activities. Even for the short period from 1995 to 1997, the improvements on specific fields are
impressive:
- acidity to air and water, down 42% ;
- hazardous air emissions, down 37% ;
- aquatic oxygen demand, down 31% ;
- aquatic ecotoxicity, down 28% ;
- ozone depletion, down 31% ;
- photochemical ozone creation, down 23% (ICI, 1997).
These reductions prove that even in the late 1990s, firms can still further reduce already low levels
of emissions.
4. Conclusions
We presented two cases of successful realization of environmental objectives. Industry took up its
responsibility in voluntarily phasing out the production and use of CFCs and in reducing toxic
releases in the US. There are however clear differences. In the case of CFCs, the complementarity
of pro-active national strategies for the CFC-using industries proved to result in comparative
advantages for the US and Denmark. It is understandable that these countries favour a strict
implication of the Montreal Protocol.
In the second case, our analysis showed that many industries could reduce emissions at a low cost.
But probably this was not the motive to invest in pollution reduction. Pollution data are available for
everybody in the US3 (and to a limited extent also in Indonesia) and this is in sharp contrast to many
European countries. This availability of data makes it possible to identify the biggest polluters and
suggest the link between pollution and health problems in the surroundings of the facility. We can
assume that pollution reduction was an option to avoid costs of liabilities in the future. The
implementation of a system like TRI could therefore result in different reduction patterns in other
countries.
3 On the EPA Internetsite (<http://www.epa.gov>), it is possible to make a search for the release
of each TRI-chemical for each company that has to report to the Environmental Protection Agency.

C A V A W o r k i n g P a p e r n o 1 1
J a n u a r y 1 9 9 9 2 4
In the two cases, there was a clear threat that could contribute to the success of the agreements with
industry. The Montreal Protocol did foresee trade sanctions in case of non-compliance and in the
TRI-case, future liabilities could turn out to be more expensive than investments in pollution control.
We should also mention that the targets in both EAs were not determined by industry but by
governments at international conventions or by government agencies.
C A V A W o r k i n g P a p e r n o 1 1
J a n u a r y 1 9 9 9 2 5
References
Afsah, S. and Vincent, J. R., 1997, Putting pressure on polluters: Indonesia’s PROPER Program.
Case study for the 1997 Asia Environmental Economics Policy Seminar, Harvard Institute for
International Development, mimeo
Albrecht, J., 1998. Environmental regulation, comparative advantage and the Porter hypothesis, Nota
di Lavoro ENV 59.98 (September), Fondazione Eni Enrico Mattei, Milan
AFEAS (Alternative Fluorocarbons Environmental Acceptability Study), 1997, <http://afeas.org>
Arora, S. and Cason, T.N., 1995. An experiment in voluntary regulation: participation in EPA’s
33/50 Program, Journal of Environmental Economics and Management 28,
pp.271-286
ARI, 1997. Acceleration of the HCFC phaseout dates and/or reduction of the HCFC consumption
(odp) cap, ARI Issues, 7 May 1997 (updated), <http://www.ari.org>
BASF, 1997a, Leefmilieurapport 1996 BASF Antwerpen NV
BASF, 1997b, Umweltbericht 1996 BASF-Gruppe
CEFIC, 1998. Long-term agreements on energy efficiency: the preferred policy response to climate
change concerns, News Release (16/06/98)
Danish Environmental Protection Agency, 1995. Going towards natural refrigerants (Environmental
Project No.301, Copenhagen)
Easterbrook, G., 1995. A moment on the earth (Penguin, New York)
Environmental Protection Agency, 1995-1997, Toxics Release Inventory Public Data Release,
<http://www.epa.gov>
European Commission, 1996. Communication from the Commission to the Council and the
European Parliament on Environmental Agreements, COM(96)561
C A V A W o r k i n g P a p e r n o 1 1
J a n u a r y 1 9 9 9 2 6
GEF (Global Environmental Facility), 1998. Celebrating Ozone Day. A message from Mohamed
T.El-Ashry, <http://www.gefweb.org/GEFCEO/ozone.htm>
Haas, Peter M., 1992. Banning chlorofluorocarbons : epistemic community efforts to protect
stratospheric ozone, International Organization 46(1), pp.187-224
Hartman, R. S., Wheeler, D. and Singh, M., 1994, The cost of air pollution abatement. World Bank
Policy Research Working Paper # 1398
Hoechst, 1996. Das FCKW-Entsorgungskonzept der Hoechst AG und die erforderlichen
Masnahmen zum konsequenten Ausstieg aus den FCKW
Howes, R., Skea, J. And Whelan, B., 1997, Clean and competitive? Motivating environmental
performance in industry (Earthscan Publications, London)
ICI, 1997. Safety, health and environmental performance
Kemp, R., 1995, Environmental policy and technical change. A comparison of the technological
impact of policy instruments (Universitaire Pers, Maastricht)
Khanna, M. and Damon, L., 1998. EPA’s Voluntary 33/50 Program : impact on toxic releases and
economic performance of firms, University of Illinois at Urbana-Champaign, mimeo
Konar, S. and Cohen, M.A., 1997. Information as regulation : the effect of Community Right to
Know laws on toxic emissions, Journal of Environmental Economics and Management 32, pp.109-
124
Lorenz-Meyer, Stefan, 1998. Flexibility in European climate policy - how it could work. Discussion
paper prepared for ENVECO 8, European Commission, mimeo
Murdoch, T. and Sandler, 1997. The voluntary provision of a pure public good: the case of reduced
CFC emissions and the Montreal Protocol, Journal of Public Economics 63, pp.331-349
O’Connor, D., 1994. Managing the environment with rapid industrialization: lessons from the East
Asian experience (OECD, Paris)
C A V A W o r k i n g P a p e r n o 1 1
J a n u a r y 1 9 9 9 2 7
Official Journal of the European Community, 1988. ‘Council resolution of 14 October 1988 for the
limitation of use of chlorofluorocarbons and halons’, OJ C285, 9/11/1988, pp.1-2
Porter, M.E. and van der Linde, C., 1995. Toward a new conception of the environment-
competitiveness relationship, Journal of Economic Perspectives 6(4), pp.119-132
Solvay, 1997. Safety, health and environment, <http://www.solvay.com>
Swanson, T. and Mason, R., 1998. The impact of the Montreal Protocol: an empirical analysis of
aggregate and distributive impacts, CSERGE, University College London, mimeo
TNO. 1989. Ozonlaag. De beschermer bedreigd (TNO, Den Haag).
United Nations Environmental Programme (The Ozone Secretariat), 1998. Status of
ratification/accession/acceptance/approval of the agreements on the protection of the stratospheric
ozone layer (as of February 19, 1998, New York), <http://www.unep.ch/ozone/ratif.htm>
United Nations Industrial Development Organization, 1990. Industry and development. Global
report 1990/1991 (UNIDO, Vienna)
Westin, Richard A., 1997. Environmental tax initiatives ans multilateral trade agreements: dangerous
collisions (Kluwer, The Hague)
The World Bank Group, 1997. Word Bank tells UN Earth Summit of new actions to safeguard
environment, News Release No.97/1405/5

C A V A W o r k i n g P a p e r n o 1 1
J a n u a r y 1 9 9 9 2 8
C A V A P a r t n e r s
CERNA, Ecole Nationale Supérieure desMines de Paris
Co-ordinator: François LévêqueProject manager: Martina Chidiak60, bld Saint-Michel 75006 Paris FranceTel.: + 33 1 40 51 92 28Fax: + 33 1 44 07 10 46email: [email protected],[email protected]
University College Dublin (UCD)
Frank ConveryRichview Clonskeagh Dublin 14 Ireland
Tel.: +353 1 269 7988Fax: +353 1 283 7009
email: [email protected]
CEEM - University of Gent
Marc De ClercqHoveniersberg 24 9000 Gent BelgiumTel.: +32 9 264 35 02Fax: +32 9 264 35 99email: [email protected]
AKF
Anders LarsenNyropsgade 37 1602 Copenhagen V
DenmarkTel.: +45 33 11 03 00Fax: +45 33 15 28 75
email: [email protected] Eni Enrico Mattei (FEEM)
Carlo CarraroCorso Magenta 63 20123 Milano ItalyTel.: +39 41 2711453Fax: +39 41 2711461email: [email protected]
Öko-Institut
Ralf JuelichBunsenstr. 14 64293 Darmstadt Germany
Tel.: +49 6151 8191 0Fax: +49 6151 8191 33email: [email protected]
Onderzoeksproject HL/DD/004
Internationale Economische Orde : Opportuniteiten enBeperkingen voor een Belgische Milieufiscaliteit(olv. Prof.Dr.M.De Clercq)
Tekst bijDeel A. Analyse van de internationale economische orde ; laat deze eenkleine, open economie voldoende beleidsautonomie om een gerichte milieu-fiscaliteit uit te bouwen?
Johan AlbrechtUniversiteit GentFaculteit Economische en Toegepaste Economische WetenschappenHoveniersberg 49000 Gent09/264 35 1009/264 34 [email protected]
Green Policies -from ecotaxes to extended producer responsibility :an institutional search for policy autonomy starting from the EU andWTO frameworks-------------------------------------------------------------------------------------
Content
Part I EUPart II WTO
3
Introduction
Regarding national policy autonomy, the increasing number of regional and international agreements isexpected to influence national policies. This impact can range from trade policy to other importantaspects of economic and industrial policy. For the Member States of the European Union - still the mostsuccesful example of international political integration - , one could therefore expect a framework thatclearly distincts national powers from supranational powers. This expectation might be one of theconsequences of the recent subsidiarity debate and the discussions on the many possible meanings ofthis concept. Another factor is the ever widening range of domains and competences that the EuropeanUnion is working on (Eur-Op News, 1997). For the future, new European policies are expected.At this moment, it still remains an open question whether the European Union can establish an industrial,economic, fiscal, environmental, monetary, transport and social policy - see the renewed Article 2 - orthat these competences will remain a strictly national occupation? In our overview of the European Union(EU), we will focus on environmental and commercial policy.
National policy autonomy is much more than the result of a division of powers. Autonomy is an evidencelike national sovereignty. Next to specific limitations following international agreements (like the MontrealProtocol or CITES), all national states will always have the unlimited power to develop a specific policythat targets very national ambitions. But when the introduction and the application of these nationalpolicies can have consequences for other countries that are not in line with the principles underwrittenin supranational agreements (like GATT/WTO, EU, NAFTA, CITES, Montreal Protocol,...), thesenational policies can be challenged for reasons of de jure or de facto discrimination. As a consequence,violation of international agreements - that have been signed and ratified voluntarily by the country - can result in clear limitations of policy autonomy.
We will work on the interactions between environmental, economic and trade policy. Environmentalpolicy should have the aim to conserve and protect natural endowments and has many different aspectsand possible applications, depending on specific situations and needs. Trade policies are introduced tostimulate free and fair trade to improve economic efficiency of transactions and wealth-creatingprocesses. In many cases, the practice of trade policy is directed at removing existing and possible tradebarriers, mostly linked to specific national regulation.
We will not discuss the validity of trade theories that feed most trade agreements, but we will focus on
4
the possible trade impact of environmental policies. The word 'impact' could sound negative ordetrimental in terms of environmental hindrance for wealth-creating trade flows. But the establishmentof free or common markets for goods and the protection of the environment do not necessary contradicteach other per se.Trade is an instrument for the optimal allocation of production resources. The protection of theenvironment, particularly in terms of the concept of ‘sustainable development’, aims at the maintenanceof an ecological equilibrium in the interest of a balanced long-term growth in terms of consumption andproduction. Environmental policy works at the preservation of natural production factors for futuregenerations and can be a necessary condition for future allocation patterns. As such, the two policies cansimilar objectives..
As already suggested, an environmental policy can introduce measures that could discriminate foreignexporters. Examples of such measures are the designs of green taxes, take-back obligations for allproducers, specific prohibitions for certain products (some of them based on the conditions ofproduction), recycling content obligations, green labels, green subsidies for domestic firms, voluntaryagreements between industries and other involved parties, technical standards and testing proceduresthat are more difficult for foreign exporters,...Depending on the environmental objectives and the specifications of these instruments, the environmentalprotection can create a trade barrier and this practice could then eventually be challenged by foreigncompetitors. As a result, national environmental policies could be stopped or strongly modified.
These scenarios with conficting trade and green interests are problematic because they might slow downsome of the urgently needed environmental protection programmes. Therefore, policy makers shouldwork out green programme specifications that make complaints and litigations from possiblydiscriminated parties ‘hardly impossible’.A transparent environmental policy with clearly formulated ambitions and instruments, with a consultationround for trade partners and related international organisations (EU, WTO), with clear provisions forharmed trade partners (especially from less developed regions) and of course with de jure and de factoneutrality, has a very good change of becoming internationally accepted and even supported bycomplementary initiatives in other countries.
National policies should as such not be undercut by international agreements but should foresee possibleinteractions and consequences and beware possible litigations. Therefore we will study the internationaleconomic order that should shape these national policy frameworks. We will try to make a globalanalysis that is more than the aggregate of some specific cases because market conditions andenvironmental needs change over time, as well as their perception by citizens and public authorities.

5
Globalisation is a process ; so are environmental concerns and priorities and the efforts to find anappropriate equilibrium between market needs and the environment.
Why using market-based instruments in green policies?
Like recent medical practice illustrates more and more, for very complex diseases the best therapies usecocktails of medicines instead of just one antidotum. Environmental problems are very complex anddiverse and cannot be treated by a standardised approach. Each approach has to be very specific andtake care with local conditions. Considerations on costs are also shaping green policies. Inflexiblecommand-and-control regulations are considered as more costly compared to flexible market-basedinstruments (Hanley, 1997). This latter category of instruments will therefore gain importance especiallysince designing new policies seems to be closely linked with considerations on internationalcompetitiveness (WTO, 1997).Environmental policies in the late 1990s therefore use a multitude of instruments - environmentalregulation next to market-based instruments - that are very flexible and case-depending.The use of economic instruments is however still a recent trend in environmental policy making. Theyhave the clear advantage that they make it possible to confront producers and consumers with the(external) consequences of their production and consumption behaviour. Correct price signals canmotivate producers to alter their production processes and adapt to new priorities. Entrepeneurialdynamism and goodwill are crucial in the struggle against environmental deterioration because for most(but not all) problems there is at the moment a technological solution that just needs some improvementsto be applicable, affordable and diffused on a large scale.
With a government that limits its policy to prohibitions (traditional command-and-control approach),without economic instruments that involve the dynamics of the business community, many possiblesolutions may not be elaborated. Similarly, the forced imposition of one specific technology - even whenit is the best available at the moment - will reduce the attractivity of further R&D in this area. Fixedregulation also risks significant pressure group influence that is motivated by static analyses mainly in thefield of international competitiveness and the doubts on the instigating role played by smaller countries.
We should also keep in mind that environmental problems stem from failures within economies andeconomic transactions. If transactions on markets for goods, services and factors create the problem,market-based measures can be a part of the solution.In the coming sections, we investigate the installation of a programme of green taxes. Since theseprogrammes make use of many related instruments like labels or take-back obligations, they can provide
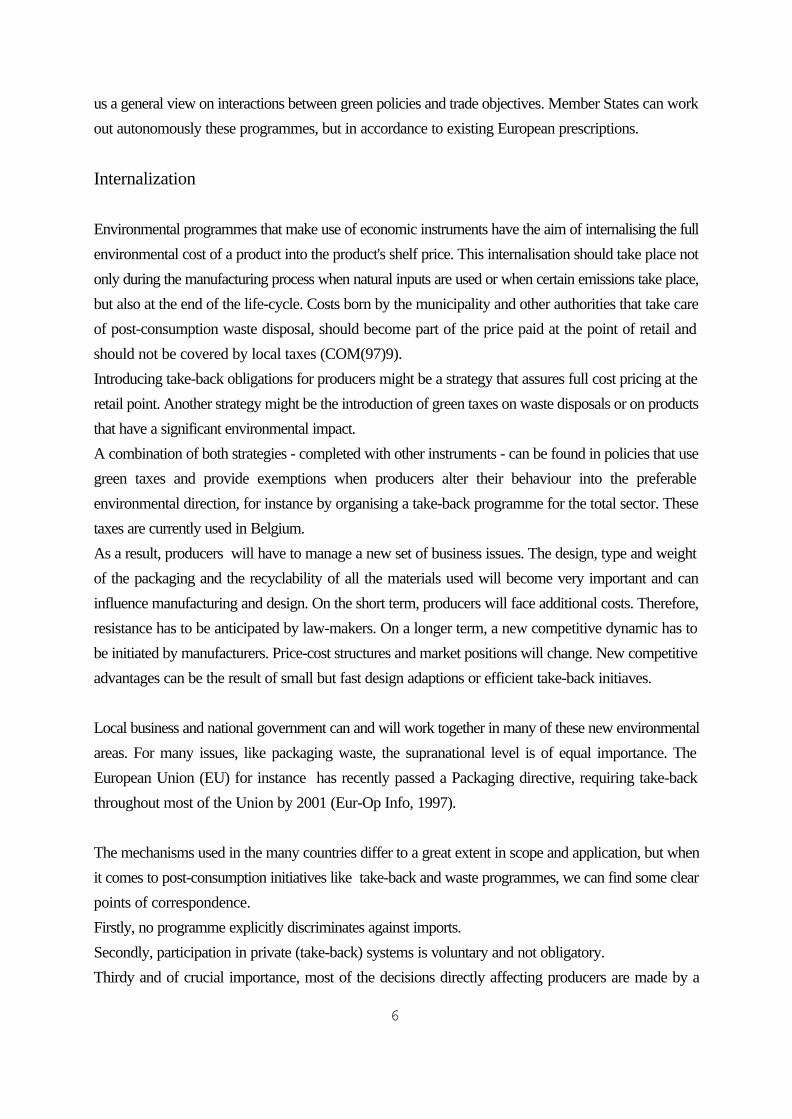
6
us a general view on interactions between green policies and trade objectives. Member States can workout autonomously these programmes, but in accordance to existing European prescriptions.
Internalization
Environmental programmes that make use of economic instruments have the aim of internalising the fullenvironmental cost of a product into the product's shelf price. This internalisation should take place notonly during the manufacturing process when natural inputs are used or when certain emissions take place,but also at the end of the life-cycle. Costs born by the municipality and other authorities that take careof post-consumption waste disposal, should become part of the price paid at the point of retail andshould not be covered by local taxes (COM(97)9).Introducing take-back obligations for producers might be a strategy that assures full cost pricing at theretail point. Another strategy might be the introduction of green taxes on waste disposals or on productsthat have a significant environmental impact.A combination of both strategies - completed with other instruments - can be found in policies that usegreen taxes and provide exemptions when producers alter their behaviour into the preferableenvironmental direction, for instance by organising a take-back programme for the total sector. Thesetaxes are currently used in Belgium.As a result, producers will have to manage a new set of business issues. The design, type and weightof the packaging and the recyclability of all the materials used will become very important and caninfluence manufacturing and design. On the short term, producers will face additional costs. Therefore,resistance has to be anticipated by law-makers. On a longer term, a new competitive dynamic has tobe initiated by manufacturers. Price-cost structures and market positions will change. New competitiveadvantages can be the result of small but fast design adaptions or efficient take-back initiaves.
Local business and national government can and will work together in many of these new environmentalareas. For many issues, like packaging waste, the supranational level is of equal importance. TheEuropean Union (EU) for instance has recently passed a Packaging directive, requiring take-backthroughout most of the Union by 2001 (Eur-Op Info, 1997).
The mechanisms used in the many countries differ to a great extent in scope and application, but whenit comes to post-consumption initiatives like take-back and waste programmes, we can find some clearpoints of correspondence.Firstly, no programme explicitly discriminates against imports.Secondly, participation in private (take-back) systems is voluntary and not obligatory.Thirdy and of crucial importance, most of the decisions directly affecting producers are made by a
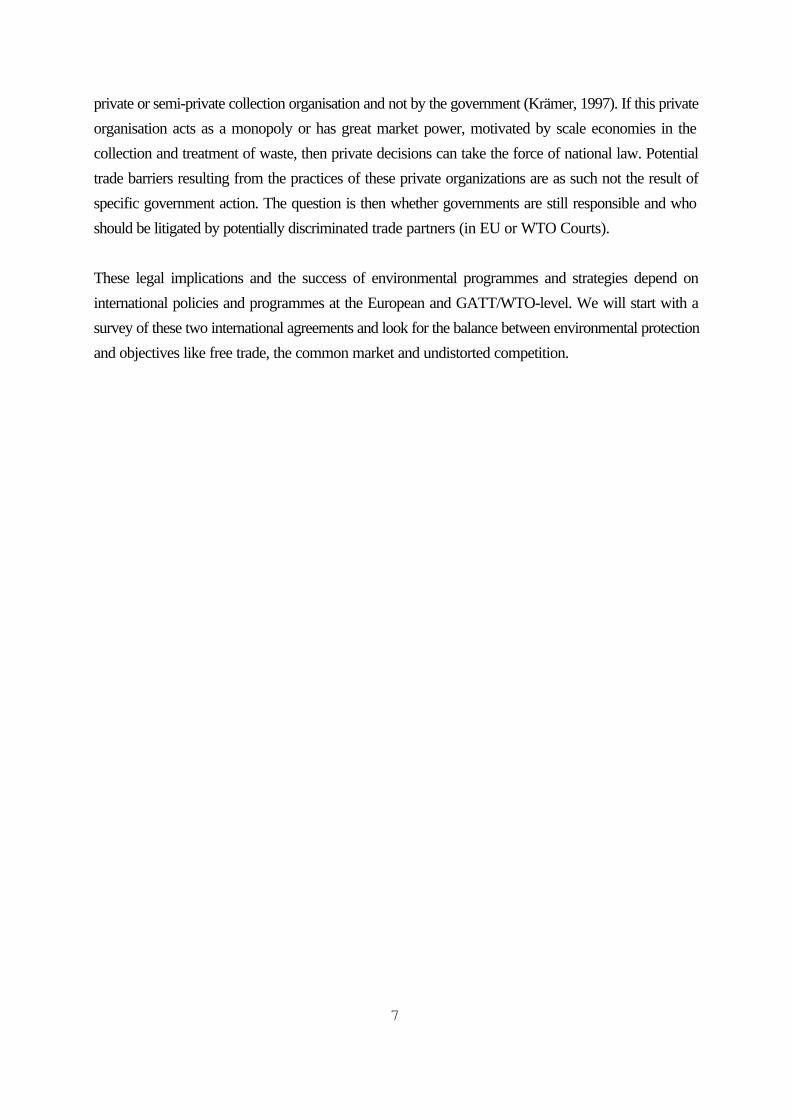
7
private or semi-private collection organisation and not by the government (Krämer, 1997). If this privateorganisation acts as a monopoly or has great market power, motivated by scale economies in thecollection and treatment of waste, then private decisions can take the force of national law. Potentialtrade barriers resulting from the practices of these private organizations are as such not the result ofspecific government action. The question is then whether governments are still responsible and whoshould be litigated by potentially discriminated trade partners (in EU or WTO Courts).
These legal implications and the success of environmental programmes and strategies depend oninternational policies and programmes at the European and GATT/WTO-level. We will start with asurvey of these two international agreements and look for the balance between environmental protectionand objectives like free trade, the common market and undistorted competition.
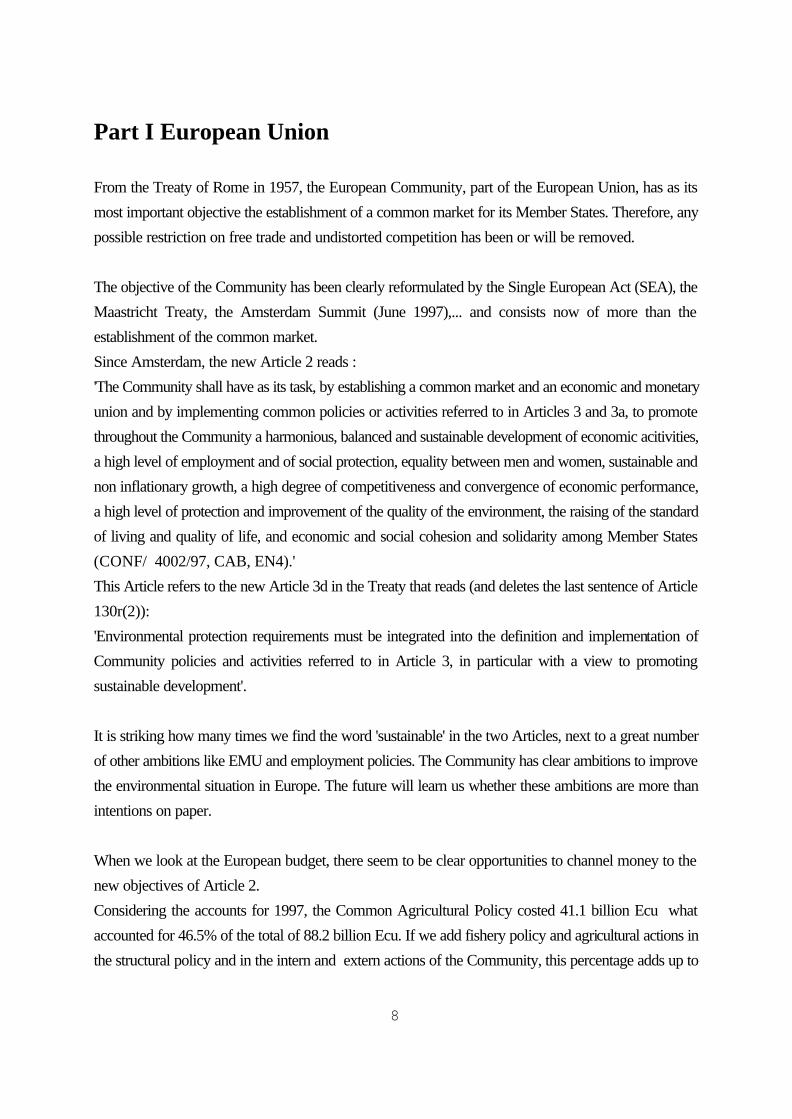
8
Part I European Union
From the Treaty of Rome in 1957, the European Community, part of the European Union, has as itsmost important objective the establishment of a common market for its Member States. Therefore, anypossible restriction on free trade and undistorted competition has been or will be removed.
The objective of the Community has been clearly reformulated by the Single European Act (SEA), theMaastricht Treaty, the Amsterdam Summit (June 1997),... and consists now of more than theestablishment of the common market.Since Amsterdam, the new Article 2 reads :'The Community shall have as its task, by establishing a common market and an economic and monetaryunion and by implementing common policies or activities referred to in Articles 3 and 3a, to promotethroughout the Community a harmonious, balanced and sustainable development of economic acitivities,a high level of employment and of social protection, equality between men and women, sustainable andnon inflationary growth, a high degree of competitiveness and convergence of economic performance,a high level of protection and improvement of the quality of the environment, the raising of the standardof living and quality of life, and economic and social cohesion and solidarity among Member States(CONF/ 4002/97, CAB, EN4).'This Article refers to the new Article 3d in the Treaty that reads (and deletes the last sentence of Article130r(2)):'Environmental protection requirements must be integrated into the definition and implementation ofCommunity policies and activities referred to in Article 3, in particular with a view to promotingsustainable development'.
It is striking how many times we find the word 'sustainable' in the two Articles, next to a great numberof other ambitions like EMU and employment policies. The Community has clear ambitions to improvethe environmental situation in Europe. The future will learn us whether these ambitions are more thanintentions on paper.
When we look at the European budget, there seem to be clear opportunities to channel money to thenew objectives of Article 2.Considering the accounts for 1997, the Common Agricultural Policy costed 41.1 billion Ecu whataccounted for 46.5% of the total of 88.2 billion Ecu. If we add fishery policy and agricultural actions inthe structural policy and in the intern and extern actions of the Community, this percentage adds up to
9
52.5% of the total budget. This is in very sharp contrast to the importance of the agricultural sector inthe European economy.Structural policies attracted 35.6% of total means, external policy 6.3%, the administration 3.1%,reserves 1.3% ... (EC, Algemeen Verslag over de werkzaamheden van de Europese Unie 1997, p.397ev).It should not be a surprise that 'Environment' received only 0.132 billion Ecu, a modest 0.15% of thetotal budget. If we relate this to the most conservative estimates on actual and expected environmentalemployment in the EU - at least 1% of the total European labour force is directly or indirectly workingin the area of environmental conservation -, more funding in the environmental area could be a interestingelement of employment policies (EU, Werkgelegenheid in Europa, 1995).Other priorities like industry, trans-European networks, internal market, information technologies,... alsoreceived unsignificant amounts.As a conclusion we might state that a reallocation of the Community budget could make certain policyobjectives - like the integration of environmental protection - possible, at least when it comes to thefinancing of these objectives.
But the ‘integration of environmental protection’ should not be compared to designing environmentalpolicies in existing free trade frameworks. Environmental policies always had to be integrated in otherpolicies and we will present an overview in the coming sections.Integration means here that when designing other policies, all key policy initiatives should integrateconcern for the environment. This means that instruments like environmental impact assessments willbecome crucial determinants in investment issues for transport policies, industry and commerce. At therecent Cardiff Summit, it was decided that Member States had to identify a set of environmental priorityactions and foresee effective mechanisms for monitoring their implementation (Eur-Op Info, 2/1998 +COM(98)333 fin). In a following phase, these environmental priorities will be included in other policies.As a consequence, only new European policies will in the future integrate environmental concerns,assuming that the integration will be a success. But trade and competition policy are, next to energypolicy, the most crucial policy sets that can interact with environmental protection. And can we expectsignificant changes in European trade policy? Could trade policy be reshaped by environmentalconsiderations? Notwithstanding the question whether this would be a desirable development, there isonly a very small chance because free trade and undistorted competition are also the fundamentals ofthe world trade system institutionalised into the GATT/ WTO.
Critical 'EU-watchers' have serious doubts when it comes to the integration of environmentalconsiderations in other European policies. Environmental policies are by nature already closelyintertwined with other policy objectives (transport, health, stocks of natural assests,...) and this limits the
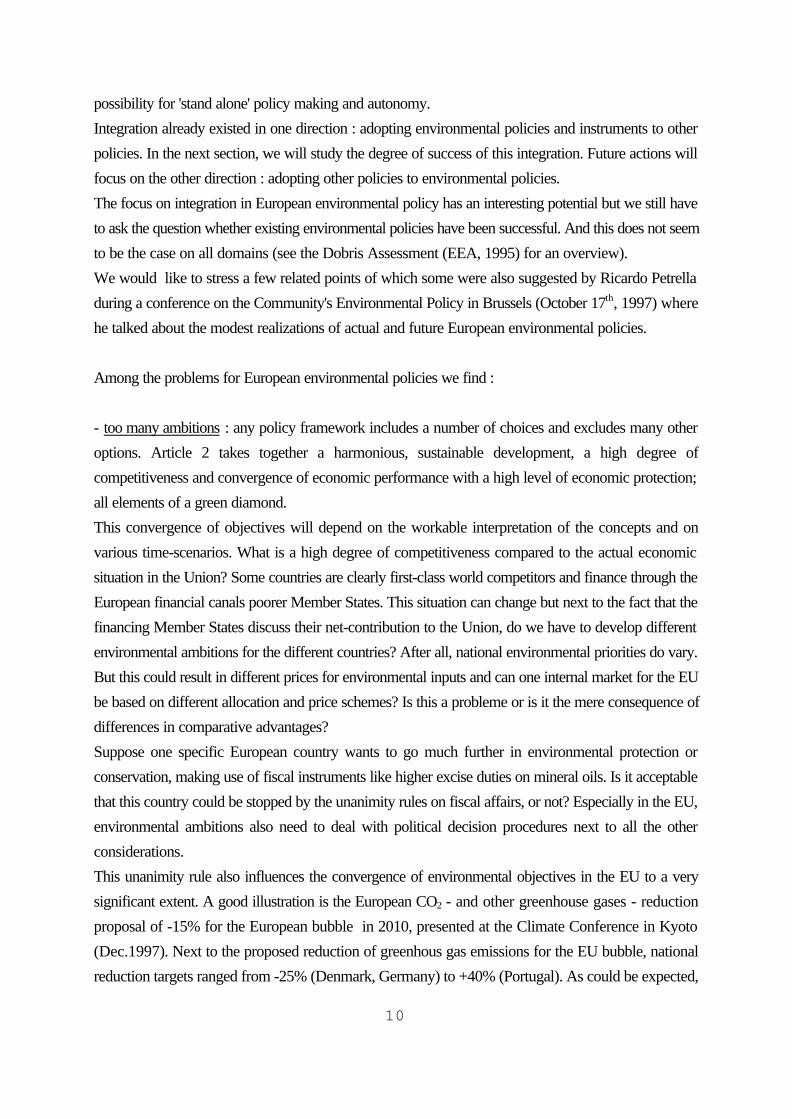
10
possibility for 'stand alone' policy making and autonomy.Integration already existed in one direction : adopting environmental policies and instruments to otherpolicies. In the next section, we will study the degree of success of this integration. Future actions willfocus on the other direction : adopting other policies to environmental policies.The focus on integration in European environmental policy has an interesting potential but we still haveto ask the question whether existing environmental policies have been successful. And this does not seemto be the case on all domains (see the Dobris Assessment (EEA, 1995) for an overview). We would like to stress a few related points of which some were also suggested by Ricardo Petrelladuring a conference on the Community's Environmental Policy in Brussels (October 17th, 1997) wherehe talked about the modest realizations of actual and future European environmental policies.
Among the problems for European environmental policies we find :
- too many ambitions : any policy framework includes a number of choices and excludes many otheroptions. Article 2 takes together a harmonious, sustainable development, a high degree ofcompetitiveness and convergence of economic performance with a high level of economic protection;all elements of a green diamond.This convergence of objectives will depend on the workable interpretation of the concepts and onvarious time-scenarios. What is a high degree of competitiveness compared to the actual economicsituation in the Union? Some countries are clearly first-class world competitors and finance through theEuropean financial canals poorer Member States. This situation can change but next to the fact that thefinancing Member States discuss their net-contribution to the Union, do we have to develop differentenvironmental ambitions for the different countries? After all, national environmental priorities do vary.But this could result in different prices for environmental inputs and can one internal market for the EUbe based on different allocation and price schemes? Is this a probleme or is it the mere consequence ofdifferences in comparative advantages?Suppose one specific European country wants to go much further in environmental protection orconservation, making use of fiscal instruments like higher excise duties on mineral oils. Is it acceptablethat this country could be stopped by the unanimity rules on fiscal affairs, or not? Especially in the EU,environmental ambitions also need to deal with political decision procedures next to all the otherconsiderations.This unanimity rule also influences the convergence of environmental objectives in the EU to a verysignificant extent. A good illustration is the European CO2 - and other greenhouse gases - reductionproposal of -15% for the European bubble in 2010, presented at the Climate Conference in Kyoto(Dec.1997). Next to the proposed reduction of greenhous gas emissions for the EU bubble, nationalreduction targets ranged from -25% (Denmark, Germany) to +40% (Portugal). As could be expected,
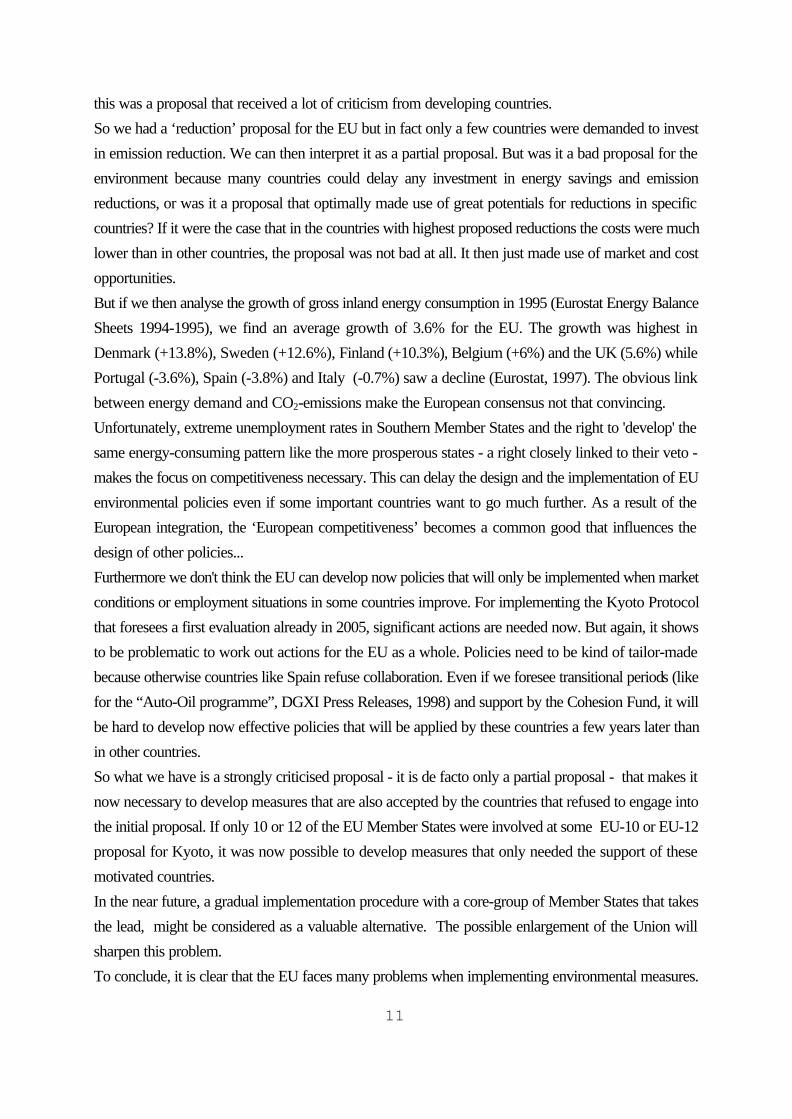
11
this was a proposal that received a lot of criticism from developing countries.So we had a ‘reduction’ proposal for the EU but in fact only a few countries were demanded to investin emission reduction. We can then interpret it as a partial proposal. But was it a bad proposal for theenvironment because many countries could delay any investment in energy savings and emissionreductions, or was it a proposal that optimally made use of great potentials for reductions in specificcountries? If it were the case that in the countries with highest proposed reductions the costs were muchlower than in other countries, the proposal was not bad at all. It then just made use of market and costopportunities.But if we then analyse the growth of gross inland energy consumption in 1995 (Eurostat Energy BalanceSheets 1994-1995), we find an average growth of 3.6% for the EU. The growth was highest inDenmark (+13.8%), Sweden (+12.6%), Finland (+10.3%), Belgium (+6%) and the UK (5.6%) whilePortugal (-3.6%), Spain (-3.8%) and Italy (-0.7%) saw a decline (Eurostat, 1997). The obvious linkbetween energy demand and CO2-emissions make the European consensus not that convincing.Unfortunately, extreme unemployment rates in Southern Member States and the right to 'develop' thesame energy-consuming pattern like the more prosperous states - a right closely linked to their veto -makes the focus on competitiveness necessary. This can delay the design and the implementation of EUenvironmental policies even if some important countries want to go much further. As a result of theEuropean integration, the ‘European competitiveness’ becomes a common good that influences thedesign of other policies...Furthermore we don't think the EU can develop now policies that will only be implemented when marketconditions or employment situations in some countries improve. For implementing the Kyoto Protocolthat foresees a first evaluation already in 2005, significant actions are needed now. But again, it showsto be problematic to work out actions for the EU as a whole. Policies need to be kind of tailor-madebecause otherwise countries like Spain refuse collaboration. Even if we foresee transitional periods (likefor the “Auto-Oil programme”, DGXI Press Releases, 1998) and support by the Cohesion Fund, it willbe hard to develop now effective policies that will be applied by these countries a few years later thanin other countries.So what we have is a strongly criticised proposal - it is de facto only a partial proposal - that makes itnow necessary to develop measures that are also accepted by the countries that refused to engage intothe initial proposal. If only 10 or 12 of the EU Member States were involved at some EU-10 or EU-12proposal for Kyoto, it was now possible to develop measures that only needed the support of thesemotivated countries.In the near future, a gradual implementation procedure with a core-group of Member States that takesthe lead, might be considered as a valuable alternative. The possible enlargement of the Union willsharpen this problem.To conclude, it is clear that the EU faces many problems when implementing environmental measures.
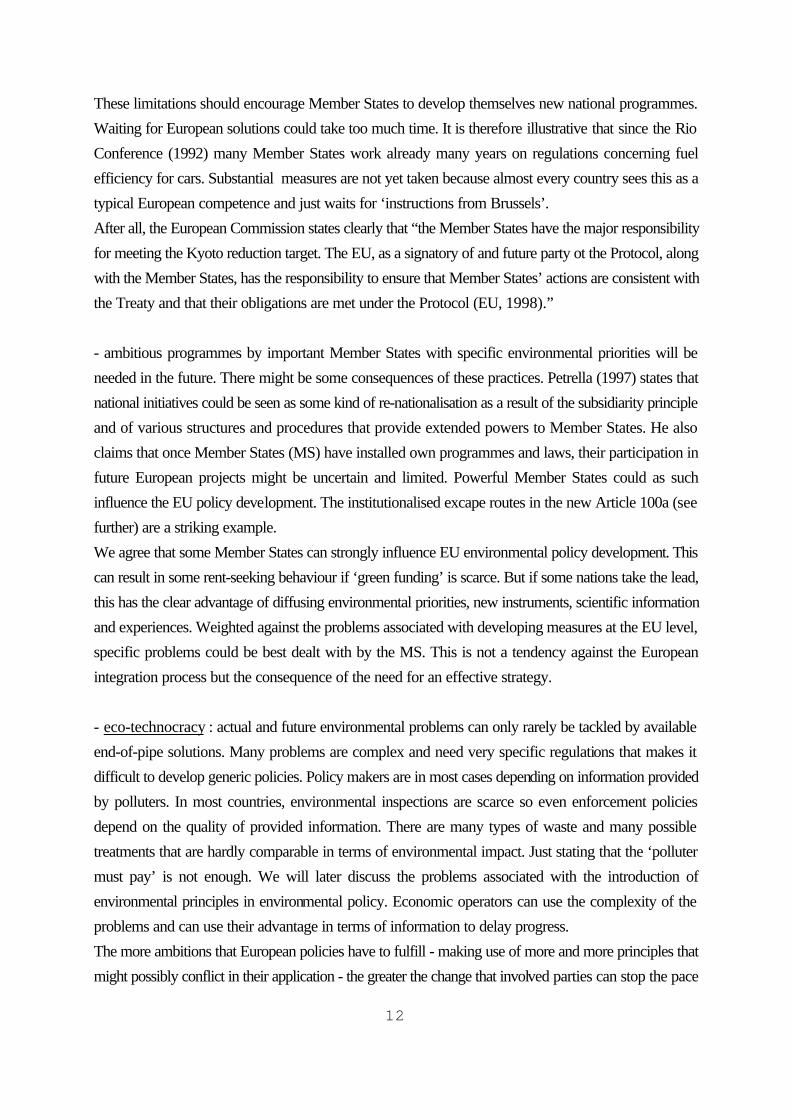
12
These limitations should encourage Member States to develop themselves new national programmes.Waiting for European solutions could take too much time. It is therefore illustrative that since the RioConference (1992) many Member States work already many years on regulations concerning fuelefficiency for cars. Substantial measures are not yet taken because almost every country sees this as atypical European competence and just waits for ‘instructions from Brussels’.After all, the European Commission states clearly that “the Member States have the major responsibilityfor meeting the Kyoto reduction target. The EU, as a signatory of and future party ot the Protocol, alongwith the Member States, has the responsibility to ensure that Member States’ actions are consistent withthe Treaty and that their obligations are met under the Protocol (EU, 1998).”
- ambitious programmes by important Member States with specific environmental priorities will beneeded in the future. There might be some consequences of these practices. Petrella (1997) states thatnational initiatives could be seen as some kind of re-nationalisation as a result of the subsidiarity principleand of various structures and procedures that provide extended powers to Member States. He alsoclaims that once Member States (MS) have installed own programmes and laws, their participation infuture European projects might be uncertain and limited. Powerful Member States could as suchinfluence the EU policy development. The institutionalised excape routes in the new Article 100a (seefurther) are a striking example.We agree that some Member States can strongly influence EU environmental policy development. Thiscan result in some rent-seeking behaviour if ‘green funding’ is scarce. But if some nations take the lead,this has the clear advantage of diffusing environmental priorities, new instruments, scientific informationand experiences. Weighted against the problems associated with developing measures at the EU level,specific problems could be best dealt with by the MS. This is not a tendency against the Europeanintegration process but the consequence of the need for an effective strategy.
- eco-technocracy : actual and future environmental problems can only rarely be tackled by availableend-of-pipe solutions. Many problems are complex and need very specific regulations that makes itdifficult to develop generic policies. Policy makers are in most cases depending on information providedby polluters. In most countries, environmental inspections are scarce so even enforcement policiesdepend on the quality of provided information. There are many types of waste and many possibletreatments that are hardly comparable in terms of environmental impact. Just stating that the ‘pollutermust pay’ is not enough. We will later discuss the problems associated with the introduction ofenvironmental principles in environmental policy. Economic operators can use the complexity of theproblems and can use their advantage in terms of information to delay progress.The more ambitions that European policies have to fulfill - making use of more and more principles thatmight possibly conflict in their application - the greater the change that involved parties can stop the pace
13
by introducing complaints that result in time-consuming cases for the Court and secondary law thatfurther complicates the situation. For example, a simple instrument like an ecotax has to include amultitude of considerations and even then, future developments in the common market can make itinapplicable due to conflicting interests.
- implementation problems : it should be no surprise that regulations are in many cases translated withgreat delay into national legislation. Some MS even never start with the implementation of certaindirectives. At the end of 1995, 133 environmental directives were applicable. Denmark and theNetherlands had notified measures for 131 of them, Germany and Ireland had measures for 127directives, France had measures for 126 directives... Three countries had measures for less than 115directives : Finland (114), Italy (113) and Belgium (111) (Micosi, 1996).These differences in delay depend mainly on capabilities and experience but also to a large extent ongoodwill. The growing number of Member States increases the average delays and linguistic problems(not every Member State translates and interprets 'polluter pays' and 'sustainable development' the sameway).Next to the dependence on national goodwill, it is striking that the legal affairs department of theCommission that should supervise correct and adequate implementation is deprived from sufficienthuman and non-human resources to function properly. Without an effective implementation, ambitiouspolicies and principles will not work (Rhiannon Williams, 1997).
- stakeholders' interests : the Commission consults many involved parties before a policy will bedesigned. This is a condition for a later succesful implementation but it risks to introduce non-transparentand non-democratic policy mechanisms. The European Parliament should control the process of policy-making instead of giving opinions on implementation issues once the policy in introduced. Anotherproblem is that the Commission might spend too much time in consultation rounds and faces evolutionslike growing concern on competitivity and employment, institutionel effects of future enlargements,influence by stakeholders and eco-technocracy.
- the importance of European competitivity needs no further explanation. The European Union has tocreate a great common market to provide equal market-opportunities for European-based firmscompared to their American and Asian competitors. Market-integration is the principal priority of theEuropean Commission. A competitive market will make any environmental barrier to trade orcompetition very problematic. This focus on free trade and undistorted competition makes it difficult tointroduce economic, social, industrial or fiscal policies on a European scale. These policies can inducefinancial transfers that can disturb competition. Even structural funds for poor regions have to be carefully
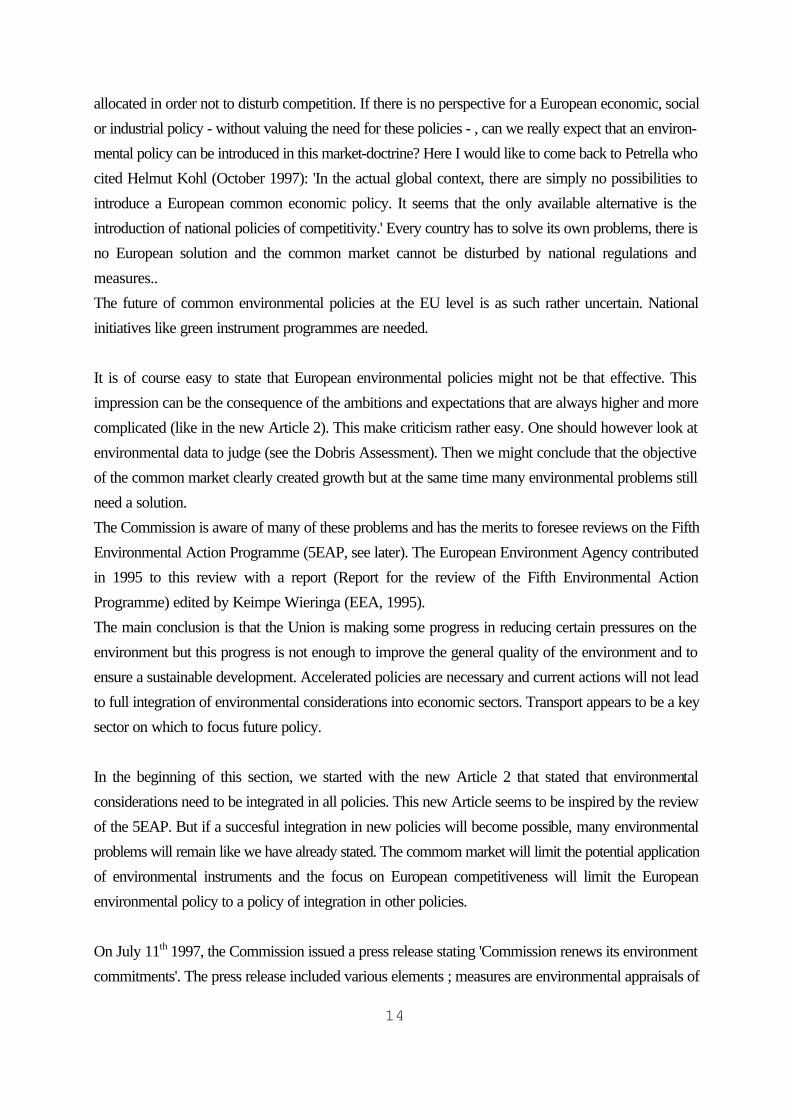
14
allocated in order not to disturb competition. If there is no perspective for a European economic, socialor industrial policy - without valuing the need for these policies - , can we really expect that an environ-mental policy can be introduced in this market-doctrine? Here I would like to come back to Petrella whocited Helmut Kohl (October 1997): 'In the actual global context, there are simply no possibilities tointroduce a European common economic policy. It seems that the only available alternative is theintroduction of national policies of competitivity.' Every country has to solve its own problems, there isno European solution and the common market cannot be disturbed by national regulations andmeasures..The future of common environmental policies at the EU level is as such rather uncertain. Nationalinitiatives like green instrument programmes are needed.
It is of course easy to state that European environmental policies might not be that effective. Thisimpression can be the consequence of the ambitions and expectations that are always higher and morecomplicated (like in the new Article 2). This make criticism rather easy. One should however look atenvironmental data to judge (see the Dobris Assessment). Then we might conclude that the objectiveof the common market clearly created growth but at the same time many environmental problems stillneed a solution.The Commission is aware of many of these problems and has the merits to foresee reviews on the FifthEnvironmental Action Programme (5EAP, see later). The European Environment Agency contributedin 1995 to this review with a report (Report for the review of the Fifth Environmental ActionProgramme) edited by Keimpe Wieringa (EEA, 1995).The main conclusion is that the Union is making some progress in reducing certain pressures on theenvironment but this progress is not enough to improve the general quality of the environment and toensure a sustainable development. Accelerated policies are necessary and current actions will not leadto full integration of environmental considerations into economic sectors. Transport appears to be a keysector on which to focus future policy.
In the beginning of this section, we started with the new Article 2 that stated that environmentalconsiderations need to be integrated in all policies. This new Article seems to be inspired by the reviewof the 5EAP. But if a succesful integration in new policies will become possible, many environmentalproblems will remain like we have already stated. The commom market will limit the potential applicationof environmental instruments and the focus on European competitiveness will limit the Europeanenvironmental policy to a policy of integration in other policies.
On July 11th 1997, the Commission issued a press release stating 'Commission renews its environmentcommitments'. The press release included various elements ; measures are environmental appraisals of
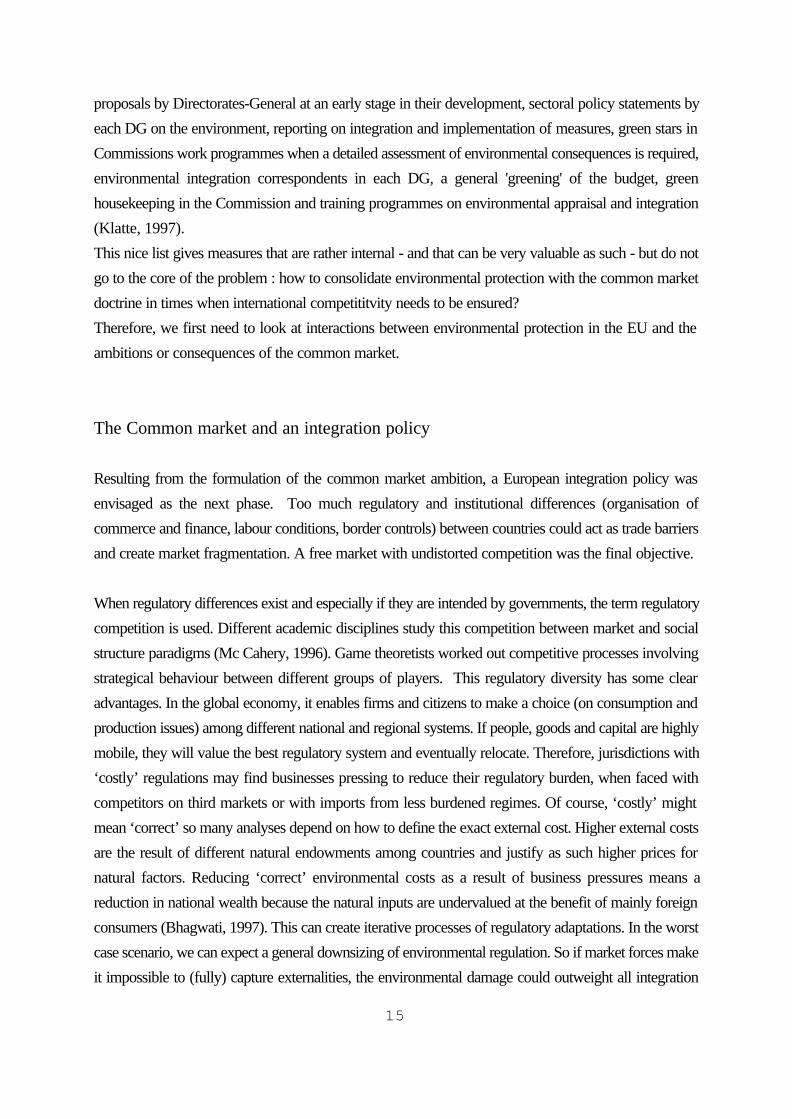
15
proposals by Directorates-General at an early stage in their development, sectoral policy statements byeach DG on the environment, reporting on integration and implementation of measures, green stars inCommissions work programmes when a detailed assessment of environmental consequences is required,environmental integration correspondents in each DG, a general 'greening' of the budget, greenhousekeeping in the Commission and training programmes on environmental appraisal and integration(Klatte, 1997).This nice list gives measures that are rather internal - and that can be very valuable as such - but do notgo to the core of the problem : how to consolidate environmental protection with the common marketdoctrine in times when international competititvity needs to be ensured? Therefore, we first need to look at interactions between environmental protection in the EU and theambitions or consequences of the common market.
The Common market and an integration policy
Resulting from the formulation of the common market ambition, a European integration policy wasenvisaged as the next phase. Too much regulatory and institutional differences (organisation ofcommerce and finance, labour conditions, border controls) between countries could act as trade barriersand create market fragmentation. A free market with undistorted competition was the final objective.
When regulatory differences exist and especially if they are intended by governments, the term regulatorycompetition is used. Different academic disciplines study this competition between market and socialstructure paradigms (Mc Cahery, 1996). Game theoretists worked out competitive processes involvingstrategical behaviour between different groups of players. This regulatory diversity has some clearadvantages. In the global economy, it enables firms and citizens to make a choice (on consumption andproduction issues) among different national and regional systems. If people, goods and capital are highlymobile, they will value the best regulatory system and eventually relocate. Therefore, jurisdictions with‘costly’ regulations may find businesses pressing to reduce their regulatory burden, when faced withcompetitors on third markets or with imports from less burdened regimes. Of course, ‘costly’ mightmean ‘correct’ so many analyses depend on how to define the exact external cost. Higher external costsare the result of different natural endowments among countries and justify as such higher prices fornatural factors. Reducing ‘correct’ environmental costs as a result of business pressures means areduction in national wealth because the natural inputs are undervalued at the benefit of mainly foreignconsumers (Bhagwati, 1997). This can create iterative processes of regulatory adaptations. In the worstcase scenario, we can expect a general downsizing of environmental regulation. So if market forces makeit impossible to (fully) capture externalities, the environmental damage could outweight all integration
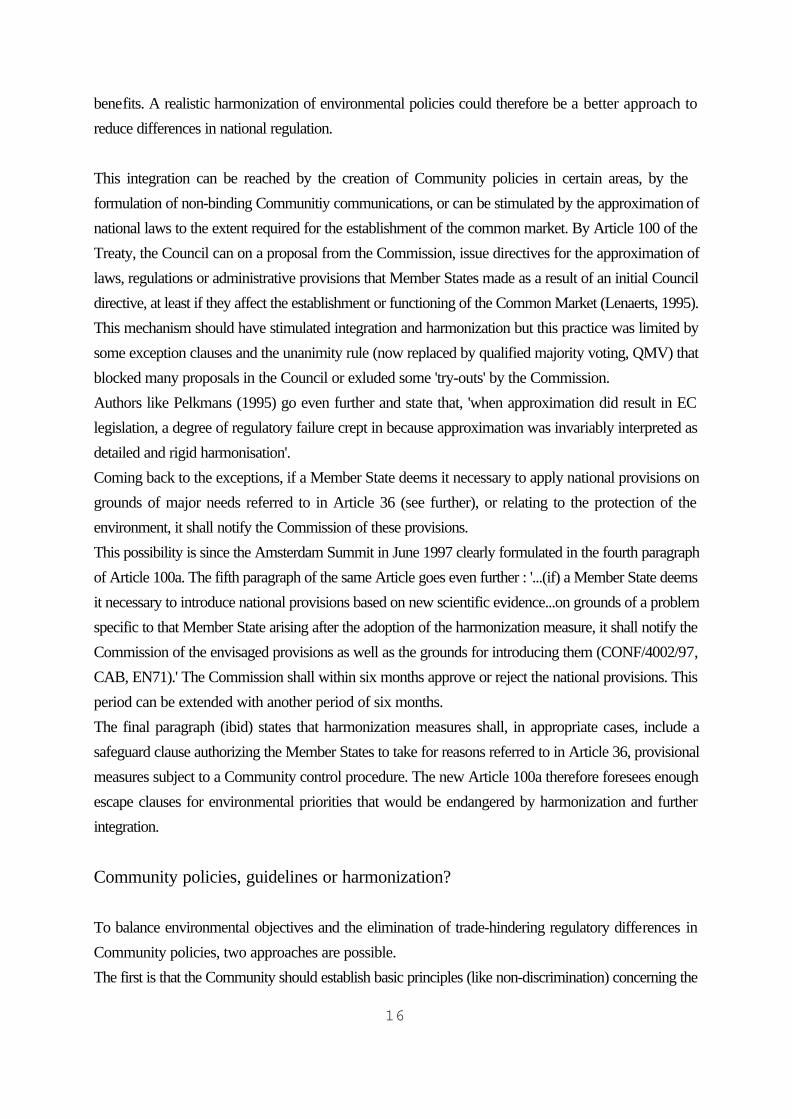
16
benefits. A realistic harmonization of environmental policies could therefore be a better approach toreduce differences in national regulation.
This integration can be reached by the creation of Community policies in certain areas, by the formulation of non-binding Communitiy communications, or can be stimulated by the approximation ofnational laws to the extent required for the establishment of the common market. By Article 100 of theTreaty, the Council can on a proposal from the Commission, issue directives for the approximation oflaws, regulations or administrative provisions that Member States made as a result of an initial Councildirective, at least if they affect the establishment or functioning of the Common Market (Lenaerts, 1995).This mechanism should have stimulated integration and harmonization but this practice was limited bysome exception clauses and the unanimity rule (now replaced by qualified majority voting, QMV) thatblocked many proposals in the Council or exluded some 'try-outs' by the Commission.Authors like Pelkmans (1995) go even further and state that, 'when approximation did result in EClegislation, a degree of regulatory failure crept in because approximation was invariably interpreted asdetailed and rigid harmonisation'. Coming back to the exceptions, if a Member State deems it necessary to apply national provisions ongrounds of major needs referred to in Article 36 (see further), or relating to the protection of theenvironment, it shall notify the Commission of these provisions.This possibility is since the Amsterdam Summit in June 1997 clearly formulated in the fourth paragraphof Article 100a. The fifth paragraph of the same Article goes even further : '...(if) a Member State deemsit necessary to introduce national provisions based on new scientific evidence...on grounds of a problemspecific to that Member State arising after the adoption of the harmonization measure, it shall notify theCommission of the envisaged provisions as well as the grounds for introducing them (CONF/4002/97,CAB, EN71).' The Commission shall within six months approve or reject the national provisions. Thisperiod can be extended with another period of six months.The final paragraph (ibid) states that harmonization measures shall, in appropriate cases, include asafeguard clause authorizing the Member States to take for reasons referred to in Article 36, provisionalmeasures subject to a Community control procedure. The new Article 100a therefore foresees enoughescape clauses for environmental priorities that would be endangered by harmonization and furtherintegration.
Community policies, guidelines or harmonization?
To balance environmental objectives and the elimination of trade-hindering regulatory differences inCommunity policies, two approaches are possible.The first is that the Community should establish basic principles (like non-discrimination) concerning the
17
application of national environmental measures, eventually with possible exceptions.The second approach is the harmonization of environmental standards. Under the Single European Act,the existing set of competences was complemented by an explicit power to introduce a comprehensiveenvironmental policy at Community level, but recently this approach came under growing criticism. Theprinciple of subsidiarity and the actual competition among regulatory systems express a strong desire tolimit the harmonization measures taken by the Community to those absolutely necessary (Ziegler, 1997).There are also strong environmental arguments because some Member States want to go further in theirenvironmental protection compared to the protection that was envisaged by the Commission.
The Community showed a tendency to the first approach based on guidelines which allow for theapplication of domestic environmental measures and instruments at the national and regional level,without of course jeopardising the establishment of the common market.
GREEN TAX PROGRAMMES IN THE EU
Many European countries recently applied new environmental instruments or consider their futureapplication. The environmental purpose is always rather obvious but many authors expressed theirconcerns when it comes to possible trade restrictive consequences.In a growing number of cases, taxes on products - ecotaxes - are installed. They do not replace existingtaxes on emissions, energy or water use. These ecotaxes can be conditional and mostly make part ofa larger policy framework that also includes take-back programmes (maybe enabled by voluntaryagreements between private firms or between public authorities and firms), recycling objectives or shiftstowards greener technologies. Of course, also countries that have no green taxes (and do not want toinstall them in the near future) can have a take-back programme or a 'green technology' policy. Forthese countries the analysis of the ecotaxes, the main instrument in our survey, can be interesting becauseof possible future Community initiatives in other, related fields.
We want to answer the question which national ecotax programmes are compatible with the EuropeanUnion Treaty, and which, by contrast, breach the rules of the Single Market? In an attempt to clarify thissituation, the European Commission presented a communication on January 29th, 1997, setting outguidelines for Member States on their margin for manoeuvre in this field.In the absence of relevant Community law (the second approach), national, regional and local entitiesare entitled to take necessary actions provided they do not jeopardize the Community legal order and,in particular, the establishment of the Common Market.
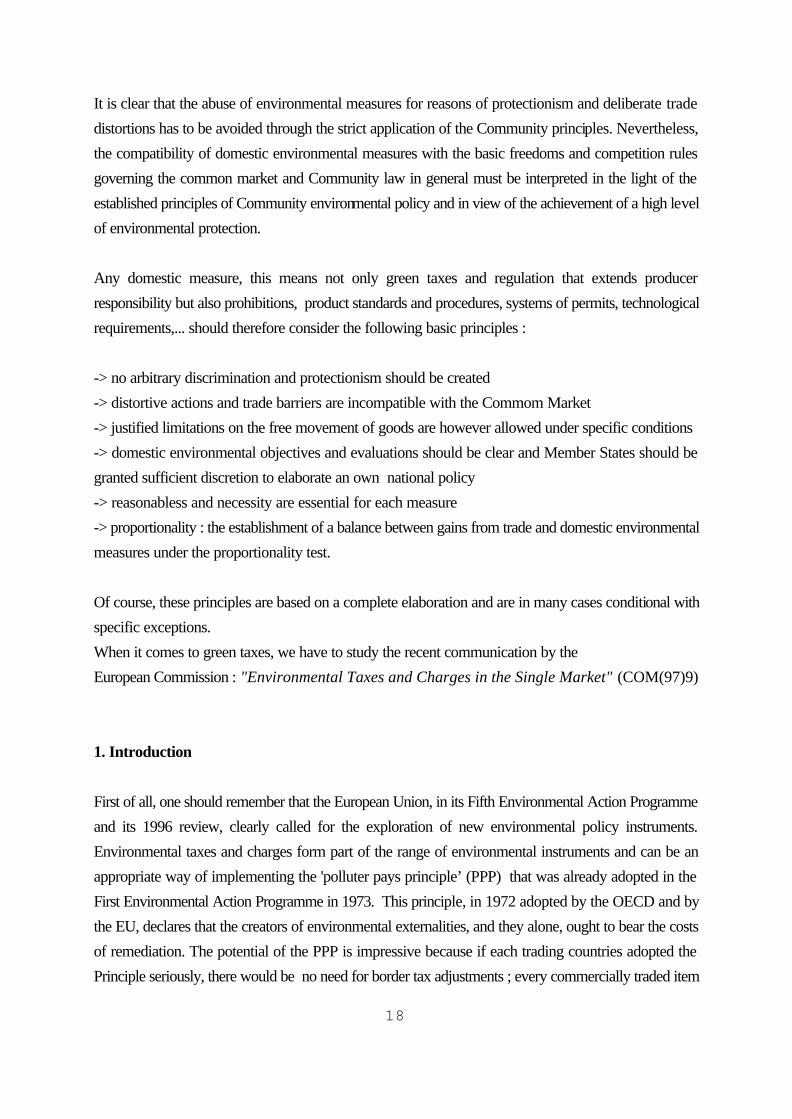
18
It is clear that the abuse of environmental measures for reasons of protectionism and deliberate tradedistortions has to be avoided through the strict application of the Community principles. Nevertheless,the compatibility of domestic environmental measures with the basic freedoms and competition rulesgoverning the common market and Community law in general must be interpreted in the light of theestablished principles of Community environmental policy and in view of the achievement of a high levelof environmental protection.
Any domestic measure, this means not only green taxes and regulation that extends producerresponsibility but also prohibitions, product standards and procedures, systems of permits, technologicalrequirements,... should therefore consider the following basic principles :
-> no arbitrary discrimination and protectionism should be created-> distortive actions and trade barriers are incompatible with the Commom Market-> justified limitations on the free movement of goods are however allowed under specific conditions-> domestic environmental objectives and evaluations should be clear and Member States should begranted sufficient discretion to elaborate an own national policy-> reasonabless and necessity are essential for each measure-> proportionality : the establishment of a balance between gains from trade and domestic environmentalmeasures under the proportionality test.
Of course, these principles are based on a complete elaboration and are in many cases conditional withspecific exceptions.When it comes to green taxes, we have to study the recent communication by theEuropean Commission : "Environmental Taxes and Charges in the Single Market" (COM(97)9)
1. Introduction
First of all, one should remember that the European Union, in its Fifth Environmental Action Programmeand its 1996 review, clearly called for the exploration of new environmental policy instruments.Environmental taxes and charges form part of the range of environmental instruments and can be anappropriate way of implementing the 'polluter pays principle’ (PPP) that was already adopted in theFirst Environmental Action Programme in 1973. This principle, in 1972 adopted by the OECD and bythe EU, declares that the creators of environmental externalities, and they alone, ought to bear the costsof remediation. The potential of the PPP is impressive because if each trading countries adopted thePrinciple seriously, there would be no need for border tax adjustments ; every commercially traded item
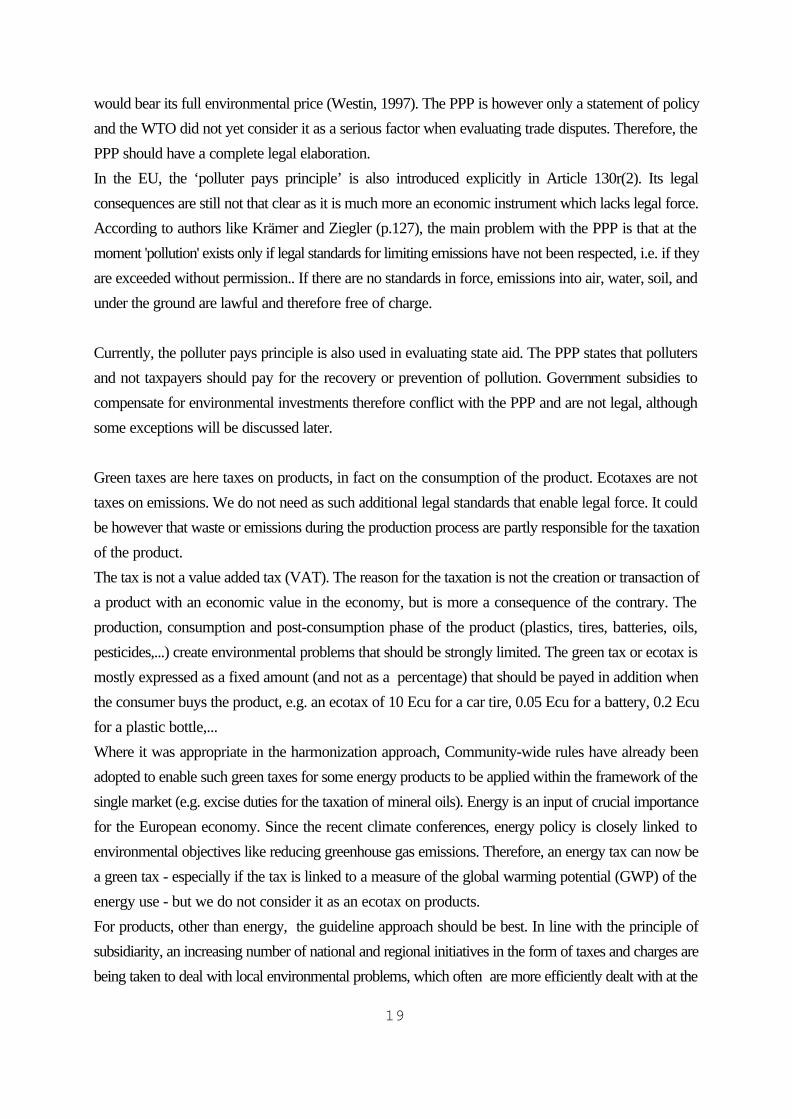
19
would bear its full environmental price (Westin, 1997). The PPP is however only a statement of policyand the WTO did not yet consider it as a serious factor when evaluating trade disputes. Therefore, thePPP should have a complete legal elaboration.In the EU, the ‘polluter pays principle’ is also introduced explicitly in Article 130r(2). Its legalconsequences are still not that clear as it is much more an economic instrument which lacks legal force.According to authors like Krämer and Ziegler (p.127), the main problem with the PPP is that at themoment 'pollution' exists only if legal standards for limiting emissions have not been respected, i.e. if theyare exceeded without permission.. If there are no standards in force, emissions into air, water, soil, andunder the ground are lawful and therefore free of charge.
Currently, the polluter pays principle is also used in evaluating state aid. The PPP states that pollutersand not taxpayers should pay for the recovery or prevention of pollution. Government subsidies tocompensate for environmental investments therefore conflict with the PPP and are not legal, althoughsome exceptions will be discussed later.
Green taxes are here taxes on products, in fact on the consumption of the product. Ecotaxes are nottaxes on emissions. We do not need as such additional legal standards that enable legal force. It couldbe however that waste or emissions during the production process are partly responsible for the taxationof the product.The tax is not a value added tax (VAT). The reason for the taxation is not the creation or transaction ofa product with an economic value in the economy, but is more a consequence of the contrary. Theproduction, consumption and post-consumption phase of the product (plastics, tires, batteries, oils,pesticides,...) create environmental problems that should be strongly limited. The green tax or ecotax ismostly expressed as a fixed amount (and not as a percentage) that should be payed in addition whenthe consumer buys the product, e.g. an ecotax of 10 Ecu for a car tire, 0.05 Ecu for a battery, 0.2 Ecufor a plastic bottle,...Where it was appropriate in the harmonization approach, Community-wide rules have already beenadopted to enable such green taxes for some energy products to be applied within the framework of thesingle market (e.g. excise duties for the taxation of mineral oils). Energy is an input of crucial importancefor the European economy. Since the recent climate conferences, energy policy is closely linked toenvironmental objectives like reducing greenhouse gas emissions. Therefore, an energy tax can now bea green tax - especially if the tax is linked to a measure of the global warming potential (GWP) of theenergy use - but we do not consider it as an ecotax on products.For products, other than energy, the guideline approach should be best. In line with the principle ofsubsidiarity, an increasing number of national and regional initiatives in the form of taxes and charges arebeing taken to deal with local environmental problems, which often are more efficiently dealt with at the
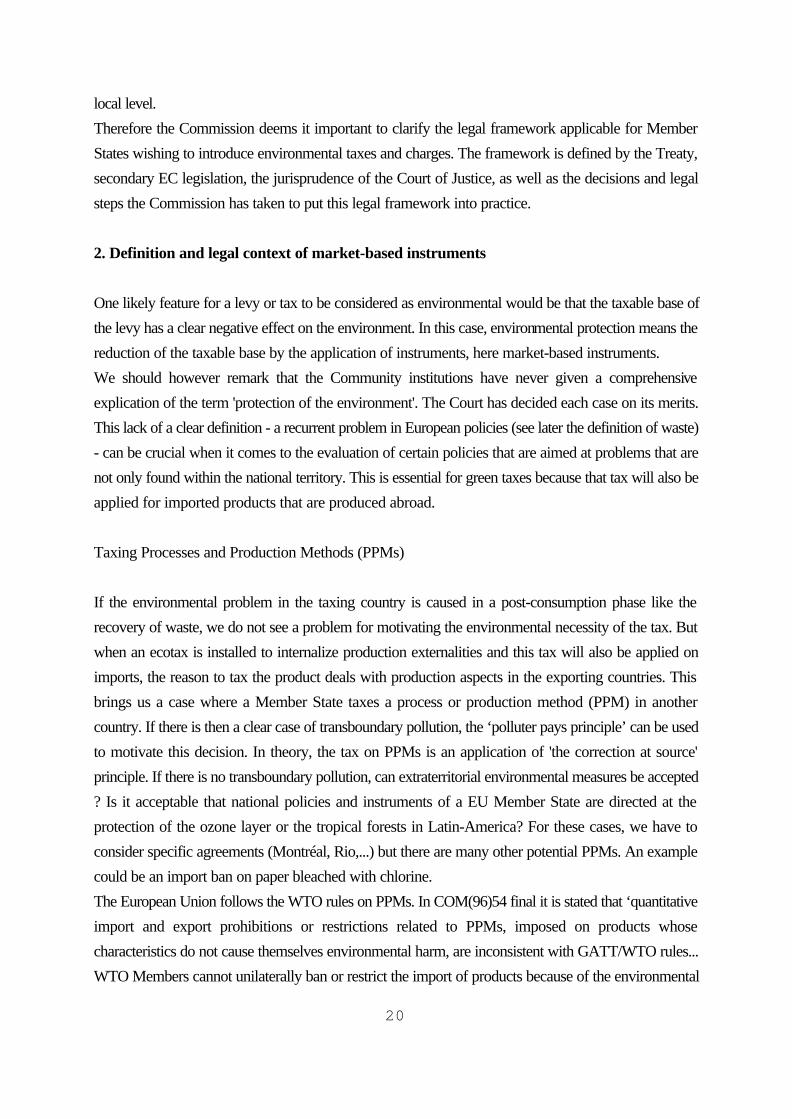
20
local level.Therefore the Commission deems it important to clarify the legal framework applicable for MemberStates wishing to introduce environmental taxes and charges. The framework is defined by the Treaty,secondary EC legislation, the jurisprudence of the Court of Justice, as well as the decisions and legalsteps the Commission has taken to put this legal framework into practice.
2. Definition and legal context of market-based instruments
One likely feature for a levy or tax to be considered as environmental would be that the taxable base ofthe levy has a clear negative effect on the environment. In this case, environmental protection means thereduction of the taxable base by the application of instruments, here market-based instruments.We should however remark that the Community institutions have never given a comprehensiveexplication of the term 'protection of the environment'. The Court has decided each case on its merits.This lack of a clear definition - a recurrent problem in European policies (see later the definition of waste)- can be crucial when it comes to the evaluation of certain policies that are aimed at problems that arenot only found within the national territory. This is essential for green taxes because that tax will also beapplied for imported products that are produced abroad.
Taxing Processes and Production Methods (PPMs)
If the environmental problem in the taxing country is caused in a post-consumption phase like therecovery of waste, we do not see a problem for motivating the environmental necessity of the tax. Butwhen an ecotax is installed to internalize production externalities and this tax will also be applied onimports, the reason to tax the product deals with production aspects in the exporting countries. Thisbrings us a case where a Member State taxes a process or production method (PPM) in anothercountry. If there is then a clear case of transboundary pollution, the ‘polluter pays principle’ can be usedto motivate this decision. In theory, the tax on PPMs is an application of 'the correction at source'principle. If there is no transboundary pollution, can extraterritorial environmental measures be accepted? Is it acceptable that national policies and instruments of a EU Member State are directed at theprotection of the ozone layer or the tropical forests in Latin-America? For these cases, we have toconsider specific agreements (Montréal, Rio,...) but there are many other potential PPMs. An examplecould be an import ban on paper bleached with chlorine.The European Union follows the WTO rules on PPMs. In COM(96)54 final it is stated that ‘quantitativeimport and export prohibitions or restrictions related to PPMs, imposed on products whosecharacteristics do not cause themselves environmental harm, are inconsistent with GATT/WTO rules...WTO Members cannot unilaterally ban or restrict the import of products because of the environmental
21
effects of processes and production methods (PPMs) used in the exporting (producing) country.’ Butin the case of environmental harm to a neighbouring state, this may be counteracted by the argument thatStates also have an obligation under Principle 2 of the Rio Declaration ‘to ensure that activities withintheir jurisdiction do not cause damage to the environment of other States or areas beyond the limits ofnational jurisdiction.’ The correct application of this principle would render PPMs unnecessary. The EUunderwrites these statements but emphasises that this last category of PPMs should be based on rigorousscientific evidence, be proportional to the objectives sought and implemented in a transparent manner.They should also be considered as last resort measures, once attempts to find other bilateral andmultilateral solution have been exhausted. In later sections, we will further elaborate PPMs.
Environmental effects
Any measure should be proportional to the environmental effects of it. This rule does not imply thatdifference in environmental requirements should be problematic. Already in the 1972 OECD GuidingPrinciples, valid reasons for different environmental requirements were formulated (OECD/GD(97)137).However, the OECD went on to state that where valid reasons for differences do not exist, ‘governmentshould seek harmonisation of environmental policies.’In general, it is up to the Member State (MS) to show the estimated environmental effect of the levy, ifthat would be needed in assessing its compatibility with Community law (COM(97)9). The ecotax is ameasure that can in principle be installed for the realization of any environmental objective that is relatedto the consumption of goods and services. Like for all measures, the European Court has establishedthat a national measure has to be reasonable for the pursuit of the objective. As a consequence, it ispossible that the Court refers to the capacity of a measure to achieve the attempted objective.For products with a very low elasticity, the price signal created by the ecotax could be insignificant sothe levy needs accompanying measures to realize a specific environmental objective. This explains whysome existing ecotaxes are relatively high compared to the initial product price. Only then the price signalwill be obvious.Working with elasticity always is problematic because it remains a rather theoretical principle thatrequires excellent data to calculate. Even then, the calculated value is only valid for a specific momentin time with a specific price and market situation. But here we can state that even low elasticities couldinfluence enterprise profits so the ecotax could stimulate producers to alter their behavior. This can alsobe realization of the environmental objective.But as far as the suitability of domestic measures is concerned, the Court has repeatedly held thatMember States should have a relatively wide discretion in the choice of the appropriate measures andthat the test applied by the Court is aimed mainly at eliminating obviously inappropriate measures. TheCourt will assess whether there is an obvious and reasonable link between the measure used and the
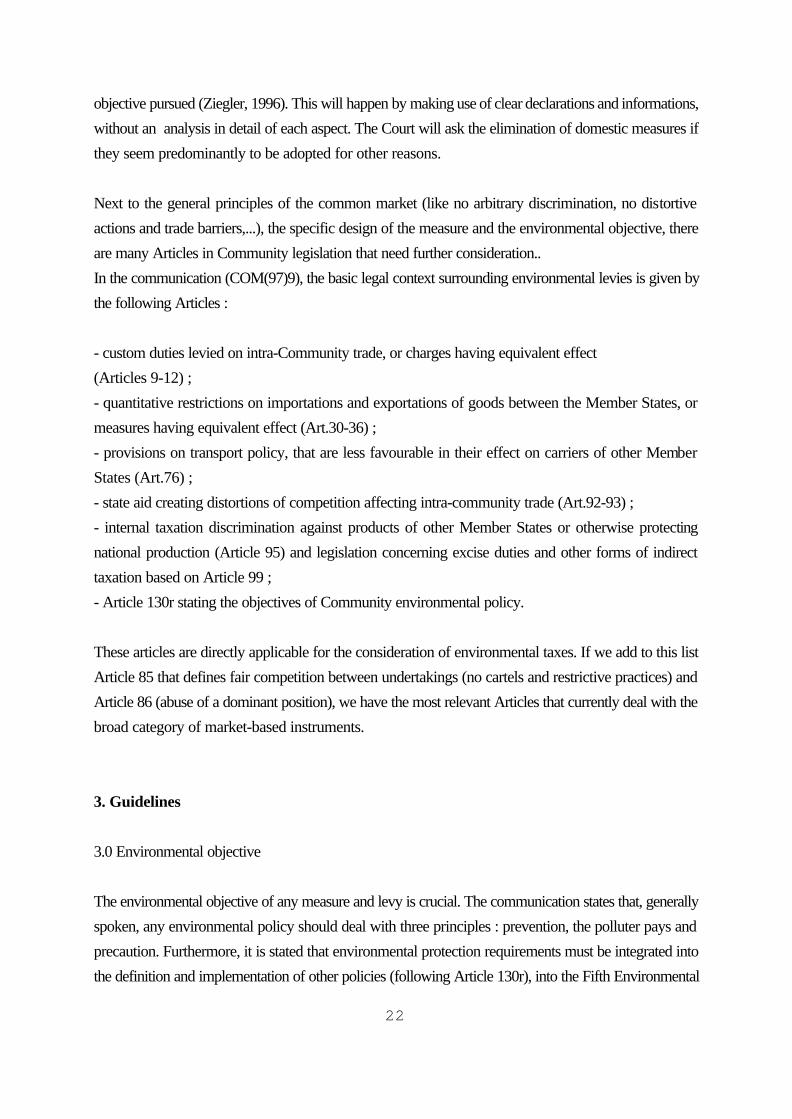
22
objective pursued (Ziegler, 1996). This will happen by making use of clear declarations and informations,without an analysis in detail of each aspect. The Court will ask the elimination of domestic measures ifthey seem predominantly to be adopted for other reasons.
Next to the general principles of the common market (like no arbitrary discrimination, no distortiveactions and trade barriers,...), the specific design of the measure and the environmental objective, thereare many Articles in Community legislation that need further consideration..In the communication (COM(97)9), the basic legal context surrounding environmental levies is given bythe following Articles :
- custom duties levied on intra-Community trade, or charges having equivalent effect(Articles 9-12) ;- quantitative restrictions on importations and exportations of goods between the Member States, ormeasures having equivalent effect (Art.30-36) ;- provisions on transport policy, that are less favourable in their effect on carriers of other MemberStates (Art.76) ;- state aid creating distortions of competition affecting intra-community trade (Art.92-93) ;- internal taxation discrimination against products of other Member States or otherwise protectingnational production (Article 95) and legislation concerning excise duties and other forms of indirecttaxation based on Article 99 ;- Article 130r stating the objectives of Community environmental policy.
These articles are directly applicable for the consideration of environmental taxes. If we add to this listArticle 85 that defines fair competition between undertakings (no cartels and restrictive practices) andArticle 86 (abuse of a dominant position), we have the most relevant Articles that currently deal with thebroad category of market-based instruments.
3. Guidelines
3.0 Environmental objective
The environmental objective of any measure and levy is crucial. The communication states that, generallyspoken, any environmental policy should deal with three principles : prevention, the polluter pays andprecaution. Furthermore, it is stated that environmental protection requirements must be integrated intothe definition and implementation of other policies (following Article 130r), into the Fifth Environmental
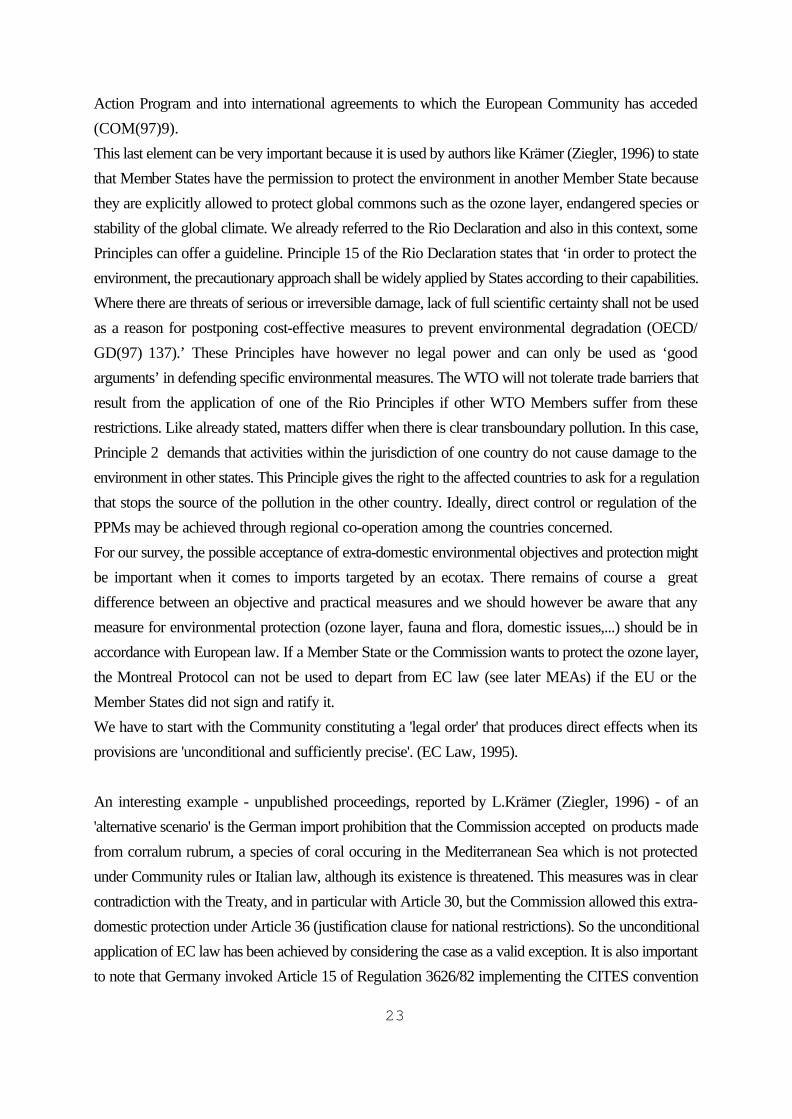
23
Action Program and into international agreements to which the European Community has acceded(COM(97)9).This last element can be very important because it is used by authors like Krämer (Ziegler, 1996) to statethat Member States have the permission to protect the environment in another Member State becausethey are explicitly allowed to protect global commons such as the ozone layer, endangered species orstability of the global climate. We already referred to the Rio Declaration and also in this context, somePrinciples can offer a guideline. Principle 15 of the Rio Declaration states that ‘in order to protect theenvironment, the precautionary approach shall be widely applied by States according to their capabilities.Where there are threats of serious or irreversible damage, lack of full scientific certainty shall not be usedas a reason for postponing cost-effective measures to prevent environmental degradation (OECD/GD(97) 137).’ These Principles have however no legal power and can only be used as ‘goodarguments’ in defending specific environmental measures. The WTO will not tolerate trade barriers thatresult from the application of one of the Rio Principles if other WTO Members suffer from theserestrictions. Like already stated, matters differ when there is clear transboundary pollution. In this case,Principle 2 demands that activities within the jurisdiction of one country do not cause damage to theenvironment in other states. This Principle gives the right to the affected countries to ask for a regulationthat stops the source of the pollution in the other country. Ideally, direct control or regulation of thePPMs may be achieved through regional co-operation among the countries concerned. For our survey, the possible acceptance of extra-domestic environmental objectives and protection mightbe important when it comes to imports targeted by an ecotax. There remains of course a greatdifference between an objective and practical measures and we should however be aware that anymeasure for environmental protection (ozone layer, fauna and flora, domestic issues,...) should be inaccordance with European law. If a Member State or the Commission wants to protect the ozone layer,the Montreal Protocol can not be used to depart from EC law (see later MEAs) if the EU or theMember States did not sign and ratify it.We have to start with the Community constituting a 'legal order' that produces direct effects when itsprovisions are 'unconditional and sufficiently precise'. (EC Law, 1995).
An interesting example - unpublished proceedings, reported by L.Krämer (Ziegler, 1996) - of an'alternative scenario' is the German import prohibition that the Commission accepted on products madefrom corralum rubrum, a species of coral occuring in the Mediterranean Sea which is not protectedunder Community rules or Italian law, although its existence is threatened. This measures was in clearcontradiction with the Treaty, and in particular with Article 30, but the Commission allowed this extra-domestic protection under Article 36 (justification clause for national restrictions). So the unconditionalapplication of EC law has been achieved by considering the case as a valid exception. It is also importantto note that Germany invoked Article 15 of Regulation 3626/82 implementing the CITES convention
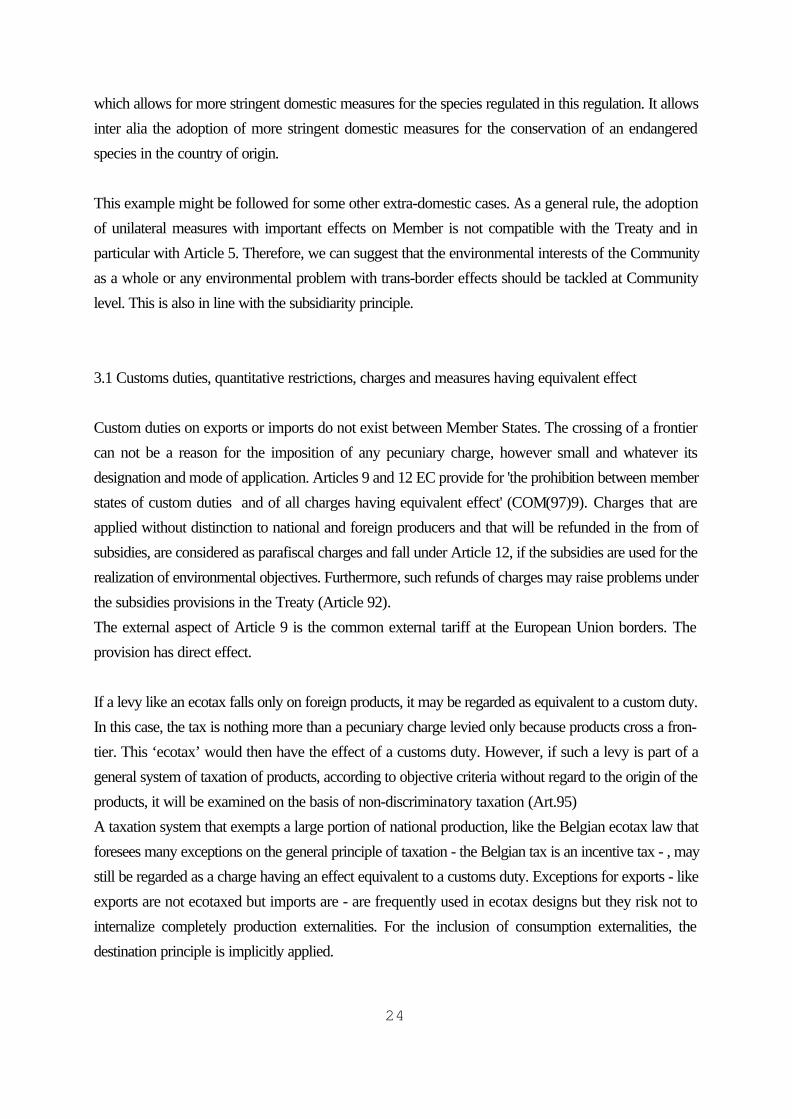
24
which allows for more stringent domestic measures for the species regulated in this regulation. It allowsinter alia the adoption of more stringent domestic measures for the conservation of an endangeredspecies in the country of origin.
This example might be followed for some other extra-domestic cases. As a general rule, the adoptionof unilateral measures with important effects on Member is not compatible with the Treaty and inparticular with Article 5. Therefore, we can suggest that the environmental interests of the Communityas a whole or any environmental problem with trans-border effects should be tackled at Communitylevel. This is also in line with the subsidiarity principle.
3.1 Customs duties, quantitative restrictions, charges and measures having equivalent effect
Custom duties on exports or imports do not exist between Member States. The crossing of a frontiercan not be a reason for the imposition of any pecuniary charge, however small and whatever itsdesignation and mode of application. Articles 9 and 12 EC provide for 'the prohibition between memberstates of custom duties and of all charges having equivalent effect' (COM(97)9). Charges that areapplied without distinction to national and foreign producers and that will be refunded in the from ofsubsidies, are considered as parafiscal charges and fall under Article 12, if the subsidies are used for therealization of environmental objectives. Furthermore, such refunds of charges may raise problems underthe subsidies provisions in the Treaty (Article 92).The external aspect of Article 9 is the common external tariff at the European Union borders. Theprovision has direct effect. If a levy like an ecotax falls only on foreign products, it may be regarded as equivalent to a custom duty.In this case, the tax is nothing more than a pecuniary charge levied only because products cross a fron-tier. This ‘ecotax’ would then have the effect of a customs duty. However, if such a levy is part of ageneral system of taxation of products, according to objective criteria without regard to the origin of theproducts, it will be examined on the basis of non-discriminatory taxation (Art.95)A taxation system that exempts a large portion of national production, like the Belgian ecotax law thatforesees many exceptions on the general principle of taxation - the Belgian tax is an incentive tax - , maystill be regarded as a charge having an effect equivalent to a customs duty. Exceptions for exports - likeexports are not ecotaxed but imports are - are frequently used in ecotax designs but they risk not tointernalize completely production externalities. For the inclusion of consumption externalities, thedestination principle is implicitly applied.
25
In this context, the Court has made it clear that it may also be necessary to take into account theappropriation of the revenue from the levy. A levy applying to products of other Member States anddomestic products according to the same criteria can therefore constitute a charge having an effectequivalent to customs duties if the revenue is used to fully compensate domestic producers of the taxedproducts. However, using the revenue to support the consumers of the taxed products would not fall inthis category, but would have to be judged according to state aid law (COM(97)9).
The Commission includes in the legal context of its communication the Articles 30 and 36 (the Articlethat foresees exceptions) but does not work them out in detail, probably because the communicationonly deals with environmental levies and not with general green policy frameworks. Tariffs or customsare by nature not considered as quantitative restrictions like quota. But an ecotax policy can includemany conditions and prescriptions of which some fall under the latter category, like take-back programs. In order to make this analysis applicable to general policy packages, we include the two mentionedArticles in this overview.
Article 30 is striking for its brevity : Quantitative restrictions on imports and all measures havingequivalent effect shall, without prejudice to the following provisions, be prohibited between MemberStates (ECLaw, 1995). Trade restrictions like quota are more prejudicial to free trade than tariffs orcustoms because they impose an absolute ban on trade beyond the stipulated ceilings of imports, ratherthan rendering importations more expensive.
Article 34 applies a similarly worded prohibition to quantitative restrictions on exports. This Article canbecome relevant in situations where national authorities want to limit exports of certain wastes to ensurethe profitability of local recycling plants or regenerating industries. Often, measures of this kind arejustified by the authorities with the need to eliminate circumvention opportunity for domestic recyclingand process regulations.
The application of Article 30 as an instrument for the removal of a wide range of hindrances to the freemovement of goods is attributable to its second limb, namely the 'measure having equivalent effect' (oftenabbreviated to the MEQR).In this evolution, the Court played a major role through a long line of case law.Two basic interpretations for the classification as a measure having equivalent effect were possible. Likein most trade agreements, the non-discrimination principle was used as a 'national treatment' requirement.This means that domestic measures have to be applied without making a distinction between importedand domestic products. If equally applicable measures have very disparate effects on domestic andimported goods, the domestic measure could be unlawful.
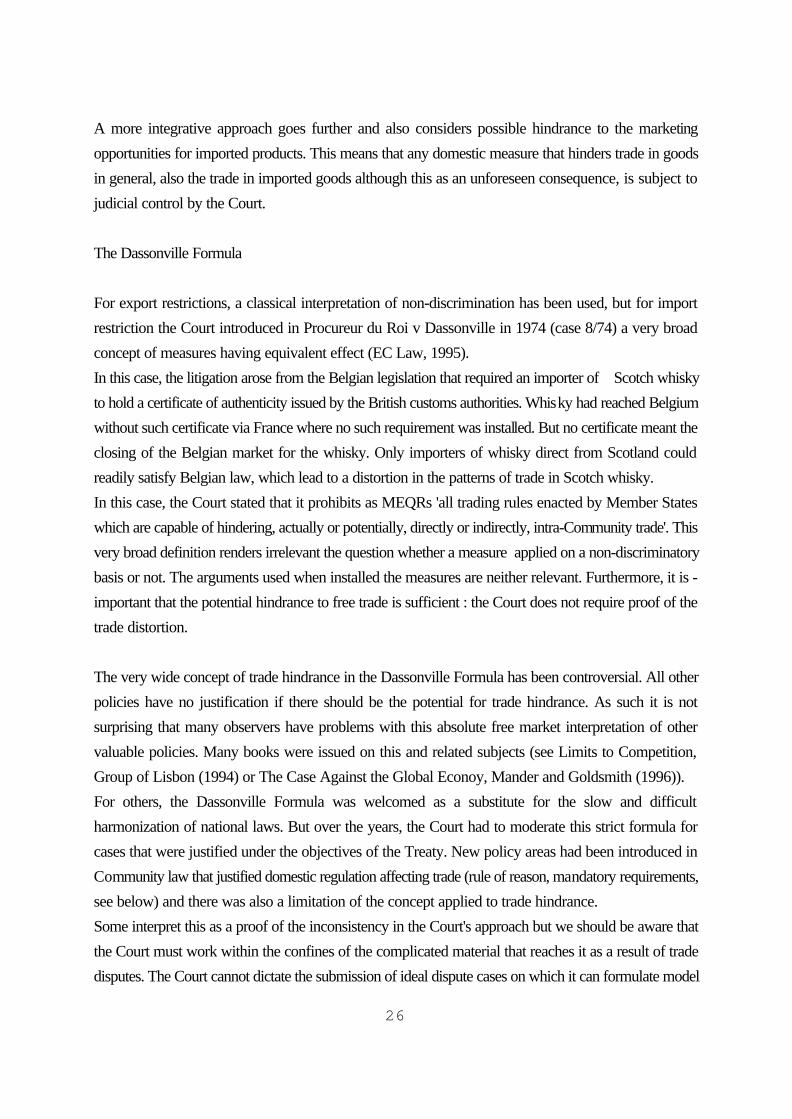
26
A more integrative approach goes further and also considers possible hindrance to the marketingopportunities for imported products. This means that any domestic measure that hinders trade in goodsin general, also the trade in imported goods although this as an unforeseen consequence, is subject tojudicial control by the Court.
The Dassonville Formula
For export restrictions, a classical interpretation of non-discrimination has been used, but for importrestriction the Court introduced in Procureur du Roi v Dassonville in 1974 (case 8/74) a very broadconcept of measures having equivalent effect (EC Law, 1995).In this case, the litigation arose from the Belgian legislation that required an importer of Scotch whiskyto hold a certificate of authenticity issued by the British customs authorities. Whisky had reached Belgiumwithout such certificate via France where no such requirement was installed. But no certificate meant theclosing of the Belgian market for the whisky. Only importers of whisky direct from Scotland couldreadily satisfy Belgian law, which lead to a distortion in the patterns of trade in Scotch whisky.In this case, the Court stated that it prohibits as MEQRs 'all trading rules enacted by Member Stateswhich are capable of hindering, actually or potentially, directly or indirectly, intra-Community trade'. Thisvery broad definition renders irrelevant the question whether a measure applied on a non-discriminatorybasis or not. The arguments used when installed the measures are neither relevant. Furthermore, it is -important that the potential hindrance to free trade is sufficient : the Court does not require proof of thetrade distortion.
The very wide concept of trade hindrance in the Dassonville Formula has been controversial. All otherpolicies have no justification if there should be the potential for trade hindrance. As such it is notsurprising that many observers have problems with this absolute free market interpretation of othervaluable policies. Many books were issued on this and related subjects (see Limits to Competition,Group of Lisbon (1994) or The Case Against the Global Econoy, Mander and Goldsmith (1996)).For others, the Dassonville Formula was welcomed as a substitute for the slow and difficultharmonization of national laws. But over the years, the Court had to moderate this strict formula forcases that were justified under the objectives of the Treaty. New policy areas had been introduced inCommunity law that justified domestic regulation affecting trade (rule of reason, mandatory requirements,see below) and there was also a limitation of the concept applied to trade hindrance.Some interpret this as a proof of the inconsistency in the Court's approach but we should be aware thatthe Court must work within the confines of the complicated material that reaches it as a result of tradedisputes. The Court cannot dictate the submission of ideal dispute cases on which it can formulate model
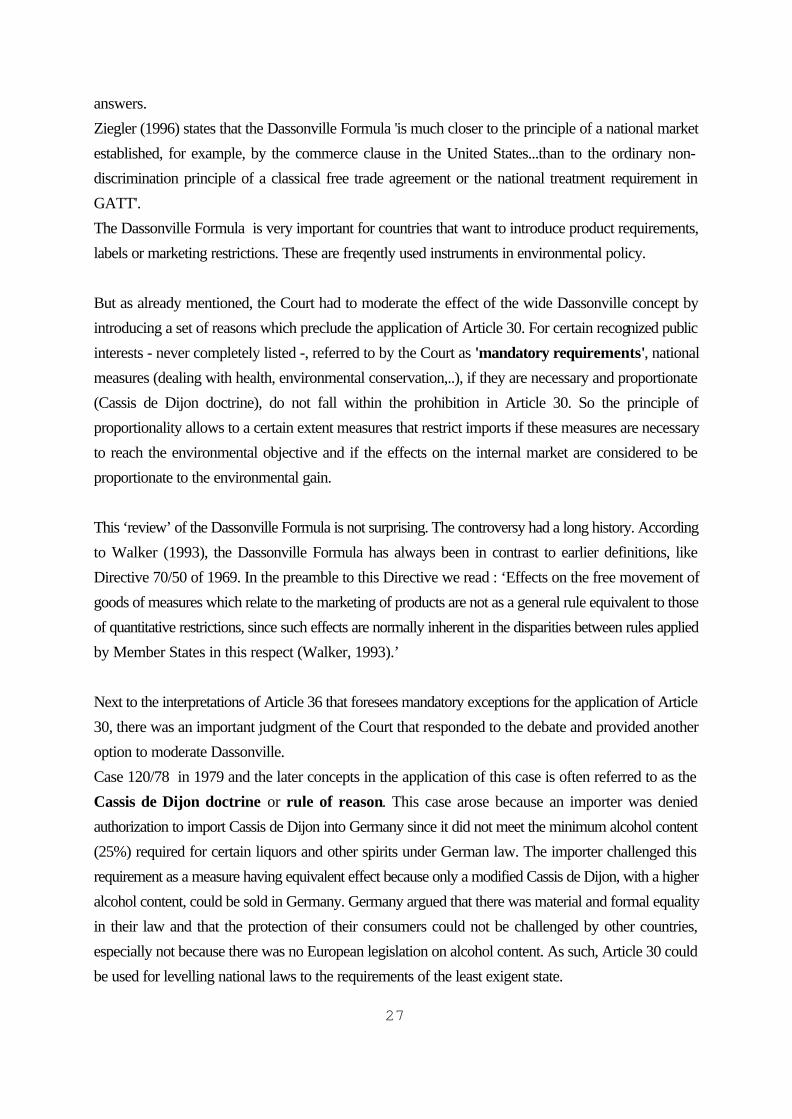
27
answers.Ziegler (1996) states that the Dassonville Formula 'is much closer to the principle of a national marketestablished, for example, by the commerce clause in the United States...than to the ordinary non-discrimination principle of a classical free trade agreement or the national treatment requirement inGATT'.The Dassonville Formula is very important for countries that want to introduce product requirements,labels or marketing restrictions. These are freqently used instruments in environmental policy.
But as already mentioned, the Court had to moderate the effect of the wide Dassonville concept byintroducing a set of reasons which preclude the application of Article 30. For certain recognized publicinterests - never completely listed -, referred to by the Court as 'mandatory requirements', nationalmeasures (dealing with health, environmental conservation,..), if they are necessary and proportionate(Cassis de Dijon doctrine), do not fall within the prohibition in Article 30. So the principle ofproportionality allows to a certain extent measures that restrict imports if these measures are necessaryto reach the environmental objective and if the effects on the internal market are considered to beproportionate to the environmental gain.
This ‘review’ of the Dassonville Formula is not surprising. The controversy had a long history. Accordingto Walker (1993), the Dassonville Formula has always been in contrast to earlier definitions, likeDirective 70/50 of 1969. In the preamble to this Directive we read : ‘Effects on the free movement ofgoods of measures which relate to the marketing of products are not as a general rule equivalent to thoseof quantitative restrictions, since such effects are normally inherent in the disparities between rules appliedby Member States in this respect (Walker, 1993).’
Next to the interpretations of Article 36 that foresees mandatory exceptions for the application of Article30, there was an important judgment of the Court that responded to the debate and provided anotheroption to moderate Dassonville.Case 120/78 in 1979 and the later concepts in the application of this case is often referred to as theCassis de Dijon doctrine or rule of reason. This case arose because an importer was deniedauthorization to import Cassis de Dijon into Germany since it did not meet the minimum alcohol content(25%) required for certain liquors and other spirits under German law. The importer challenged thisrequirement as a measure having equivalent effect because only a modified Cassis de Dijon, with a higheralcohol content, could be sold in Germany. Germany argued that there was material and formal equalityin their law and that the protection of their consumers could not be challenged by other countries,especially not because there was no European legislation on alcohol content. As such, Article 30 couldbe used for levelling national laws to the requirements of the least exigent state.
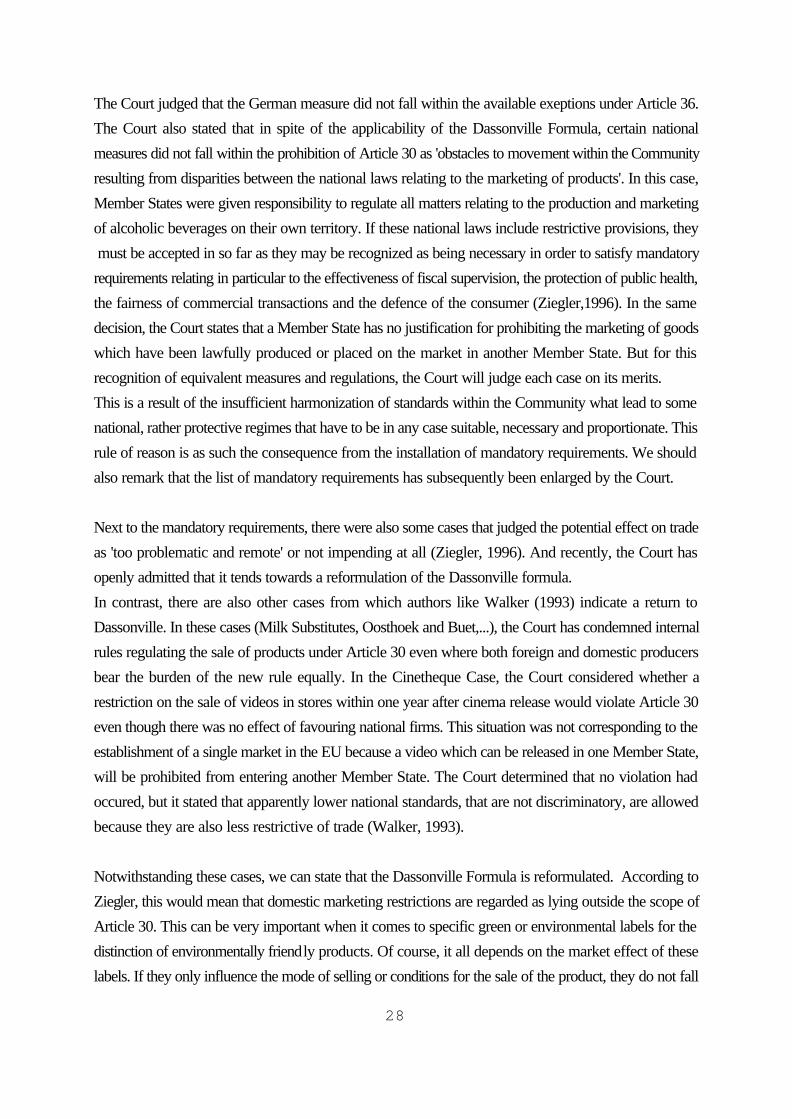
28
The Court judged that the German measure did not fall within the available exeptions under Article 36.The Court also stated that in spite of the applicability of the Dassonville Formula, certain nationalmeasures did not fall within the prohibition of Article 30 as 'obstacles to movement within the Communityresulting from disparities between the national laws relating to the marketing of products'. In this case,Member States were given responsibility to regulate all matters relating to the production and marketingof alcoholic beverages on their own territory. If these national laws include restrictive provisions, they must be accepted in so far as they may be recognized as being necessary in order to satisfy mandatoryrequirements relating in particular to the effectiveness of fiscal supervision, the protection of public health,the fairness of commercial transactions and the defence of the consumer (Ziegler,1996). In the samedecision, the Court states that a Member State has no justification for prohibiting the marketing of goodswhich have been lawfully produced or placed on the market in another Member State. But for thisrecognition of equivalent measures and regulations, the Court will judge each case on its merits.This is a result of the insufficient harmonization of standards within the Community what lead to somenational, rather protective regimes that have to be in any case suitable, necessary and proportionate. Thisrule of reason is as such the consequence from the installation of mandatory requirements. We shouldalso remark that the list of mandatory requirements has subsequently been enlarged by the Court.
Next to the mandatory requirements, there were also some cases that judged the potential effect on tradeas 'too problematic and remote' or not impending at all (Ziegler, 1996). And recently, the Court hasopenly admitted that it tends towards a reformulation of the Dassonville formula.In contrast, there are also other cases from which authors like Walker (1993) indicate a return toDassonville. In these cases (Milk Substitutes, Oosthoek and Buet,...), the Court has condemned internalrules regulating the sale of products under Article 30 even where both foreign and domestic producersbear the burden of the new rule equally. In the Cinetheque Case, the Court considered whether arestriction on the sale of videos in stores within one year after cinema release would violate Article 30even though there was no effect of favouring national firms. This situation was not corresponding to theestablishment of a single market in the EU because a video which can be released in one Member State,will be prohibited from entering another Member State. The Court determined that no violation hadoccured, but it stated that apparently lower national standards, that are not discriminatory, are allowedbecause they are also less restrictive of trade (Walker, 1993).
Notwithstanding these cases, we can state that the Dassonville Formula is reformulated. According toZiegler, this would mean that domestic marketing restrictions are regarded as lying outside the scope ofArticle 30. This can be very important when it comes to specific green or environmental labels for thedistinction of environmentally friendly products. Of course, it all depends on the market effect of theselabels. If they only influence the mode of selling or conditions for the sale of the product, they do not fall
29
anymore under the Dassonville formula. If the product declaration however would partition the commonmarket into separate segments by requiring different packagings for different countries, the measure willfall under Article 30. And there is in many cases only a thin line between product information strategiesand fragmenting marketing conditions.If, for example, we reconsider the case of an ecotax linked to other specifications (labels, take-backprogrammes) where the levy regulation requires an economic operator to alter the form, size ordesignation of the product, or the label under which the product is lawfully marketed in another MemberStates, and if this modification is not necessary for the proper functioning and objective of the levy, therequired modification may be assessed under Article 30.Technical requirements may not give to certain traders the ability to affect the imports of the productsconcerned, whereas others are prevented from doing so.In communication COM(97)9, we also find that the Court has ruled that a measure, such as a depositcharged per bottle, as part of a recycling system for bottles, cannot itself qualify as a fiscal measure, andmay therefore also be examined under Article 30.
The classic exception clause to Article 30 is Article 36. Like in the GATT/WTO and other internationalagreements, the exceptional non-application of certain treaty provisions is clairly defined and limited tosome specific cases. For the EU, the approximation of laws is a permanent evolution and will make onthe long term the application of Article 36 more and more limited. National measures are only legitimateas long as the Community itself has not taken comprehensive measures to avoid the inherent dangers.The areas of Article 36 deal with public morality, public policy or public security, with the protectionof health and life of humans, animals or plants, with the protection of national treasures and the protectionof industrial and commercial property.Not every area has its relevance for environmental policy but a good example is the influence ofpesticides on health and the environment. In several cases the Court had to decide on the lawfulness oftrade prohibitions and restrictions on pesticides or pesticide-treated products. In case 125/88 CriminalProceedings against Nijdam (Ziegler, 1996), the Court stated that Member States were responsible fortaking the necessary actions in fields where there was no comprehensive harmonization. The Dutchauthorities had begun criminal proceedings against Mr.Nijman because he had been found in possessionof a substance that was prohibited because of the dangereous effects it could have on the health of theusers and the environment.The level of protection necessary for safeguarding public health is in principle to be set by the MemberStates. The Dutch prohibition was therefore lawful under Article 36.
Another field of Article 36 that deserves our attention is the protection of wild flora and fauna. Afteryears of controversy, the Community introduced in 1983 its Common Fishery Policy (Barnes and
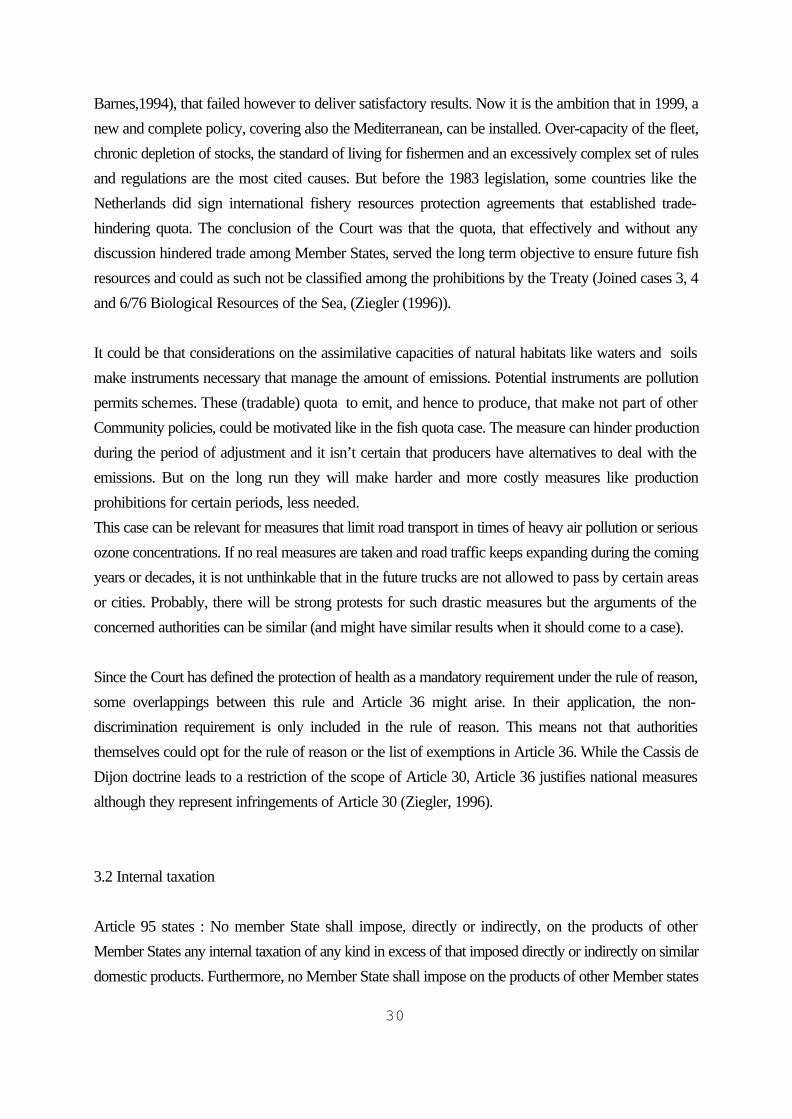
30
Barnes,1994), that failed however to deliver satisfactory results. Now it is the ambition that in 1999, anew and complete policy, covering also the Mediterranean, can be installed. Over-capacity of the fleet,chronic depletion of stocks, the standard of living for fishermen and an excessively complex set of rulesand regulations are the most cited causes. But before the 1983 legislation, some countries like theNetherlands did sign international fishery resources protection agreements that established trade-hindering quota. The conclusion of the Court was that the quota, that effectively and without anydiscussion hindered trade among Member States, served the long term objective to ensure future fishresources and could as such not be classified among the prohibitions by the Treaty (Joined cases 3, 4and 6/76 Biological Resources of the Sea, (Ziegler (1996)).
It could be that considerations on the assimilative capacities of natural habitats like waters and soilsmake instruments necessary that manage the amount of emissions. Potential instruments are pollutionpermits schemes. These (tradable) quota to emit, and hence to produce, that make not part of otherCommunity policies, could be motivated like in the fish quota case. The measure can hinder productionduring the period of adjustment and it isn’t certain that producers have alternatives to deal with theemissions. But on the long run they will make harder and more costly measures like productionprohibitions for certain periods, less needed.This case can be relevant for measures that limit road transport in times of heavy air pollution or seriousozone concentrations. If no real measures are taken and road traffic keeps expanding during the comingyears or decades, it is not unthinkable that in the future trucks are not allowed to pass by certain areasor cities. Probably, there will be strong protests for such drastic measures but the arguments of theconcerned authorities can be similar (and might have similar results when it should come to a case).
Since the Court has defined the protection of health as a mandatory requirement under the rule of reason,some overlappings between this rule and Article 36 might arise. In their application, the non-discrimination requirement is only included in the rule of reason. This means not that authoritiesthemselves could opt for the rule of reason or the list of exemptions in Article 36. While the Cassis deDijon doctrine leads to a restriction of the scope of Article 30, Article 36 justifies national measuresalthough they represent infringements of Article 30 (Ziegler, 1996).
3.2 Internal taxation
Article 95 states : No member State shall impose, directly or indirectly, on the products of otherMember States any internal taxation of any kind in excess of that imposed directly or indirectly on similardomestic products. Furthermore, no Member State shall impose on the products of other Member states
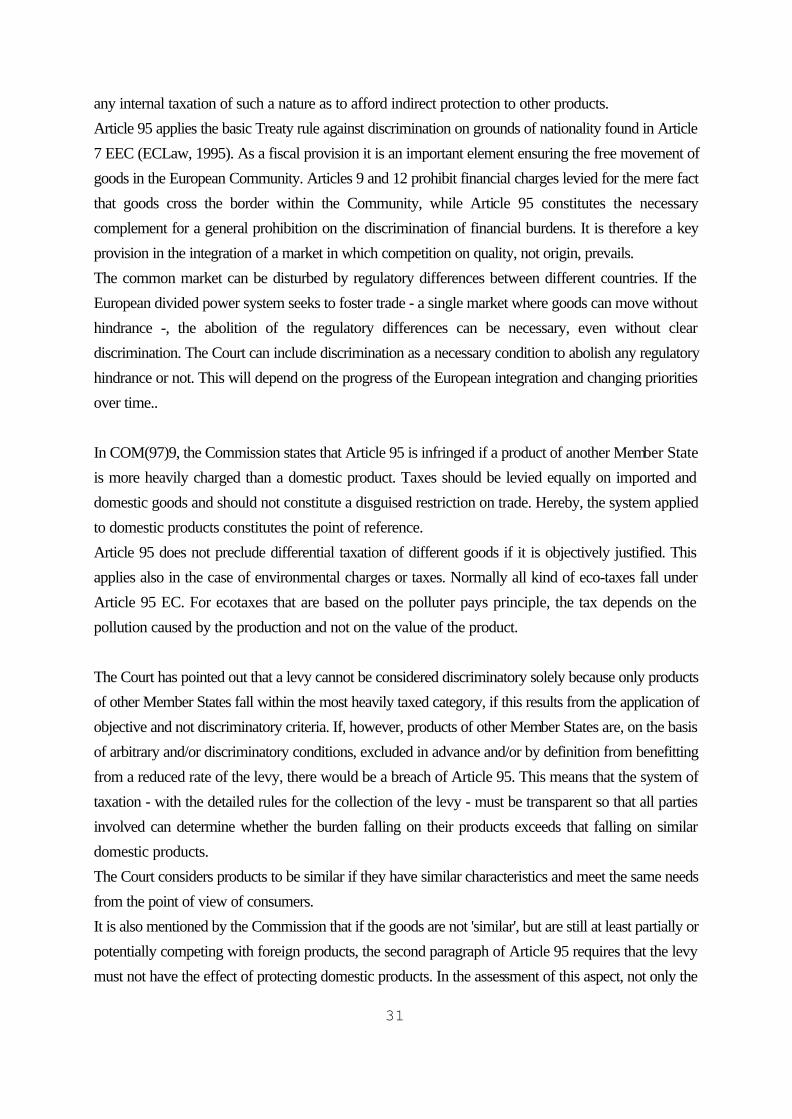
31
any internal taxation of such a nature as to afford indirect protection to other products.Article 95 applies the basic Treaty rule against discrimination on grounds of nationality found in Article7 EEC (ECLaw, 1995). As a fiscal provision it is an important element ensuring the free movement ofgoods in the European Community. Articles 9 and 12 prohibit financial charges levied for the mere factthat goods cross the border within the Community, while Article 95 constitutes the necessarycomplement for a general prohibition on the discrimination of financial burdens. It is therefore a keyprovision in the integration of a market in which competition on quality, not origin, prevails.The common market can be disturbed by regulatory differences between different countries. If theEuropean divided power system seeks to foster trade - a single market where goods can move withouthindrance -, the abolition of the regulatory differences can be necessary, even without cleardiscrimination. The Court can include discrimination as a necessary condition to abolish any regulatoryhindrance or not. This will depend on the progress of the European integration and changing prioritiesover time..
In COM(97)9, the Commission states that Article 95 is infringed if a product of another Member Stateis more heavily charged than a domestic product. Taxes should be levied equally on imported anddomestic goods and should not constitute a disguised restriction on trade. Hereby, the system appliedto domestic products constitutes the point of reference.Article 95 does not preclude differential taxation of different goods if it is objectively justified. Thisapplies also in the case of environmental charges or taxes. Normally all kind of eco-taxes fall underArticle 95 EC. For ecotaxes that are based on the polluter pays principle, the tax depends on thepollution caused by the production and not on the value of the product.
The Court has pointed out that a levy cannot be considered discriminatory solely because only productsof other Member States fall within the most heavily taxed category, if this results from the application ofobjective and not discriminatory criteria. If, however, products of other Member States are, on the basisof arbitrary and/or discriminatory conditions, excluded in advance and/or by definition from benefittingfrom a reduced rate of the levy, there would be a breach of Article 95. This means that the system oftaxation - with the detailed rules for the collection of the levy - must be transparent so that all partiesinvolved can determine whether the burden falling on their products exceeds that falling on similardomestic products.The Court considers products to be similar if they have similar characteristics and meet the same needsfrom the point of view of consumers.It is also mentioned by the Commission that if the goods are not 'similar', but are still at least partially orpotentially competing with foreign products, the second paragraph of Article 95 requires that the levymust not have the effect of protecting domestic products. In the assessment of this aspect, not only the
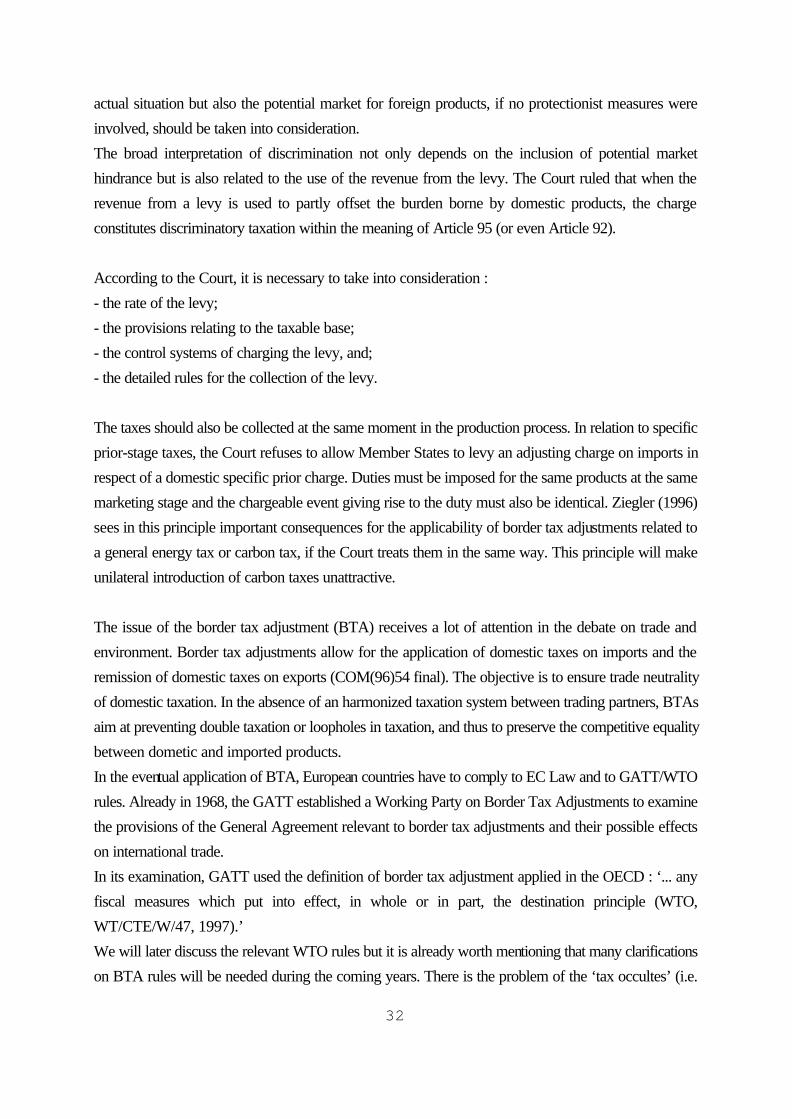
32
actual situation but also the potential market for foreign products, if no protectionist measures wereinvolved, should be taken into consideration.The broad interpretation of discrimination not only depends on the inclusion of potential markethindrance but is also related to the use of the revenue from the levy. The Court ruled that when therevenue from a levy is used to partly offset the burden borne by domestic products, the chargeconstitutes discriminatory taxation within the meaning of Article 95 (or even Article 92).
According to the Court, it is necessary to take into consideration :- the rate of the levy;- the provisions relating to the taxable base;- the control systems of charging the levy, and;- the detailed rules for the collection of the levy.
The taxes should also be collected at the same moment in the production process. In relation to specificprior-stage taxes, the Court refuses to allow Member States to levy an adjusting charge on imports inrespect of a domestic specific prior charge. Duties must be imposed for the same products at the samemarketing stage and the chargeable event giving rise to the duty must also be identical. Ziegler (1996)sees in this principle important consequences for the applicability of border tax adjustments related toa general energy tax or carbon tax, if the Court treats them in the same way. This principle will makeunilateral introduction of carbon taxes unattractive.
The issue of the border tax adjustment (BTA) receives a lot of attention in the debate on trade andenvironment. Border tax adjustments allow for the application of domestic taxes on imports and theremission of domestic taxes on exports (COM(96)54 final). The objective is to ensure trade neutralityof domestic taxation. In the absence of an harmonized taxation system between trading partners, BTAsaim at preventing double taxation or loopholes in taxation, and thus to preserve the competitive equalitybetween dometic and imported products.In the eventual application of BTA, European countries have to comply to EC Law and to GATT/WTOrules. Already in 1968, the GATT established a Working Party on Border Tax Adjustments to examinethe provisions of the General Agreement relevant to border tax adjustments and their possible effectson international trade.In its examination, GATT used the definition of border tax adjustment applied in the OECD : ‘... anyfiscal measures which put into effect, in whole or in part, the destination principle (WTO,WT/CTE/W/47, 1997).’We will later discuss the relevant WTO rules but it is already worth mentioning that many clarificationson BTA rules will be needed during the coming years. There is the problem of the ‘tax occultes’ (i.e.
33
taxes on capital equipment, auxiliary materials and services used in the production of the taxable good,including taxes on energy), the asymmetrical elaboration of BTA rules for imports and for exports, andthe different position on BTA for taxes on products and on production processes.
Finding the balanceIt should also be noted that Article 95 does not give the Community a right to judge whether a levy ina Member State is excessively high in relation to its environmental objective. Again, the criteria ofproportionality (causal link, necessary, in proportion) need to be applied for the environmentaljustification of specific measures.Balancing the gain for the environment with the potential impact on the single market should only happenfor administrative control measures of the levy. Next to the common market impact of the environmentalobjectives, the required environmental justification for differential or for equal taxation but with someindirect discrimination against foreign producers, may take into account e.g. the characteristics andconsequences of pollutants, the mode of production or the effects of a product after its use such as thepossibilities for its recycling. This broad perspective is depending on specific conditions in order not toraise issues with regard to the territoriality principle and the sovereignty of Member States to decide theirown level of environmental protection. A famous similar case in GATT/WTO was the US restriction onimports of tuna (Walker, 1993).
Ziegler (1996) gives as an example Case 21/79 Commission versus Italy where the Court wasconfronted with an Italian measure favouring oil produced from recycled waste oil. This type of oil wasgranted a tax reduction which did not apply to normal oil, although fresh and regenerated oil could notbe distinguished. This tax differentiation was justified, among other reasons, by environmentalconsiderations. The Court held that Italy was permitted to distinguish between 'physically' identicalproducts on the grounds of production process and raw materials used. But as the tax reduction,however, applied only to the domestic production (imports were not eligible for the tax reduction) it wasconsidered as a discriminatory measure prohibited under Article 95.
To conclude, Article 95 has been interpreted very broadly and a very strict motivation is required fora de facto differential treatment that results from national taxation initiatives. The Court will always lookbehind the measures to analyse whether they constitute disguised protection. The effects of the proposedmeasures will be evaluated and can be a motivation for the Court to require other, less protectionistmeasures.
3.3 The harmonization of indirect taxation (Article 99)
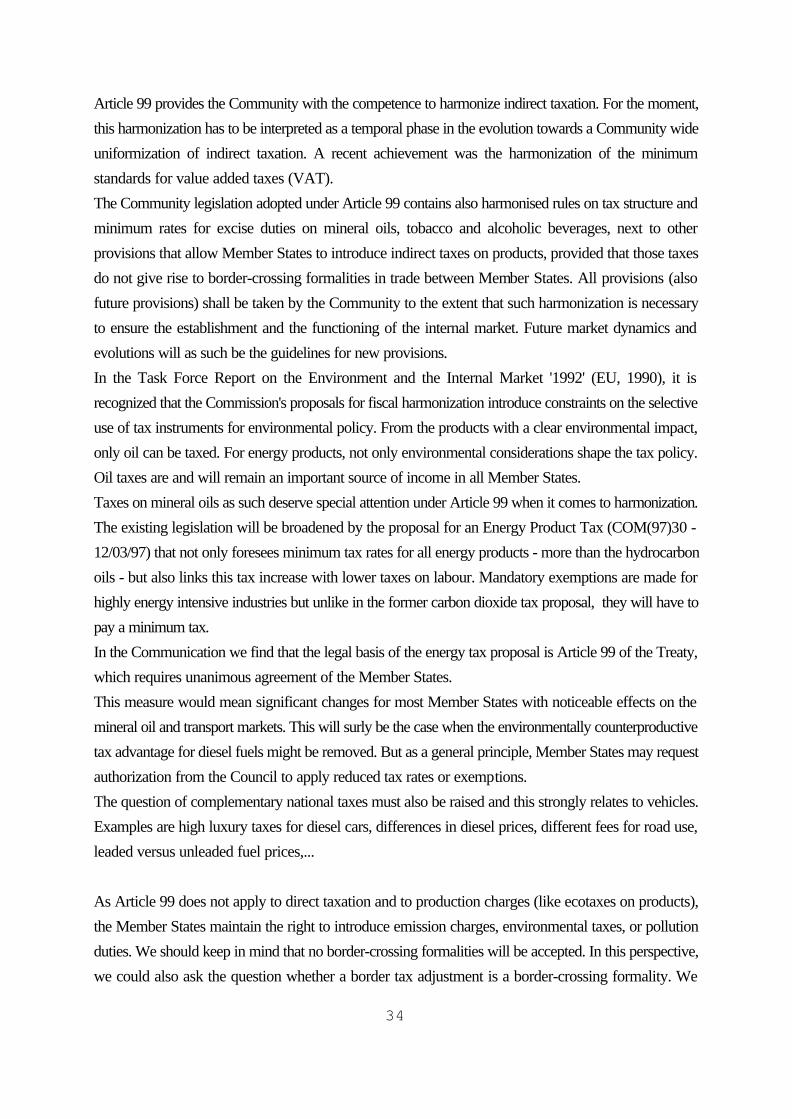
34
Article 99 provides the Community with the competence to harmonize indirect taxation. For the moment,this harmonization has to be interpreted as a temporal phase in the evolution towards a Community wideuniformization of indirect taxation. A recent achievement was the harmonization of the minimumstandards for value added taxes (VAT).The Community legislation adopted under Article 99 contains also harmonised rules on tax structure andminimum rates for excise duties on mineral oils, tobacco and alcoholic beverages, next to otherprovisions that allow Member States to introduce indirect taxes on products, provided that those taxesdo not give rise to border-crossing formalities in trade between Member States. All provisions (alsofuture provisions) shall be taken by the Community to the extent that such harmonization is necessaryto ensure the establishment and the functioning of the internal market. Future market dynamics andevolutions will as such be the guidelines for new provisions.In the Task Force Report on the Environment and the Internal Market '1992' (EU, 1990), it isrecognized that the Commission's proposals for fiscal harmonization introduce constraints on the selectiveuse of tax instruments for environmental policy. From the products with a clear environmental impact,only oil can be taxed. For energy products, not only environmental considerations shape the tax policy.Oil taxes are and will remain an important source of income in all Member States.Taxes on mineral oils as such deserve special attention under Article 99 when it comes to harmonization.The existing legislation will be broadened by the proposal for an Energy Product Tax (COM(97)30 -12/03/97) that not only foresees minimum tax rates for all energy products - more than the hydrocarbonoils - but also links this tax increase with lower taxes on labour. Mandatory exemptions are made forhighly energy intensive industries but unlike in the former carbon dioxide tax proposal, they will have topay a minimum tax.In the Communication we find that the legal basis of the energy tax proposal is Article 99 of the Treaty,which requires unanimous agreement of the Member States.This measure would mean significant changes for most Member States with noticeable effects on themineral oil and transport markets. This will surly be the case when the environmentally counterproductivetax advantage for diesel fuels might be removed. But as a general principle, Member States may requestauthorization from the Council to apply reduced tax rates or exemptions.The question of complementary national taxes must also be raised and this strongly relates to vehicles.Examples are high luxury taxes for diesel cars, differences in diesel prices, different fees for road use,leaded versus unleaded fuel prices,... As Article 99 does not apply to direct taxation and to production charges (like ecotaxes on products),the Member States maintain the right to introduce emission charges, environmental taxes, or pollutionduties. We should keep in mind that no border-crossing formalities will be accepted. In this perspective,we could also ask the question whether a border tax adjustment is a border-crossing formality. We
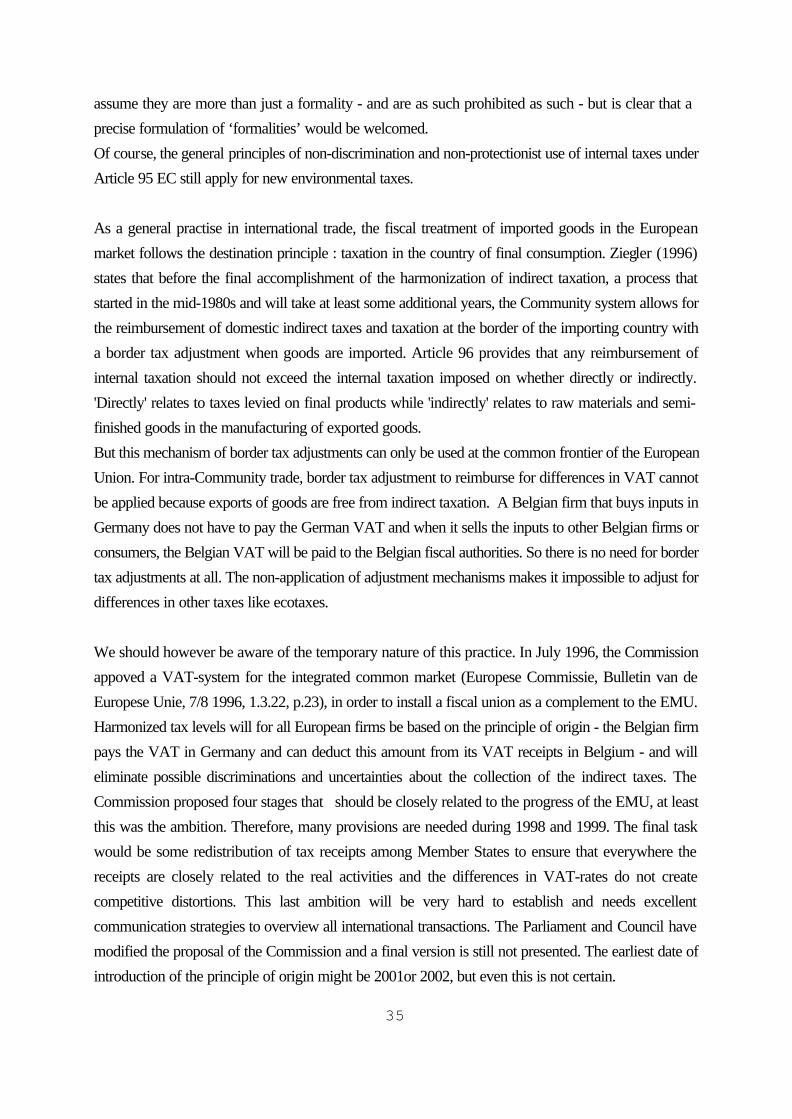
35
assume they are more than just a formality - and are as such prohibited as such - but is clear that a precise formulation of ‘formalities’ would be welcomed.Of course, the general principles of non-discrimination and non-protectionist use of internal taxes underArticle 95 EC still apply for new environmental taxes.
As a general practise in international trade, the fiscal treatment of imported goods in the Europeanmarket follows the destination principle : taxation in the country of final consumption. Ziegler (1996)states that before the final accomplishment of the harmonization of indirect taxation, a process thatstarted in the mid-1980s and will take at least some additional years, the Community system allows forthe reimbursement of domestic indirect taxes and taxation at the border of the importing country witha border tax adjustment when goods are imported. Article 96 provides that any reimbursement ofinternal taxation should not exceed the internal taxation imposed on whether directly or indirectly.'Directly' relates to taxes levied on final products while 'indirectly' relates to raw materials and semi-finished goods in the manufacturing of exported goods.But this mechanism of border tax adjustments can only be used at the common frontier of the EuropeanUnion. For intra-Community trade, border tax adjustment to reimburse for differences in VAT cannotbe applied because exports of goods are free from indirect taxation. A Belgian firm that buys inputs inGermany does not have to pay the German VAT and when it sells the inputs to other Belgian firms orconsumers, the Belgian VAT will be paid to the Belgian fiscal authorities. So there is no need for bordertax adjustments at all. The non-application of adjustment mechanisms makes it impossible to adjust fordifferences in other taxes like ecotaxes.
We should however be aware of the temporary nature of this practice. In July 1996, the Commissionappoved a VAT-system for the integrated common market (Europese Commissie, Bulletin van deEuropese Unie, 7/8 1996, 1.3.22, p.23), in order to install a fiscal union as a complement to the EMU.Harmonized tax levels will for all European firms be based on the principle of origin - the Belgian firmpays the VAT in Germany and can deduct this amount from its VAT receipts in Belgium - and willeliminate possible discriminations and uncertainties about the collection of the indirect taxes. TheCommission proposed four stages that should be closely related to the progress of the EMU, at leastthis was the ambition. Therefore, many provisions are needed during 1998 and 1999. The final taskwould be some redistribution of tax receipts among Member States to ensure that everywhere thereceipts are closely related to the real activities and the differences in VAT-rates do not createcompetitive distortions. This last ambition will be very hard to establish and needs excellentcommunication strategies to overview all international transactions. The Parliament and Council havemodified the proposal of the Commission and a final version is still not presented. The earliest date ofintroduction of the principle of origin might be 2001or 2002, but even this is not certain.
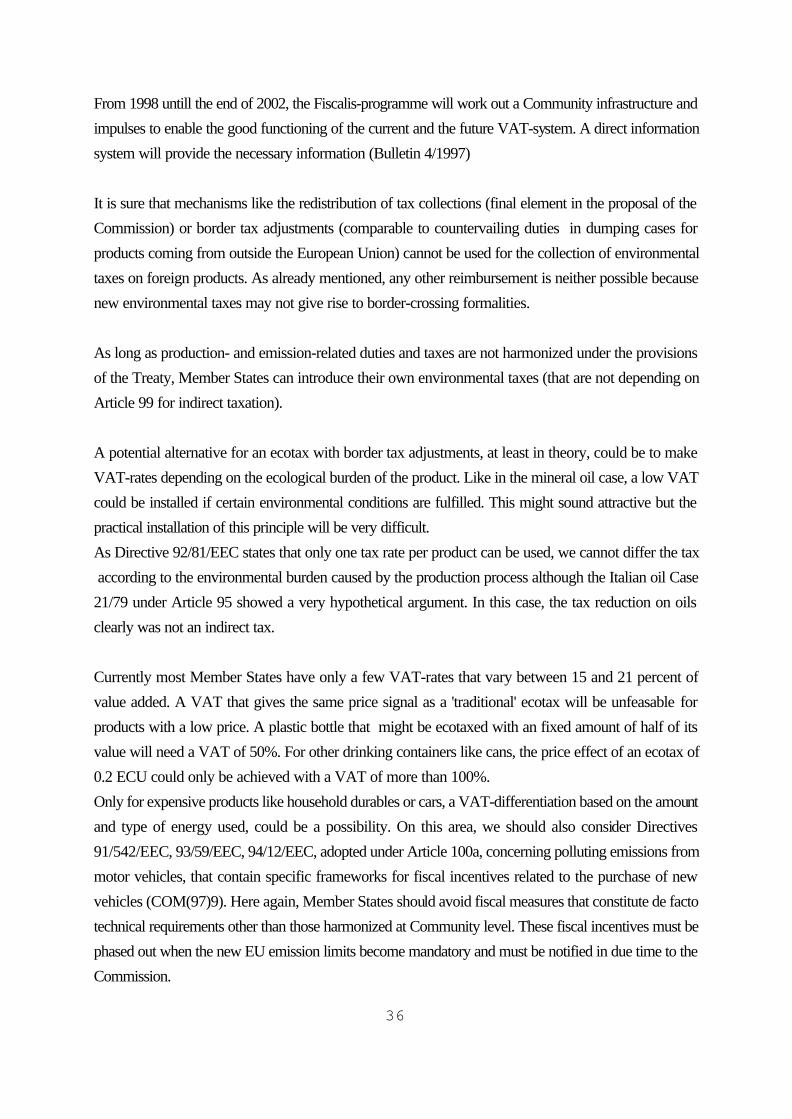
36
From 1998 untill the end of 2002, the Fiscalis-programme will work out a Community infrastructure andimpulses to enable the good functioning of the current and the future VAT-system. A direct informationsystem will provide the necessary information (Bulletin 4/1997)
It is sure that mechanisms like the redistribution of tax collections (final element in the proposal of theCommission) or border tax adjustments (comparable to countervailing duties in dumping cases forproducts coming from outside the European Union) cannot be used for the collection of environmentaltaxes on foreign products. As already mentioned, any other reimbursement is neither possible becausenew environmental taxes may not give rise to border-crossing formalities.
As long as production- and emission-related duties and taxes are not harmonized under the provisionsof the Treaty, Member States can introduce their own environmental taxes (that are not depending onArticle 99 for indirect taxation).
A potential alternative for an ecotax with border tax adjustments, at least in theory, could be to makeVAT-rates depending on the ecological burden of the product. Like in the mineral oil case, a low VATcould be installed if certain environmental conditions are fulfilled. This might sound attractive but thepractical installation of this principle will be very difficult.As Directive 92/81/EEC states that only one tax rate per product can be used, we cannot differ the tax according to the environmental burden caused by the production process although the Italian oil Case21/79 under Article 95 showed a very hypothetical argument. In this case, the tax reduction on oilsclearly was not an indirect tax.
Currently most Member States have only a few VAT-rates that vary between 15 and 21 percent ofvalue added. A VAT that gives the same price signal as a 'traditional' ecotax will be unfeasable forproducts with a low price. A plastic bottle that might be ecotaxed with an fixed amount of half of itsvalue will need a VAT of 50%. For other drinking containers like cans, the price effect of an ecotax of0.2 ECU could only be achieved with a VAT of more than 100%.Only for expensive products like household durables or cars, a VAT-differentiation based on the amountand type of energy used, could be a possibility. On this area, we should also consider Directives91/542/EEC, 93/59/EEC, 94/12/EEC, adopted under Article 100a, concerning polluting emissions frommotor vehicles, that contain specific frameworks for fiscal incentives related to the purchase of newvehicles (COM(97)9). Here again, Member States should avoid fiscal measures that constitute de factotechnical requirements other than those harmonized at Community level. These fiscal incentives must bephased out when the new EU emission limits become mandatory and must be notified in due time to theCommission.
37
To conclude, we should mention that Article 99 does not provide a general safeguard clause allowingfor more stringent national measures in the interest of the environment in general, Neither is there ageneral safeguard clause comparable to Article 36. Ziegler (1996) gives two exceptions. In theCommission's proposals for the introduction of a carbon dioxide or energy product tax, Member Statesare allowed to apply higher rates and as far as the recently adopted directive on vehicle taxes and tollsis concerned, only minimum standards for vehicle taxes are provided. In the latter case, the user chargeshould be in proportion to the duration of the use made of the infrastructure, which corresponds to thepolluter pays principle.For other products, we should keep as a guideline that Article 99 clearly implies that border taxadjustments for environmental taxes are not possible.
3.4 Fair and undistorted competition and the environment (Article 85)
In many environmental programmes that introduce ecotaxes, an essential role is played by privateundertakings. They can create cooperative structures for the practical organization of waste collectionand processing, the introduction of ecolabels, logistic arrangements, environmental R&D-programmesfor clean technologies and so on. These activities with beneficial effects on the environment can alsoinfluence competitive relations. Some forms of collaborations can suppress competition and this will raiseproblems.
Article 85 (Cartels and Restrictive Practices) prohibits as incompatible with the common market : allagreements between undertakings, decisions by associations of undertakings and concerted practiceswhich may affect trade between Member States and which have as their object or effect the prevention,restriction or distortion of competition within the common market, and in particular those which :
a. directly or indirectly fix purchase or selling prices or any other trading conditions;b. limit or control production, markets, technical development, or investment;c. share markets or sources of supply;d. apply dissimilar conditions to equivalent transactions with other trading parties, thereby placing themat a competitive disadvantage;e. make the conclusion of contracts subject to acceptance by other parties of supplementary obligationswhich, by their nature or according to commercial usage, have no connection with the subject of suchcontracts (EC Law,1995).
The principles elaborated in the Articles 85-90 primarily concern the distorting behaviour of private

38
undertakings, but they apply by implication to Member States taking action to support, facilitate, or allowsuch private behaviour. The definitions in Article 85 are also very broad and general and are most andfor all 'effect based'. Neither the precise legal form of specific agreements, nor its actual content are ofdecisive relevance.Furthermore, the agreement or concerted practice between undertakings must have an effect on tradebetween Member States for Article 85 to apply. This is essential. If a restrictive practice has implicationsonly within a single Member State, then regulatory competence belongs solely at the national level. Itshould however be noted that the jurisdictional threshold used by the Court is very low so even whenthe (voluntary) agreements appear on first inspection to concern one state alone, it will be frequentlypossible to identify an effect on trade (EC Law, 1995).
Voluntary agreements among firms can defy the prohibitions of Article 85 but this is not a priori the case.We should always keep in mind that 'perfect competition' with maximum efficiency is a textbookhypothesis and therefore considered as unattainable for many reasons. This is reflected in the notion of'workable competition' as the objective of Article 85. The European Court referred in Case 26/76 (ECR1875, 1904) Metro vs Commission to '...the market of workable competition ...to ensure ... the creationof a single market achieving conditions similar to those of a domestic market.'
Also, for environmental policy programmes based on voluntary agreements, there is the crucialexemption under Article 85(3) for agreements that meet specified criteria reflecting overall beneficialeffect. The exemption can be used for practices or agreements which contribute 'to improving theproduction or distribution of goods or to promote technical or economic progress, while allowingconsumers a fair share of the resulting benefit, and which do not :
a. impose on the undertakings concerned restrictions which are not indispensable to the attainment ofthese objectives ;b. afford such undertakings the possibility of eliminating competition in respect of a substantial part ofthe products in question (EC Law, 1995).
Undertakings can apply to the Commission for the grant of an exemption based on Article 85(3). Toprevent an intolerable workload, block exemption regulations were developped for several categoriesof collaboration. If an agreement is of a type covered by a block exemption regulation, the firms canconsult this regulation and do not have to seek an individual exemption. Of course, firms that do not finda solution in the block exemptions can directly contact the Commission.Concerning voluntary agreements that are used in environmental policy, Reg.418/85 Research andDevelopment agreements, Reg.2349/84 Patent licensing agreements and Reg.556/89 Know-how
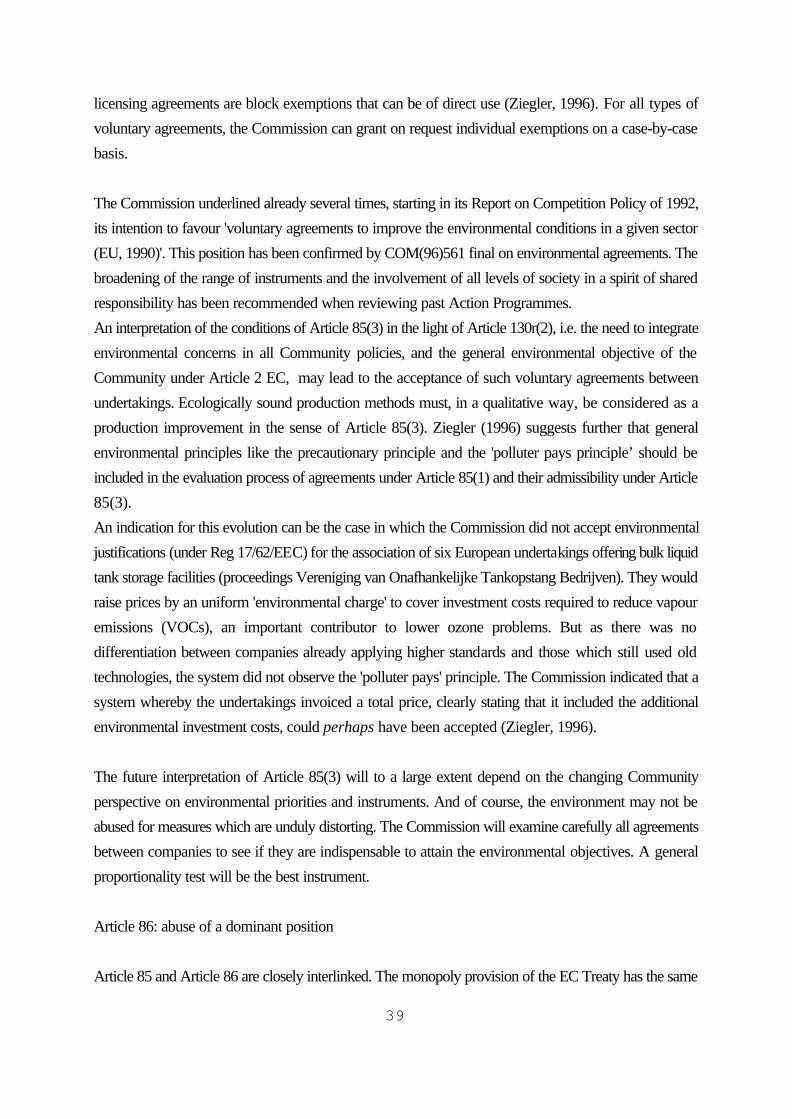
39
licensing agreements are block exemptions that can be of direct use (Ziegler, 1996). For all types ofvoluntary agreements, the Commission can grant on request individual exemptions on a case-by-casebasis.
The Commission underlined already several times, starting in its Report on Competition Policy of 1992,its intention to favour 'voluntary agreements to improve the environmental conditions in a given sector(EU, 1990)'. This position has been confirmed by COM(96)561 final on environmental agreements. Thebroadening of the range of instruments and the involvement of all levels of society in a spirit of sharedresponsibility has been recommended when reviewing past Action Programmes.An interpretation of the conditions of Article 85(3) in the light of Article 130r(2), i.e. the need to integrateenvironmental concerns in all Community policies, and the general environmental objective of theCommunity under Article 2 EC, may lead to the acceptance of such voluntary agreements betweenundertakings. Ecologically sound production methods must, in a qualitative way, be considered as aproduction improvement in the sense of Article 85(3). Ziegler (1996) suggests further that generalenvironmental principles like the precautionary principle and the 'polluter pays principle’ should beincluded in the evaluation process of agreements under Article 85(1) and their admissibility under Article85(3).An indication for this evolution can be the case in which the Commission did not accept environmentaljustifications (under Reg 17/62/EEC) for the association of six European undertakings offering bulk liquidtank storage facilities (proceedings Vereniging van Onafhankelijke Tankopstang Bedrijven). They wouldraise prices by an uniform 'environmental charge' to cover investment costs required to reduce vapouremissions (VOCs), an important contributor to lower ozone problems. But as there was nodifferentiation between companies already applying higher standards and those which still used oldtechnologies, the system did not observe the 'polluter pays' principle. The Commission indicated that asystem whereby the undertakings invoiced a total price, clearly stating that it included the additionalenvironmental investment costs, could perhaps have been accepted (Ziegler, 1996).
The future interpretation of Article 85(3) will to a large extent depend on the changing Communityperspective on environmental priorities and instruments. And of course, the environment may not beabused for measures which are unduly distorting. The Commission will examine carefully all agreementsbetween companies to see if they are indispensable to attain the environmental objectives. A generalproportionality test will be the best instrument.
Article 86: abuse of a dominant position
Article 85 and Article 86 are closely interlinked. The monopoly provision of the EC Treaty has the same
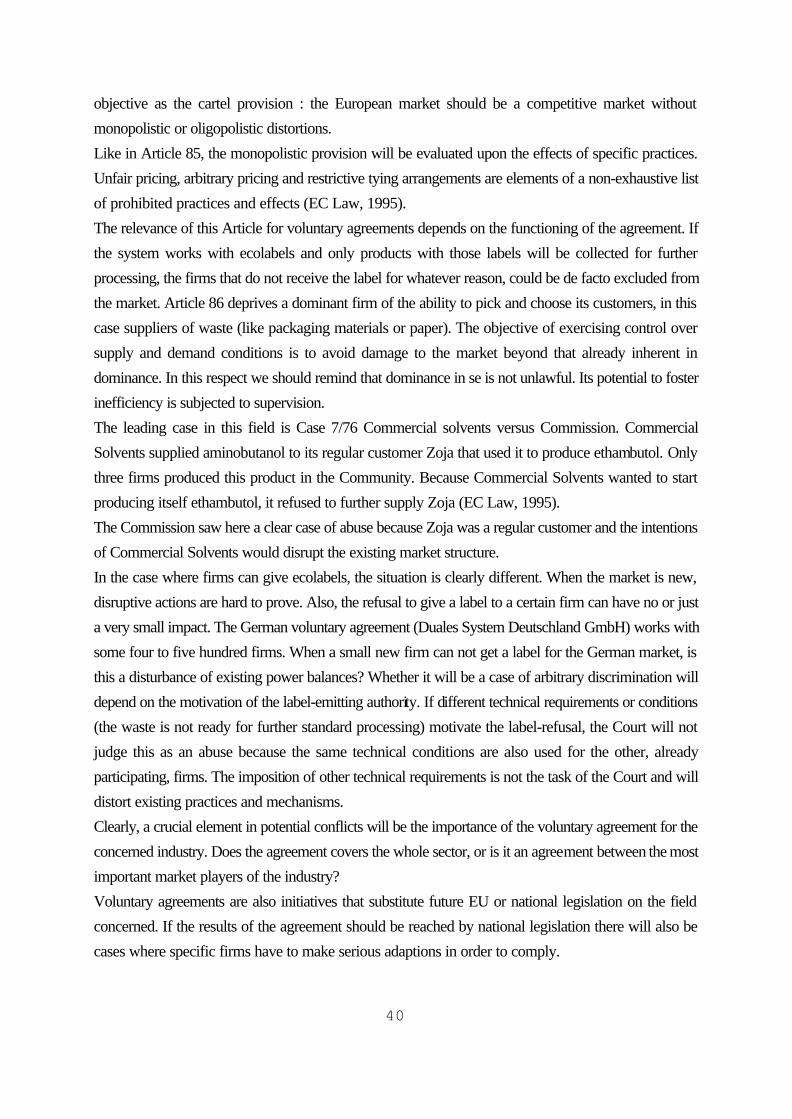
40
objective as the cartel provision : the European market should be a competitive market withoutmonopolistic or oligopolistic distortions.Like in Article 85, the monopolistic provision will be evaluated upon the effects of specific practices.Unfair pricing, arbitrary pricing and restrictive tying arrangements are elements of a non-exhaustive listof prohibited practices and effects (EC Law, 1995).The relevance of this Article for voluntary agreements depends on the functioning of the agreement. Ifthe system works with ecolabels and only products with those labels will be collected for furtherprocessing, the firms that do not receive the label for whatever reason, could be de facto excluded fromthe market. Article 86 deprives a dominant firm of the ability to pick and choose its customers, in thiscase suppliers of waste (like packaging materials or paper). The objective of exercising control oversupply and demand conditions is to avoid damage to the market beyond that already inherent indominance. In this respect we should remind that dominance in se is not unlawful. Its potential to fosterinefficiency is subjected to supervision.The leading case in this field is Case 7/76 Commercial solvents versus Commission. CommercialSolvents supplied aminobutanol to its regular customer Zoja that used it to produce ethambutol. Onlythree firms produced this product in the Community. Because Commercial Solvents wanted to startproducing itself ethambutol, it refused to further supply Zoja (EC Law, 1995).The Commission saw here a clear case of abuse because Zoja was a regular customer and the intentionsof Commercial Solvents would disrupt the existing market structure.In the case where firms can give ecolabels, the situation is clearly different. When the market is new,disruptive actions are hard to prove. Also, the refusal to give a label to a certain firm can have no or justa very small impact. The German voluntary agreement (Duales System Deutschland GmbH) works withsome four to five hundred firms. When a small new firm can not get a label for the German market, isthis a disturbance of existing power balances? Whether it will be a case of arbitrary discrimination willdepend on the motivation of the label-emitting authority. If different technical requirements or conditions(the waste is not ready for further standard processing) motivate the label-refusal, the Court will notjudge this as an abuse because the same technical conditions are also used for the other, alreadyparticipating, firms. The imposition of other technical requirements is not the task of the Court and willdistort existing practices and mechanisms.Clearly, a crucial element in potential conflicts will be the importance of the voluntary agreement for theconcerned industry. Does the agreement covers the whole sector, or is it an agreement between the mostimportant market players of the industry? Voluntary agreements are also initiatives that substitute future EU or national legislation on the fieldconcerned. If the results of the agreement should be reached by national legislation there will also becases where specific firms have to make serious adaptions in order to comply.
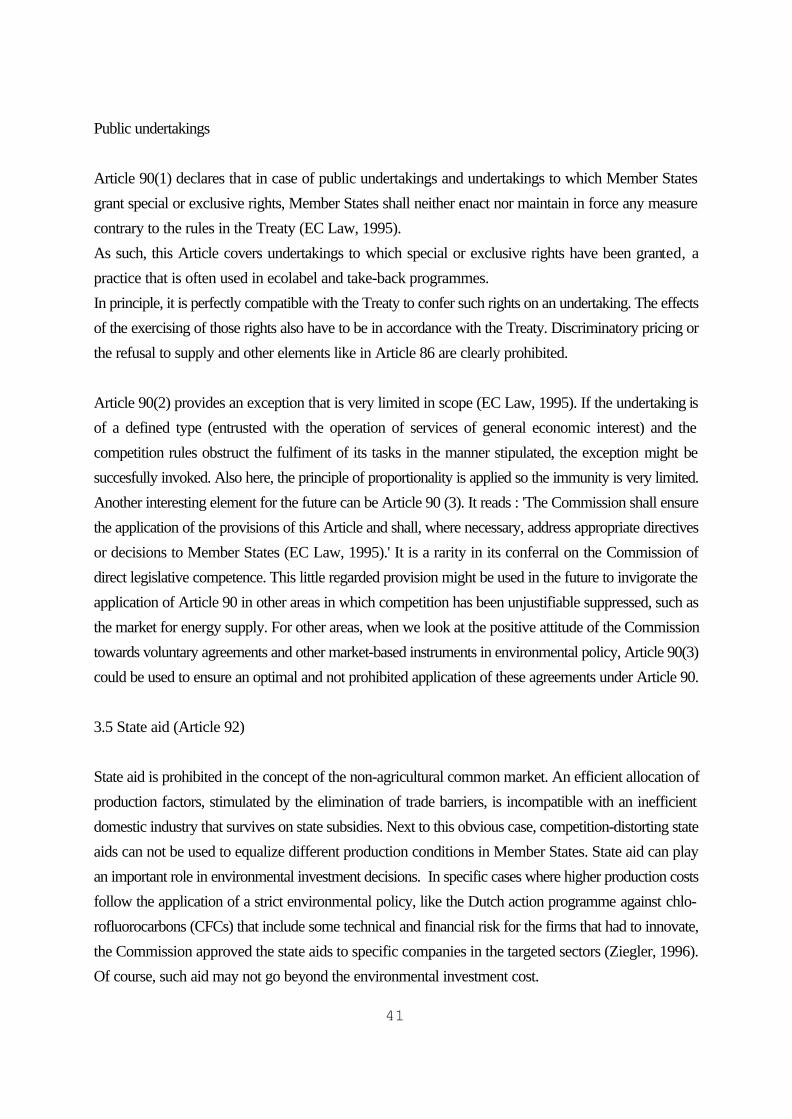
41
Public undertakings
Article 90(1) declares that in case of public undertakings and undertakings to which Member Statesgrant special or exclusive rights, Member States shall neither enact nor maintain in force any measurecontrary to the rules in the Treaty (EC Law, 1995).As such, this Article covers undertakings to which special or exclusive rights have been granted, apractice that is often used in ecolabel and take-back programmes.In principle, it is perfectly compatible with the Treaty to confer such rights on an undertaking. The effectsof the exercising of those rights also have to be in accordance with the Treaty. Discriminatory pricing orthe refusal to supply and other elements like in Article 86 are clearly prohibited.
Article 90(2) provides an exception that is very limited in scope (EC Law, 1995). If the undertaking isof a defined type (entrusted with the operation of services of general economic interest) and thecompetition rules obstruct the fulfiment of its tasks in the manner stipulated, the exception might besuccesfully invoked. Also here, the principle of proportionality is applied so the immunity is very limited.Another interesting element for the future can be Article 90 (3). It reads : 'The Commission shall ensurethe application of the provisions of this Article and shall, where necessary, address appropriate directivesor decisions to Member States (EC Law, 1995).' It is a rarity in its conferral on the Commission ofdirect legislative competence. This little regarded provision might be used in the future to invigorate theapplication of Article 90 in other areas in which competition has been unjustifiable suppressed, such asthe market for energy supply. For other areas, when we look at the positive attitude of the Commissiontowards voluntary agreements and other market-based instruments in environmental policy, Article 90(3)could be used to ensure an optimal and not prohibited application of these agreements under Article 90.
3.5 State aid (Article 92)
State aid is prohibited in the concept of the non-agricultural common market. An efficient allocation ofproduction factors, stimulated by the elimination of trade barriers, is incompatible with an inefficientdomestic industry that survives on state subsidies. Next to this obvious case, competition-distorting stateaids can not be used to equalize different production conditions in Member States. State aid can playan important role in environmental investment decisions. In specific cases where higher production costsfollow the application of a strict environmental policy, like the Dutch action programme against chlo-rofluorocarbons (CFCs) that include some technical and financial risk for the firms that had to innovate,the Commission approved the state aids to specific companies in the targeted sectors (Ziegler, 1996).Of course, such aid may not go beyond the environmental investment cost.
42
In cases where firms apply voluntarily more stringent environmental standards - not to compare withcompulsory legal requirements -, the possible state aid has in recent guidelines even been limited to 30per cent of the total environmental relevant cost. The Treaty provides broader exceptions (not related to the environment) for sectors like agriculture andtransport. And like in the Dutch CFC-case, there is special secondary legislation that makes it possibleto provide environmental subsidies (Ziegler, 1996), in particular for investments in ecologically soundtechnologies. These subsidies do not follow the 'polluter pays principle’ but the Commission sees itsguidelines as a compromise to find a workable balance between the environmental arguments and thedistorting effects on competition and trade.
Article 92 is only relevant when national aid affects trade between Member States. The capability ofhindering trade is however a sufficient condition. If, for example, cheap energy is provided for all sectorsin the economy, there can be no competition distorting effect as a result of this state aid. This wouldhowever be the case when the aid applies to some selected exporting sectors.
An important exception is provided by Article 92(3) which allows state aids to 'promote the executionof an important project of common European interest or to remedy a serious disturbance in the economyof a Member State (EC Law, 1995)'. The aid, clearly suitable for promoting the objective, must beproportionate to the importance of the objective, next to indispensable to achieve it.Environmental programmes may be projects that serve common European interests. In 1975, theCommission announced that it would accept environmental state aid for a limited transitional period thatshould have ended in 1980. The application was extended for an additional period of some 15 years andin March 1994 the Commission published its currently applicable guidelines which follow in fact theapproach used in 1975. The aid, limited to 15 per cent of the additional investments, is granted only toundertakings which had had installations in operation for at least two years before the entry into forceof new higher environmental standards.As already mentioned, for firms that voluntary go further than the compulsory level of protection, stateaid can amount to 30 per cent of investments. The Article also requires any Member State to inform theCommission in due course (two-month period is sufficient) about its plans to grant or alter any kind ofstate aid. There is also the obligation for a Member State not to put its proposed measures into effectuntill a final Commission decision has direct effect. This means that a competitor to the firm benefittingfrom the aid, could request a national court to take all appropriate measures in accordance with nationallaw, including the suspension of further payments under the scheme, until the Commission has decidedon the compatibility of the aid with the Treaty.The same period is maintained for the prior notification by Member States of any technical regulations,
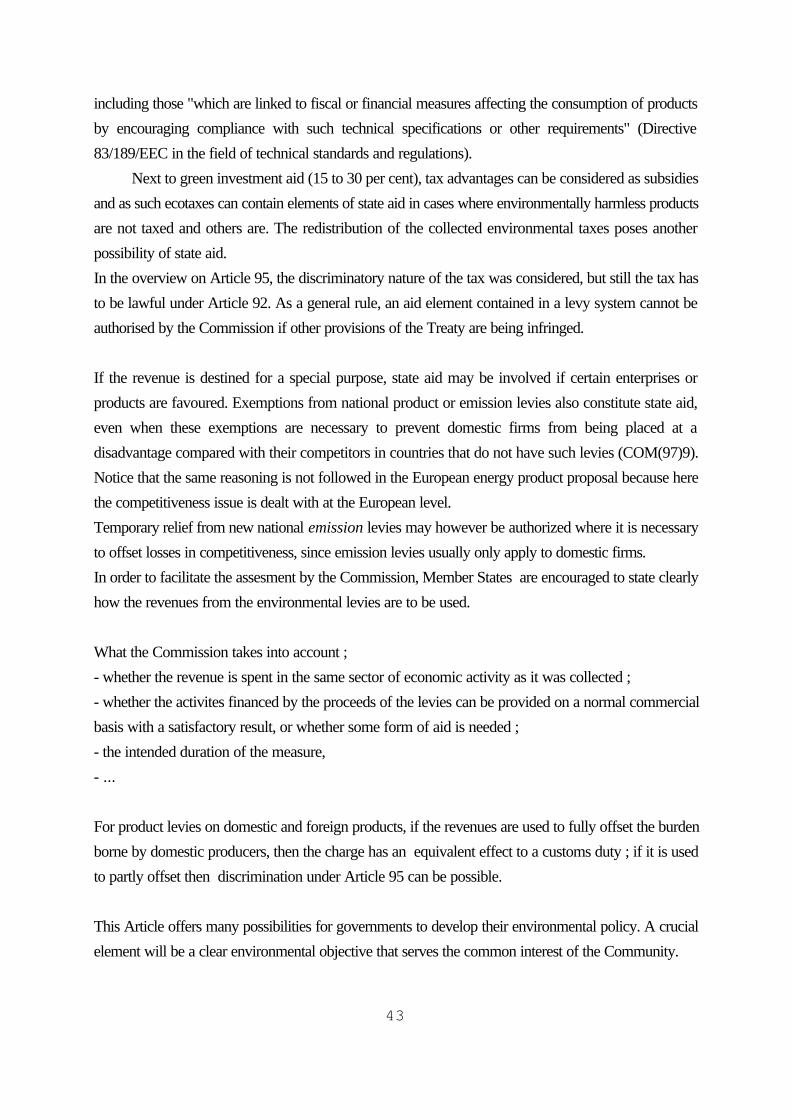
43
including those "which are linked to fiscal or financial measures affecting the consumption of productsby encouraging compliance with such technical specifications or other requirements" (Directive83/189/EEC in the field of technical standards and regulations).
Next to green investment aid (15 to 30 per cent), tax advantages can be considered as subsidiesand as such ecotaxes can contain elements of state aid in cases where environmentally harmless productsare not taxed and others are. The redistribution of the collected environmental taxes poses anotherpossibility of state aid.In the overview on Article 95, the discriminatory nature of the tax was considered, but still the tax hasto be lawful under Article 92. As a general rule, an aid element contained in a levy system cannot beauthorised by the Commission if other provisions of the Treaty are being infringed.
If the revenue is destined for a special purpose, state aid may be involved if certain enterprises orproducts are favoured. Exemptions from national product or emission levies also constitute state aid,even when these exemptions are necessary to prevent domestic firms from being placed at adisadvantage compared with their competitors in countries that do not have such levies (COM(97)9).Notice that the same reasoning is not followed in the European energy product proposal because herethe competitiveness issue is dealt with at the European level.Temporary relief from new national emission levies may however be authorized where it is necessaryto offset losses in competitiveness, since emission levies usually only apply to domestic firms.In order to facilitate the assesment by the Commission, Member States are encouraged to state clearlyhow the revenues from the environmental levies are to be used.
What the Commission takes into account ;- whether the revenue is spent in the same sector of economic activity as it was collected ;- whether the activites financed by the proceeds of the levies can be provided on a normal commercialbasis with a satisfactory result, or whether some form of aid is needed ;- the intended duration of the measure,- ...
For product levies on domestic and foreign products, if the revenues are used to fully offset the burdenborne by domestic producers, then the charge has an equivalent effect to a customs duty ; if it is usedto partly offset then discrimination under Article 95 can be possible.
This Article offers many possibilities for governments to develop their environmental policy. A crucialelement will be a clear environmental objective that serves the common interest of the Community.
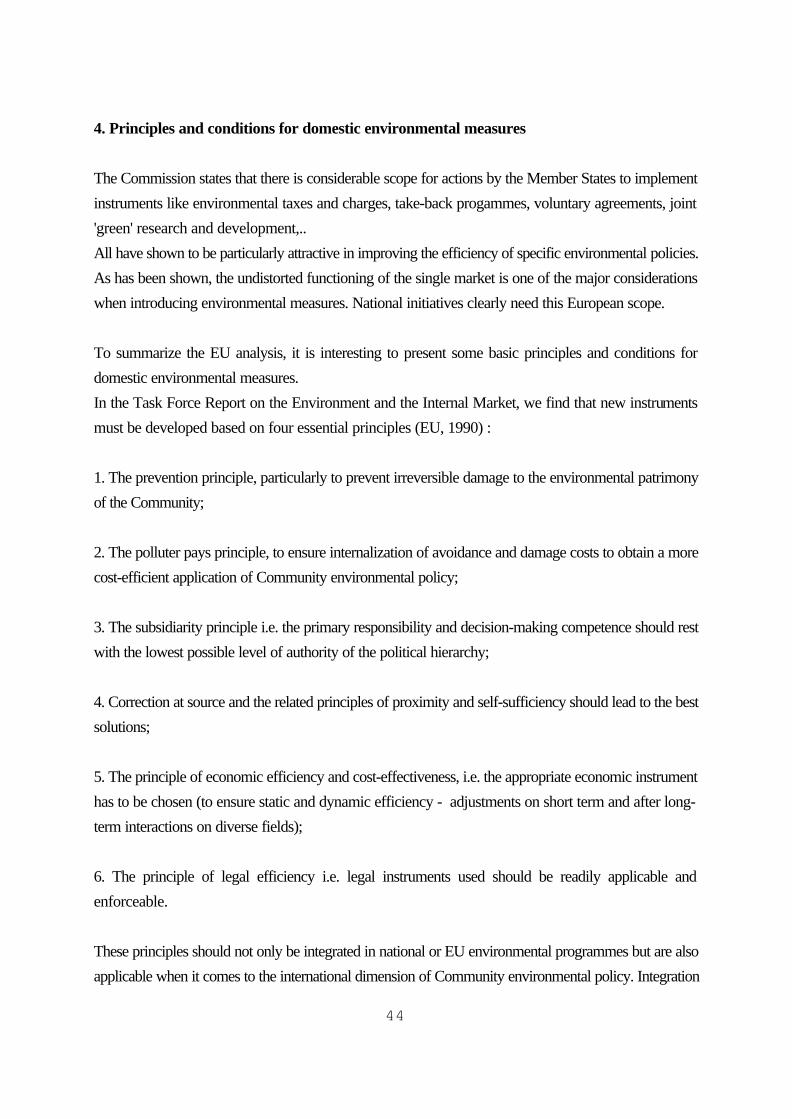
44
4. Principles and conditions for domestic environmental measures
The Commission states that there is considerable scope for actions by the Member States to implementinstruments like environmental taxes and charges, take-back progammes, voluntary agreements, joint'green' research and development,..All have shown to be particularly attractive in improving the efficiency of specific environmental policies.As has been shown, the undistorted functioning of the single market is one of the major considerationswhen introducing environmental measures. National initiatives clearly need this European scope.
To summarize the EU analysis, it is interesting to present some basic principles and conditions fordomestic environmental measures.In the Task Force Report on the Environment and the Internal Market, we find that new instrumentsmust be developed based on four essential principles (EU, 1990) :
1. The prevention principle, particularly to prevent irreversible damage to the environmental patrimonyof the Community;
2. The polluter pays principle, to ensure internalization of avoidance and damage costs to obtain a morecost-efficient application of Community environmental policy;
3. The subsidiarity principle i.e. the primary responsibility and decision-making competence should restwith the lowest possible level of authority of the political hierarchy;
4. Correction at source and the related principles of proximity and self-sufficiency should lead to the bestsolutions;
5. The principle of economic efficiency and cost-effectiveness, i.e. the appropriate economic instrumenthas to be chosen (to ensure static and dynamic efficiency - adjustments on short term and after long-term interactions on diverse fields);
6. The principle of legal efficiency i.e. legal instruments used should be readily applicable andenforceable.
These principles should not only be integrated in national or EU environmental programmes but are alsoapplicable when it comes to the international dimension of Community environmental policy. Integration
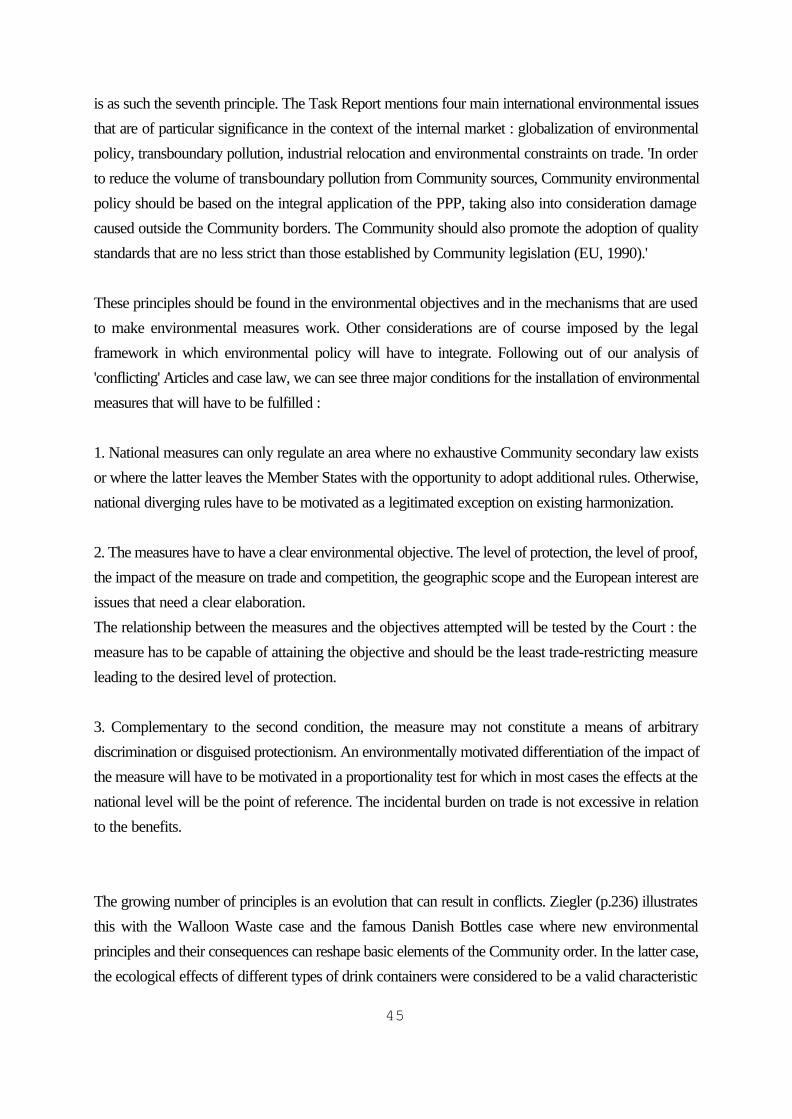
45
is as such the seventh principle. The Task Report mentions four main international environmental issuesthat are of particular significance in the context of the internal market : globalization of environmentalpolicy, transboundary pollution, industrial relocation and environmental constraints on trade. 'In orderto reduce the volume of transboundary pollution from Community sources, Community environmentalpolicy should be based on the integral application of the PPP, taking also into consideration damagecaused outside the Community borders. The Community should also promote the adoption of qualitystandards that are no less strict than those established by Community legislation (EU, 1990).'
These principles should be found in the environmental objectives and in the mechanisms that are usedto make environmental measures work. Other considerations are of course imposed by the legalframework in which environmental policy will have to integrate. Following out of our analysis of'conflicting' Articles and case law, we can see three major conditions for the installation of environmentalmeasures that will have to be fulfilled :
1. National measures can only regulate an area where no exhaustive Community secondary law existsor where the latter leaves the Member States with the opportunity to adopt additional rules. Otherwise,national diverging rules have to be motivated as a legitimated exception on existing harmonization.
2. The measures have to have a clear environmental objective. The level of protection, the level of proof,the impact of the measure on trade and competition, the geographic scope and the European interest areissues that need a clear elaboration.The relationship between the measures and the objectives attempted will be tested by the Court : themeasure has to be capable of attaining the objective and should be the least trade-restricting measureleading to the desired level of protection.
3. Complementary to the second condition, the measure may not constitute a means of arbitrarydiscrimination or disguised protectionism. An environmentally motivated differentiation of the impact ofthe measure will have to be motivated in a proportionality test for which in most cases the effects at thenational level will be the point of reference. The incidental burden on trade is not excessive in relationto the benefits.
The growing number of principles is an evolution that can result in conflicts. Ziegler (p.236) illustratesthis with the Walloon Waste case and the famous Danish Bottles case where new environmentalprinciples and their consequences can reshape basic elements of the Community order. In the latter case,the ecological effects of different types of drink containers were considered to be a valid characteristic
46
for distinguishing the products while in the former case, the origin of the product allowed a differenttreatment in comparison to local waste.The cases redefined the non-discrimination principle in a way which is completely foreign to ‘traditional’trade theory. These principles can as such influenve the Community legal order and it will be interestingto see what will be the ultimate long-term impact of principles like sustainability or safeguarding bio-diversity that are listed in the last Environmental Action Programmes in accordance with the decisionsat the 1992 Rio Earth Summit.
The introduction of principles is an evolution that we find mainly in Community environmental policy.Some principles will be integrated in other areas, like the PPP in the Common Agricultural Policy. Atfirst sight, this should be an improvement for the environment compared to the situation before. Somespecialists however have serious doubts. At the Brussels conference (17-18 october 1997)'Community's Environmental Policy at 25 : Stocktaking and Future Prospects', Ludwig Krämer (DGXI)illustrated the difficult translation of the 'polluter pays principle’ into national legislations.Depending on the Member States, the PPP was (or will be) translated as the polluter shall, should, will,has to,... pay for his actual, past or future damaging pollution.But what is the correct definition of a polluter and what is pollution? How, to what extent and whenshould he pay? Also here, there are many differing definitions and the impact of directives without clearspecifications is questionable. Furthermore, we already stated that principles that are not translated inlaws have no legal force.The 'polluter pays' is an economic principle that was not developed to be included immediately into legalframeworks. The principle was formulated to influence and ensure environmental efficiency in economicbehaviour. Again, principles are illustrative but are on itself not enforceable.An individual or a firm cannot complain to the Commission or introduce a case because a neighbourdoes not pay for his pollution or does not correct at the source, notwithstanding the general acceptanceof the validity of the principles.And PPP is maybe one of the most 'applicable' principles.More vague principles like precaution and sustainable development are probably more difficult to includein Community order. 'Correction at source' poses similar problems. It is clear that pollution should becorrected at the source but what is the final objective? Setting limits on car emissions does not guaranteethe maintenance of specific air quality levels. If a level of air quality is the objective, can we achieve thisobjective by only setting emission levels for cars or the introduction of catalysts? If traffic keeps ongrowing, emissions per car will not lead to improved air quality, but we can say that 'we corrected at thesource' and made 'the polluter pay' for his emissions.Why then have principles been seen as a good way to work on environmental issues? This is not so clearbut probably the attractiveness of principles lays in their obvious educational value. The 'polluter pays'
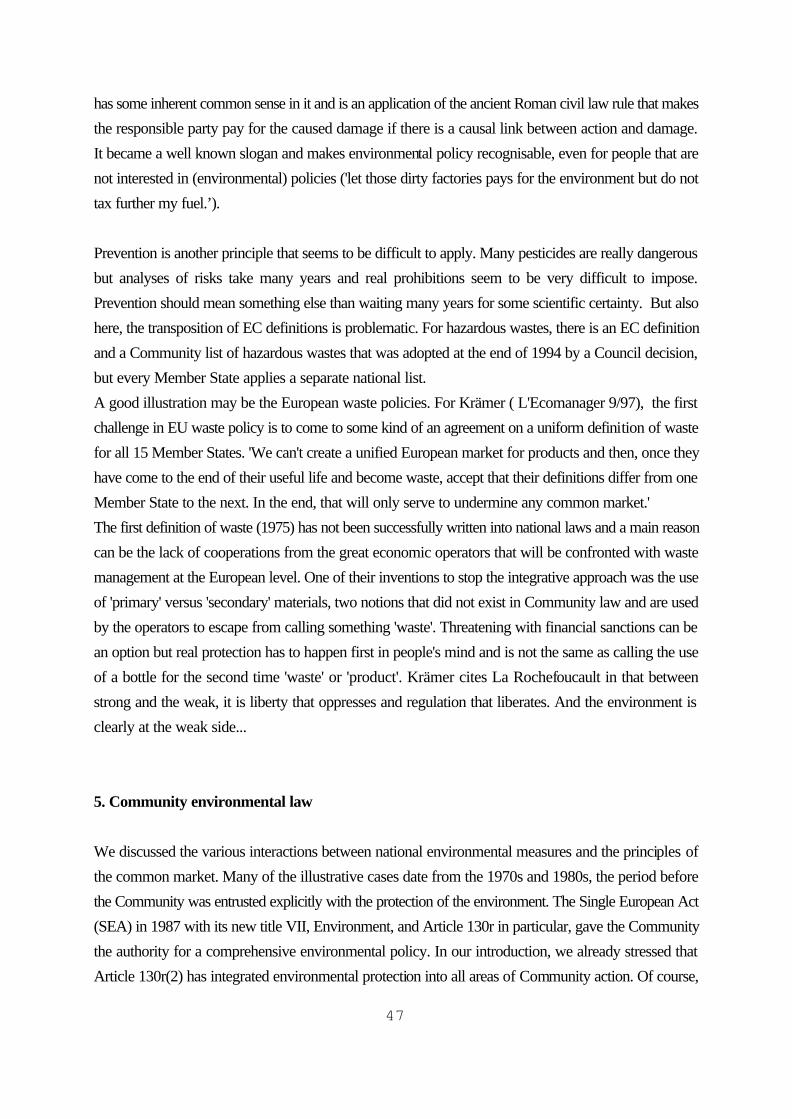
47
has some inherent common sense in it and is an application of the ancient Roman civil law rule that makesthe responsible party pay for the caused damage if there is a causal link between action and damage.It became a well known slogan and makes environmental policy recognisable, even for people that arenot interested in (environmental) policies ('let those dirty factories pays for the environment but do nottax further my fuel.’). Prevention is another principle that seems to be difficult to apply. Many pesticides are really dangerousbut analyses of risks take many years and real prohibitions seem to be very difficult to impose.Prevention should mean something else than waiting many years for some scientific certainty. But alsohere, the transposition of EC definitions is problematic. For hazardous wastes, there is an EC definitionand a Community list of hazardous wastes that was adopted at the end of 1994 by a Council decision,but every Member State applies a separate national list.A good illustration may be the European waste policies. For Krämer ( L'Ecomanager 9/97), the firstchallenge in EU waste policy is to come to some kind of an agreement on a uniform definition of wastefor all 15 Member States. 'We can't create a unified European market for products and then, once theyhave come to the end of their useful life and become waste, accept that their definitions differ from oneMember State to the next. In the end, that will only serve to undermine any common market.'The first definition of waste (1975) has not been successfully written into national laws and a main reasoncan be the lack of cooperations from the great economic operators that will be confronted with wastemanagement at the European level. One of their inventions to stop the integrative approach was the useof 'primary' versus 'secondary' materials, two notions that did not exist in Community law and are usedby the operators to escape from calling something 'waste'. Threatening with financial sanctions can bean option but real protection has to happen first in people's mind and is not the same as calling the useof a bottle for the second time 'waste' or 'product'. Krämer cites La Rochefoucault in that betweenstrong and the weak, it is liberty that oppresses and regulation that liberates. And the environment isclearly at the weak side...
5. Community environmental law
We discussed the various interactions between national environmental measures and the principles ofthe common market. Many of the illustrative cases date from the 1970s and 1980s, the period beforethe Community was entrusted explicitly with the protection of the environment. The Single European Act(SEA) in 1987 with its new title VII, Environment, and Article 130r in particular, gave the Communitythe authority for a comprehensive environmental policy. In our introduction, we already stressed thatArticle 130r(2) has integrated environmental protection into all areas of Community action. Of course,
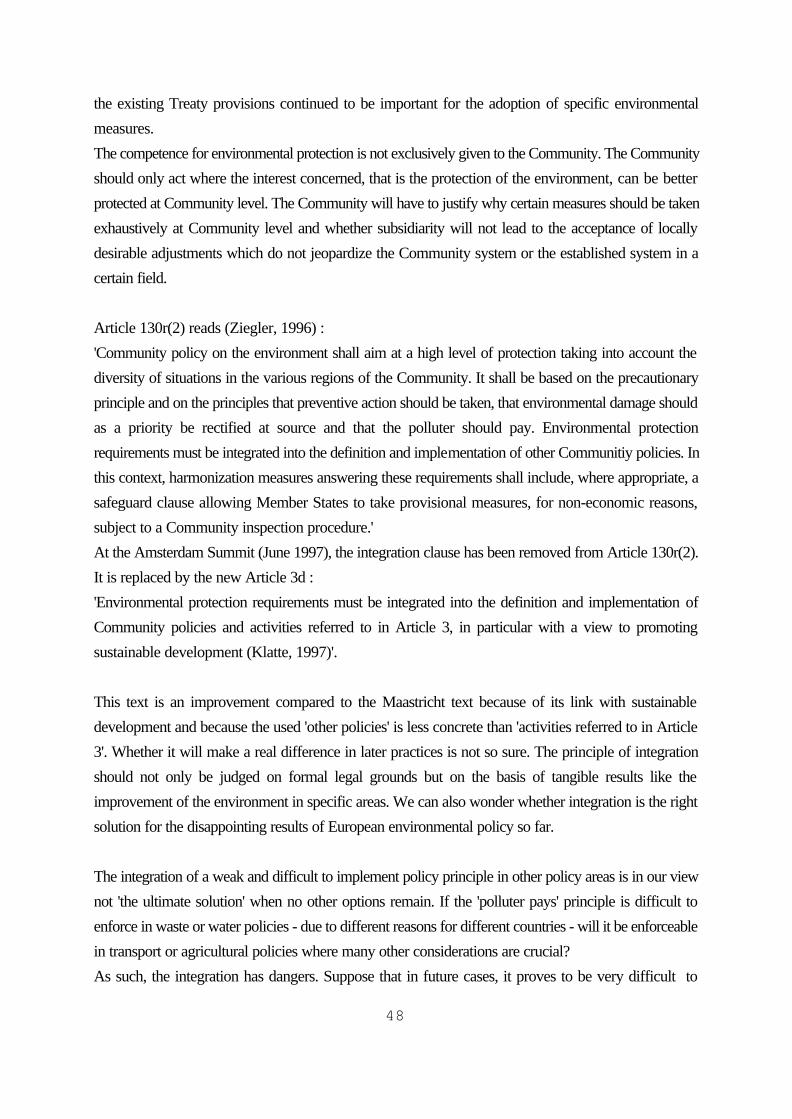
48
the existing Treaty provisions continued to be important for the adoption of specific environmentalmeasures.The competence for environmental protection is not exclusively given to the Community. The Communityshould only act where the interest concerned, that is the protection of the environment, can be betterprotected at Community level. The Community will have to justify why certain measures should be takenexhaustively at Community level and whether subsidiarity will not lead to the acceptance of locallydesirable adjustments which do not jeopardize the Community system or the established system in acertain field.
Article 130r(2) reads (Ziegler, 1996) :'Community policy on the environment shall aim at a high level of protection taking into account thediversity of situations in the various regions of the Community. It shall be based on the precautionaryprinciple and on the principles that preventive action should be taken, that environmental damage shouldas a priority be rectified at source and that the polluter should pay. Environmental protectionrequirements must be integrated into the definition and implementation of other Communitiy policies. Inthis context, harmonization measures answering these requirements shall include, where appropriate, asafeguard clause allowing Member States to take provisional measures, for non-economic reasons,subject to a Community inspection procedure.'At the Amsterdam Summit (June 1997), the integration clause has been removed from Article 130r(2).It is replaced by the new Article 3d :'Environmental protection requirements must be integrated into the definition and implementation ofCommunity policies and activities referred to in Article 3, in particular with a view to promotingsustainable development (Klatte, 1997)'.
This text is an improvement compared to the Maastricht text because of its link with sustainabledevelopment and because the used 'other policies' is less concrete than 'activities referred to in Article3'. Whether it will make a real difference in later practices is not so sure. The principle of integrationshould not only be judged on formal legal grounds but on the basis of tangible results like theimprovement of the environment in specific areas. We can also wonder whether integration is the rightsolution for the disappointing results of European environmental policy so far.
The integration of a weak and difficult to implement policy principle in other policy areas is in our viewnot 'the ultimate solution' when no other options remain. If the 'polluter pays' principle is difficult toenforce in waste or water policies - due to different reasons for different countries - will it be enforceablein transport or agricultural policies where many other considerations are crucial?As such, the integration has dangers. Suppose that in future cases, it proves to be very difficult to
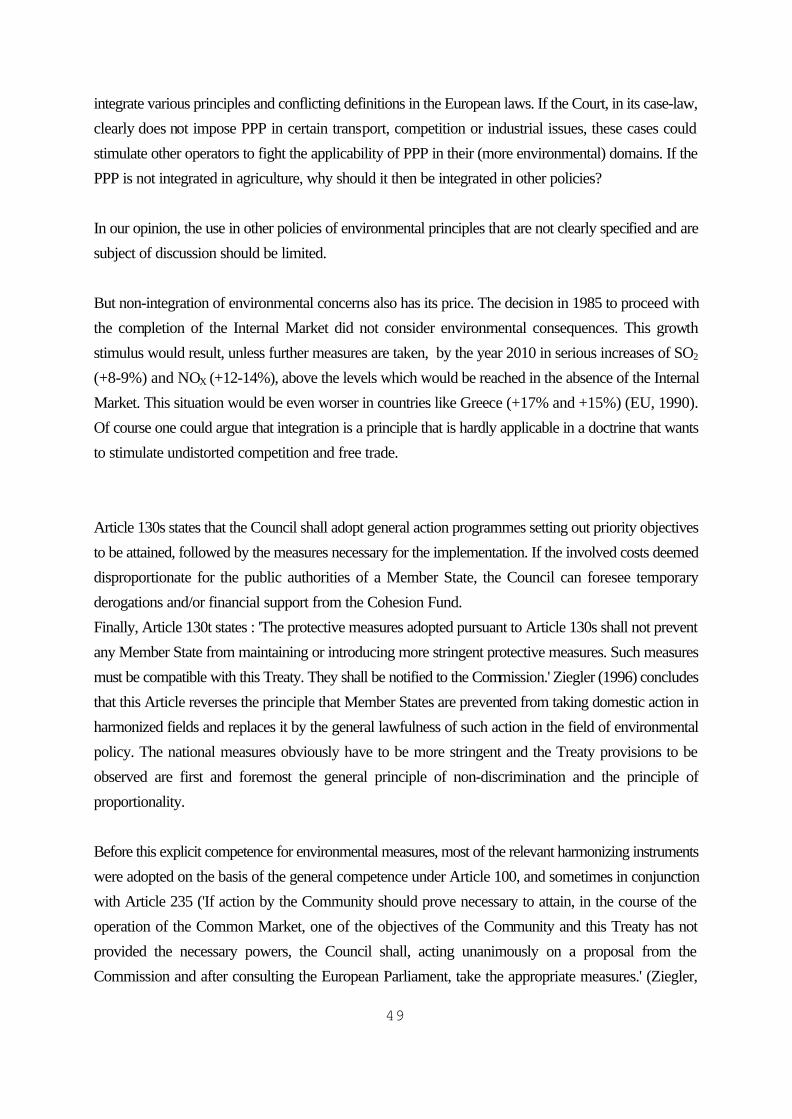
49
integrate various principles and conflicting definitions in the European laws. If the Court, in its case-law,clearly does not impose PPP in certain transport, competition or industrial issues, these cases couldstimulate other operators to fight the applicability of PPP in their (more environmental) domains. If thePPP is not integrated in agriculture, why should it then be integrated in other policies?
In our opinion, the use in other policies of environmental principles that are not clearly specified and aresubject of discussion should be limited.
But non-integration of environmental concerns also has its price. The decision in 1985 to proceed withthe completion of the Internal Market did not consider environmental consequences. This growthstimulus would result, unless further measures are taken, by the year 2010 in serious increases of SO2
(+8-9%) and NOX (+12-14%), above the levels which would be reached in the absence of the InternalMarket. This situation would be even worser in countries like Greece (+17% and +15%) (EU, 1990).Of course one could argue that integration is a principle that is hardly applicable in a doctrine that wantsto stimulate undistorted competition and free trade.
Article 130s states that the Council shall adopt general action programmes setting out priority objectivesto be attained, followed by the measures necessary for the implementation. If the involved costs deemeddisproportionate for the public authorities of a Member State, the Council can foresee temporaryderogations and/or financial support from the Cohesion Fund.Finally, Article 130t states : 'The protective measures adopted pursuant to Article 130s shall not preventany Member State from maintaining or introducing more stringent protective measures. Such measuresmust be compatible with this Treaty. They shall be notified to the Commission.' Ziegler (1996) concludesthat this Article reverses the principle that Member States are prevented from taking domestic action inharmonized fields and replaces it by the general lawfulness of such action in the field of environmentalpolicy. The national measures obviously have to be more stringent and the Treaty provisions to beobserved are first and foremost the general principle of non-discrimination and the principle ofproportionality.
Before this explicit competence for environmental measures, most of the relevant harmonizing instrumentswere adopted on the basis of the general competence under Article 100, and sometimes in conjunctionwith Article 235 ('If action by the Community should prove necessary to attain, in the course of theoperation of the Common Market, one of the objectives of the Community and this Treaty has notprovided the necessary powers, the Council shall, acting unanimously on a proposal from theCommission and after consulting the European Parliament, take the appropriate measures.' (Ziegler,
50
1996)).We should keep in mind that as Article 100 only allows the adoption of directives, the Member Statesalways retain a certain autonomy when implementing Community measures. This practice has of coursethe risk of a heterogeneous realization of Community objectives and the misuse by Member States'authorities. Some state that the lax implementation of Community directives by the Member States isthe major problem of today's Community environmental law.The envisaged harmonization of environmental rules on the basis of Article 100 does however permitdiffering national provisions (the case law by the Court on Article 30 and the exceptions foreseen inArticle 36 have a permanent power even after harmonization). Once a State has notified a divergentmeasure - there is a compulsory notification of almost all draft national environmental legislation -, theCommission may only check whether it is compatible with the general conditions of Article 36 and therule of reason. An improper use of this provision will be brought before the Court by the Commissionor by another Member State. From the limited number of cases so far, it seems to be that the Courtrequires a high standard in the arguments put forward for the justification of national derogations.
The mutual recognition of standards under Article 100b could be of great importance when barriers totrade did not fall under Article 100a or under Article 30. Although its applicability might be limited, thisArticle empowers the Council to require the recognition of national environmental rules and standardsprovided that they have not yet been harmonized under Article 100a.
6. External relations and environmental protection
Multilateral environmental agreements (MEAs) are the key-instrument for international negotiations toprotect the environment. Article 130r(4) provides specific Community competence for international co-operation although there is still no intention to confer an exclusive external competence for MEAs on theCommunity. The principle of subsidiarity underlines the fact that the Community has the power to actinternally and externally only if the objectives can be better attained at Community level. Most MEAshave been concluded as mixed agreements (Montréal Protocol, Vienna Convention) what allows bothMember States and the Community to negotiate and ratify international conventions. This is possibleeven if the Community has already taken internal measures in a relevant area.Also with MEAs, the possibility to implement more stringent measures is provided by Article 130t. Toensure a homogeneous application, the international agreements are implemented internally byCommunity regulations. This is necessary because any national restriction on imports from non-membercountries which is not applied homogeneously in all the Member States can result in new trade barrierserected between Member States. Trade barriers and commercial policy are the exclusive competencesof the Community.
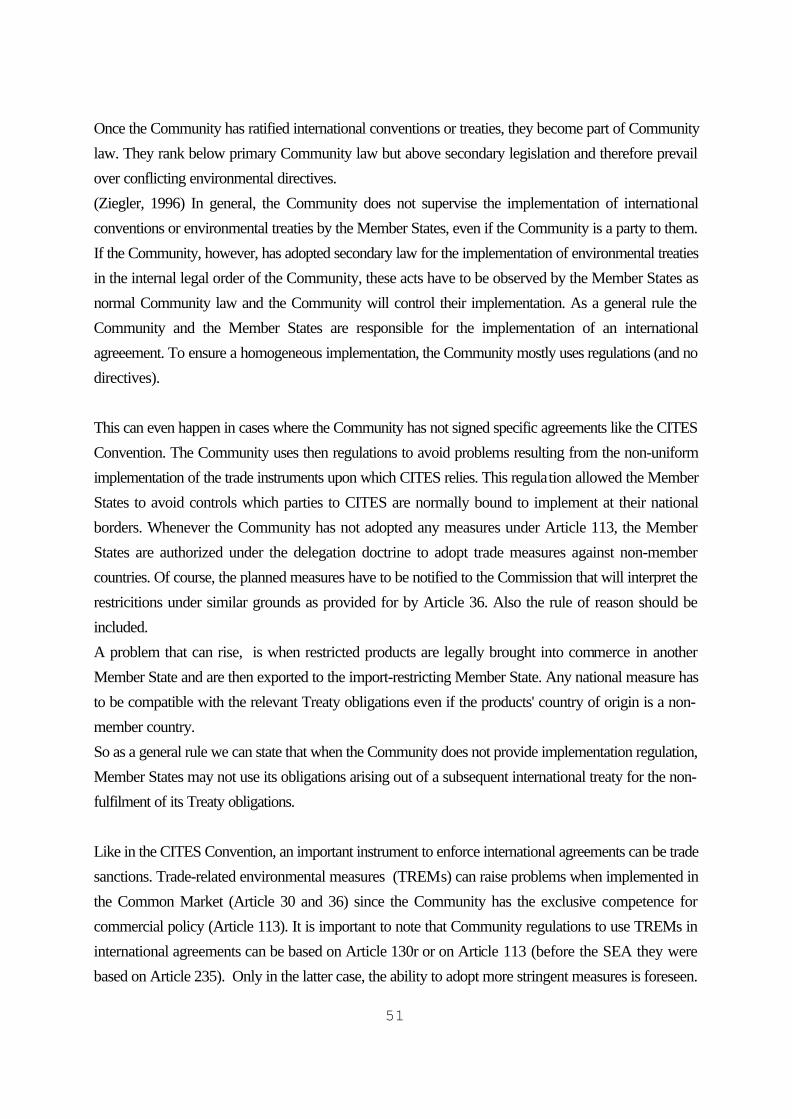
51
Once the Community has ratified international conventions or treaties, they become part of Communitylaw. They rank below primary Community law but above secondary legislation and therefore prevailover conflicting environmental directives.(Ziegler, 1996) In general, the Community does not supervise the implementation of internationalconventions or environmental treaties by the Member States, even if the Community is a party to them.If the Community, however, has adopted secondary law for the implementation of environmental treatiesin the internal legal order of the Community, these acts have to be observed by the Member States asnormal Community law and the Community will control their implementation. As a general rule theCommunity and the Member States are responsible for the implementation of an internationalagreeement. To ensure a homogeneous implementation, the Community mostly uses regulations (and nodirectives).
This can even happen in cases where the Community has not signed specific agreements like the CITESConvention. The Community uses then regulations to avoid problems resulting from the non-uniformimplementation of the trade instruments upon which CITES relies. This regulation allowed the MemberStates to avoid controls which parties to CITES are normally bound to implement at their nationalborders. Whenever the Community has not adopted any measures under Article 113, the MemberStates are authorized under the delegation doctrine to adopt trade measures against non-membercountries. Of course, the planned measures have to be notified to the Commission that will interpret therestricitions under similar grounds as provided for by Article 36. Also the rule of reason should beincluded.A problem that can rise, is when restricted products are legally brought into commerce in anotherMember State and are then exported to the import-restricting Member State. Any national measure hasto be compatible with the relevant Treaty obligations even if the products' country of origin is a non-member country.So as a general rule we can state that when the Community does not provide implementation regulation,Member States may not use its obligations arising out of a subsequent international treaty for the non-fulfilment of its Treaty obligations.
Like in the CITES Convention, an important instrument to enforce international agreements can be tradesanctions. Trade-related environmental measures (TREMs) can raise problems when implemented inthe Common Market (Article 30 and 36) since the Community has the exclusive competence forcommercial policy (Article 113). It is important to note that Community regulations to use TREMs ininternational agreements can be based on Article 130r or on Article 113 (before the SEA they werebased on Article 235). Only in the latter case, the ability to adopt more stringent measures is foreseen.
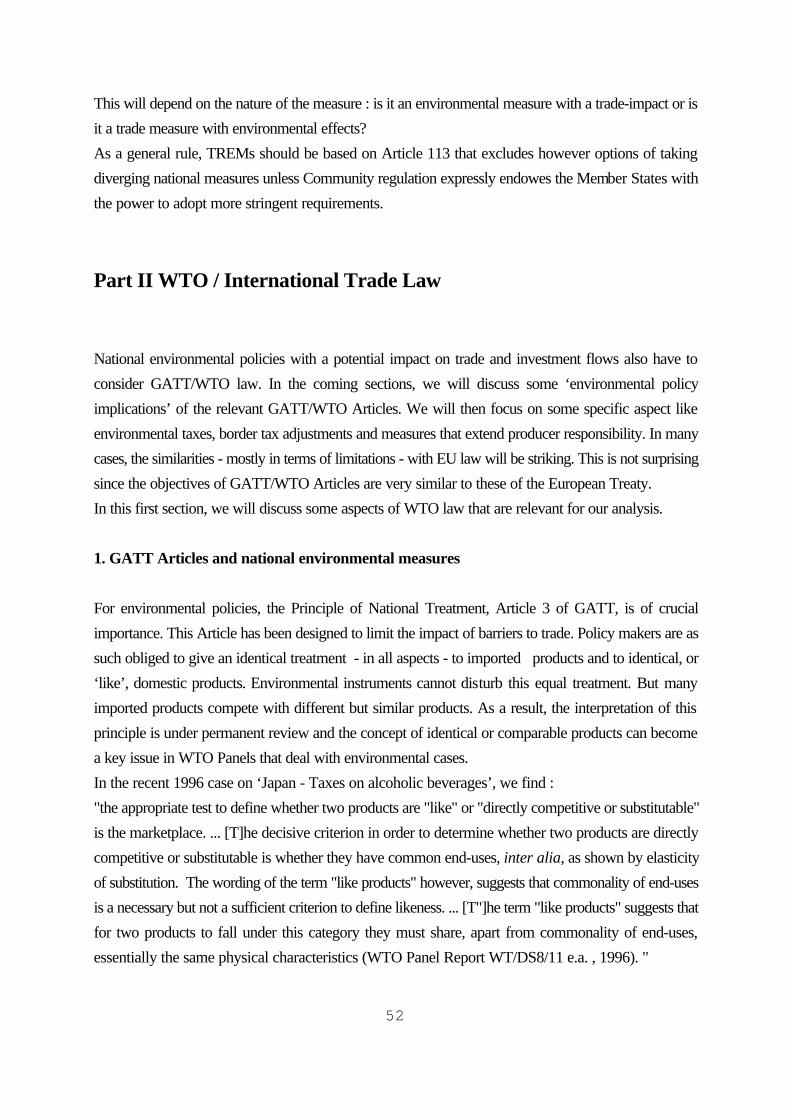
52
This will depend on the nature of the measure : is it an environmental measure with a trade-impact or isit a trade measure with environmental effects?As a general rule, TREMs should be based on Article 113 that excludes however options of takingdiverging national measures unless Community regulation expressly endowes the Member States withthe power to adopt more stringent requirements.
Part II WTO / International Trade Law
National environmental policies with a potential impact on trade and investment flows also have toconsider GATT/WTO law. In the coming sections, we will discuss some ‘environmental policyimplications’ of the relevant GATT/WTO Articles. We will then focus on some specific aspect likeenvironmental taxes, border tax adjustments and measures that extend producer responsibility. In manycases, the similarities - mostly in terms of limitations - with EU law will be striking. This is not surprisingsince the objectives of GATT/WTO Articles are very similar to these of the European Treaty.In this first section, we will discuss some aspects of WTO law that are relevant for our analysis.
1. GATT Articles and national environmental measures
For environmental policies, the Principle of National Treatment, Article 3 of GATT, is of crucialimportance. This Article has been designed to limit the impact of barriers to trade. Policy makers are assuch obliged to give an identical treatment - in all aspects - to imported products and to identical, or‘like’, domestic products. Environmental instruments cannot disturb this equal treatment. But manyimported products compete with different but similar products. As a result, the interpretation of thisprinciple is under permanent review and the concept of identical or comparable products can becomea key issue in WTO Panels that deal with environmental cases.In the recent 1996 case on ‘Japan - Taxes on alcoholic beverages’, we find :"the appropriate test to define whether two products are "like" or "directly competitive or substitutable"is the marketplace. ... [T]he decisive criterion in order to determine whether two products are directlycompetitive or substitutable is whether they have common end-uses, inter alia, as shown by elasticityof substitution. The wording of the term "like products" however, suggests that commonality of end-usesis a necessary but not a sufficient criterion to define likeness. ... [T"]he term "like products" suggests thatfor two products to fall under this category they must share, apart from commonality of end-uses,essentially the same physical characteristics (WTO Panel Report WT/DS8/11 e.a. , 1996). "
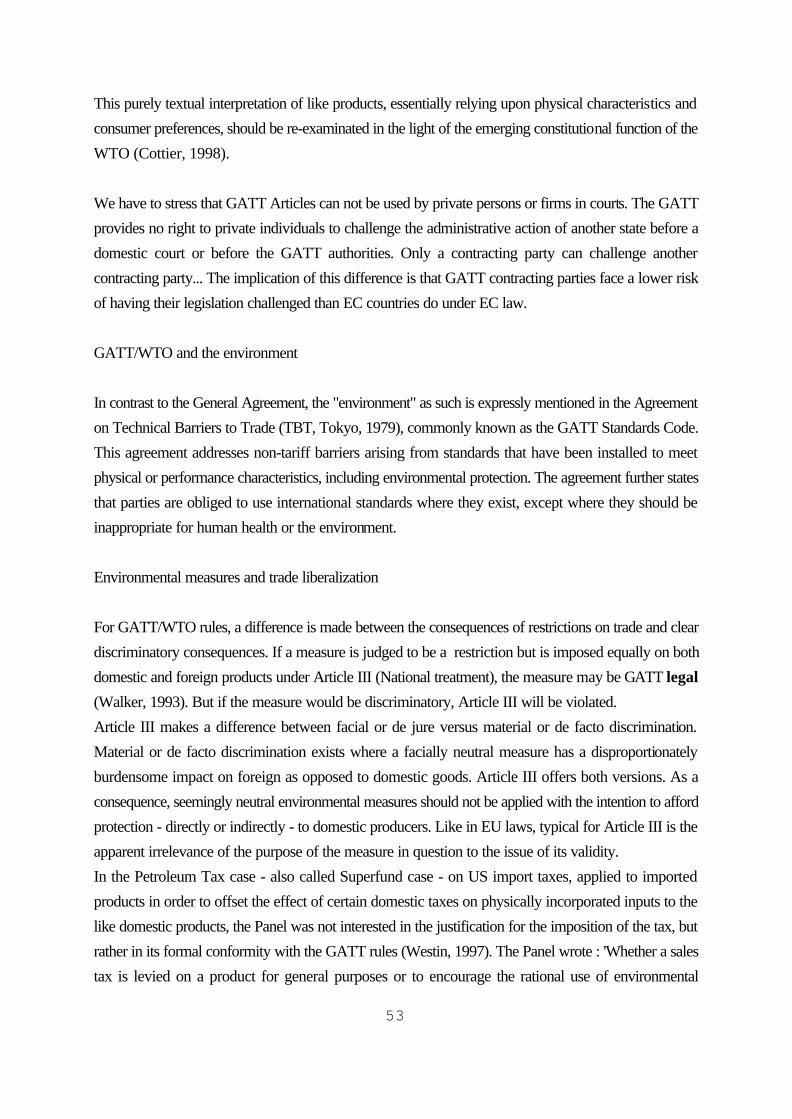
53
This purely textual interpretation of like products, essentially relying upon physical characteristics andconsumer preferences, should be re-examinated in the light of the emerging constitutional function of theWTO (Cottier, 1998).
We have to stress that GATT Articles can not be used by private persons or firms in courts. The GATTprovides no right to private individuals to challenge the administrative action of another state before adomestic court or before the GATT authorities. Only a contracting party can challenge anothercontracting party... The implication of this difference is that GATT contracting parties face a lower riskof having their legislation challenged than EC countries do under EC law.
GATT/WTO and the environment
In contrast to the General Agreement, the "environment" as such is expressly mentioned in the Agreementon Technical Barriers to Trade (TBT, Tokyo, 1979), commonly known as the GATT Standards Code.This agreement addresses non-tariff barriers arising from standards that have been installed to meetphysical or performance characteristics, including environmental protection. The agreement further statesthat parties are obliged to use international standards where they exist, except where they should beinappropriate for human health or the environment.
Environmental measures and trade liberalization
For GATT/WTO rules, a difference is made between the consequences of restrictions on trade and cleardiscriminatory consequences. If a measure is judged to be a restriction but is imposed equally on bothdomestic and foreign products under Article III (National treatment), the measure may be GATT legal(Walker, 1993). But if the measure would be discriminatory, Article III will be violated.Article III makes a difference between facial or de jure versus material or de facto discrimination.Material or de facto discrimination exists where a facially neutral measure has a disproportionatelyburdensome impact on foreign as opposed to domestic goods. Article III offers both versions. As aconsequence, seemingly neutral environmental measures should not be applied with the intention to affordprotection - directly or indirectly - to domestic producers. Like in EU laws, typical for Article III is theapparent irrelevance of the purpose of the measure in question to the issue of its validity.In the Petroleum Tax case - also called Superfund case - on US import taxes, applied to importedproducts in order to offset the effect of certain domestic taxes on physically incorporated inputs to thelike domestic products, the Panel was not interested in the justification for the imposition of the tax, butrather in its formal conformity with the GATT rules (Westin, 1997). The Panel wrote : 'Whether a salestax is levied on a product for general purposes or to encourage the rational use of environmental
54
resources, is therefore not relevant for the determination of the eligibility of a tax for border taxadjustment (Walker, 1993)'. It is also interesting to note that since exports were exempted from the tax,this tax clearly defeated the application of the ‘polluter pays principle’ because the pollution was causedduring the processing (Westin, 1997).
In contrast to taxation measures under Article III, if a prohibition falls under Article XI (Generalelimination of quantitative restrictions), the measure is always illegal under the GATT unless it can beexempted under one of the GATT exemptions. The measure does not have to discriminate explicitlyforeign producers.The applicable exemptions will most likely be Article XX b ( necessary to protect human, animal or plantlife or health) or Article XX g (relating to the conservation of exhaustible natural resources).
Article III offers more perspective for introducing environmental instruments than Article XI, but thereare some problematic interpretations of the impact of environmental measures. A measure should notdiscriminate and therefore the impact of the measure is more important than the regulatory design thatcould be perfectly neutral.If as a result of a neutral measure, foreign companies might be required to produce a special product linefor the country concerned, thereby raising the cost of these products, particularly if the country’s marketis not a principal one, the measure would not be legal under the GATT.For the EU, we discussed the implications of the Dassonville Formula. The potential impact ofenvironmental measures on the marketing of foreign products has then been investigated. For theGATT/WTO, there has been a GATT Panel stating that Article III.4 establishes the principle of 'effectiveequality of opportunity for imported products' with respect to their sale, distribution or use (Walker,1993). It is highly probable that bona fide environmental regulations and standards will frequently applymore favourably to domestic products than foreign ones because national legislators mostly tend to takeinto account specific local conditions and priorities. We can conclude that the threat to environmentalmeasures under Article III is significant. If this absolute equality interpretation of non-discrimination willbe used in all Panels, countries would have to resort with increasing frequency to the provisions of ArticleXX in order to defend the validity of their provisions. This raises the issue of whether GATT panelsshould protect facially neutral environmental regulations which require minor adjustments by foreignproducers. An option could be a de minimis threshold demarcating significant from insignificant restrictiveeffects of environmental regulation.
The exceptions under Article XX
Article XX (b) and Article XX (g) foresee exceptions if there should be dangers for health or resource
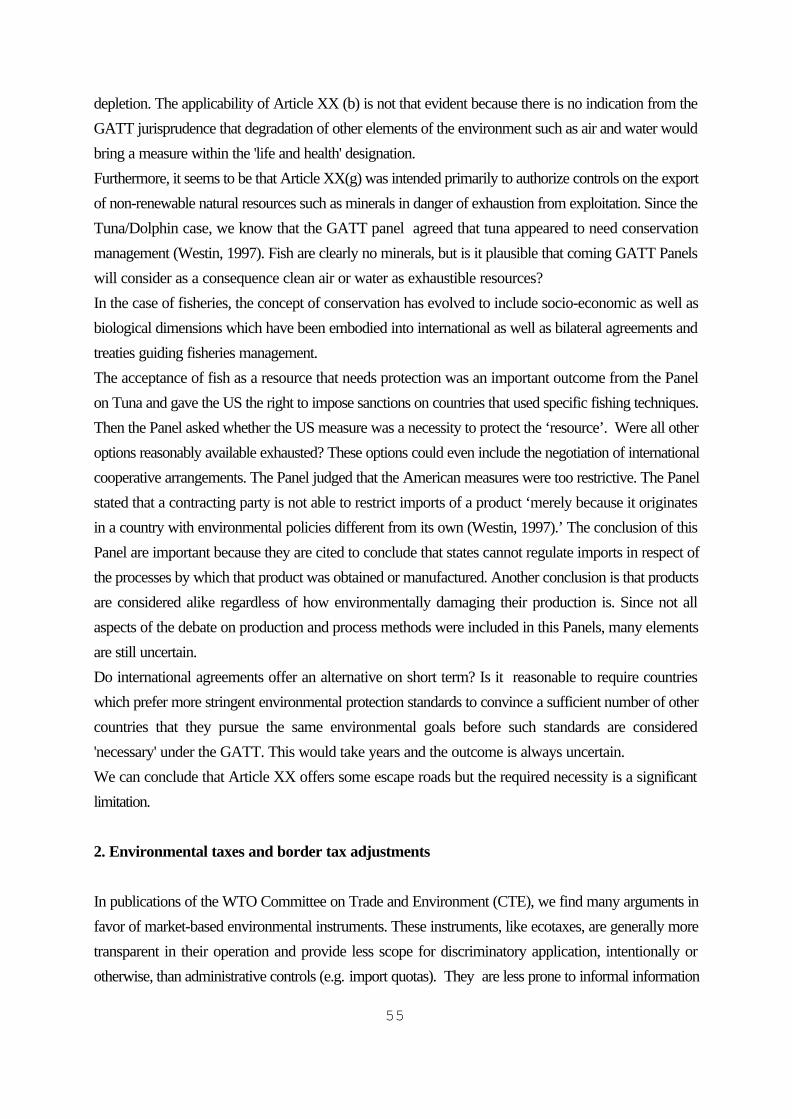
55
depletion. The applicability of Article XX (b) is not that evident because there is no indication from theGATT jurisprudence that degradation of other elements of the environment such as air and water wouldbring a measure within the 'life and health' designation.Furthermore, it seems to be that Article XX(g) was intended primarily to authorize controls on the exportof non-renewable natural resources such as minerals in danger of exhaustion from exploitation. Since theTuna/Dolphin case, we know that the GATT panel agreed that tuna appeared to need conservationmanagement (Westin, 1997). Fish are clearly no minerals, but is it plausible that coming GATT Panelswill consider as a consequence clean air or water as exhaustible resources?In the case of fisheries, the concept of conservation has evolved to include socio-economic as well asbiological dimensions which have been embodied into international as well as bilateral agreements andtreaties guiding fisheries management.The acceptance of fish as a resource that needs protection was an important outcome from the Panelon Tuna and gave the US the right to impose sanctions on countries that used specific fishing techniques.Then the Panel asked whether the US measure was a necessity to protect the ‘resource’. Were all otheroptions reasonably available exhausted? These options could even include the negotiation of internationalcooperative arrangements. The Panel judged that the American measures were too restrictive. The Panelstated that a contracting party is not able to restrict imports of a product ‘merely because it originatesin a country with environmental policies different from its own (Westin, 1997).’ The conclusion of thisPanel are important because they are cited to conclude that states cannot regulate imports in respect ofthe processes by which that product was obtained or manufactured. Another conclusion is that productsare considered alike regardless of how environmentally damaging their production is. Since not allaspects of the debate on production and process methods were included in this Panels, many elementsare still uncertain.Do international agreements offer an alternative on short term? Is it reasonable to require countrieswhich prefer more stringent environmental protection standards to convince a sufficient number of othercountries that they pursue the same environmental goals before such standards are considered'necessary' under the GATT. This would take years and the outcome is always uncertain.We can conclude that Article XX offers some escape roads but the required necessity is a significantlimitation.
2. Environmental taxes and border tax adjustments
In publications of the WTO Committee on Trade and Environment (CTE), we find many arguments infavor of market-based environmental instruments. These instruments, like ecotaxes, are generally moretransparent in their operation and provide less scope for discriminatory application, intentionally orotherwise, than administrative controls (e.g. import quotas). They are less prone to informal information
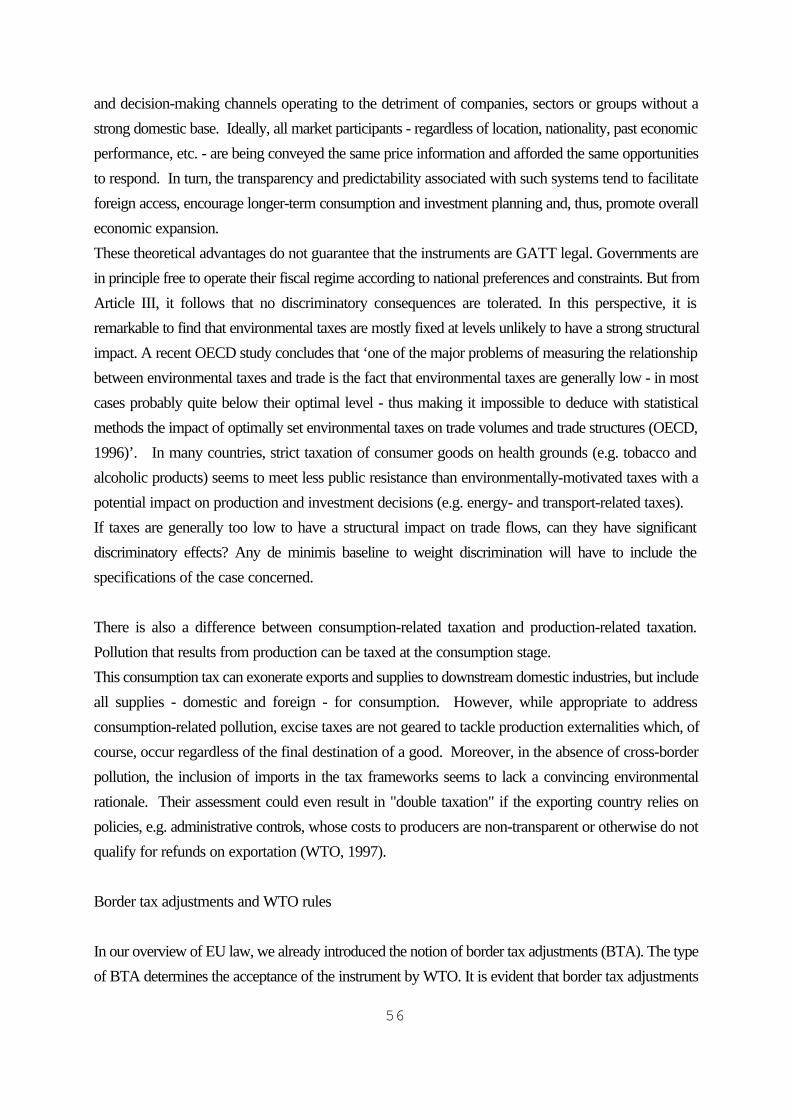
56
and decision-making channels operating to the detriment of companies, sectors or groups without astrong domestic base. Ideally, all market participants - regardless of location, nationality, past economicperformance, etc. - are being conveyed the same price information and afforded the same opportunitiesto respond. In turn, the transparency and predictability associated with such systems tend to facilitateforeign access, encourage longer-term consumption and investment planning and, thus, promote overalleconomic expansion.These theoretical advantages do not guarantee that the instruments are GATT legal. Governments arein principle free to operate their fiscal regime according to national preferences and constraints. But fromArticle III, it follows that no discriminatory consequences are tolerated. In this perspective, it isremarkable to find that environmental taxes are mostly fixed at levels unlikely to have a strong structuralimpact. A recent OECD study concludes that ‘one of the major problems of measuring the relationshipbetween environmental taxes and trade is the fact that environmental taxes are generally low - in mostcases probably quite below their optimal level - thus making it impossible to deduce with statisticalmethods the impact of optimally set environmental taxes on trade volumes and trade structures (OECD,1996)’. In many countries, strict taxation of consumer goods on health grounds (e.g. tobacco andalcoholic products) seems to meet less public resistance than environmentally-motivated taxes with apotential impact on production and investment decisions (e.g. energy- and transport-related taxes).If taxes are generally too low to have a structural impact on trade flows, can they have significantdiscriminatory effects? Any de minimis baseline to weight discrimination will have to include thespecifications of the case concerned.
There is also a difference between consumption-related taxation and production-related taxation.Pollution that results from production can be taxed at the consumption stage.This consumption tax can exonerate exports and supplies to downstream domestic industries, but includeall supplies - domestic and foreign - for consumption. However, while appropriate to addressconsumption-related pollution, excise taxes are not geared to tackle production externalities which, ofcourse, occur regardless of the final destination of a good. Moreover, in the absence of cross-borderpollution, the inclusion of imports in the tax frameworks seems to lack a convincing environmentalrationale. Their assessment could even result in "double taxation" if the exporting country relies onpolicies, e.g. administrative controls, whose costs to producers are non-transparent or otherwise do notqualify for refunds on exportation (WTO, 1997).
Border tax adjustments and WTO rules
In our overview of EU law, we already introduced the notion of border tax adjustments (BTA). The typeof BTA determines the acceptance of the instrument by WTO. It is evident that border tax adjustments
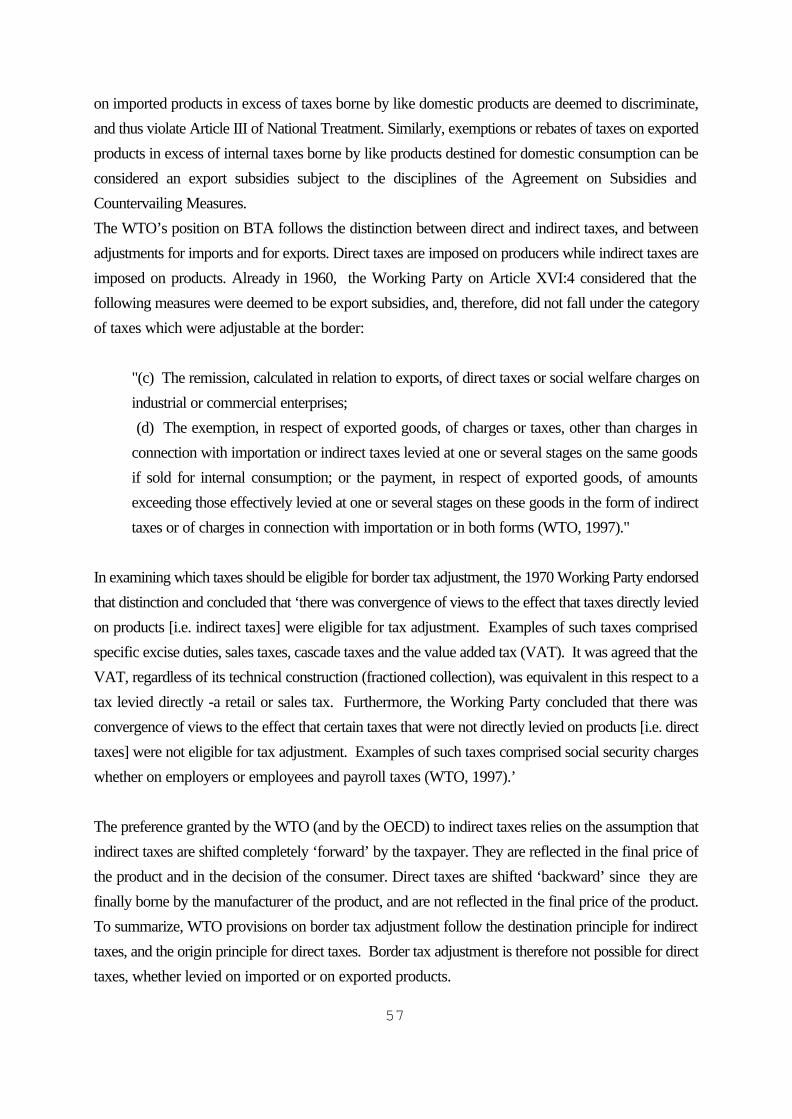
57
on imported products in excess of taxes borne by like domestic products are deemed to discriminate,and thus violate Article III of National Treatment. Similarly, exemptions or rebates of taxes on exportedproducts in excess of internal taxes borne by like products destined for domestic consumption can beconsidered an export subsidies subject to the disciplines of the Agreement on Subsidies andCountervailing Measures.The WTO’s position on BTA follows the distinction between direct and indirect taxes, and betweenadjustments for imports and for exports. Direct taxes are imposed on producers while indirect taxes areimposed on products. Already in 1960, the Working Party on Article XVI:4 considered that thefollowing measures were deemed to be export subsidies, and, therefore, did not fall under the categoryof taxes which were adjustable at the border:
"(c) The remission, calculated in relation to exports, of direct taxes or social welfare charges onindustrial or commercial enterprises; (d) The exemption, in respect of exported goods, of charges or taxes, other than charges inconnection with importation or indirect taxes levied at one or several stages on the same goodsif sold for internal consumption; or the payment, in respect of exported goods, of amountsexceeding those effectively levied at one or several stages on these goods in the form of indirecttaxes or of charges in connection with importation or in both forms (WTO, 1997)."
In examining which taxes should be eligible for border tax adjustment, the 1970 Working Party endorsedthat distinction and concluded that ‘there was convergence of views to the effect that taxes directly leviedon products [i.e. indirect taxes] were eligible for tax adjustment. Examples of such taxes comprisedspecific excise duties, sales taxes, cascade taxes and the value added tax (VAT). It was agreed that theVAT, regardless of its technical construction (fractioned collection), was equivalent in this respect to atax levied directly -a retail or sales tax. Furthermore, the Working Party concluded that there wasconvergence of views to the effect that certain taxes that were not directly levied on products [i.e. directtaxes] were not eligible for tax adjustment. Examples of such taxes comprised social security chargeswhether on employers or employees and payroll taxes (WTO, 1997).’
The preference granted by the WTO (and by the OECD) to indirect taxes relies on the assumption thatindirect taxes are shifted completely ‘forward’ by the taxpayer. They are reflected in the final price ofthe product and in the decision of the consumer. Direct taxes are shifted ‘backward’ since they arefinally borne by the manufacturer of the product, and are not reflected in the final price of the product.To summarize, WTO provisions on border tax adjustment follow the destination principle for indirecttaxes, and the origin principle for direct taxes. Border tax adjustment is therefore not possible for directtaxes, whether levied on imported or on exported products.
58
* Border tax adjustments on imported goods
One of the basic purposes of Article III National Treatment is to ensure that internal charges andregulations are not such as to frustrate the effect of tariff concessions granted under Article II.. However, Article III applies whether or not the product concerned is subject to a tariff concession andwhether or not adverse trade effects occurred. The purpose of that provision is to establish certaincompetitive conditions for imported products in relation to domestic products; it is not to protectexpectations on export volumes.The relevant question becomes whether or not the BTA has a discriminatory impact on the importedproducts. This does not mean that the BTA should be identical to the internal tax level. In the PanelReport ‘Japan - Taxes on alcoholic beverages’ we find :‘There could be objective reasons proper to the tax in question which could justify or necessitatedifferences in the system of taxation for imported and for domestic products. ...[i]t could be alsocompatible with Article III:2 to allow two different methods of calculation of price for tax purposes. Since Article III:2 prohibited only discriminatory or protective tax burdens on imported products, whatmattered was, ..., whether the application of the different taxation methods actually had a discriminatoryor protective effect against imported products (WTO, Panel Report, 1996)’.If the level of the BTA exceeds the internal tax level without a clear objective reason, the smallest amountof “excess” taxation is too much (ibid). So there is still no de minimis standard used to evaluate the tradeeffects of differences in taxation. In the Appellate Body Report on this case, we find however that acase-by-case approach is used so the principle of a de minimis impact is not excluded for other cases.
* Border tax adjustments on exported products
This BTA is also allowed under GATT provisions.The exemption from, or refund of, taxes borne by like domestic products cannot be subject to anti-dumping or countervailing duties, as stated in Article VI:4 of GATT 1994:"No product of the territory of any contracting party imported into the territory of any other contractingparty shall be subject to anti-dumping or countervailing duty by reason of the exemption of such productfrom duties or taxes borne by the like product when destined for consumption in the country of originor exportation, or by reason of the refund of such duties or taxes (WTO, 1997)."The fact that border tax adjustment on exported products is not countervailable was confirmed bydispute settlement practice.
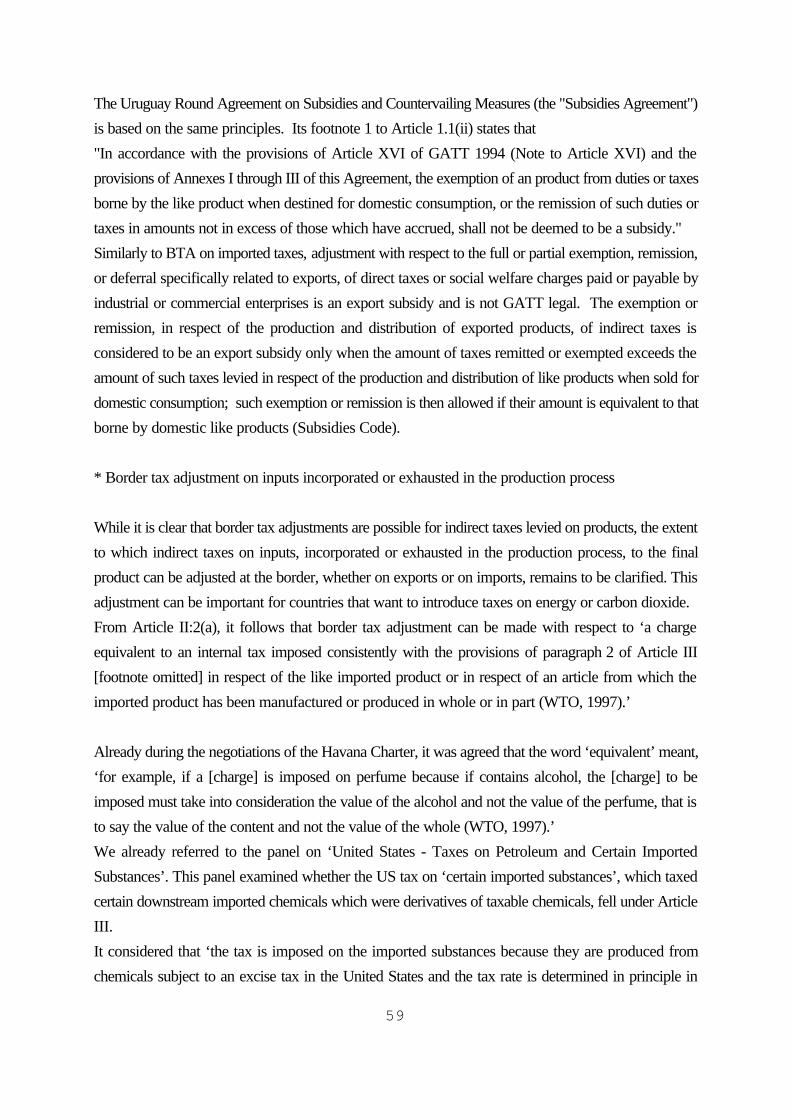
59
The Uruguay Round Agreement on Subsidies and Countervailing Measures (the "Subsidies Agreement")is based on the same principles. Its footnote 1 to Article 1.1(ii) states that"In accordance with the provisions of Article XVI of GATT 1994 (Note to Article XVI) and theprovisions of Annexes I through III of this Agreement, the exemption of an product from duties or taxesborne by the like product when destined for domestic consumption, or the remission of such duties ortaxes in amounts not in excess of those which have accrued, shall not be deemed to be a subsidy."Similarly to BTA on imported taxes, adjustment with respect to the full or partial exemption, remission,or deferral specifically related to exports, of direct taxes or social welfare charges paid or payable byindustrial or commercial enterprises is an export subsidy and is not GATT legal. The exemption orremission, in respect of the production and distribution of exported products, of indirect taxes isconsidered to be an export subsidy only when the amount of taxes remitted or exempted exceeds theamount of such taxes levied in respect of the production and distribution of like products when sold fordomestic consumption; such exemption or remission is then allowed if their amount is equivalent to thatborne by domestic like products (Subsidies Code).
* Border tax adjustment on inputs incorporated or exhausted in the production process
While it is clear that border tax adjustments are possible for indirect taxes levied on products, the extentto which indirect taxes on inputs, incorporated or exhausted in the production process, to the finalproduct can be adjusted at the border, whether on exports or on imports, remains to be clarified. Thisadjustment can be important for countries that want to introduce taxes on energy or carbon dioxide.From Article II:2(a), it follows that border tax adjustment can be made with respect to ‘a chargeequivalent to an internal tax imposed consistently with the provisions of paragraph 2 of Article III[footnote omitted] in respect of the like imported product or in respect of an article from which theimported product has been manufactured or produced in whole or in part (WTO, 1997).’
Already during the negotiations of the Havana Charter, it was agreed that the word ‘equivalent’ meant,‘for example, if a [charge] is imposed on perfume because if contains alcohol, the [charge] to beimposed must take into consideration the value of the alcohol and not the value of the perfume, that isto say the value of the content and not the value of the whole (WTO, 1997).’We already referred to the panel on ‘United States - Taxes on Petroleum and Certain ImportedSubstances’. This panel examined whether the US tax on ‘certain imported substances’, which taxedcertain downstream imported chemicals which were derivatives of taxable chemicals, fell under ArticleIII.It considered that ‘the tax is imposed on the imported substances because they are produced fromchemicals subject to an excise tax in the United States and the tax rate is determined in principle in
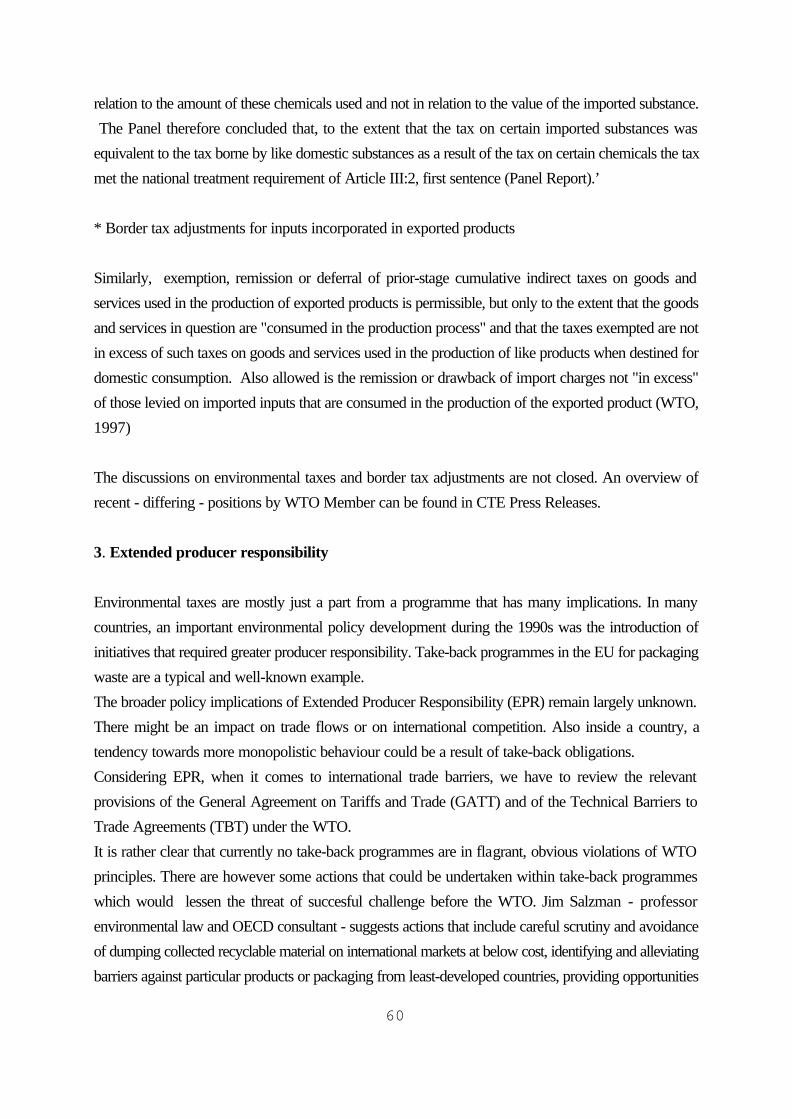
60
relation to the amount of these chemicals used and not in relation to the value of the imported substance. The Panel therefore concluded that, to the extent that the tax on certain imported substances wasequivalent to the tax borne by like domestic substances as a result of the tax on certain chemicals the taxmet the national treatment requirement of Article III:2, first sentence (Panel Report).’
* Border tax adjustments for inputs incorporated in exported products
Similarly, exemption, remission or deferral of prior-stage cumulative indirect taxes on goods andservices used in the production of exported products is permissible, but only to the extent that the goodsand services in question are "consumed in the production process" and that the taxes exempted are notin excess of such taxes on goods and services used in the production of like products when destined fordomestic consumption. Also allowed is the remission or drawback of import charges not "in excess"of those levied on imported inputs that are consumed in the production of the exported product (WTO,1997)
The discussions on environmental taxes and border tax adjustments are not closed. An overview ofrecent - differing - positions by WTO Member can be found in CTE Press Releases.
3. Extended producer responsibility
Environmental taxes are mostly just a part from a programme that has many implications. In manycountries, an important environmental policy development during the 1990s was the introduction ofinitiatives that required greater producer responsibility. Take-back programmes in the EU for packagingwaste are a typical and well-known example.The broader policy implications of Extended Producer Responsibility (EPR) remain largely unknown.There might be an impact on trade flows or on international competition. Also inside a country, atendency towards more monopolistic behaviour could be a result of take-back obligations.Considering EPR, when it comes to international trade barriers, we have to review the relevantprovisions of the General Agreement on Tariffs and Trade (GATT) and of the Technical Barriers toTrade Agreements (TBT) under the WTO.It is rather clear that currently no take-back programmes are in flagrant, obvious violations of WTOprinciples. There are however some actions that could be undertaken within take-back programmeswhich would lessen the threat of succesful challenge before the WTO. Jim Salzman - professorenvironmental law and OECD consultant - suggests actions that include careful scrutiny and avoidanceof dumping collected recyclable material on international markets at below cost, identifying and alleviatingbarriers against particular products or packaging from least-developed countries, providing opportunities
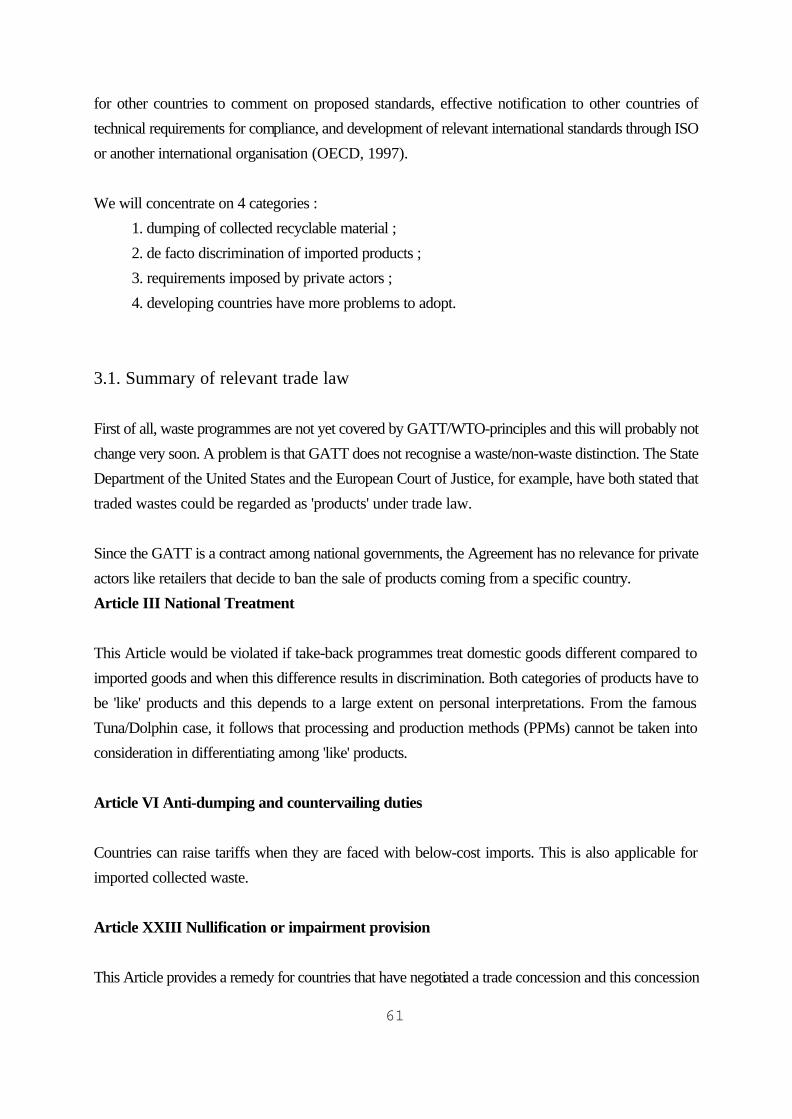
61
for other countries to comment on proposed standards, effective notification to other countries oftechnical requirements for compliance, and development of relevant international standards through ISOor another international organisation (OECD, 1997).
We will concentrate on 4 categories :1. dumping of collected recyclable material ;2. de facto discrimination of imported products ;3. requirements imposed by private actors ;4. developing countries have more problems to adopt.
3.1. Summary of relevant trade law
First of all, waste programmes are not yet covered by GATT/WTO-principles and this will probably notchange very soon. A problem is that GATT does not recognise a waste/non-waste distinction. The StateDepartment of the United States and the European Court of Justice, for example, have both stated thattraded wastes could be regarded as 'products' under trade law.
Since the GATT is a contract among national governments, the Agreement has no relevance for privateactors like retailers that decide to ban the sale of products coming from a specific country.Article III National Treatment
This Article would be violated if take-back programmes treat domestic goods different compared toimported goods and when this difference results in discrimination. Both categories of products have tobe 'like' products and this depends to a large extent on personal interpretations. From the famousTuna/Dolphin case, it follows that processing and production methods (PPMs) cannot be taken intoconsideration in differentiating among 'like' products.
Article VI Anti-dumping and countervailing duties
Countries can raise tariffs when they are faced with below-cost imports. This is also applicable forimported collected waste.
Article XXIII Nullification or impairment provision
This Article provides a remedy for countries that have negotiated a trade concession and this concession
62
is significantly diminished by an action that was not reasonably foreseeable.Take-back laws can be a case where former concessions are reduced or influenced by unforeseenobligations.
Article XX Legitimate exceptions
Article XX's exceptions do not apply if the measures are applied in an arbitrary or unjustifiable manner,or operate as a disguided restriction on trade. Legitimate environmental protection are covered byArticle XX(b) and XX(g). This last clause is important for laws that violate other GATT Articles but thatare directed at conserving a domestic exhaustible natural resource and place comparable burdens onboth domestic and imported products.
Technical Barriers to Trade Agreement (TBT)
The TBT was adopted during the recent Uruguay Round of trade negotiations. Its coverage includestechnical standards (voluntary) and technical regulation (mandatory), including symbols, marketing andlabelling requirements.Article 2 of TBT deals with 'Preparation, Adoption and Application of Technical Regulations by CentralGovernment Bodies'. These rules would apply to many environmental programmes in different countriesbut would probably not cover rules set by private collection companies such Duales System Deutschland(DSD). But government is assumed reponsible for private standard setting in the 'Code of Good Practicefor Preparation, Adoption and Application of Standards'.TBT Article 2.2
Regulation cannot be prepared with a view of creating unnecessary obstacles to international trade. Ameasure cannot be more trade restrictive than necessary for a legitimate objective, includingenvironmental protection.
TBT Article 2.9
In preparing new technical standards, the government must notify the TBT Secretariat of the standards'sobjectives and rationale at an early stage that amendments from Member Countries can be introducedand taken into account.
63
3.2. Legal analysis of the hypotheticals
Hypothetical 1 : Dumping Recyclable Material
A high level of collection and recovery can cause problems when the country has insufficient recyclingcapacity. Germany confronted this problem immediately with plastic, paper and carton board. Much ofthe excess was pushed onto the international market at low or no cost to regions as distant as the PacificRim. This flooding of markets with cheap recyclable material can harm local recycling schemes. Whystill collect own waste at a cost that exceeds the export price of foreign collected materials? It happenedthat with sorted plastic and paper on offer for little or nothing, re-processors turned away from localrecycling organisations, denying them a substantial stream of income.Like already mentioned, GATT does not make any difference between waste and other products thusrecyclable material could be subject of a countervailing duty. Like other products, the duty will becalibrated to the 'margin of dumping' which restores the price to its level prior to lowering orsubsidisation. But since German waste is not collected in order to gain a large market share abroad, andsince there is no difference between the foreign and domestic price, the countervailing duty will be a falseinflation of prices.This problematic situation will probably not occur that often.The EU Packaging Directive explicitly prohibits operation of packaging take-back programmes with arecycling requirement above 45 percent unless the country has a domestic recycling capacity to handlethe excess amount without distorting the Internal Market.
A local variant to dumping, expressed as an industry subsidy, is also worth examining. It can be thattake-back programmes result in national price advantages for products with an important recycledcontent, just because the government imposed or supported collection schemes. The Uruguay Round'sAgreement on Subsidies and Countervailing Measures could apply. But mostly, the government doesnot pay a direct subsidy to the users of recycled material - comparable to unemployment measures thatfavour labourers without qualifications - so the situation is not countervailable.
Hypothetical 2 : De Facto Discrimination
Most GATT challenges to environmental measures have involved de jure discrimination, cases wherethe law openly treats foreign products differently.With not openly discriminating laws, a de facto discrimination can be argued. There are three basic typesof injuries ; added costs to meet different requirements in different countries, discrimination against
64
foreign goods' transit packaging (more robust for the longer trip) and an inferior bargaining powerbecause foreign manufacturers will have little or no choice but to join large collection systems.
The leading GATT case on de facto discrimination is the 1994 dispute panel decision on AutomobileTaxes. De jure discrimination was absent in the case but the Panel noted that for a measure to be subjectto Article III, it does not have to regulate a product directly. It only has to affect the conditions ofcompetition between domestic and imported products. But while facially neutral measures can violateArticle III, both the effect and purpose must be inherently discriminatory.And to show that the intent of the measure is to protect local companies is not that obvious.The Panel concluded that the purpose of Article III is not to prevent contracting parties from using theirfiscal and regulatory powers for purposes other than to afford protection to domestic production.Incidental trade barriers, if not intended to protect local companies, should not violate Article III.
An alternative might be Article XXIII, the nullification and impairment clause, that may become moreimportant as take-back requirements extend to complex, high value goods which have negotiated tariffs(e.g. cars).But if we assume that Article III or XXIII is violated, then country Z may still avoid a GATT violationby qualifying for the exception of Article XX(g) but until now, no dispute panel has addressed whetherlandfill qualifies as an exhaustible natural resource under Article XX.
Since TBT has not yet been interpreted by a WTO dispute panel, its application to take-backprogrammes is uncertain. A threshold question is whether the TBT applies at all, i.e., whether take-backlaws meet the definition of a technical regulation. They might be considered product 'related processes'that can influence product design and this could be interpreted as a technical regulation that creates anunnecessary obstacle to international trade. To judge it as unnecessary, alternatives that do not distortcompetitive balances should be formulated.In the future, take-back laws expand their reach from packaging to other, more valuable products likecomputers and this will imply re-use, special designs (with standardised components) and even theconstruction of regional processing facilities.
Hypothetical 3 : Private Actors
We wonder what could be the consequences when the private collection system does not accept acertain type of packaging and excludes as such foreign producers from the market.GATT disciplines presumptively do not apply to private companies and since the standards used by thiscompany are voluntary (one has the free choice to participate in the programme or not), the TBT Articles
65
do not apply.If the used standards create problems for foreign producers, and simple measures could remove thisconcerns, the home country would be held responsible for bringing the standards in line with the disputepanel's holding.The private firms that manage the take-back programmes exist in fact by state approval, are in somecountries state-regulated monopolies, what makes that their acts qualify as government actions. Thereach of the GATT and TBT to quasi-state entities is unclear, but the arguments above warrant conside-ration.
Hypothetical 4 : Developing Countries
GATT and TBT provide special treatment for developing countries. At the moment, private collectionschemes do not appear to make special arrangements for products from developing countries. Theresulted in some cases like that of the Kenyan flower crates where special assistance was necessary.With the expansion of take-back programmes among many countries and for more and more products,expensive assistance could be an unexpected consequence.
66
III. Conclusions
As could be expected, both the EU and the WTO offer the possibility to introduce nationalenvironmental instruments. The increased use of market-based instruments is clearly encouraged.Many considerations have to be taken when designing the new instruments. The instrument should haveno discriminatory impact, directly or indirectly, and the environmental objective should be clearlyformulated. Exception clauses are foreseen by the EU and the WTO. In any case, the measure shouldalways be in proportion to the environmental objective.
67
References
Barnes, I. and Barnes, P., 1995, The Enlarged European Union (Longman, London)
Bhagwati, Jagdish, 1997, Writings on International Economics (Oxford University Press, Delhi)
COM(96)54 final, Communication to the Council and to the Parliament on Trade and Environment
COM(96) 561 final, Communication from the Commission to the Council and the European Parliament onEnvironmental Agreements
COM(97)9, Environmental Taxes and Charges in the Single Market
Cottier, Thomas, 1998, The WTO and Environmental Law : three points for discussion, in : Fijalkowski, Agata, andCameron, James (eds), Trade and the environment : bridging the gap, (Cameron May Ltd, The Hague), pp.56-65
Esty, Daniel C., 1994, Greening the GATT (Institute for International Economics, Washington)
EU, 1990, “1992" The Environmental Dimension, Task Force Report on Environment and the Internal Market(Economica Verlag, Bonn)
EUR-OP Info NEWS, various issues
Europese Commissie, 1996, Werkgelegenheid in Europa (COM(95)396) (EG, Luxemburg)
Europese Commissie, 1998, Algemeen Verslag over de Werkzaamheden van de Europese Unie 1997 (EG, Brussel)
Europese Commissie, 1997 and 1998, Bulletin van de Europese Unie, various issues
Eurostat, 1997, Energy Balance Sheets, 1994-1995
Groep van Lissabon, 1995, Grenzen aan de Concurrentie (VUBPress, Brussel)
Hanley, N., Shogren, J. and White, B., 1997, Environmental Economics in Theory and Practice (MacMillan Press,London)
Klatte, E., 1997, The Principle of Intergration after 25 Years of Community Environmental Policy, speech at TheCommunity’s Environmental Policy at 25 : Stocktaking and Future Prospects Conference, Brussels, 17-18 October 1997
Krämer, L., 1997, Integrated European-wide Waste Management has yet to be created, in : L’Echomanager 9/97
Krämer, L., 1997, General Principles of Community Environmental Law and their Translation into Secondary Law,speech at The Community’s Environmental Policy at 25 : Stocktaking and Future Prospects Conference, Brussels, 17-18 October 1997
68
Lenaerts, Koen and Van Nuffel, Piet, 1995, Europees Recht in Hoofdlijnen (MAKLU, Antwerpen)
Mc Cahery, Bratton, Picciotto, Scott, 1996, International Regulatory Competition and Coodination (Clarendon Press,Oxford)
Mander, J. and Goldsmith, E., 1996, The Case against the Global Economy (Sierra Books, San Francisco)
Micosi, Stefano (DG III), 1996, Industry and Environment : EU Regulation (Speech at the ICC, Rome)
OCDE/GD(97)137, Processes and Production Methods (PPMs) : Conceptual Framework and Considerations on Useof PPM-based Trade Measures
OECD, 1996, Implementation Strategies for Environmental Taxes
OECD, 1997, ENV/EPOC/WMP/RD(97)3, Extended Producer Responsibility : Take-back Programmes and InternationalTrade Law
Pelkmans, J., 1997, European Integration (Addison Wesley Longman, Essex)
Petrella, R., 1997, Community Environmental Policy in an Age of Globalization : Liberalization, Privatization andDeregulation, speech at The Community’s Environmental Policy at 25 : Stocktaking and Future Prospects Conference,Brussels, 17-18 October 1997
Walker, Sandra L., 1993, Environmental Protection versus Trade Liberalization : finding the Balance (Publications desFacultés universitaires Saint-Louis, Bruxelles)
Westin, Richard A., 1997, Environmental Tax Initiatives and Multilateral Trade Agreements : dangerous collisions(Kluwer Law International, The Hague)
Wieringa, Keimpe, 1995, Report for the Review of the 5th EAP (EEA, Copenhagen
Williams, R., 1997, The European Commission as “Guardian” of Community Environmental Law, speech at TheCommunity’s Environmental Policy at 25 : Stocktaking and Future Prospects Conference, Brussels, 17-18 October 1997
WTO, 1997, Press/TE 018, WTO Committee on Trade and Environment discusses Environmental Reviews, Border taxAdjustments, Eco-labelling and Packaging
WTO, 1996, WT/CTE/W/28, The Provisions of the Multilateral Trading System with Respect to the Transparency ofTrade Measures used for Environmental Purposes
WTO, 1997, WT/CTE/W/47, Taxes and Charges for Environmental Purposes - Border Tax Adjustment
Ziegler, Andreas, 1996, Trade and Environmental Law in the European Community (Clarendon Press, Oxford)
Paper presented at the GREENING THE BUDGET Conference,ifo Institut für Wirtschaftsforschung, München, May 11-12, 1998
Environmental Consumer Subsidies and PotentialReductions of CO2 Emissions
Johan Albrecht, CEEM- University of Ghent*
1. Introduction
In the environmental debate, global problems clearly gained importance. Successful internationalconventions could reduce the threats posed by acid rain, ozone depletion and hazardous wastes.Next to end-of-pipe solutions (like placing scrubbers), cleaner inputs (like low-sulphur coal),cleaner products or retrofit processes (replacing CFCs by HCFCs and HFCs) were available indue course.Acid rain and ozone depletion are problems caused by specific industrial activities, processes orproducts, whereas global warming and the resulting climate change are the consequence of amultitude of factors, most of them related to energy use. This limits the possibility of solving theproblem with just one set of substituting technologies. It will be necessary to work out aconcerted strategy that exploits all potential efficiency gains in all layers of society. We will needto modify whole structures, institutions and behaviours. Therefore we can use economicinstruments like taxes, subsidies and tradable permits.We will try to estimate the potential of environmental subsidies in terms of reductions of energyuse and CO2 emissions. In the next sections, we will comment on the Kyoto Protocol and theprojected CO2 emissions in the European Union. Starting from data on sectoral energy efficiency,we will indicate policy priorities and will present a short overview of instruments. In the finalsections, we work out three types of consumer subsidies and estimate their potential of reducingCO2 emissions.
* Funded by OSTC (Belgian Federal Office for Scientific, Technological and Cultural Affairs,Programme on Sustainable Development). The views presented are those of the author. E-mail : [email protected]
2
We will conclude that these subsidies - basic but attractive instruments for politicians - can bean important step in achieving the Kyoto targets.
2. The Kyoto Protocol
In December 1997, developed countries agreed in Kyoto to reduce significantly emissions ofgreenhouse gases (GHG) resulting from human activities by the commitment period 2008 to2012. Each developed country will have to demonstrate significant progress by 2005.For the European Union, the agreed reduction will be 8% of the emissions in 1990. Comparedto the initial European proposal to reduce emissions of greenhouse gases by 15% - a realisticreduction according to the EC-, the agreed reduction target should not pose serious problems.As a result of the important reductions of greenhouse gases in Germany and the UK, actualemissions in the EU only slightly exceed the 1990-level. This means that all the neededreductions will have to take place without delay. Furthermore, CO2 and other emissions inGermany will not continue to decrease. This is crucial since the relative weight of Germanemissions in the total emissions in the EU amounts to almost 30%. For the period 1995 to 2005,German emissions are expected to increase by 10% if no measures are taken. In the scenario>with measures=, the German emissions could be reduced by an additional 3% (ClimateProtection in Germany, 1997).Until now, there is no further distribution of the total European reductions among the MemberStates so each country has the obligation to reduce its emissions by 8%. The initial EU proposalcontained very generous provisions for Portugal (+40%), Greece (+30%), Spain (+17%), Ireland(+15%) and even Sweden 1(+5%). Not surprisingly, this differentiation2 was strongly criticisedby developing countries that were asked at the Kyoto Conference to engage in significantreductions of greenhouse gases.For the US, the agreed reduction is 7%, Canada has to reduce emissions by 6% and for Japan thetarget is -5%. Countries like Australia, Iceland and Norway are allowed to further increase theiremissions of greenhouse gases, by respectively 8%, 10% and 1% (Kyoto Protocol, FCCC, 1997).These increases of GHG has been criticised but in its Climate Change Report of 1997, Australia
1 In 1990, emissions in Sweden were at a >historical minimum= with the completion of a nuclear buildingprogramme, industrial biomass utilization and energy conservation programmes in virtually all sectors.
2 According to Michel Raquet (EU, DG XI), the final distribution of the European reduction will beaccording to the differentiation in the first proposal of the European Union.
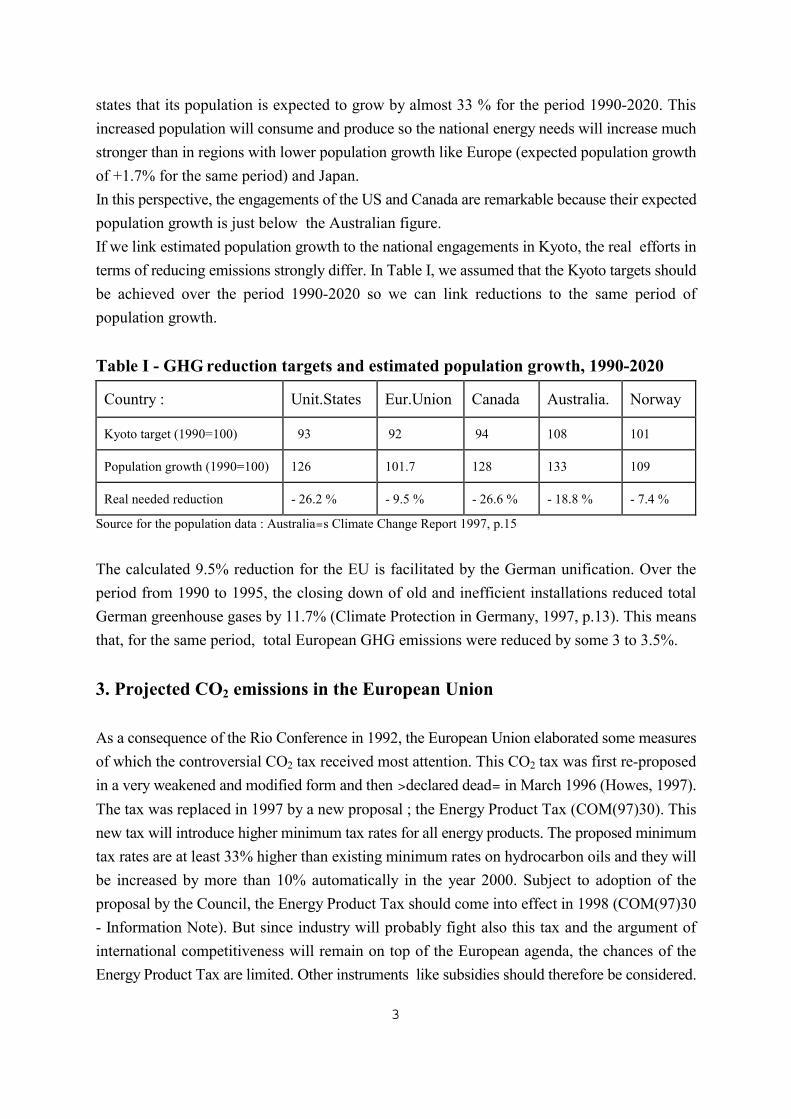
3
states that its population is expected to grow by almost 33 % for the period 1990-2020. Thisincreased population will consume and produce so the national energy needs will increase muchstronger than in regions with lower population growth like Europe (expected population growthof +1.7% for the same period) and Japan.In this perspective, the engagements of the US and Canada are remarkable because their expectedpopulation growth is just below the Australian figure.If we link estimated population growth to the national engagements in Kyoto, the real efforts interms of reducing emissions strongly differ. In Table I, we assumed that the Kyoto targets shouldbe achieved over the period 1990-2020 so we can link reductions to the same period ofpopulation growth.
Table I - GHG reduction targets and estimated population growth, 1990-2020
Country : Unit.States Eur.Union Canada Australia. Norway
Kyoto target (1990=100) 93 92 94 108 101
Population growth (1990=100) 126 101.7 128 133 109
Real needed reduction - 26.2 % - 9.5 % - 26.6 % - 18.8 % - 7.4 %
Source for the population data : Australia=s Climate Change Report 1997, p.15
The calculated 9.5% reduction for the EU is facilitated by the German unification. Over theperiod from 1990 to 1995, the closing down of old and inefficient installations reduced totalGerman greenhouse gases by 11.7% (Climate Protection in Germany, 1997, p.13). This meansthat, for the same period, total European GHG emissions were reduced by some 3 to 3.5%.
3. Projected CO2 emissions in the European Union
As a consequence of the Rio Conference in 1992, the European Union elaborated some measuresof which the controversial CO2 tax received most attention. This CO2 tax was first re-proposedin a very weakened and modified form and then >declared dead= in March 1996 (Howes, 1997).The tax was replaced in 1997 by a new proposal ; the Energy Product Tax (COM(97)30). Thisnew tax will introduce higher minimum tax rates for all energy products. The proposed minimumtax rates are at least 33% higher than existing minimum rates on hydrocarbon oils and they willbe increased by more than 10% automatically in the year 2000. Subject to adoption of theproposal by the Council, the Energy Product Tax should come into effect in 1998 (COM(97)30- Information Note). But since industry will probably fight also this tax and the argument ofinternational competitiveness will remain on top of the European agenda, the chances of theEnergy Product Tax are limited. Other instruments like subsidies should therefore be considered.
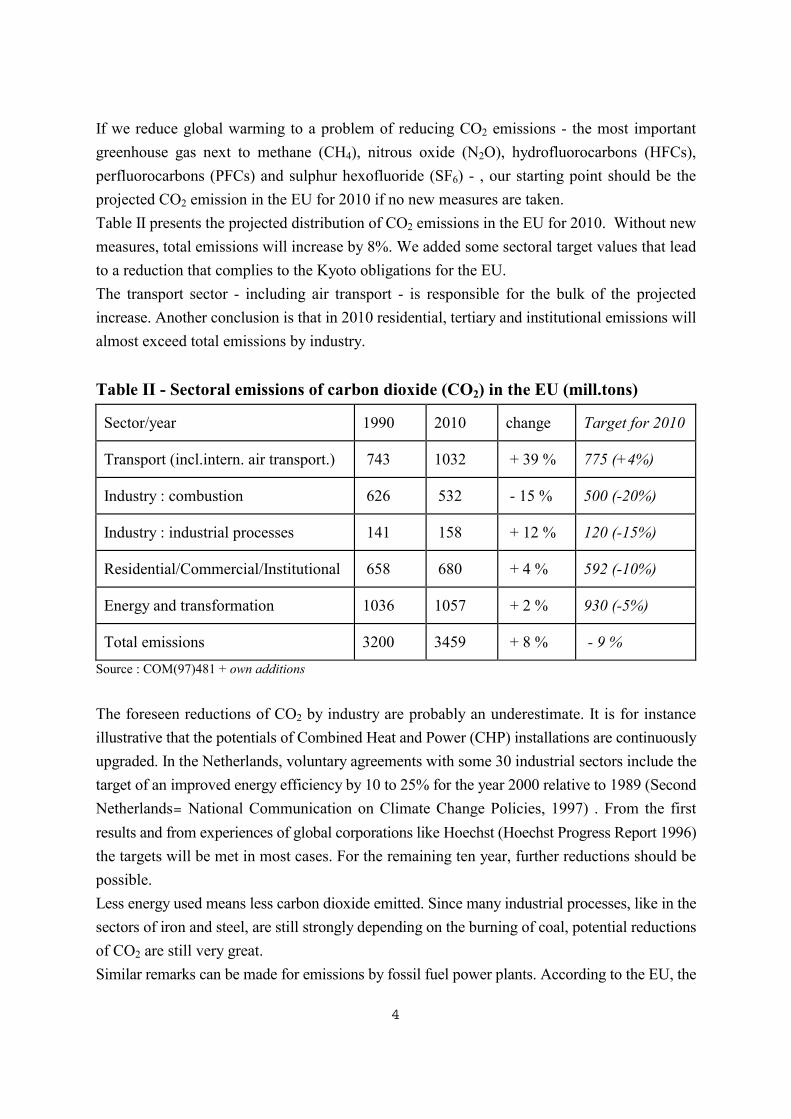
4
If we reduce global warming to a problem of reducing CO2 emissions - the most importantgreenhouse gas next to methane (CH4), nitrous oxide (N2O), hydrofluorocarbons (HFCs),perfluorocarbons (PFCs) and sulphur hexofluoride (SF6) - , our starting point should be theprojected CO2 emission in the EU for 2010 if no new measures are taken.Table II presents the projected distribution of CO2 emissions in the EU for 2010. Without newmeasures, total emissions will increase by 8%. We added some sectoral target values that leadto a reduction that complies to the Kyoto obligations for the EU.The transport sector - including air transport - is responsible for the bulk of the projectedincrease. Another conclusion is that in 2010 residential, tertiary and institutional emissions willalmost exceed total emissions by industry.
Table II - Sectoral emissions of carbon dioxide (CO2) in the EU (mill.tons)
Sector/year 1990 2010 change Target for 2010
Transport (incl.intern. air transport.) 743 1032 + 39 % 775 (+4%)
Industry : combustion 626 532 - 15 % 500 (-20%)
Industry : industrial processes 141 158 + 12 % 120 (-15%)
Residential/Commercial/Institutional 658 680 + 4 % 592 (-10%)
Energy and transformation 1036 1057 + 2 % 930 (-5%)
Total emissions 3200 3459 + 8 % - 9 %Source : COM(97)481 + own additions
The foreseen reductions of CO2 by industry are probably an underestimate. It is for instanceillustrative that the potentials of Combined Heat and Power (CHP) installations are continuouslyupgraded. In the Netherlands, voluntary agreements with some 30 industrial sectors include thetarget of an improved energy efficiency by 10 to 25% for the year 2000 relative to 1989 (SecondNetherlands= National Communication on Climate Change Policies, 1997) . From the firstresults and from experiences of global corporations like Hoechst (Hoechst Progress Report 1996)the targets will be met in most cases. For the remaining ten year, further reductions should bepossible.Less energy used means less carbon dioxide emitted. Since many industrial processes, like in thesectors of iron and steel, are still strongly depending on the burning of coal, potential reductionsof CO2 are still very great.Similar remarks can be made for emissions by fossil fuel power plants. According to the EU, the
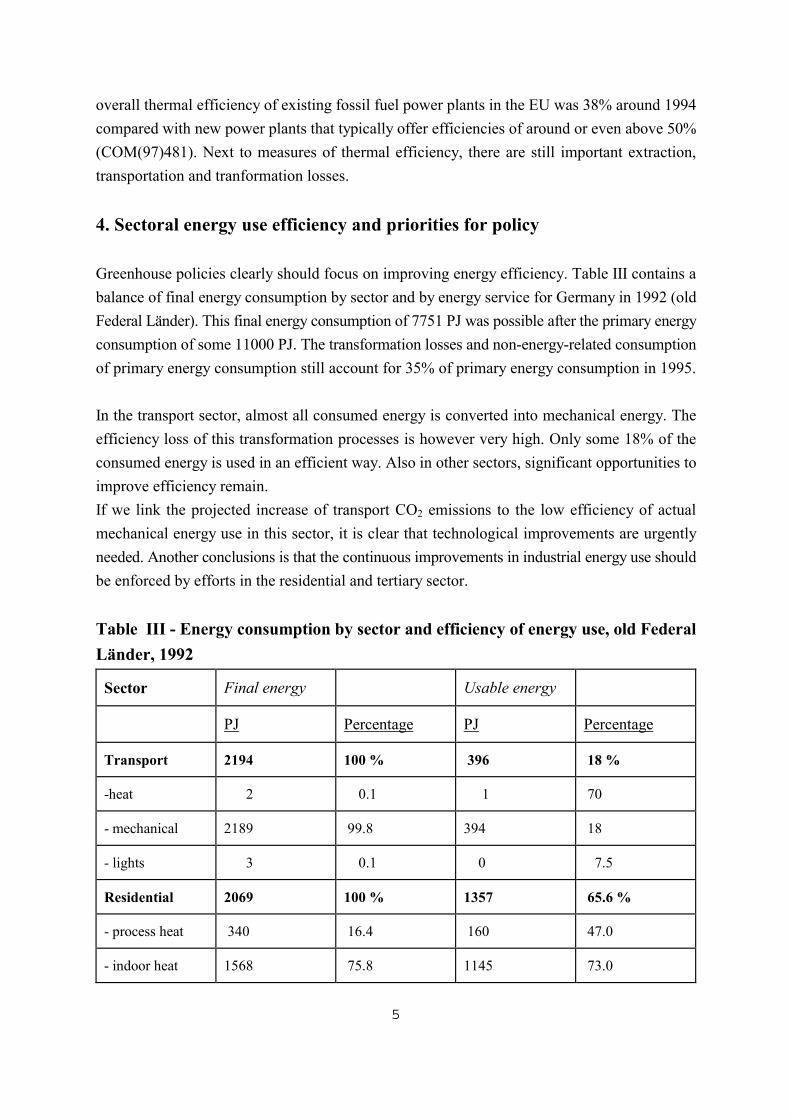
5
overall thermal efficiency of existing fossil fuel power plants in the EU was 38% around 1994compared with new power plants that typically offer efficiencies of around or even above 50%(COM(97)481). Next to measures of thermal efficiency, there are still important extraction,transportation and tranformation losses.
4. Sectoral energy use efficiency and priorities for policy
Greenhouse policies clearly should focus on improving energy efficiency. Table III contains abalance of final energy consumption by sector and by energy service for Germany in 1992 (oldFederal Länder). This final energy consumption of 7751 PJ was possible after the primary energyconsumption of some 11000 PJ. The transformation losses and non-energy-related consumptionof primary energy consumption still account for 35% of primary energy consumption in 1995. In the transport sector, almost all consumed energy is converted into mechanical energy. Theefficiency loss of this transformation processes is however very high. Only some 18% of theconsumed energy is used in an efficient way. Also in other sectors, significant opportunities toimprove efficiency remain.If we link the projected increase of transport CO2 emissions to the low efficiency of actualmechanical energy use in this sector, it is clear that technological improvements are urgentlyneeded. Another conclusions is that the continuous improvements in industrial energy use shouldbe enforced by efforts in the residential and tertiary sector.
Table III - Energy consumption by sector and efficiency of energy use, old FederalLänder, 1992
Sector Final energy Usable energy
PJ Percentage PJ Percentage
Transport 2194 100 % 396 18 %
-heat 2 0.1 1 70
- mechanical 2189 99.8 394 18
- lights 3 0.1 0 7.5
Residential 2069 100 % 1357 65.6 %
- process heat 340 16.4 160 47.0
- indoor heat 1568 75.8 1145 73.0

6
Sector Final energy Usable energy
- mechanical 126 6.1 50 40.0
Industry 2212 100 % 1323 59.8 %
- process heat 1521 68.8 882 58.0
- indoor heat 217 9.8 152 70.0
- mechanical 439 19.8 285 65.0
- lights 35 1.6 4 10.0
Source : Second Report of the Government of the Federal Republic of Germany Pursuant to the United NationsFramework Convention on Climate Change, p.45
5. Policy options and sets of instruments
We presented some indications for giving priority to energy issues in transport and in theresidential/tertiary sector. Before discussing some instruments, it is interesting to refer to someestimates of total greenhouse policy costs. In COM(97)481, we read :AFor a 15% reduction in CO2 emissions compared to 1990 estimates of the direct compliancecosts related to energy supply/demand mitigation actions range from around 15 bn Ecu to about35 bn Ecu annually by 2010. This corresponds to roughly 0.2 and 0.4% of GDP in the year2010.@Since the European reductions will not be 15 but only 8%, total costs will be lower but still veryimpressive. Most estimates amount to 0.1% to 0.2% of GDP. Similar findings are presented bythe Energy Technology Systems Analysis Programme (ETSAP), a cooperative researchagreement among member countries of the International Energy Agency (IEA). Throughpartnerships, ETSAP uses the expertise of 60 teams in more than 30 countries that work with theMARKAL-MACRO family of energy/economy/environment models. ETSAP estimates that themarginal CO2 reduction costs in 2010 can amount to $ 150 per ton reduced, depending on thespecific country of analysis (ETSAT Kyoto Statement, 1997).These high estimates of CO2 abatement costs are derived from a framework that does not includethe potential costs saving from emission permit trading or joint implementation that allowscountries with high marginal abatement costs to buy credits from countries where abatementcosts are much lower. Since many developing countries have very inefficient electricy plants,substantial reductions of emissions are possible on short term and at a low cost.For the US, the economic costs of implementing CO2 reduction measures are calculated using

7
the opportunities of international emissions permit trading, joint implementation and the CleanDevelopment Mechanism. Dr.Janet Yellen of the President=s Council of Economic Advisorsindicated in a recently given testimony that the abatement cost for carbon dioxide would beroughly $ 14 - $ 23 per ton. This would correlate to between 3-4 cents per gallon of gasoline, amodest increase (USIS, Embassy of the United States of America, 1997).For reductions of emissions at the national level, various policy options and instruments areavailable :
1. Taxes on energy
Fiscal instruments are being increasingly used as a step towards implementing the Polluter PaysPrinciple (PPP). The Commission=s communication on environmental taxes and charges in theSingle Market provides guidelines for Member States in designing, implementing and evaluatingenvironmental levies and charges (COM(97)9). This communication came one year after thediscussions on a European CO2 tax so its future use will probably be more in the field of ecotaxeson products and packaging wastes.Taxes on energy are among the most popular environmental instruments. But in many countriesenergy taxes are already very high. Additional taxes will result in >cigarette prices=: prices ofwhich 75 to 90% consists of taxes. The health implications of smoking cigarettes are howevermore obvious for smokers than the negative consequences for the environment of burning fuels.High taxes on cigarettes are therefore an application of the Killer Pays Principle.In other debates, energy taxes are presented versus labour taxes as >taxing the bad versus taxingthe good=. The problem here is that we rather have to differentiate according to the efficient orinefficient use of energy. If we take a central heating burner of 1970 - of which many millionsare still used in Europe - and compare this burner to the best types of 1998, the two installationshave extreme differences in energy efficiency. For old burners the efficiency is around 50-60%while this percentage will be around 95% for the newest types.If an energy tax would be installed because >using energy is bad=, families with the mostefficient available heating installations will be punished for their efficient and optimal use of anatural resource. We should better tax inefficient burners or subsidize efficient types3.Therefore, we will work out some policy instruments that promote the most efficient use ofenergy (in heating installations, for cars and other engines and in households). Furthermore, if we relate CO2 to the external effects of generating and using energy - an approach
3 A similar reasoning can be used when it comes to emissions of methane, one of the other importantgreenhouse gases. After eating grass, cattle or other animals emit methane. If we want to reduce emissions ofmethane, we can tax grass (like an energy tax) or the cattle. People with a lawn that do not own animals will clearlyprefer the latter option. Otherwise, we would punish efficient users of the resources like polluting users.
8
in line with the Fifth Environmental Action Programme (5EAP) of the EU -, we have to considerthe greenhouse external effects of transport, industry and other sectors. It is not easy to calculatethese effects because there is still a significant element of uncertainty in many assessments of theconsequences of global warming. As an example, the human-induced greenhouse effect hascompletely different consequences for countries that strongly depend on winter tourism comparedto countries that will have better agricultural possibilities if average temperatures increase bysome 1 or 2°C.The Extern-E project AExternalities of Energy@ by DGXII (Joule Programme) calculated thecomplete external effects of energy generation and transport. The first results clearly demonstratethat emissions of Particulate Matter (PM) are much more important - in terms of external costs- than emissions of CO2. PMs can have significant health effects for people with respiratoryproblems. For transport, PMs account for 80% of all external costs.As could be expected, the same survey shows that burning coal generates much higher externalcosts compared to using other energy inputs.Similar results - for transport - are presented by Proost and Van Regemorter (1998). Using theTRENER model for the EU JOULE II programme, they found that existing energy taxes perpassenger kilometre already strongly exceed the external costs in terms of air pollution perpassenger kilometre. Only for public transport where taxes are much lower (or even negative),the external costs for air pollution are not covered by the reference taxes.To conclude, if we motivate a CO2 tax by means of the Polluter Pays Principle (PPP), we openthe door for many other taxes that better correct for external effects like a health tax on PMs ora tax on diesel. A strict application of the PPP would lead to reducing many energy taxes inprivate transport because they are already too high.
2. Subsidies
The sectors that contribute most to the emissions of CO2, all have a tradition of subsidies andpreferential regimes. Energy has always been a crucial resource for economic development andenergy policies are closely linked to industrial and social policies. The oil crises and the Gulf Warbrought energy back on the political agenda.Since the 19th century, nations invested massively in their energy structure and many subsidiesstill have a clear impact on energy prices. According to a recent OECD-survey, adding up allsubsidies and subsidy-equivalent market distortions still gives a total of $ 100 billion or 0.75%of the OECD-GDP. The total greenhouse gas mitigation opportunities identified in the casestudies would total some 400 to 500 million tonnes of CO2 in 2010 - about half of it in Russia.Some promising areas for subsidy reform are :- removing coal producer grants and price supports ;- reforming subsidies to electricity supply industry investment or protection from risk, where
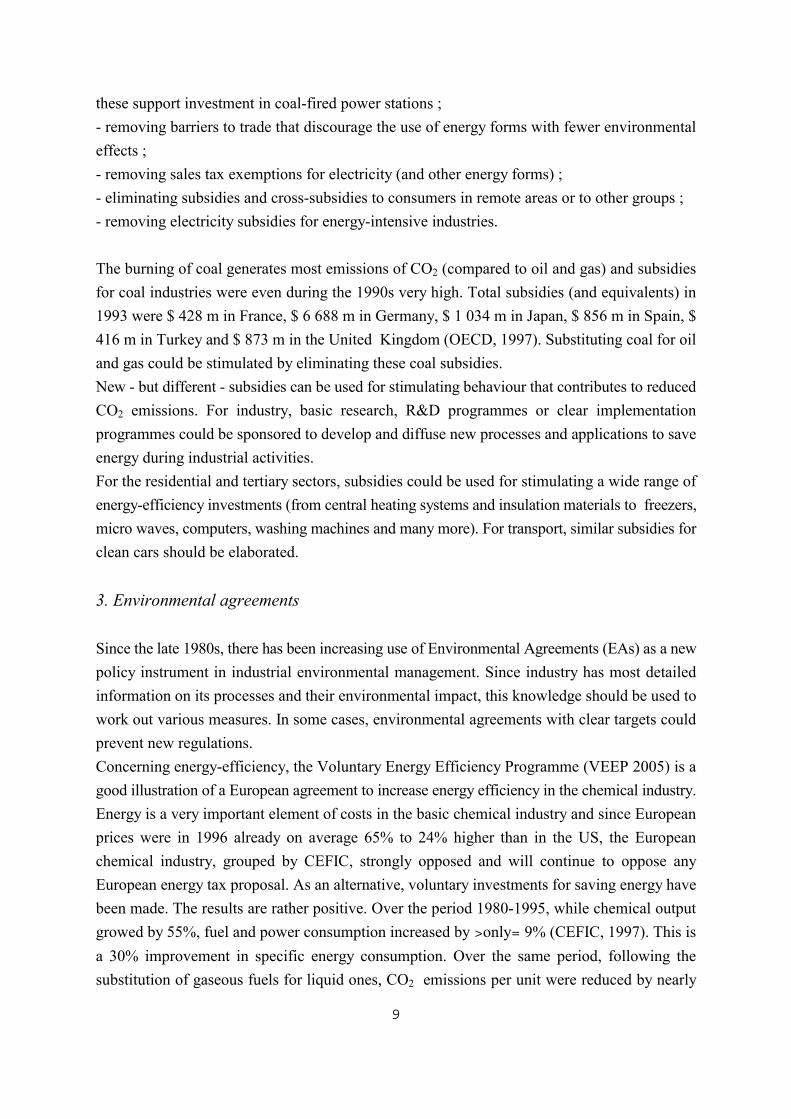
9
these support investment in coal-fired power stations ;- removing barriers to trade that discourage the use of energy forms with fewer environmentaleffects ;- removing sales tax exemptions for electricity (and other energy forms) ;- eliminating subsidies and cross-subsidies to consumers in remote areas or to other groups ;- removing electricity subsidies for energy-intensive industries.
The burning of coal generates most emissions of CO2 (compared to oil and gas) and subsidiesfor coal industries were even during the 1990s very high. Total subsidies (and equivalents) in1993 were $ 428 m in France, $ 6 688 m in Germany, $ 1 034 m in Japan, $ 856 m in Spain, $416 m in Turkey and $ 873 m in the United Kingdom (OECD, 1997). Substituting coal for oiland gas could be stimulated by eliminating these coal subsidies. New - but different - subsidies can be used for stimulating behaviour that contributes to reducedCO2 emissions. For industry, basic research, R&D programmes or clear implementationprogrammes could be sponsored to develop and diffuse new processes and applications to saveenergy during industrial activities.For the residential and tertiary sectors, subsidies could be used for stimulating a wide range ofenergy-efficiency investments (from central heating systems and insulation materials to freezers,micro waves, computers, washing machines and many more). For transport, similar subsidies forclean cars should be elaborated.
3. Environmental agreements
Since the late 1980s, there has been increasing use of Environmental Agreements (EAs) as a newpolicy instrument in industrial environmental management. Since industry has most detailedinformation on its processes and their environmental impact, this knowledge should be used towork out various measures. In some cases, environmental agreements with clear targets couldprevent new regulations.Concerning energy-efficiency, the Voluntary Energy Efficiency Programme (VEEP 2005) is agood illustration of a European agreement to increase energy efficiency in the chemical industry.Energy is a very important element of costs in the basic chemical industry and since Europeanprices were in 1996 already on average 65% to 24% higher than in the US, the Europeanchemical industry, grouped by CEFIC, strongly opposed and will continue to oppose anyEuropean energy tax proposal. As an alternative, voluntary investments for saving energy havebeen made. The results are rather positive. Over the period 1980-1995, while chemical outputgrowed by 55%, fuel and power consumption increased by >only= 9% (CEFIC, 1997). This isa 30% improvement in specific energy consumption. Over the same period, following thesubstitution of gaseous fuels for liquid ones, CO2 emissions per unit were reduced by nearly
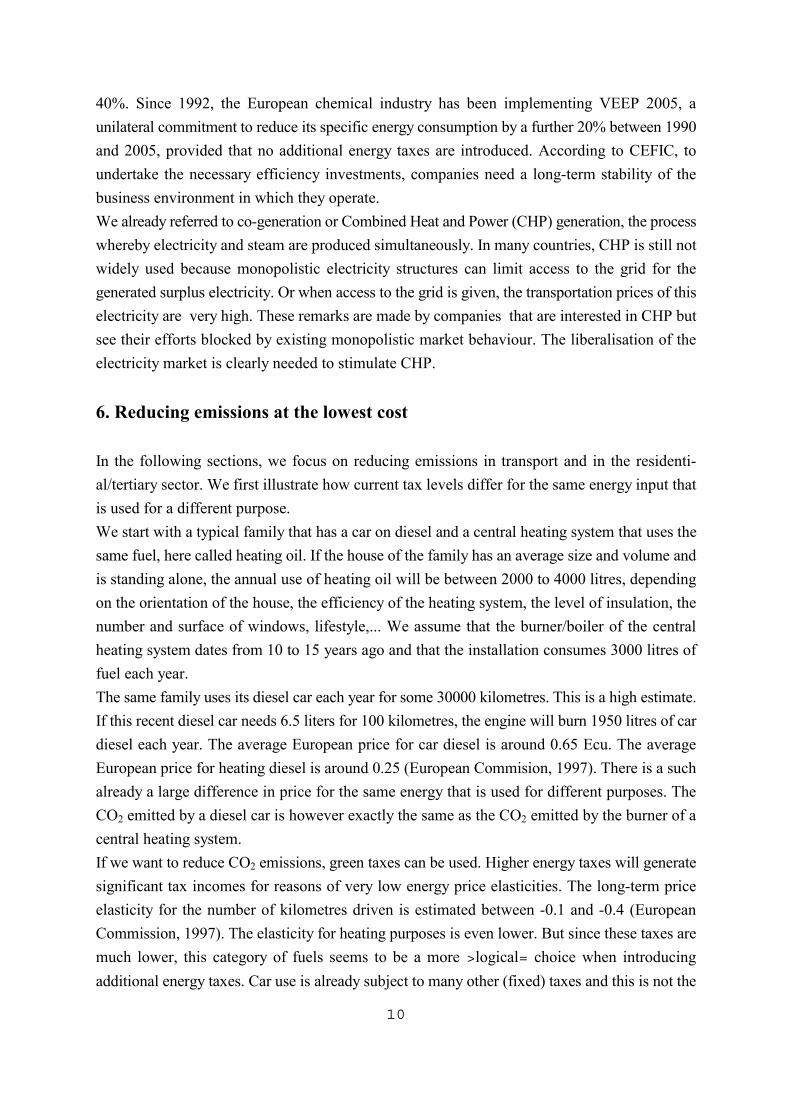
10
40%. Since 1992, the European chemical industry has been implementing VEEP 2005, aunilateral commitment to reduce its specific energy consumption by a further 20% between 1990and 2005, provided that no additional energy taxes are introduced. According to CEFIC, toundertake the necessary efficiency investments, companies need a long-term stability of thebusiness environment in which they operate.We already referred to co-generation or Combined Heat and Power (CHP) generation, the processwhereby electricity and steam are produced simultaneously. In many countries, CHP is still notwidely used because monopolistic electricity structures can limit access to the grid for thegenerated surplus electricity. Or when access to the grid is given, the transportation prices of thiselectricity are very high. These remarks are made by companies that are interested in CHP butsee their efforts blocked by existing monopolistic market behaviour. The liberalisation of theelectricity market is clearly needed to stimulate CHP.
6. Reducing emissions at the lowest cost
In the following sections, we focus on reducing emissions in transport and in the residenti-al/tertiary sector. We first illustrate how current tax levels differ for the same energy input thatis used for a different purpose.We start with a typical family that has a car on diesel and a central heating system that uses thesame fuel, here called heating oil. If the house of the family has an average size and volume andis standing alone, the annual use of heating oil will be between 2000 to 4000 litres, dependingon the orientation of the house, the efficiency of the heating system, the level of insulation, thenumber and surface of windows, lifestyle,... We assume that the burner/boiler of the centralheating system dates from 10 to 15 years ago and that the installation consumes 3000 litres offuel each year.The same family uses its diesel car each year for some 30000 kilometres. This is a high estimate.If this recent diesel car needs 6.5 liters for 100 kilometres, the engine will burn 1950 litres of cardiesel each year. The average European price for car diesel is around 0.65 Ecu. The averageEuropean price for heating diesel is around 0.25 (European Commision, 1997). There is a suchalready a large difference in price for the same energy that is used for different purposes. TheCO2 emitted by a diesel car is however exactly the same as the CO2 emitted by the burner of acentral heating system.If we want to reduce CO2 emissions, green taxes can be used. Higher energy taxes will generatesignificant tax incomes for reasons of very low energy price elasticities. The long-term priceelasticity for the number of kilometres driven is estimated between -0.1 and -0.4 (EuropeanCommission, 1997). The elasticity for heating purposes is even lower. But since these taxes aremuch lower, this category of fuels seems to be a more >logical= choice when introducingadditional energy taxes. Car use is already subject to many other (fixed) taxes and this is not the
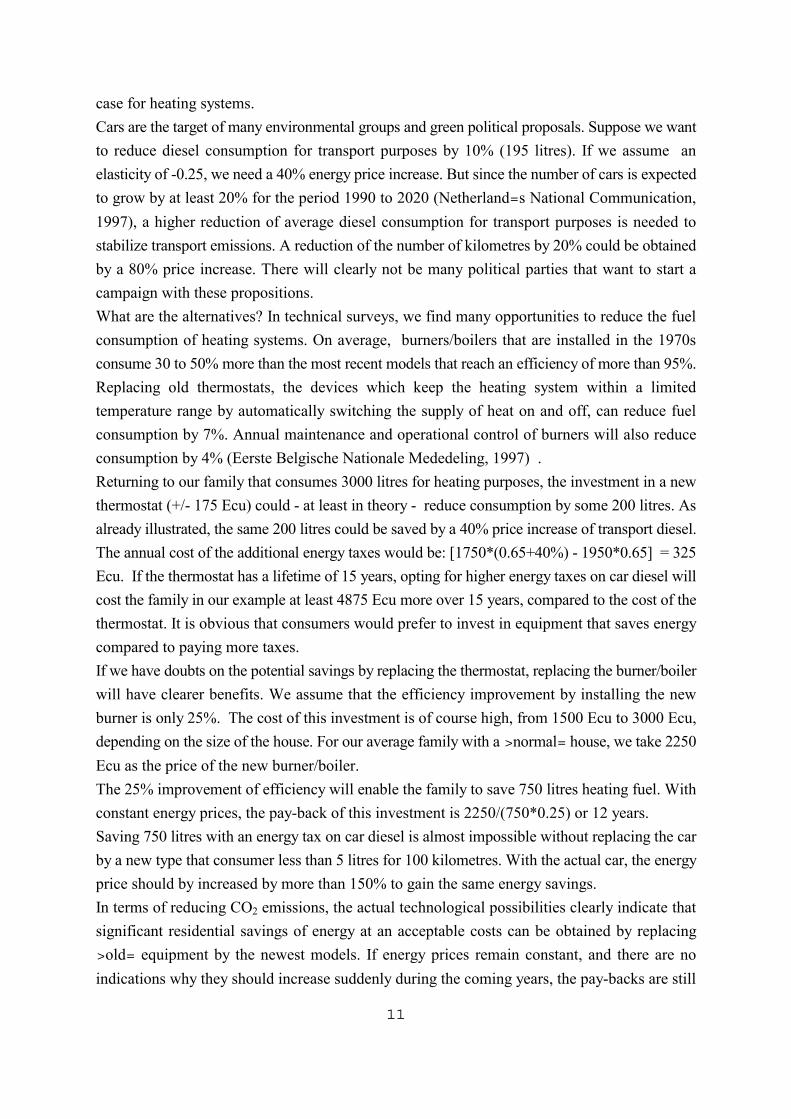
11
case for heating systems.Cars are the target of many environmental groups and green political proposals. Suppose we wantto reduce diesel consumption for transport purposes by 10% (195 litres). If we assume anelasticity of -0.25, we need a 40% energy price increase. But since the number of cars is expectedto grow by at least 20% for the period 1990 to 2020 (Netherland=s National Communication,1997), a higher reduction of average diesel consumption for transport purposes is needed tostabilize transport emissions. A reduction of the number of kilometres by 20% could be obtainedby a 80% price increase. There will clearly not be many political parties that want to start acampaign with these propositions.What are the alternatives? In technical surveys, we find many opportunities to reduce the fuelconsumption of heating systems. On average, burners/boilers that are installed in the 1970sconsume 30 to 50% more than the most recent models that reach an efficiency of more than 95%.Replacing old thermostats, the devices which keep the heating system within a limitedtemperature range by automatically switching the supply of heat on and off, can reduce fuelconsumption by 7%. Annual maintenance and operational control of burners will also reduceconsumption by 4% (Eerste Belgische Nationale Mededeling, 1997) .Returning to our family that consumes 3000 litres for heating purposes, the investment in a newthermostat (+/- 175 Ecu) could - at least in theory - reduce consumption by some 200 litres. Asalready illustrated, the same 200 litres could be saved by a 40% price increase of transport diesel.The annual cost of the additional energy taxes would be: [1750*(0.65+40%) - 1950*0.65] = 325Ecu. If the thermostat has a lifetime of 15 years, opting for higher energy taxes on car diesel willcost the family in our example at least 4875 Ecu more over 15 years, compared to the cost of thethermostat. It is obvious that consumers would prefer to invest in equipment that saves energycompared to paying more taxes. If we have doubts on the potential savings by replacing the thermostat, replacing the burner/boilerwill have clearer benefits. We assume that the efficiency improvement by installing the newburner is only 25%. The cost of this investment is of course high, from 1500 Ecu to 3000 Ecu,depending on the size of the house. For our average family with a >normal= house, we take 2250Ecu as the price of the new burner/boiler.The 25% improvement of efficiency will enable the family to save 750 litres heating fuel. Withconstant energy prices, the pay-back of this investment is 2250/(750*0.25) or 12 years.Saving 750 litres with an energy tax on car diesel is almost impossible without replacing the carby a new type that consumer less than 5 litres for 100 kilometres. With the actual car, the energyprice should by increased by more than 150% to gain the same energy savings.In terms of reducing CO2 emissions, the actual technological possibilities clearly indicate thatsignificant residential savings of energy at an acceptable costs can be obtained by replacing>old= equipment by the newest models. If energy prices remain constant, and there are noindications why they should increase suddenly during the coming years, the pay-backs are still
12
relatively long. To stimulate replacing investments with clear benefits in terms of emissions,subsidies to consumers can be an appropriate instrument.In the next section, we will work out three types of subsidies ; subsidies for replacing oldburners/boilers, subsidies for energy efficient cars and subsidies for other consumer products thathave clear energy saving potentials.
7. Consumer subsidies
7.1 The microeconomics of consumer subsidies versus energy taxes
In the previous section, we considered the low energy price elasticity and high investment costsfor consumers that want to replace inefficient burners or cars. If we reduce in our period ofanalysis the total costs of using a heating burner or a refrigerator to only two categories namelyinvestment costs and energy costs, the rational consumer will base his decision on these twofactors. He will opt for the product with the lowest total cost. In figure I, we present three optionsfor a consumer that wants to buy a product with specific characteristics (like the cooling capacityor volume of a refrigerator). The three types a, b and c have identical characteristics. The relativeenergy prices determine the slopes of the lines through the three points on the iso-product curve.If we assume that more energy efficient equipment will cost more than inefficient types (for usingspecial components, better insulation,..) this price difference will be important in the investmentdecision. Starting from model a on the iso-product curve in figure I and with energy prices thatincrease as a result of energy taxes, this will provide an incentive to buy a more efficient type (bor c). Compared to model a, the reduced energy needs of model b over the period will more thancompensate the additional investment cost for the period. But if the consumer already thinks ofbuying model c, it is clear that a further increase in energy prices will not result in replacing thistype by a more efficient type on the left side from model c. Due to budget limitations (model cis already very expensive) , the consumer has no choice but paying the higher energy prices.
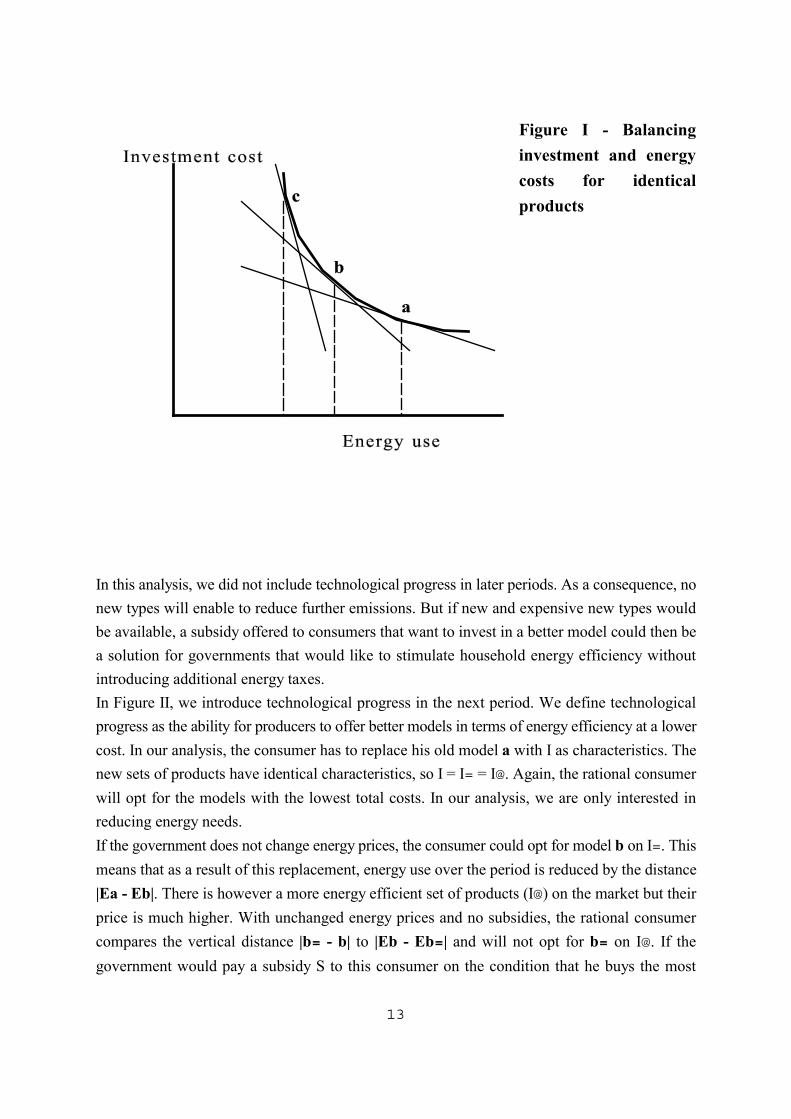
13
Figure I - Balancinginvestment and energycosts for identicalproducts
In this analysis, we did not include technological progress in later periods. As a consequence, nonew types will enable to reduce further emissions. But if new and expensive new types wouldbe available, a subsidy offered to consumers that want to invest in a better model could then bea solution for governments that would like to stimulate household energy efficiency withoutintroducing additional energy taxes.In Figure II, we introduce technological progress in the next period. We define technologicalprogress as the ability for producers to offer better models in terms of energy efficiency at a lowercost. In our analysis, the consumer has to replace his old model a with I as characteristics. Thenew sets of products have identical characteristics, so I = I= = I@. Again, the rational consumerwill opt for the models with the lowest total costs. In our analysis, we are only interested inreducing energy needs.If the government does not change energy prices, the consumer could opt for model b on I=. Thismeans that as a result of this replacement, energy use over the period is reduced by the distance|Ea - Eb|. There is however a more energy efficient set of products (I@) on the market but theirprice is much higher. With unchanged energy prices and no subsidies, the rational consumercompares the vertical distance |b= - b| to |Eb - Eb=| and will not opt for b= on I@. If thegovernment would pay a subsidy S to this consumer on the condition that he buys the most
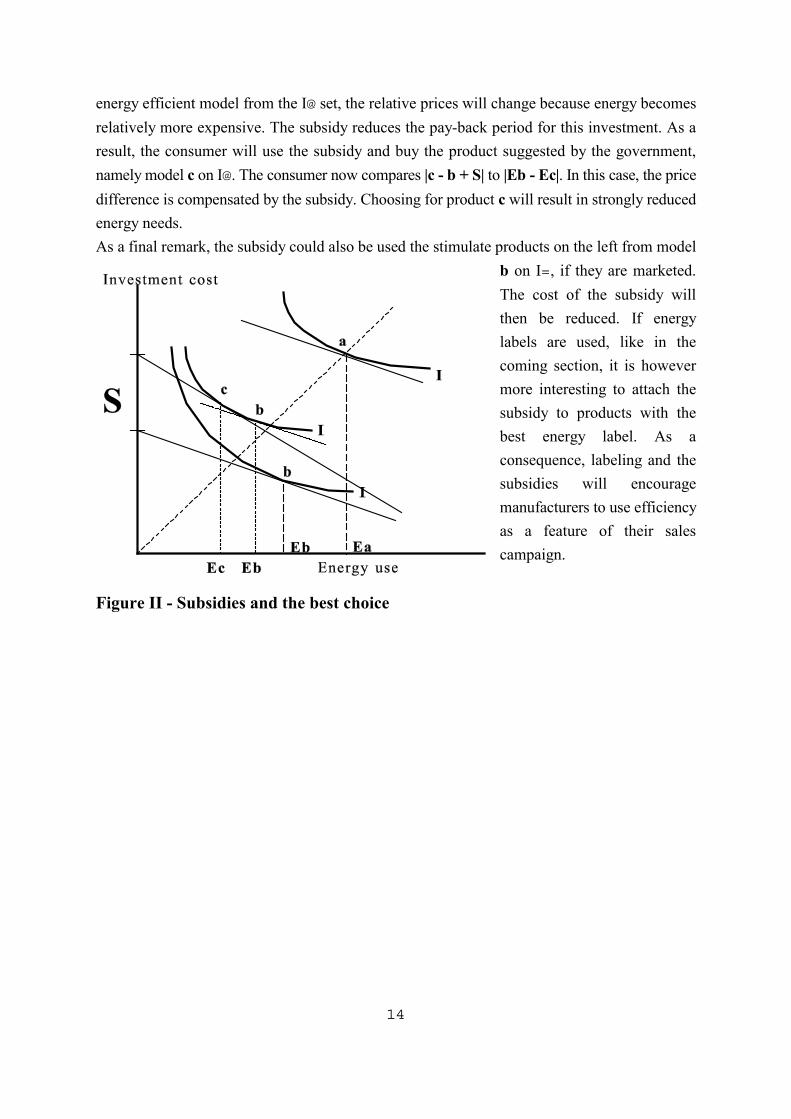
14
energy efficient model from the I@ set, the relative prices will change because energy becomesrelatively more expensive. The subsidy reduces the pay-back period for this investment. As aresult, the consumer will use the subsidy and buy the product suggested by the government,namely model c on I@. The consumer now compares |c - b + S| to |Eb - Ec|. In this case, the pricedifference is compensated by the subsidy. Choosing for product c will result in strongly reducedenergy needs.As a final remark, the subsidy could also be used the stimulate products on the left from model
b on I=, if they are marketed.The cost of the subsidy willthen be reduced. If energylabels are used, like in thecoming section, it is howevermore interesting to attach thesubsidy to products with thebest energy label. As aconsequence, labeling and thesubsidies will encouragemanufacturers to use efficiencyas a feature of their salescampaign.
Figure II - Subsidies and the best choice
15
7.2 Subsidies for replacing heating systems
Investing in efficient burners will reduce emissions of CO2, CO, NOX and PM. The long pay-back could be a barrier for many people that will keep, as a consequence, their old and inefficientburners as long as possible.In many countries, technical certification agencies provide efficiency labels that enableconsumers to recognise the best installations. In the Netherlands, subsidies were available for themost efficient heating systems on gas, the HR-types. The subsidy policy started in 1988 and wasimmediately a great success. The number of installed HR-installations increased from year toyear (50000 in 1988, already 200000 in 1989) and in 1994, already 40% of total privateresidential heating installations were burners of the most efficient types (EnergieverslagNederland, 1994).If we provide a subsidy of 500 Ecu for each investment in high efficiency burners, the pay- backin our example will be around 9 years. If at the same time, a campaign supports this policyinstruments, the reaction of consumers might be significant.For each country, we can estimate the energy efficiency potential of new installed burners startingfrom the number of new houses built. It can be expected that in new houses that have aninsulation efficiency that reduces the potential energy losses by at least 50% compared to housesbuilt before 1970, only the newest models will be installed. The energy needs of new houses aretherefore 50 to 75% lower than of similar older houses.In existing houses, replacements will depend on the age of the burner and the incentives offeredby the government. If the investment subsidies are announced as an initiative that will only beavailable for 2 or 3 years, the reaction can be expected to be direct.In Belgium, with some 30000 to 40000 new houses built each year and with a potential of 50000to 100000 replacements per year, the annual cost of the subsidy will be between 40 to 60 millionEcu. If the subsidy will be available for 8 years and the public reacts as can be expected, the totalresidential energy needs can be reduced by 25%, especially if we assume that in older houses other replacing investments will also take place over time (energy efficient glass, new roofs,foams, insulating injections). In Belgium, emissions from total residential heating amounted to23.8% of total emissions in 1994 (Belgian National Communication, 1997). The Europeanaverage for 1990 was 20.4%.A reduction of 25% of these emissions can reduce total national emissions by 5 to 6% if all theother sectors do not increase their emissions. Over this period of 8 years, the reductions ofnational emissions by 5% will cost some 400 to 500 million Ecu. At the same time, the sectorsthat produce and install heating installations will see their markets expand. These labourintensive sectors will create employment and generate additional revenues.If this price is too high for the budget, governments could use the facilities offered by the Energy
16
Product Tax that will install higher minimum energy taxes on all fuels. From experiences in thepast, we can assume that increasing the price of fuels for heating from 0.25 ECU to 0.35 Ecu perlitre can generate annually 200 to 250 million Ecu in Belgium, at least in the first years after thehigher energy taxes (Federaal Planbureau, 1995) . This price increase will further reduce the pay-back to 6.6 years (1750/750*0.35).The generated incomes can also be used to finance other subsidies, like those presented in thefollowing subsections.
7.3 Subsidies for energy efficient cars
7.3.1 Potentials
We already referred to the Extern-E project that concludes that the bulk of the external costs oftransport (cars, buses, trucks and other vehicles) is caused by the emissions of PM resulting frominefficient burning. Reducing emissions is closely related to reducing energy consumption.Since the average age of cars has been increasing the last year and is now around 7 years, theactual average fuel consumption of cars on gasoline is still between 8 and 11 litres for 100kilometres. For diesel cars, the average fuel consumption is between 6 and 9 litres because olderdiesels typically have heavy engines.There are however many possibilities to reduce these energy needs by half since gasoline is usedvery inefficiently in internal combustion engines. About 80% of its energy capacity is lost (seetable III).In 1997, the fuel cell technology reached the potential of short-term commercialisation. In theUS, a partnership with the auto industry, funded by the Department of Energy, has lead to thepotential creation of a new generation of vehicles that will use 84% of the gasoline in the fuelcell. This means that the energy efficiency will be increased by a factor four. Similar results wereobtained from projects funded by the Defense Advanced Research Products Agency and theCommerce Department=s National Institute of Science and Technology.GM, Ford, Chrysler and other members of the project already announced to commercialize fuelcell vehicles at competitive prices starting from 2001 or 2002 (USIS, Embassy of the UnitedStates of America, 1997). In the next century, powerful cars will be available that need only 2to 3 litres per 100 kilometres. Emissions, other than CO2, will be reduced by 90%.In Japan, Honda did also develop fuel cell prototypes and will start commercialisation around2002. Toyota will build next year hydro-cars that need only water and the Toyota Prius, a carwith an electrical and conventional engine that both reduce energy needs to less than 5 litres per100 kilometres is already a big success in Japan. In 1999, this car will be redesigned andcommericalized for the European markets.Of course, these promising developments for the future are no reason to wait. On our markets,
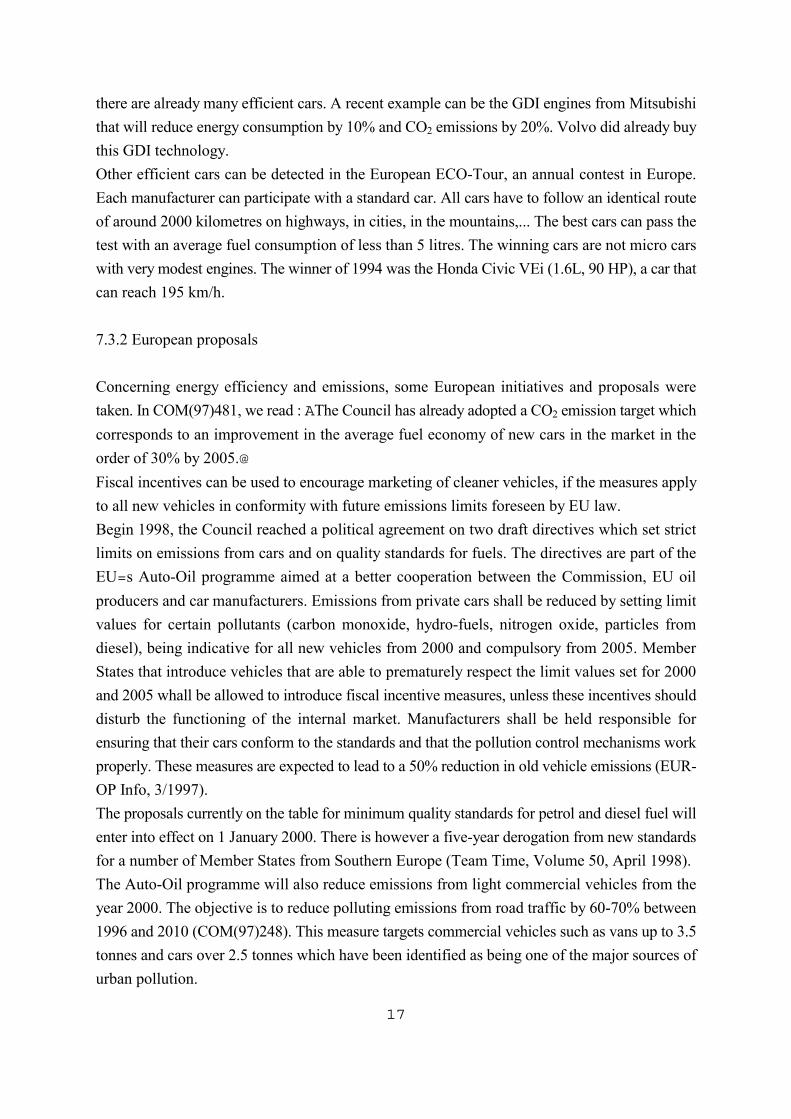
17
there are already many efficient cars. A recent example can be the GDI engines from Mitsubishithat will reduce energy consumption by 10% and CO2 emissions by 20%. Volvo did already buythis GDI technology.Other efficient cars can be detected in the European ECO-Tour, an annual contest in Europe.Each manufacturer can participate with a standard car. All cars have to follow an identical routeof around 2000 kilometres on highways, in cities, in the mountains,... The best cars can pass thetest with an average fuel consumption of less than 5 litres. The winning cars are not micro carswith very modest engines. The winner of 1994 was the Honda Civic VEi (1.6L, 90 HP), a car thatcan reach 195 km/h.
7.3.2 European proposals
Concerning energy efficiency and emissions, some European initiatives and proposals weretaken. In COM(97)481, we read : AThe Council has already adopted a CO2 emission target whichcorresponds to an improvement in the average fuel economy of new cars in the market in theorder of 30% by 2005.@Fiscal incentives can be used to encourage marketing of cleaner vehicles, if the measures applyto all new vehicles in conformity with future emissions limits foreseen by EU law.Begin 1998, the Council reached a political agreement on two draft directives which set strictlimits on emissions from cars and on quality standards for fuels. The directives are part of theEU=s Auto-Oil programme aimed at a better cooperation between the Commission, EU oilproducers and car manufacturers. Emissions from private cars shall be reduced by setting limitvalues for certain pollutants (carbon monoxide, hydro-fuels, nitrogen oxide, particles fromdiesel), being indicative for all new vehicles from 2000 and compulsory from 2005. MemberStates that introduce vehicles that are able to prematurely respect the limit values set for 2000and 2005 whall be allowed to introduce fiscal incentive measures, unless these incentives shoulddisturb the functioning of the internal market. Manufacturers shall be held responsible forensuring that their cars conform to the standards and that the pollution control mechanisms workproperly. These measures are expected to lead to a 50% reduction in old vehicle emissions (EUR-OP Info, 3/1997).The proposals currently on the table for minimum quality standards for petrol and diesel fuel willenter into effect on 1 January 2000. There is however a five-year derogation from new standardsfor a number of Member States from Southern Europe (Team Time, Volume 50, April 1998).The Auto-Oil programme will also reduce emissions from light commercial vehicles from theyear 2000. The objective is to reduce polluting emissions from road traffic by 60-70% between1996 and 2010 (COM(97)248). This measure targets commercial vehicles such as vans up to 3.5tonnes and cars over 2.5 tonnes which have been identified as being one of the major sources ofurban pollution.
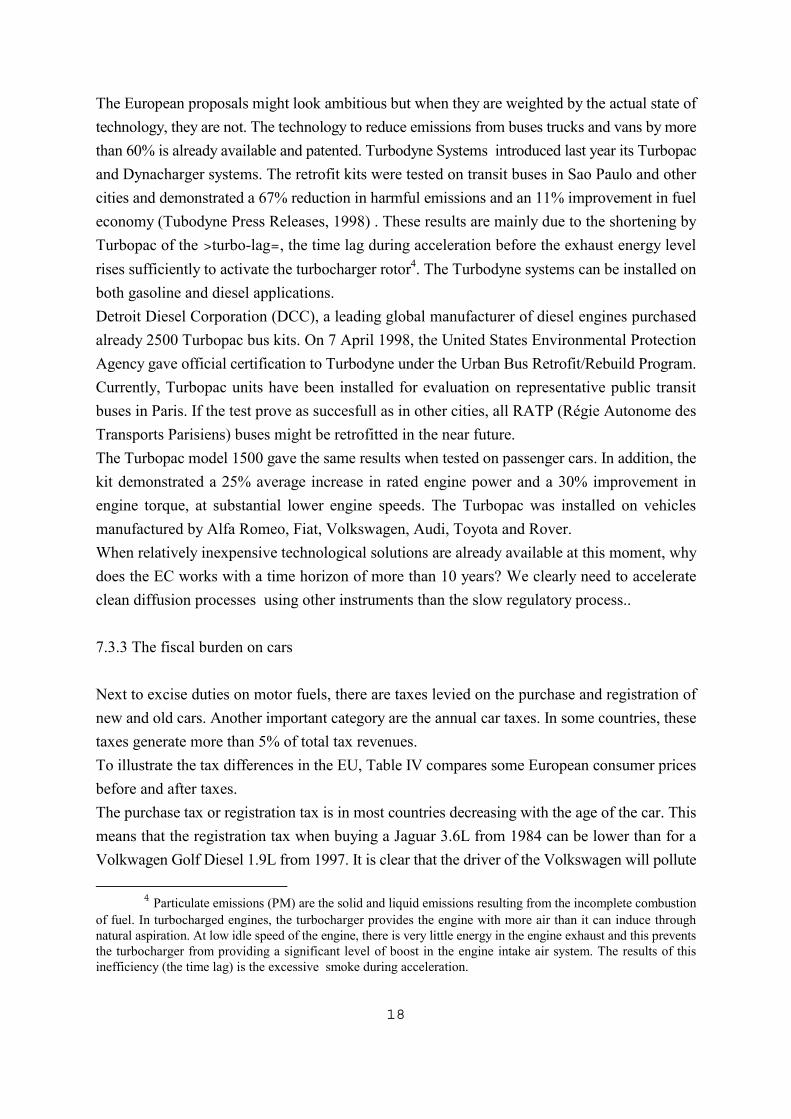
18
The European proposals might look ambitious but when they are weighted by the actual state oftechnology, they are not. The technology to reduce emissions from buses trucks and vans by morethan 60% is already available and patented. Turbodyne Systems introduced last year its Turbopacand Dynacharger systems. The retrofit kits were tested on transit buses in Sao Paulo and othercities and demonstrated a 67% reduction in harmful emissions and an 11% improvement in fueleconomy (Tubodyne Press Releases, 1998) . These results are mainly due to the shortening byTurbopac of the >turbo-lag=, the time lag during acceleration before the exhaust energy levelrises sufficiently to activate the turbocharger rotor4. The Turbodyne systems can be installed onboth gasoline and diesel applications.Detroit Diesel Corporation (DCC), a leading global manufacturer of diesel engines purchasedalready 2500 Turbopac bus kits. On 7 April 1998, the United States Environmental ProtectionAgency gave official certification to Turbodyne under the Urban Bus Retrofit/Rebuild Program.Currently, Turbopac units have been installed for evaluation on representative public transitbuses in Paris. If the test prove as succesfull as in other cities, all RATP (Régie Autonome desTransports Parisiens) buses might be retrofitted in the near future.The Turbopac model 1500 gave the same results when tested on passenger cars. In addition, thekit demonstrated a 25% average increase in rated engine power and a 30% improvement inengine torque, at substantial lower engine speeds. The Turbopac was installed on vehiclesmanufactured by Alfa Romeo, Fiat, Volkswagen, Audi, Toyota and Rover. When relatively inexpensive technological solutions are already available at this moment, whydoes the EC works with a time horizon of more than 10 years? We clearly need to accelerateclean diffusion processes using other instruments than the slow regulatory process..
7.3.3 The fiscal burden on cars
Next to excise duties on motor fuels, there are taxes levied on the purchase and registration ofnew and old cars. Another important category are the annual car taxes. In some countries, thesetaxes generate more than 5% of total tax revenues.To illustrate the tax differences in the EU, Table IV compares some European consumer pricesbefore and after taxes.The purchase tax or registration tax is in most countries decreasing with the age of the car. Thismeans that the registration tax when buying a Jaguar 3.6L from 1984 can be lower than for aVolkwagen Golf Diesel 1.9L from 1997. It is clear that the driver of the Volkswagen will pollute
4 Particulate emissions (PM) are the solid and liquid emissions resulting from the incomplete combustionof fuel. In turbocharged engines, the turbocharger provides the engine with more air than it can induce throughnatural aspiration. At low idle speed of the engine, there is very little energy in the engine exhaust and this preventsthe turbocharger from providing a significant level of boost in the engine intake air system. The results of thisinefficiency (the time lag) is the excessive smoke during acceleration.
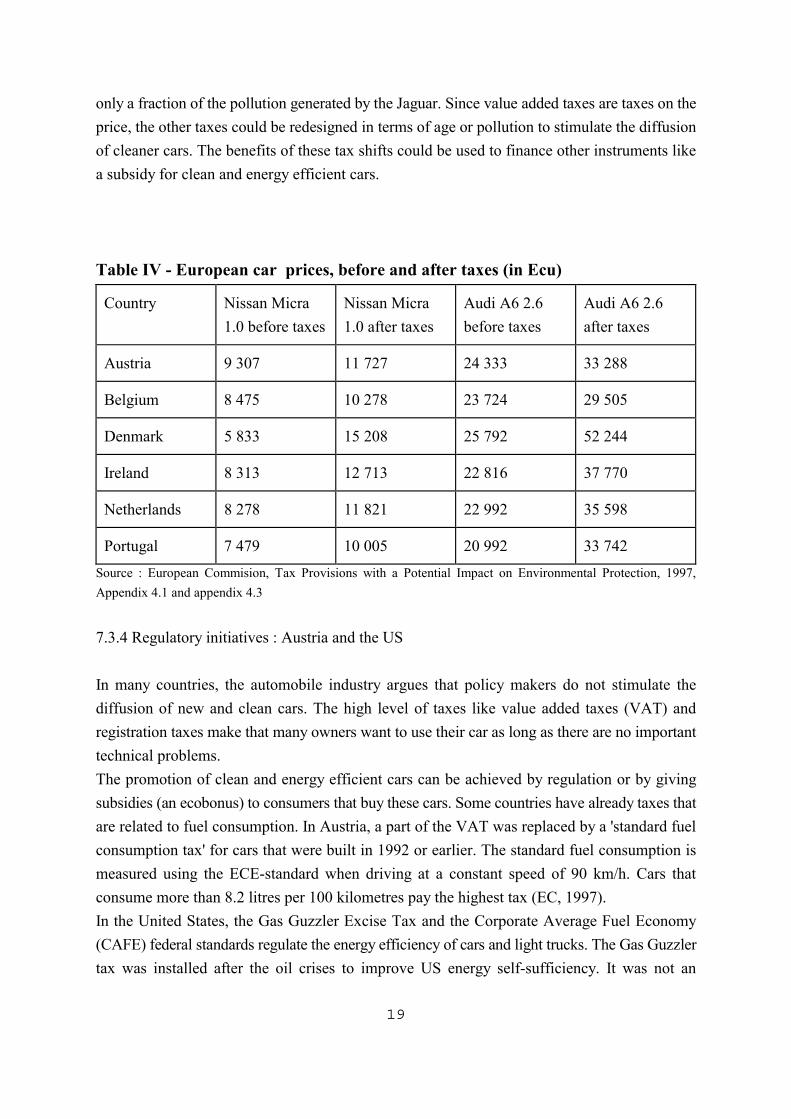
19
only a fraction of the pollution generated by the Jaguar. Since value added taxes are taxes on theprice, the other taxes could be redesigned in terms of age or pollution to stimulate the diffusionof cleaner cars. The benefits of these tax shifts could be used to finance other instruments likea subsidy for clean and energy efficient cars.
Table IV - European car prices, before and after taxes (in Ecu)
Country Nissan Micra1.0 before taxes
Nissan Micra1.0 after taxes
Audi A6 2.6before taxes
Audi A6 2.6after taxes
Austria 9 307 11 727 24 333 33 288
Belgium 8 475 10 278 23 724 29 505
Denmark 5 833 15 208 25 792 52 244
Ireland 8 313 12 713 22 816 37 770
Netherlands 8 278 11 821 22 992 35 598
Portugal 7 479 10 005 20 992 33 742Source : European Commision, Tax Provisions with a Potential Impact on Environmental Protection, 1997,Appendix 4.1 and appendix 4.3
7.3.4 Regulatory initiatives : Austria and the US
In many countries, the automobile industry argues that policy makers do not stimulate thediffusion of new and clean cars. The high level of taxes like value added taxes (VAT) andregistration taxes make that many owners want to use their car as long as there are no importanttechnical problems.The promotion of clean and energy efficient cars can be achieved by regulation or by givingsubsidies (an ecobonus) to consumers that buy these cars. Some countries have already taxes thatare related to fuel consumption. In Austria, a part of the VAT was replaced by a 'standard fuelconsumption tax' for cars that were built in 1992 or earlier. The standard fuel consumption ismeasured using the ECE-standard when driving at a constant speed of 90 km/h. Cars thatconsume more than 8.2 litres per 100 kilometres pay the highest tax (EC, 1997).In the United States, the Gas Guzzler Excise Tax and the Corporate Average Fuel Economy(CAFE) federal standards regulate the energy efficiency of cars and light trucks. The Gas Guzzlertax was installed after the oil crises to improve US energy self-sufficiency. It was not an
20
environmental tax. Cars that are less efficient than 22.5 miles/gallon (mpg) or 10.5 litres/100kilometres were taxed with the Guzzler Tax that started from $ 1000 and could amount to $ 7700(Westin, 1997).This tax has been attacked by the European Community that stated that European cars weredisproportionately taxed, especially since light trucks, which are very popular as alternatives tocars in the US, were not taxed under the Guzzler Tax.. Light trucks account for one third of theUS car market. The GATT Panel rejected the European arguments on the theory that the lawlacks a protectionist purpose.The Guzzler Tax would only have impact on powerful cars and therefore the Corporate AverageFuel Economy provisions of the 1975 Clean Air Act are more important when it comes to theaverage fuel consumption of the US car fleet. The CAFE standards require that new cars averageat least 27.5 mpg (8.5 l/100 km) and light trucks average 20.6 mpg (11.5 l/100 km). The CAFEis an average standard for the complete fleet of a manufacturer. Car makers still can producevehicles which fail to meet the standards as long as enough other models meet the CAFEstandards to balance out the 'guzzlers'. Since foreign manufacturers do not have the opportunityto compensate the fuel inefficiency of their top models - with the highest profit margins - byselling high volumes of their smaller and more efficient cars on the US market, manufacturerslike BMW and Mercedes attacked CAFE under the GATT. This time, the CAFE tax case wasdecided in favor of the protesting nations because it was discriminatory. As a result, there willbe no CAFE taxes on imported cars.Since US car manufacturers reached this CAFE standard already in the 1980s, mainly byreducing weight, improvements in fuel economy have stagnated since then. Manufacturersinvested in performance inprovements, safety and luxury aspects.Environmental groups like the Sierra Club therefore want to adapt the CAFE standards to theactual technological possibilities. In his recent election campaign, President Clinton also sugge-sted an stricter CAFE standard for the coming years. The Sierra Club proposed an update of theCAFE law to 45 mpg (5.2 l/100 km) for cars, and 34 mpg (7.2 l/100 km) for light trucks. If thesestandards are met in the coming years, the new CAFE would >save more oil than the US importfrom the entire Persian Gulf (Sierra Club,1997)=.Efficiency gains do not only depend on the fuel cell technology but can be achieved using multi-valve engines, variable valve timing, high-strength lightweight structures, optimized gearing,better aerodynamics, low rolling resistance tires and improved fuel quality.
7.3.5 The ecobonus for cars
There are no actual indications that in the near future a European CAFE standard might beimposed. European policy makers that are attracted be the principle will hesitate because structu-ral regulatory changes concerning the international car industry, are expected to come from the
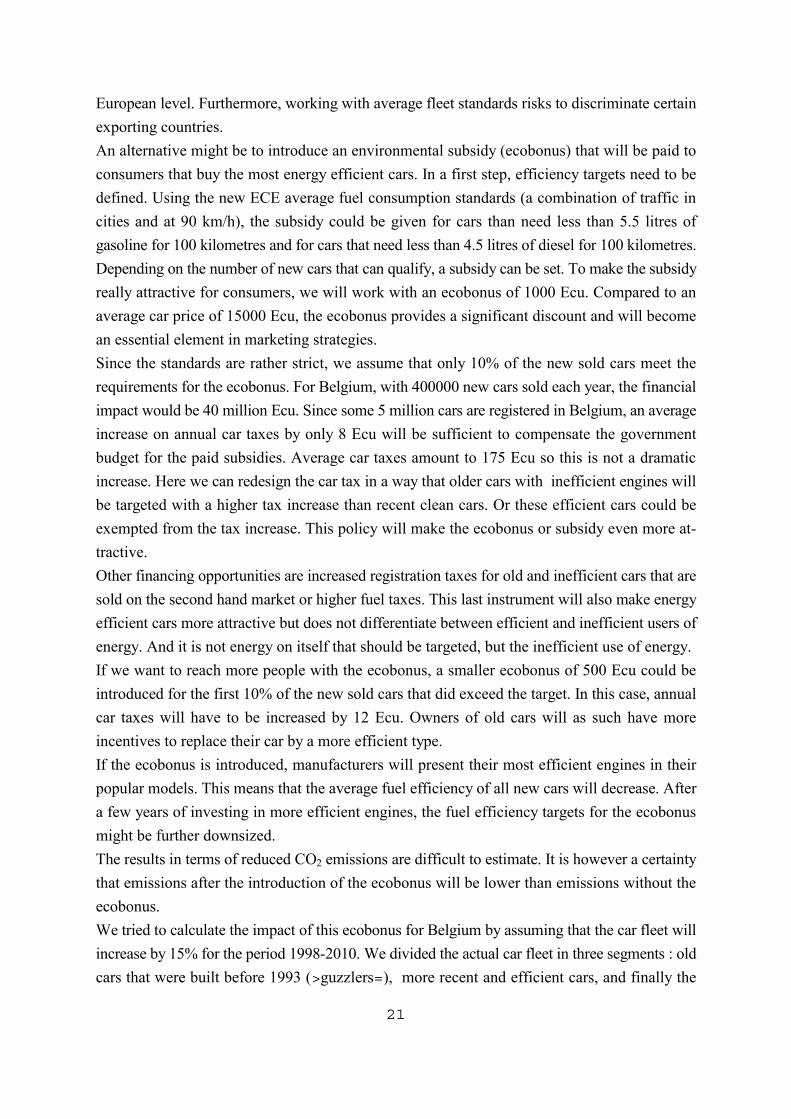
21
European level. Furthermore, working with average fleet standards risks to discriminate certainexporting countries.An alternative might be to introduce an environmental subsidy (ecobonus) that will be paid toconsumers that buy the most energy efficient cars. In a first step, efficiency targets need to bedefined. Using the new ECE average fuel consumption standards (a combination of traffic incities and at 90 km/h), the subsidy could be given for cars than need less than 5.5 litres ofgasoline for 100 kilometres and for cars that need less than 4.5 litres of diesel for 100 kilometres.Depending on the number of new cars that can qualify, a subsidy can be set. To make the subsidyreally attractive for consumers, we will work with an ecobonus of 1000 Ecu. Compared to anaverage car price of 15000 Ecu, the ecobonus provides a significant discount and will becomean essential element in marketing strategies.Since the standards are rather strict, we assume that only 10% of the new sold cars meet therequirements for the ecobonus. For Belgium, with 400000 new cars sold each year, the financialimpact would be 40 million Ecu. Since some 5 million cars are registered in Belgium, an averageincrease on annual car taxes by only 8 Ecu will be sufficient to compensate the governmentbudget for the paid subsidies. Average car taxes amount to 175 Ecu so this is not a dramaticincrease. Here we can redesign the car tax in a way that older cars with inefficient engines willbe targeted with a higher tax increase than recent clean cars. Or these efficient cars could beexempted from the tax increase. This policy will make the ecobonus or subsidy even more at-tractive.Other financing opportunities are increased registration taxes for old and inefficient cars that aresold on the second hand market or higher fuel taxes. This last instrument will also make energyefficient cars more attractive but does not differentiate between efficient and inefficient users ofenergy. And it is not energy on itself that should be targeted, but the inefficient use of energy.If we want to reach more people with the ecobonus, a smaller ecobonus of 500 Ecu could beintroduced for the first 10% of the new sold cars that did exceed the target. In this case, annualcar taxes will have to be increased by 12 Ecu. Owners of old cars will as such have moreincentives to replace their car by a more efficient type.If the ecobonus is introduced, manufacturers will present their most efficient engines in theirpopular models. This means that the average fuel efficiency of all new cars will decrease. Aftera few years of investing in more efficient engines, the fuel efficiency targets for the ecobonusmight be further downsized.The results in terms of reduced CO2 emissions are difficult to estimate. It is however a certaintythat emissions after the introduction of the ecobonus will be lower than emissions without theecobonus.We tried to calculate the impact of this ecobonus for Belgium by assuming that the car fleet willincrease by 15% for the period 1998-2010. We divided the actual car fleet in three segments : oldcars that were built before 1993 (>guzzlers=), more recent and efficient cars, and finally the
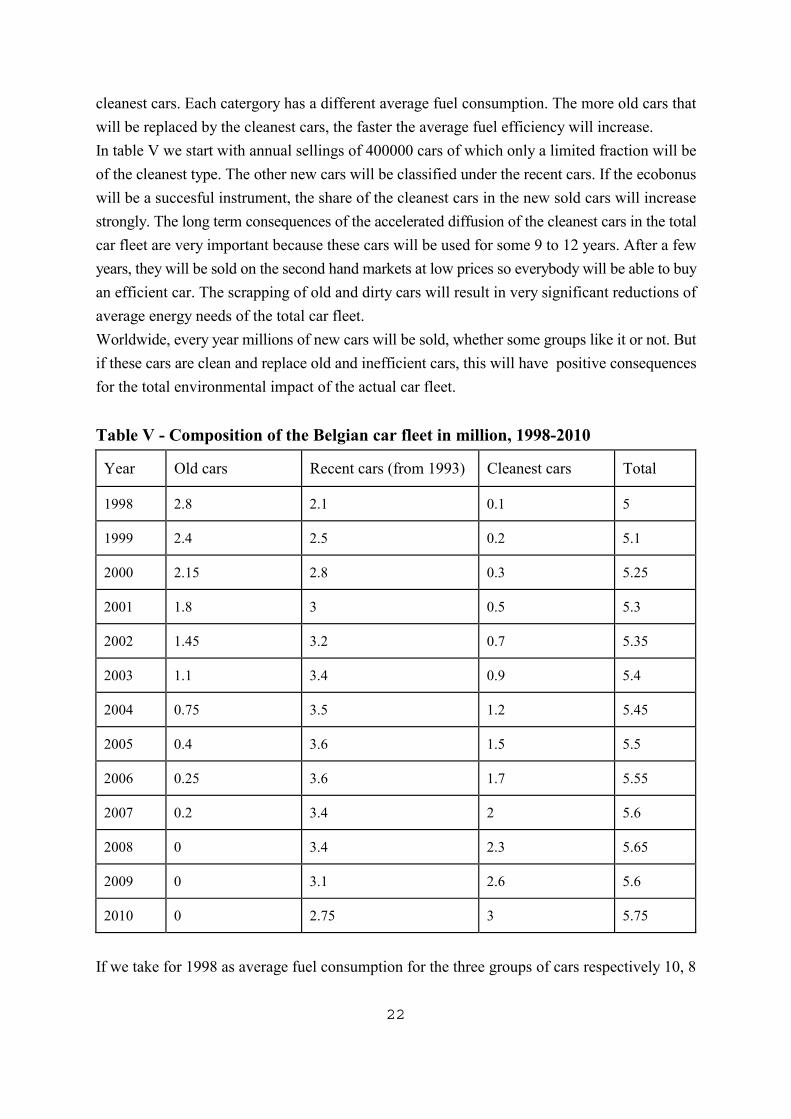
22
cleanest cars. Each catergory has a different average fuel consumption. The more old cars thatwill be replaced by the cleanest cars, the faster the average fuel efficiency will increase.In table V we start with annual sellings of 400000 cars of which only a limited fraction will beof the cleanest type. The other new cars will be classified under the recent cars. If the ecobonuswill be a succesful instrument, the share of the cleanest cars in the new sold cars will increasestrongly. The long term consequences of the accelerated diffusion of the cleanest cars in the totalcar fleet are very important because these cars will be used for some 9 to 12 years. After a fewyears, they will be sold on the second hand markets at low prices so everybody will be able to buyan efficient car. The scrapping of old and dirty cars will result in very significant reductions ofaverage energy needs of the total car fleet.Worldwide, every year millions of new cars will be sold, whether some groups like it or not. Butif these cars are clean and replace old and inefficient cars, this will have positive consequencesfor the total environmental impact of the actual car fleet.
Table V - Composition of the Belgian car fleet in million, 1998-2010
Year Old cars Recent cars (from 1993) Cleanest cars Total
1998 2.8 2.1 0.1 5
1999 2.4 2.5 0.2 5.1
2000 2.15 2.8 0.3 5.25
2001 1.8 3 0.5 5.3
2002 1.45 3.2 0.7 5.35
2003 1.1 3.4 0.9 5.4
2004 0.75 3.5 1.2 5.45
2005 0.4 3.6 1.5 5.5
2006 0.25 3.6 1.7 5.55
2007 0.2 3.4 2 5.6
2008 0 3.4 2.3 5.65
2009 0 3.1 2.6 5.6
2010 0 2.75 3 5.75
If we take for 1998 as average fuel consumption for the three groups of cars respectively 10, 8
23
and 5 litres for 100 kilometres, the average fuel efficiency of the actual fleet is 9.06 litres for 100kilometres. For 2010, we assume that the group of recent cars needs 7 litres and the cleanest carsneed only 4 litres for 100 kilometres. This brings the average fuel efficiency of the fleet in 2010to 5.43 litres for 100 kilometres, a reduction by 40% compared to 1998.If the 5.75 million cars in 2010 are used for the same average number of kilometres as in 1998,total energy needs after the growth of the car fleet by 15% will still be reduced by 31%. And ifwe assume that each car in 2010 will make 10% more kilometres than the average car in 1998,the reduction of energy needs and CO2 emissions will still be 25%.Of course, also without the ecobonus, average fuel consumption will be reduced as a result of thescrapping of old and dirty cars . The ecobonus can accelerate the diffusion of the cleanest models.For engines of light vehicles, trucks and buses, similar improvements might be expected over alonger period since the lifetime of the best trucks is around 2 to 2.5 million kilometres.Furthermore, congestion problems may stimulate intermodal shift what can result in additionalCO2 reductions.Stating that total transport emissions of CO2 will be reduced in 2010 by some 15% compared to1998, is not that speculative. Compared to 1990, a 10% reduction should be possible whencleanest technologies are strongly promoted.Less combustion of fuel means also less pollution other than CO2. The next generation ofcatalytic converters, like the types that will meet the most recent Californian laws on Ultra LowEmission Vehicles (ULEV) in 1999 and 2001, will further reduce other emissions by 90%compared to average car emissions in 1995. The Honda Accord 2.2 EX was the first car that didqualify for the new Californian emission standards (Honda, 1997).
7.4 Subsidies for other consumer products
Using environmental subsidies for heating installations and cars will have more impact thanintroducing subsidies for energy efficient refrigerators or washing machines. But everyimprovement in energy efficiency is important so we have to exploit all opportunities to save ondomestic and tertiary energy needs.This is also the European position : "On the end-use side there are numerous ways to improveefficiencies, both in the industrial and in the domestic and tertiary sectors. Refrigerators,computers, televisions, washing machines, light bulbs are only a few examples where use ofexisting technology will allow the same level of service with much less energy consumption.Electric motors used extensively in industry can similarly be improved. The EU has alreadydeveloped mandatory energy efficiency labeling schemes for the principal 'white goods' andmandatory standards for refrigerators/freezers to improve efficiency. The Commission is nownegotiating standards on a more extensive product range with the relevant industrial sectors(COM(97)481)."
24
The existing labels for energy efficient or white goods (Dir.92/75/EC, Dir.94/2/EC, Dir.95/13/E-C, Dir.96/57/EC, Dir.96/60/EC and Dir.97/17/EC) are the result of the European PACEProgramme (Programme d'action communautaire visant à ameliorer l'efficacité d'utilisation del'éléctricité) of which SAVE (Specific Actions for Vigourous Energy Efficiency) was animportant subprogramme.The European energy label uses a graphical indication of energy efficiency ranging with thelabels A (more than 45% more efficient than average) to G (more than 25% less efficient thanaverage). The EU has the intention to continuously update the labels in terms of average energyefficiency and to ban from the European markets in the year 2000 all products with the label G(Electrabel, 1997).In Belgium, the electricity provider Electrabel used the European label in its campaign toimprove 'rational energy use'. In order to attract attention, a subsidy of 50 Ecu was provided whenconsumers did buy a refrigerator or freezer with the label A. Electrabel finances this subsidy fromits own resources. This subsidy was a great succes because it almost completely compensated forthe price difference with less efficient types. As a consequence, many distributors of coolingequipment changed their product selection and started to present many types of the most efficientrefrigerators and freezers. In their publicity, annual energy needs are provided for coolingequipment and for washing machines. As such the awareness of the public is strongly increased.In the near future, the energy label will also be used for washing and drying machines, dishwashers, cooking equipment, electric mobile heating devices, light bulbs and air conditionings.From 1999, a subsidy of 75 Ecu will be provided when consumers opt for the most efficientwashing machines and dish washers (Nieuwejaers, 1998).The potential savings on energy and on CO2 emissions might be considered as limited becausewe only deal with refrigerators or freezers. But both consumer goods have a long lifetime whatmakes that their cumulative energy savings can be significant.Starting from the difference in annual energy needs between an efficient type and an inefficienttype, expressed in kWh, table VI calculates the difference in total energy costs and total CO2
emissions after a period of ten years. The calculations are made using an average electricity priceof 5 BEF/kWh.
Table VI - Differences in energy costs over a 10 year period
E-difference Difference in energycosts after 10 years
Actualised differencein energy costs
Difference in CO2 emis-sions after 10 years
50 kWh 2500 BEF (Belg.Fr.) 2109 BEF 92 kg
100 kWh 5000 BEF 4218 BEF 184 kg
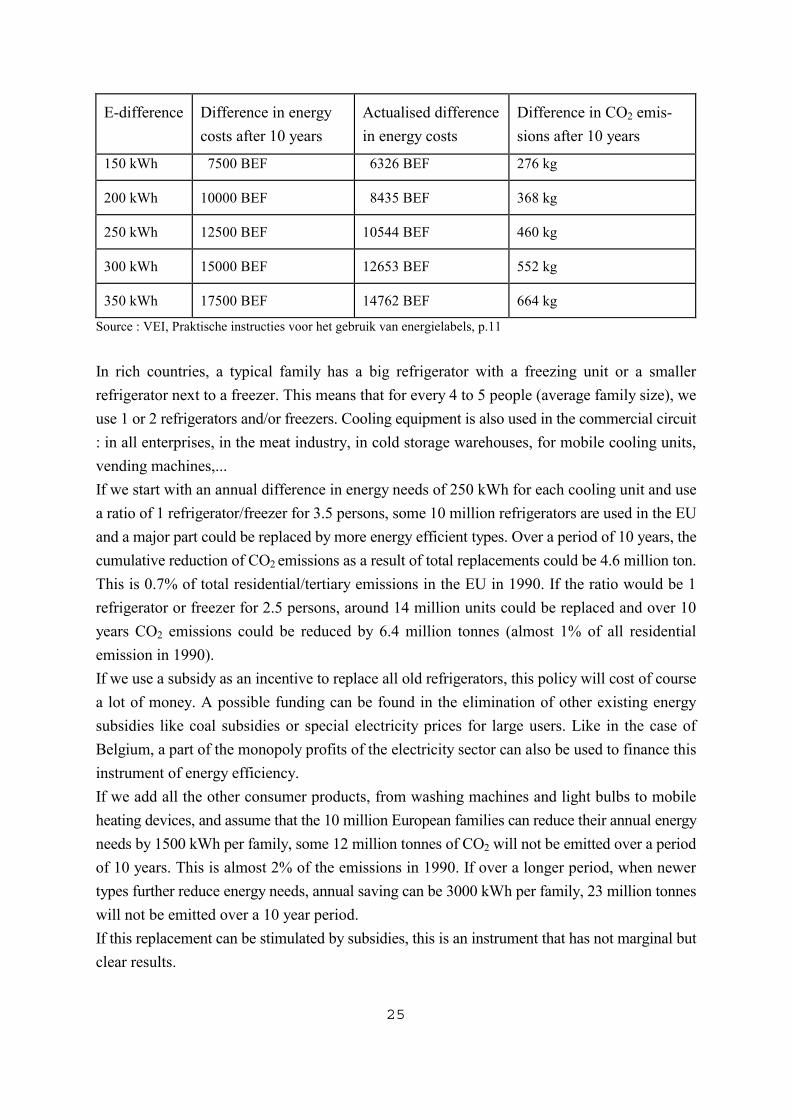
25
E-difference Difference in energycosts after 10 years
Actualised differencein energy costs
Difference in CO2 emis-sions after 10 years
150 kWh 7500 BEF 6326 BEF 276 kg
200 kWh 10000 BEF 8435 BEF 368 kg
250 kWh 12500 BEF 10544 BEF 460 kg
300 kWh 15000 BEF 12653 BEF 552 kg
350 kWh 17500 BEF 14762 BEF 664 kg
Source : VEI, Praktische instructies voor het gebruik van energielabels, p.11
In rich countries, a typical family has a big refrigerator with a freezing unit or a smallerrefrigerator next to a freezer. This means that for every 4 to 5 people (average family size), weuse 1 or 2 refrigerators and/or freezers. Cooling equipment is also used in the commercial circuit: in all enterprises, in the meat industry, in cold storage warehouses, for mobile cooling units,vending machines,...If we start with an annual difference in energy needs of 250 kWh for each cooling unit and usea ratio of 1 refrigerator/freezer for 3.5 persons, some 10 million refrigerators are used in the EUand a major part could be replaced by more energy efficient types. Over a period of 10 years, thecumulative reduction of CO2 emissions as a result of total replacements could be 4.6 million ton.This is 0.7% of total residential/tertiary emissions in the EU in 1990. If the ratio would be 1refrigerator or freezer for 2.5 persons, around 14 million units could be replaced and over 10years CO2 emissions could be reduced by 6.4 million tonnes (almost 1% of all residentialemission in 1990).If we use a subsidy as an incentive to replace all old refrigerators, this policy will cost of coursea lot of money. A possible funding can be found in the elimination of other existing energysubsidies like coal subsidies or special electricity prices for large users. Like in the case ofBelgium, a part of the monopoly profits of the electricity sector can also be used to finance thisinstrument of energy efficiency.If we add all the other consumer products, from washing machines and light bulbs to mobileheating devices, and assume that the 10 million European families can reduce their annual energyneeds by 1500 kWh per family, some 12 million tonnes of CO2 will not be emitted over a periodof 10 years. This is almost 2% of the emissions in 1990. If over a longer period, when newertypes further reduce energy needs, annual saving can be 3000 kWh per family, 23 million tonneswill not be emitted over a 10 year period.If this replacement can be stimulated by subsidies, this is an instrument that has not marginal butclear results.
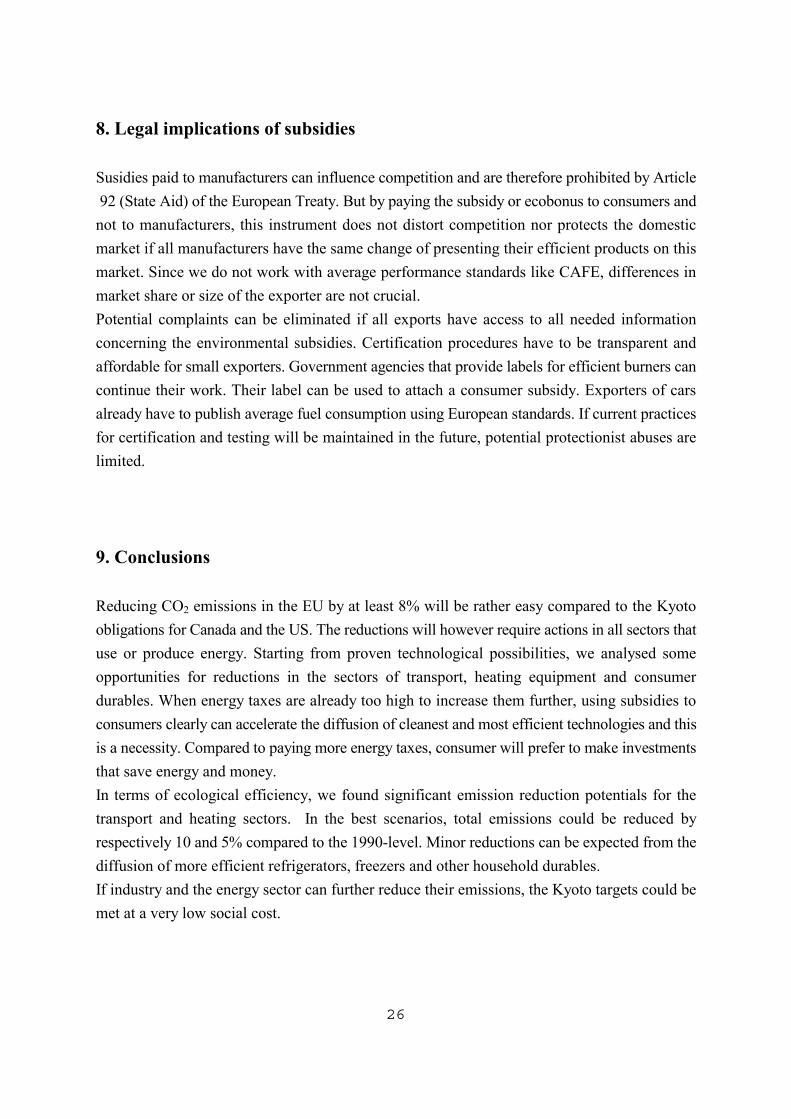
26
8. Legal implications of subsidies
Susidies paid to manufacturers can influence competition and are therefore prohibited by Article 92 (State Aid) of the European Treaty. But by paying the subsidy or ecobonus to consumers andnot to manufacturers, this instrument does not distort competition nor protects the domesticmarket if all manufacturers have the same change of presenting their efficient products on thismarket. Since we do not work with average performance standards like CAFE, differences inmarket share or size of the exporter are not crucial.Potential complaints can be eliminated if all exports have access to all needed informationconcerning the environmental subsidies. Certification procedures have to be transparent andaffordable for small exporters. Government agencies that provide labels for efficient burners cancontinue their work. Their label can be used to attach a consumer subsidy. Exporters of carsalready have to publish average fuel consumption using European standards. If current practicesfor certification and testing will be maintained in the future, potential protectionist abuses arelimited.
9. Conclusions
Reducing CO2 emissions in the EU by at least 8% will be rather easy compared to the Kyotoobligations for Canada and the US. The reductions will however require actions in all sectors thatuse or produce energy. Starting from proven technological possibilities, we analysed someopportunities for reductions in the sectors of transport, heating equipment and consumerdurables. When energy taxes are already too high to increase them further, using subsidies toconsumers clearly can accelerate the diffusion of cleanest and most efficient technologies and thisis a necessity. Compared to paying more energy taxes, consumer will prefer to make investmentsthat save energy and money.In terms of ecological efficiency, we found significant emission reduction potentials for thetransport and heating sectors. In the best scenarios, total emissions could be reduced byrespectively 10 and 5% compared to the 1990-level. Minor reductions can be expected from thediffusion of more efficient refrigerators, freezers and other household durables.If industry and the energy sector can further reduce their emissions, the Kyoto targets could bemet at a very low social cost.
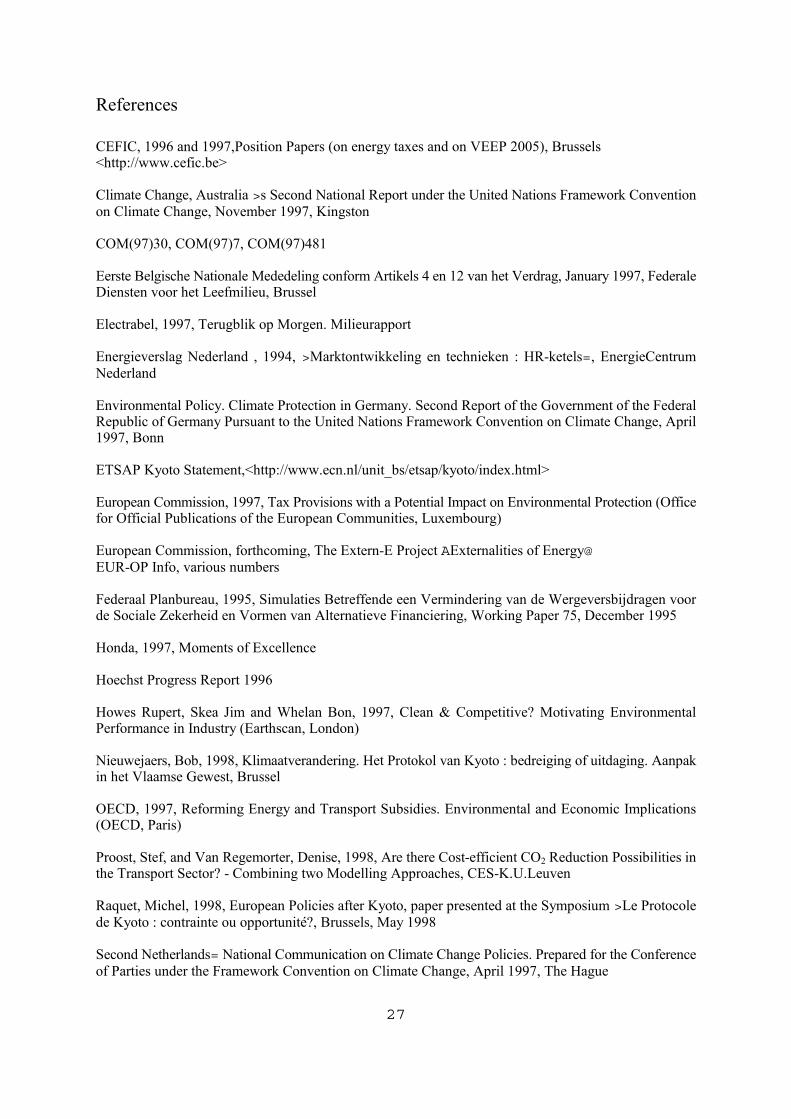
27
References
CEFIC, 1996 and 1997,Position Papers (on energy taxes and on VEEP 2005), Brussels<http://www.cefic.be>
Climate Change, Australia >s Second National Report under the United Nations Framework Conventionon Climate Change, November 1997, Kingston
COM(97)30, COM(97)7, COM(97)481
Eerste Belgische Nationale Mededeling conform Artikels 4 en 12 van het Verdrag, January 1997, FederaleDiensten voor het Leefmilieu, Brussel
Electrabel, 1997, Terugblik op Morgen. Milieurapport
Energieverslag Nederland , 1994, >Marktontwikkeling en technieken : HR-ketels=, EnergieCentrumNederland
Environmental Policy. Climate Protection in Germany. Second Report of the Government of the FederalRepublic of Germany Pursuant to the United Nations Framework Convention on Climate Change, April1997, Bonn
ETSAP Kyoto Statement,<http://www.ecn.nl/unit_bs/etsap/kyoto/index.html>
European Commission, 1997, Tax Provisions with a Potential Impact on Environmental Protection (Officefor Official Publications of the European Communities, Luxembourg)
European Commission, forthcoming, The Extern-E Project AExternalities of Energy@EUR-OP Info, various numbers
Federaal Planbureau, 1995, Simulaties Betreffende een Vermindering van de Wergeversbijdragen voorde Sociale Zekerheid en Vormen van Alternatieve Financiering, Working Paper 75, December 1995
Honda, 1997, Moments of Excellence
Hoechst Progress Report 1996
Howes Rupert, Skea Jim and Whelan Bon, 1997, Clean & Competitive? Motivating EnvironmentalPerformance in Industry (Earthscan, London)
Nieuwejaers, Bob, 1998, Klimaatverandering. Het Protokol van Kyoto : bedreiging of uitdaging. Aanpakin het Vlaamse Gewest, Brussel
OECD, 1997, Reforming Energy and Transport Subsidies. Environmental and Economic Implications(OECD, Paris)
Proost, Stef, and Van Regemorter, Denise, 1998, Are there Cost-efficient CO2 Reduction Possibilities inthe Transport Sector? - Combining two Modelling Approaches, CES-K.U.Leuven
Raquet, Michel, 1998, European Policies after Kyoto, paper presented at the Symposium >Le Protocolede Kyoto : contrainte ou opportunité?, Brussels, May 1998
Second Netherlands= National Communication on Climate Change Policies. Prepared for the Conferenceof Parties under the Framework Convention on Climate Change, April 1997, The Hague
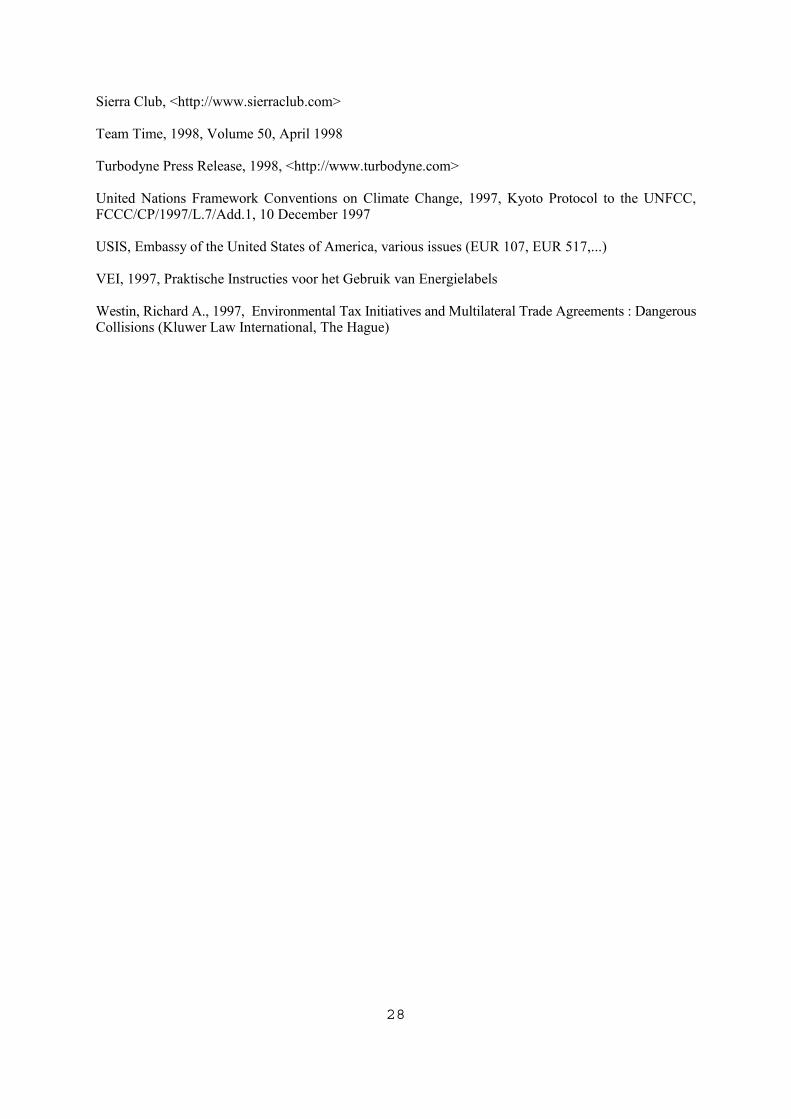
28
Sierra Club, <http://www.sierraclub.com>
Team Time, 1998, Volume 50, April 1998
Turbodyne Press Release, 1998, <http://www.turbodyne.com>
United Nations Framework Conventions on Climate Change, 1997, Kyoto Protocol to the UNFCC,FCCC/CP/1997/L.7/Add.1, 10 December 1997
USIS, Embassy of the United States of America, various issues (EUR 107, EUR 517,...)
VEI, 1997, Praktische Instructies voor het Gebruik van Energielabels
Westin, Richard A., 1997, Environmental Tax Initiatives and Multilateral Trade Agreements : DangerousCollisions (Kluwer Law International, The Hague)
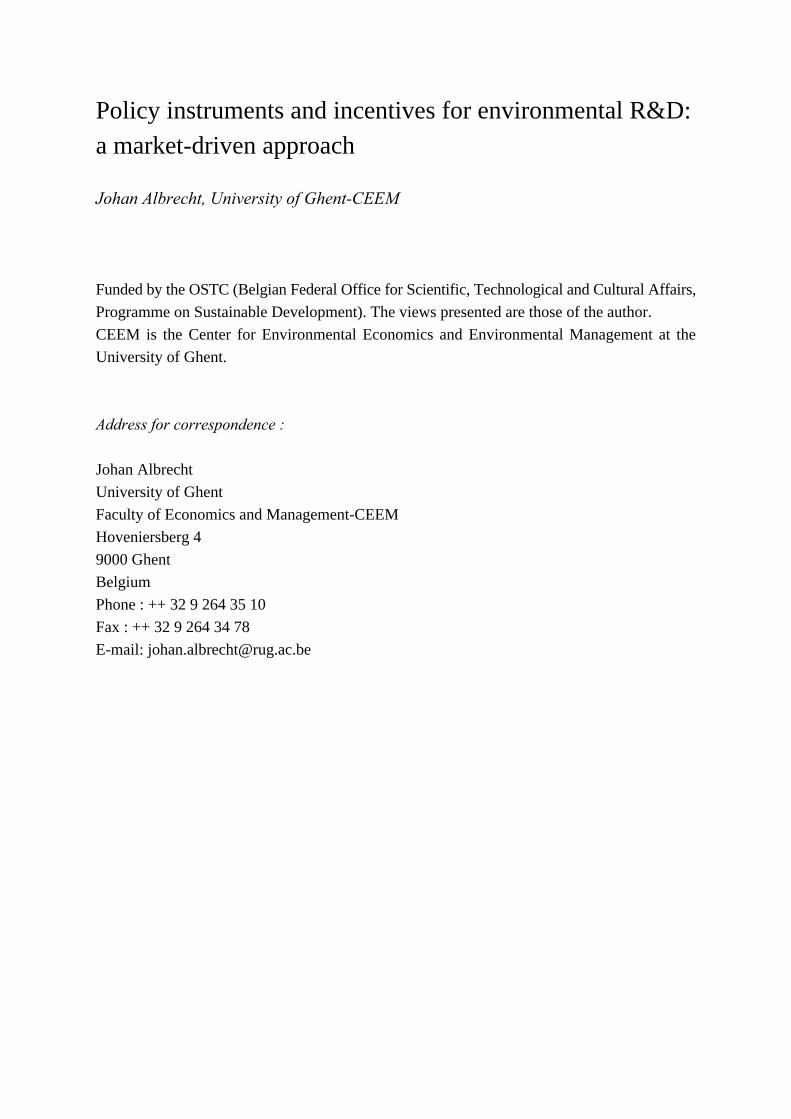
Policy instruments and incentives for environmental R&D:a market-driven approach
Johan Albrecht, University of Ghent-CEEM
Funded by the OSTC (Belgian Federal Office for Scientific, Technological and Cultural Affairs,Programme on Sustainable Development). The views presented are those of the author.CEEM is the Center for Environmental Economics and Environmental Management at theUniversity of Ghent.
Address for correspondence :
Johan AlbrechtUniversity of GhentFaculty of Economics and Management-CEEMHoveniersberg 49000 GhentBelgiumPhone : ++ 32 9 264 35 10Fax : ++ 32 9 264 34 78E-mail: [email protected]
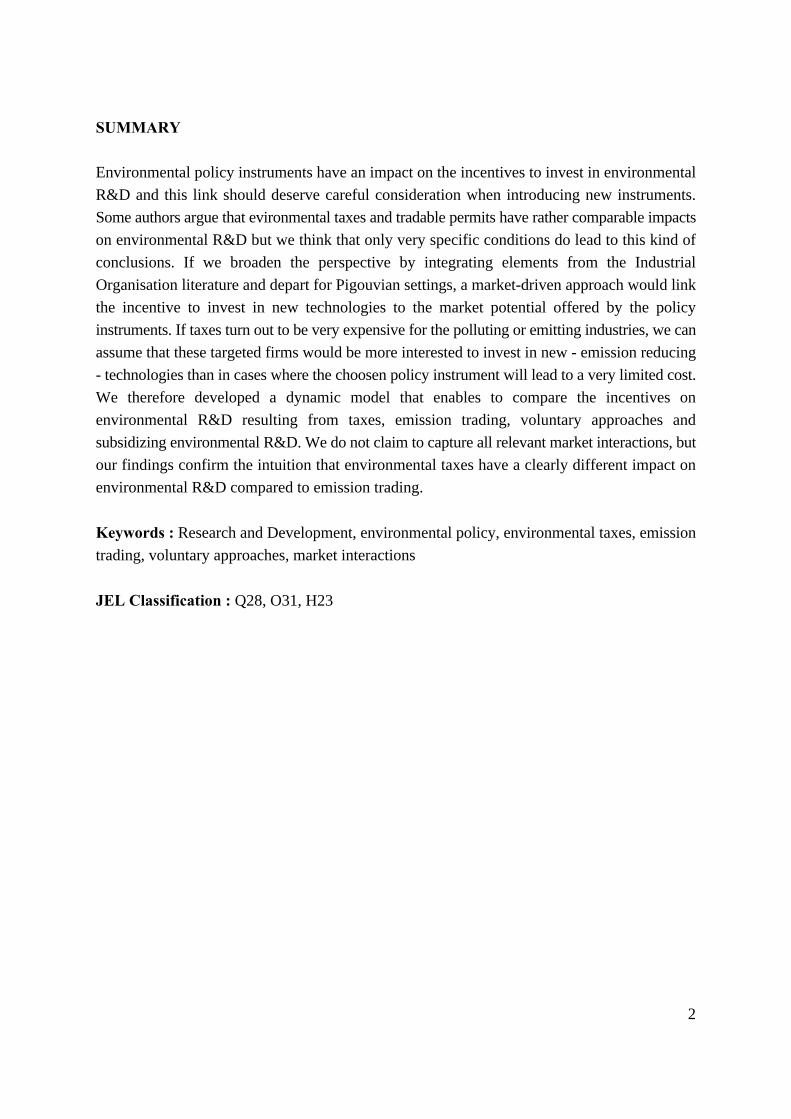
2
SUMMARY
Environmental policy instruments have an impact on the incentives to invest in environmentalR&D and this link should deserve careful consideration when introducing new instruments.Some authors argue that evironmental taxes and tradable permits have rather comparable impactson environmental R&D but we think that only very specific conditions do lead to this kind ofconclusions. If we broaden the perspective by integrating elements from the IndustrialOrganisation literature and depart for Pigouvian settings, a market-driven approach would linkthe incentive to invest in new technologies to the market potential offered by the policyinstruments. If taxes turn out to be very expensive for the polluting or emitting industries, we canassume that these targeted firms would be more interested to invest in new - emission reducing- technologies than in cases where the choosen policy instrument will lead to a very limited cost.We therefore developed a dynamic model that enables to compare the incentives onenvironmental R&D resulting from taxes, emission trading, voluntary approaches andsubsidizing environmental R&D. We do not claim to capture all relevant market interactions, butour findings confirm the intuition that environmental taxes have a clearly different impact onenvironmental R&D compared to emission trading.
Keywords : Research and Development, environmental policy, environmental taxes, emissiontrading, voluntary approaches, market interactions
JEL Classification : Q28, O31, H23
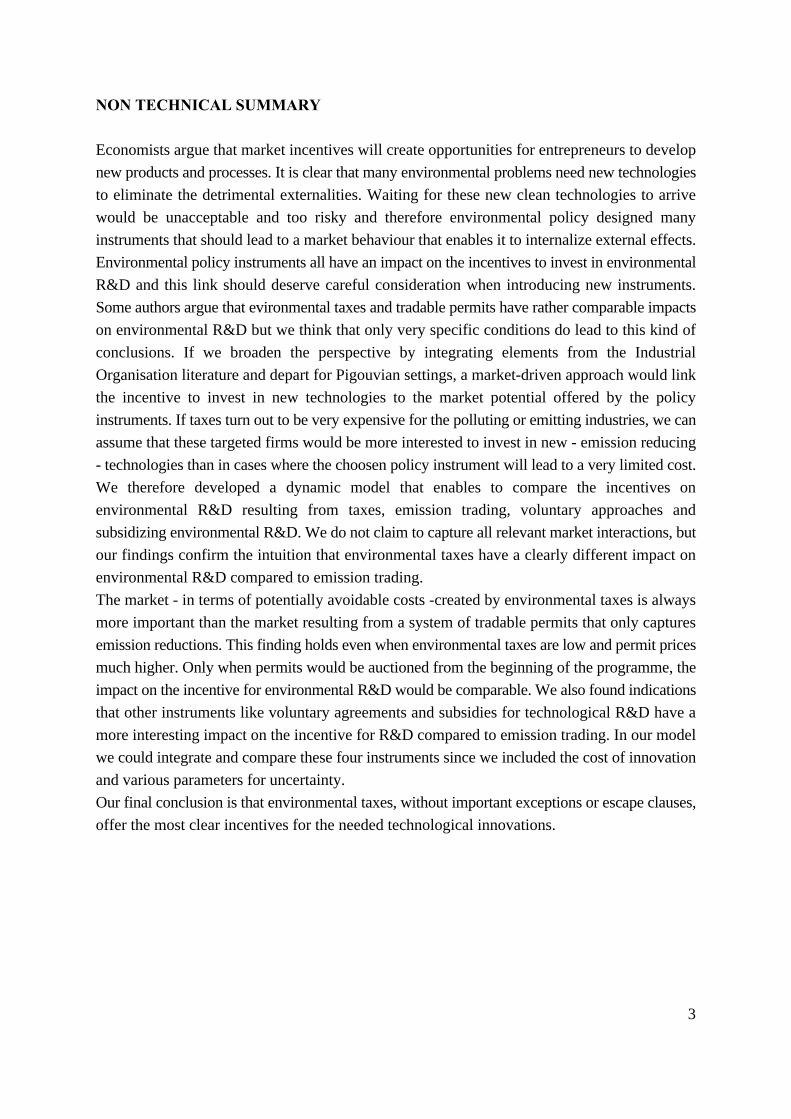
3
NON TECHNICAL SUMMARY
Economists argue that market incentives will create opportunities for entrepreneurs to developnew products and processes. It is clear that many environmental problems need new technologiesto eliminate the detrimental externalities. Waiting for these new clean technologies to arrivewould be unacceptable and too risky and therefore environmental policy designed manyinstruments that should lead to a market behaviour that enables it to internalize external effects.Environmental policy instruments all have an impact on the incentives to invest in environmentalR&D and this link should deserve careful consideration when introducing new instruments.Some authors argue that evironmental taxes and tradable permits have rather comparable impactson environmental R&D but we think that only very specific conditions do lead to this kind ofconclusions. If we broaden the perspective by integrating elements from the IndustrialOrganisation literature and depart for Pigouvian settings, a market-driven approach would linkthe incentive to invest in new technologies to the market potential offered by the policyinstruments. If taxes turn out to be very expensive for the polluting or emitting industries, we canassume that these targeted firms would be more interested to invest in new - emission reducing- technologies than in cases where the choosen policy instrument will lead to a very limited cost.We therefore developed a dynamic model that enables to compare the incentives onenvironmental R&D resulting from taxes, emission trading, voluntary approaches andsubsidizing environmental R&D. We do not claim to capture all relevant market interactions, butour findings confirm the intuition that environmental taxes have a clearly different impact onenvironmental R&D compared to emission trading.The market - in terms of potentially avoidable costs -created by environmental taxes is alwaysmore important than the market resulting from a system of tradable permits that only capturesemission reductions. This finding holds even when environmental taxes are low and permit pricesmuch higher. Only when permits would be auctioned from the beginning of the programme, theimpact on the incentive for environmental R&D would be comparable. We also found indicationsthat other instruments like voluntary agreements and subsidies for technological R&D have amore interesting impact on the incentive for R&D compared to emission trading. In our modelwe could integrate and compare these four instruments since we included the cost of innovationand various parameters for uncertainty.Our final conclusion is that environmental taxes, without important exceptions or escape clauses,offer the most clear incentives for the needed technological innovations.
4
CONTENTS
1. Introduction2. Presentation of the model
2.1 The polluting sector2.2 The innovating sector2.3 Adoption of the new technology2.4 The market potential for environmental technologies
3. Taxes versus permits4. The general model
4.1 Environmental taxes on emissions4.2 Tradable emission permits4.3 Voluntary agreements to reduce emissions4.4 Subsidies for technological R&R
5. Conclusions
References
5
1. Introduction
For many environmental problems, technological innovations can offer fundamental solutions,especially when behavioural changes are limited by various inertia. Our industrial andtechnological infrastructure that did lead to significant externalities, can be transformed to limitdetrimental environmental impacts. This transformation process is already happening verysmoothly since environmental considerations started to influence all engineering and industrialdesigning phases. During the coming decades, our technological infrastructure will no longer becharacterized by >brute-force= manipulation of scarce natural resources.Efficiency could and should lead to sufficiency and sustainability (Huber, 1998). If this positivescenario works out, the most convinced >technology-believers= would even suggest thatstringent and costly environmental policies could be postponed. For some areas like globalwarming policy, this possibility is considered because many scientific uncertainties could leadto the too early implementation of costly measures. We believe however that the strategy ofwaiting for superior technologies could turn out very disappointing. Like all other goods,technological products need an interesting market that stimulates the process of entrepreneurialand Schumpeterian dynamism. New technologies need to be commercialized and without clearand credible environmental policies or the threat to impose environmental measures in the nearfuture, such markets for new technologies do not exist. Waiting has always a price in terms oflost opportunities and therefore we argue that an accelerated technological innovation anddiffusion should be stimulated by the appropriate choice of environmental policy instruments.This consideration has already frequently been made during the 1970s and 1980s (Magat, 1979; Milliman and Prince, 1989) but recent environmental policy has not generally focused on thepositive connection between environmental improvement and technological innovation. Apossible explanation is that the early environmental movement often preoccupied itself with theadverse impacts of technology (OECD, 1997).In the economic literature, many studies on the different effects of environmental policyinstruments are based on the seminal paper by Weitzman (1974). He concluded that taxes shouldbe prefered to quantity controls when expected marginal benefits were relatively flat. The relativecurvature of the cost and damage functions is only part of the reason for preferring taxes.Weitzman also noted that when shocks to costs and benefits are correlated, this simple intuitionbreaks down (Pizer, 1997 ; Stavins, 1996).Basic elements of Industrial Organization literature were integrated by authors like Biglaiser andHorrowitz (1995) and Parry (1995, 1996). These authors work with Pigouvian taxes and permitprice levels equalling marginal environmental damage under perfectly competitive conditionswith homogeneous firms in terms of production and abatement costs. These market conditionsare hard to find what makes the conclusions of the studies difficult to generalize.Parry (1996) concludes that the incentives for environmental R&D are empirically similar underthe Pigouvian tax and under the Pigouvian quantity of permits when innovations are minor and
6
there is a well-functioning permit market. In our work, we will depart from Pigouvian settingsof taxes and quantities and illustrate that the different impact on the incentive for Research andDevelopment (R&D) resulting from taxes or permits is very significant.Furthermore, each sector or environmental problem has very specific characteristics that are notfound in other industries or policies objectives. As a result, the >overall= effects of theenvironmental regulation on R&D tends to be ambiguous (Palmer, Oates and Portney, 1995).In this paper, we have the ambition to work out in more detail the linkages betweenenvironmental instruments and the behaviour of the innovating sector. We introduce an investment decision that is made by firms that have the potential to invest in environmentalR&D. We see innovation as an endogeneous and continuous process. By the latter, we mean thatthe decision to innovate - not to compare with the decision to imitate - can be made at anymoment in our analysis and not only at the starting point of the simulation.In our approach, firms are not identical. Each of the polluting firms has different marginalabatement costs. To capture these differences in our model, we make use of probability densityfunctions.
2. Presentation of the model
In our model, we work with two sectors ; the group of polluting firms and the group of firmsinvesting in R&D to provide an abatement technology to the polluting sectors.The group of the polluting firms causes the externality and is the target of the environmentalpolicy. Government can use various instruments like taxes, tradable permits, technologicalstandards, performance standards, product bans, environmental agreements and the disclosureof environmental information (e.g. compliance records). Each instrument has a different impacton the process of technological innovation and diffusion. A comparative approach would bepreferred but is only possible for a limited selection of all available instruments. We thereforeprefer to simulate the incentives for environmental R&D that are the result of specificinstruments. Our findings could be an interesting complement to algebraic or game-theoreticalapproaches.
2.1 The polluting sector
We assume that abatement costs for the polluting firms differ. This is a realistic assumption inline with the findings of Hartman, Wheeler and Singh (1994) who used the U.S. Department ofCommerce=s annual 20000-plant random survey of pollution abatement costs and expenditures(PACE). For 37 sectors, the average abatement costs in $US (1993) per tonne were calculatedfor seven air pollutant categories : suspended particulate matter, sulphur dioxide, nitrogen oxidesand carbon monoxide, hydrocarbons, lead, hazardous (toxic) emissions and other emissions.
7
They concluded that maximum/minimum ratios are frequently near ten, and occasionally nearone hundred. Abatement costs for a selection of air pollutants and US industries are presentedin Table I.
Table I - Average abatement costs by sector, 1979-1985 ($1993/ton)
Industry Particulates Sulphuroxides
NO2, CO Hydro-carbons
Lead
Food 86 521 229 162 46612
Leather 132 377 8430 633 132
Industrial chemicals 46 75 304 213 1300
Chemical products 212 681 48 157 29
Metal products 343 1563 461 399 161
Electrical machinery 373 483 1559 215 365
Transport equipment 635 1266 468 1006 468
Motor vehicles 350 1523 1155 2441 21483
Source : Hartman, Wheeler and Singh, 1994, p.4
Another conclusion from the empirical analysis was that scale economies may apply to someabatement processes. The polluting industry can develop its own abatement technologies or can buy technologicalsolutions provided by the technological sector. Since end-of-pipe solutions were used for airpollution abatement, the data by Hartman e.a.(1994) are in most cases payments to technologyproviders. In our model, we assume that the polluting industry will always buy cleantechnologies. There will be no in-house development because these firms have no experiencewith environmental technology development and commercialization.If abatement costs for air pollutants can vary from $10 to $ 46000 per tonne (Hartman e.a., 1994),it will be very complicated to determine ex-ante the optimal Pigouvian tax or permit price. Wethink it is useful to assume that abatement costs follow a normal distribution over the pollutingfirms.
2.2 The innovating sector
In our model, we consider the decision to innovate and the marketing of the resulting innovationsas endogeneous. The innovating sector operates in a commercial environment and will base itsdecision to invest in environmental R&D on factors like the cost of the innovation, the chance
8
to achieve technological success, the discounted profits following from the commercialization,the rate of return of the project and the possibility of patent protection. In our thresholdinnovation model, we assume that firms want to invest in innovation if the cost of innovation(CI) does not exceed a critical value, determined by the discounted profits from innovation.
We calculate these discounted profits from innovation (DPI) for i years as :
DPI = ρ∑ [(pi - ci)*qi]/ (1+r)i ,
with pi = price for technology on the market ;ci = cost of producing the technology ;qi = quantity sold to polluting industries ;r = internal rate of return ;ñ = success probability (technical success and the possibility to commercialize theinnovation) or uncertainty factor (0 < ρ < 1)
Investing in technological innovations is an activity with many business risks. We follow theapproach indicated by Mansfield and identify three different success probabilities : (1) theprobability that technological goals would be achieved ; (2) the probability that, conditional upontechnical success, the resulting product or process would be commercialized ; and (3) givencommercialization, the probability that the project yielded a return on investment at least as highas the opportunity cost of the firms capital (Scherer and Ross, 1990).Scherer and Ross (1990) also present the empirical results of the investigations by Mansfield. Forthe firms in his analysis, the average probabilities were :
Technical success (ρ1) 0.57
Commercialization, given technical success (ρ2) 0.65
Financial success, given commercialization (ρ3) 0.74
with ρ = ρ1* ρ2*ρ3 (=0.274)
It is clear that the choice of the used environmental policy instrument has a strong impact on theprobability of realizing a financial success but not on the technical success probability. Supposethat in this example, the best environmental policy results in a financial success probability of0.95 compared to a probability of only 0.55 for the worst policy option, the difference in totalsuccess probability would be 0.15 (0.35 - 0.20) what is much less than two times 0.20. Some authors link total success probability to the number of firms that invest in environmentalR&D. The higher the number of involved firms, the more limited is the probability of financialsuccess. This is a reasonable assumption in the case when there is only one technology that can
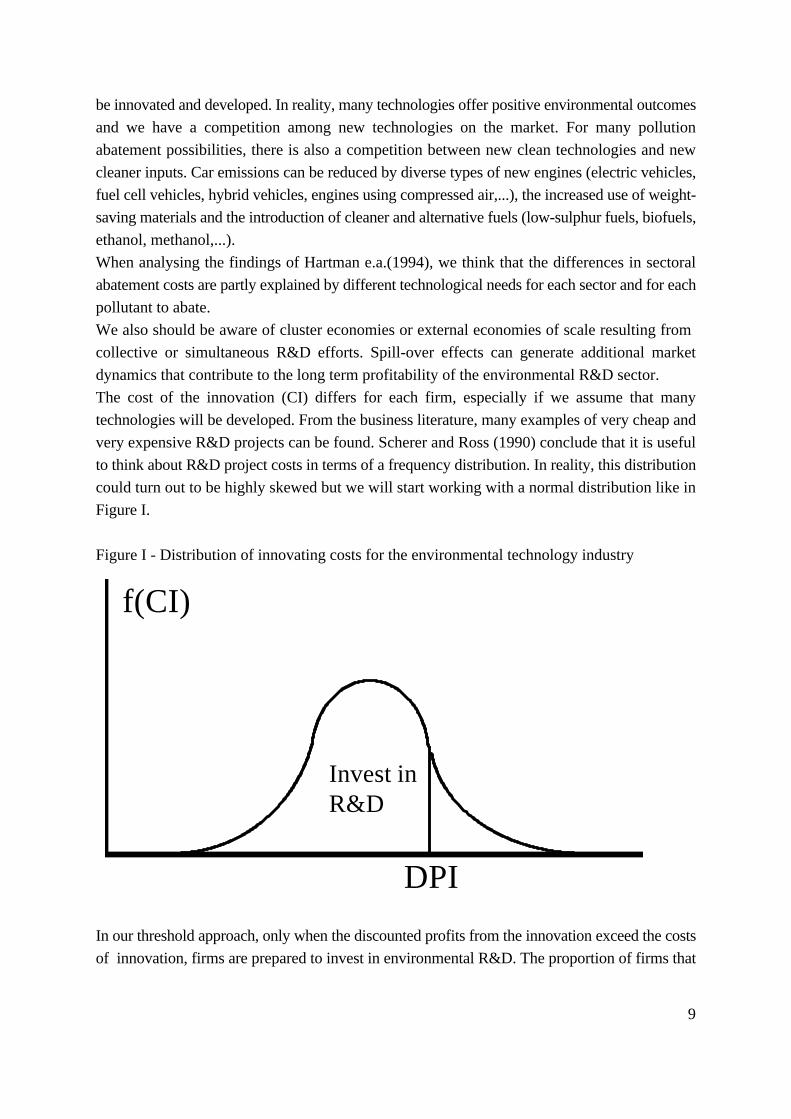
9
be innovated and developed. In reality, many technologies offer positive environmental outcomesand we have a competition among new technologies on the market. For many pollutionabatement possibilities, there is also a competition between new clean technologies and newcleaner inputs. Car emissions can be reduced by diverse types of new engines (electric vehicles,fuel cell vehicles, hybrid vehicles, engines using compressed air,...), the increased use of weight-saving materials and the introduction of cleaner and alternative fuels (low-sulphur fuels, biofuels,ethanol, methanol,...).When analysing the findings of Hartman e.a.(1994), we think that the differences in sectoralabatement costs are partly explained by different technological needs for each sector and for eachpollutant to abate.We also should be aware of cluster economies or external economies of scale resulting from collective or simultaneous R&D efforts. Spill-over effects can generate additional marketdynamics that contribute to the long term profitability of the environmental R&D sector.The cost of the innovation (CI) differs for each firm, especially if we assume that manytechnologies will be developed. From the business literature, many examples of very cheap andvery expensive R&D projects can be found. Scherer and Ross (1990) conclude that it is usefulto think about R&D project costs in terms of a frequency distribution. In reality, this distributioncould turn out to be highly skewed but we will start working with a normal distribution like inFigure I.
Figure I - Distribution of innovating costs for the environmental technology industry
In our threshold approach, only when the discounted profits from the innovation exceed the costsof innovation, firms are prepared to invest in environmental R&D. The proportion of firms that
f(CI)
Invest inR&D
DPI
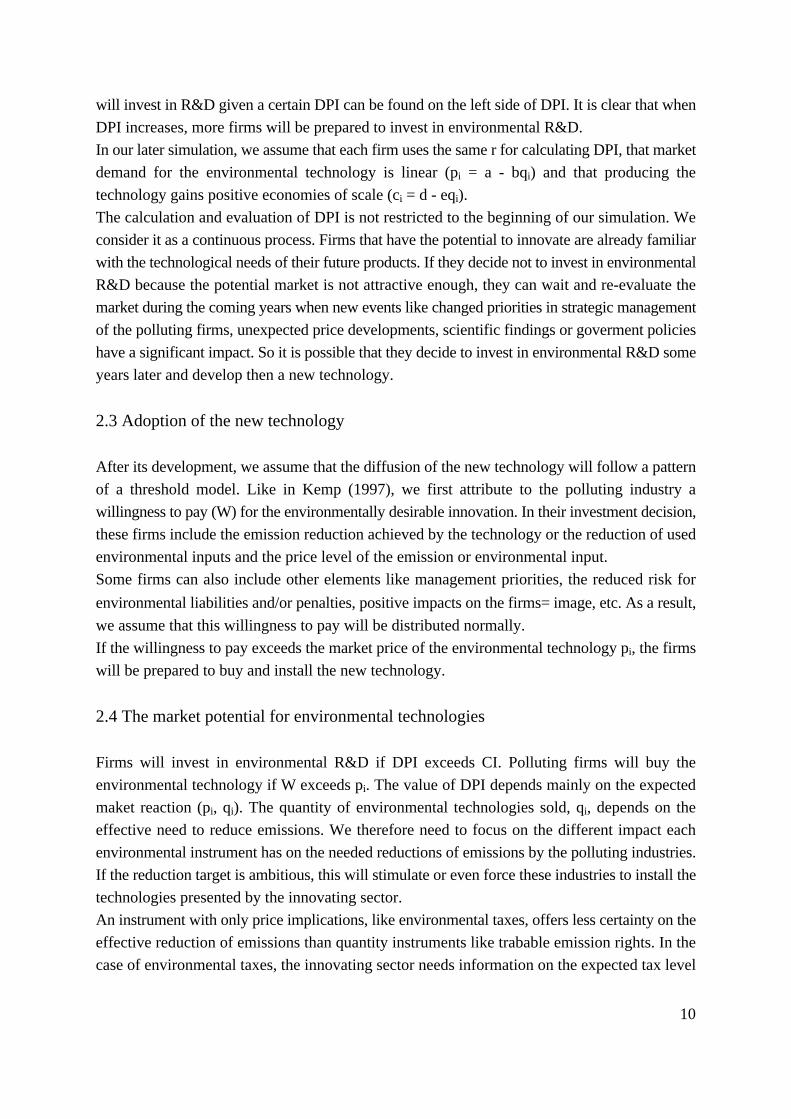
10
will invest in R&D given a certain DPI can be found on the left side of DPI. It is clear that whenDPI increases, more firms will be prepared to invest in environmental R&D.In our later simulation, we assume that each firm uses the same r for calculating DPI, that marketdemand for the environmental technology is linear (pi = a - bqi) and that producing thetechnology gains positive economies of scale (ci = d - eqi).The calculation and evaluation of DPI is not restricted to the beginning of our simulation. Weconsider it as a continuous process. Firms that have the potential to innovate are already familiarwith the technological needs of their future products. If they decide not to invest in environmentalR&D because the potential market is not attractive enough, they can wait and re-evaluate themarket during the coming years when new events like changed priorities in strategic managementof the polluting firms, unexpected price developments, scientific findings or goverment policieshave a significant impact. So it is possible that they decide to invest in environmental R&D someyears later and develop then a new technology.
2.3 Adoption of the new technology
After its development, we assume that the diffusion of the new technology will follow a patternof a threshold model. Like in Kemp (1997), we first attribute to the polluting industry awillingness to pay (W) for the environmentally desirable innovation. In their investment decision,these firms include the emission reduction achieved by the technology or the reduction of usedenvironmental inputs and the price level of the emission or environmental input.Some firms can also include other elements like management priorities, the reduced risk forenvironmental liabilities and/or penalties, positive impacts on the firms= image, etc. As a result,we assume that this willingness to pay will be distributed normally.If the willingness to pay exceeds the market price of the environmental technology pi, the firmswill be prepared to buy and install the new technology.
2.4 The market potential for environmental technologies
Firms will invest in environmental R&D if DPI exceeds CI. Polluting firms will buy theenvironmental technology if W exceeds pi. The value of DPI depends mainly on the expectedmaket reaction (pi, qi). The quantity of environmental technologies sold, qi, depends on theeffective need to reduce emissions. We therefore need to focus on the different impact eachenvironmental instrument has on the needed reductions of emissions by the polluting industries.If the reduction target is ambitious, this will stimulate or even force these industries to install thetechnologies presented by the innovating sector.An instrument with only price implications, like environmental taxes, offers less certainty on theeffective reduction of emissions than quantity instruments like trabable emission rights. In thecase of environmental taxes, the innovating sector needs information on the expected tax level
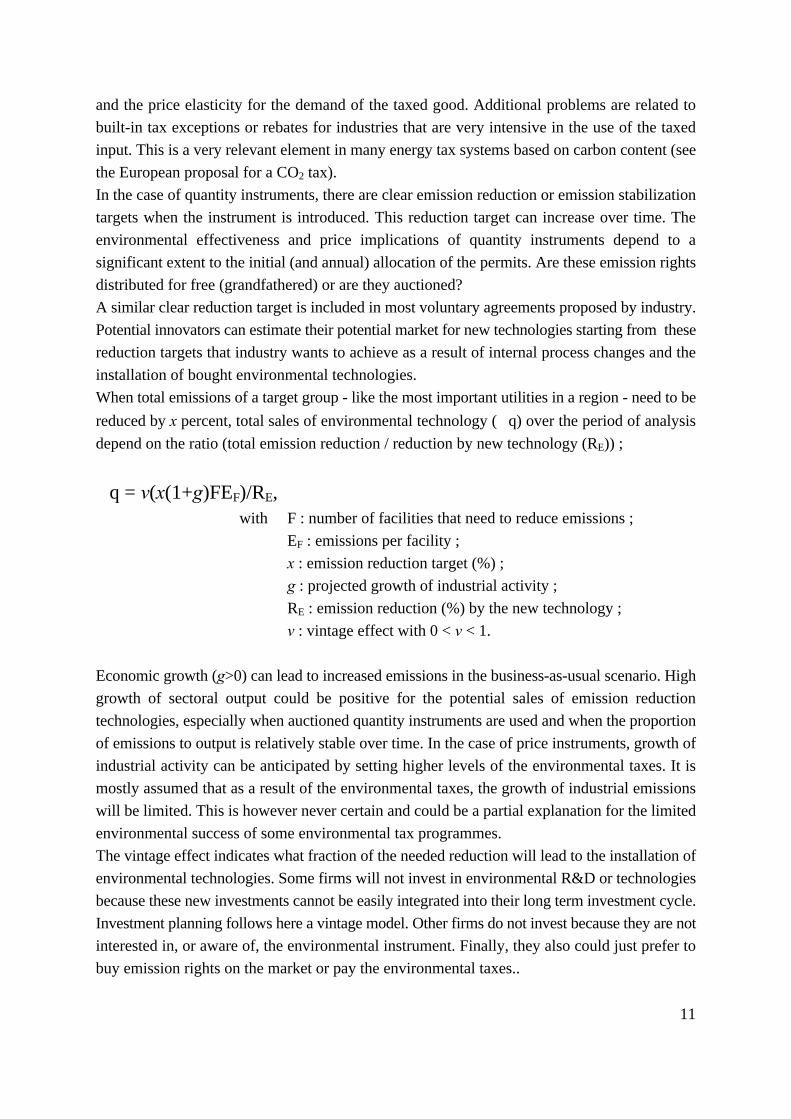
11
and the price elasticity for the demand of the taxed good. Additional problems are related tobuilt-in tax exceptions or rebates for industries that are very intensive in the use of the taxedinput. This is a very relevant element in many energy tax systems based on carbon content (seethe European proposal for a CO2 tax).In the case of quantity instruments, there are clear emission reduction or emission stabilizationtargets when the instrument is introduced. This reduction target can increase over time. Theenvironmental effectiveness and price implications of quantity instruments depend to asignificant extent to the initial (and annual) allocation of the permits. Are these emission rightsdistributed for free (grandfathered) or are they auctioned?A similar clear reduction target is included in most voluntary agreements proposed by industry.Potential innovators can estimate their potential market for new technologies starting from thesereduction targets that industry wants to achieve as a result of internal process changes and theinstallation of bought environmental technologies.When total emissions of a target group - like the most important utilities in a region - need to bereduced by x percent, total sales of environmental technology (∋ q) over the period of analysisdepend on the ratio (total emission reduction / reduction by new technology (RE)) ;
∋ q = v(x(1+g)FEF)/RE, with F : number of facilities that need to reduce emissions ;
EF : emissions per facility ;x : emission reduction target (%) ;g : projected growth of industrial activity ;RE : emission reduction (%) by the new technology ;v : vintage effect with 0 < v < 1.
Economic growth (g>0) can lead to increased emissions in the business-as-usual scenario. Highgrowth of sectoral output could be positive for the potential sales of emission reductiontechnologies, especially when auctioned quantity instruments are used and when the proportionof emissions to output is relatively stable over time. In the case of price instruments, growth ofindustrial activity can be anticipated by setting higher levels of the environmental taxes. It ismostly assumed that as a result of the environmental taxes, the growth of industrial emissionswill be limited. This is however never certain and could be a partial explanation for the limitedenvironmental success of some environmental tax programmes.The vintage effect indicates what fraction of the needed reduction will lead to the installation ofenvironmental technologies. Some firms will not invest in environmental R&D or technologiesbecause these new investments cannot be easily integrated into their long term investment cycle.Investment planning follows here a vintage model. Other firms do not invest because they are notinterested in, or aware of, the environmental instrument. Finally, they also could just prefer tobuy emission rights on the market or pay the environmental taxes..
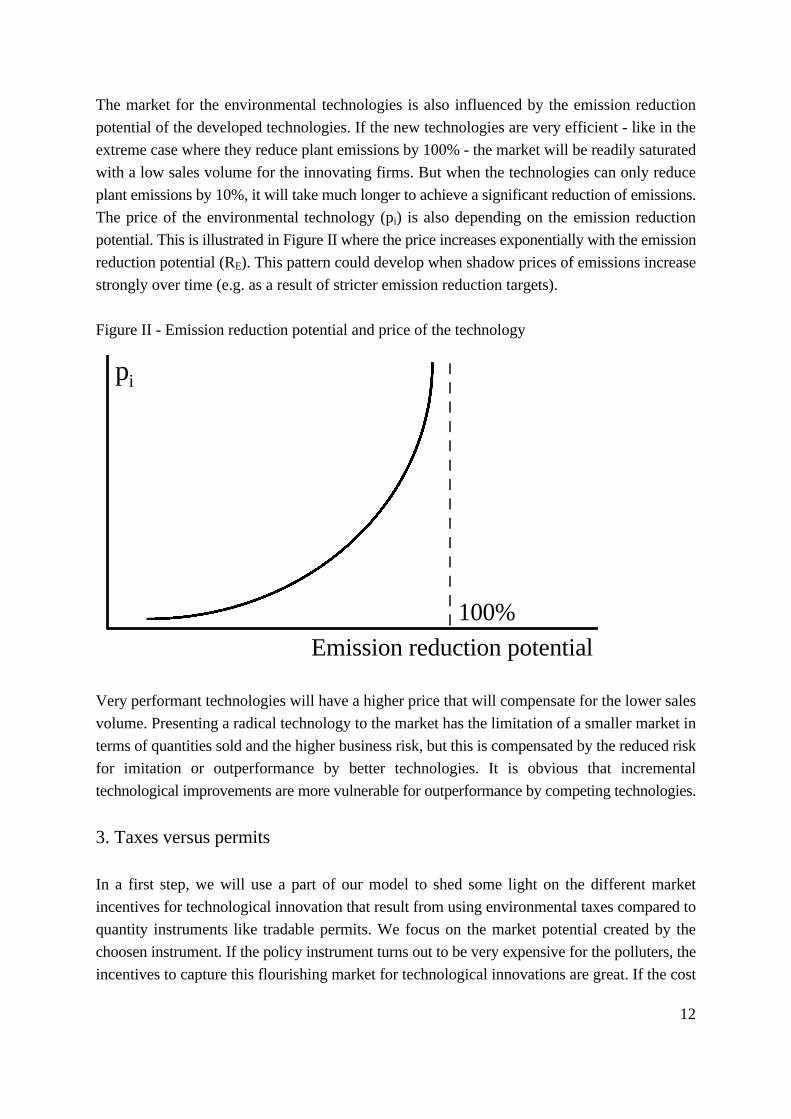
12
The market for the environmental technologies is also influenced by the emission reductionpotential of the developed technologies. If the new technologies are very efficient - like in theextreme case where they reduce plant emissions by 100% - the market will be readily saturatedwith a low sales volume for the innovating firms. But when the technologies can only reduceplant emissions by 10%, it will take much longer to achieve a significant reduction of emissions.The price of the environmental technology (pi) is also depending on the emission reductionpotential. This is illustrated in Figure II where the price increases exponentially with the emissionreduction potential (RE). This pattern could develop when shadow prices of emissions increasestrongly over time (e.g. as a result of stricter emission reduction targets).
Figure II - Emission reduction potential and price of the technology
Very performant technologies will have a higher price that will compensate for the lower salesvolume. Presenting a radical technology to the market has the limitation of a smaller market interms of quantities sold and the higher business risk, but this is compensated by the reduced riskfor imitation or outperformance by better technologies. It is obvious that incrementaltechnological improvements are more vulnerable for outperformance by competing technologies.
3. Taxes versus permits
In a first step, we will use a part of our model to shed some light on the different marketincentives for technological innovation that result from using environmental taxes compared toquantity instruments like tradable permits. We focus on the market potential created by thechoosen instrument. If the policy instrument turns out to be very expensive for the polluters, theincentives to capture this flourishing market for technological innovations are great. If the cost
pi
100%Emission reduction potential
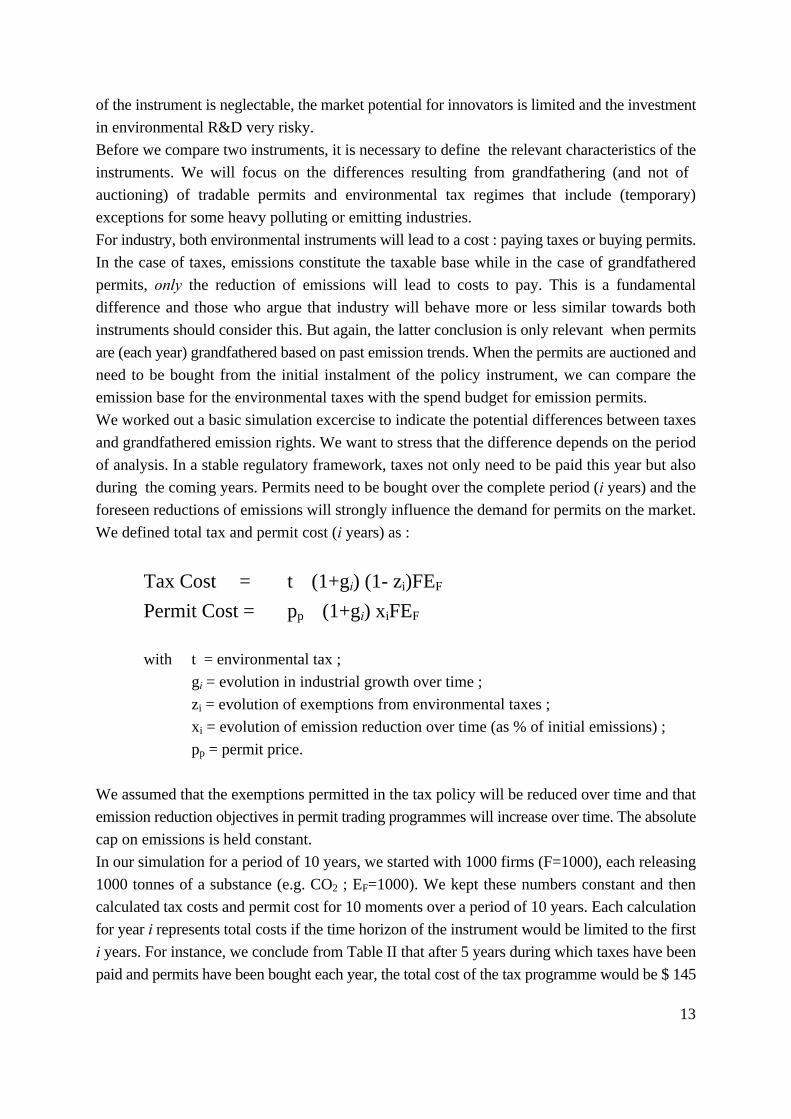
13
of the instrument is neglectable, the market potential for innovators is limited and the investmentin environmental R&D very risky.Before we compare two instruments, it is necessary to define the relevant characteristics of theinstruments. We will focus on the differences resulting from grandfathering (and not of auctioning) of tradable permits and environmental tax regimes that include (temporary)exceptions for some heavy polluting or emitting industries. For industry, both environmental instruments will lead to a cost : paying taxes or buying permits.In the case of taxes, emissions constitute the taxable base while in the case of grandfatheredpermits, only the reduction of emissions will lead to costs to pay. This is a fundamentaldifference and those who argue that industry will behave more or less similar towards bothinstruments should consider this. But again, the latter conclusion is only relevant when permitsare (each year) grandfathered based on past emission trends. When the permits are auctioned andneed to be bought from the initial instalment of the policy instrument, we can compare theemission base for the environmental taxes with the spend budget for emission permits.We worked out a basic simulation excercise to indicate the potential differences between taxesand grandfathered emission rights. We want to stress that the difference depends on the periodof analysis. In a stable regulatory framework, taxes not only need to be paid this year but alsoduring the coming years. Permits need to be bought over the complete period (i years) and theforeseen reductions of emissions will strongly influence the demand for permits on the market.We defined total tax and permit cost (i years) as :
Tax Cost = t ∋ (1+gi) (1- zi)FEF
Permit Cost = pp ∋ (1+gi) xiFEF
with t = environmental tax ;gi = evolution in industrial growth over time ;zi = evolution of exemptions from environmental taxes ;xi = evolution of emission reduction over time (as % of initial emissions) ;pp = permit price.
We assumed that the exemptions permitted in the tax policy will be reduced over time and thatemission reduction objectives in permit trading programmes will increase over time. The absolutecap on emissions is held constant.In our simulation for a period of 10 years, we started with 1000 firms (F=1000), each releasing1000 tonnes of a substance (e.g. CO2 ; EF=1000). We kept these numbers constant and thencalculated tax costs and permit cost for 10 moments over a period of 10 years. Each calculationfor year i represents total costs if the time horizon of the instrument would be limited to the firsti years. For instance, we conclude from Table II that after 5 years during which taxes have beenpaid and permits have been bought each year, the total cost of the tax programme would be $ 145
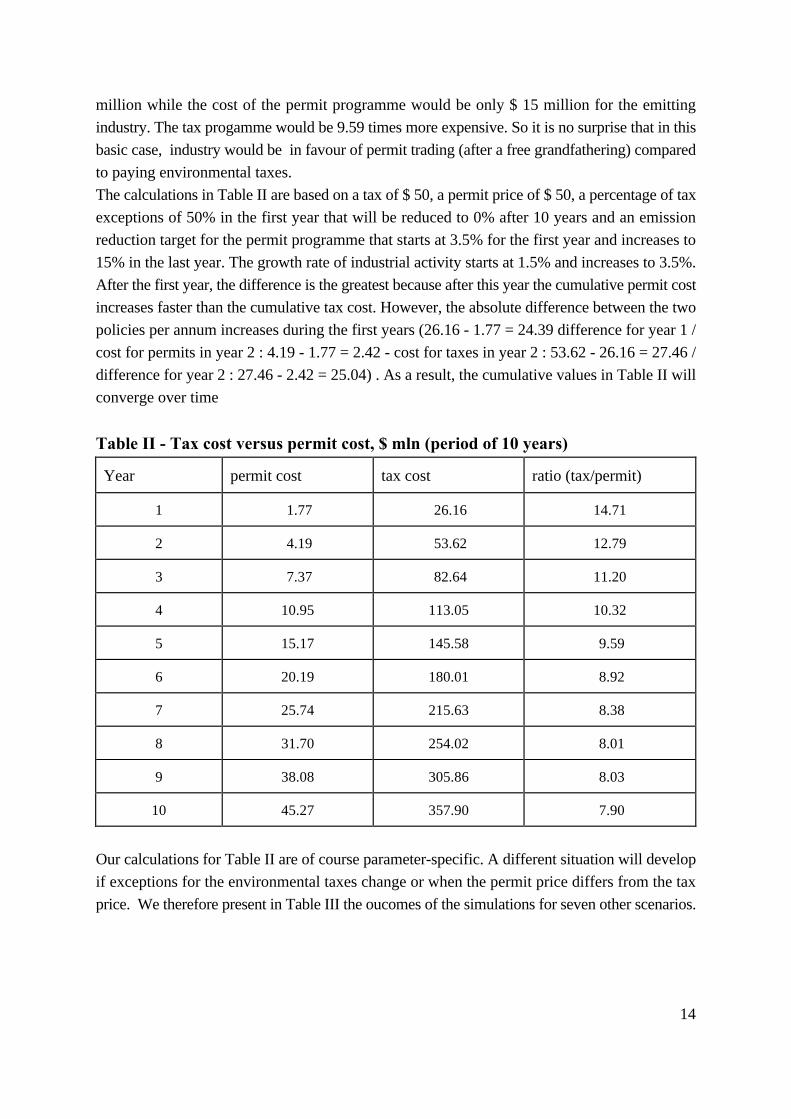
14
million while the cost of the permit programme would be only $ 15 million for the emittingindustry. The tax progamme would be 9.59 times more expensive. So it is no surprise that in thisbasic case, industry would be in favour of permit trading (after a free grandfathering) comparedto paying environmental taxes.The calculations in Table II are based on a tax of $ 50, a permit price of $ 50, a percentage of taxexceptions of 50% in the first year that will be reduced to 0% after 10 years and an emissionreduction target for the permit programme that starts at 3.5% for the first year and increases to15% in the last year. The growth rate of industrial activity starts at 1.5% and increases to 3.5%.After the first year, the difference is the greatest because after this year the cumulative permit costincreases faster than the cumulative tax cost. However, the absolute difference between the twopolicies per annum increases during the first years (26.16 - 1.77 = 24.39 difference for year 1 /cost for permits in year 2 : 4.19 - 1.77 = 2.42 - cost for taxes in year 2 : 53.62 - 26.16 = 27.46 /difference for year 2 : 27.46 - 2.42 = 25.04) . As a result, the cumulative values in Table II willconverge over time
Table II - Tax cost versus permit cost, $ mln (period of 10 years)
Year permit cost tax cost ratio (tax/permit)
1 1.77 26.16 14.71
2 4.19 53.62 12.79
3 7.37 82.64 11.20
4 10.95 113.05 10.32
5 15.17 145.58 9.59
6 20.19 180.01 8.92
7 25.74 215.63 8.38
8 31.70 254.02 8.01
9 38.08 305.86 8.03
10 45.27 357.90 7.90
Our calculations for Table II are of course parameter-specific. A different situation will developif exceptions for the environmental taxes change or when the permit price differs from the taxprice. We therefore present in Table III the oucomes of the simulations for seven other scenarios.
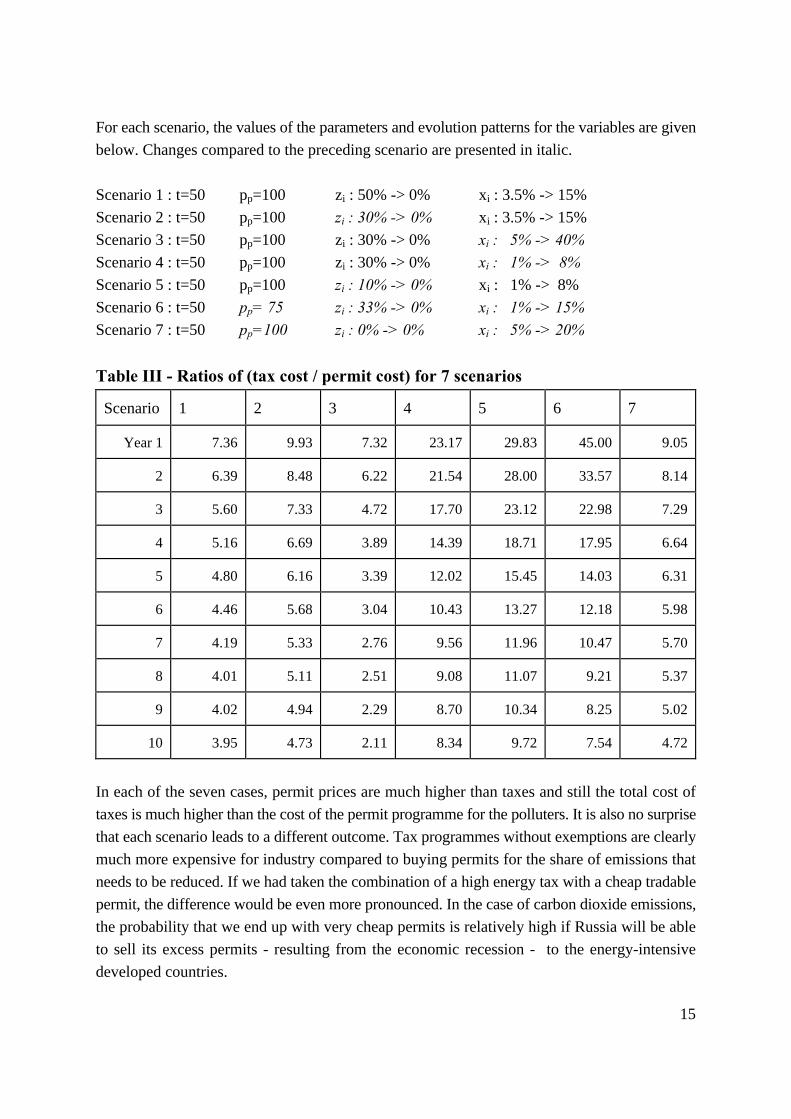
15
For each scenario, the values of the parameters and evolution patterns for the variables are givenbelow. Changes compared to the preceding scenario are presented in italic.
Scenario 1 : t=50 pp=100 zi : 50% -> 0% xi : 3.5% -> 15%Scenario 2 : t=50 pp=100 zi : 30% -> 0% xi : 3.5% -> 15%Scenario 3 : t=50 pp=100 zi : 30% -> 0% xi : 5% -> 40%Scenario 4 : t=50 pp=100 zi : 30% -> 0% xi : 1% -> 8%Scenario 5 : t=50 pp=100 zi : 10% -> 0% xi : 1% -> 8%Scenario 6 : t=50 pp= 75 zi : 33% -> 0% xi : 1% -> 15%Scenario 7 : t=50 pp=100 zi : 0% -> 0% xi : 5% -> 20% Table III - Ratios of (tax cost / permit cost) for 7 scenarios
Scenario 1 2 3 4 5 6 7
Year 1 7.36 9.93 7.32 23.17 29.83 45.00 9.05
2 6.39 8.48 6.22 21.54 28.00 33.57 8.14
3 5.60 7.33 4.72 17.70 23.12 22.98 7.29
4 5.16 6.69 3.89 14.39 18.71 17.95 6.64
5 4.80 6.16 3.39 12.02 15.45 14.03 6.31
6 4.46 5.68 3.04 10.43 13.27 12.18 5.98
7 4.19 5.33 2.76 9.56 11.96 10.47 5.70
8 4.01 5.11 2.51 9.08 11.07 9.21 5.37
9 4.02 4.94 2.29 8.70 10.34 8.25 5.02
10 3.95 4.73 2.11 8.34 9.72 7.54 4.72
In each of the seven cases, permit prices are much higher than taxes and still the total cost oftaxes is much higher than the cost of the permit programme for the polluters. It is also no surprisethat each scenario leads to a different outcome. Tax programmes without exemptions are clearlymuch more expensive for industry compared to buying permits for the share of emissions thatneeds to be reduced. If we had taken the combination of a high energy tax with a cheap tradablepermit, the difference would be even more pronounced. In the case of carbon dioxide emissions,the probability that we end up with very cheap permits is relatively high if Russia will be ableto sell its excess permits - resulting from the economic recession - to the energy-intensivedeveloped countries.
16
As a result, the different costs for industry resulting from both instruments clearly creates abigger market for environmental technologies in the case of environmental taxes. Only when thepermit price and the emission reduction objective are high (like in scenario 3), the total costs aresomehow comparable.In this basic simulation, we did not include many other important aspects like the performanceof the technological innovation (in terms of reduced emissions), the price of the technology, scaleeconomies in the production of new environmental technologies, etc.We will integrate these elements in the next sections.
4. The general model
For a period of 15 years, we analyse the incentive to invest in environmental R&D by makinguse of the assumptions used to define DPI and total sales of the new environmental technology(Σq). For the first model runs in the base-line situation without an environmental policyinstrument implemented, there is only a reduction target for emissions that the innovating sectorsassumes to become the effective target in later policy frameworks. So there are no environmentalpolicy instruments used at this moment and we focus on the proportion of potential innovatorsthat will each year effectively invest in environmental R&D as it was presented in Figure I. Wewill work out a graphical presentation for the total period of analysis. Therefore we need tointroduce CI, the cost of the technological innovation. We assume that CI consists of a fixed cost,set at $ 1 million in our model, and a variable part since each product sold on the market willresult in some feedback from clients that demand for adaptations of the technology to theirspecific demands.We then define a new variable, R&D Incentive = (DPI - CI)/CI, to qualify the difference betweenDPI and CI over time like used in Figure I.We present our findings making use of the following settings : p=20000 - 0.03q ; c=15000 -0.03q; RE = 0.2 + 2q/1000000 ; an industrial growth rate starting at 1.5% and increasing by 10%(0.10 * 1.5%) each year; ρ1=0.33 ; ρ2 =0.33 ; v = 0.75.The reduction of the emissions is linked to the technological performance of the new technology- in terms of emission reduction - what results in a sales estimate for the new technology. Themanufacturers then set initial prices and production costs that should both decline over time.Only when the profits from future sales outweight the costs of the technological innovation bya certain factor or baseline, manufacturers will start investing.In Figure III, a sensitivity analysis was made for the variable R&D Incentive when the initialreduction target - used by the innovating industries in their investment decision - ranges from 5%to 25% with an increase by 10% each year. We notice that the value for R&D Incentive exceeds1 in most cases. Industry is however aware of the many uncertainties surrounding theenvironmental policy process and could therefore work with very short pay-back periods forenvironmental investments or could require that R&D Incentives exceeds factor 5 before starting
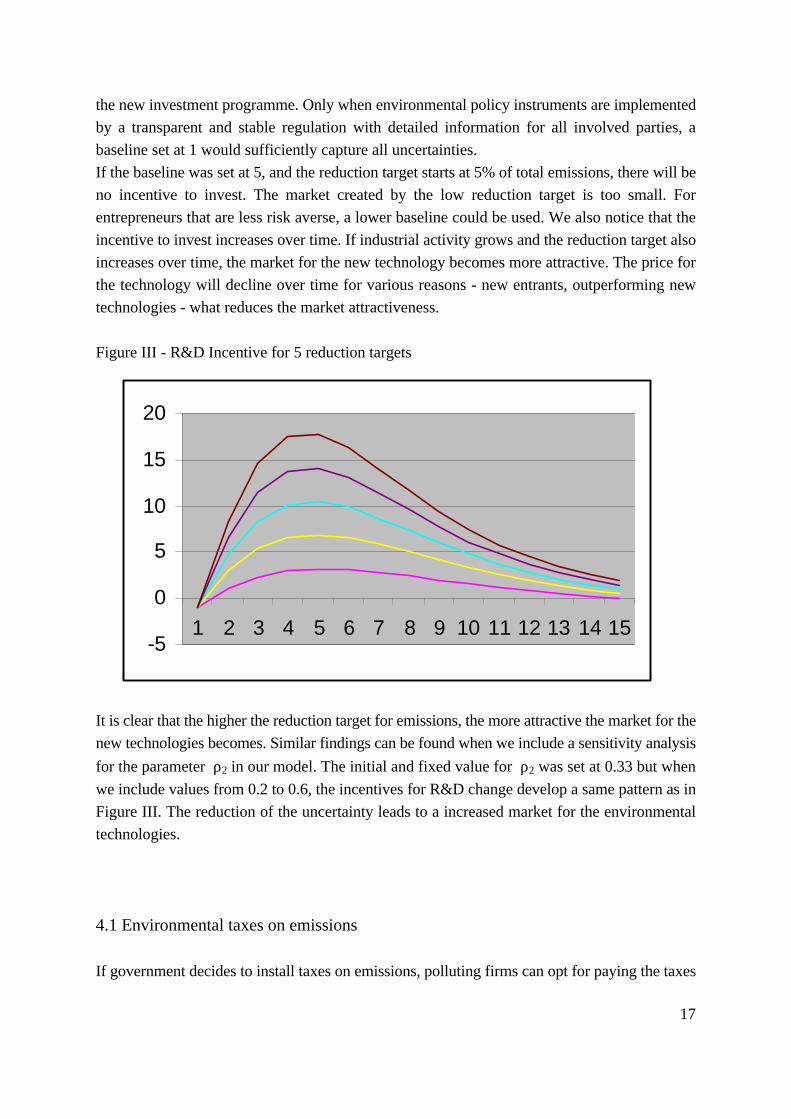
17
the new investment programme. Only when environmental policy instruments are implementedby a transparent and stable regulation with detailed information for all involved parties, abaseline set at 1 would sufficiently capture all uncertainties.If the baseline was set at 5, and the reduction target starts at 5% of total emissions, there will beno incentive to invest. The market created by the low reduction target is too small. Forentrepreneurs that are less risk averse, a lower baseline could be used. We also notice that theincentive to invest increases over time. If industrial activity grows and the reduction target alsoincreases over time, the market for the new technology becomes more attractive. The price forthe technology will decline over time for various reasons - new entrants, outperforming newtechnologies - what reduces the market attractiveness.
Figure III - R&D Incentive for 5 reduction targets
It is clear that the higher the reduction target for emissions, the more attractive the market for thenew technologies becomes. Similar findings can be found when we include a sensitivity analysisfor the parameter ρ2 in our model. The initial and fixed value for ρ2 was set at 0.33 but whenwe include values from 0.2 to 0.6, the incentives for R&D change develop a same pattern as inFigure III. The reduction of the uncertainty leads to a increased market for the environmentaltechnologies.
4.1 Environmental taxes on emissions
If government decides to install taxes on emissions, polluting firms can opt for paying the taxes
-5
0
5
10
15
20
1 2 3 4 5 6 7 8 9 10 11 12 13 14 15
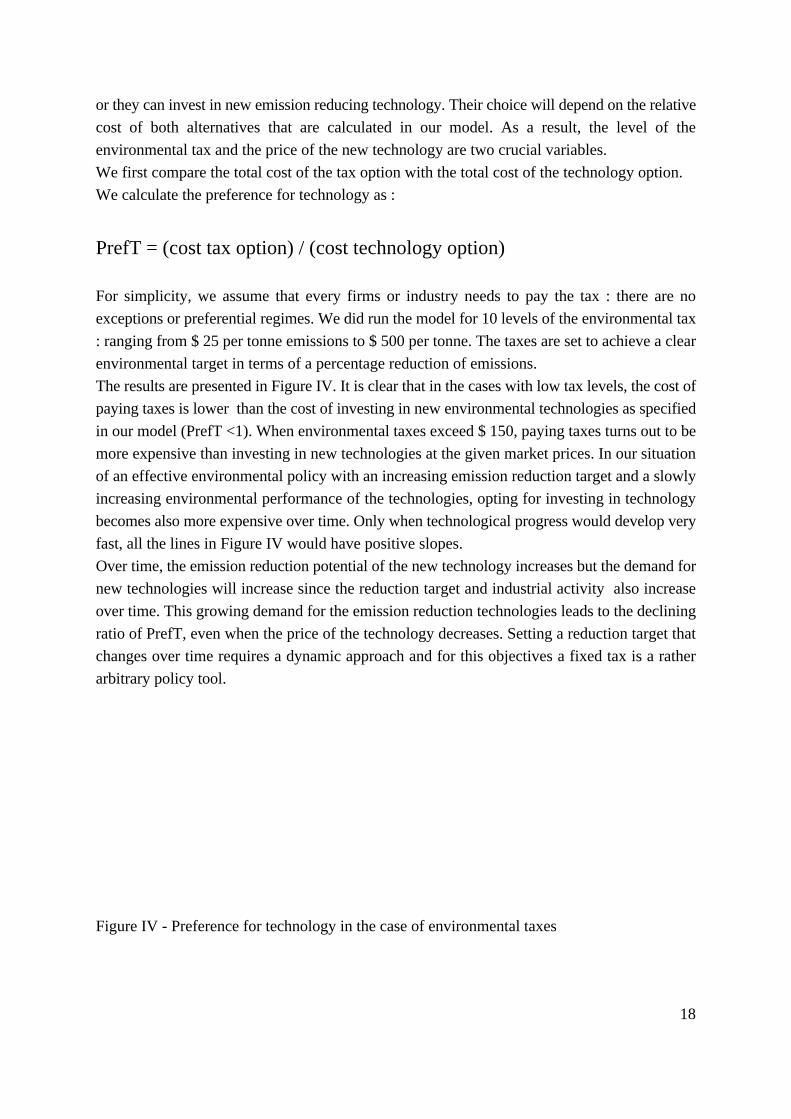
18
or they can invest in new emission reducing technology. Their choice will depend on the relativecost of both alternatives that are calculated in our model. As a result, the level of theenvironmental tax and the price of the new technology are two crucial variables.We first compare the total cost of the tax option with the total cost of the technology option.We calculate the preference for technology as :
PrefT = (cost tax option) / (cost technology option)
For simplicity, we assume that every firms or industry needs to pay the tax : there are noexceptions or preferential regimes. We did run the model for 10 levels of the environmental tax: ranging from $ 25 per tonne emissions to $ 500 per tonne. The taxes are set to achieve a clearenvironmental target in terms of a percentage reduction of emissions.The results are presented in Figure IV. It is clear that in the cases with low tax levels, the cost ofpaying taxes is lower than the cost of investing in new environmental technologies as specifiedin our model (PrefT <1). When environmental taxes exceed $ 150, paying taxes turns out to bemore expensive than investing in new technologies at the given market prices. In our situationof an effective environmental policy with an increasing emission reduction target and a slowlyincreasing environmental performance of the technologies, opting for investing in technologybecomes also more expensive over time. Only when technological progress would develop veryfast, all the lines in Figure IV would have positive slopes.Over time, the emission reduction potential of the new technology increases but the demand fornew technologies will increase since the reduction target and industrial activity also increaseover time. This growing demand for the emission reduction technologies leads to the decliningratio of PrefT, even when the price of the technology decreases. Setting a reduction target thatchanges over time requires a dynamic approach and for this objectives a fixed tax is a ratherarbitrary policy tool.
Figure IV - Preference for technology in the case of environmental taxes
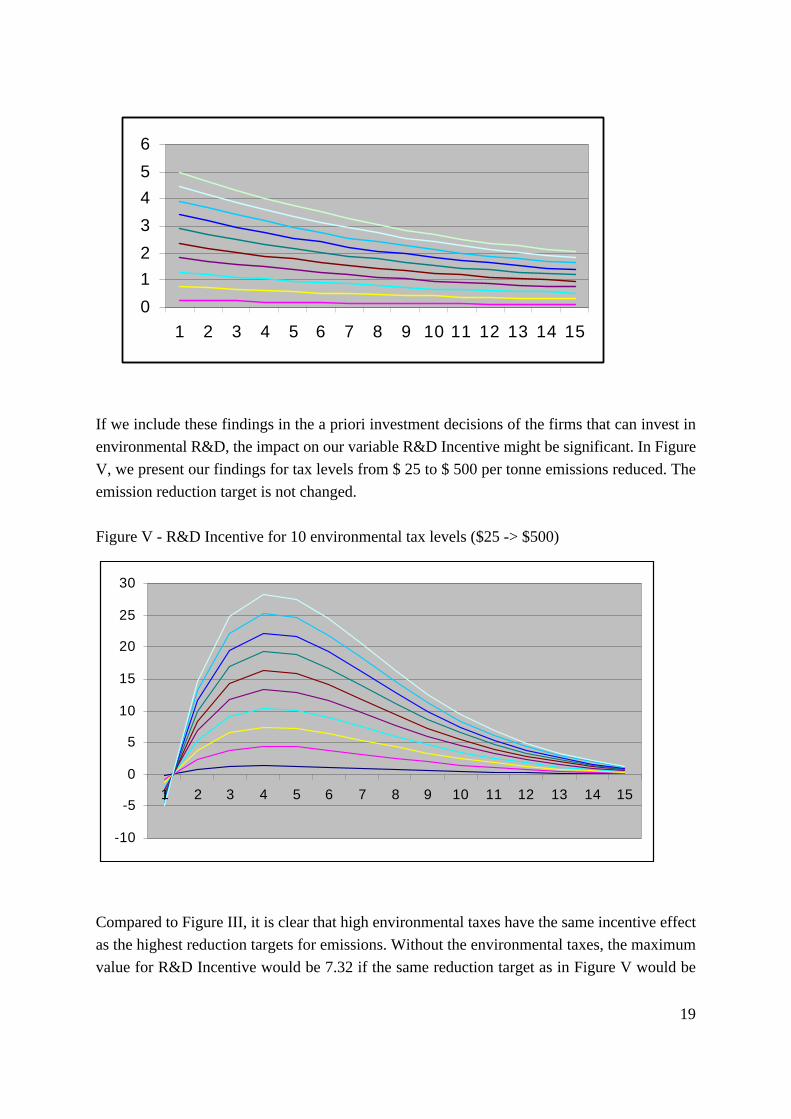
19
If we include these findings in the a priori investment decisions of the firms that can invest inenvironmental R&D, the impact on our variable R&D Incentive might be significant. In FigureV, we present our findings for tax levels from $ 25 to $ 500 per tonne emissions reduced. Theemission reduction target is not changed.
Figure V - R&D Incentive for 10 environmental tax levels ($25 -> $500)
Compared to Figure III, it is clear that high environmental taxes have the same incentive effectas the highest reduction targets for emissions. Without the environmental taxes, the maximumvalue for R&D Incentive would be 7.32 if the same reduction target as in Figure V would be
0123456
1 2 3 4 5 6 7 8 9 10 11 12 13 14 15
-10
-5
0
5
10
15
20
25
30
1 2 3 4 5 6 7 8 9 10 11 12 13 14 15
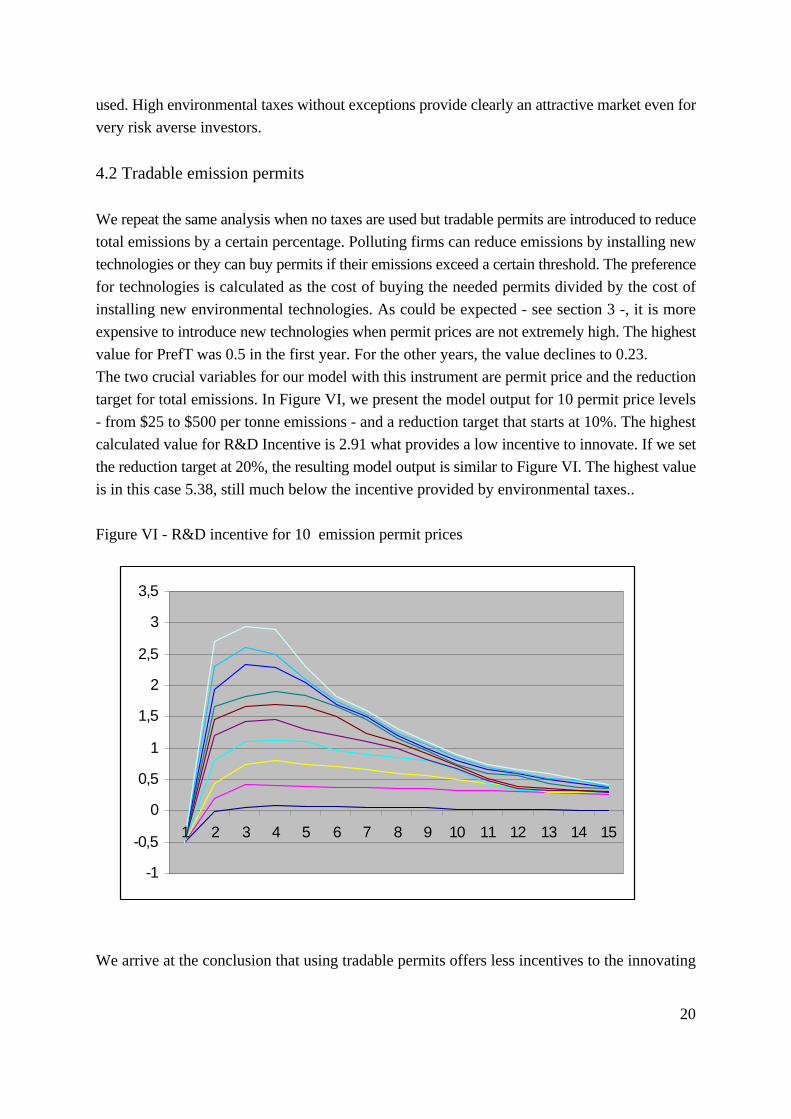
20
used. High environmental taxes without exceptions provide clearly an attractive market even forvery risk averse investors.
4.2 Tradable emission permits
We repeat the same analysis when no taxes are used but tradable permits are introduced to reducetotal emissions by a certain percentage. Polluting firms can reduce emissions by installing newtechnologies or they can buy permits if their emissions exceed a certain threshold. The preferencefor technologies is calculated as the cost of buying the needed permits divided by the cost ofinstalling new environmental technologies. As could be expected - see section 3 -, it is moreexpensive to introduce new technologies when permit prices are not extremely high. The highestvalue for PrefT was 0.5 in the first year. For the other years, the value declines to 0.23.The two crucial variables for our model with this instrument are permit price and the reductiontarget for total emissions. In Figure VI, we present the model output for 10 permit price levels- from $25 to $500 per tonne emissions - and a reduction target that starts at 10%. The highestcalculated value for R&D Incentive is 2.91 what provides a low incentive to innovate. If we setthe reduction target at 20%, the resulting model output is similar to Figure VI. The highest valueis in this case 5.38, still much below the incentive provided by environmental taxes..
Figure VI - R&D incentive for 10 emission permit prices
We arrive at the conclusion that using tradable permits offers less incentives to the innovating
-1
-0,5
0
0,5
1
1,5
2
2,5
3
3,5
1 2 3 4 5 6 7 8 9 10 11 12 13 14 15
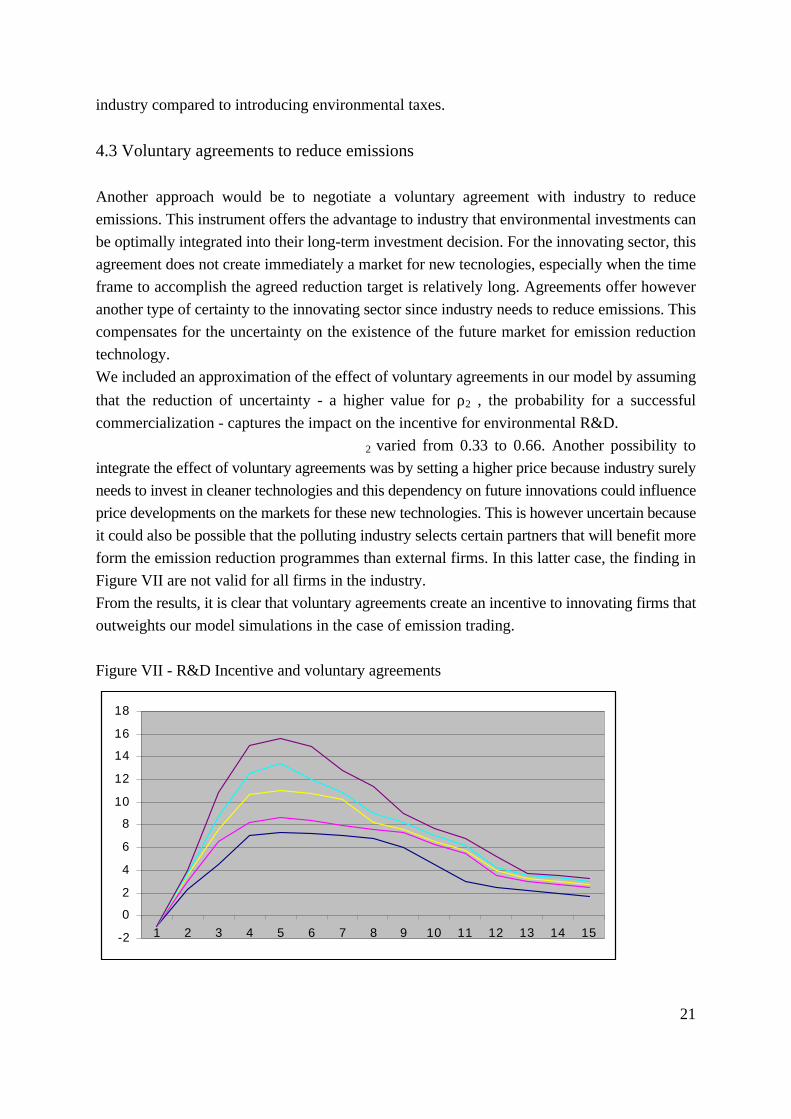
21
industry compared to introducing environmental taxes.
4.3 Voluntary agreements to reduce emissions
Another approach would be to negotiate a voluntary agreement with industry to reduceemissions. This instrument offers the advantage to industry that environmental investments canbe optimally integrated into their long-term investment decision. For the innovating sector, thisagreement does not create immediately a market for new tecnologies, especially when the timeframe to accomplish the agreed reduction target is relatively long. Agreements offer howeveranother type of certainty to the innovating sector since industry needs to reduce emissions. Thiscompensates for the uncertainty on the existence of the future market for emission reductiontechnology.We included an approximation of the effect of voluntary agreements in our model by assumingthat the reduction of uncertainty - a higher value for ρ2 , the probability for a successfulcommercialization - captures the impact on the incentive for environmental R&D.
2 varied from 0.33 to 0.66. Another possibility tointegrate the effect of voluntary agreements was by setting a higher price because industry surelyneeds to invest in cleaner technologies and this dependency on future innovations could influenceprice developments on the markets for these new technologies. This is however uncertain becauseit could also be possible that the polluting industry selects certain partners that will benefit moreform the emission reduction programmes than external firms. In this latter case, the finding inFigure VII are not valid for all firms in the industry.From the results, it is clear that voluntary agreements create an incentive to innovating firms thatoutweights our model simulations in the case of emission trading.
Figure VII - R&D Incentive and voluntary agreements
-2
0
2
4
6
8
10
12
14
16
18
1 2 3 4 5 6 7 8 9 10 11 12 13 14 15
22
4.4 Subsidies for technological R&D
Government could also opt for subsidizing R&D of environmental technologies. In principle, thispolicy would provide a very strong incentive for the firms that will receive these subsidies. If newentrants to the R&D market have no access to this funding, the subsidy could create a barrier.We wanted to introduce the subsidy option in our model and therefore assumed that every firmwill receive the subsidy - or at least projects to receive this funding for the investment decision-and that each firm receive the same amount. As a result, the subsidy reduces CI (the cost of theenvironmental R&D). Since the incentive to invest depends on the difference between DPI andCI, it is obvious that subsidies are important for the investment decision of innovating firms.
We introduced five levels of the subsidy; from no subsidies to a subsidy of $500000, each stepincreasing by $100000.We found that the value for R&D Incentive increased to 14.01 in the case of the highest subsidy.When the subsidy was $400000, R&D Incentive amounted to 11.08 and with a subsidy of$100000 the calculated value was 8.5. Compared to our findings in the case of emission trading,subsidizing environmental R&D has a more interesting impact on the incentive to invest in newtechnologies.
5. Conclusions
Environmental policy instruments have an impact on the incentives to invest in environmentalR&D and this link should deserve careful consideration when introducing new instruments.Some authors argue that evironmental taxes and tradable permits have rather comparable impactson environmental R&D but we think that only very specific conditions do lead to this kind ofconclusions. If we broaden the perspective by integrating elements from the IndustrialOrganisation literature and depart for Pigouvian settings, a market-driven approach would linkthe incentive to invest in new technologies to the market potential offered by the policyinstruments. If taxes turn out to be very expensive for the polluting or emitting industries, we canassume that these targeted firms would be more interested to invest in new - emission reducing- technologies than in cases where the choosen policy instrument will lead to a very limited cost.We therefore developed a model that enables to compare the incentives on environmental R&Dresulting from taxes, emission trading, voluntary approaches and subsidizing environmentalR&D. We do not claim to capture all relevant market interactions, but our findings confirm theintuition that environmental taxes have a clearly different impact on environmental R&Dcompared to emission trading. The market - in terms of potentially avoidable costs -created byenvironmental taxes is always more important than the market resulting from a system of tradablepermits that only captures emission reductions. This finding holds even when environmentaltaxes are low and permit prices much higher. Only when permits would be auctioned from the
23
beginning of the programme, the impact on the incentive for environmental R&D would becomparable. We also found indications that other instruments like voluntary agreements andsubsidies for technological R&D have a more interesting impact on the incentive for R&Dcompared to emission trading. In our model we could integrate and compare these fourinstruments since we included the cost of innovation and various parameters for uncertainty.Our final conclusion is that environmental taxes, without important exceptions or escape clauses,offer the most clear incentives for the needed technological innovations.
24
References
Biglaiser, G. and Horrowitz, J.K. (1995). Pollution regulation and incentives for pollution-control research. Journalof Economics and Management Strategy 3, pp.663-684
Hartman, R. S., Wheeler, D. and Singh, M. (1994). The cost of air pollution abatement. World Bank Policy ResearchWorking Paper # 1398.
Huber, J. (1998). Sustainable development as a concept of ecological modernization - Towards industrial ecology.Paper presented at the International Workshop on Ecological Modernization at the University of Helsinki, 10-13September, 1998
Kemp, R.(1997). Environmental policy and technical change. A comparison of the technological impact of policyinstruments (Edward Elgar, Cheltenham)
Magat, A. W. (1979). The effects of environmental regulation on innovation. Law and Contemporary Problems43(1), pp.4-25
Milliman, R. S. and Prince, R. (1989). Firm incentives to promote technological change in pollution control. Journalof Environmental Economics and Managment 17, pp.245-265
OECD (1997). Environmental policies and innovation : analytical framework. ENV/EPOC/GEEI(97)12
Palmer, K., Oates, W. E. and Portney, P. R. (1995). Tightening environmental standards : the benefit-cost or the no-cost paradigm? Journal of Economic Perspectives 9(4), pp.119-132
Parry, I. W. H. (1995). Optimal pollution taxes and endogenous progress. Resource and Energy Economics 15, pp.99-149
Parry, I. W. H. (1996). The choice between emissions taxes and tradable permits when technological innovation isendogenous. Resources for the Future, Discussion Paper 96-31
Pizer, W. A. (1997). Optimal choice of policy instrument and stringency under uncertainty : the case of climatechange. Resources for the Future (paper, version of March 3, 1997)
Scherer, F. M. and Ross, D. (1990). Industrial market structure and economic performance (Houghton MifflinCompany, Boston)
Stavins, R. N. (1996). Correlated uncertainty and policy instrument choice. Journal of Environmental Economicsand Management 30(2), pp. 218-232
Weitzman, M. L. (1974). Prices vs. quantities. Review of Economic Studies 41(4), pp.477-491
1
Environmental policy and new technologies : to create or to scrap?
Johan Albrecht, Ghent UniversityCEEM, Hoveniersberg 24, 9000 Gent, België[email protected]
Abstract :Policy instruments like environmental taxes on emissions can influence the innovation process and lead to moreefficient abatement technologies. However, by scrapping parts of the old capital stock entrepreneurs can alsolower emissions without investing in environmental R&D. In this paper, a capital stock rotation exampleillustrates how the scrapping of old capital can lead to the same impact on emissions as the development of moreenergy efficient technologies. Scrapping has a positive cost and we therefore present a numerical simulation tocompare the impact of scrapping to that of technological innovations. In the simulation, we use the concept oftechnological optimism. We find that the higher this optimism, the lower the environmental tax needs to be tostimulate technological innovations. In a next step, we compare the emission reduction contribution of scrappingto that of innovating. We conclude that the indirect effects of technological innovations – scrappingopportunities – can outweigh the direct effects of lower abatement costs.
Keywords : environmental taxes, technological innovation, capital stock rotation, scrapping
JEL Classification : Q28, O31, H23
1. Introduction
In his last State of the Union Address to Congress, President Clinton repeated that ‘global
warming is the greatest environmental challenge of the new century (Clinton, 2000).’ Since
most economists focus on reducing greenhouse gas (GHG) emissions as the first strategy in
climate policy, new technologies that improve energy efficiency or capture emissions deserve
special attention when economic instruments or regulations are introduced. The incentive to
develop new environmental technologies depends on an attractive buyers’ market that
stimulates the process of entrepreneurial dynamism. Clear and credible environmental
policies or the threat to impose environmental measures in the near future can create these
markets. In this paper, we analyze the link between a policy instrument like environmental
taxes and the incentive for technological innovation. The impact of technological innovations
on the incentive to scrap or eliminate old capital is explicitly considered. We wonder whether
innovating and scrapping policies are complements or substitutes.
2
The analysis in this paper is based on environmental taxes as the policy instrument. Other
instruments can have different impacts on innovations and other investment decisions. In the
literature, many studies on the different effects of environmental policy instruments are based
on the seminal ‘prices versus quantities’ paper by Weitzman (1974). He concluded that taxes
should be prefered to quantity controls when expected marginal benefits were relatively flat.
Weitzman also noted that when shocks to costs and benefits are correlated, this simple
intuition breaks down (Pizer, 1997 ; Stavins, 1996). Biglaiser and Horrowitz (1995) and
Parry (1995, 1996) integrate basic elements of Industrial Organization literature in the
analysis of economic instruments. They present Pigouvian taxes and permit price levels that
equal marginal environmental damage under perfectly competitive conditions with
homogeneous firms.
Parry (1996) concludes that the incentives for environmental Research and Development
(R&D) are empirically similar under the Pigouvian tax and under the Pigouvian quantity of
permits when innovations are minor and there is a well-functioning permit market. But since
each sector or environmental problem has very specific characteristics, the ‘overall effects of
the environmental regulation on R&D tends to be ambiguous (Palmer, Oates and Portney,
1995)’. It is striking that scrapping decisions are not explicitly integrated in this literature. In
the next section we show the role scrapping can play in emission reduction strategies.
Economic instruments can stimulate technological innovations but the short-term impact on
total emissions of even the most successful innovations can turn out to be modest. Since GHG
emissions are closely connected to many aspects of economic activity (production,
consumption, transportation, residential functions,...), it is not realistic to assume that
significant reductions are possible without important capital replacement efforts. The
economic inability to scrap energy-inefficient capital can be a serious restriction for emissions
reduction targets. We therefore illustrate in the next section the importance of capital stock
rotation and possible reductions in total energy use.
2. Capital stock rotation and inertia
In response to the conferences in Rio and Kyoto, many countries took measures to improve
the energy efficiency of the most important economic sectors. Despite these and future
efforts, most analyses show that GHG emissions of developed countries will continue to rise
in business-as-usual scenarios. The ability to depart from these pessimistic scenarios will
3
depend on the diffusion of new technologies that can be stimulated by climate policy
instruments. Behavioral changes are of equal importance. But even with the optimal
instrument mix, it can take a long time before we notice the needed emission reductions.
2.1 A simulation
We illustrate this time gap in the following basic simulation with two capital stocks : the
existing capital stock at the moment of the analysis and the new capital stock that will be
integrated in the economy. In energy-intensive sectors, the capital cycles are generally long.
Cars and motorcycles are replaced after some ten years but industrial engines are used for 20
to 30 years. The cement industry can use the same production facility for 40 years. Houses,
commercial buildings and the transport infrastructure have longer life cycles.
We start in the simulation with an initial capital stock of 100 units. We set the average level of
energy efficiency of the total capital stock equal to 1. Over the period in the simulation (50
years), a significant part of this old capital stock will be scrapped. Each year, one unit of the
100 initial capital units is scrapped and replaced by more energy-efficient capital. We assume
that no retrofitting of existing technologies takes place. After 50 years, the capital stock that
existed at the beginning of our analysis is halved.
We assume in the simulation a fixed capital growth of two new capital units each year. After
50 years, we end up with a capital stock of 150 units (100 - 50*1 + 50*2) or an increase by
50%.
The impact of the shift to new and energy-efficient technologies is modelled in the average
energy efficiency of new capital (AEENC) for each moment in our analysis. In Figure I, we
present five scenarios for this shift to new technologies. We always start with an average
energy efficiency that equals 1.
Scenario A is a very conservative business-as-usual forecast : the average energy efficiency of
new capital would improve by less than 1% per annum for a period of 50 years. Such a period
of technological stagnancy is hard to imagine with promising applications of fuel-cell
technologies just around the corner. The other scenarios are more optimistic. Important
technological breakthroughs will be widely commercialized and have a significant impact on
AEENC. The only remaining uncertainty is the ‘when uncertainty’. It is a certainty that there
will be a moment that every new sold car needs only 3 litres for 100 kilometres. We only do
not know when. In the scenarios B and C, AEENC improves slowly in the first 20 years. After
50 years, AEENC equals 0.5 in scenario B and 0.166 in scenario C.
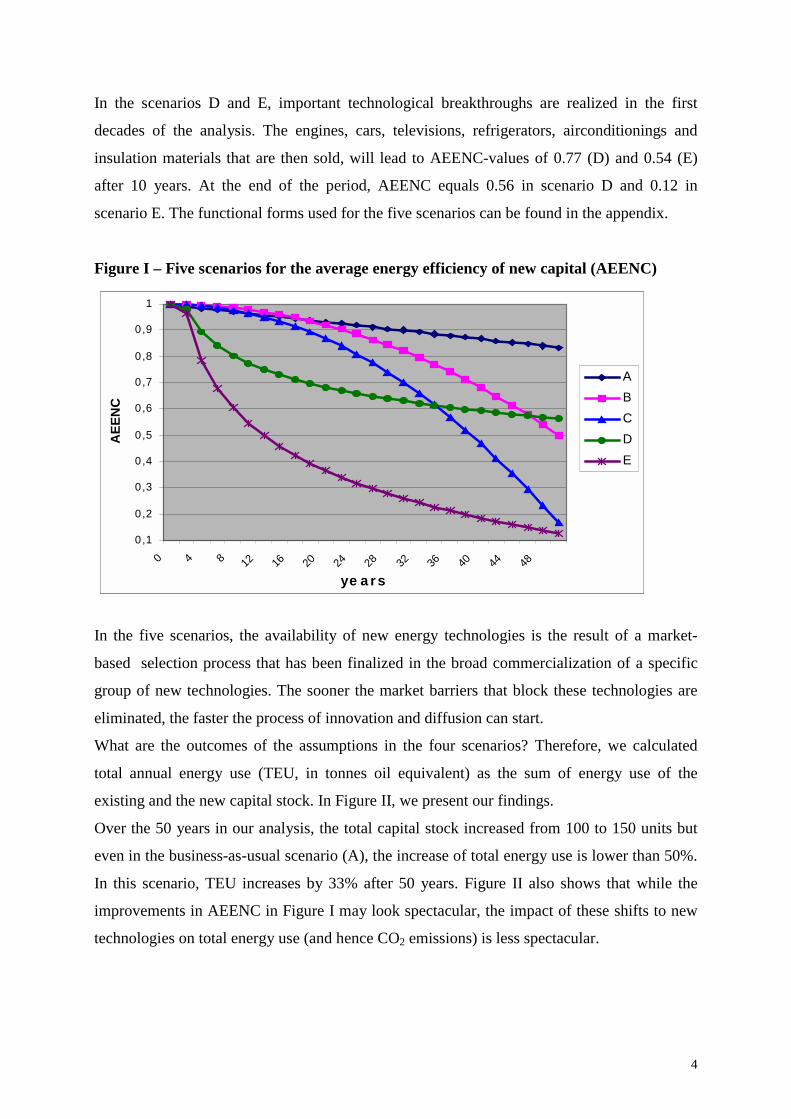
4
In the scenarios D and E, important technological breakthroughs are realized in the first
decades of the analysis. The engines, cars, televisions, refrigerators, airconditionings and
insulation materials that are then sold, will lead to AEENC-values of 0.77 (D) and 0.54 (E)
after 10 years. At the end of the period, AEENC equals 0.56 in scenario D and 0.12 in
scenario E. The functional forms used for the five scenarios can be found in the appendix.
Figure I – Five scenarios for the average energy efficiency of new capital (AEENC)
In the five scenarios, the availability of new energy technologies is the result of a market-
based selection process that has been finalized in the broad commercialization of a specific
group of new technologies. The sooner the market barriers that block these technologies are
eliminated, the faster the process of innovation and diffusion can start.
What are the outcomes of the assumptions in the four scenarios? Therefore, we calculated
total annual energy use (TEU, in tonnes oil equivalent) as the sum of energy use of the
existing and the new capital stock. In Figure II, we present our findings.
Over the 50 years in our analysis, the total capital stock increased from 100 to 150 units but
even in the business-as-usual scenario (A), the increase of total energy use is lower than 50%.
In this scenario, TEU increases by 33% after 50 years. Figure II also shows that while the
improvements in AEENC in Figure I may look spectacular, the impact of these shifts to new
technologies on total energy use (and hence CO2 emissions) is less spectacular.
0,1
0,2
0,3
0,4
0,5
0,6
0,7
0,8
0,9
1
0 4 8 12 16 20 24 28 32 36 40 44 48
ye a rs
AEE
NC
ABCDE
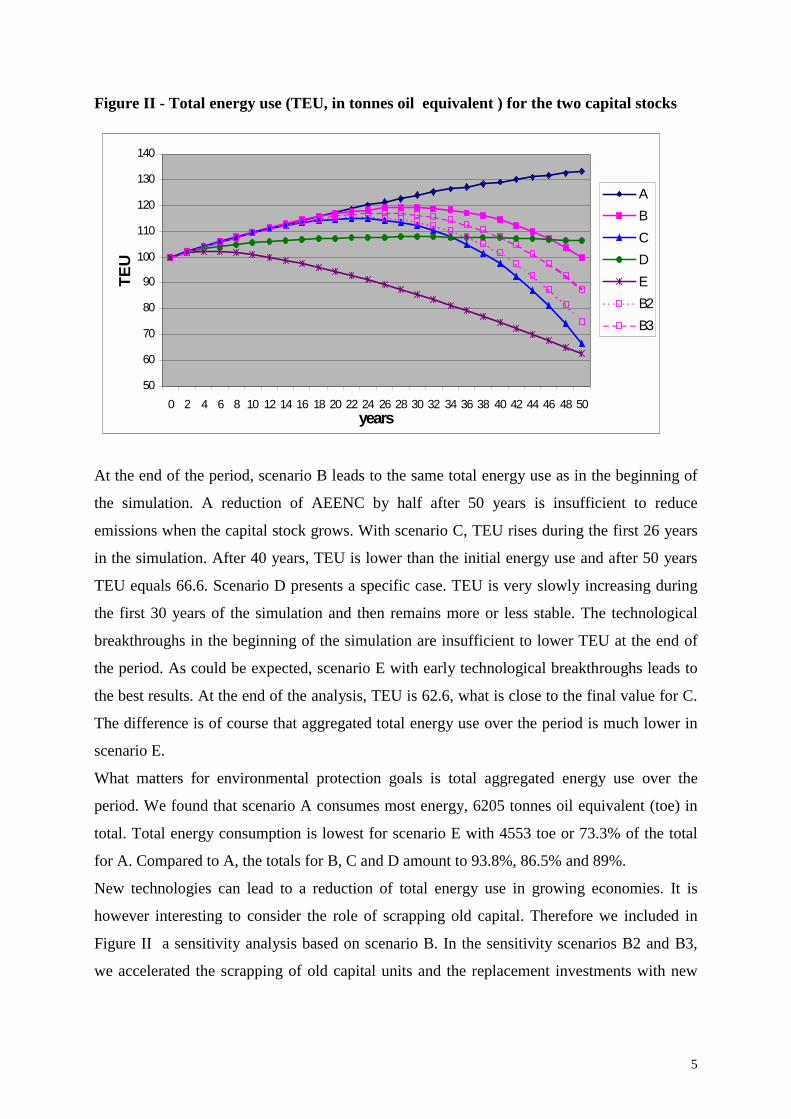
5
Figure II - Total energy use (TEU, in tonnes oil equivalent ) for the two capital stocks
At the end of the period, scenario B leads to the same total energy use as in the beginning of
the simulation. A reduction of AEENC by half after 50 years is insufficient to reduce
emissions when the capital stock grows. With scenario C, TEU rises during the first 26 years
in the simulation. After 40 years, TEU is lower than the initial energy use and after 50 years
TEU equals 66.6. Scenario D presents a specific case. TEU is very slowly increasing during
the first 30 years of the simulation and then remains more or less stable. The technological
breakthroughs in the beginning of the simulation are insufficient to lower TEU at the end of
the period. As could be expected, scenario E with early technological breakthroughs leads to
the best results. At the end of the analysis, TEU is 62.6, what is close to the final value for C.
The difference is of course that aggregated total energy use over the period is much lower in
scenario E.
What matters for environmental protection goals is total aggregated energy use over the
period. We found that scenario A consumes most energy, 6205 tonnes oil equivalent (toe) in
total. Total energy consumption is lowest for scenario E with 4553 toe or 73.3% of the total
for A. Compared to A, the totals for B, C and D amount to 93.8%, 86.5% and 89%.
New technologies can lead to a reduction of total energy use in growing economies. It is
however interesting to consider the role of scrapping old capital. Therefore we included in
Figure II a sensitivity analysis based on scenario B. In the sensitivity scenarios B2 and B3,
we accelerated the scrapping of old capital units and the replacement investments with new
50
60
70
80
90
100
110
120
130
140
0 2 4 6 8 10 12 14 16 18 20 22 24 26 28 30 32 34 36 38 40 42 44 46 48 50years
TEU
ABCDEB2B3
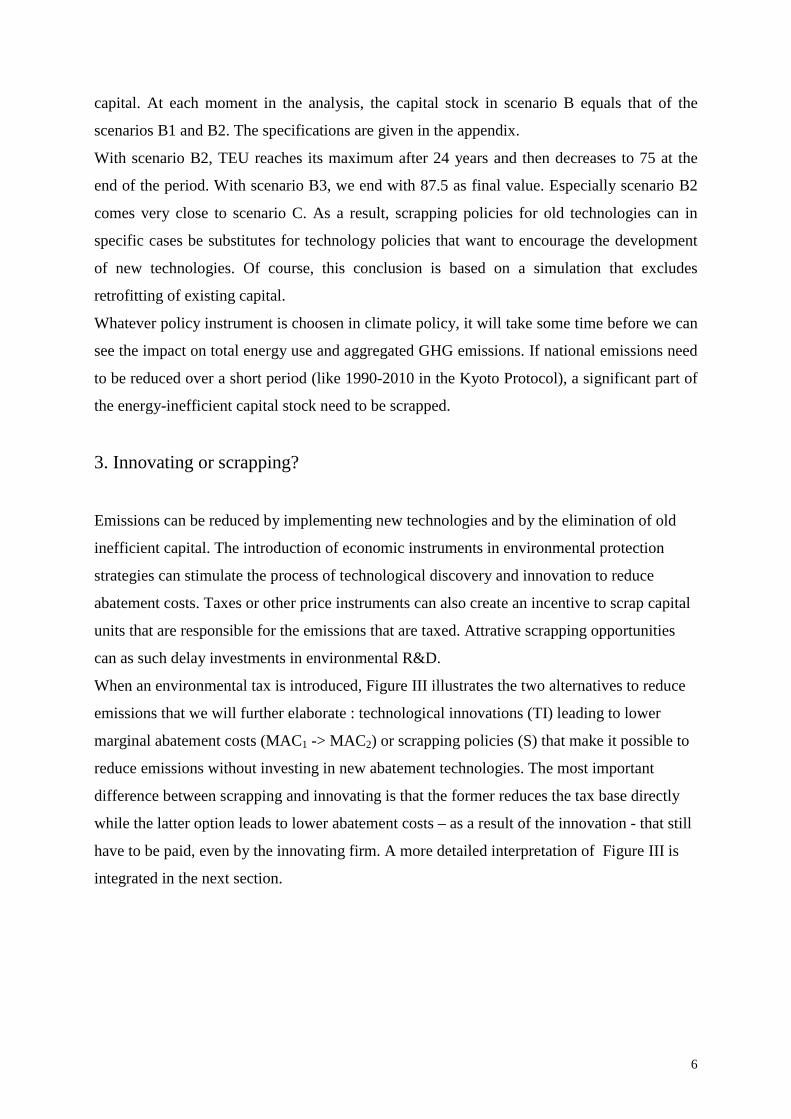
6
capital. At each moment in the analysis, the capital stock in scenario B equals that of the
scenarios B1 and B2. The specifications are given in the appendix.
With scenario B2, TEU reaches its maximum after 24 years and then decreases to 75 at the
end of the period. With scenario B3, we end with 87.5 as final value. Especially scenario B2
comes very close to scenario C. As a result, scrapping policies for old technologies can in
specific cases be substitutes for technology policies that want to encourage the development
of new technologies. Of course, this conclusion is based on a simulation that excludes
retrofitting of existing capital.
Whatever policy instrument is choosen in climate policy, it will take some time before we can
see the impact on total energy use and aggregated GHG emissions. If national emissions need
to be reduced over a short period (like 1990-2010 in the Kyoto Protocol), a significant part of
the energy-inefficient capital stock need to be scrapped.
3. Innovating or scrapping?
Emissions can be reduced by implementing new technologies and by the elimination of old
inefficient capital. The introduction of economic instruments in environmental protection
strategies can stimulate the process of technological discovery and innovation to reduce
abatement costs. Taxes or other price instruments can also create an incentive to scrap capital
units that are responsible for the emissions that are taxed. Attrative scrapping opportunities
can as such delay investments in environmental R&D.
When an environmental tax is introduced, Figure III illustrates the two alternatives to reduce
emissions that we will further elaborate : technological innovations (TI) leading to lower
marginal abatement costs (MAC1 -> MAC2) or scrapping policies (S) that make it possible to
reduce emissions without investing in new abatement technologies. The most important
difference between scrapping and innovating is that the former reduces the tax base directly
while the latter option leads to lower abatement costs – as a result of the innovation - that still
have to be paid, even by the innovating firm. A more detailed interpretation of Figure III is
integrated in the next section.
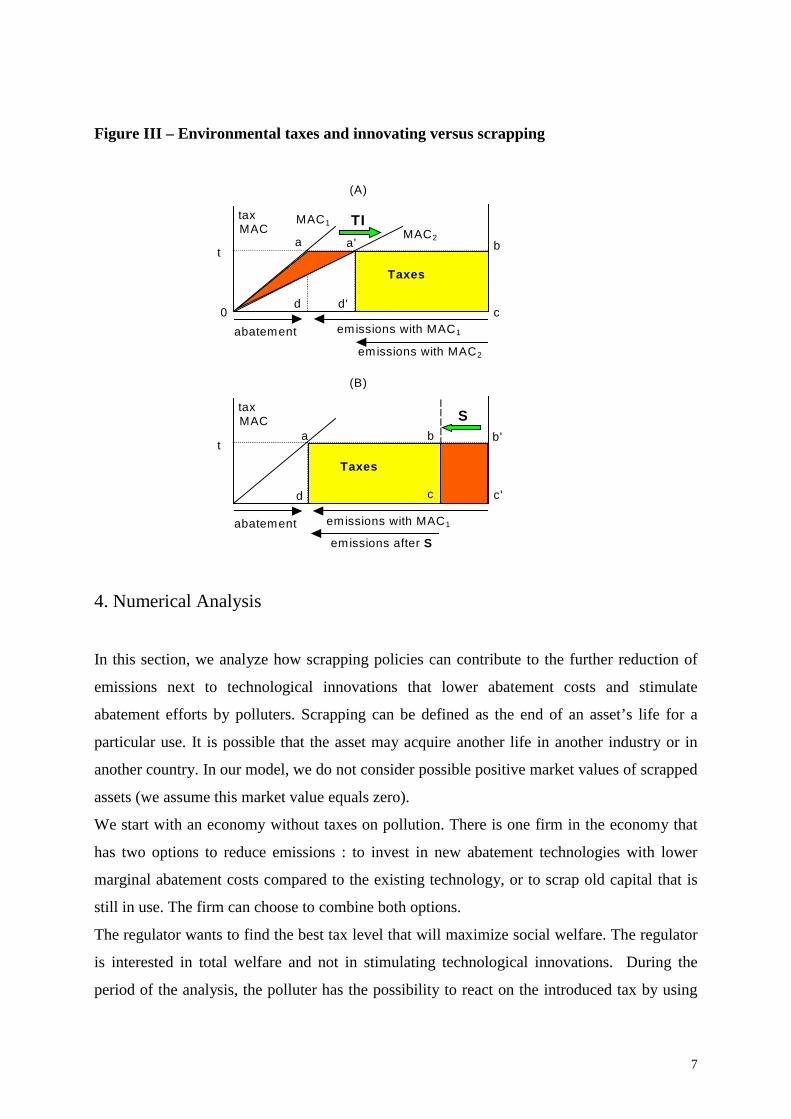
7
Figure III – Environmental taxes and innovating versus scrapping
4. Numerical Analysis
In this section, we analyze how scrapping policies can contribute to the further reduction of
emissions next to technological innovations that lower abatement costs and stimulate
abatement efforts by polluters. Scrapping can be defined as the end of an asset’s life for a
particular use. It is possible that the asset may acquire another life in another industry or in
another country. In our model, we do not consider possible positive market values of scrapped
assets (we assume this market value equals zero).
We start with an economy without taxes on pollution. There is one firm in the economy that
has two options to reduce emissions : to invest in new abatement technologies with lower
marginal abatement costs compared to the existing technology, or to scrap old capital that is
still in use. The firm can choose to combine both options.
The regulator wants to find the best tax level that will maximize social welfare. The regulator
is interested in total welfare and not in stimulating technological innovations. During the
period of the analysis, the polluter has the possibility to react on the introduced tax by using
taxMAC
abatement emissions with MAC1
taxMAC
abatement emissions with MAC1
MAC1MAC2
emissions with MAC2
Taxes
0
a b
cd d'
a'
S
emissions after S
Taxes
TI
t
t
(A)
(B)
a
d
b b'
c'c
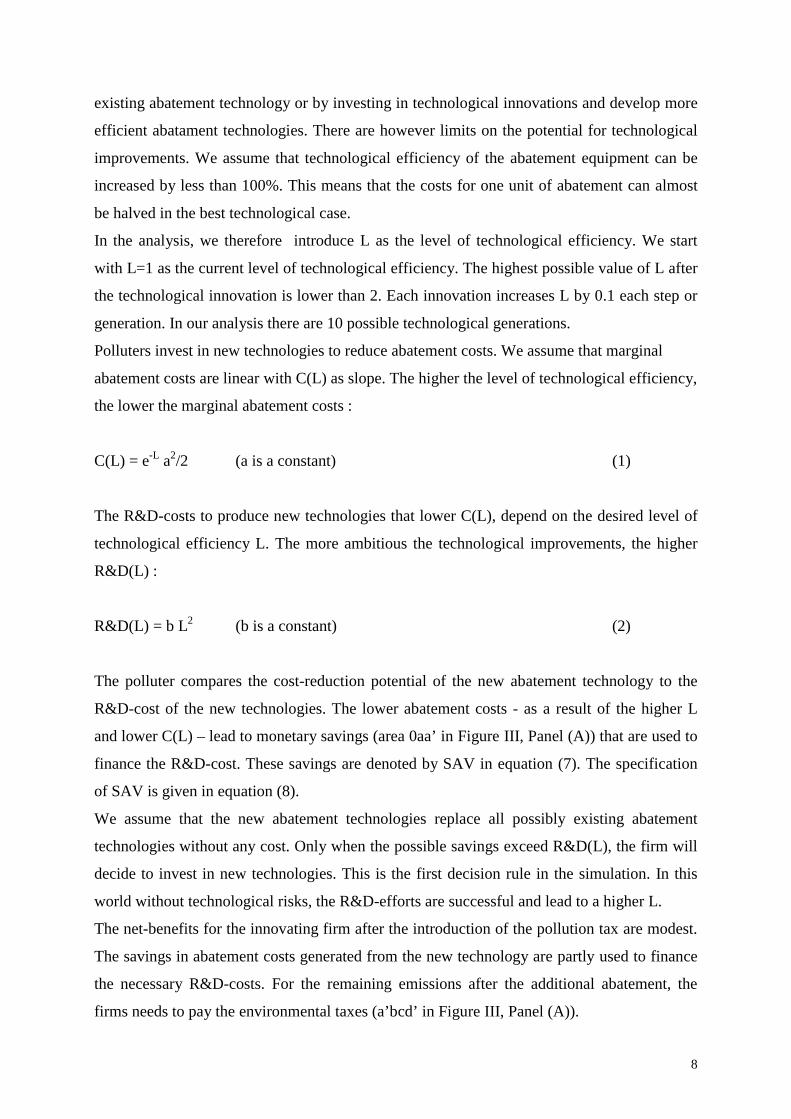
8
existing abatement technology or by investing in technological innovations and develop more
efficient abatament technologies. There are however limits on the potential for technological
improvements. We assume that technological efficiency of the abatement equipment can be
increased by less than 100%. This means that the costs for one unit of abatement can almost
be halved in the best technological case.
In the analysis, we therefore introduce L as the level of technological efficiency. We start
with L=1 as the current level of technological efficiency. The highest possible value of L after
the technological innovation is lower than 2. Each innovation increases L by 0.1 each step or
generation. In our analysis there are 10 possible technological generations.
Polluters invest in new technologies to reduce abatement costs. We assume that marginal
abatement costs are linear with C(L) as slope. The higher the level of technological efficiency,
the lower the marginal abatement costs :
C(L) = e-L a2/2 (a is a constant) (1)
The R&D-costs to produce new technologies that lower C(L), depend on the desired level of
technological efficiency L. The more ambitious the technological improvements, the higher
R&D(L) :
R&D(L) = b L2 (b is a constant) (2)
The polluter compares the cost-reduction potential of the new abatement technology to the
R&D-cost of the new technologies. The lower abatement costs - as a result of the higher L
and lower C(L) – lead to monetary savings (area 0aa’ in Figure III, Panel (A)) that are used to
finance the R&D-cost. These savings are denoted by SAV in equation (7). The specification
of SAV is given in equation (8).
We assume that the new abatement technologies replace all possibly existing abatement
technologies without any cost. Only when the possible savings exceed R&D(L), the firm will
decide to invest in new technologies. This is the first decision rule in the simulation. In this
world without technological risks, the R&D-efforts are successful and lead to a higher L.
The net-benefits for the innovating firm after the introduction of the pollution tax are modest.
The savings in abatement costs generated from the new technology are partly used to finance
the necessary R&D-costs. For the remaining emissions after the additional abatement, the
firms needs to pay the environmental taxes (a’bcd’ in Figure III, Panel (A)).
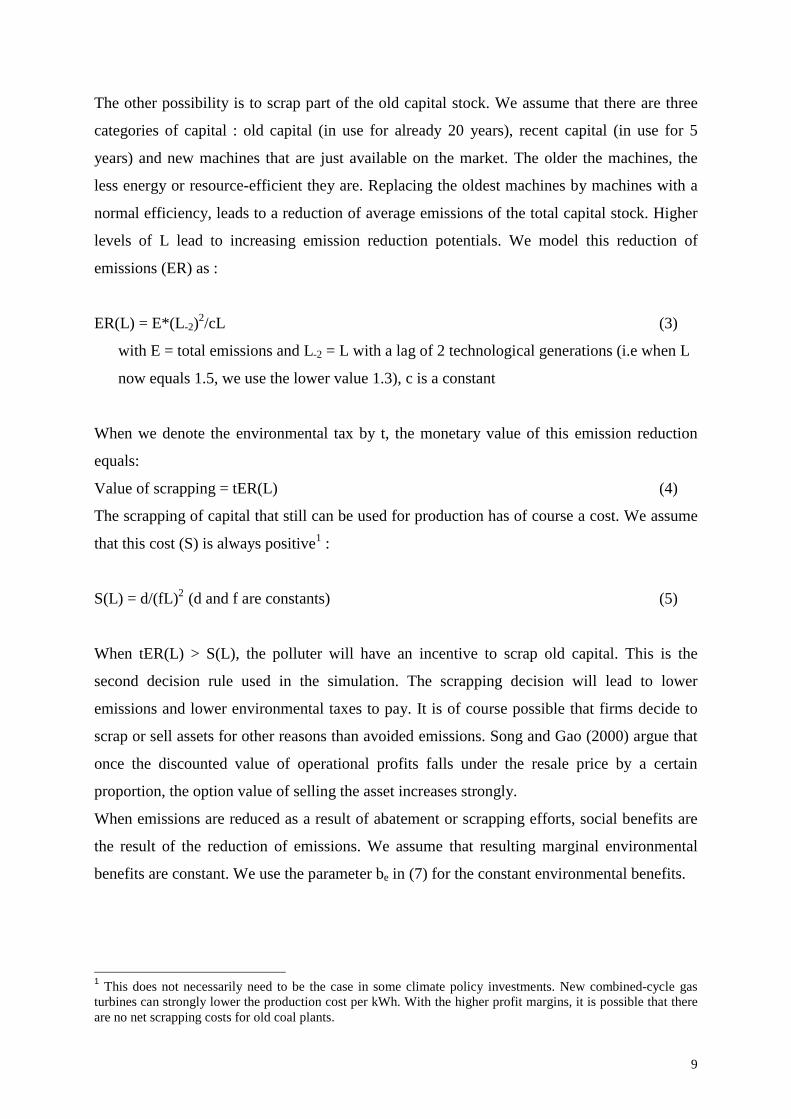
9
The other possibility is to scrap part of the old capital stock. We assume that there are three
categories of capital : old capital (in use for already 20 years), recent capital (in use for 5
years) and new machines that are just available on the market. The older the machines, the
less energy or resource-efficient they are. Replacing the oldest machines by machines with a
normal efficiency, leads to a reduction of average emissions of the total capital stock. Higher
levels of L lead to increasing emission reduction potentials. We model this reduction of
emissions (ER) as :
ER(L) = E*(L-2)2/cL (3)
with E = total emissions and L-2 = L with a lag of 2 technological generations (i.e when L
now equals 1.5, we use the lower value 1.3), c is a constant
When we denote the environmental tax by t, the monetary value of this emission reduction
equals:
Value of scrapping = tER(L) (4)
The scrapping of capital that still can be used for production has of course a cost. We assume
that this cost (S) is always positive1 :
S(L) = d/(fL)2 (d and f are constants) (5)
When tER(L) > S(L), the polluter will have an incentive to scrap old capital. This is the
second decision rule used in the simulation. The scrapping decision will lead to lower
emissions and lower environmental taxes to pay. It is of course possible that firms decide to
scrap or sell assets for other reasons than avoided emissions. Song and Gao (2000) argue that
once the discounted value of operational profits falls under the resale price by a certain
proportion, the option value of selling the asset increases strongly.
When emissions are reduced as a result of abatement or scrapping efforts, social benefits are
the result of the reduction of emissions. We assume that resulting marginal environmental
benefits are constant. We use the parameter be in (7) for the constant environmental benefits.
1 This does not necessarily need to be the case in some climate policy investments. New combined-cycle gasturbines can strongly lower the production cost per kWh. With the higher profit margins, it is possible that thereare no net scrapping costs for old coal plants.
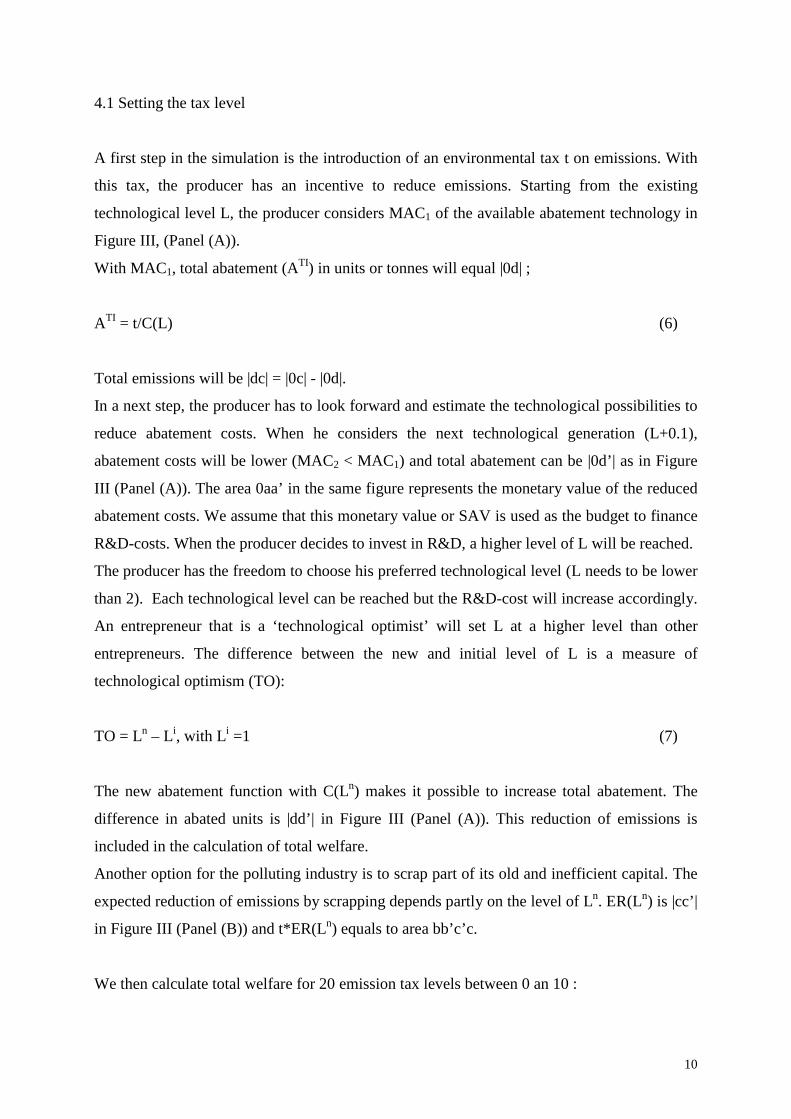
10
4.1 Setting the tax level
A first step in the simulation is the introduction of an environmental tax t on emissions. With
this tax, the producer has an incentive to reduce emissions. Starting from the existing
technological level L, the producer considers MAC1 of the available abatement technology in
Figure III, (Panel (A)).
With MAC1, total abatement (ATI) in units or tonnes will equal |0d| ;
ATI = t/C(L) (6)
Total emissions will be |dc| = |0c| - |0d|.
In a next step, the producer has to look forward and estimate the technological possibilities to
reduce abatement costs. When he considers the next technological generation (L+0.1),
abatement costs will be lower (MAC2 < MAC1) and total abatement can be |0d’| as in Figure
III (Panel (A)). The area 0aa’ in the same figure represents the monetary value of the reduced
abatement costs. We assume that this monetary value or SAV is used as the budget to finance
R&D-costs. When the producer decides to invest in R&D, a higher level of L will be reached.
The producer has the freedom to choose his preferred technological level (L needs to be lower
than 2). Each technological level can be reached but the R&D-cost will increase accordingly.
An entrepreneur that is a ‘technological optimist’ will set L at a higher level than other
entrepreneurs. The difference between the new and initial level of L is a measure of
technological optimism (TO):
TO = Ln – Li, with Li =1 (7)
The new abatement function with C(Ln) makes it possible to increase total abatement. The
difference in abated units is |dd’| in Figure III (Panel (A)). This reduction of emissions is
included in the calculation of total welfare.
Another option for the polluting industry is to scrap part of its old and inefficient capital. The
expected reduction of emissions by scrapping depends partly on the level of Ln. ER(Ln) is |cc’|
in Figure III (Panel (B)) and t*ER(Ln) equals to area bb’c’c.
We then calculate total welfare for 20 emission tax levels between 0 an 10 :
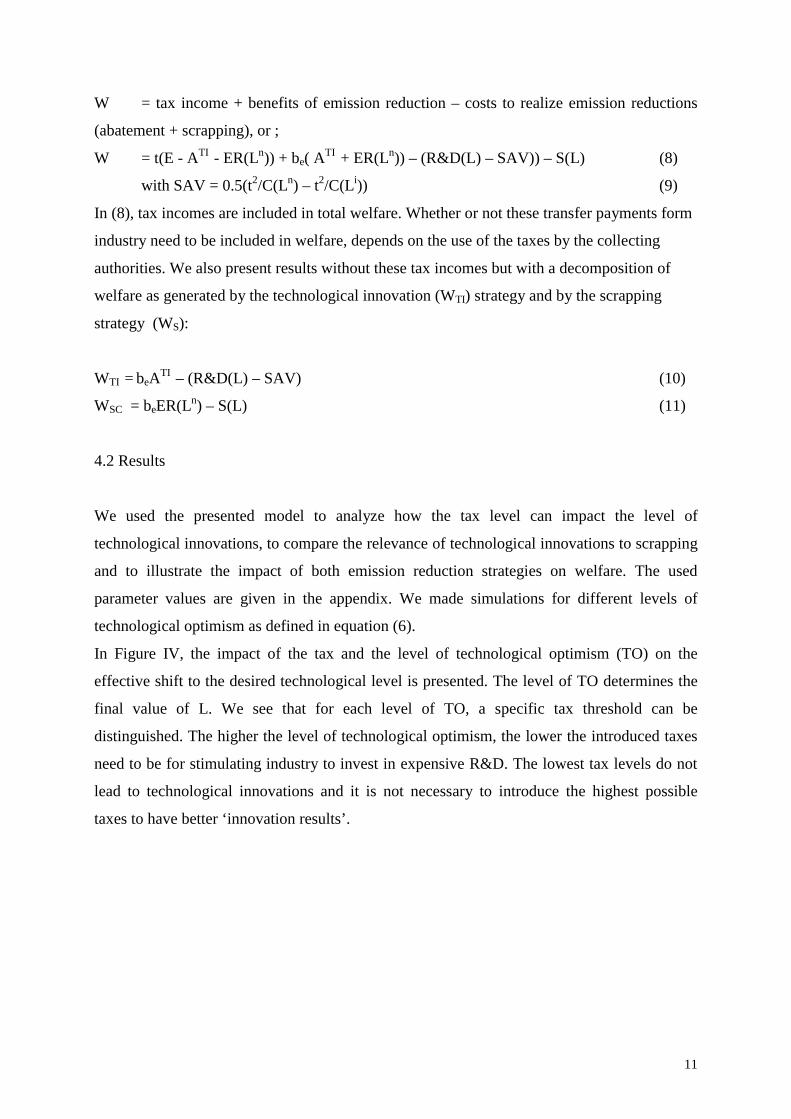
11
W = tax income + benefits of emission reduction – costs to realize emission reductions
(abatement + scrapping), or ;
W = t(E - ATI - ER(Ln)) + be( ATI + ER(Ln)) – (R&D(L) – SAV)) – S(L) (8)
with SAV = 0.5(t2/C(Ln) – t2/C(Li)) (9)
In (8), tax incomes are included in total welfare. Whether or not these transfer payments form
industry need to be included in welfare, depends on the use of the taxes by the collecting
authorities. We also present results without these tax incomes but with a decomposition of
welfare as generated by the technological innovation (WTI) strategy and by the scrapping
strategy (WS):
WTI = beATI – (R&D(L) – SAV) (10)
WSC = beER(Ln) – S(L) (11)
4.2 Results
We used the presented model to analyze how the tax level can impact the level of
technological innovations, to compare the relevance of technological innovations to scrapping
and to illustrate the impact of both emission reduction strategies on welfare. The used
parameter values are given in the appendix. We made simulations for different levels of
technological optimism as defined in equation (6).
In Figure IV, the impact of the tax and the level of technological optimism (TO) on the
effective shift to the desired technological level is presented. The level of TO determines the
final value of L. We see that for each level of TO, a specific tax threshold can be
distinguished. The higher the level of technological optimism, the lower the introduced taxes
need to be for stimulating industry to invest in expensive R&D. The lowest tax levels do not
lead to technological innovations and it is not necessary to introduce the highest possible
taxes to have better ‘innovation results’.
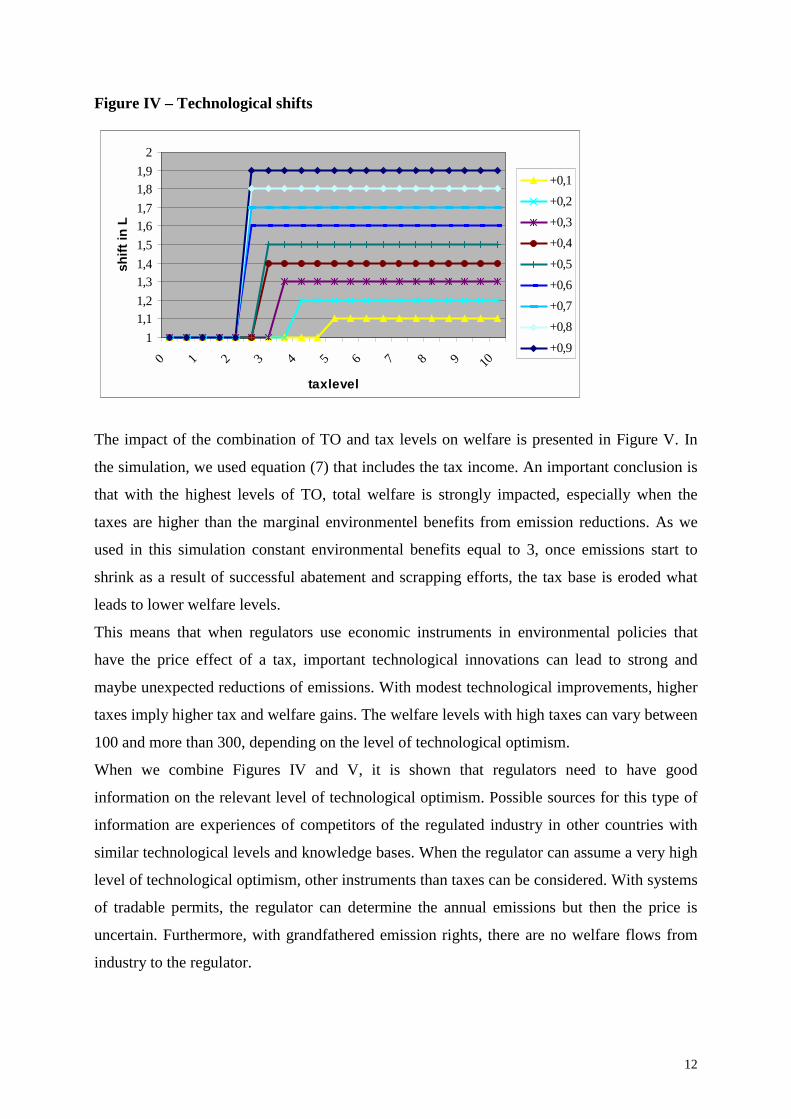
12
Figure IV – Technological shifts
The impact of the combination of TO and tax levels on welfare is presented in Figure V. In
the simulation, we used equation (7) that includes the tax income. An important conclusion is
that with the highest levels of TO, total welfare is strongly impacted, especially when the
taxes are higher than the marginal environmentel benefits from emission reductions. As we
used in this simulation constant environmental benefits equal to 3, once emissions start to
shrink as a result of successful abatement and scrapping efforts, the tax base is eroded what
leads to lower welfare levels.
This means that when regulators use economic instruments in environmental policies that
have the price effect of a tax, important technological innovations can lead to strong and
maybe unexpected reductions of emissions. With modest technological improvements, higher
taxes imply higher tax and welfare gains. The welfare levels with high taxes can vary between
100 and more than 300, depending on the level of technological optimism.
When we combine Figures IV and V, it is shown that regulators need to have good
information on the relevant level of technological optimism. Possible sources for this type of
information are experiences of competitors of the regulated industry in other countries with
similar technological levels and knowledge bases. When the regulator can assume a very high
level of technological optimism, other instruments than taxes can be considered. With systems
of tradable permits, the regulator can determine the annual emissions but then the price is
uncertain. Furthermore, with grandfathered emission rights, there are no welfare flows from
industry to the regulator.
11,11,21,31,41,51,61,71,81,9
2
0 1 2 3 4 5 6 7 8 9 10
taxlevel
shift
in L
+0,1+0,2+0,3+0,4+0,5+0,6+0,7+0,8+0,9
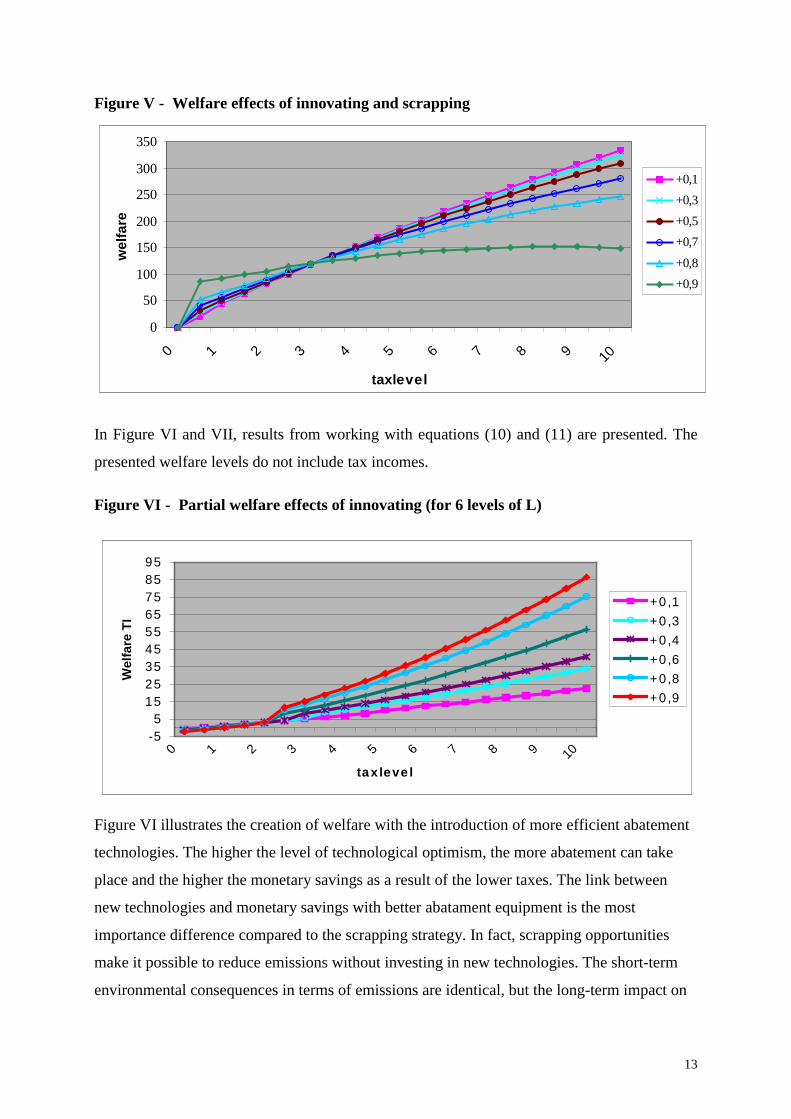
13
Figure V - Welfare effects of innovating and scrapping
In Figure VI and VII, results from working with equations (10) and (11) are presented. The
presented welfare levels do not include tax incomes.
Figure VI - Partial welfare effects of innovating (for 6 levels of L)
Figure VI illustrates the creation of welfare with the introduction of more efficient abatement
technologies. The higher the level of technological optimism, the more abatement can take
place and the higher the monetary savings as a result of the lower taxes. The link between
new technologies and monetary savings with better abatament equipment is the most
importance difference compared to the scrapping strategy. In fact, scrapping opportunities
make it possible to reduce emissions without investing in new technologies. The short-term
environmental consequences in terms of emissions are identical, but the long-term impact on
0
50
100
150
200
250
300
350
0 1 2 3 4 5 6 7 8 9 10
taxlevel
wel
fare
+0,1+0,3+0,5+0,7+0,8+0,9
-55
152535455565758595
0 1 2 3 4 5 6 7 8 9 10
taxleve l
Wel
fare
TI
+0,1+0 ,3+0 ,4+0 ,6+0 ,8+0 ,9
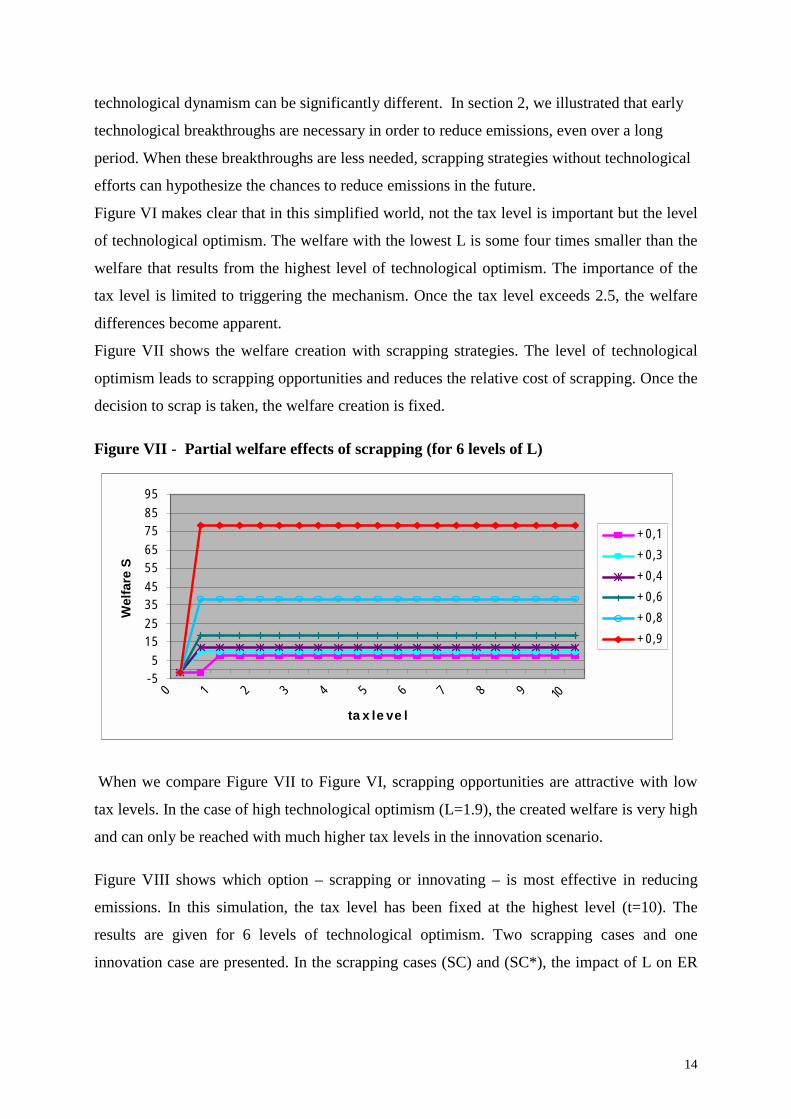
14
technological dynamism can be significantly different. In section 2, we illustrated that early
technological breakthroughs are necessary in order to reduce emissions, even over a long
period. When these breakthroughs are less needed, scrapping strategies without technological
efforts can hypothesize the chances to reduce emissions in the future.
Figure VI makes clear that in this simplified world, not the tax level is important but the level
of technological optimism. The welfare with the lowest L is some four times smaller than the
welfare that results from the highest level of technological optimism. The importance of the
tax level is limited to triggering the mechanism. Once the tax level exceeds 2.5, the welfare
differences become apparent.
Figure VII shows the welfare creation with scrapping strategies. The level of technological
optimism leads to scrapping opportunities and reduces the relative cost of scrapping. Once the
decision to scrap is taken, the welfare creation is fixed.
Figure VII - Partial welfare effects of scrapping (for 6 levels of L)
When we compare Figure VII to Figure VI, scrapping opportunities are attractive with low
tax levels. In the case of high technological optimism (L=1.9), the created welfare is very high
and can only be reached with much higher tax levels in the innovation scenario.
Figure VIII shows which option – scrapping or innovating – is most effective in reducing
emissions. In this simulation, the tax level has been fixed at the highest level (t=10). The
results are given for 6 levels of technological optimism. Two scrapping cases and one
innovation case are presented. In the scrapping cases (SC) and (SC*), the impact of L on ER
-55
1 52535455565758595
0 1 2 3 4 5 6 7 8 9 10
ta x le ve l
Wel
fare
S
+0,1
+0,3
+0,4
+0,6
+0,8
+0,9
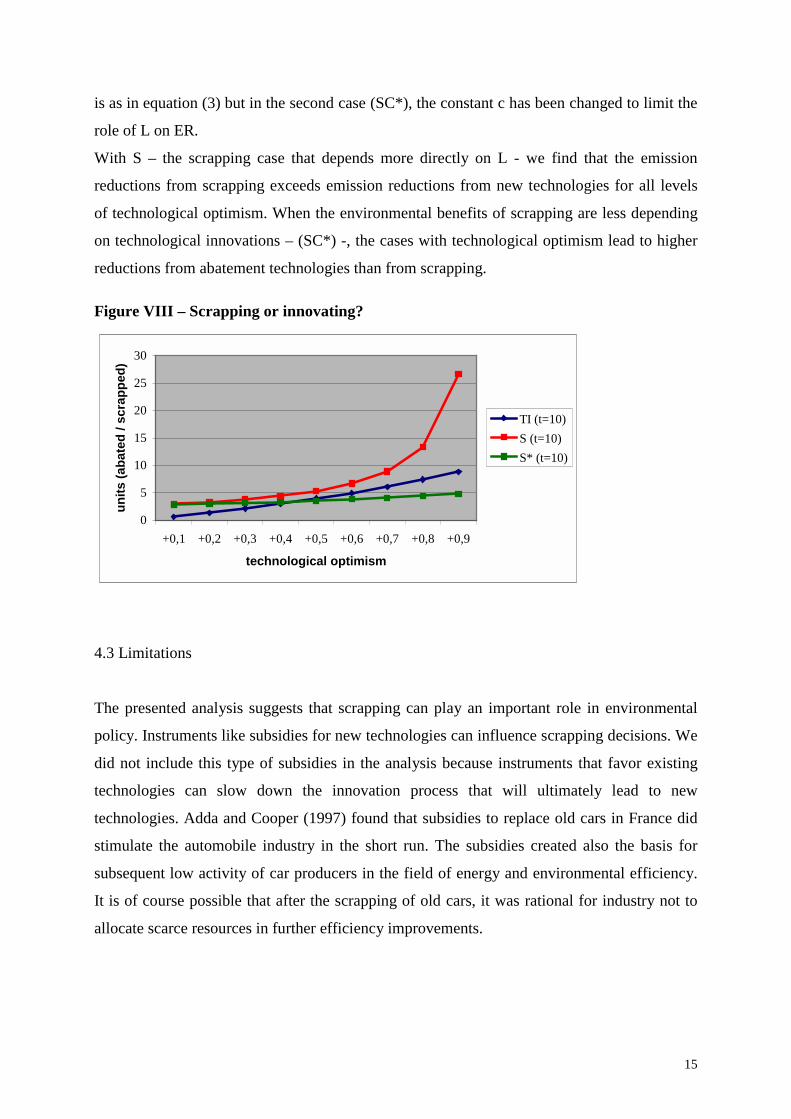
15
is as in equation (3) but in the second case (SC*), the constant c has been changed to limit the
role of L on ER.
With S – the scrapping case that depends more directly on L - we find that the emission
reductions from scrapping exceeds emission reductions from new technologies for all levels
of technological optimism. When the environmental benefits of scrapping are less depending
on technological innovations – (SC*) -, the cases with technological optimism lead to higher
reductions from abatement technologies than from scrapping.
Figure VIII – Scrapping or innovating?
4.3 Limitations
The presented analysis suggests that scrapping can play an important role in environmental
policy. Instruments like subsidies for new technologies can influence scrapping decisions. We
did not include this type of subsidies in the analysis because instruments that favor existing
technologies can slow down the innovation process that will ultimately lead to new
technologies. Adda and Cooper (1997) found that subsidies to replace old cars in France did
stimulate the automobile industry in the short run. The subsidies created also the basis for
subsequent low activity of car producers in the field of energy and environmental efficiency.
It is of course possible that after the scrapping of old cars, it was rational for industry not to
allocate scarce resources in further efficiency improvements.
0
5
10
15
20
25
30
+0,1 +0,2 +0,3 +0,4 +0,5 +0,6 +0,7 +0,8 +0,9
technological optimism
units
(aba
ted
/ scr
appe
d)
TI (t=10)S (t=10)S* (t=10)
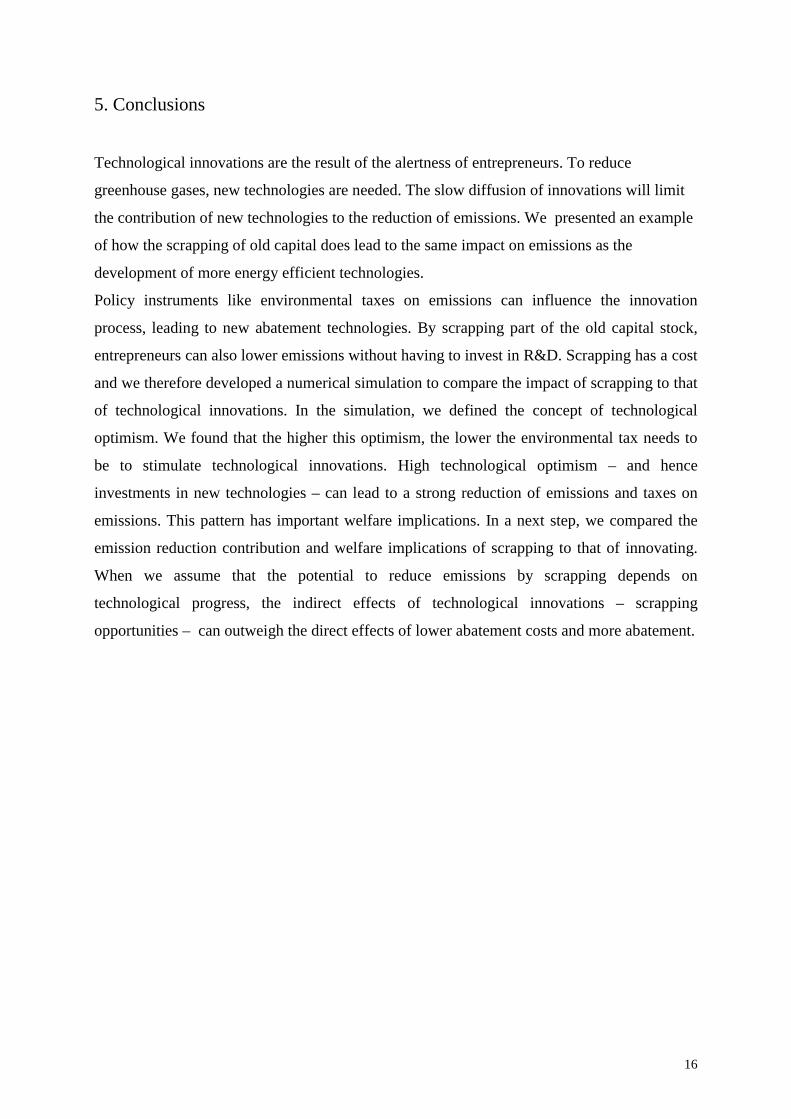
16
5. Conclusions
Technological innovations are the result of the alertness of entrepreneurs. To reduce
greenhouse gases, new technologies are needed. The slow diffusion of innovations will limit
the contribution of new technologies to the reduction of emissions. We presented an example
of how the scrapping of old capital does lead to the same impact on emissions as the
development of more energy efficient technologies.
Policy instruments like environmental taxes on emissions can influence the innovation
process, leading to new abatement technologies. By scrapping part of the old capital stock,
entrepreneurs can also lower emissions without having to invest in R&D. Scrapping has a cost
and we therefore developed a numerical simulation to compare the impact of scrapping to that
of technological innovations. In the simulation, we defined the concept of technological
optimism. We found that the higher this optimism, the lower the environmental tax needs to
be to stimulate technological innovations. High technological optimism – and hence
investments in new technologies – can lead to a strong reduction of emissions and taxes on
emissions. This pattern has important welfare implications. In a next step, we compared the
emission reduction contribution and welfare implications of scrapping to that of innovating.
When we assume that the potential to reduce emissions by scrapping depends on
technological progress, the indirect effects of technological innovations – scrapping
opportunities – can outweigh the direct effects of lower abatement costs and more abatement.
17
AppendixScenario A ; AEENCA(t) = 1- t/300Scenario B ; AEENCB(t) = 1- t2/5000Scenario C ; AEENCC(t) = 1- t2/300Scenario D ; AEENCD(t) = 1- 0.3 log (t/1.75)Scenario E ; AEENCE(t) = 1- 0.6 log (t/1.75)Scenario B ; TEUB(t) = 100 - t + 2t*AEENCB(t) = 100 + t -t3/2500Scenario B1 ; TEUB1(t) = 100 - 2t + 3t*AEENCB(t)Scenario B2 ; TEUB2(t) = 100 -1.5 + 2.5t*AEENCB(t)
C(L) = e-L a2/2 with a=3R&D(L) = b L2 .with b=0.6ER(L) = E(L-l2)2/cL with E=40 and c=7.5S(L) = d/(fL)2 with d=15 and f=3
ReferencesAdda, Jerome and Cooper, Russell (1997). Balladurette and Jupette : A Discrete Analysis of ScrappingSubsidies. NBER Working Paper N° W6048
Biglaiser, G. and Horrowitz, J.K. (1995). Pollution regulation and incentives for pollution-control research.Journal of Economics and Management Strategy 3, pp.663-684
Palmer, K., Oates, W. E. and Portney, P. R. (1995). Tightening environmental standards : the benefit-cost or theno-cost paradigm? Journal of Economic Perspectives 9(4), pp.119-132
Parry, I. W. H. (1995). Optimal pollution taxes and endogenous progress. Resource and Energy Economics 15,pp. 99-149
Parry, I. W. H. (1996). The choice between emissions taxes and tradable permits when technological innovationis endogenous. Resources for the Future, Discussion Paper 96-31
Pizer, W. A. (1997). Optimal choice of policy instrument and stringency under uncertainty : the case of climatechange. Resources for the Future (paper, version of March 3, 1997)
President Willian Jefferson Clinton (2000). State of the Union Address to Congress, January 27
Song, Jihe and Gao, Shumei (2000). An Option Pricing Approach to Asset Sale. Henriot-WattUniversity Working Paper N°2000/1, July 2000
Stavins, R. N. (1996). Correlated uncertainty and policy instrument choice. Journal of Environmental Economicsand Management 30(2), pp. 218-232
Weitzman, M. L. (1974). Prices vs. quantities. Review of Economic Studies 41(4), pp.477-491
AbstractStarting from CO2 emissions data collected during both the production phase and during thelifetime of cars and trucks, we argue that impressive opportunities to reduce emissions can befound in the consumption phase. It is however obvious that energy taxes alone will not lead toa strong reduction of transport emissions. New instruments that stimulate technologicalinnovations should therefore focus on emissions during product use.In our opinion, current designs and proposals for CO2 emission trading systems do not provideincentives to stimulate cross-sectoral energy efficiency investments like the development ofcleaner cars and trucks. We think manufacturers should be >rewarded= when their productsallow consumers to save energy during consumption.To adapt these flexible designs, we introduced the concept of a >tradable certificate=, anallowance for each tonne CO2 avoided as a result of selling a vehicle that is much more energyefficient than other new vehicles. We then developed two dynamic models in which we linkedthe value of these certificates to the diffusion of the cleanest vehicles. We found that theintroduction of the certificate in tradable permit systems can lead to very significant reductionsof CO2 emissions. Our models indicate that emissions resulting from the car fleet can be reducedby 25 to 38% over a period of 15 years (starting in 1999). The potential of this new instrumentis less spectacular for the truck market as a result of some fundamental differences compared totechnological evolutions for car engines. But if the value of the certificate were high enough,emissions resulting from the truck fleet could be reduced by 12% over the same period.
Non-technical AbstractIn climate policy, new instruments are considered to reduce the emissions of greenhouse gases.One of the most interesting new instruments is emission or allowance trading that is already usedin the U.S. Acid Rain Program. We think however that most designs for CO2 emission tradingare too strongly based on SO2 trading designs while the abatement strategies for bothenvironmental problems are clearly different. In our paper, we focus on CO2 emissions intransport.Starting from CO2 emissions data collected during both the production phase and lifetime of carsand trucks, we argue that impressive opportunities to reduce emissions can be found in theconsumption phase. We calculated the relative importance of the production and consumptionphase in terms of total CO2 emissions. We found that for the production of cars, emissionsduring the lifetime are 25 times more important than emissions during manufacturing. For trucks,emissions during lifetime are 375 times more important than emissions during manufacturing.Most policies do focus however on emissions during production and just assume that higherenergy prices for consumers will lead to lower emissions.It is however obvious that energy taxes alone will not lead to a strong reduction of transportemissions. Even in the countries with the highest energy taxes, total emissions in transportcontinue to increase. New instruments that stimulate technological innovations should thereforefocus on emissions during product use.In our opinion, current designs and proposals for CO2 emission trading systems do not provideincentives to stimulate cross-sectoral energy efficiency investments like the development ofcleaner cars and trucks. We think manufacturers should be >rewarded= when their productsallow consumers to save energy during consumption.To adapt these flexible designs, we introduced the concept of a >tradable certificate=, anallowance for each tonne CO2 avoided as a result of selling a vehicle that is much more energyefficient than other new vehicles. We then developed two dynamic models in which we linked
the value of these certificates to the diffusion of the cleanest vehicles. We found that theintroduction of the certificate in tradable permit systems can lead to very significant reductionsof CO2 emissions. Our models indicate that emissions resulting from the car fleet can be reducedby 25 to 38% over a period of 15 years (starting in 1999). The potential of this new instrumentis less spectacular for the truck market as a result of some fundamental differences compared totechnological evolutions for car engines. When other truck emissions like NOX need to bereduced, this will lead to a higher fuel consumption. But if the value of the certificate were highenough, emissions resulting from the truck fleet could be reduced by 12% over the same period.
Johan AlbrechtUniversity of Ghent, Faculty of EconomicsCenter for Environmental Economics and Environmental ManagementHoveniersberg 249000 GhentBelgiumE-mail : [email protected]
Making CO2 Emission Trading More Effective :Integrating Cross-sectoral Energy Efficiency Opportunities
Johan Albrecht, University of Ghent-CEEM*
AbstractStarting from CO2 emissions data collected during both the production phase and during the lifetime of cars andtrucks, we argue that impressive opportunities to reduce emissions can be found in the consumption phase. It ishowever obvious that energy taxes alone will not lead to a strong reduction of transport emissions. New instrumentsthat stimulate technological innovations should therefore focus on emissions during product use.In our opinion, current designs and proposals for CO2 emission trading systems do not provide incentives tostimulate cross-sectoral energy efficiency investments like the development of cleaner cars and trucks. We thinkmanufacturers should be >rewarded= when their products allow consumers to save energy during consumption.To adapt these flexible designs, we introduced the concept of a >tradable certificate=, an allowance for each tonneCO2 avoided as a result of selling a vehicle that is much more energy efficient than other new vehicles. We thendeveloped two dynamic models in which we linked the value of these certificates to the diffusion of the cleanestvehicles. We found that the introduction of the certificate in tradable permit systems can lead to very significantreductions of CO2 emissions. Our models indicate that emissions resulting from the car fleet can be reduced by 25to 38% over a period of 15 years (starting in 1999). The potential of this new instrument is less spectacular for thetruck market as a result of some fundamental differences compared to technological evolutions for car engines. Butif the value of the certificate were high enough, emissions resulting from the truck fleet could be reduced by 12%over the same period.
Keywords : emission trading, greenhouse gases, energy efficiency, clean technologies, car andtruck industryJEL Classification : Q25, Q28, O3, L62
1. Introduction
Reducing greenhouse gas emissions will require a strategy that combines various policy measuresand economic instruments. Next to traditional instruments like taxes on energy or the reductionof subsidies to energy-related sectors, some relatively new instruments entered the internationalfora. Systems of tradable permits for greenhouse gases (GHG), Joint Implementation (JI) andthe Clean Development Mechanism (CDM) are currently considered or already in anexperimental phase. Many of these instruments are of special importance for internationalemission reduction efforts but they do not provide a stand-alone solution. If they will beintroduced in the near future, they will function next to many other instruments, depending onnational priorities and political sensitivities.
* Funded by the OSTC (Belgian Federal Office for Scientific, Technological and Cultural
Affairs, Programme on Sustainable Development). The views presented are those of theauthor.I want to thank Bart Ameels, Niko Gobbin, Freddy Heylen and Tom Verbeke for their helpfulcomments. Remaining errors are mine.
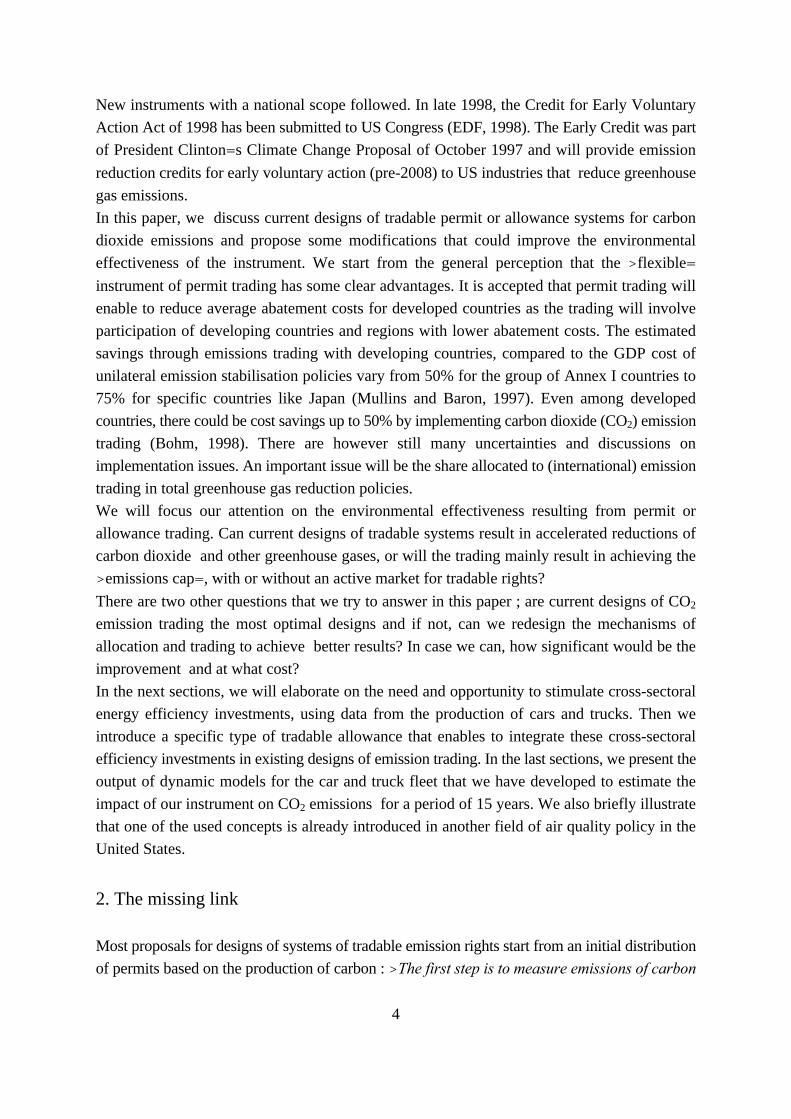
4
New instruments with a national scope followed. In late 1998, the Credit for Early VoluntaryAction Act of 1998 has been submitted to US Congress (EDF, 1998). The Early Credit was partof President Clinton=s Climate Change Proposal of October 1997 and will provide emissionreduction credits for early voluntary action (pre-2008) to US industries that reduce greenhousegas emissions.In this paper, we discuss current designs of tradable permit or allowance systems for carbondioxide emissions and propose some modifications that could improve the environmentaleffectiveness of the instrument. We start from the general perception that the >flexible=instrument of permit trading has some clear advantages. It is accepted that permit trading willenable to reduce average abatement costs for developed countries as the trading will involveparticipation of developing countries and regions with lower abatement costs. The estimatedsavings through emissions trading with developing countries, compared to the GDP cost ofunilateral emission stabilisation policies vary from 50% for the group of Annex I countries to75% for specific countries like Japan (Mullins and Baron, 1997). Even among developedcountries, there could be cost savings up to 50% by implementing carbon dioxide (CO2) emissiontrading (Bohm, 1998). There are however still many uncertainties and discussions onimplementation issues. An important issue will be the share allocated to (international) emissiontrading in total greenhouse gas reduction policies.We will focus our attention on the environmental effectiveness resulting from permit orallowance trading. Can current designs of tradable systems result in accelerated reductions ofcarbon dioxide and other greenhouse gases, or will the trading mainly result in achieving the>emissions cap=, with or without an active market for tradable rights?There are two other questions that we try to answer in this paper ; are current designs of CO2
emission trading the most optimal designs and if not, can we redesign the mechanisms ofallocation and trading to achieve better results? In case we can, how significant would be theimprovement and at what cost?In the next sections, we will elaborate on the need and opportunity to stimulate cross-sectoralenergy efficiency investments, using data from the production of cars and trucks. Then weintroduce a specific type of tradable allowance that enables to integrate these cross-sectoralefficiency investments in existing designs of emission trading. In the last sections, we present theoutput of dynamic models for the car and truck fleet that we have developed to estimate theimpact of our instrument on CO2 emissions for a period of 15 years. We also briefly illustratethat one of the used concepts is already introduced in another field of air quality policy in theUnited States.
2. The missing link
Most proposals for designs of systems of tradable emission rights start from an initial distributionof permits based on the production of carbon : >The first step is to measure emissions of carbon
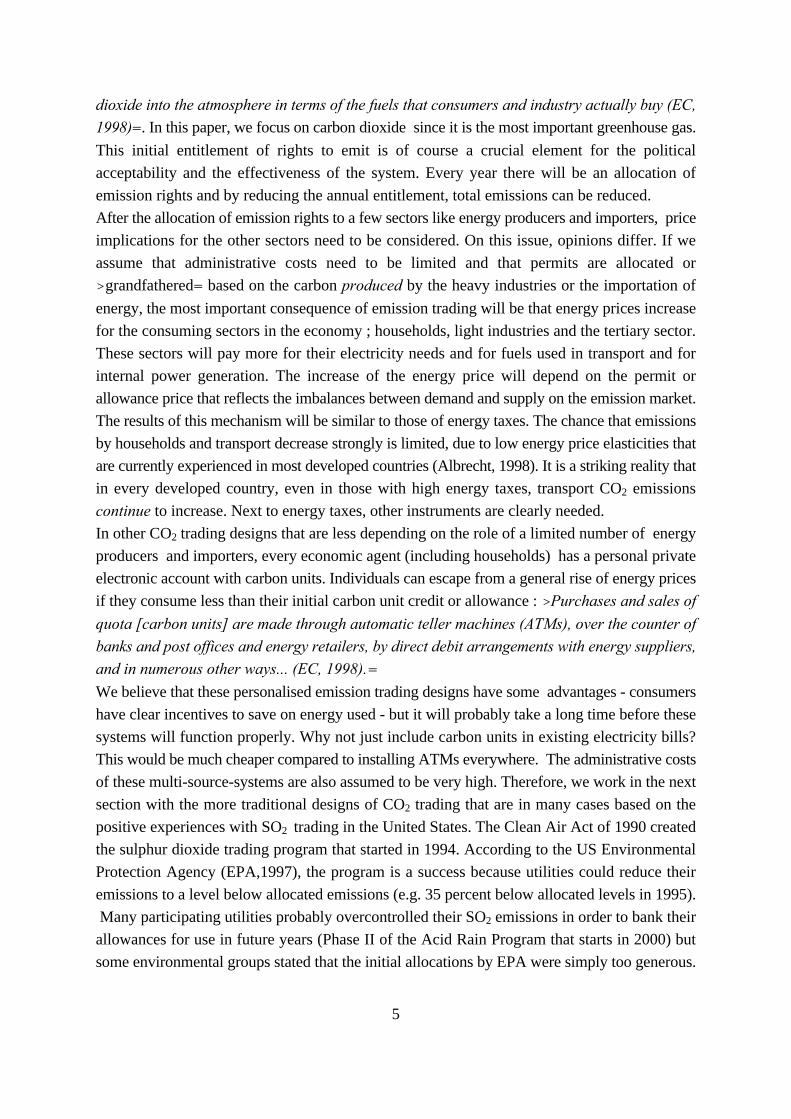
5
dioxide into the atmosphere in terms of the fuels that consumers and industry actually buy (EC,1998)=. In this paper, we focus on carbon dioxide since it is the most important greenhouse gas.This initial entitlement of rights to emit is of course a crucial element for the politicalacceptability and the effectiveness of the system. Every year there will be an allocation ofemission rights and by reducing the annual entitlement, total emissions can be reduced.After the allocation of emission rights to a few sectors like energy producers and importers, priceimplications for the other sectors need to be considered. On this issue, opinions differ. If weassume that administrative costs need to be limited and that permits are allocated or>grandfathered= based on the carbon produced by the heavy industries or the importation ofenergy, the most important consequence of emission trading will be that energy prices increasefor the consuming sectors in the economy ; households, light industries and the tertiary sector.These sectors will pay more for their electricity needs and for fuels used in transport and forinternal power generation. The increase of the energy price will depend on the permit orallowance price that reflects the imbalances between demand and supply on the emission market.The results of this mechanism will be similar to those of energy taxes. The chance that emissionsby households and transport decrease strongly is limited, due to low energy price elasticities thatare currently experienced in most developed countries (Albrecht, 1998). It is a striking reality thatin every developed country, even in those with high energy taxes, transport CO2 emissionscontinue to increase. Next to energy taxes, other instruments are clearly needed.In other CO2 trading designs that are less depending on the role of a limited number of energyproducers and importers, every economic agent (including households) has a personal privateelectronic account with carbon units. Individuals can escape from a general rise of energy pricesif they consume less than their initial carbon unit credit or allowance : >Purchases and sales of
quota [carbon units] are made through automatic teller machines (ATMs), over the counter ofbanks and post offices and energy retailers, by direct debit arrangements with energy suppliers,and in numerous other ways... (EC, 1998).= We believe that these personalised emission trading designs have some advantages - consumershave clear incentives to save on energy used - but it will probably take a long time before thesesystems will function properly. Why not just include carbon units in existing electricity bills?This would be much cheaper compared to installing ATMs everywhere. The administrative costsof these multi-source-systems are also assumed to be very high. Therefore, we work in the nextsection with the more traditional designs of CO2 trading that are in many cases based on thepositive experiences with SO2 trading in the United States. The Clean Air Act of 1990 createdthe sulphur dioxide trading program that started in 1994. According to the US EnvironmentalProtection Agency (EPA,1997), the program is a success because utilities could reduce theiremissions to a level below allocated emissions (e.g. 35 percent below allocated levels in 1995). Many participating utilities probably overcontrolled their SO2 emissions in order to bank theirallowances for use in future years (Phase II of the Acid Rain Program that starts in 2000) butsome environmental groups stated that the initial allocations by EPA were simply too generous.
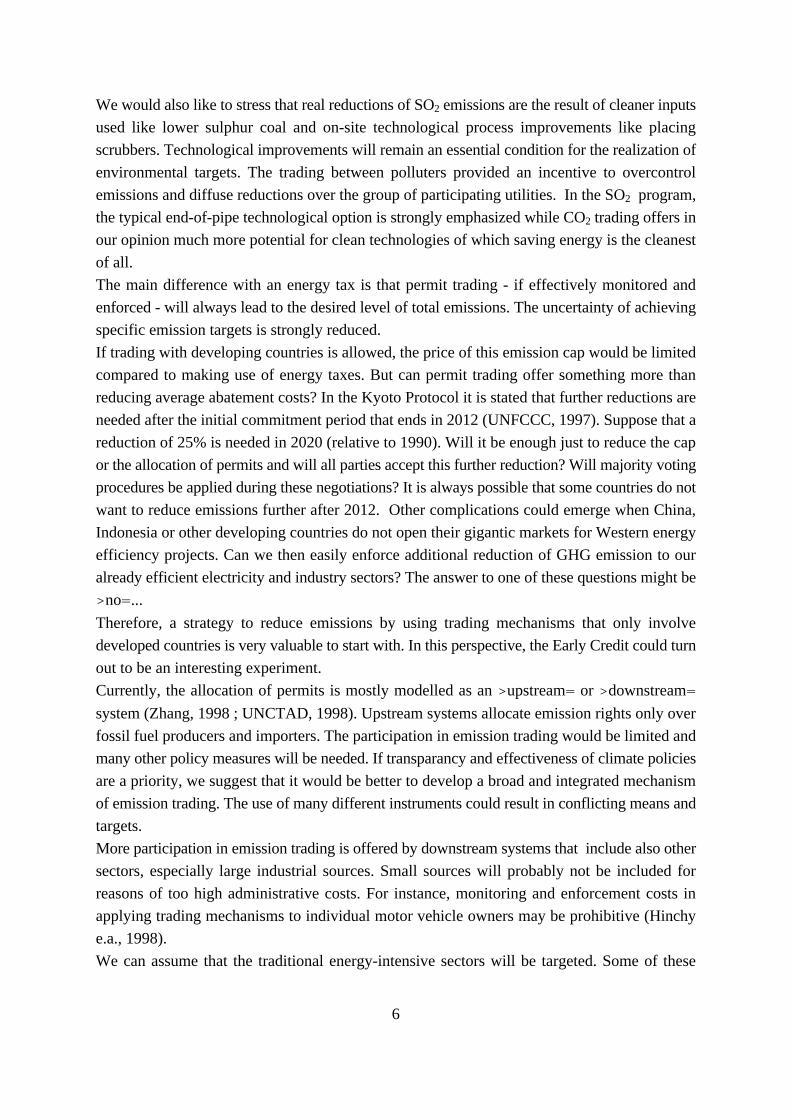
6
We would also like to stress that real reductions of SO2 emissions are the result of cleaner inputsused like lower sulphur coal and on-site technological process improvements like placingscrubbers. Technological improvements will remain an essential condition for the realization ofenvironmental targets. The trading between polluters provided an incentive to overcontrolemissions and diffuse reductions over the group of participating utilities. In the SO2 program,the typical end-of-pipe technological option is strongly emphasized while CO2 trading offers inour opinion much more potential for clean technologies of which saving energy is the cleanestof all.The main difference with an energy tax is that permit trading - if effectively monitored andenforced - will always lead to the desired level of total emissions. The uncertainty of achievingspecific emission targets is strongly reduced.If trading with developing countries is allowed, the price of this emission cap would be limitedcompared to making use of energy taxes. But can permit trading offer something more thanreducing average abatement costs? In the Kyoto Protocol it is stated that further reductions areneeded after the initial commitment period that ends in 2012 (UNFCCC, 1997). Suppose that areduction of 25% is needed in 2020 (relative to 1990). Will it be enough just to reduce the capor the allocation of permits and will all parties accept this further reduction? Will majority votingprocedures be applied during these negotiations? It is always possible that some countries do notwant to reduce emissions further after 2012. Other complications could emerge when China,Indonesia or other developing countries do not open their gigantic markets for Western energyefficiency projects. Can we then easily enforce additional reduction of GHG emission to ouralready efficient electricity and industry sectors? The answer to one of these questions might be>no=...Therefore, a strategy to reduce emissions by using trading mechanisms that only involvedeveloped countries is very valuable to start with. In this perspective, the Early Credit could turnout to be an interesting experiment.Currently, the allocation of permits is mostly modelled as an >upstream= or >downstream=system (Zhang, 1998 ; UNCTAD, 1998). Upstream systems allocate emission rights only overfossil fuel producers and importers. The participation in emission trading would be limited andmany other policy measures will be needed. If transparancy and effectiveness of climate policiesare a priority, we suggest that it would be better to develop a broad and integrated mechanismof emission trading. The use of many different instruments could result in conflicting means andtargets.More participation in emission trading is offered by downstream systems that include also othersectors, especially large industrial sources. Small sources will probably not be included forreasons of too high administrative costs. For instance, monitoring and enforcement costs inapplying trading mechanisms to individual motor vehicle owners may be prohibitive (Hinchye.a., 1998).We can assume that the traditional energy-intensive sectors will be targeted. Some of these
7
sectors have already formulated policy statements on permit trading. CEFIC, the Europeanchemical industry council, will not oppose CO2 emissions trading but explicitly demands for arelative grandfathering based on the changes in industrial production (CEFIC, 1998).Industry can sell emission rights if the sector reduces its own CO2 emissions. But if industry andthe electricity sector are already efficient, how can we then reduce further GHG emissions at anacceptable cost? The answer on this question is not integrated in current tradable emissiondesigns but is rather evident : we need to create incentives that make it interesting (not to sayprofitable) for industry and the electricity sector to reduce the GHG emissions of other sectors(transport, households and the tertiary sector). This is possible for each product that needs energyduring the use or consumption. And many technical surveys indicate that the energy efficiencyin transport and household energy use is still relatively low (Albrecht, 1998).Therefore, we should stimulate cross-sectoral efficiency investments. Emission trading systemsneed to integrate cross-sectoral transactions like permits allocated to car manufacturers becausethey did sell very energy efficient cars to households. Therefore a new type of permits shouldbe created for efforts that lead to reductions of emissions in other sectors. If the electricity sector,or another industry, provides a technology to a firm or industry that can reduce, just by theimplementation of this technology, its own GHG emission by x tonnes, the provider of thetechnology should receive a number of tradable allowances2 - in terms of GHG reduction units- for its sold product or technology. Later we will use the term >certificate= for this type ofallowance. If other manufacturers, like the car industry or producers of heating systems orrefrigerators, present a new energy efficient type, they could also receive a similar allowance orpermit for the realized reductions. These allowances can be sold on the GHG Permit Market.The benefits from selling will reward industries for investing in GHG reductions realised by othersectors.In the next section, we will work out an example for the car and truck industry to illustrate thatwhat we propose is not just a further complication of existing proposals for permit systems butwill offer significant environmental potentials.
3. Car and truck manufacturers and the tradable certificate
Next to many other sources, GHG emissions result from the production and the use of cars andtrucks in transport. In most OECD-countries, transport accounts for more than 25% of all GHGemissions. The relative share of transport is estimated to increase further (COM(97)481). The
2 Credits are denominated in terms of a pollutant flow such as tonnes per year. Allowances are defined
in discrete terms like tonne CO2, without a time specification. Working with allowances facilitates thedevelopment of future markets (Tietenberg, 1997).
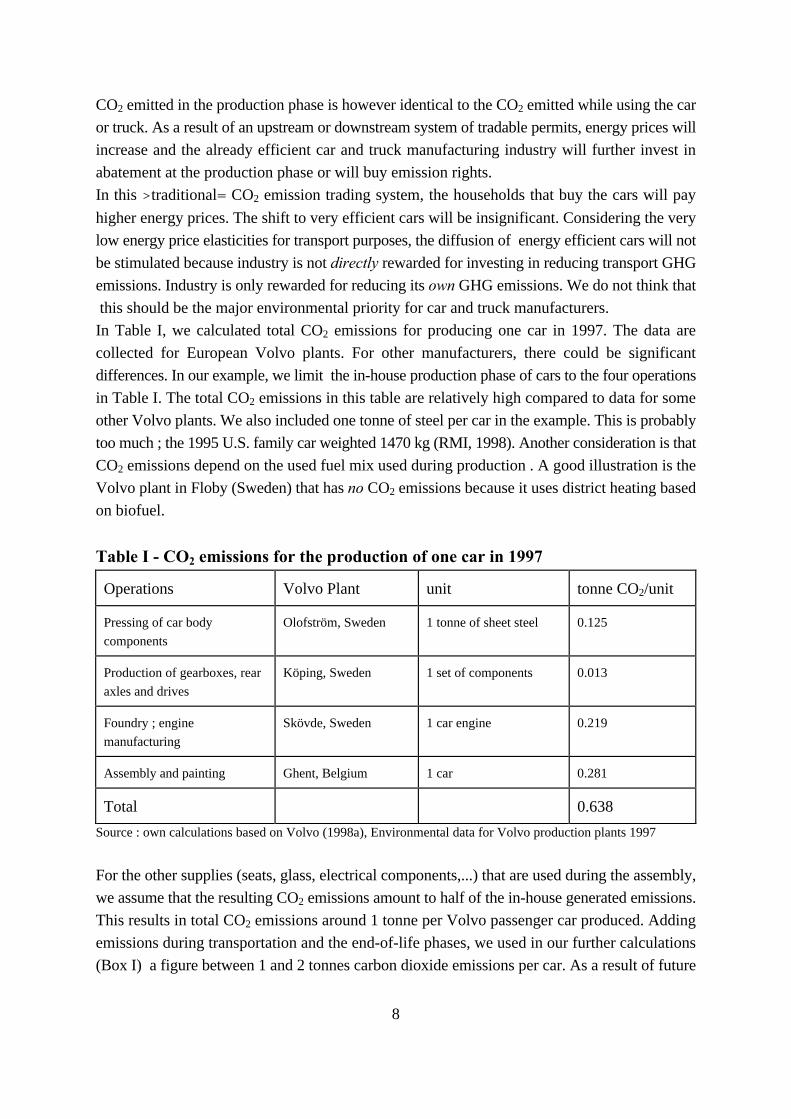
8
CO2 emitted in the production phase is however identical to the CO2 emitted while using the caror truck. As a result of an upstream or downstream system of tradable permits, energy prices willincrease and the already efficient car and truck manufacturing industry will further invest inabatement at the production phase or will buy emission rights.In this >traditional= CO2 emission trading system, the households that buy the cars will payhigher energy prices. The shift to very efficient cars will be insignificant. Considering the verylow energy price elasticities for transport purposes, the diffusion of energy efficient cars will notbe stimulated because industry is not directly rewarded for investing in reducing transport GHGemissions. Industry is only rewarded for reducing its own GHG emissions. We do not think that this should be the major environmental priority for car and truck manufacturers.In Table I, we calculated total CO2 emissions for producing one car in 1997. The data arecollected for European Volvo plants. For other manufacturers, there could be significantdifferences. In our example, we limit the in-house production phase of cars to the four operationsin Table I. The total CO2 emissions in this table are relatively high compared to data for someother Volvo plants. We also included one tonne of steel per car in the example. This is probablytoo much ; the 1995 U.S. family car weighted 1470 kg (RMI, 1998). Another consideration is thatCO2 emissions depend on the used fuel mix used during production . A good illustration is theVolvo plant in Floby (Sweden) that has no CO2 emissions because it uses district heating basedon biofuel.
Table I - CO2 emissions for the production of one car in 1997
Operations Volvo Plant unit tonne CO2/unit
Pressing of car bodycomponents
Olofström, Sweden 1 tonne of sheet steel 0.125
Production of gearboxes, rearaxles and drives
Köping, Sweden 1 set of components 0.013
Foundry ; enginemanufacturing
Skövde, Sweden 1 car engine 0.219
Assembly and painting Ghent, Belgium 1 car 0.281
Total 0.638Source : own calculations based on Volvo (1998a), Environmental data for Volvo production plants 1997 For the other supplies (seats, glass, electrical components,...) that are used during the assembly,we assume that the resulting CO2 emissions amount to half of the in-house generated emissions.This results in total CO2 emissions around 1 tonne per Volvo passenger car produced. Addingemissions during transportation and the end-of-life phases, we used in our further calculations(Box I) a figure between 1 and 2 tonnes carbon dioxide emissions per car. As a result of future
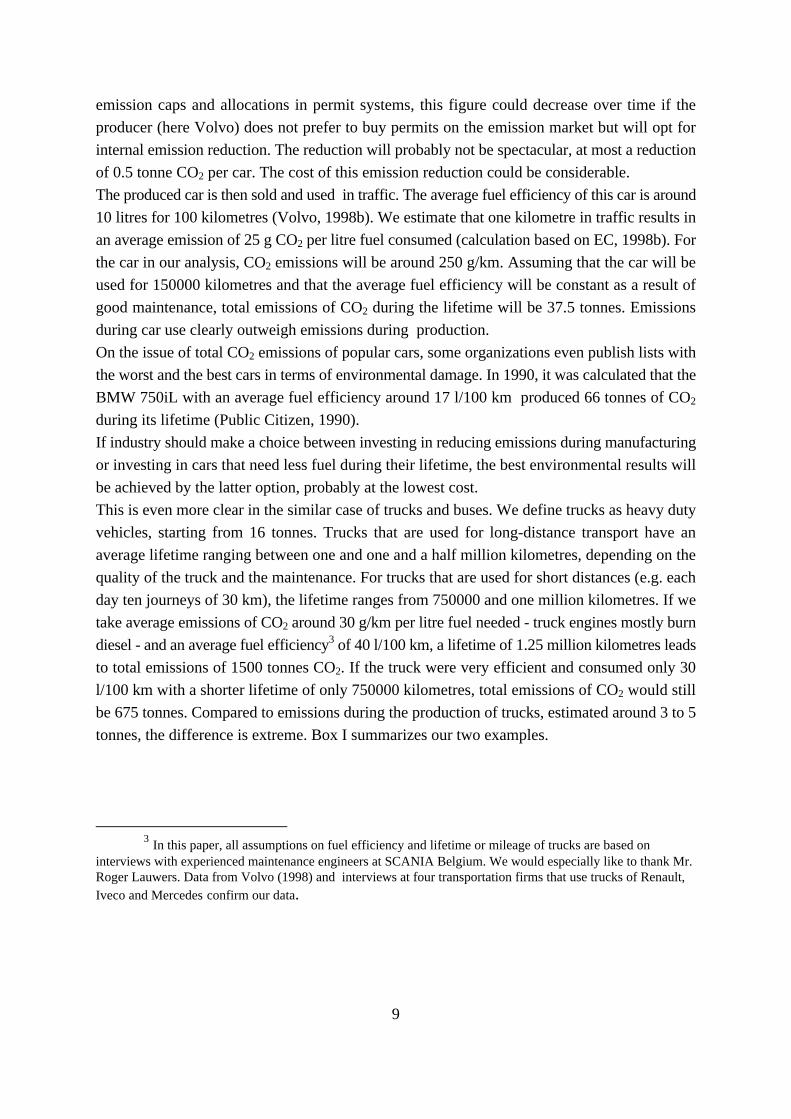
9
emission caps and allocations in permit systems, this figure could decrease over time if theproducer (here Volvo) does not prefer to buy permits on the emission market but will opt forinternal emission reduction. The reduction will probably not be spectacular, at most a reductionof 0.5 tonne CO2 per car. The cost of this emission reduction could be considerable.The produced car is then sold and used in traffic. The average fuel efficiency of this car is around10 litres for 100 kilometres (Volvo, 1998b). We estimate that one kilometre in traffic results inan average emission of 25 g CO2 per litre fuel consumed (calculation based on EC, 1998b). Forthe car in our analysis, CO2 emissions will be around 250 g/km. Assuming that the car will beused for 150000 kilometres and that the average fuel efficiency will be constant as a result ofgood maintenance, total emissions of CO2 during the lifetime will be 37.5 tonnes. Emissionsduring car use clearly outweigh emissions during production.On the issue of total CO2 emissions of popular cars, some organizations even publish lists withthe worst and the best cars in terms of environmental damage. In 1990, it was calculated that theBMW 750iL with an average fuel efficiency around 17 l/100 km produced 66 tonnes of CO2
during its lifetime (Public Citizen, 1990).If industry should make a choice between investing in reducing emissions during manufacturingor investing in cars that need less fuel during their lifetime, the best environmental results willbe achieved by the latter option, probably at the lowest cost.This is even more clear in the similar case of trucks and buses. We define trucks as heavy dutyvehicles, starting from 16 tonnes. Trucks that are used for long-distance transport have anaverage lifetime ranging between one and one and a half million kilometres, depending on thequality of the truck and the maintenance. For trucks that are used for short distances (e.g. eachday ten journeys of 30 km), the lifetime ranges from 750000 and one million kilometres. If wetake average emissions of CO2 around 30 g/km per litre fuel needed - truck engines mostly burndiesel - and an average fuel efficiency3 of 40 l/100 km, a lifetime of 1.25 million kilometres leadsto total emissions of 1500 tonnes CO2. If the truck were very efficient and consumed only 30l/100 km with a shorter lifetime of only 750000 kilometres, total emissions of CO2 would stillbe 675 tonnes. Compared to emissions during the production of trucks, estimated around 3 to 5tonnes, the difference is extreme. Box I summarizes our two examples.
3 In this paper, all assumptions on fuel efficiency and lifetime or mileage of trucks are based on
interviews with experienced maintenance engineers at SCANIA Belgium. We would especially like to thank Mr.Roger Lauwers. Data from Volvo (1998) and interviews at four transportation firms that use trucks of Renault,Iveco and Mercedes confirm our data.
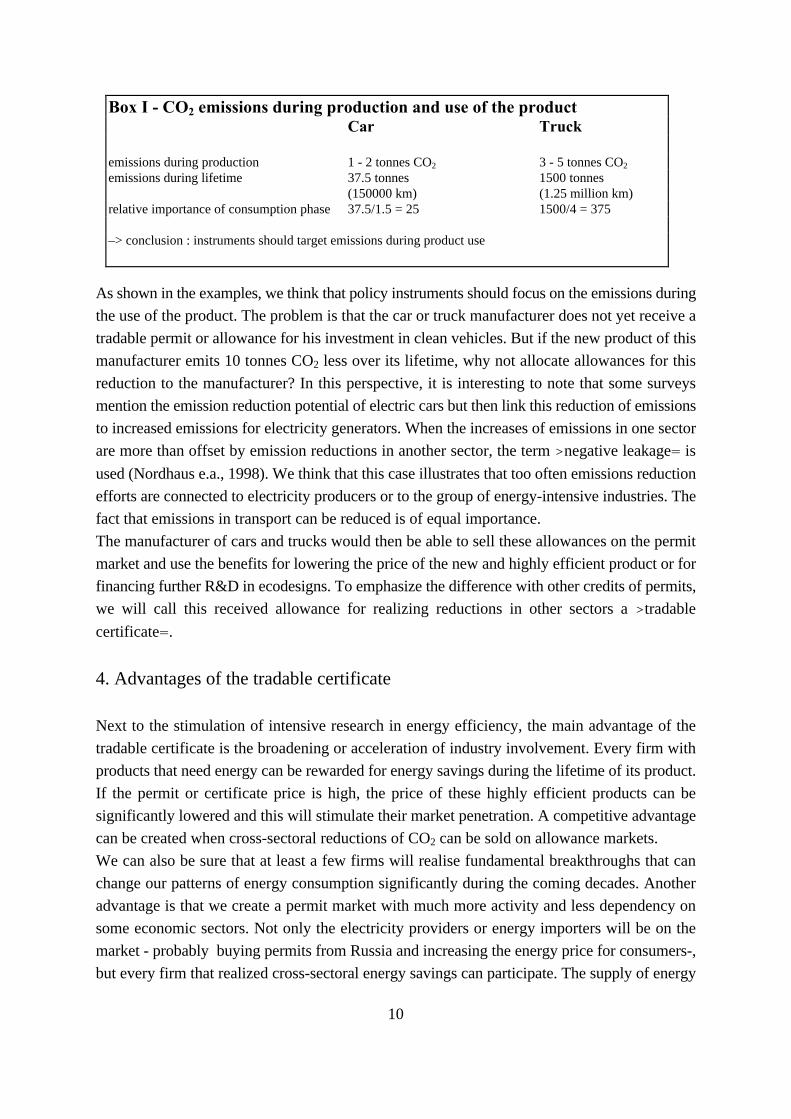
10
As shown in the examples, we think that policy instruments should focus on the emissions duringthe use of the product. The problem is that the car or truck manufacturer does not yet receive atradable permit or allowance for his investment in clean vehicles. But if the new product of thismanufacturer emits 10 tonnes CO2 less over its lifetime, why not allocate allowances for thisreduction to the manufacturer? In this perspective, it is interesting to note that some surveysmention the emission reduction potential of electric cars but then link this reduction of emissionsto increased emissions for electricity generators. When the increases of emissions in one sectorare more than offset by emission reductions in another sector, the term >negative leakage= isused (Nordhaus e.a., 1998). We think that this case illustrates that too often emissions reductionefforts are connected to electricity producers or to the group of energy-intensive industries. Thefact that emissions in transport can be reduced is of equal importance.The manufacturer of cars and trucks would then be able to sell these allowances on the permitmarket and use the benefits for lowering the price of the new and highly efficient product or forfinancing further R&D in ecodesigns. To emphasize the difference with other credits of permits,we will call this received allowance for realizing reductions in other sectors a >tradablecertificate=.
4. Advantages of the tradable certificate
Next to the stimulation of intensive research in energy efficiency, the main advantage of thetradable certificate is the broadening or acceleration of industry involvement. Every firm withproducts that need energy can be rewarded for energy savings during the lifetime of its product.If the permit or certificate price is high, the price of these highly efficient products can besignificantly lowered and this will stimulate their market penetration. A competitive advantagecan be created when cross-sectoral reductions of CO2 can be sold on allowance markets.We can also be sure that at least a few firms will realise fundamental breakthroughs that canchange our patterns of energy consumption significantly during the coming decades. Anotheradvantage is that we create a permit market with much more activity and less dependency onsome economic sectors. Not only the electricity providers or energy importers will be on themarket - probably buying permits from Russia and increasing the energy price for consumers-,but every firm that realized cross-sectoral energy savings can participate. The supply of energy
Box I - CO2 emissions during production and use of the productCar Truck
emissions during production 1 - 2 tonnes CO2 3 - 5 tonnes CO2emissions during lifetime 37.5 tonnes 1500 tonnes
(150000 km) (1.25 million km)relative importance of consumption phase 37.5/1.5 = 25 1500/4 = 375
–> conclusion : instruments should target emissions during product use
11
efficiency will come from many parties. The stricter the caps imposed on the main emittingsectors, the more attractive their efficiency gains.Some other issues need to be considered. In the case that manufacturers of cars or refrigeratorscan improve the energy efficiency of their products by making use of light materials or insulationsolutions provided by the chemical or other industries, the allocation of the certificate is partlymade possible by the inputs from other industries. These supply industries could claim a part ofthe certificates for themselves. It would however be very complicated to calculate the specificcontribution of each input in total energy savings. Another option is that car or refrigeratormanufacturers just pay a higher price for these specific inputs. On the other hand, the increasedinterest in energy saving technologies and inputs creates new and important markets for thesesupplying industries. They can increase their sales and this is partly made possible by theallocation of the certificates to the car and refrigerator industries.If we introduce certificates for car manufacturers or other sectors to increase their CO2 emissionsduring production, it is clear that the allocation of other - probably grandfathered - emissionrights needs to be reduced. Otherwise, total emissions would increase. In our later model, we willexplain that each year only a part of total received certificates will be available on the market foremission rights. We suggest that this annual inflow of certificates on the emission market willbe deducted from the annual allocation that is planned for the country or industries in theanalysis. Compared to the Early Credit, the main difference is the cross-sectoral incentive to improveenergy efficiency. Many aspects associated with the Early Credit are also valid for the tradablecertificate : reward real reductions and not gaming, no predetermination of the eventual domesticregulatory program to control domestic GHG emissions, focus is on domestic early action, amechanism that is not made contingent upon ratification of the Kyoto or later protocols,...If the tradable certificate were developed as a voluntary mechanism, it would provide at themoment of the introduction of international emission trading some form of recognition for pastvoluntary GHG emissions. This should be preferred compared to a grandfathering mechanismthat does not include past efforts. This is an important aspect since most observers estimate thatinternational trading of emissions will not be a reality before 2004.
5. Performance standards
If we want to allocate certificates based on improved energy efficiency, a baseline to measure theefficiency gains is needed. The measurement of the energy efficiency improvement is rather easyto establish. For cars and trucks, detailed information on CO2 emissions per kilometre areavailable in most countries. In our example, we calculated the efficiency gain as the reductionof emissions per kilometre.Electronic devices need electricity and their electricity consumption is expressed in kilowatt-hours (kWh). In Europe, the most efficient refrigerators are already differentiated form the least
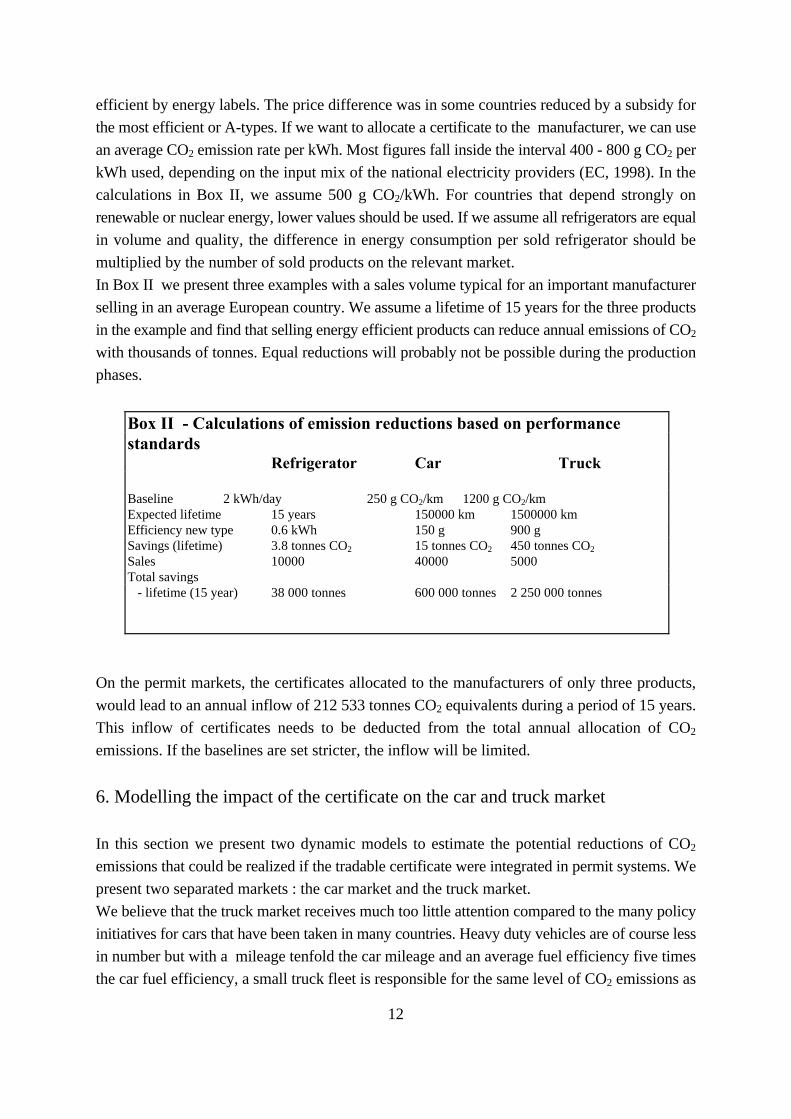
12
efficient by energy labels. The price difference was in some countries reduced by a subsidy forthe most efficient or A-types. If we want to allocate a certificate to the manufacturer, we can usean average CO2 emission rate per kWh. Most figures fall inside the interval 400 - 800 g CO2 perkWh used, depending on the input mix of the national electricity providers (EC, 1998). In thecalculations in Box II, we assume 500 g CO2/kWh. For countries that depend strongly onrenewable or nuclear energy, lower values should be used. If we assume all refrigerators are equalin volume and quality, the difference in energy consumption per sold refrigerator should bemultiplied by the number of sold products on the relevant market.In Box II we present three examples with a sales volume typical for an important manufacturerselling in an average European country. We assume a lifetime of 15 years for the three productsin the example and find that selling energy efficient products can reduce annual emissions of CO2
with thousands of tonnes. Equal reductions will probably not be possible during the productionphases.
On the permit markets, the certificates allocated to the manufacturers of only three products,would lead to an annual inflow of 212 533 tonnes CO2 equivalents during a period of 15 years.This inflow of certificates needs to be deducted from the total annual allocation of CO2
emissions. If the baselines are set stricter, the inflow will be limited.
6. Modelling the impact of the certificate on the car and truck market
In this section we present two dynamic models to estimate the potential reductions of CO2
emissions that could be realized if the tradable certificate were integrated in permit systems. Wepresent two separated markets : the car market and the truck market.We believe that the truck market receives much too little attention compared to the many policyinitiatives for cars that have been taken in many countries. Heavy duty vehicles are of course lessin number but with a mileage tenfold the car mileage and an average fuel efficiency five timesthe car fuel efficiency, a small truck fleet is responsible for the same level of CO2 emissions as
Box II - Calculations of emission reductions based on performancestandards
Refrigerator Car Truck
Baseline 2 kWh/day 250 g CO2/km 1200 g CO2/kmExpected lifetime 15 years 150000 km 1500000 kmEfficiency new type 0.6 kWh 150 g 900 gSavings (lifetime) 3.8 tonnes CO2 15 tonnes CO2 450 tonnes CO2Sales 10000 40000 5000Total savings - lifetime (15 year) 38 000 tonnes 600 000 tonnes 2 250 000 tonnes
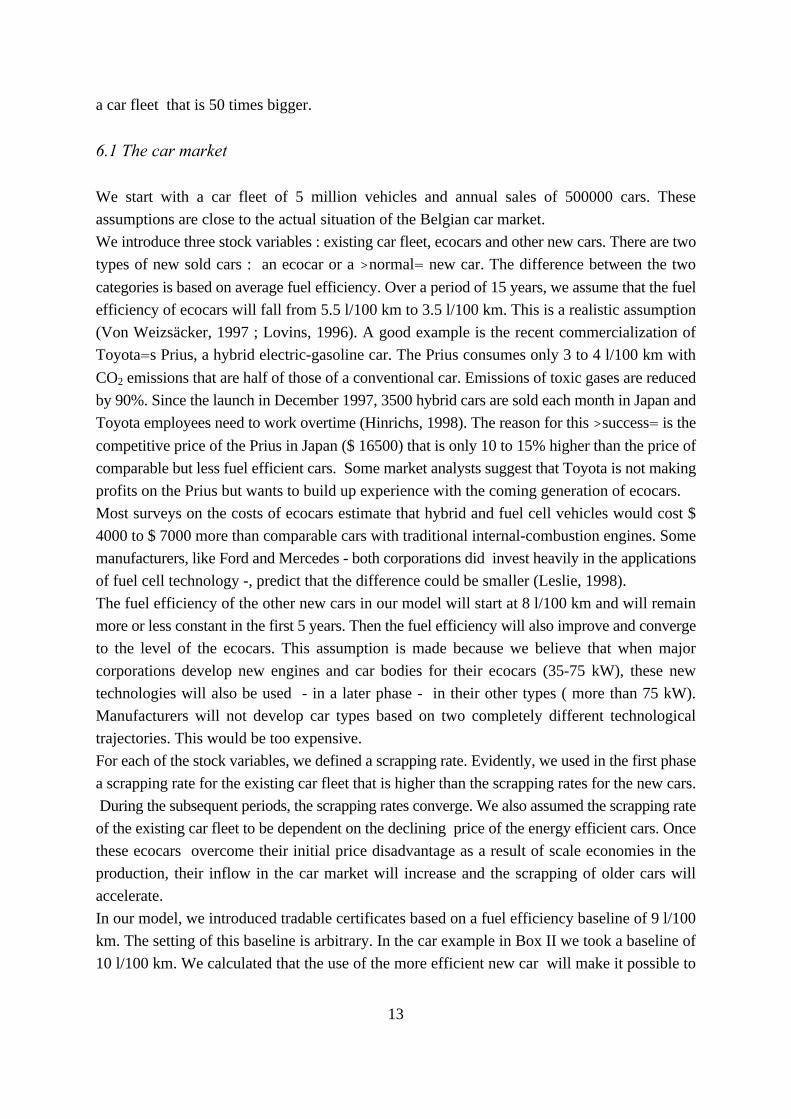
13
a car fleet that is 50 times bigger.
6.1 The car market
We start with a car fleet of 5 million vehicles and annual sales of 500000 cars. Theseassumptions are close to the actual situation of the Belgian car market.We introduce three stock variables : existing car fleet, ecocars and other new cars. There are twotypes of new sold cars : an ecocar or a >normal= new car. The difference between the twocategories is based on average fuel efficiency. Over a period of 15 years, we assume that the fuelefficiency of ecocars will fall from 5.5 l/100 km to 3.5 l/100 km. This is a realistic assumption(Von Weizsäcker, 1997 ; Lovins, 1996). A good example is the recent commercialization ofToyota=s Prius, a hybrid electric-gasoline car. The Prius consumes only 3 to 4 l/100 km withCO2 emissions that are half of those of a conventional car. Emissions of toxic gases are reducedby 90%. Since the launch in December 1997, 3500 hybrid cars are sold each month in Japan andToyota employees need to work overtime (Hinrichs, 1998). The reason for this >success= is thecompetitive price of the Prius in Japan ($ 16500) that is only 10 to 15% higher than the price ofcomparable but less fuel efficient cars. Some market analysts suggest that Toyota is not makingprofits on the Prius but wants to build up experience with the coming generation of ecocars.Most surveys on the costs of ecocars estimate that hybrid and fuel cell vehicles would cost $4000 to $ 7000 more than comparable cars with traditional internal-combustion engines. Somemanufacturers, like Ford and Mercedes - both corporations did invest heavily in the applicationsof fuel cell technology -, predict that the difference could be smaller (Leslie, 1998). The fuel efficiency of the other new cars in our model will start at 8 l/100 km and will remainmore or less constant in the first 5 years. Then the fuel efficiency will also improve and convergeto the level of the ecocars. This assumption is made because we believe that when majorcorporations develop new engines and car bodies for their ecocars (35-75 kW), these newtechnologies will also be used - in a later phase - in their other types ( more than 75 kW).Manufacturers will not develop car types based on two completely different technologicaltrajectories. This would be too expensive.For each of the stock variables, we defined a scrapping rate. Evidently, we used in the first phasea scrapping rate for the existing car fleet that is higher than the scrapping rates for the new cars. During the subsequent periods, the scrapping rates converge. We also assumed the scrapping rateof the existing car fleet to be dependent on the declining price of the energy efficient cars. Oncethese ecocars overcome their initial price disadvantage as a result of scale economies in theproduction, their inflow in the car market will increase and the scrapping of older cars willaccelerate.In our model, we introduced tradable certificates based on a fuel efficiency baseline of 9 l/100km. The setting of this baseline is arbitrary. In the car example in Box II we took a baseline of10 l/100 km. We calculated that the use of the more efficient new car will make it possible to
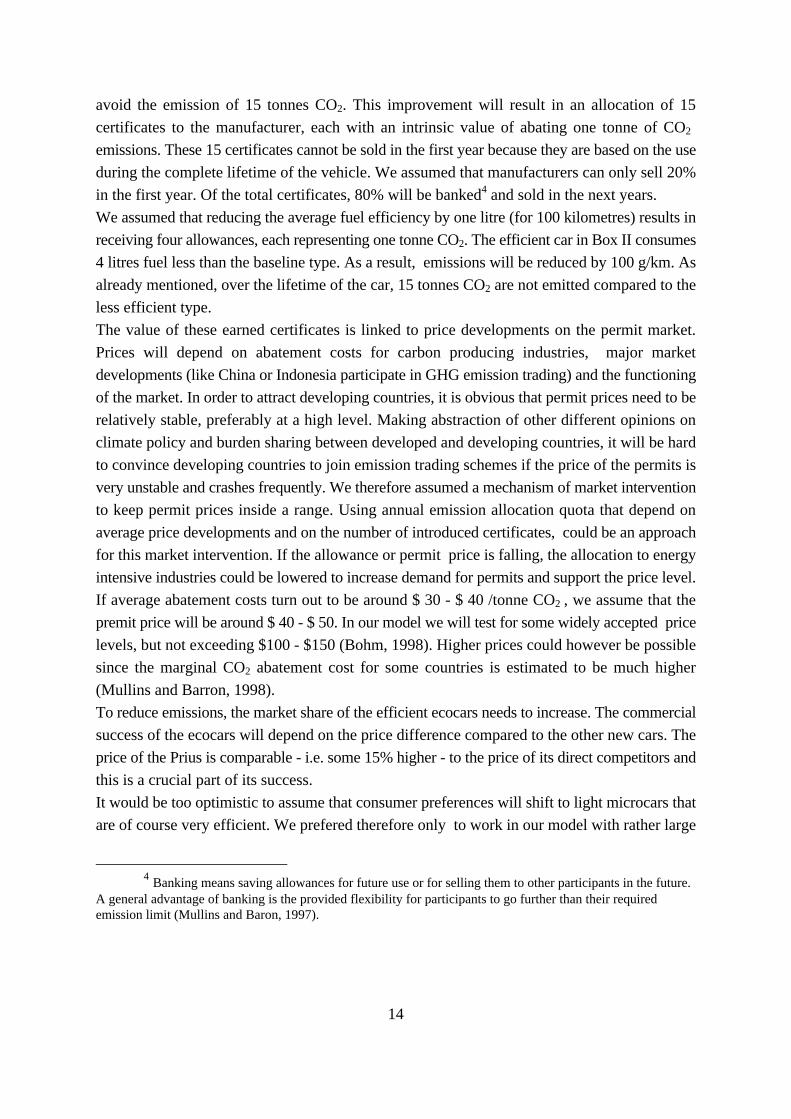
14
avoid the emission of 15 tonnes CO2. This improvement will result in an allocation of 15certificates to the manufacturer, each with an intrinsic value of abating one tonne of CO2
emissions. These 15 certificates cannot be sold in the first year because they are based on the useduring the complete lifetime of the vehicle. We assumed that manufacturers can only sell 20%in the first year. Of the total certificates, 80% will be banked4 and sold in the next years.We assumed that reducing the average fuel efficiency by one litre (for 100 kilometres) results inreceiving four allowances, each representing one tonne CO2. The efficient car in Box II consumes4 litres fuel less than the baseline type. As a result, emissions will be reduced by 100 g/km. Asalready mentioned, over the lifetime of the car, 15 tonnes CO2 are not emitted compared to theless efficient type.The value of these earned certificates is linked to price developments on the permit market.Prices will depend on abatement costs for carbon producing industries, major marketdevelopments (like China or Indonesia participate in GHG emission trading) and the functioningof the market. In order to attract developing countries, it is obvious that permit prices need to berelatively stable, preferably at a high level. Making abstraction of other different opinions onclimate policy and burden sharing between developed and developing countries, it will be hardto convince developing countries to join emission trading schemes if the price of the permits isvery unstable and crashes frequently. We therefore assumed a mechanism of market interventionto keep permit prices inside a range. Using annual emission allocation quota that depend onaverage price developments and on the number of introduced certificates, could be an approachfor this market intervention. If the allowance or permit price is falling, the allocation to energyintensive industries could be lowered to increase demand for permits and support the price level.If average abatement costs turn out to be around $ 30 - $ 40 /tonne CO2 , we assume that thepremit price will be around $ 40 - $ 50. In our model we will test for some widely accepted pricelevels, but not exceeding $100 - $150 (Bohm, 1998). Higher prices could however be possiblesince the marginal CO2 abatement cost for some countries is estimated to be much higher(Mullins and Barron, 1998).To reduce emissions, the market share of the efficient ecocars needs to increase. The commercialsuccess of the ecocars will depend on the price difference compared to the other new cars. Theprice of the Prius is comparable - i.e. some 15% higher - to the price of its direct competitors andthis is a crucial part of its success.
4 Banking means saving allowances for future use or for selling them to other participants in the future.
A general advantage of banking is the provided flexibility for participants to go further than their requiredemission limit (Mullins and Baron, 1997).
It would be too optimistic to assume that consumer preferences will shift to light microcars thatare of course very efficient. We prefered therefore only to work in our model with rather large
15
cars with high comfort levels. Of this car with a high price of $ 30000, only two types are soldon the market. We clearly do not limit the category of ecocars to small cars because we think itis necessary to compare levels of comfort offered by cars. If an ecocar with only two places coststhe same as a small family car with four places, the relative price of the ecocar is de facto twicethe price of the other car. Many very efficient cars are small to reduce weight. This might be apositive development but households with three children that are also interested in efficient cars,are more concerned about the comfort level of their car. So we need to upgrade our averageecocar to the quality level of the average family car. We assume in our model that the ecotypeof the average family car is 15% more expensive compared to the other type. We remind that thedifference is probably smaller, especially for average cars with turbo diesel engines. In mostcountries, cars with the very efficient turbo diesel engines of Volkswagen and Seat cost some5 to 10% more than the models of their competitors. The assumptions in our model are thereforerather conservative. If price differences are smaller, many stories like the Prius would follow. The same conclusion holds when the market share of small cars would increase.Production prices of ecocars will fall as a result of economies of scale. For the new engines andmaterials, the economies of scale will be more important than for existing models.We further assumed that prices to consumers will be reduced by the total actual value of thecertificates that will be allocated to the manufacturer when selling an ecocar. We assumed thatthe banked certificates will not lose or gain value.It is clear that buyers will only opt for the ecocar if the price is good and the comfort levelcomparable. In our model, 500000 new cars will be sold each year. If the price of the veryefficient car equals the price of the other car, we assume that the market share of the ecocars willbe 75% because comfort levels are identical. There will always be consumers that do not careabout fuel efficiency and consider other characteristics more important. If the price of the ecocarsis only 5% higher than the price of the other cars, we assume a market share of 30% for theecocars. These buyers include the discounted energy savings in their decision to buy. If the priceof the ecocar is 10% less than the other cars, we assume a market share of 95%.The diffusion of the ecocars and the reduction of CO2 emissions depend mainly on the differencein production cost and the value of the certificates that the producers of ecocars receive more thanthe producers of the other cars. If the baseline is set at 9 l/100 km, for every new sold car certificates will be received. Box III summarizes the main interactions that determine the marketshare of ecocars in our model.
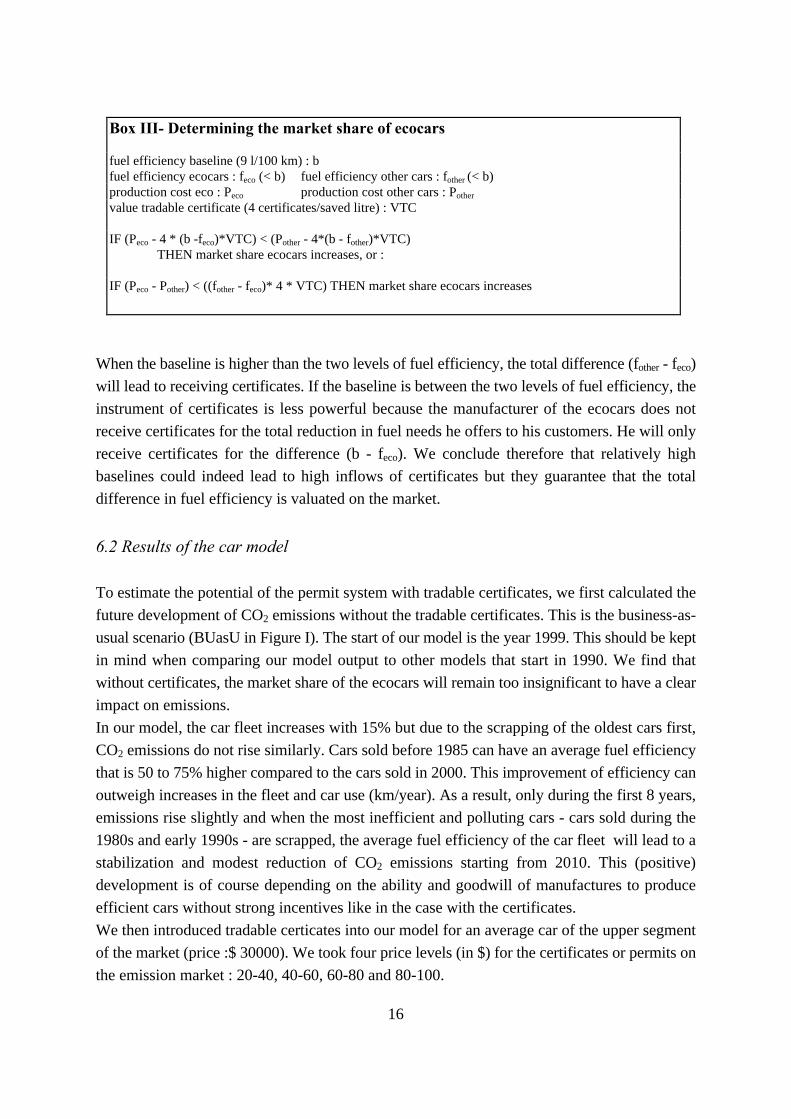
16
When the baseline is higher than the two levels of fuel efficiency, the total difference (fother - feco)will lead to receiving certificates. If the baseline is between the two levels of fuel efficiency, theinstrument of certificates is less powerful because the manufacturer of the ecocars does notreceive certificates for the total reduction in fuel needs he offers to his customers. He will onlyreceive certificates for the difference (b - feco). We conclude therefore that relatively highbaselines could indeed lead to high inflows of certificates but they guarantee that the totaldifference in fuel efficiency is valuated on the market.
6.2 Results of the car model
To estimate the potential of the permit system with tradable certificates, we first calculated thefuture development of CO2 emissions without the tradable certificates. This is the business-as-usual scenario (BUasU in Figure I). The start of our model is the year 1999. This should be keptin mind when comparing our model output to other models that start in 1990. We find thatwithout certificates, the market share of the ecocars will remain too insignificant to have a clearimpact on emissions.In our model, the car fleet increases with 15% but due to the scrapping of the oldest cars first,CO2 emissions do not rise similarly. Cars sold before 1985 can have an average fuel efficiencythat is 50 to 75% higher compared to the cars sold in 2000. This improvement of efficiency canoutweigh increases in the fleet and car use (km/year). As a result, only during the first 8 years,emissions rise slightly and when the most inefficient and polluting cars - cars sold during the1980s and early 1990s - are scrapped, the average fuel efficiency of the car fleet will lead to astabilization and modest reduction of CO2 emissions starting from 2010. This (positive)development is of course depending on the ability and goodwill of manufactures to produceefficient cars without strong incentives like in the case with the certificates.We then introduced tradable certicates into our model for an average car of the upper segmentof the market (price :$ 30000). We took four price levels (in $) for the certificates or permits onthe emission market : 20-40, 40-60, 60-80 and 80-100.
Box III- Determining the market share of ecocars
fuel efficiency baseline (9 l/100 km) : bfuel efficiency ecocars : feco (< b) fuel efficiency other cars : fother (< b)production cost eco : Peco production cost other cars : Pothervalue tradable certificate (4 certificates/saved litre) : VTC
IF (Peco - 4 * (b -feco)*VTC) < (Pother - 4*(b - fother)*VTC)THEN market share ecocars increases, or :
IF (Peco - Pother) < ((fother - feco)* 4 * VTC) THEN market share ecocars increases

17
From Figure I - permit price ranges are indicated as ppr[,] - it is clear that the reduction of CO2
emissions strongly depends on the introduction of the certificate. However, the differences foreach price interval are small once prices on the permit market exceed $ 40. The patternspresented in Figure I are trend lines derived from numerous runs for each permit price interval.For each run, random permit prices were selected out of the relevant price interval.
Figure I - CO2 emissions of the car fleet (million tonnes, 15 years)
Since our baseline remains at 9 l/100 km, there is a strong incentive for the most efficientmanufacturers but certificates will also be received by other manufacturers. As a result, the levelof the total reduction depends also on the improved fuel efficiency for the other cars. Theimproved average efficiency of all new cars is as important as the market share of ecocars.Compared to the scenario without certificates (business-as-usual), the reductions of CO2
emissions range between 25 and 38%, depending on the value of the certificate. Compared to thelevel of emissions in the first year of the model, the reductions are even higher : from 32 to 43%.If we had included in our model an increasing market share for small cars, the reductions wouldhave been even more impressive. Since emissions from transport are assumed to increase morethan emissions from other sources - for the European Union, transport emissions are projectedto increase by 39% for the period 1990-2010 if no measures are taken (COM(97)481) - thepotential of our instrument proves to be very attractive, even when working with this marketsegment of expensive cars. For smaller ecocars, compared to other cars of average size, the value
150
200
250
300
350
400
0 1 2 3 4 5 6 7 8 9 10 11 12 13 14 15
BUasU ppr[20,40] ppr[40,60]ppr[60,80] ppr[80,100]
18
of the certificates will lead to a more explicit price advantage.
6.3 The truck market
We developed a similar model for heavy duty trucks, starting from 16 tonnes. The success of CO2
policies will also depend on evolutions in fuel efficiency for these vehicles. Many authors whowrite on the car market assume that developments for the truck market will be similar. There arehowever a few fundamental differences.First of all, the truck market is more competitive than the car market. Buyers are very interestedin the energy consumption of the truck they will use for many kilometres. The strong competitionon the transportation market guarantees that transportation firms want to lower their energy costs.If the price of the most efficient trucks will fall, the reaction of transporters would be significantand the market share of ecotrucks would increase strongly.Another difference with evolutions on the car market is related to the link between fuel efficiencyand payload. The fuel efficiency of cars can be improved by reducing the weight of the cars.Trucks are developed to transport a heavy load. The use of weightsaving materials in theproduction of trucks will not yield similar results as in the car industry because the load remainsheavy. The heavy load also has other implications. The average fuel efficiency of heavy trucksranges between 30 and 40 litres for 100 km. In very congested traffic, the fuel consumption caneven double. The two most important determinants of the fuel efficiency are not engineperformance aspects but very basic elements : aerodynamics of the truck and load and tirepressure (the latter as a result of the weight of the load). Surprisingly, driving an empty or fullcontainer results in a difference in fuel consumption of only 5 litres. More surprisingly, driving an open (no roof) or closed container results in the same difference, with or without load. Andthe same additional 5 litres will also be consumed when the tire pressure is 25% below theoptimal level (8 to 8.5 bar).A rather conterintuitive difference is that for heavy vehicles, cleaner engines are less fuelefficient engines. There is generally a trade-off between exhaust emissions and fuel consumption(Samuelsson, 1998). Reducing emissions of pollutants did result in increased fuel consumptionof turbo diesel engines. This depends to a large extent on the link beteen NOX (nitrogen oxides)emissions and fuel efficiency. And from Table II, it follows that the focus of emission reductionrequirements by the EC has been on reducing NOX.The relationship between NOX and fuel consumption is shown in Figure II.. The emissions ofturbo diesel engines depends on the timing of the injection. When the injection is retarded, theemissions of NOX (g/kWh) will be reduced but the fuel consumption will increase. The challengein most engineering departments of truck manufacturers is to anticipate the stricter Euro IIIstandard while keeping fuel consumption stable. For SCANIA, it is expected that fuelconsumption will increase by 0.5 to one litre per 100 kilometres as a result of the Euro IIIstandard. For other manufacturers that are less advanced in the reduction in NOX, the increase

19
in fuel consumption is expected to be up to 5 litres! This is a good illustration of the benefitsfrom investing first in clean technologies.
Table II - Development of emission requirements for trucks, g/kWh, 1989-1999
Standard Year NOX HC CO Particulates
ECE R 49 1982 18 3.5 14 -
Germany 1986 14.4 2.8 11.2 -
EEC 1990 14.4 2.4 11.2 -
Euro I 1992-development1992-commercial
8.09.0
1.11.25
4.55.0
0.360.40
Euro II 1995/1996 7.0 1.1 4.0 0.15
Euro III 1999 under disc. u.d. u.d u.d.
SCANIA 1989 14 0.5 1 -
SCANIA 1991 7.8 0.5 1 0.25
Source : SCANIA, 1998
Figure II - Relationship between NOX and fuel consumption (diesel engines)
Source : Nylin, 1991
As a result of this trade-off, we cannot expect that the average fuel efficiency of the truck fleetwill be strongly reduced in a few years. It will take more time. Furthermore, it is not speculative
Turbo diesel
Turbo dieselwith charge - air cooling
NOX (g/kWh)
fuel consumption
retardedinjectiontiming
advanced injection timing
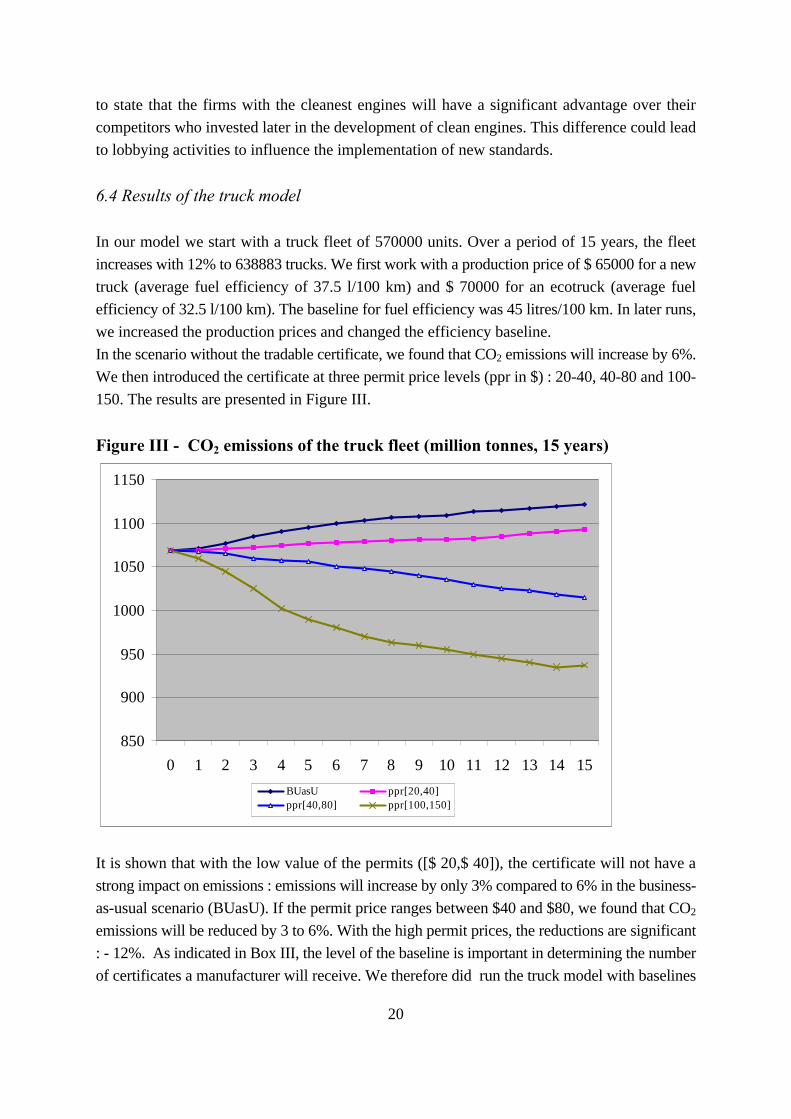
20
to state that the firms with the cleanest engines will have a significant advantage over theircompetitors who invested later in the development of clean engines. This difference could leadto lobbying activities to influence the implementation of new standards.
6.4 Results of the truck model
In our model we start with a truck fleet of 570000 units. Over a period of 15 years, the fleetincreases with 12% to 638883 trucks. We first work with a production price of $ 65000 for a newtruck (average fuel efficiency of 37.5 l/100 km) and $ 70000 for an ecotruck (average fuelefficiency of 32.5 l/100 km). The baseline for fuel efficiency was 45 litres/100 km. In later runs,we increased the production prices and changed the efficiency baseline.In the scenario without the tradable certificate, we found that CO2 emissions will increase by 6%.We then introduced the certificate at three permit price levels (ppr in $) : 20-40, 40-80 and 100-150. The results are presented in Figure III.
Figure III - CO2 emissions of the truck fleet (million tonnes, 15 years)
It is shown that with the low value of the permits ([$ 20,$ 40]), the certificate will not have astrong impact on emissions : emissions will increase by only 3% compared to 6% in the business-as-usual scenario (BUasU). If the permit price ranges between $40 and $80, we found that CO2
emissions will be reduced by 3 to 6%. With the high permit prices, the reductions are significant: - 12%. As indicated in Box III, the level of the baseline is important in determining the numberof certificates a manufacturer will receive. We therefore did run the truck model with baselines
850
900
950
1000
1050
1100
1150
0 1 2 3 4 5 6 7 8 9 10 11 12 13 14 15BUasU ppr[20,40]ppr[40,80] ppr[100,150]
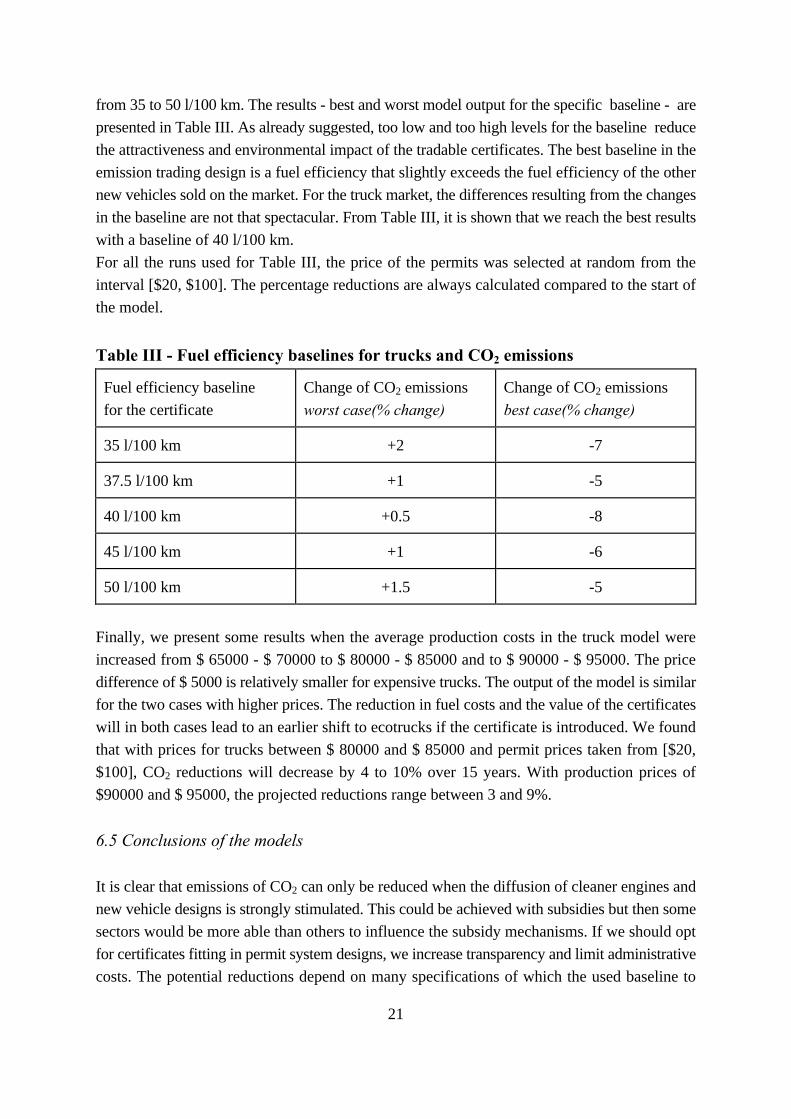
21
from 35 to 50 l/100 km. The results - best and worst model output for the specific baseline - arepresented in Table III. As already suggested, too low and too high levels for the baseline reducethe attractiveness and environmental impact of the tradable certificates. The best baseline in theemission trading design is a fuel efficiency that slightly exceeds the fuel efficiency of the othernew vehicles sold on the market. For the truck market, the differences resulting from the changesin the baseline are not that spectacular. From Table III, it is shown that we reach the best resultswith a baseline of 40 l/100 km.For all the runs used for Table III, the price of the permits was selected at random from theinterval [$20, $100]. The percentage reductions are always calculated compared to the start ofthe model.
Table III - Fuel efficiency baselines for trucks and CO2 emissions
Fuel efficiency baselinefor the certificate
Change of CO2 emissionsworst case(% change)
Change of CO2 emissionsbest case(% change)
35 l/100 km +2 -7
37.5 l/100 km +1 -5
40 l/100 km +0.5 -8
45 l/100 km +1 -6
50 l/100 km +1.5 -5
Finally, we present some results when the average production costs in the truck model wereincreased from $ 65000 - $ 70000 to $ 80000 - $ 85000 and to $ 90000 - $ 95000. The pricedifference of $ 5000 is relatively smaller for expensive trucks. The output of the model is similarfor the two cases with higher prices. The reduction in fuel costs and the value of the certificateswill in both cases lead to an earlier shift to ecotrucks if the certificate is introduced. We foundthat with prices for trucks between $ 80000 and $ 85000 and permit prices taken from [$20,$100], CO2 reductions will decrease by 4 to 10% over 15 years. With production prices of$90000 and $ 95000, the projected reductions range between 3 and 9%.
6.5 Conclusions of the models
It is clear that emissions of CO2 can only be reduced when the diffusion of cleaner engines andnew vehicle designs is strongly stimulated. This could be achieved with subsidies but then somesectors would be more able than others to influence the subsidy mechanisms. If we should optfor certificates fitting in permit system designs, we increase transparency and limit administrativecosts. The potential reductions depend on many specifications of which the used baseline to
22
allocate the certificates might be an important one. With realistic permit prices, we found thatthe system with tradable certificates offers very significant reduction potentials, especially forthe car market. For the truck market, the reduction potential is more limited but still veryinteresting.
7. The case of permits for scrapping
The tradable certificate, like we have presented it, receives its value from avoiding CO2
emissions. We found another case related to cars - especially to very old cars - where permitswere also allocated as a result of avoided emissions. There are however many differences in thecase that we will briefly present. The term >permit= is here an air quality permit, like city andcounty permits and should not be compared with permits in emission trading.The Clain Air Act amendements of 1990 required US states to consider possible remedies forpollution from old cars. These cars pose serious problems. Tests in the early 1990s on thousandsof vehicles in Los Angeles, Chicago and elsewhere showed that 50% of all carbonmonoxide(CO) emissions came from only 10% of the cars on the road. Similarly, half of the hydrocarbons(HC) were emitted by 14% of the vehicles (Totten and Settina, 1993).A few programs were established to accelerate the scrapping of these older cars. The first wasSCRAP (South Coast Recycled Auto Project). SCRAP could offer $ 700 to each owner that soldhis old car. Compared to our case, SCRAP gave the owner the certificate for avoided emissionsand he sold it immediately on the CO- or HC-market for $ 700. In the first phase of SCRAP,8400 cars were bought. This resulted in the elimination of 13 million pounds of pollutants fromthe air. To make the program more attractive, participation of other corporations could bestimulated by linking their construction permits to proven reductions from other sources. Thesefirms would then estimate their future emissions and buy the necessary number of old cars to>offset= their own pollution debt (Totten and Settina, 1993).Another program is the Bay Area Vehicle Buy Back program (San Francisco). Since 1996, thisprogram has already bought 2000 old cars and paid each owner $500 (BAAQMD, 1998). Byrecently adding 1980 and 1981 model years to the program, the potential pool of eligible vehiclesin the Bay Area approximates 100000 vehicles, each 5 to 50 times more polluting than new cars.Almost every environmental program receives criticism from action groups but these scrappingprograms were opposed by some unexpected groups next to environmental organizations.Associations of collectors of old cars tried to stop the scrapping because the prices of spare partsfor collectors would increase as a result of the scarcity. Some of these groups used howeverinteresting arguments to oppose the scrapping5. They stated that when the pollution creditsresulting from the scrapping are applied for permitting new plants - and this was the basic
5 An overview of the position of these groups with economic and environmental arguments can be
found at <http://home.fuse.net/sdun/Scrappage.htm> (visited 16/10/98).
23
principle when introducing SCRAP -, there is no net change in emissions and air quality. Whenthe owners who scrapped their old car, replace this vehicle by another relatively old and dirty car,total emissions could even increase.Environmental groups complained that some cars for which their owner received the scrappingpremium were barely running. They argue that the realized reductions by the program are muchlower.
8. Conclusions
Starting from reliable data on CO2 emissions during the production and the use of cars andtrucks, we found that opportunities for reducing emissions are impressive in the consumption phase. Emissions during the production phase are almost negligible compared to emissionsduring the use of the vehicles. The only available instruments that directly influence energy useby households and industry are energy taxes. The price elasticity of energy used in tranport ishowever much too low to have a significant impact on transport emissions. It is striking that inevery developed country, even in those with the highest energy taxes, transport emissionscontinue to increase. New instruments should therefore focus on emissions during the phase ofproduct use or lifetime but current designs and proposals for tradable CO2 emission systems donot provide incentives to stimulate cross-sectoral energy efficiency investments. We argue thatmanufacturers should be rewarded for their products when they make it possible for consumersto save energy during consumption.To modify these designs, we introduced the concept of a >tradable certificate=, an allowancefor each tonne CO2 avoided as a result of selling a vehicle that is much more energy efficient thanother new vehicles. We then developed two dynamic models in which we linked the value ofthese certificates to the diffusion of the cleanest vehicles. We found that the introduction of thecertificate in tradable permit systems did lead to very significant reductions of CO2 emissions.Emissions resulting from the car fleet will be reduced by 25 to 38% over a period of 15 years(starting in 1999). The accelerated scrapping of old and energy inefficient cars is also veryimportant in this process.The potential of the new instrument is less spectacular for the truck market as a result of somefundamental technological differences. But when the value of the certificate would be highenough, emissions resulting from the truck fleet could be reduced by 12% over the same period.
24
References
Albrecht, J. (1998). Environmental consumer subsidies and potential reductions of CO2 emissions. Working PaperNr.98/59 Universiteit Gent, Faculteit Economie en Bedrijfskunde.
Bay Area Air Quality Management District (1998). Retire >81 and older vehicles. Press Release August 1998.(<http://www.baaqmd.gov/pie/press/>)
Bohm, P. (1998). Benefits of international carbon emissions trading : theory and experimental evidence. StockholmUniversity, Department of Economics, mimeo
CEFIC Comments (12/06/1998). Post-Kyoto views on climate policy.
COM(97)481 Climate Change (European Commission, Brussels).
Environmental Defense Fund (1998). >Credit for Voluntary Early Action Act= sunmitted to Congress.(<http://www.edf.org/issues/newbill.html>, visted 19/11/1998
European Commission (1998). Domestic tradable quotas as an instrument to reduce carbon dioxide emissions(Proceedings of the domestic tradable quotas workshop, Brussels, 1-2 July, 1998).
European Commission (1998b). Press Release, ip/98/234
Hinchy, M., Fisher, B. and Graham, B. (1998). Emissions trading in Australia : developing a framework. ClimateChange Newsletter, Volume 10 Number 2, May 1998.
Hinrichs, D. (1998). Green cars : start your engines. Enviroworld, February 1998.(<http://enviroworld.com/February98/031298.HTML>, visited 20/6/98)
Leslie, J. (1997). Dawn of the hydrogen age. Wired Magazine 5.10, October 1997.
Lovins A., Brylawski, M., Cramer, D. and Moore, T. (1996). Hypercars : materials, manufacturing and policyimplications (The Hypercar Center, Rocky Mountain Institute, Colorado).
Mullins, F. and Baron, R. (1997). International GHG emission trading. Annex I Expert Group on the UNFCCC,Policies and Measures for Common Action Working Paper 9.
Nordhaus, R., Fotis, S. and Van Ness Feldman, P. (1998). Analysis of early action crediting proposals (Pew centeron Global Climate Change, Washington D.C.)
Nylin , S. (1991). Emission regulations today and tomorrow, in ; SCANIA (1991). The diesel engine and theenvironment
Public Citizen (1990). Driving up the heat : a buyers guide to automobiles, fuel efficiency and global warming(Public Citizen, Washington DC).
Rocky Mountains Institute (1998). A typical 1995 U.S. family car.
Samuelsson, H.(1998). Scania launches low-emission engines for city environments (Scania press release, 1 Sept1998), <http://www.scania.com/news/archive/>
SCANIA (1998). Efficiency of diesel engines. Slides provided by SCANIA Training Belgium.
Tietenberg, T. (1997). Tradable permits and the control of air pollution in the United States. Colby College,Department of Economics, mimeo (written for the 10th anniversary jubilee edition of the Zeitschrift Für AngewandteUmweltforschung)
Totten, M. and Settina, N. (1993). Energy wise options for state and local governments (Center for PolicyAlternatives, Washington).
United Nations Conference on Trade and Development (1998). Greenhouse gas emissions trading. Defining theprinciples, modalities, rules and guidelines for verification, reporting & accountability.

25
United Nations Framework Convention on Climate Change (1997), Kyoto Protocol to the UNFCCC,FCCC/CP/1997/L.7/Add.1, 10 December 1997
United States Environmental Protection Agency (1997). Acid rain program. 1996 compliance report (Office of Airand Radiation, EPA 430-R-97-025, June 1997)
Volvo (1998a). Environmental data for Volvo production plants, 1997.
Volvo (1998b). Environmental report 1997.
Von Weizsäcker, E., Lovins, A. and Lovins L. (1997). Factor four. Doubling wealth - halving resource use. The newreport to the Club of Rome. (Earthscan Publication Ltd, London).
Zhang, Z. (1998). Towards a successful international greenhouse gas emissions trading. University of Groningen,Faculty of Law and Faculty of Economics, mimeo
1
Voluntary Agreements with Emission Trading Options in Climate Policy
Johan Albrecht and Delphine François, Ghent University (CEEM)
ABSTRACTRecent political and corporate initiatives indicate that voluntary agreements and emission trading will play a
crucial role in climate policy. We show that when emission trading is integrated as an option in voluntary
agreement contracts, the overall efficiency of the use of flexible climate policy instruments is strongly
increased. The emission trading option, formalized as a CO2 allowance call option contract that can be traded,
provides clear incentives to overcomply with the target of the voluntary agreement. The option mechanism
also delivers a market price for eventual non-compliance, based on differences in abatement costs. With an
example, we illustrate that the option mechanism can result in stimulating financial benefits for the firms that
are most succesful in reducing emissions.
1. Introduction
At the 1997 Kyoto Conference of Parties, developed countries agreed to set reduction
targets for carbon dioxide (CO2) and five other greenhouse gas emissions as a first step to
stabilize the atmospheric concentration levels of these heat-trapping gases. For this
purpose, the use of flexible instruments like emission trading has been integrated in the
Kyoto Protocol. The Kyoto Protocol also foresees that the set of flexible instruments needs
to be further developed. Voluntary approaches have already been considered since the Rio
Conference in 1992.
In this paper, we first briefly present some experiences with voluntary instruments and
emission trading. Although both instruments have similar goals, there are no formal
connecting mechanisms. The flexibility that both instruments are expected to offer depends
on aspects like the emission reduction target. Strong economic growth renders absolute
reduction targets more challenging while economic recessions offer ‘opportunities’ to
overcomply. In the later sections we will focus on the opportunities to motivate firms to
overcomply when this is technically possible.
In the final section, we propose a combined instrument to reduce industrial greenhouse gas
emissions : a voluntary agreement with an emission trading option.
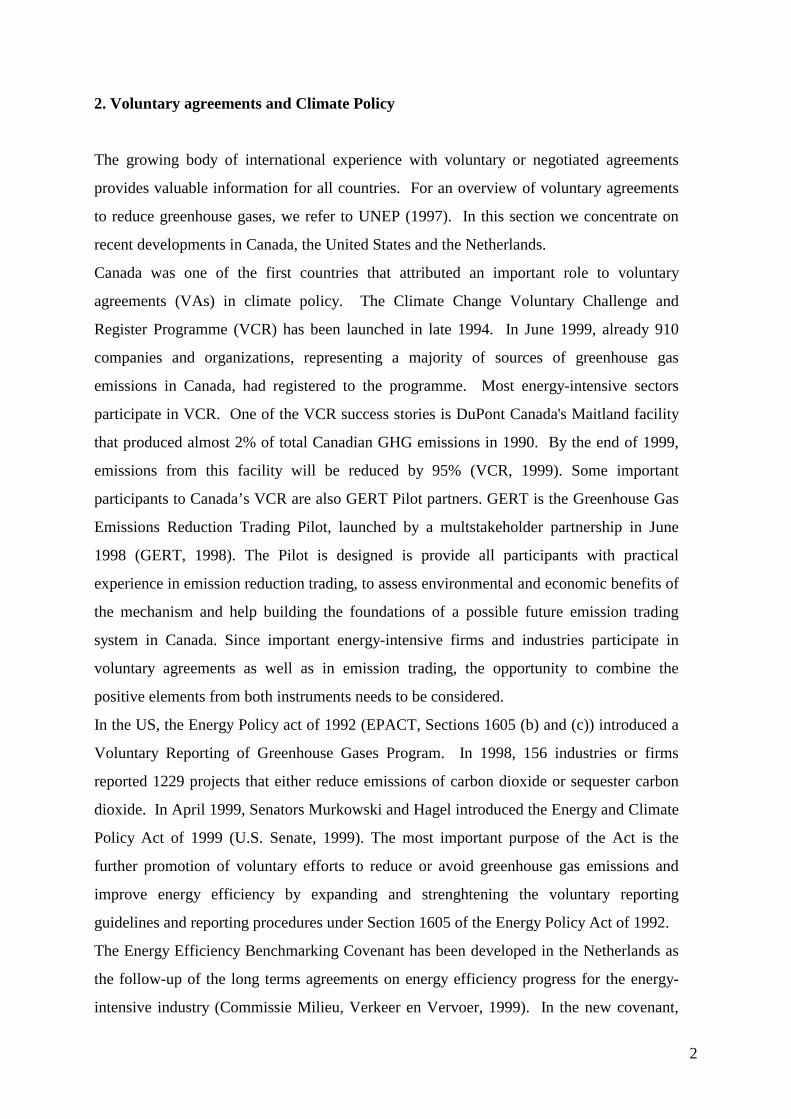
2
2. Voluntary agreements and Climate Policy
The growing body of international experience with voluntary or negotiated agreements
provides valuable information for all countries. For an overview of voluntary agreements
to reduce greenhouse gases, we refer to UNEP (1997). In this section we concentrate on
recent developments in Canada, the United States and the Netherlands.
Canada was one of the first countries that attributed an important role to voluntary
agreements (VAs) in climate policy. The Climate Change Voluntary Challenge and
Register Programme (VCR) has been launched in late 1994. In June 1999, already 910
companies and organizations, representing a majority of sources of greenhouse gas
emissions in Canada, had registered to the programme. Most energy-intensive sectors
participate in VCR. One of the VCR success stories is DuPont Canada's Maitland facility
that produced almost 2% of total Canadian GHG emissions in 1990. By the end of 1999,
emissions from this facility will be reduced by 95% (VCR, 1999). Some important
participants to Canada’s VCR are also GERT Pilot partners. GERT is the Greenhouse Gas
Emissions Reduction Trading Pilot, launched by a multstakeholder partnership in June
1998 (GERT, 1998). The Pilot is designed is provide all participants with practical
experience in emission reduction trading, to assess environmental and economic benefits of
the mechanism and help building the foundations of a possible future emission trading
system in Canada. Since important energy-intensive firms and industries participate in
voluntary agreements as well as in emission trading, the opportunity to combine the
positive elements from both instruments needs to be considered.
In the US, the Energy Policy act of 1992 (EPACT, Sections 1605 (b) and (c)) introduced a
Voluntary Reporting of Greenhouse Gases Program. In 1998, 156 industries or firms
reported 1229 projects that either reduce emissions of carbon dioxide or sequester carbon
dioxide. In April 1999, Senators Murkowski and Hagel introduced the Energy and Climate
Policy Act of 1999 (U.S. Senate, 1999). The most important purpose of the Act is the
further promotion of voluntary efforts to reduce or avoid greenhouse gas emissions and
improve energy efficiency by expanding and strenghtening the voluntary reporting
guidelines and reporting procedures under Section 1605 of the Energy Policy Act of 1992.
The Energy Efficiency Benchmarking Covenant has been developed in the Netherlands as
the follow-up of the long terms agreements on energy efficiency progress for the energy-
intensive industry (Commissie Milieu, Verkeer en Vervoer, 1999). In the new covenant,
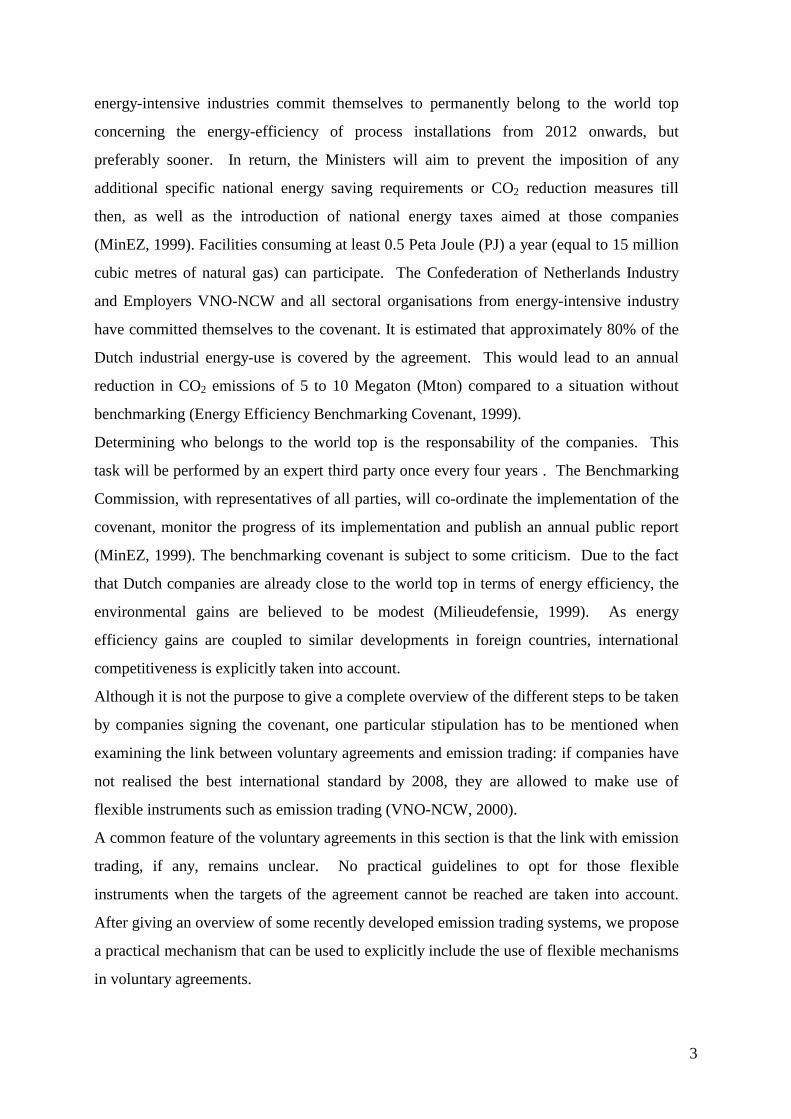
3
energy-intensive industries commit themselves to permanently belong to the world top
concerning the energy-efficiency of process installations from 2012 onwards, but
preferably sooner. In return, the Ministers will aim to prevent the imposition of any
additional specific national energy saving requirements or CO2 reduction measures till
then, as well as the introduction of national energy taxes aimed at those companies
(MinEZ, 1999). Facilities consuming at least 0.5 Peta Joule (PJ) a year (equal to 15 million
cubic metres of natural gas) can participate. The Confederation of Netherlands Industry
and Employers VNO-NCW and all sectoral organisations from energy-intensive industry
have committed themselves to the covenant. It is estimated that approximately 80% of the
Dutch industrial energy-use is covered by the agreement. This would lead to an annual
reduction in CO2 emissions of 5 to 10 Megaton (Mton) compared to a situation without
benchmarking (Energy Efficiency Benchmarking Covenant, 1999).
Determining who belongs to the world top is the responsability of the companies. This
task will be performed by an expert third party once every four years . The Benchmarking
Commission, with representatives of all parties, will co-ordinate the implementation of the
covenant, monitor the progress of its implementation and publish an annual public report
(MinEZ, 1999). The benchmarking covenant is subject to some criticism. Due to the fact
that Dutch companies are already close to the world top in terms of energy efficiency, the
environmental gains are believed to be modest (Milieudefensie, 1999). As energy
efficiency gains are coupled to similar developments in foreign countries, international
competitiveness is explicitly taken into account.
Although it is not the purpose to give a complete overview of the different steps to be taken
by companies signing the covenant, one particular stipulation has to be mentioned when
examining the link between voluntary agreements and emission trading: if companies have
not realised the best international standard by 2008, they are allowed to make use of
flexible instruments such as emission trading (VNO-NCW, 2000).
A common feature of the voluntary agreements in this section is that the link with emission
trading, if any, remains unclear. No practical guidelines to opt for those flexible
instruments when the targets of the agreement cannot be reached are taken into account.
After giving an overview of some recently developed emission trading systems, we propose
a practical mechanism that can be used to explicitly include the use of flexible mechanisms
in voluntary agreements.
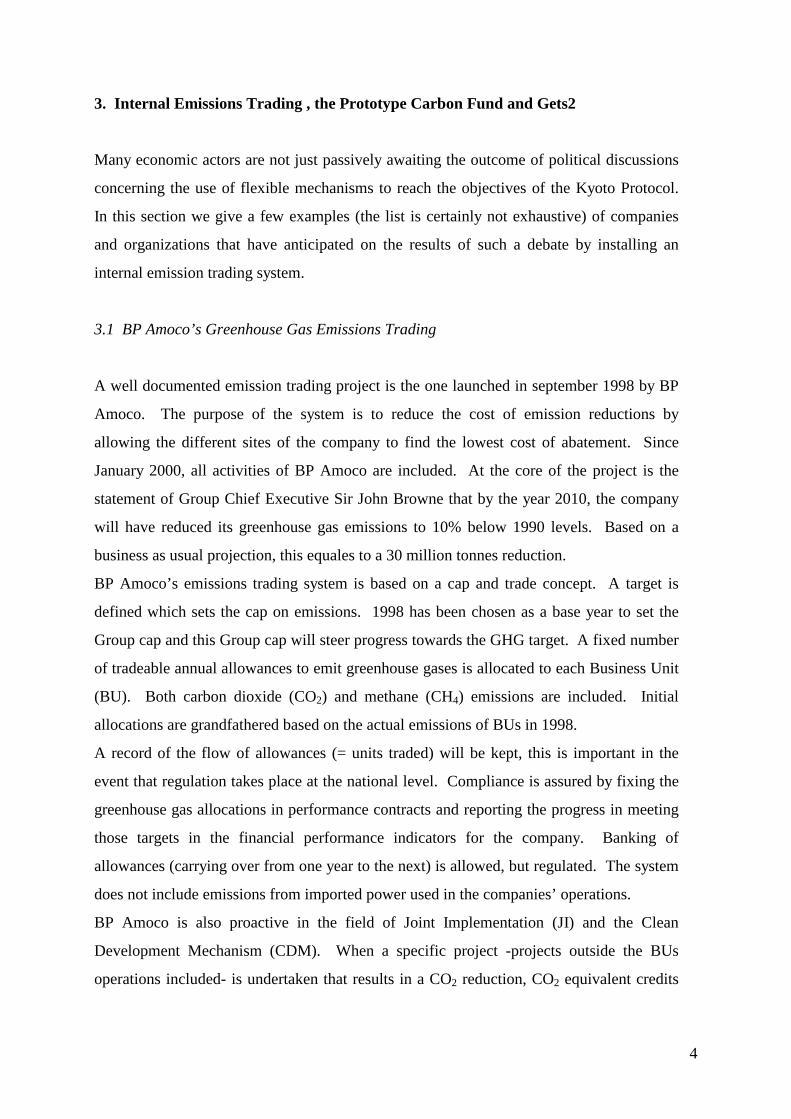
4
3. Internal Emissions Trading , the Prototype Carbon Fund and Gets2
Many economic actors are not just passively awaiting the outcome of political discussions
concerning the use of flexible mechanisms to reach the objectives of the Kyoto Protocol.
In this section we give a few examples (the list is certainly not exhaustive) of companies
and organizations that have anticipated on the results of such a debate by installing an
internal emission trading system.
3.1 BP Amoco’s Greenhouse Gas Emissions Trading
A well documented emission trading project is the one launched in september 1998 by BP
Amoco. The purpose of the system is to reduce the cost of emission reductions by
allowing the different sites of the company to find the lowest cost of abatement. Since
January 2000, all activities of BP Amoco are included. At the core of the project is the
statement of Group Chief Executive Sir John Browne that by the year 2010, the company
will have reduced its greenhouse gas emissions to 10% below 1990 levels. Based on a
business as usual projection, this equales to a 30 million tonnes reduction.
BP Amoco’s emissions trading system is based on a cap and trade concept. A target is
defined which sets the cap on emissions. 1998 has been chosen as a base year to set the
Group cap and this Group cap will steer progress towards the GHG target. A fixed number
of tradeable annual allowances to emit greenhouse gases is allocated to each Business Unit
(BU). Both carbon dioxide (CO2) and methane (CH4) emissions are included. Initial
allocations are grandfathered based on the actual emissions of BUs in 1998.
A record of the flow of allowances (= units traded) will be kept, this is important in the
event that regulation takes place at the national level. Compliance is assured by fixing the
greenhouse gas allocations in performance contracts and reporting the progress in meeting
those targets in the financial performance indicators for the company. Banking of
allowances (carrying over from one year to the next) is allowed, but regulated. The system
does not include emissions from imported power used in the companies’ operations.
BP Amoco is also proactive in the field of Joint Implementation (JI) and the Clean
Development Mechanism (CDM). When a specific project -projects outside the BUs
operations included- is undertaken that results in a CO2 reduction, CO2 equivalent credits

5
are generated. This approach is called Credit Based trading (CBT). Restricions will be
imposed on the use of this mechanism.
The document “Greenhouse Gas Emissions Trading in BP Amoco” states that “Trading is
an important policy alternative to taxation, and has the important advantage that it can
work with other policy initiatives such as voluntary agreements between industries and
governments (BP Amoco, 1999).” The system developed by the company links voluntary
agreements and internal emission trading. In Section 4, we extend this approach to
external (i.e. with companies outside the VA) emission trading.
3.2 The Shell Tradeable Emission Permit System (STEPS)
The Royal Dutch/Shell Group recently launched ‘STEPS’, the Shell Tradeable Emission
Permit System, a cap and trade system with very similar characteristics as the one
previously described. The Group has set itself an overall reduction target of 10% of its
greenhouse gas emissions by 2002, compared with its 1990 levels. This target can partly
be reached by making use of an internal emission trading system. Each permit is worth 100
tonnes of CO2 emissions or its CH4 equivalent. Allocation of the permits is based on 1998
levels. Each participant will receive permits up to a level of 98% of the emissions during
that year. They commit themselves to make a 2% reduction over the next three years.
Permits for the three years have been given in advance, therefore a futures market is
expected to develop. In the first year, participants receive 95% of their allocated permits.
The remaining 5% is being held in reserve for early auction among the companies.
Emissions covered by STEPS make up 30% of the Groups total emissions and participation
is restricted to the companies operating in Annex I countries. Marginal costs are estimated
in the range of $5 to $40 per tonne of carbon abated. Banking is possible and penalties are
levied for non-compliance. Transaction costs will be minimised by making use of a
Trading Manager, through which all trades will be channelled. In addition, the Group is
establishing guidelines for a Shell-internal CDM-scheme (Shell, 2000).
6
3.3 The Prototype Carbon Fund
The Prototype Carbon Fund (PCF) was launched by the World Bank in January 2000. The
Fund will invest in projects in the framework of JI and the CDM (Prototype Carbon Fund,
2000). It is a market-based mechanism aimed at addressing climate change and promoting
the financing and transfer of climate-friendly technologies to developing countries. The
PCF consists of contributions from governments and private companies. The purpose of
the Fund is to reduce greenhouse gas emissions by making investments in cleaner
technologies in the developing countries and transition economies. The main focus is on
renewable energy technologies. After an independent verification and certification of the
emission reductions, they will be transfered to the Fund’s contributors. This will be done
in the form of emission reduction certificates. The World Bank will act as a broker in
helping to negotiate a price for the emission reductions that is reasonable for both buyers
and sellers. The emission reductions from PCF projects may eventually be used against
industrializes countries’ commitments to reduce their greenhouse gas emissions, dependent
on what rules will be developed by the Parties to the UN Framework Convention on
Climate Change (The World Bank, 2000). However, PCF is a pilot activity and does not
endeaver to compete in the emissions reductions market; it is restricted to US $150 million.
Termination of the project is sheduled for 2012. As interest in the Fund shows to be
greater than previously expected, the Bank’s management decided to ask its Executive
Board to raise the $150 million cap (Prototype Carbon Fund News Page, 2000).
3.4 Gets2
Another interesting initiative is Gets 2, the Greenhouse & Energy Trading Simulation n°2.
This program runs under the aegis of ParisBourse and Eurelectric. During Gets2 sessions,
more than 35 fictional companies from 6 industrial sectors (Utilities, Petroleum, Steel,
Cement, Chemicals, Pulp and Paper) are trading emissions permits over the internet. The
results will be presented at the Sixth Conference of the Parties (COP-6) to the UNFCCC
(Gets2, 2000).
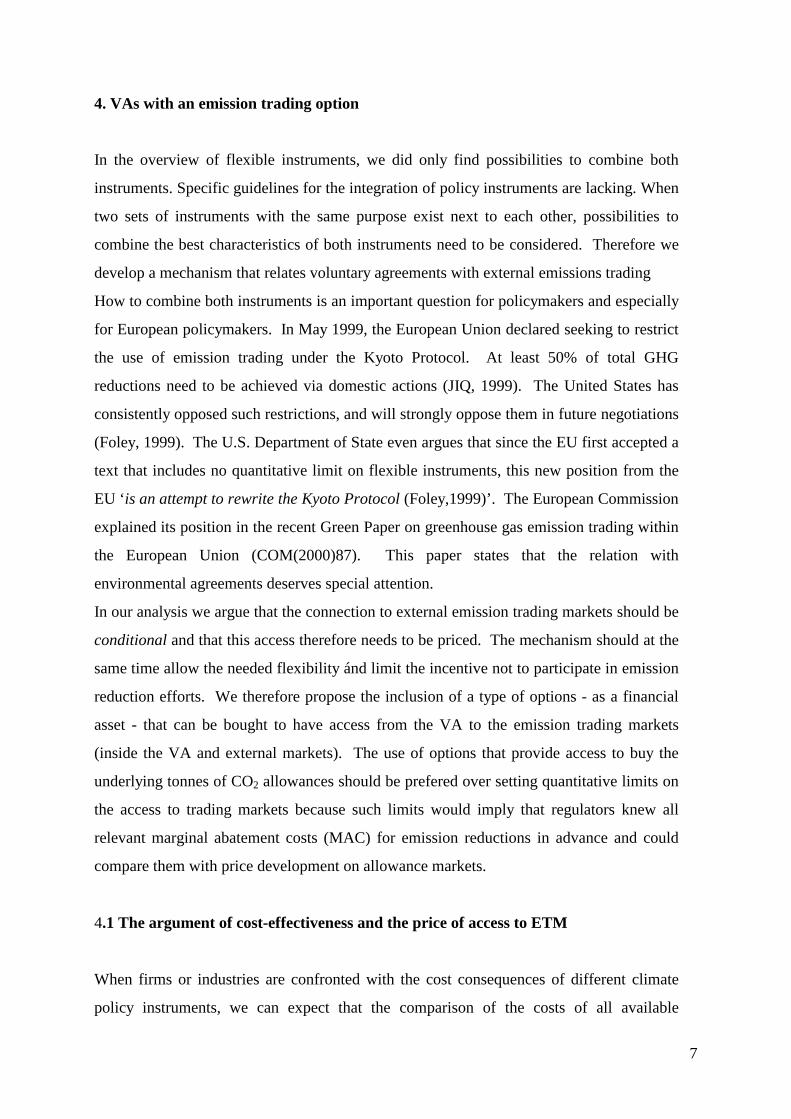
7
4. VAs with an emission trading option
In the overview of flexible instruments, we did only find possibilities to combine both
instruments. Specific guidelines for the integration of policy instruments are lacking. When
two sets of instruments with the same purpose exist next to each other, possibilities to
combine the best characteristics of both instruments need to be considered. Therefore we
develop a mechanism that relates voluntary agreements with external emissions trading
How to combine both instruments is an important question for policymakers and especially
for European policymakers. In May 1999, the European Union declared seeking to restrict
the use of emission trading under the Kyoto Protocol. At least 50% of total GHG
reductions need to be achieved via domestic actions (JIQ, 1999). The United States has
consistently opposed such restrictions, and will strongly oppose them in future negotiations
(Foley, 1999). The U.S. Department of State even argues that since the EU first accepted a
text that includes no quantitative limit on flexible instruments, this new position from the
EU ‘is an attempt to rewrite the Kyoto Protocol (Foley,1999)’. The European Commission
explained its position in the recent Green Paper on greenhouse gas emission trading within
the European Union (COM(2000)87). This paper states that the relation with
environmental agreements deserves special attention.
In our analysis we argue that the connection to external emission trading markets should be
conditional and that this access therefore needs to be priced. The mechanism should at the
same time allow the needed flexibility ánd limit the incentive not to participate in emission
reduction efforts. We therefore propose the inclusion of a type of options - as a financial
asset - that can be bought to have access from the VA to the emission trading markets
(inside the VA and external markets). The use of options that provide access to buy the
underlying tonnes of CO2 allowances should be prefered over setting quantitative limits on
the access to trading markets because such limits would imply that regulators knew all
relevant marginal abatement costs (MAC) for emission reductions in advance and could
compare them with price development on allowance markets.
4.1 The argument of cost-effectiveness and the price of access to ETM
When firms or industries are confronted with the cost consequences of different climate
policy instruments, we can expect that the comparison of the costs of all available
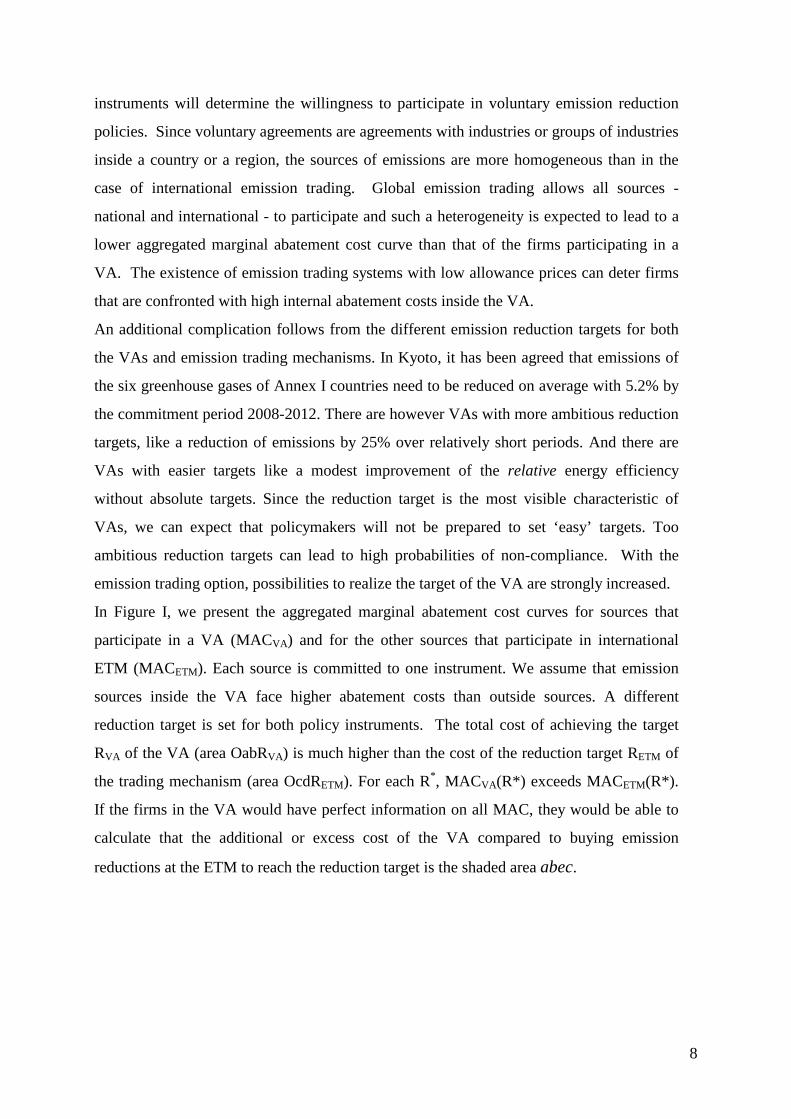
8
instruments will determine the willingness to participate in voluntary emission reduction
policies. Since voluntary agreements are agreements with industries or groups of industries
inside a country or a region, the sources of emissions are more homogeneous than in the
case of international emission trading. Global emission trading allows all sources -
national and international - to participate and such a heterogeneity is expected to lead to a
lower aggregated marginal abatement cost curve than that of the firms participating in a
VA. The existence of emission trading systems with low allowance prices can deter firms
that are confronted with high internal abatement costs inside the VA.
An additional complication follows from the different emission reduction targets for both
the VAs and emission trading mechanisms. In Kyoto, it has been agreed that emissions of
the six greenhouse gases of Annex I countries need to be reduced on average with 5.2% by
the commitment period 2008-2012. There are however VAs with more ambitious reduction
targets, like a reduction of emissions by 25% over relatively short periods. And there are
VAs with easier targets like a modest improvement of the relative energy efficiency
without absolute targets. Since the reduction target is the most visible characteristic of
VAs, we can expect that policymakers will not be prepared to set ‘easy’ targets. Too
ambitious reduction targets can lead to high probabilities of non-compliance. With the
emission trading option, possibilities to realize the target of the VA are strongly increased.
In Figure I, we present the aggregated marginal abatement cost curves for sources that
participate in a VA (MACVA) and for the other sources that participate in international
ETM (MACETM). Each source is committed to one instrument. We assume that emission
sources inside the VA face higher abatement costs than outside sources. A different
reduction target is set for both policy instruments. The total cost of achieving the target
RVA of the VA (area OabRVA) is much higher than the cost of the reduction target RETM of
the trading mechanism (area OcdRETM). For each R*, MACVA(R*) exceeds MACETM(R*).
If the firms in the VA would have perfect information on all MAC, they would be able to
calculate that the additional or excess cost of the VA compared to buying emission
reductions at the ETM to reach the reduction target is the shaded area abec.
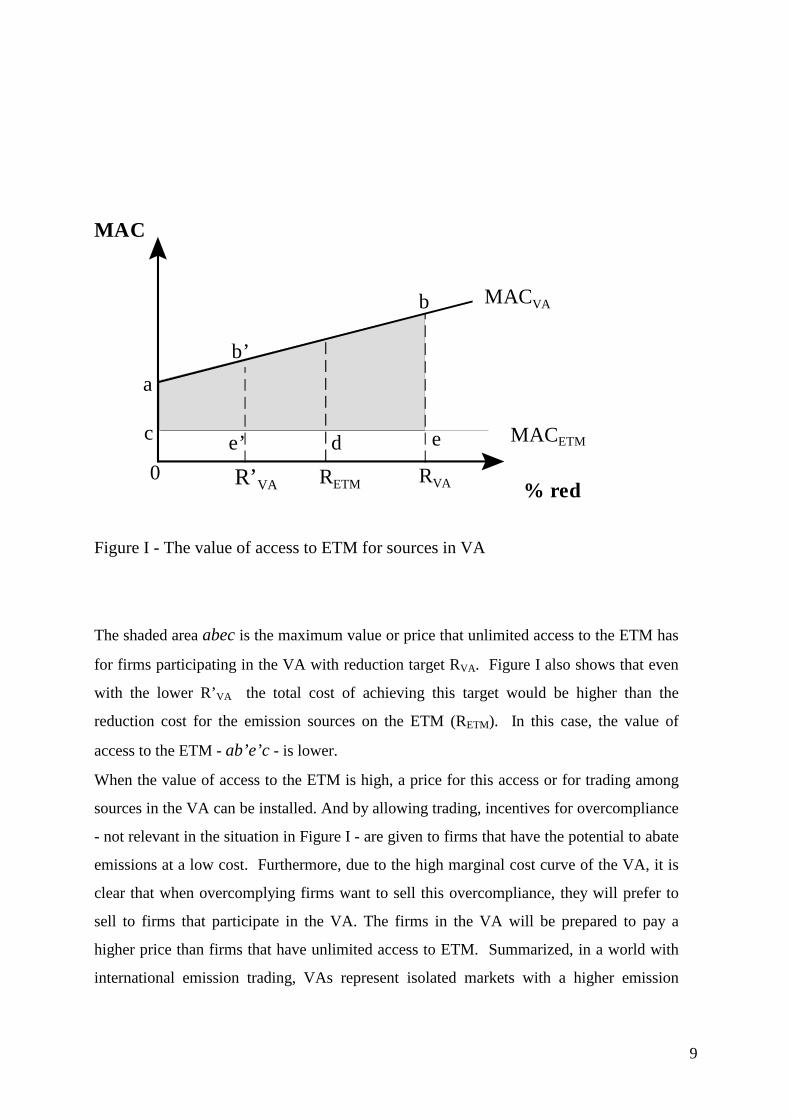
9
Figure I - The value of access to ETM for sources in VA
The shaded area abec is the maximum value or price that unlimited access to the ETM has
for firms participating in the VA with reduction target RVA. Figure I also shows that even
with the lower R’VA the total cost of achieving this target would be higher than the
reduction cost for the emission sources on the ETM (RETM). In this case, the value of
access to the ETM - ab’e’c - is lower.
When the value of access to the ETM is high, a price for this access or for trading among
sources in the VA can be installed. And by allowing trading, incentives for overcompliance
- not relevant in the situation in Figure I - are given to firms that have the potential to abate
emissions at a low cost. Furthermore, due to the high marginal cost curve of the VA, it is
clear that when overcomplying firms want to sell this overcompliance, they will prefer to
sell to firms that participate in the VA. The firms in the VA will be prepared to pay a
higher price than firms that have unlimited access to ETM. Summarized, in a world with
international emission trading, VAs represent isolated markets with a higher emission
MAC
% red
MACVA
MACETM
a
c
0
b’
e’
b
e
R’VA RVA
dRETM
10
reduction scarcity. This situation generates higher prices for overcompliance and a
willingness to pay for access to the world market for emission reductions.
4.2 Design of the mechanism
In order to limit administrative complications, information and transaction costs for
participating firms in VAs with access to the ETM, the connection between both
instruments should be established by some type of market maker, here called the
Supervising Body (SB). As shown in Figure II, this Supervising Body will provide the
participating firms or industries with all information concerning the Emission Trading
Market and will write standard option contracts that are transparent and tradeable.
Figure II - Market structure for VAs with ETM
4.3 The role of information and the cost of non-compliance
The targets for emission reductions in voluntary agreements are determined after a process
of information gathering, processing, analysis and negotiations. After the complete audit
process, a selection of investment projects needs to be made by the participants in the VA.
Projects with an acceptable pay-back period will be chosen to realize the reduction targets.
The quality of the estimates in the audit of the long-term development of marginal and
average abatement costs will strongly determine the success of the realization of the
emission reduction targets. Industries are aware of the uncertainties surrounding future
abatement costs and have as such an incentive to exaggerate these estimates in the
negotiations in order to lower the emission reduction target that will be agreed upon in the
ABCDE
Supervising Body
ET M
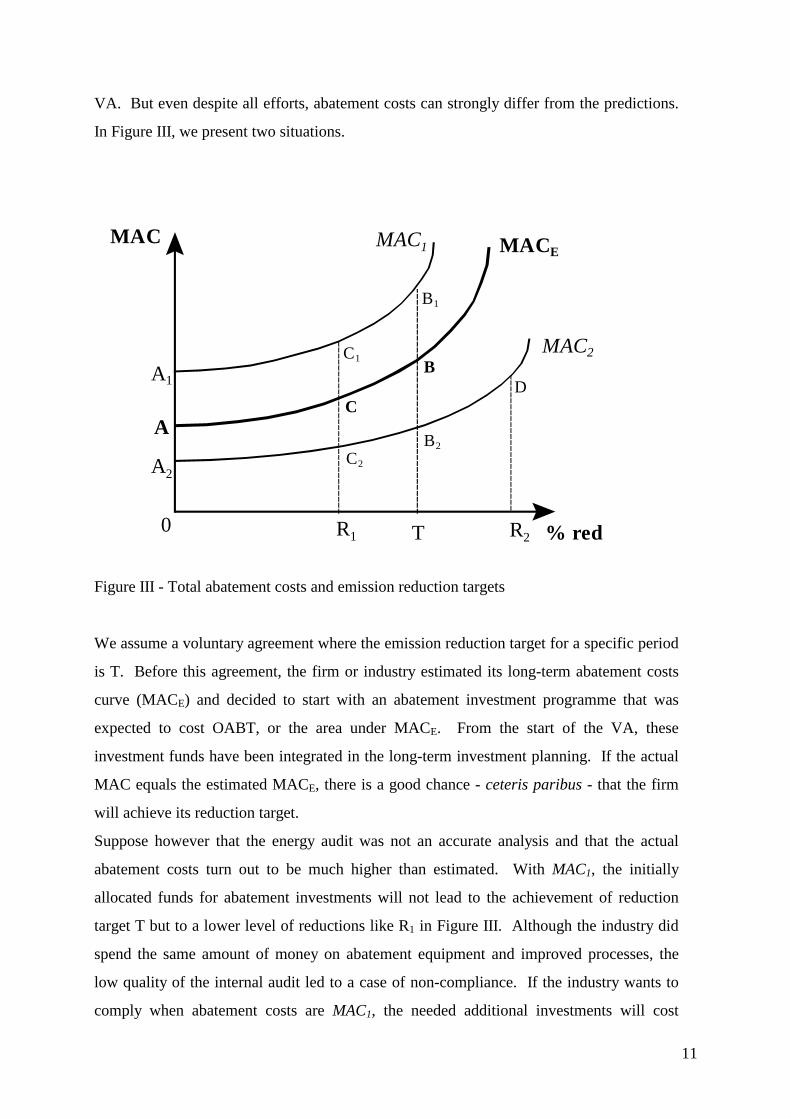
11
VA. But even despite all efforts, abatement costs can strongly differ from the predictions.
In Figure III, we present two situations.
Figure III - Total abatement costs and emission reduction targets
We assume a voluntary agreement where the emission reduction target for a specific period
is T. Before this agreement, the firm or industry estimated its long-term abatement costs
curve (MACE) and decided to start with an abatement investment programme that was
expected to cost OABT, or the area under MACE. From the start of the VA, these
investment funds have been integrated in the long-term investment planning. If the actual
MAC equals the estimated MACE, there is a good chance - ceteris paribus - that the firm
will achieve its reduction target.
Suppose however that the energy audit was not an accurate analysis and that the actual
abatement costs turn out to be much higher than estimated. With MAC1, the initially
allocated funds for abatement investments will not lead to the achievement of reduction
target T but to a lower level of reductions like R1 in Figure III. Although the industry did
spend the same amount of money on abatement equipment and improved processes, the
low quality of the internal audit led to a case of non-compliance. If the industry wants to
comply when abatement costs are MAC1, the needed additional investments will cost
MAC
% red0
A2
A1
A
C1
C2
C
B1
B
B2
R1 T R2
D
MAC1
MAC2
MACE
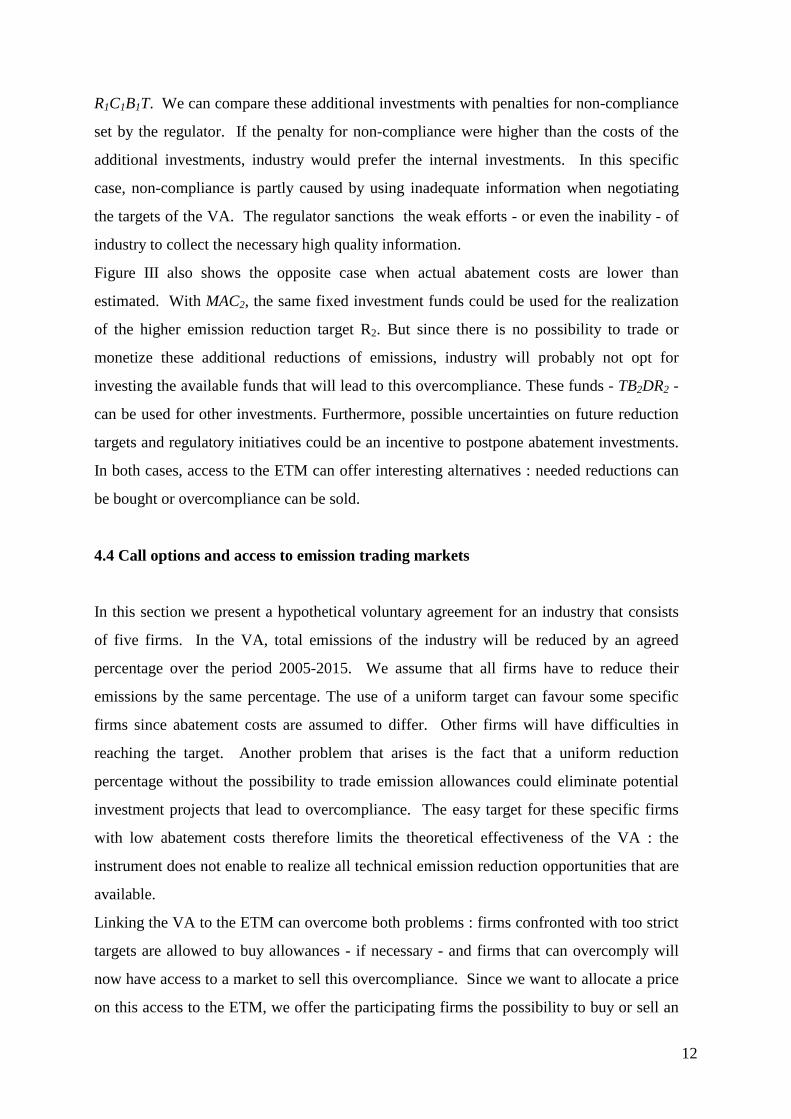
12
R1C1B1T. We can compare these additional investments with penalties for non-compliance
set by the regulator. If the penalty for non-compliance were higher than the costs of the
additional investments, industry would prefer the internal investments. In this specific
case, non-compliance is partly caused by using inadequate information when negotiating
the targets of the VA. The regulator sanctions the weak efforts - or even the inability - of
industry to collect the necessary high quality information.
Figure III also shows the opposite case when actual abatement costs are lower than
estimated. With MAC2, the same fixed investment funds could be used for the realization
of the higher emission reduction target R2. But since there is no possibility to trade or
monetize these additional reductions of emissions, industry will probably not opt for
investing the available funds that will lead to this overcompliance. These funds - TB2DR2 -
can be used for other investments. Furthermore, possible uncertainties on future reduction
targets and regulatory initiatives could be an incentive to postpone abatement investments.
In both cases, access to the ETM can offer interesting alternatives : needed reductions can
be bought or overcompliance can be sold.
4.4 Call options and access to emission trading markets
In this section we present a hypothetical voluntary agreement for an industry that consists
of five firms. In the VA, total emissions of the industry will be reduced by an agreed
percentage over the period 2005-2015. We assume that all firms have to reduce their
emissions by the same percentage. The use of a uniform target can favour some specific
firms since abatement costs are assumed to differ. Other firms will have difficulties in
reaching the target. Another problem that arises is the fact that a uniform reduction
percentage without the possibility to trade emission allowances could eliminate potential
investment projects that lead to overcompliance. The easy target for these specific firms
with low abatement costs therefore limits the theoretical effectiveness of the VA : the
instrument does not enable to realize all technical emission reduction opportunities that are
available.
Linking the VA to the ETM can overcome both problems : firms confronted with too strict
targets are allowed to buy allowances - if necessary - and firms that can overcomply will
now have access to a market to sell this overcompliance. Since we want to allocate a price
on this access to the ETM, we offer the participating firms the possibility to buy or sell an
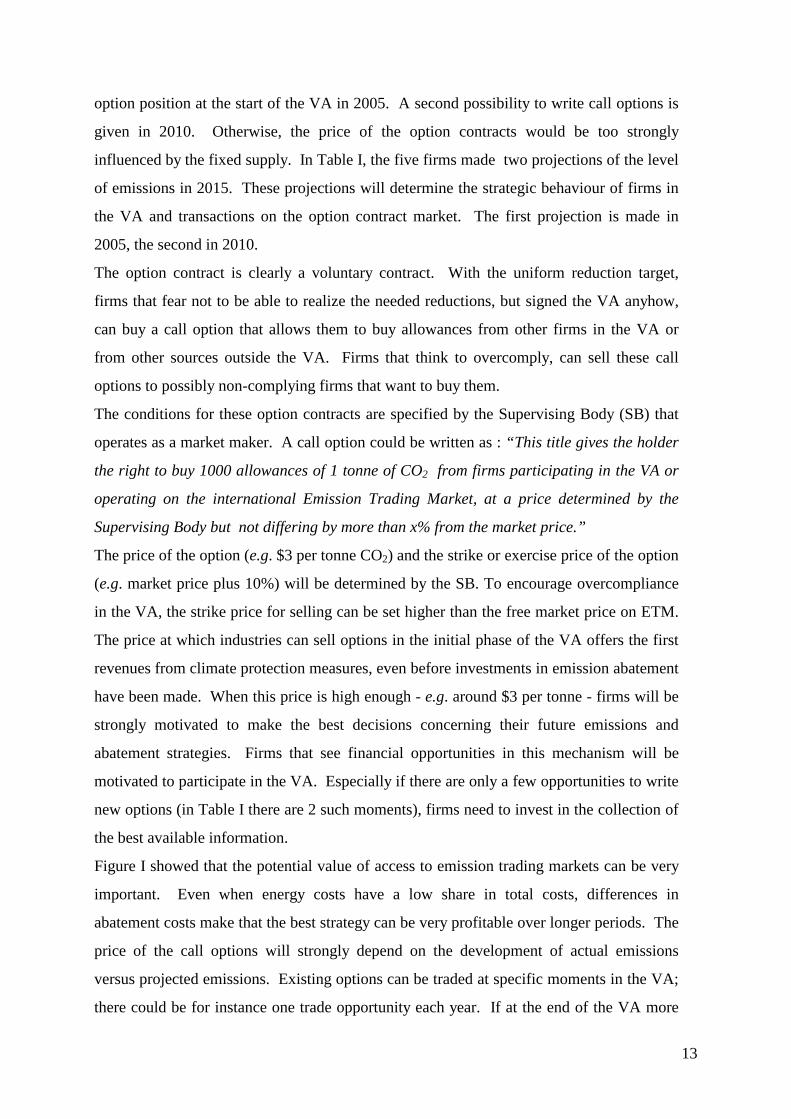
13
option position at the start of the VA in 2005. A second possibility to write call options is
given in 2010. Otherwise, the price of the option contracts would be too strongly
influenced by the fixed supply. In Table I, the five firms made two projections of the level
of emissions in 2015. These projections will determine the strategic behaviour of firms in
the VA and transactions on the option contract market. The first projection is made in
2005, the second in 2010.
The option contract is clearly a voluntary contract. With the uniform reduction target,
firms that fear not to be able to realize the needed reductions, but signed the VA anyhow,
can buy a call option that allows them to buy allowances from other firms in the VA or
from other sources outside the VA. Firms that think to overcomply, can sell these call
options to possibly non-complying firms that want to buy them.
The conditions for these option contracts are specified by the Supervising Body (SB) that
operates as a market maker. A call option could be written as : “This title gives the holder
the right to buy 1000 allowances of 1 tonne of CO2 from firms participating in the VA or
operating on the international Emission Trading Market, at a price determined by the
Supervising Body but not differing by more than x% from the market price.”
The price of the option (e.g. $3 per tonne CO2) and the strike or exercise price of the option
(e.g. market price plus 10%) will be determined by the SB. To encourage overcompliance
in the VA, the strike price for selling can be set higher than the free market price on ETM.
The price at which industries can sell options in the initial phase of the VA offers the first
revenues from climate protection measures, even before investments in emission abatement
have been made. When this price is high enough - e.g. around $3 per tonne - firms will be
strongly motivated to make the best decisions concerning their future emissions and
abatement strategies. Firms that see financial opportunities in this mechanism will be
motivated to participate in the VA. Especially if there are only a few opportunities to write
new options (in Table I there are 2 such moments), firms need to invest in the collection of
the best available information.
Figure I showed that the potential value of access to emission trading markets can be very
important. Even when energy costs have a low share in total costs, differences in
abatement costs make that the best strategy can be very profitable over longer periods. The
price of the call options will strongly depend on the development of actual emissions
versus projected emissions. Existing options can be traded at specific moments in the VA;
there could be for instance one trade opportunity each year. If at the end of the VA more
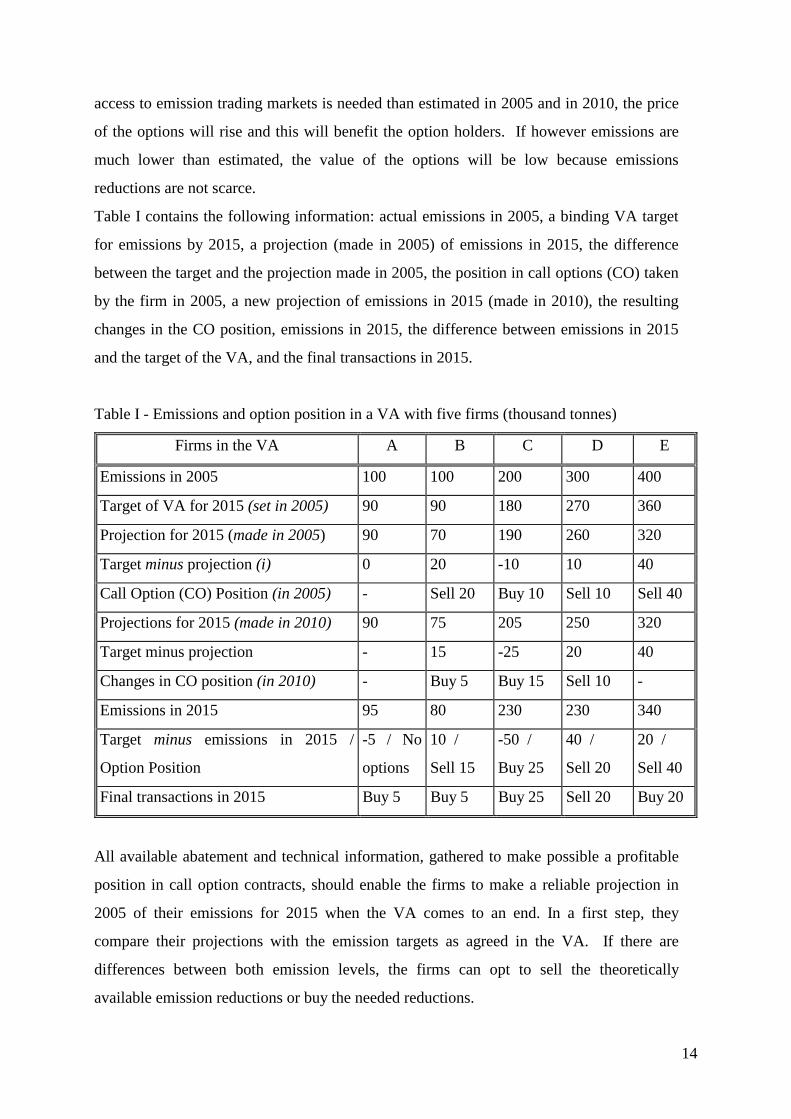
14
access to emission trading markets is needed than estimated in 2005 and in 2010, the price
of the options will rise and this will benefit the option holders. If however emissions are
much lower than estimated, the value of the options will be low because emissions
reductions are not scarce.
Table I contains the following information: actual emissions in 2005, a binding VA target
for emissions by 2015, a projection (made in 2005) of emissions in 2015, the difference
between the target and the projection made in 2005, the position in call options (CO) taken
by the firm in 2005, a new projection of emissions in 2015 (made in 2010), the resulting
changes in the CO position, emissions in 2015, the difference between emissions in 2015
and the target of the VA, and the final transactions in 2015.
Table I - Emissions and option position in a VA with five firms (thousand tonnes)
Firms in the VA A B C D E
Emissions in 2005 100 100 200 300 400
Target of VA for 2015 (set in 2005) 90 90 180 270 360
Projection for 2015 (made in 2005) 90 70 190 260 320
Target minus projection (i) 0 20 -10 10 40
Call Option (CO) Position (in 2005) - Sell 20 Buy 10 Sell 10 Sell 40
Projections for 2015 (made in 2010) 90 75 205 250 320
Target minus projection - 15 -25 20 40
Changes in CO position (in 2010) - Buy 5 Buy 15 Sell 10 -
Emissions in 2015 95 80 230 230 340
Target minus emissions in 2015 /
Option Position
-5 / No
options
10 /
Sell 15
-50 /
Buy 25
40 /
Sell 20
20 /
Sell 40
Final transactions in 2015 Buy 5 Buy 5 Buy 25 Sell 20 Buy 20
All available abatement and technical information, gathered to make possible a profitable
position in call option contracts, should enable the firms to make a reliable projection in
2005 of their emissions for 2015 when the VA comes to an end. In a first step, they
compare their projections with the emission targets as agreed in the VA. If there are
differences between both emission levels, the firms can opt to sell the theoretically
available emission reductions or buy the needed reductions.
15
For the five firms, the difference between the target and the projection made in 2005 (row
(i) in Table I) is respectively 0, 20, -10, 10 and 40. The net difference is +60. This positive
difference indicates the need for access to external emission trading markets because not all
excess emission reductions can be sold inside the VA.
The firms all have the possibility to take a position in call options in 2005 and in 2010.
Firm A does not take an option position because it projects to meet the emission reduction
target. At first, firm B projects that in 2015 its emissions will be lower than the target in
the VA. This potential overcompliance can be sold and therefore firm B will be prepared
to sell call options to firms that want to buy this excess emission reductions later on.
Therefore, in 2005 firm B communicates to the Supervising Body its willingness to sell - or
to write - a call option that allows the exercisers to buy allowances for 20 thousand tonnes
of CO2 emissions. In 2010, B estimates that the difference between its emissions and the
target of the VA will only be 15 tonnes. Since B will not be able to sell 20 tonnes of
realized reductions, it will buy back 5 call options. Firm C expects a strong market growth
and projects that emissions will not meet the emission reduction target of the VA in 2015.
Firm C wants to buy emission allowances from sources inside or outside the VA. In 2005
it will express its willingness to buy 10 units of allowances and will therefore buy call
options. In 2010, it becomes obvious that its emissions will be much higher and C will buy
additional call options. Firms D and E both expect that emissions in 2015 will be lower
than the target and therefore want to sell emission allowances.
The Supervising Body collects all information on call options and after a process of
multilateral communication with the 5 firms it determines an initial price for the option
contracts. Firms estimated their internal marginal abatement cost curve; they only want to
buy allowances if the total cost - the price of the call option added to price of the emission
permits - is lower than their own MAC. The option price should be high enough so that
sellers receive an advance payment for their later efforts in terms of emission reductions.
Furthermore, a too low option price would make it too attractive to buy options instead of
starting internal efficiency investments.
The SB could opt for an option price close to the lowest marginal abatement costs of the
five firms. In the example of Figure I, this would result in an option price between 0c and
0a when MACVA is the marginal abatement cost curve that is estimated by the SB. In
2015, the SB will determine the price – based on the price on the ETM - for the allowances

16
that can be bought when using the call options. It also organizes a final trade in call
options since it can be expected that some firms did buy too much or not enough of them.
In what follows, we discuss the situation in 2015 for each firm in Table I
Firm A : No options have been bought by A but emissions in 2015 exceed the VA target
for A by 5 units. Once firm A detects this non-compliance, it will buy call options for 5
units and use these options to buy emission reductions inside or outside the VA.
Firm B : B wrote options to sell 20 units of emission reductions in 2005 and did buy 5 units
of them in 2010. In 2015, it turns out that emissions are higher than anticipated and B can
sell only 10 units. As a result, B needs to buy back option contracts for 5 units.
Firm C : C anticipated to buy 10 emission units in 2005 but in 2015 it is clear that it will
need access to 40 additional units. C did buy 15 call options in 2010 and will need 25
additional call options in 2015.
Firm D: D did foresee to sell 20 emission units in 2015 but as a result of diverse factors,
the firm’s emissions are only 230. D can sell 20 additional emission units.
Firm E: E anticipated to sell 40 emission units but its emissions in 2015 are higher than
expected. E can only sell 20 units. E did write option contracts for 40 units in 2005 and
cannot fulfull its obligations. It will buy back 20 call options in 2015.
In 2015, the differences between target and emissions are known. The net-difference is
+15. This means that the target of the VA will be met. The SB can sell emission permits
on the emission trading market. If emissions were much higher, the price paid by the five
firms for emission permits would be the market price of non-compliance. In 2010, only
firm D can sell additional reductions and this firm will clearly benefit from the market
mechanism. Without this opportunity to sell, D could limit its efforts and emit 270 instead
of 230 units. B and E have sold too much emission reductions and they cannot deliver
what they promised. Therefore D will be prepared to take over their obligation to sell
reductions. B and E will pay D a price above the initial value of the option contract in
2005, otherwise they would be rewarded for failing to fulfill their voluntary contractual
obligations. Since B and E have no direct access to the international emission trading
market, the price they pay to D can be higher than the price at which allowances are traded
at that moment. The strike price for the sold emission reductions will be determined by the
SB. This price will be based on the ETM price level. We believe this is a pragmatic
position. When emission permits trade at $15 per tonne CO2, there is no need for the SB to
17
price emission reductions at $100 even when there are contractual buyers at this price. In
this case, the cost or price of non-compliance is market-based and not determined by
regulators. On the other hand, the price should be above $15 since we assume that firms in
the VA have higher marginal abatement costs than sources that reduce emissions for the
ETM. Very low prices would make emission reduction an unprofitable investment for
firms that sell excess reductions. Of course, when emission permits trade at $150, the costs
of non-compliance will be higher.
4.5 The benefits of linking VAs to emission trading
In absence of the link to emission trading, the five firms in Table I would focus on the
emission target and not on the potential emission reductions. They would also strongly
concentrate on the policy process that enables them to influence reduction targets. The
opportunities resulting from the emission trading option provide a clear incentive to
analyse energy flows and potential savings in greater detail than when excess reductions of
emissions have no value. Without the link to the ETM, the internally projected emissions
for 2015 could be much higher because a more limited audit did probably not reveal all
available opportunities. Confronted with the same reduction target, the behaviour of the
five firms in the VA could be different. Since they would not have the ambition to realize
the projected level of possible emission reductions in 2015 without ETM access, we can
expect that emissions will be higher compared to situations with incentives to limit
emissions and sell excess reductions. For instance, firm B projected to emit 70 units and
sold 20 emission units. To fulfill its contractual obligations, the firm will accept higher
abatement costs for additional investments while with the normal VA, this would not be
the case (see Figure III). When B emits 80 after the maximal reduction effort, what would
be emissions without market-incentives? Would emissions be 90 or 100? We do not have
the answer, but it would not be surprising that emissions exceed 80.
D is the best performer in Table I. It can reduce emissions from 300 to 230. D monetized
the reduction of emissions at three occasions. First it wrote a call option for 10 units and
received a price determined by the SB. In 2010, 10 additional call option contracts have
been written and sold. In 2015, it became obvious that only D could sell more emission
reductions inside the VA while other firms that initially also claimed to sell, had to reduce
their position in options. These firms had to transfer their obligation to sell emission
18
reductions to the SB. Via the SB a part of their obligation has been passed on to D. In
return, D received a price higher than the initial value of the option. Finally, D can sell the
emission reductions at a strike price that is probably higher than the price on the
international emission trading market. We do not suggest that these financial opportunities
led to the low level of emissions, but it is clear that without these market-incentives,
emissions of D could be much higher, even above 270.
To conclude, the linking of both instruments led to lower levels of emissions for the firms
participating in the VA. An additional benefit is that non-compliance of the VA has a clear
price that is partly based on the price developments on the ETM. The mechanism further
provides additional benefits for overcompliance and makes it possible to trade emission
reductions at interesting prices. Compared to emission trading without the VA, the
proposed mechanism ensures reduction efforts for industries that face much higher
marginal abatement costs than the sources that will deliver the majority of emission
reductions in international trading designs. In fact, this mechanism does not limit the
flexibility of emission trading but adapts emission trading for regions and industries that
cannot compete with allowance prices on the international emission market. The VA
offers a degree of protection against very competitive price conditions on international
ETMs.
5. Conclusions
Recent political and corporate initiatives indicate that voluntary agreements and emission
trading will play a crucial role in future climate policy. We started with a short overview of
existing flexible instruments for climate policy. An important conclusion was that
voluntary agreements are not connected with emission trading markets by a specific market
mechanism. Since both instruments have the same goal – the reduction of greenhouse gases
– the isolated use of instruments can have serious drawbacks. How these instruments can
be combined is an important question, especially for European climate policy. We show
that when emission trading is integrated as an option in voluntary agreement contracts, the
overall efficiency of the use of flexible climate policy instruments is strongly increased.
The emission trading option, formalized as a CO2 allowance call option contract that can
be traded, provides clear incentives to overcomply with the target of the voluntary

19
agreement. The option mechanism also delivers a market price for eventual non-
compliance, based on differences in abatement costs. With an example, we illustrate that
the option mechanism can result in stimulating financial benefits for the firms that are most
succesful in reducing emissions.
20
References
BP Amoco (1999), Greenhouse Gas Emissions Trading in BP Amoco.
<http://www.BPAmoco.com/climatechange/index_communication.htm>
Commissie Milieu, Verkeer en Vervoer (1999). Mededeling van Gedeputeerde Staten aan
Provinciale Staten van Groningen betreffende de aan het IPO verleende machtiging tot
ondertekening van het Convenant Benchmarking energie-efficiency, Nummer 49/1999.
Ministerie van Economische Zaken (1999). Convenant Benchmarking Energie-Efficiency,
gezamenlijk persbericht ministeries van Economische Zaken en Volkshuisvesting,
Ruimtelijke Ordening en Milieubeheer, Nederland (<http.minez.nl/pers99/99059.htm>(
VNO-NCW (2000). Convenant Benchmarking energie-efficiency, <http://www.vno-
ncw.nl/informatie/publicaties/convbenc.htm>
Energy Efficiency Benchmarking Covenant (1999)
<http://info.minez.nl/ezenglish/energy.htm>
European Commission (2000). Green Paper on greenhouse gas emissions trading within the
European Union (COM (2000)87)
Foley, James B. (1999). U.S. Reaction to EU move to limit emission trading. U.S. Department
of State. Office of the Spokesman. Press Statement, May 17,1999
GERT (1998). Pilot Backgrounder, June 3
Gets2 (2000). TITEL http://www.gets2.org
Joint Implementation Quaterly (1999). Common EU position on ‘ceilings’, Vol.5, No.3, June
1999

21
Milieudefensie (1999) – Opinie: Benchmarking, Industrie wordt volger in plaats van koploper,
juli/augustus 1999
Prototype Carbon Fund News Page (2000), Private Sectoe Interest in Prototype Carbon Fund
exceeds expectations, News Release No. 2000/307/S
Prototype Carbon Fund (2000), <http://www.prototypecarbonfund.org/>
Shell (2000), The Shell Tradeable Emission Permit System, http://www.shell.com/royal-
en/content/0,5028,25544-54535,00.html
United Nations Environment Programma (1997). Reducing greenhouse gas emissions : the
role of voluntary programmes (UNEP Industry and Environment Programme Activity Centre,
Paris)
United States Senate Committee on Energy and Natural Resources (1999). Energy and
Climate Policy Act of 1999 (March 25, 1999)
VCR (1999). Progress to date (<http://www.vcr-mvr.ca>)
The World Bank (2000), World Bank launches first-of-its-kind market-based carbon fund,
News Release No. 2000/176/S