On The Path of Global Leadership… - Welspun Corp... · • Top 2 Large Diameter Pipe Company in...
27
April 2011 Page 1 On The Path of Global Leadership… WELSPUN CITY, ANJAR
Transcript of On The Path of Global Leadership… - Welspun Corp... · • Top 2 Large Diameter Pipe Company in...

April 2011 Page 1
On The Path of Global Leadership…
WELSPUN CITY, ANJAR

April 2011 Page 2
Disclaimer
Certain statements made in this presentation may not be based on historical information or facts and may be “forward looking statements,” including
those relating to general business plans and strategy of Welspun Corp. Limited (“WCL"), its future outlook and growth prospects, and future
developments in its businesses and its competitive and regulatory environment. Actual results may differ materially from these forward-looking
statements due to a number of factors, inter alia including future changes or developments in WCL's business, its competitive environment, its ability
to implement its strategies and initiatives and respond to technological changes and political, economic, regulatory and social conditions in India.
This presentation does not constitute a prospectus, offering circular or offering memorandum or an offer invitation, or a solicitation of any offer, to
purchase or sell, any shares of WCL and should not be considered or construed in any manner whatsoever as a recommendation that any person
should subscribe for or purchase any of WCL's shares. Neither this presentation nor any other documentation or information (or any part thereof)
delivered or supplied under or in relation thereto shall be deemed to constitute an offer of or an invitation by or on behalf of WCL to subscribe for or
purchase any of its shares.
WCL, as such, makes no representation or warranty, express or implied, as to, and does not accept any responsibility or liability with respect to, the
fairness, accuracy, completeness or correctness of any information or opinions contained herein. The information contained in this presentation,
unless otherwise specified is only current as of the date of this presentation. WCL assumes no responsibility to publicly amend, modify or revise any
forward looking statements contained herein, on the basis of any subsequent development, information or events, or otherwise. Unless otherwise
stated in this document, the information contained herein is based on management information and estimates. The information contained herein is
subject to change without notice and past performance is not indicative of future results. WCL may alter, modify or otherwise change in any manner
the content of this presentation, without obligation to notify any person of such revision or changes. This presentation may not be copied and
disseminated in any manner.
THE INFORMATION PRESENTED HERE IS NOT AN OFFER INVITATION OR SOLICITATION OF ANY OFFER TO PURCHASE OR SELL ANY
EQUITY SHARES OR ANY OTHER SECURITY OF WCL.
This presentation is not for publication or distribution, directly or indirectly, in or into the United States, Canada or Japan.
These materials are not an offer or solicitation of any offer of securities for purchase or sale in or into the United States, Canada or Japan.
April 2011 Page 3
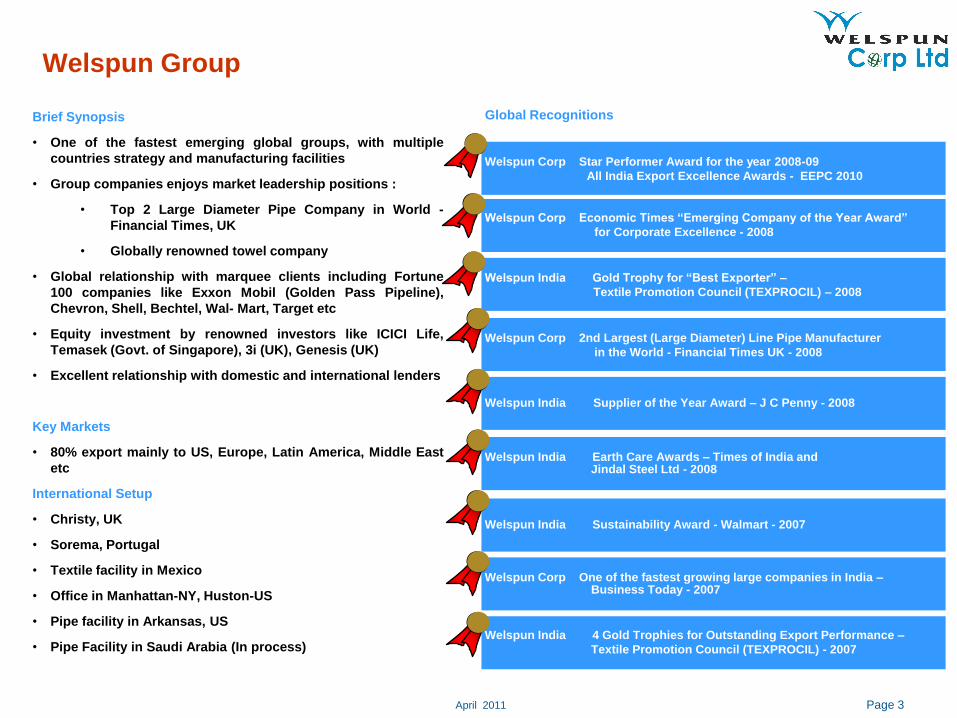
Welspun Group
Brief Synopsis
• One of the fastest emerging global groups, with multiple
countries strategy and manufacturing facilities
• Group companies enjoys market leadership positions :
• Top 2 Large Diameter Pipe Company in World -
Financial Times, UK
• Globally renowned towel company
• Global relationship with marquee clients including Fortune
100 companies like Exxon Mobil (Golden Pass Pipeline),
Chevron, Shell, Bechtel, Wal- Mart, Target etc
• Equity investment by renowned investors like ICICI Life,
Temasek (Govt. of Singapore), 3i (UK), Genesis (UK)
• Excellent relationship with domestic and international lenders
Key Markets
• 80% export mainly to US, Europe, Latin America, Middle East
etc
International Setup
• Christy, UK
• Sorema, Portugal
• Textile facility in Mexico
• Office in Manhattan-NY, Huston-US
• Pipe facility in Arkansas, US
• Pipe Facility in Saudi Arabia (In process)
Welspun Corp Economic Times “Emerging Company of the Year Award”
for Corporate Excellence - 2008
Welspun India Gold Trophy for “Best Exporter” –
Textile Promotion Council (TEXPROCIL) – 2008
Welspun Corp 2nd Largest (Large Diameter) Line Pipe Manufacturer
in the World - Financial Times UK - 2008
Welspun India Supplier of the Year Award – J C Penny - 2008
Welspun India Earth Care Awards – Times of India and Jindal Steel Ltd - 2008
Welspun India Sustainability Award - Walmart - 2007
Welspun Corp One of the fastest growing large companies in India –Business Today - 2007
Welspun India 4 Gold Trophies for Outstanding Export Performance –
Textile Promotion Council (TEXPROCIL) - 2007
Global Recognitions
Welspun Corp Star Performer Award for the year 2008-09
All India Export Excellence Awards - EEPC 2010

April 2011 Page 4
WCL – An Introduction
• WCL, flagship company of Welspun Group, is one of the
largest pipe manufacturing company in the world
• Incorporated in 1995, the Company offers a complete range
of high grade line pipes ranging from ½ inch to 100 inch
used inter alia for transmission of oil & gas
• Partner of Choice for more than 50 Oil & Gas Giants across
the globe with a geographically diverse client base including
Chevron, Exxon Mobil (Golden Pass Pipeline), Saudi Aramco,
British Gas , Kinder Morgan etc
• International footprint
• Accredited with ISO 9001, ISO 14001 and OHSAS 18001
certifications
• Strong order book of U.S. $ 1.4 Bn
26,834 39,945
57,395
73,503
58,604
0
20,000
40,000
60,000
80,000
2006-07 2007-08 2008-09 2009-10 9M 2010-11
(INR MM)CAGR (07-10): 40%
617 991 1,250US $ MM
2,666
5,845 4,768
11,301
9,447
500
3,500
6,500
9,500
12,500
2006-07 2007-08 2008-09 2009-10 9M 2010-11
(INR MM) CAGR (07-10): 62%
61 145 104US $ MM
Gross Profit
Steady Growth in Revenues and ProfitConsolidated Total Revenues
Summary Market Statistics
As of April 4, 2011 INR MM US$ MM(6)
Share Price (INR/ US$) 205.70 4.60
Market Capitalization 42,100 942
Enterprise Value (1) 49,449 1,106
19.78%
41.08%38.94%
0.20%
Promoter
Mutual Funds
FII
Public, Banks and
Financial Institutions
Shareholding Pattern, as on Dec. 31, 2010
Note
1. Net Debt at INR 7,349 MM as on 31 Mar, 2010
2. Average exchange rate of US$1 = Rs 43.51 from 01-Apr-06 till 31-Mar-07
Note
3. Average exchange rate of US$1 = Rs.40.29 from 01-Apr-07 till 31-Mar-08
4. Average exchange rate of US$1 = Rs.45.91 from 01-Apr-08 till 31-Mar-09
5. Average exchange rate of US$1 = Rs.44.90 from 01-Apr-09 till 31-Mar-10
6. Exchange rate of US$1 = Rs. 44.705 on 31tst Dec 2010
1,637
252(5)
(5)(4)(3)(2)
(2) (3) (4)
1311(6)
211(6)

April 2011 Page 5
WCL – An Introduction
Welspun Corp Limited (WCL)Promoters (41.08%) Public and Others (58.92%)
Welspun Plate and Coil Mill
DivisionManufacturer of state-of-art
Plates and Coils
Plates & Coils
Pipes
- Longitudinal (LSAW)
- Helical / Spiral (HSAW)
- Electrical (ERW)
Welspun Pipes Inc, USAWelspun Natural Resources
Pvt. Ltd.
Oil & Gas Exploration Activities
Welspun Tubular LLC
Manufacturer of Pipes,
Coating and Double jointing
Welspun Global Trade LLC
Co
rpo
rate
Str
uctu
reP
rod
ucts
Man
ufa
ctu
rin
g F
acilit
ies
• Premier integrated set-up for manufacturing weldedpipes. Installed state-of-the-art-technology and iscompletely geared to meet the requirements of theglobal industry.
• The Longitudinal Pipes division (LSAW) has acapacity of 350,000 metric ton per annum.
• The Spiral Pipes division (HSAW) has a capacity of550,000 metric ton per annum.
• The ERW Pipes division has a capacity of 200,000metric ton per annum.
• It also has Coating capabilities
Anjar & Dahej Pipe Mills
• With manufacturing facility on a 740-acre site adjacentto the Little Rock Port Authority, the $150 millionfacility commissioned in February 2009.
• This API certified facility currently employs more than300 people and is capable of producing 350,000 tonsof HSAW pipes annually for the use of the oil and gasindustry.
• The facility can produce Pipes from 24 to 60 inches asouter diameter; 6 mm to 25 mm as wall thickness andlength of 40 -80ft.
• It also has Coating and Double Jointing capabilitiesand is a one-stop-solution provider to Welspun'svalued customers
Little Rock , Arkansas, USA
• This backward integration at Anjar, Kutch,Gujarat, India has annual capacity toproduce 1.5 million tones of Plate and Coilwith plates (up to 4.5 meters wide, 140 mmthickness) and Coil (up to 2.8 meters wide,25 mm thickness) with strength of 120,000PSI.
• This mill can cater to high end specializedproduct requirement of Line Pipe Industry(API grades), Shipping, Heavy construction,Bridges, Boiler plates, Wind blades etc.
Plate-cum-Coil Mill
WCL – 100% WCL – 100%
Oil and Gas
100% Beneficial Interest 100% Beneficial Interest
Welspun Infratech Ltd.
Infrastructure
(Welspun Projects ltd)
Welspun Energy Ltd
Solar & Renewable Energy
Renewable Energy &
Infrastructure
Dammam, Saudi Arabia
• Manufacturing facility of 300,000 tons of HSAW pipes annually for the use of the oil and gas industry.

April 2011 Page 6
Growth at Infinity
Merger of coating J.V. with WCL
New Capacity at Anjar, Gujarat for HSAW & Coating
Incorporated
350,000 tons US Spiral Mill commissioned
Approvals from O&G majors for new facility
Anjar Facility , A Key Contributor
Embarked on a Growth Journey
HSAW, Dahej, Gujarat
LSAW, Dahej, Gujarat
Pipe Coating in JV with EUPEC, Germany
Dahej, Gujarat
Growth 8
2006
2005
2004
2001
2000
1998
1995
Rs. 180 mn.
Rs. 585 mn.
Rs. 2,565 mn.
Rs. 8,277 mn.
Rs. 10,385 mn.
Rs. 18,298 mn.
2007Rs. 26,834 mn.
Rs. 39,945 mn. 2008Commissioning of Plate Mill & 43 MW Power Plant
Rs. 57,395 mn. 2009
Rs. 73,503 mn. 2010
- 100,000 tons HSAW Plant in Karnataka
operational
Investment in Middle East with HSAW
capacity of 300,000 MT operational
- 350,000 MT pipe capacity addition under
implementation in India
Foray into infra & pipe laying for O&G and
water through MSK Projects India Ltd.
9M FY 2010-11Rs. 58,604 mn.
Revenue
150,000 MT Spiral Mill commissioned
April 2011 Page 7
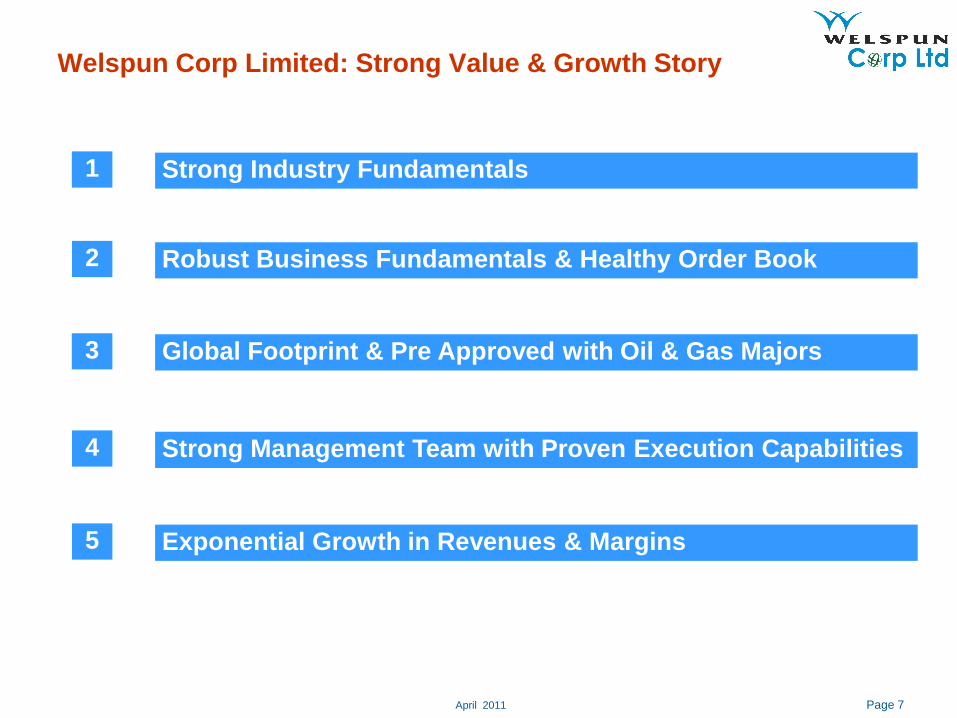
Welspun Corp Limited: Strong Value & Growth Story
Strong Industry Fundamentals1
Global Footprint & Pre Approved with Oil & Gas Majors3
Robust Business Fundamentals & Healthy Order Book2
Strong Management Team with Proven Execution Capabilities4
Exponential Growth in Revenues & Margins5
April 2011 Page 8
Proposed pipeline of GAIL
Phase I by 2011 (Under Execution)
Name of Pipeline Length (Kms)
Cost (Rs Cr)
Add. Cap (MMSCMD)
DVPL Ph -II / Vijaypur Dadri 1,115 10,830 80
Dadri - Bawana - Nangal 646 2,349 31
Chainsa - Jhajjhar - Hissar 349 1,259 35
Sub Total 2,110 14,438 146
Phase II by 2012 (Approved in 2009)
Name of Pipeline Length (Kms)
Cost (Rs Cr)
Add. Cap (MMSCMD)
Jagdishpur - Haldia 2,050 7,596 32
Dabhol - Bangalore 1,389 5,014 16
Kochi - Mangalore - Bangalore 1,114 3,263 16
Sub Total 4,553 15,873 64
Grand Total 6,663 30,311 210
Company Total Length
(kms) Quantity (KMT)
(1)
Business Potential
(US$ Bn)(2)
GAIL 6,663 1,332 1.6
RGTIL 2,750 550 0.7
GSPL 5,675 1,135 1.4
Total 15,088 3,017 3.7
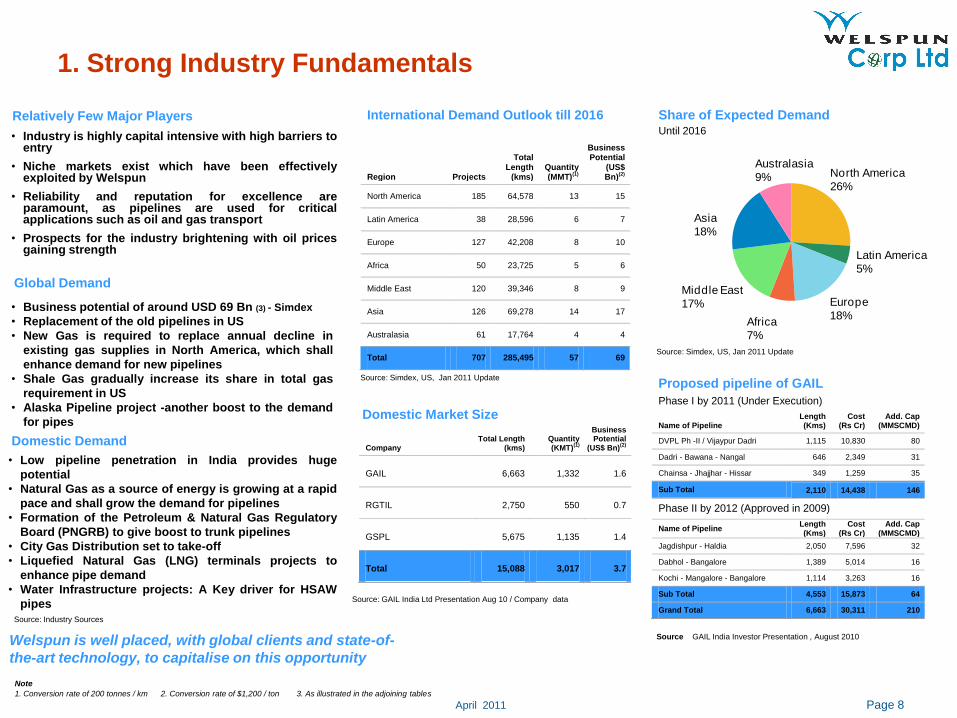
1. Strong Industry Fundamentals
Relatively Few Major Players
North America
26%
Latin America
5%
Europe
18%Africa
7%
Middle East
17%
Asia
18%
Australasia
9%
Share of Expected DemandUntil 2016
• Industry is highly capital intensive with high barriers toentry
• Niche markets exist which have been effectivelyexploited by Welspun
• Reliability and reputation for excellence areparamount, as pipelines are used for criticalapplications such as oil and gas transport
• Prospects for the industry brightening with oil pricesgaining strength
Welspun is well placed, with global clients and state-of-
the-art technology, to capitalise on this opportunity
Source GAIL India Investor Presentation , August 2010
International Demand Outlook till 2016
Region Projects
Total Length
(kms) Quantity (MMT)(1)
Business Potential
(US$ Bn)(2)
North America 185 64,578 13 15
Latin America 38 28,596 6 7
Europe 127 42,208 8 10
Africa 50 23,725 5 6
Middle East 120 39,346 8 9
Asia 126 69,278 14 17
Australasia 61 17,764 4 4
Total 707 285,495 57 69
Source: Simdex, US, Jan 2011 Update
Source: Simdex, US, Jan 2011 Update
Source: Industry Sources
Note
1. Conversion rate of 200 tonnes / km 2. Conversion rate of $1,200 / ton 3. As illustrated in the adjoining tables
Domestic Market Size
Source: GAIL India Ltd Presentation Aug 10 / Company data
Global Demand
• Business potential of around USD 69 Bn (3) - Simdex
• Replacement of the old pipelines in US
• New Gas is required to replace annual decline in
existing gas supplies in North America, which shall
enhance demand for new pipelines
• Shale Gas gradually increase its share in total gas
requirement in US
• Alaska Pipeline project -another boost to the demand
for pipes
Domestic Demand
• Low pipeline penetration in India provides huge
potential
• Natural Gas as a source of energy is growing at a rapid
pace and shall grow the demand for pipelines
• Formation of the Petroleum & Natural Gas Regulatory
Board (PNGRB) to give boost to trunk pipelines
• City Gas Distribution set to take-off
• Liquefied Natural Gas (LNG) terminals projects to
enhance pipe demand
• Water Infrastructure projects: A Key driver for HSAW
pipes

April 2011 Page 9
377
501
670718
814
720
193
384 373
0
100
200
300
400
500
600
700
800
900
FY06 FY07 FY08 FY09 FY10 9M FY11
Going Strength to Strength
FY07 FY09 FY10
Oil & Gas Co Approval
36 >50 >50
Production ( '000 MT)
501 717 814
Revenue (US$ MM)
571 1,250 1,637
PAT (US$ MM)
36 47 136
No. of countries Glob
al Global Global
Export Market 67% 76% 77%
2. Robust Business Fundamentals & Healthy Order Book
Strongly Positioned
350
1,300
200
1,850 1,500
350
350
(200)
200
600
1,000
1,400
1,800
2,200
LSAW HSAW ERW Total Pipe
Plate Mill
Current Capacities
‘000 MT pa
Export Market Gaining DominanceProduction Growth
‘000 MT
77%76%83%67%
23%24%17%33%
0%
20%
40%
60%
80%
100%
FY07 FY08 FY09 FY10
Export Domestic
• Welspun serves several marquee
customers like Exxon Mobil (Golden
Pass Pipeline), Kinder Morgan, Ruby
(El Paso) and GAIL because of its
specialized offerings
• It has long term contracts with giants
like TransCanada; and framework
agreements with Chevron, Saudi
Aramco, etc
• Successfully expanded into highly
competitive North and Latin America to
take advantage of higher realizations
Pipes Plates
Existing Capacities New Capacities
April 2011 Page 10
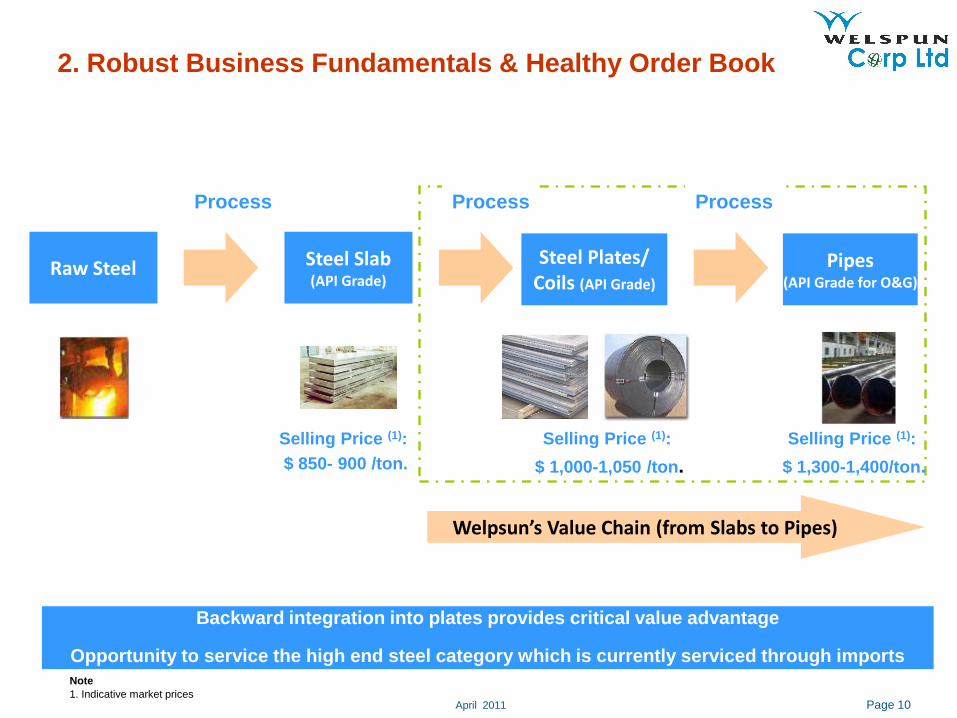
Process Process
Steel Slab(API Grade)
Steel Plates/Coils (API Grade)
Pipes(API Grade for O&G)
Selling Price (1):
$ 850- 900 /ton.
Selling Price (1):
$ 1,000-1,050 /ton.
Selling Price (1):
$ 1,300-1,400/ton.
Raw Steel
Welpsun’s Value Chain (from Slabs to Pipes)
Process
2. Robust Business Fundamentals & Healthy Order Book
Backward integration into plates provides critical value advantage
Opportunity to service the high end steel category which is currently serviced through imports
Note
1. Indicative market prices
April 2011 Page 11
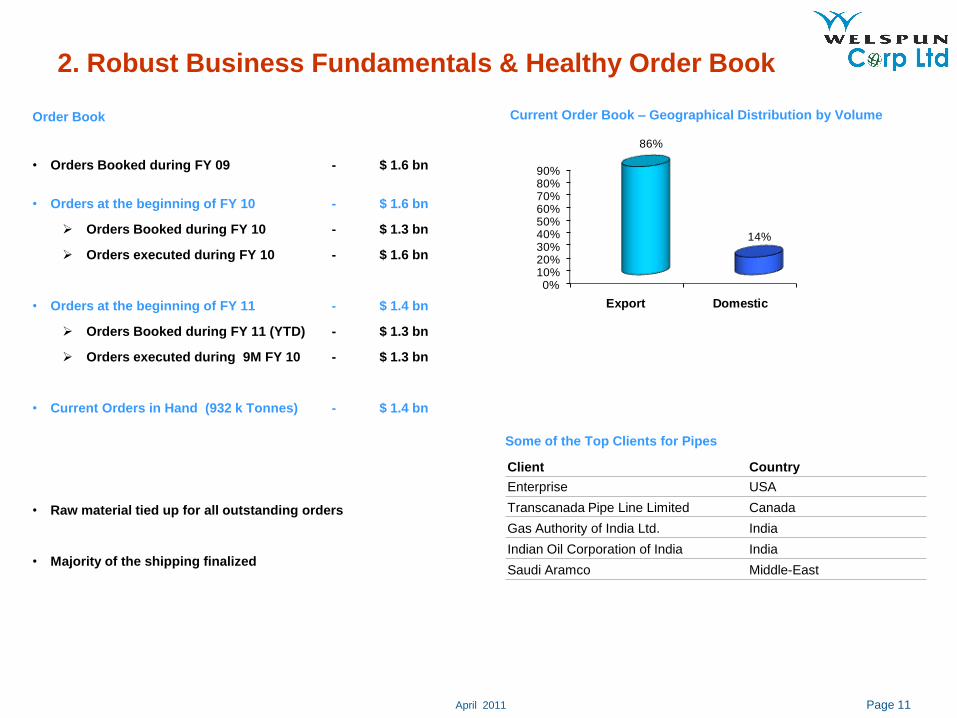
Order Book
• Orders Booked during FY 09 - $ 1.6 bn
• Orders at the beginning of FY 10 - $ 1.6 bn
Orders Booked during FY 10 - $ 1.3 bn
Orders executed during FY 10 - $ 1.6 bn
• Orders at the beginning of FY 11 - $ 1.4 bn
Orders Booked during FY 11 (YTD) - $ 1.3 bn
Orders executed during 9M FY 10 - $ 1.3 bn
• Current Orders in Hand (932 k Tonnes) - $ 1.4 bn
• Raw material tied up for all outstanding orders
• Majority of the shipping finalized
2. Robust Business Fundamentals & Healthy Order Book
Current Order Book – Geographical Distribution by Volume
Some of the Top Clients for Pipes
Client Country
Enterprise USA
Transcanada Pipe Line Limited Canada
Gas Authority of India Ltd. India
Indian Oil Corporation of India India
Saudi Aramco Middle-East
0%10%20%30%40%50%60%70%80%90%
Export Domestic
86%
14%

April 2011 Page 12
3. Global Footprint & Pre Approved with Oil & Gas Majors
What Sets WCL Apart From Competition
• Decade Long Experience
• All Solutions Under One Roof
• High Capacity Equipment to Meet Future Demand
• Backward Integration with In-house Plate-cum-Coil-Mill
World’s largest diameter steel pipe producers(1)
2007 output (million tonnes)
Salzgitter/Europipe* (Germany) 1.3
Welspun (India) 1.0
JFE (Japan) 0.7
Sumitomo (Japan) 0.7
Evraz** (Russia) 0.6
Nippon Steel (Japan) 0.6
Riva (Italy) 0.6
PSL (India) 0.5
JSW (India) 0.3
ArcelorMittal (Luxembourg) 0.2
Stupp (US) 0.1
Tata/Corus (India/UK/Netherlands) 0.1
Others*** 7.3
WCL was rated 2nd largest Pipe Company in 2007 and has since added further capacity of 0.85 MTPA
• Features- Selected few companies considered for supplies that meet stringent process of qualification
- Typically customers with large requirement over a period of time
- Flexibility in pricing terms and continuous business
• Current Framework Agreements
- Chevron, Saudi Aramco (pipe purchase agreement)
Framework Agreements
Global Market Expansion
Year 2000–2001 Year 2001–2002 Year 2002–2003 Year 2003–2004 Year 2004–2005
Year 2005–2006 Year 2006–2007 Year 2007–2008 Year 2008–2009
Canada
US (Trader Mkt.)
US (Projects)
Mexico
Venezuela
Columbia
Spain
Tunisia
Algeria
Libya
Egypt
Sudan
Qatar
Oman
Saudi Arabia
Indonesia
Malaysia
Bangladesh
Iraq
China
Russia
Year 2000–2001Year 2000–2001 Year 2001–2002Year 2001–2002 Year 2002–2003 Year 2003–2004 Year 2004–2005Year 2004–2005
Year 2005–2006 Year 2006–2007Year 2006–2007 Year 2007–2008Year 2007–2008 Year 2008–2009Year 2008–2009
Canada
US (Trader Mkt.)
US (Projects)
Mexico
Venezuela
Peru
Columbia
Spain
Tunisia
Algeria
Libya
Egypt
Sudan
Qatar
Oman
Saudi Arabia
Indonesia
Malaysia
Bangladesh
Iraq
China
Russia
Note
1. As reported by Financial Times on April 13, 2008
–Year 2009 2010
Bolivia

April 2011 Page 13
AGIP NTPC
BECHTEL ONGC
BRITISH GAS PETRO CHINA
BRITISH PETROLEUM PETRONAS, MALAYSIA
CHINA NATIONAL PETROLEUM CORPORATION PDO, OMAN
CPMEC, CHINA PGN, INDONESIA
CHEVRON (Framework Agreement) QATAR PETROLEUM
DOW RELIANCE INDUSTRIES LIMITED
RUBY (ELPASO) SAIPEM, SNAM
EGYPTIAN GENERAL PETROLEUM CORPORATION SAUDI ARAMCO (Framework Agreement)
ENTERPRISE SHELL
EXXON-MOBIL (GOLDEN PASS PIPELINE) STOLT OFFSHORE – Acergy
GAIL SONATRACH
GASCO, ABUDHABI TOTAL
GASCO, EGYPT TECHNIP
GAZPROM (STROYTRANSGAZ) TRANSCANADA (Long Term Contract)
KINDER MORGAN UNOCAL
MOGE, MYANMER PERU LNG (HUNT OIL)
N.A.O.C. - NIGERIA VIETSOPETRO
NPCC, ABU DHABI
3. Global Footprint & Pre Approved with Oil & Gas Majors
3 - 5 years
Setting up plant
2 years
Seeking API
approval
1 year
Approval from major domestic / international
oil and gas companies
2 – 3 years
Accreditation Process
A significant entry barrier

April 2011 Page 14
4. Strong Management Team with Proven Execution
Capabilities
Mr. L. T. Hotwani is Director, Supply Chain Management
of Welspun Corp Limited. With a rich experience of over 36
years, Mr. Hotwani is instrumental in sourcing raw materials
and managing supply chain with global players
Mr. B.K. Goenka is the Chairman, and the chief architect
of the Welspun Group. Today, with his entrepreneurial
ability and professionalism, he has built up one of the most
admired business conglomerates
Mr. R.R. Mandawewala is the Managing Director. He has
been a key contributor in Welspun’s journey. A Chartered
Accountant by profession and with over 20 years of
experience, he has cross-industry expertise varying from
Textiles to SAW pipes.
Mr. M.L. Mittal serves as Executive Director. A Chartered
Accountant by profession, Mr. Mittal has been instrumental
in arranging Long Term Loans and Working Capital
Facilities. During his tenure, the Company has successfully
funded several expansions projects.
Mr. Akhil Jindal serves as Director of Corporate Affairs.
He graduated with an Engineering Degree and thereafter an
MBA from Indian Institute of Management, Bangalore. Mr.
Jindal is responsible for strategic inorganic/organic
initiatives within the Group and has spearheaded large fund
raisings, cross border acquisitions, private equity raisings
and financial closure of projects exceeding over US$ 1 bn.
Mr. Asim Chakraborty is Executive Director and Plant Head
of the Anjar facility. A Civil Engineer from the University of
Kolkata, Mr. Chakraborty has been instrumental in timely
construction of various projects
Mr. Vipul Mathur is the Director of Marketing & Sales
(Pipes & Plates Division). A Science Graduate and Masters in
Business Administration (MBA) in Marketing, he has a rich
experience of over 16 years in the Oil & Gas Pipe Industry
Mr. Prashant Mukherjee serves as Director of Welded
Pipes. A Graduate in Science (Engineering, Mech) with over 24
years experience mostly in the Oil & Gas Pipe Industry, Mr.
Mukherjee has been instrumental in implementing expansion
projects in the Company
Mr. B.R. Jaju serves as Director & CFO. A Chartered
accountant by profession, member of Company Secretary (FCS),
as well as a Law Degree (LL.B). He has a rich experience over
30 years in finance and global M&A activities. Mr. Jaju has been
awarded 3 times as Best Performing CFO in the year 2003, 2005
and 2006, by the most credible nationally renowned jury.
Management Team
Mr. David J. Delie serves as President Welspun Tubular
LLC. A graduate in Science (Electrical Engineering) and a
Masters Degree in Engineering Management from the
University of Pittsburgh, he has an extensive 33-year
background in the steel and pipe industry. Mr Delie has
served on the Board of Directors of Berg Steel Pipe Corp.,
EB Pipe Coating, Inc., the American Iron & Steel Institute
(AISI).
April 2011 Page 15
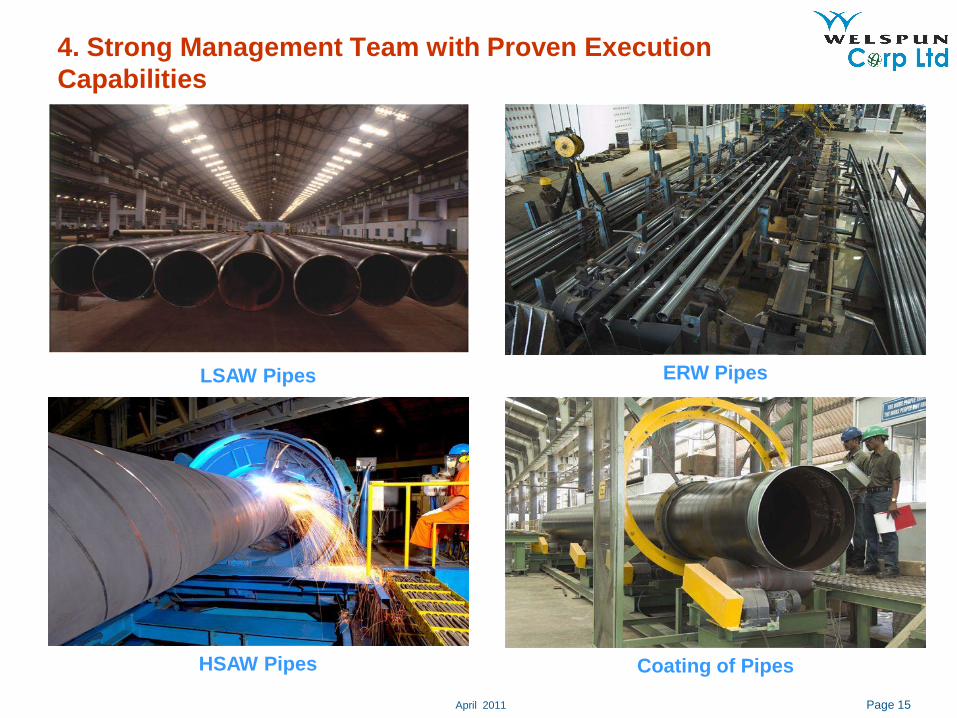
4. Strong Management Team with Proven Execution
Capabilities
LSAW Pipes ERW Pipes
HSAW Pipes Coating of Pipes

April 2011 Page 16
4. Strong Management Team with Proven Execution
Capabilities
PlatesPlates
US Plant
April 2011 Page 17
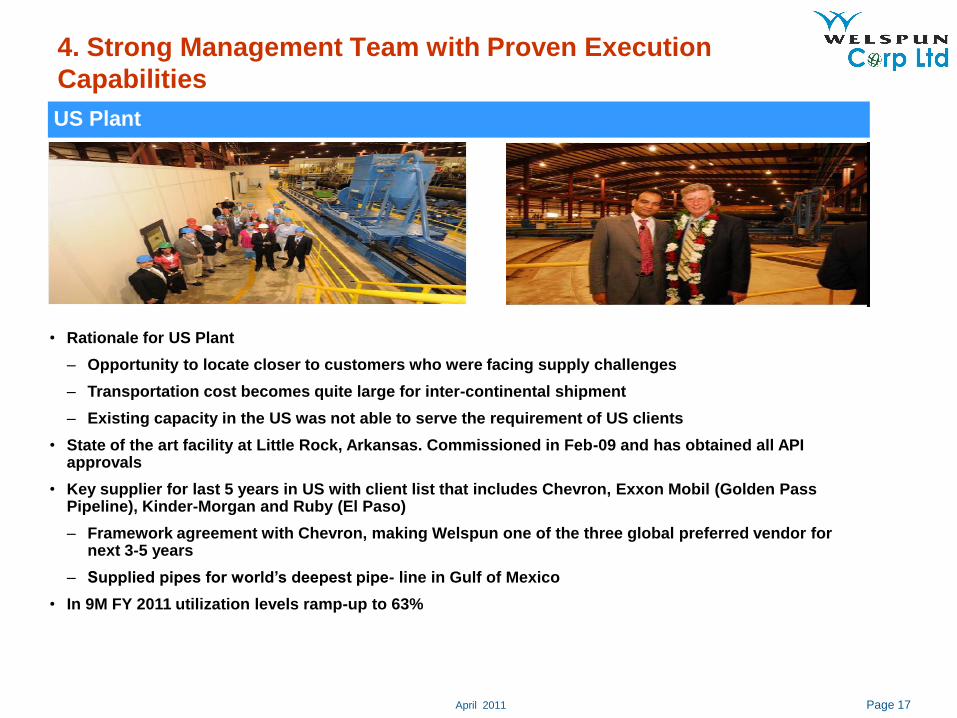
4. Strong Management Team with Proven Execution
Capabilities
US Plant
• Rationale for US Plant
– Opportunity to locate closer to customers who were facing supply challenges
– Transportation cost becomes quite large for inter-continental shipment
– Existing capacity in the US was not able to serve the requirement of US clients
• State of the art facility at Little Rock, Arkansas. Commissioned in Feb-09 and has obtained all API approvals
• Key supplier for last 5 years in US with client list that includes Chevron, Exxon Mobil (Golden Pass Pipeline), Kinder-Morgan and Ruby (El Paso)
– Framework agreement with Chevron, making Welspun one of the three global preferred vendor for next 3-5 years
– Supplied pipes for world‟s deepest pipe- line in Gulf of Mexico
• In 9M FY 2011 utilization levels ramp-up to 63%

April 2011 Page 18
Notes
1. Excluding Other Income
2. Using avg. exchange rate of US$1 = Rs.44.28 from 01-Apr-05 till 31-Mar-06
3. Using avg. exchange rate of US$1 = Rs.43.51 from 01-Apr-06 till 31-Mar-07
4. Using avg. exchange rate of US$1 = Rs.40.29 from 01-Apr-07 till 31-Mar-08
10,493
3,384
1,655
6,555 6,348
13,186
0
4,000
8,000
12,000
2005-06 2006-07 2007-08 2008-09 2009-10 9M-2010-11(3) (4) (7)(5)(2)
37 78
5. Exponential Growth in Revenues & Margins
371
501
641695
814
640
154
356387
50
250
450
650
850
2005-06 2006-07 2007-08 2008-09 2009-10 9M -2010-11
(„000 MT) (INR MM)CAGR (06-10): 22%
(INR MM)
5,150
1,425
614
3,408
2,135
6,104
0
1,500
3,000
4,500
6,000
2005-06 2006-07 2007-08 2008-09 2009-10 9M -2010-11
0.0%
4.0%
8.0%
12.0%
16.0%
PAT Margin (%)(INR MM)CAGR (06-10): 68% CAGR (06-10): 78%
163 138US$ MM
Sales (volume) Consolidated Revenues (1)
EBITDA (1) Profit After Tax
1,250US$ MM 991413(2)
617(3) (4) (5)
Notes
5. Using avg. exchange rate of US$1 = Rs.45.91 from 01-Apr-08 till 31-Mar-09
6. Includes extraordinary items : forex provisioning of INR1,256MM, Inventory write-down of INR 385MM,
ECB provisions of INR 178MM
7. Using avg. exchange rate of US$1 = Rs.44.90 from 01-Apr-09 till 31-Mar-10
8. Includes recovery of past forex provisioning ( in FY09) , which is reflected in better realization and cost of material
9. Exchange rate of US$1 = Rs.44..705 as at 31-Dec-10
(3) (4) (5)(2)14 33 85 47
1,637(7)
294 136(7)
18,29826,834
39,945
57,395
73,503
58,604
0
25,000
50,000
75,000
100,000
2005-06 2006-07 2007-08 2008-09 2009-10 9M-2010-11
CAGR (05-10): 42%
(8)
# Plates
(#)(#)
(#)
(9)1311
235(9)
115(9)
US$ MM
(6)
(6)

April 2011 Page 19
4.2
8.7
18.3
11.5
28.4
23.3
0
7
14
21
28
35
2005-06 2006-07 2007-08 2008-09 2009-10 9M-2010-11
CAGR (06-10): 61%
14.7%
19.5%
11.4%
17.3%19.1%
12.2%
21.8% 21.7%
13.7%
21.0%
0%
5%
10%
15%
20%
25%
2005-06 2006-07 2007-08 2008-09 2009-10
R OC E R OE
5. Exponential Growth in Revenues & Margins
EPS (Rs./Share)(Diluted)
ROCE and ROE (%)
April 2011 Page 20
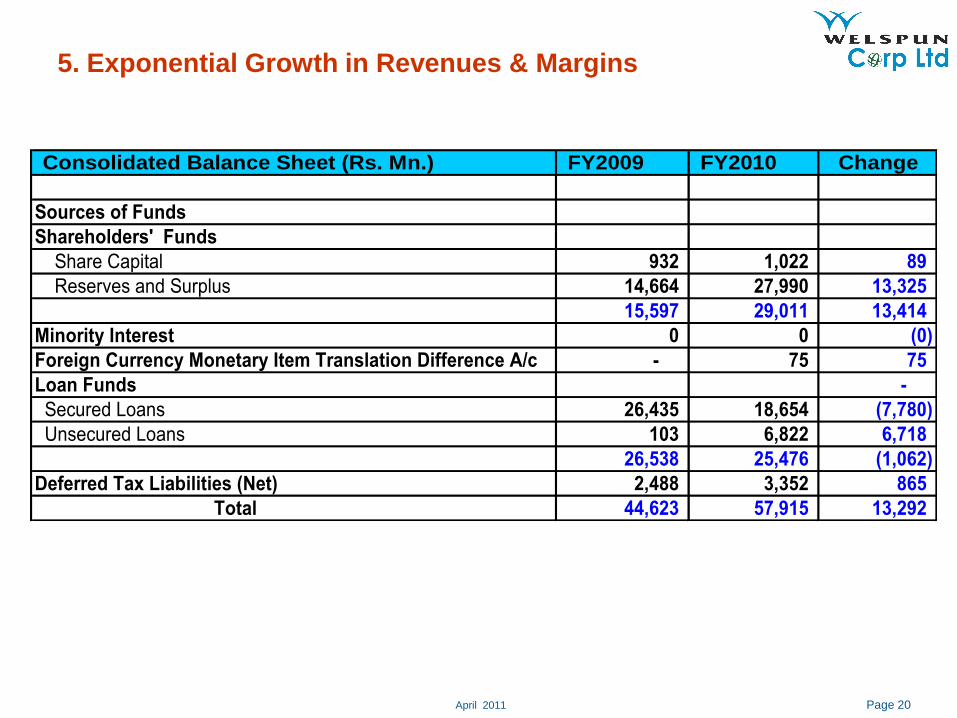
5. Exponential Growth in Revenues & Margins
Consolidated Balance Sheet (Rs. Mn.) FY2009 FY2010 Change
Sources of Funds
Shareholders' Funds
Share Capital 932 1,022 89
Reserves and Surplus 14,664 27,990 13,325
15,597 29,011 13,414
Minority Interest 0 0 (0)
Foreign Currency Monetary Item Translation Difference A/c - 75 75
Loan Funds -
Secured Loans 26,435 18,654 (7,780)
Unsecured Loans 103 6,822 6,718
26,538 25,476 (1,062)
Deferred Tax Liabilities (Net) 2,488 3,352 865
Total 44,623 57,915 13,292

April 2011 Page 21
5. Exponential Growth in Revenues & Margins
Consolidated Balance Sheet (Rs. Mn.) FY2009 FY2010 Change
Application Of Funds
Fixed Assets
Gross Block 34,844 38,810 3,966
Less:Depreciation/Amortisation/Impairment 3,847 5,889 2,042
Net Block 30,996 32,921 1,924
Capital Work-In-Progress 5,808 5,412 (396)
36,804 38,333 1,529
Investments 1,140 1,596 456
Foreign Currency Monetary Item Translation Difference A/c 355 - (355)
Current Assets, Loans and Advances -
Income Accrued on Investments 113 13 (99)
Inventories 26,113 20,322 (5,791)
Sundry Debtors 4,601 8,077 3,476
Cash and Bank Balances 9,470 17,028 7,558
Loans and Advances 5,552 6,031 479
45,848 51,471 5,623
Less : Current Liabilities and Provisions -
Current Liabilities 38,955 32,291 (6,663)
Provisions 601 1,219 618
39,555 33,510 (6,045)
Net Current Assets 6,293 17,961 11,668
Preliminary Expenses 0 0 (0)
Deferred Revenue Expenditure 31 25 (5)
Total 44,623 57,915 13,292

April 2011 Page 22
Consolidated Balance Sheet as on 30th Sept 2010
Particulars
H1 FY 2011
As at 30.09.2010
Unaudited (Rs. Mn)
A Sources of Funds
1 Shareholders Fund
a Share Capital 1,023
b Reserves and Surplus 31,470
c Share Application Money -
d Minority Interest 1,548
2 Loan Funds 38,913
3 Foreign Currency Monetory Item Translation Difference Account 38
4 Deferred Tax Liabilities-Net 3,761
Total 76,753
B Application of Funds
1 Fixed Assets 40,296
2 Build Operate and Transfer Projects Expenditure 4,159
3 Investments 13,065
4 Foreign Currency Monetory Item Translation Difference Account
5 Current Assets, Loans and Advances
a Inventories 19,002
b Sundry Debtors 12,998
c Cash and Bank Balances 13,132
d Loans and Advances 4,964 Less
4 Current Liabilities and Provisions
a Current Liabilities 29,404
b Provisions 1,482 5 Miscellaneous Expenditure 25
Total 76,753

April 2011 Page 23
9M & Q3 FY 2010-11 Highlights
Summary of 9M & Q3 FY11 (Rs. Million)
Breakdown of Production and Sales in MT
Major Highlights in 9M FY11
• Sales strengthened by volume growth and consolidation
of Infra business and is up by 2%
• Interest costs lower by 42%, due to repayment of high
cost debt
• Depreciation is higher by 17%, due to capitalization of
new capacities and consolidation of Infra business
• PAT at Rs. 5,150 million reflects the growth of 16% on a
YoY basis
• Net Debt of Rs 11,120 million and Net Debt Equity Ratio
of 33%
Status of ProjectsCapacity of Pipes is being increased to 2.2 million MTPA:
• LSAW expansion of 350 K MTPA at Anjar in Q1 FY 2012.
• HSAW plant of 100K MTPA at Karnataka is now fully
operational.
• Saudi Plant commences production in Q4 FY11
New Initiatives• The company successfully completed the investment in
the Saudi plant, which has commenced production in Q4
FY11
• Implementation of L-SAW plant at Anjar is on schedule,
and is likely to be commissioned by the end of Q1 FY12
• The Mandya plant in Karnataka has started production
and is ramping up to achieve desired level of production.
• Welspun Middle East is establishing its presence in
Dubai to cater to the bouyant markets of Middle East and
Africa.
Particulars Q3 FY11 Q3 FY10Growth
%
9M
FY11
9M
FY10
Growth
%
Sales 15,862 16,395 -3% 58,604 57,528 2%
Reported EBITDA* 3,154 3,561* -11% 10,493 10,336* 2%
Interest 454 428 6% 1,046 1,790 -42%
Depreciation 653 511 28% 1,808 1,541 17%
PAT 1,465 1,668 -12% 5,150 4,439 16%
Cash PAT 2,297 2,300 7,481 6,191 21%
EPS (Rs./Share) -
Diluted6.65 7.83 -15% 23.26 20.91 11%
Reported EBITDA
Margin (%)19.9% 21.7% 17.9% 18.0%
PAT Margin (%) 9.2% 10.2% 8.8% 7.7%
Production Volume (in
tons) Q3 FY11 Q3 FY10 Change 9M FY11 9M FY10 Change
Total Pipes Consolidated 211,787 156,679 35% 719,613 613,544 17%
Plates & Coils 144,279 93,586 54% 372,635 276,749 35%
Sales Volume (in tons) Q3 FY11 Q3 FY10 Change 9M FY11 9M FY10 Change
Total Pipes Consolidated # 163,611 170,216 -4% 639,862 610,319 5%
Plates & Coils* 124,511 112,329 11% 355,937 288,279 23%
Breakdown of Production and Sales in Metric Tonnes (MT)
*Reported EBITDA and Profits for the quarter and nine months period ended 31st December 2009 includes Foreign Exchange realignment gain of Rs 590 million
and Rs 1,260 million.
# Company recorded higher inventory of pipes in Q3 FY11due to delay in shipment of certain export orders. The above inventory of finished pipes is being
dispatched in Q4 FY11 ensuring that the company achieves its annual sales target and records its highest ever sales in FY11.
* Includes Internal Sales

April 2011 Page 24
Summary
2Robust Business
Fundamentals
& Healthy Order Book
• Strong volume growth
• Order Book in excess of US$
1.4 Bn
• Capacities of global size
• Comprehensive product mix
Strong Management Team
with Proven Execution
Capabilities
• Recognized by the FT as the
second largest steel pipe
producer in the world in 2007
• First Indian company to supply
pipes for offshore projects in US
4 3 Global Footprint & Pre Approved with O&G Majors
• Presence across more than 25 countries
• Pre-approved with more than 50 O&G Majors
1 Strong Industry
Fundamentals
• Capital intensive, high
barriers to entry
• North America expected to
lead demand
5 Exponential Growth in
Revenues & Margins
• Revenues have grown at a
CAGR of 42% over the last
five years
• PAT has grown at a CAGR of
78% in the same period
1 Strong Industry
Fundamentals
• Capital intensive, high
barriers to entry
• North America expected to
lead demand

April 2011 Page 25
Welspun on the Path of Global Leadership
Scale of operations through large economic plants across the globe Scale Leadership
Adopt and innovate cutting-edge technology to satisfy stringent requirements of customers
Technology Leadership
Produce world class products at the least cost and maintain competitive edgeCost Leadership
Consistent focus on quality at all levels; be the best in delighting customersQuality Leadership
Most efficient and effective processes to achieve optimal utilizationsProcess Leadership
Best in class people : Produce extraordinary resultsPeople Leadership
Global Leadership Serve Globally, Act Locally
April 2011 Page 26
Key questions on recent updates
What is Welspun's exposure to current civil proceedings?
During the previous year one of the customer reported defect in the pipes supplied
alleging grade of steel used did not meet the specifications, the company replaced the
defective pipes and also provided for the expected loss on this account. During the year
the said customer initiated legal action against the company in the United States of
America claiming loss / damages of $ 66 million on account of defects in the pipes
supplied, consequently the company also initiated legal action against the steel supplier
claiming corresponding loss / damages it may suffer on account of this claim of the
customer. Hence the company does not expect any liability on account of the claim
against it.

April 2011 Page 27
Thank You
For further details, please contact:
Navin Agarwal
AVP - Corporate Affairs
Email: [email protected]
Akhil Jindal
Director - Corporate Affairs
Email: [email protected]
Company Website: http://www.welspuncorp.com