Olympic Industries Limited is the market leader in biscuit ... · PDF fileOlympic Industries...
22
EQUITY VALUATION REPORT Olympic Industries Limited is the market leader in biscuit, cookies and confectionary market in Bangladesh having market share of 39% of the total branded market. The company is capturing the market share by launching new products and strategic pricing. EBL Securities Ltd. (EBLSL) is one of the fastest growing full-service brokerage companies in Bangladesh and a fully owned subsidiary of Eastern Bank Limited. EBLSL is also one of the top ten leading stock brokerage houses of the country. EBL Securities Limited is the TREC-holder of both exchanges of the country; DSE (TREC# 026) and CSE (TREC# 021) A fully owned subsidiary of
Transcript of Olympic Industries Limited is the market leader in biscuit ... · PDF fileOlympic Industries...

EQUITY VALUATION REPORT
Olympic Industries Limited is the market
leader in biscuit, cookies and confectionary
market in Bangladesh having market share of
39% of the total branded market. The
company is capturing the market share by
launching new products and strategic pricing.
EBL Securities Ltd. (EBLSL) is one of the fastest growing full-service brokerage companies in Bangladesh and a fully
owned subsidiary of Eastern Bank Limited. EBLSL is also one of the top ten leading stock brokerage houses of the
country. EBL Securities Limited is the TREC-holder of both exchanges of the country; DSE (TREC# 026) and CSE (TREC#
021)
A fully owned subsidiary of

Olympic Industries Limited DSE: OLYMPIC BLOOMBERG: OLYMPI:BD Target Price: BDT 334.19, Current Price: BDT 285.70 Rating: Overweight Valuation date: 10th August 2017
Analyst:
Asaduzzaman Ashik [email protected]
2015-16
Act. 2016-17
Exp. 2017-18
Exp. 2018-19
Exp.
Financial Information (BDT mn):
Net Sales 10,965 12,755 15,338 17,654
Gross Profit 3,691 4,298 5,215 5,826
EBITDA 2,346 2,868 3,312 3,586
Operating Profit 2,116 2,513 2,960 3,231
Profit After Tax 1,624 1,903 2,200 2,419
Total Assets 7,641 9,172 11,093 12,563
Total Debt 547 627 1,160 1,256
Total Equity 4,531 5,670 6,670 7,689
Retained Earnings 2,627 3,671 4,671 5,690
Cash & FDR 3,952 5,142 6,622 7,853
Margin:
Gross Profit 33.7% 33.7% 34.0% 33.0%
EBITDA
21.4% 22.5% 21.6% 20.3%
Operating Profit 19.3% 19.7% 19.3% 18.3%
Pretax Profit 20.1% 20.5% 19.7% 18.8%
Net Profit 14.8% 14.9% 14.3% 13.7%
Growth (YoY):
Sales 23.9% 16.3% 20.3% 15.1%
Gross Profit 40.1% 16.5% 21.3% 11.7%
Operating Profit 48.2% 18.7% 17.8% 9.1%
Net Profit 49.0% 17.2% 15.6% 10.0%
Profitability:
ROA 24.2% 22.6% 21.7% 20.4%
ROE 41.0% 37.3% 35.7% 33.7%
Payout Ratio 46.9% 63.1% 63.6% 66.1%
PEG ratio 0.83 1.77 1.69 2.41
Leverage:
Debt Ratio 7.2% 6.8% 10.5% 10.0%
Debt-Equity 12.1% 11.1% 17.4% 16.3%
Altman Z-Score 23.6 24.6 15.7 15.8
Valuation:
EPS (BDT) 8.53 9.5 11.0 12.1
NAVPS (BDT) 23.8 28.4 33.4 38.5
P/NAV (x) 14.51 10.2 8.7 7.5
EV/EBITDA 28.10 20.3 17.7 16.4
EV/Sales 6.01 4.57 3.82 3.32
P/E Ratio 40.5 30.5 26.4 24.0
Price-Volume Movement
We conducted a valuation on Olympic Industries based on Discounted Cash Flow method and Relative Valuation models while assuming CAGR 17% in total revenue for next 5-Years. Currently, OLYMPIC Industries is traded at BDT 285.70 (as on 10th August, 2017). In our valuation, the target price for OLYMPIC based on DCF and Relative Valuation is determined at BDT 334.19 per share.
0
1000000
2000000
150
250
350
450Price-Volume Movement of Olympic
VOLUME CLOSE PRICE
Company Fundamentals
Sector Food & Allied
Market Cap (BDT mn) 57,122.5
Market weight 1.5%
Paid-up Capital (BDT mn) 1,999.4
No. of Share Outstanding (in mn) 199.9
Free-float Shares (Inst.+For.+Public) 71.1
3 Months Avg. Daily Turnover (BDT mn) 29.2
3 Months Avg. Daily Volume 103,984
3 Months Return -2.3%
52-week price range (BDT) 266.3- 336.20
Olympic Industries is the market leader in biscuit, cookies and confectionary market in Bangladesh having market share of 39% of the total branded market for biscuits and confectionary items. The company is capturing the market share by launching new products and strategic pricing.
The revenue of Olympic Industries is mainly from the biscuit and confectionary items and most of the sales are from domestic arena. So, dominating on the domestic market is fairly easier for Olympic Industries with huge market share.
Olympic Industries has noted 16.25% CAGR in total revenue while 36.68% CAGR in net profit over the period 2011-12 to 2015-16. Olympic’s maximum production efficiencies along with the economies of scale over the higher sales volume has driven reasonable growth in net profit.
Investment in expansion projects for Olympic Industries is remarkable. They invested BDT 970 mn in FY 2014 and 2015. Following the trend, they have already invested around BDT 652 mn in PPE in this fiscal year of 2016-17. We assume that Olympic Industries will continue the historical trend of investment in expansion projects in coming years.
Olympic Industries have 8 biscuits production lines and the 9th line of biscuits production has been started commercial operation since May 2017 and all other vertical expansion projects like Carton manufacturing line, Snacks & Noodles manufacturing line will hopefully start operations within the year end of 2017.
The key raw materials used by the Olympic Industries are wheat, egg, palm oil, soya bean oil, sugar etc. According to World Bank, there will be no significant changes in the price of the raw materials in next 3 or 4 years , Olympic will be able to stabilize the costs from raw materials and sustain the sales growth.
VAT exemption on Palm Oil and Soya Bean Oil has been extended up to June 30, 2019 in the budget of 2017-18 which will help Olympic to stabilize their direct cost of raw materials for another two years.

Valuation Report on Olympic Industries Limited Date: 10th August, 2017
Current Price (BDT): 285.70 Target Price (BDT): 334.19
2
The Industry FMCG Sector overview
Growth of market size of this sector is mostly dependent on population growth in the economy and also the income condition (purchasing power) of consumers. The annual market size of Bangladeshi branded FMCG industry is BDT 268.7bn, as on June 2016 and after 2010 the market has grown at 12.8% CAGR (Cumulative Annual Growth Rate) on the same period.
Source: AC Nielsen Data
The whole target market is divided into two segments based on spending nature- urban & rural. As the competition in the industry is so intense, differentiation is the most useful weapon to maintain sustainability and the companies differentiate their goods considering these two segments.
Biscuit market overview:
Biscuits and confectionary items are considered as one of the preferable snacks of Bangladeshi consumers especially for the middle income class group who are driving the biscuits market to grow rapidly. The biscuits industry in Bangladesh comprised of organized industrialized manufacturers and unorganized small and local producers throughout the country. Stimulated by growing demand, particularly from the lower middle and middle income groups, a large number of firms have joined the foray in the last several years. Some old players have also expanded their production capacity. The biscuit market is growing mainly because of consumers' hunt for hygienically prepared foods. The market insiders believe that the biscuit & confectionary market will grow at a rate of 15% annually in the next 10-15 years where the organized segment is expected to grow at around 10%1.
Market Size of Biscuits & Confectionary Industry in Bangladesh:
The current market size of Biscuit, Bakery and Confectionary items is BDT 50 to 60 billion. The current market size for this industry is as follows:
Source: Daily Star, March 27, 2017
1 http://www.thedailystar.net/business/biscuit-market-grows-fast-demand-rises-1381864
12.8% CAGR in this
industry since 2010
Annual Market size
of FMCG Industry BDT
268.7 bn
15% expected growth in
coming years
Current Market Size
BDT 50 to 60 bn

Valuation Report on Olympic Industries Limited Date: 10th August, 2017
Current Price (BDT): 285.70 Target Price (BDT): 334.19
3
The market was earlier dominated by small bakeries. But now, about 40% to 50% of the total market shares are taken by the large and well-known brands of the country. At present, the annual market for branded biscuits is nearly BDT 30 bn now2. Demand for biscuits is growing as entrepreneurs have shifted to automation in baking and consumers are looking for a variety of quality foods at low prices.
Source: Daily Star, March 27, 2017
Market Share of local and Imported Biscuits:
The local manufacturers now meet 90% to 95% of the domestic demand and the rest is imported3. The local manufacturers have been able to win the confidence of consumers by improving food quality and keeping prices reasonable. As a result, they have been able to sustain their position in the market by driving away imported products from India, Malaysia and Indonesia. Some firms even export biscuits. The market share is as follows:
Major Classifications Market share
Local Biscuits 90% to 95%
Imported Biscuits 5% to 10%
Source: Daily Star, March 27, 2017
Biscuits Price in Bangladesh:
Based on the data from Bangladesh Bureau of Statistics, the current price of Biscuits per kg is BDT 234.17. The price trend seems upward over the year 2011 to 2016. The historical prices of biscuits is as follows:
Source: BBS Pocket Book, 2016
2 http://www.thedailystar.net/business/biscuit-market-grows-fast-demand-rises-1381864 3 Source: http://www.thedailystar.net/business/biscuit-market-grows-fast-demand-rises-1381864
153169
221 220 234
2011-12 2012-13 2013-14 2014-15 2015-16
Biscuits Price per KG (BDT)
BDT 30 bnBranded Biscuits
Market Size

Valuation Report on Olympic Industries Limited Date: 10th August, 2017
Current Price (BDT): 285.70 Target Price (BDT): 334.19
4
Major Players in the Market: Olympic Industries is the market leader having around 39% market share of the branded biscuits market. The following table contains the major market players in the market and their most popular brands:
No. Company Names Popular Brands
1. Olympic Nutty, Energy, Tip, Milk Marie, Queen Marie, Malai Cream, Orange, Nutty real peanut, Dry cake biscuit
2. Pran Special Toast, All Time Cookies, Dry Cake Biscuit, Sweet Toast
3. Goldmark Orange Cream, Milk Cookies, Coconut Cookies, Low Sugar Biscuit, Chocolate chips, Butter
4. Ifad Tea Time, Kaju Delight, Butter Delight, Choco Delight, Jeera Biscuit, Cheesy Bites
5. Kishwan Toast, Chocolate Cookies, Horlicks Biscuit, Ovaltin, Fiore Butter
6. Bangas Grand Choice, Choco Cream, Mango Slice, Pineapple
7. Danish Toast, Dry cake biscuit, Doreo, Danish Lexus, O La La Potato
8. Nabisco Glucose, Milk Cream, Crunchi, Elachi
9. Al-Amin Orbit, Cosmos, Deena, Pineapple, Racie
10. Cocola Sweet Toast, Chocolate Biscuit
11. Multi Marie Gold, Nimki
12. Haque Digestive, Mr. Cookie, Ding Dong, Milk Chocolate, Mr. coconut, Mr. Milk
13. Bengal Orange Cake, Big Bite
Source: EBLSL Research
At present, nearly 5,000 bread and baked goods makers, including 100 automatic and semi-automatic bakeries, are operating in this segment. Some large firms like Olympic, Pran make biscuits through fully automated machines. The following graph depicts the classification:
Source: The Independent, May 7, 2017
Major Growth Drivers:
1. Urban Population in Bangladesh: People who live in urban areas are the main targeted customers for the biscuits and confectionary items in Bangladesh. The average urban population growth is about 3.66% (YoY) from 2006 to 2016. The following graph shows the historical trend of urban population in Bangladesh:
Source: World Bank Data
40.00 41.55 43.11 44.70 46.35 48.06 49.82 51.61 53.43
55.25 57.09
2006 2007 2008 2009 2010 2011 2012 2013 2014 2015 2016
Urban Population in Bangladesh (in mn)
15
35
50
Automated Factories in Bangladesh
Mega Factories Large Factories Medium Size Factories

Valuation Report on Olympic Industries Limited Date: 10th August, 2017
Current Price (BDT): 285.70 Target Price (BDT): 334.19
5
2. Middle Class Income Category: Like urban people, middle class people are also the target segment for light snacks like biscuits and other confectionary items. At present, 20% of the total population belongs to the middle class income category compared with 24.1% in India. According to the data from Household Income and Expenditures (HIES), income for middle class income category ranges $2 or $3 per day (per day per person basis). Researchers believe that 25% of the total population will belong to middle class income category in 2025 and 33% will belong in 2030.
Source: Financial Express, January 16, 2016
3. Stable Raw Material price forecast:
Wheat, Sugar, Palm Oil, Soybean Oil, Eggs etc. are the main raw materials for manufacturing biscuits and confectionary items. According to the forecasts of World Bank, there will be no significant price changes in the raw materials of the biscuits and confectionary items. The direct costs associated with raw materials should be stable for biscuits manufacturers in coming years. The historical and forecasted prices of the raw materials are as follows:
A. Sugar: At present, sugar is priced at USD 0.40 per kg in global market. In 2015, sugar price was USD 0.30 worldwide. According to the forecasts of World Bank, the price of sugar may remain unchanged in 3 years and then fall slightly.
Source: World Bank forecast, April 26, 2017
B. Wheat: Wheat is currently priced at USD 150 per MT where it was USD 312 in 2013 in global market. The price trend of wheat is downward from 2013 to 2017. Based on the forecasts of World Bank, the price of wheat may slightly increase due to the excessive demand worldwide.
Source: World Bank forecast, April 26, 2017
0.39 0.37
0.30
0.40 0.40 0.40 0.40
2013 2014 2015 2016 2017 E 2018 E 2019 E
Historical & Forecasted Sugar Price (USD/KG)
312285
204167 150 156 161
2013 2014 2015 2016 2017 2018 2019
Historical & Forecasted Wheat Price (USD/MT)
20% of total Population are Middle
class
USD 2 to 3 daily income
25% of total Population will belong to Middle
class in 2025
33% of total Population will belong to Middle
class in 2030
Valuation Report on Olympic Industries Limited Date: 10th August, 2017
Current Price (BDT): 285.70 Target Price (BDT): 334.19
6
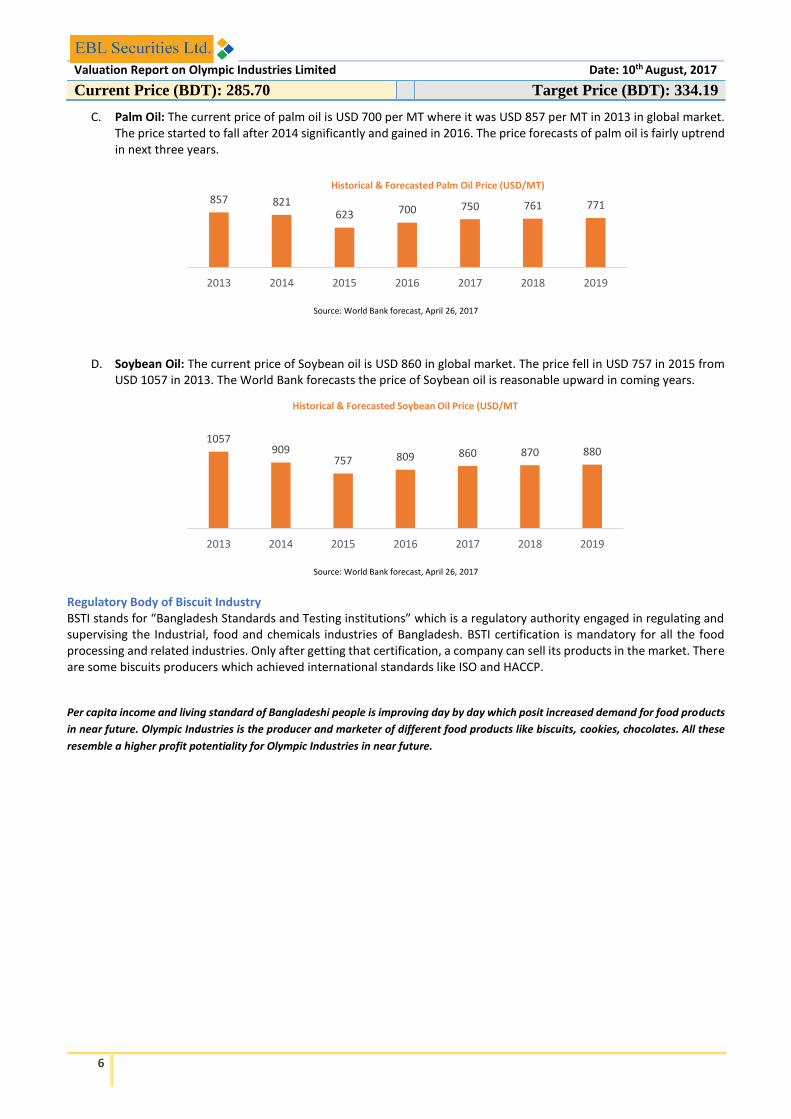
C. Palm Oil: The current price of palm oil is USD 700 per MT where it was USD 857 per MT in 2013 in global market. The price started to fall after 2014 significantly and gained in 2016. The price forecasts of palm oil is fairly uptrend in next three years.
Source: World Bank forecast, April 26, 2017
D. Soybean Oil: The current price of Soybean oil is USD 860 in global market. The price fell in USD 757 in 2015 from USD 1057 in 2013. The World Bank forecasts the price of Soybean oil is reasonable upward in coming years.
Source: World Bank forecast, April 26, 2017
Regulatory Body of Biscuit Industry BSTI stands for “Bangladesh Standards and Testing institutions” which is a regulatory authority engaged in regulating and supervising the Industrial, food and chemicals industries of Bangladesh. BSTI certification is mandatory for all the food processing and related industries. Only after getting that certification, a company can sell its products in the market. There are some biscuits producers which achieved international standards like ISO and HACCP.
Per capita income and living standard of Bangladeshi people is improving day by day which posit increased demand for food products
in near future. Olympic Industries is the producer and marketer of different food products like biscuits, cookies, chocolates. All these
resemble a higher profit potentiality for Olympic Industries in near future.
857 821623 700 750 761 771
2013 2014 2015 2016 2017 2018 2019
Historical & Forecasted Palm Oil Price (USD/MT)
1057909
757 809 860 870 880
2013 2014 2015 2016 2017 2018 2019
Historical & Forecasted Soybean Oil Price (USD/MT
Valuation Report on Olympic Industries Limited Date: 10th August, 2017
Current Price (BDT): 285.70 Target Price (BDT): 334.19
7
THE COMPANY: OLYMPIC INDUSTRIES LIMITED
Company Profile
Olympic Industries Limited is engaged in manufacturing, marketing, distributing and selling of biscuits, confectionary and bakery products and dry cell battery. Olympic Industries Limited, initially known as Bengal Carbide Limited, was incorporated in 1979 as a public limited company. The commercial operation was initiated in 1982. The major product was then Dry cell battery. In 1996, the company changed its name to Olympic Industries ltd from Bengal Carbide ltd after it had started commercial production of biscuits and confectionary items. In 1984, the company was listed on Dhaka Stock Exchange and in 1996, they listed on Chittagong Stock Exchange. As a part of business diversification, they merged with Tripti Industries and launched Olympic Ballpoint pen in 2008.
Plant Location: Biscuit & Bakery- Madanpur, Lolati (Narayanganj) Battery- Kutubpur (Narayanganj)
Key Personnel: Mohammad Bhai (Chairman), Mubarak Ali (Managing Director)
Key Brands: Energy Plus, Nutty, Tip, Lexus, Olympic Gold
Business Profile
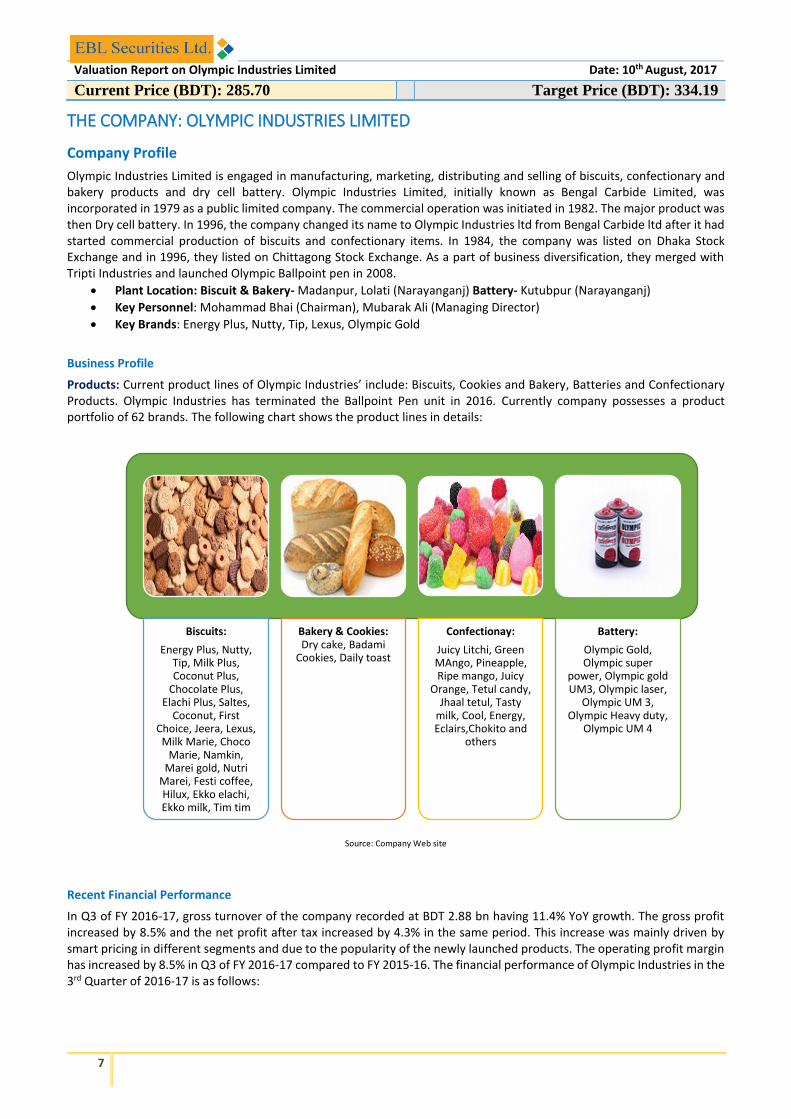
Products: Current product lines of Olympic Industries’ include: Biscuits, Cookies and Bakery, Batteries and Confectionary Products. Olympic Industries has terminated the Ballpoint Pen unit in 2016. Currently company possesses a product portfolio of 62 brands. The following chart shows the product lines in details:
Source: Company Web site
Recent Financial Performance In Q3 of FY 2016-17, gross turnover of the company recorded at BDT 2.88 bn having 11.4% YoY growth. The gross profit increased by 8.5% and the net profit after tax increased by 4.3% in the same period. This increase was mainly driven by smart pricing in different segments and due to the popularity of the newly launched products. The operating profit margin has increased by 8.5% in Q3 of FY 2016-17 compared to FY 2015-16. The financial performance of Olympic Industries in the 3rd Quarter of 2016-17 is as follows:
Biscuits:
Energy Plus, Nutty, Tip, Milk Plus, Coconut Plus,
Chocolate Plus, Elachi Plus, Saltes,
Coconut, First Choice, Jeera, Lexus,
Milk Marie, Choco Marie, Namkin,
Marei gold, Nutri Marei, Festi coffee, Hilux, Ekko elachi, Ekko milk, Tim tim
Bakery & Cookies: Dry cake, Badami
Cookies, Daily toast
Confectionay:
Juicy Litchi, Green MAngo, Pineapple, Ripe mango, Juicy
Orange, Tetul candy, Jhaal tetul, Tasty
milk, Cool, Energy, Eclairs,Chokito and
others
Battery:
Olympic Gold, Olympic super
power, Olympic gold UM3, Olympic laser,
Olympic UM 3, Olympic Heavy duty,
Olympic UM 4

Valuation Report on Olympic Industries Limited Date: 10th August, 2017
Current Price (BDT): 285.70 Target Price (BDT): 334.19
8
Shareholding Pattern and the Board of Directors: The latest shareholding composition is as follows:
Sponsor/Director (%)
Govt. (%)
Institute (%)
Foreign (%)
Public (%)
As on Jun 30, 2017 28.92 0.00 12.28 42.49 16.31
As on Jun 30, 2016 28.92 0.00 19.22 39.07 12.79
As on Dec. 29, 2016 28.92 0.00 12.00 42.88 16.19
Source: DSE website
The detailed breakdown of shareholdings of Olympic Industries for 2015-16 and 2014-15 is as follows:
Composition of Share Holdings
June 30, 2016 June 30, 2015
No. of Shares % No. of Shares %
Directors & Sponsors
55,073,733 28.92 50,026,568 31.34
Institutions 36,596,963 19.22 27,651,809 17.43
Foreign Investors 74,394,171 39.07 54,605,053 34.41
General Public 24,354,120 12.79 26,398,226 16.63
Source: Company Annual Reports
Olympic Industries has experienced board of directors consisting of 7 members. The names of the Board of Directors are as follows:
Board of Directors
Mohammad Bhai Chairman
Mubarak Ali Managing Director
Aziz Mohammad Bhai Director
Safinaz Bhai Director
Munir Ali Director
Noorbanu Virji Independent Director
Begum Sakwat Banu Independent Director
Source: Company Annual Report
Revenue Decompositions: The major sources of revenue of Olympic Industries are Biscuits, Bakery and Confectionary units, Battery unit and Ball point pen unit. Olympic Industries has terminated the Ballpoint Pen unit in 2016. Revenue from the Ball point pen unit is 0.63% in FY 2015-16. Biscuits supplies the major sources of revenue. In 2015-16, 96.14% of total revenue was derived from Biscuits and confectionary units. The contribution of biscuits in total revenue has increased year by year from 2011-12. The dry cell unit contributed 3.23% in total revenue in 2015-16. The historical revenue decomposition of Olympic Industries is as follows:
Net profit after tax 4.3% YoY growth
Gross profit 8.5%
YoY growth
Gross turnover
11.4% YoY growth

Valuation Report on Olympic Industries Limited Date: 10th August, 2017
Current Price (BDT): 285.70 Target Price (BDT): 334.19
9
Source: Company Annual Reports
During the year 2015-16, net turnover from domestic sales contributed 99.56% of the total net revenue while net turnover from biscuits & confectionery items export contributed 0.44% of the total revenue. The export of Olympic Industries has increased. In FY 2014-15, revenue from export sales was only 0.07% of the total revenue.
Source: Company Annual Reports
Production Capacity Utilization: The major products of Olympic Industries include Biscuits, Confectionary items and Battery. Though the company does not have any planning regarding the expansion project of Battery unit but they have undertaken several vertical expansion projects. They are as follow:
Carton manufacturing line PET sheet line Noodles Manufacturing line Snacks Manufacturing Line
After the completion of these projects, the existing production capacity of Olympic Industries will increase significantly.
90.49% 91.66%93.27%
95.10% 96.14%
4.96%4.62%
4.23%3.32%
3.23%4.55% 3.72% 2.50% 1.58% 0.63%
2011-12 2012-13 2013-14 2014-15 2015-16
Revenue Decomposition
Biscuits, Confectionary & Bakery Battery Ball Point Pen
100.00%
99.98%
99.91%
99.93%
99.66%
0.00%
0.02%
0.09%
0.07%
0.34%
99.40% 99.50% 99.60% 99.70% 99.80% 99.90% 100.00%
2011-12
2012-13
2013-14
2014-15
2015-16
Sales Break Down
Domestic Exports

Valuation Report on Olympic Industries Limited Date: 10th August, 2017
Current Price (BDT): 285.70 Target Price (BDT): 334.19
10
The historical production capacity and actual production of Battery Unit is as follows:
Source: Company Annual Reports
The historical production capacity and actual production of Biscuit Unit is as follows:
Source: Annual Reports of the Company
Ongoing Expansion Projects: Olympic Industries Limited has undertaken different expansion projects to meet the excessive local market demand. Among them, Carton manufacturing unit, Snacks manufacturing line and Noodles manufacturing lines is expected to start commercial operations within the year end of 2017. The current status of the ongoing projects are as follows:
Expansion Projects Total Cost/Capacity Declaration Date Commencement Date
PET sheet forming & Tray making Unit
BDT 56mn/10mn trays 31/12/2015 29/01/2017
8th Biscuit Line BDT 104mn/9600MT 31/12/2015 15/11/2016
Cookies Line (9th) BDT 133 mn/7200MT 04/05/2016 02/05/2017
Land (N.gonj) BDT 3.475mn/5.59 decimals 14/08/2016 -
Land (N.gonj) BDT 31.85mn/44 decimals 08/08/2016 -
Land (Lalita) BDT 6.8mn/34 decimals 08/05/2016 -
Carton Manufacturing line BDT 120mn/66mn Pcs 18/01/2017 2017
Snacks Manufacturing Line BDT 77mn/3700MT 18/01/2017 2017
Noodles Line BDT 187mn/9000MT 18/01/2017 2017
Factory Building BDT 250mn/88000sqft 18/01/2017 2017
Key Financial Performance & Forecast: The overall business performance of Olympic Industries seems good. The total sales of Olympic Industries Limited increased year by year. The increased sale was driven by the regular introduction of new products over the years. The company recognized the increased market demand and initiated to meet the market with expanding the capacity of productions. With the upcoming production lines and increased demand of the biscuits, Olympic Industries will be able to maintain the
103118 118 118 118 118
30 40 47 50 41 50
2010-11 2011-12 2012-13 2013-14 2014-15 2015-16
Battery Production Capacity & Actual Production (in mn pcs)
Production Capacity Actual Production
42,480 49,339
73,656 76,886 81,068 86,332
30,548 42,497 51,582 58,867 65,706 79,552
2010-11 2011-12 2012-13 2013-14 2014-15 2015-16
Biscuits production Capacity & Actual Production (in MT)
Production Capacity Actual Production

Valuation Report on Olympic Industries Limited Date: 10th August, 2017
Current Price (BDT): 285.70 Target Price (BDT): 334.19
11
sales growth and the market share of the industry. Olympic Industries has recorded 16.25% CAGR in total revenue while 36.68% CAGR in net profit over the period 2011-12 to 2015-16. The key historical and projected turnover information is as follows:
(In BDT Mn) 2011-12 A 2012-13 A 2013-14 A 2014-15 A 2015-16 A 2016-17 E 2017-18 E 2018-19 E
Sales 6,003 7,093 7,922 8,853 10,965 12,755 15,338 17,654
Gross Profit 1,461 1,822 2,283 2,635 3,691 4,298 5,215 5,826
EBITDA 788 1,076 1,333 1,621 2,346 2,868 3,312 3,586
Operating Profit 698 931 1,185 1,428 2,116 2,513 2,960 3,231
Profit After Tax 465 615 869 1,090 1,624 1,903 2,200 2,419
EPS 5.94 7.85 7.39 5.72 8.53 9.5 11.0 12.1
Financial Position & Forecast:
Olympic Industries Limited is financially healthy company. The total asset size of this company in 2015-16 fiscal year is BDT 7.64 bn. Time to time investment in Property Plant & Equipment has accelerated the growth of the company. The major Balance Sheet items of Olympic Industries Limited is as follows:
(In BDT mn) 2011-12 A 2012-13 A 2013-14 A 2014-15 A 2015-16 A 2016-17 E 2017-18 E 2018-19 E
Total Assets 2,591 3,694 5,049 5,764 7,641 9,172 11,093 12,563
Non-Current Assets 1,202 1,433 1,869 1,910 1,963 2,389 2,467 2,492 PPE 680 1,102 1,143 1,679 1,671 2,132 2,141 2,171
Current Assets 1,389 2,261 3,179 3,854 5,678 6,783 8,626 10,071
Trade Debtors 26 23 18 108 170 72 86 99
Cash & FDR 714 1,215 1,796 2,541 3,952 5,142 6,622 7,853
Share Capital 522 784 1,175 1,587 1,904 1,999 1,999 1,999
Retained Earnings 646 948 1,347 1,795 2,627 3,671 4,671 5,690
Non-Current Liabilities
286 307 549 393 249 419 398 376
Long term Loans 227 205 445 248 136 298 257 217
Current Liabilities 1,137 1,655 1,977 1,988 2,860 3,083 4,025 4,497
Trade Creditors 335 520 582 640 579 844 1,015 1,169
S.T. Bank Loans 231 105 125 138 214 137 710 834
The Authorized capital of Olympic Industries is BDT 2000 mn and the paid up capital is BDT 1999.39 mn as on 10th August, 2017. Olympic Industries Limited will have to increase the authorized capital if they want to increase their paid up capital in near future. Operating Profitability:
High gross profit margin indicates Olympic Industries’ efficiency in using its raw materials, labor and manufacturing related fixed assets to generate profits over the years. In FY 2015-16, the GPM is 33.66% where it was 29.76% in FY 2014-15. The management of Olympic Industries has fair control over operating expenses than its cost of sales outlays which reflects the increasing trend of Operating profit margin. In FY 2015-16, OPM is 19.03% where it was 16.13% in FY 2014-15. The pre-tax margin of Olympic Industries in FY 2015-16 is 20.09% where 17.39% in FY 2014-15 which indicates the management of Olympic Industries Limited is efficient in tax management techniques. The Net profit margin is 14.81% which is 2.5% higher than the previous fiscal year. Olympic Industries has 14.29% CAGR in Net profit margin from 2012-13 to 2015-16. We expect that, Olympic will be able to sustain the operating profitability with the favorable business condition in coming years. The historical and forecast of operating profitability is as follows: Particulars 2012-13 A 2013-14 A 2014-15 A 2015-16 A 2016-17 E 2017-18 E 2018-19 E
Gross Profit Margin 25.68% 28.81% 29.76% 33.66% 33.70% 34.00% 33.00%
Operating Profit Margin
13.13% 14.96% 16.13% 19.30% 19.70% 19.30% 18.30%
Pre Tax Profit Margin 12.75% 15.23% 17.39% 20.09% 20.47% 19.68% 18.80%
Net Profit Margin 08.68% 10.97% 12.31% 14.81% 14.92% 14.34% 13.70%
Return on Total Assets 19.58% 19.88% 20.16% 24.23% 22.63% 21.71% 20.45%
Return on Equity (ROE) 42.43% 40.86% 36.92% 41.04% 37.30% 35.65% 33.69%

Valuation Report on Olympic Industries Limited Date: 10th August, 2017
Current Price (BDT): 285.70 Target Price (BDT): 334.19
12
The return on equity and return on assets gives a clear look of the corporate health of Olympic Industries Limited. The ROA is 24.23% and ROE is 41.04% in 2015-16. Investors prefer higher ROE as well as ROA. Operating Efficiency:
The overall operating efficiency of Olympic Industries has increased in 2015-16. The operating cycle has decreased in 2015-16 compared to 2014-15. The cash conversion cycle is negative in 2015-16 maintaining the consistency from last 4 years. A negative cash cycle indicates that Olympic Industries pay for inventory from selling the final products associated with those inventories. They are efficient in using working capital management and have excess cash for other activities. Total asset turnover is 163.60% and fixed asset turnover is 654.53%. These ratios indicate higher return compared to the total assets and fixed assets. The historical and projected operating efficiency ratios are as follows:
Particulars 2012-13 2013-14 2014-15 2015-16 2016-17 E 2017-18 E 2018-19 E 2019-20 E
Inventory Turnover Ratio 15.18 13.44 13.03 17.14 20.29 19.22 17.84 17.93
Receivable Turnover Ratio 292.98 385.08 140.71 78.91 105.34 193.91 190.04 191.06
Average Collection Period (Days)
1.23 0.93 2.56 4.56 3.42 1.86 1.89 1.88
Inventory Conversion Period (Days)
23.71 26.78 27.63 21.00 17.74 18.73 20.18 20.08
Operating Cycle (Days) 24.94 27.72 30.19 25.56 21.16 20.59 22.08 21.96
A/C Payable Turnover Ratio
12.32 10.23 10.17 11.94 11.88 10.89 10.83 10.89
Payables Payment Period (Days)
29.21 35.19 35.39 30.16 30.29 33.07 33.24 33.06
Cash Conversion Cycle (Days)
(4.27) (7.47) (5.20) (4.60) (9.13) (12.48) (11.16) (11.10)
Total Asset Turnover 225.72% 181.24% 163.77% 163.60% 151.72% 151.37% 149.26% 153.63%
Fixed Asset Turnover 796.24% 705.85% 627.53% 654.53% 670.70% 717.92% 818.86% 936.24%
Liquidity Performance:
The Current Ratio of Olympic Industries is 1.99 in 2015-16 as against 1.94 in 2014-15. This ratio indicates Olympic’s ability to pay short term obligations. In 2015-16, Quick ratio is 1.78 as against 1.59 in 2014-15. Olympic is a cash and cash equivalent rich company. So the cash ratio is high. It is 1.38 in 2015-16 as against 1.28 in 2014-15. The historical and forecasted ratios are as follows:
Particulars 2012-13 A 2013-14 A 2014-15 A 2015-16 A 2016-17 E 2017-18 E 2018-19 E
Current Ratio 1.37 1.61 1.94 1.99 2.20 2.14 2.24
Quick Ratio 1.05 1.27 1.59 1.78 1.98 1.91 2.00
Cash Ratio 0.73 0.91 1.28 1.38 1.67 1.65 1.75
Leverage:
Olympic Industries’ debt equity ratio in 2015-16 is 12.1% as against 16.6% in 2014-15. The ratio is downward as the company is minimizing the uses of debt in financing the assets of the company. The debt to total asset ratio is 7.2% as against 9.7% in 2014-15. The historical and forecasted leverage ratios are as follows:
Particulars 2012-13 A 2013-14 A 2014-15 A 2015-16 A 2016-17 E 2017-18 E 2018-19 E
Debt to Equity 24.1% 26.8% 16.6% 12.1% 11.1% 17.4% 16.3%
Debt to Total Assets 11.3% 13.4% 9.7% 7.2% 6.8% 10.5% 10.0%

Valuation Report on Olympic Industries Limited Date: 10th August, 2017
Current Price (BDT): 285.70 Target Price (BDT): 334.19
13
INVESTMENT INSIGHT Company Positive
Olympic Industries Limited is the market leader in the organized and industrialized biscuit market having around 39% market share.
Olympic Industries has noted 16.25% CAGR in total revenue while 36.68% CAGR in net profit over the period 2011-12 to 2015-16. This growth is the reflection of strong efforts to maximize production efficiencies and capitalizing on economies of scale such as distributing fixed administrative, marketing, selling and operational costs across higher sales.
Olympic Industries regularly invest for the enhancement of its capacity and product innovation. During the last two years, it invested BDT 970 million for purchasing fixed assets. It has taken several expansion projects to be implemented in this year and next year. The company has already invested around BDT 652 million in fixed assets in the fiscal year 2016-17. Olympic Industries has undertaken two projects in 2015, four projects in 2016 and four projects in 2017. We assume that Olympic Industries will continue this historical trend of investment in expansion projects in coming years.
The company is trying to minimize the associated costs by taking the vertical expansion projects like Carton manufacturing line from where they will produce 66 mn cartons annually.
Olympic distributes handsome dividends to its shareholders every year. Olympic Industries has declared 40% cash and 5% stock dividend in fiscal year 2015-16.
Investment Concern
The food industry is fiercely competitive and consumers seek the best foods at most reasonable prices. New lines from existing biscuit manufacturers and new entries from food manufacturers are expected in coming months and years. To lead the market, Olympic Industries should to keep a close look on the strategic moves of the competitors.
Olympic Industries procures most of the raw materials for biscuit and confectionery production locally. However, Bangladesh is not a major producer of wheat, palm oil or sugar, which are the major ingredients used in biscuit manufacturing. These raw materials, though locally procured by them, are imported from all around the world and, as such, are priced in USD. Fluctuation in commodity prices is a risk to Olympic’s profitability.
Another concern for Olympic Industries is the production and distribution imitations or duplications of their products. In the past, several small producers have attempted to imitate and market products that are very similar or identical to Olympic’s most popular biscuits like Energy plus & Tip.
20% Supplementary Duty has been imposed on Powered milk, Butter and other dairy oils, spreads and products in the latest budget of 2017-18 (milk, butter & dairy oils are used in manufacturing biscuits & confectionary items). COGS of Olympic Industries may slightly rise for such imposition.
Dividend History: Olympic Industries declares dividend on a regular basis. The dividend trend is upward over the last 5 years period. The board of directors declared 40% cash and 5% stock dividend for the year 2015-16. The dividend history of Olympic is as follows:
Dividend payout ratio depicts a moving towards paying more cash than in stock dividend. Besides payout ratio is also growing thus company is disbursing more earnings rather than retaining them for financing expansion projects.
Particulars 2012 2013 2014 2015 2016
Cash Dividend 10% 10% 20% 20% 40%
Stock Dividend 50% 50% 35% 20% 5%
Payout Ratio 11% 13% 27% 44% 47%
Retention Rate 89% 87% 73% 56% 53%

Valuation Report on Olympic Industries Limited Date: 10th August, 2017
Current Price (BDT): 285.70 Target Price (BDT): 334.19
14
Proposed budgetary change for FY’18 which may affect the business operation of Olympic Industries
20% Supplementary Duty has been imposed on Powered milk, Butter and other dairy oils, spreads and products in the latest budget of 2017-18 (milk, butter & dairy oils are used in manufacturing biscuits & confectionary items). COGS of Olympic Industries may slightly rise for such imposition.
Extended VAT exemption in latest budget on Palm Oil and Soya Bean Oil up to June 30, 2019 will assist the business operation of OLYMPIC as oil used in the production of cookies, noodles and in some biscuits.
INVESTMENT THESIS
Key Assumptions Underlying the Valuation
Revenue The company has huge expansion plans in coming years. For biscuits production, they have 9 production lines. Olympic usually invests huge in expansion projects to meet the demand from the market. In last 6 years, the production capacity of Biscuits and Confectionary items has increased 2.03 times. We assume that, Olympic Industries will continue to grow following the historical trends. So the top line CAGR of Olympic Industries for the forecasted years is 17% considering all expansion projects. The historical and forecasted revenue of Olympic Industries is as follows:
Source: Company Annual Reports & EBLSL Research
Cost of Goods Sold If the production goes up, then the cost of goods sold must be rise up. But, Olympic Industries has taken some vertical expansion projects like PET sheet forming and Tray making unit and Carton manufacturing unit which will help to maintain the cost of goods sold at current proportion of sales. According to the forecast of World Bank, the price of major raw materials may not change significantly in coming years. The price of sugar is expected to sustain at USD 0.40 in next 4 years and the price of Wheat, Palm oil and Soya bean oil may slightly rise in next 4 years. So the cost of goods sold is considered as 66.4% of sales in forecasted periods. Selling & Distribution Expenses Last 5 year’s average selling and distribution expense was 11.01% of total sales. Considering all the issues which can drive the selling expenses, in next 5 years the expenses are expected to remain within 11% to 12%. Administration Expenses Olympic Industries’ historical average administration expense as percentage of sales was 2.7%. In coming 5 years, the expenses are expected to remain same as percentage of sales at 2.7%.
0.00%
5.00%
10.00%
15.00%
20.00%
25.00%
30.00%
3,000
8,000
13,000
18,000
23,000
28,000
2011-12 2012-13 2013-14 2014-15 2015-16 2016-17 2017-18 2018-19 2019-20 2020-21 2021-22
Revenue (in BDT Mn) & Growth
Revenue Growth

Valuation Report on Olympic Industries Limited Date: 10th August, 2017
Current Price (BDT): 285.70 Target Price (BDT): 334.19
15
Cash & Investment in FDR Olympic Industries is a cash rich company. In 2015-16 fiscal year is had total BDT 3.96 bn as cash and FDR Investment. Total investment in FDR stood at BDT 3.57 bn in 2015-16 which is BDT 1.49 bn higher than the previous year. We expect that, the company will continue to invest in FDR from the excess cash at hands of the company in next 5 years.
Favorable Valuation both on DCF and Relative Valuation Matrices
Discounted Cash Flow Valuation: Our updated DCF analysis with a discount rate of 8.9% & terminal growth rate of 6% gives us Enterprise Value of BDT 66.94 bn as of June, 2017. The fair value using DCF method stands at BDT 350.65 per share for the company, which implies an upside of 22.73% from current market price.
(Figures in BDT mn) 2015-16 2016-17 2017-18 2018-19 2019-20 2020-21 Terminal
Profit for the Year 1,623.7 1,902.6 2,199.7 2,418.6 2,848.5 3,659.0
Add: After Tax Interest Expenses 65.3 74.4 137.7 149.0 139.5 89.8
Add: Depreciation & Amortization 229.7 355.5 352.2 354.8 363.0 376.3
Less: Investment (Divestment) in NWC 952.2 882.4 254.8 1,015.0 648.3 1,181.4
Less: CAPEX 303.0 816.1 361.1 384.9 412.1 453.0
Free Cash Flow to the Firm 634.0 2,073.7 1,522.6 2,290.5 2,490.8 88,376.8
Present Value Adjusted Free Cash flow to the Firm 582.2 1,749.1 1,179.5 1,629.5 1,627.4 57,743.8
Enterprise Value 66,935.3
Plus: Cash & cash equivalent 381.7
Less: Interest Debt 547.3
Equity Value 66,769.8
No. of Share Outstanding 190.4
Value per Share (In BDT) 350.7
Sensitivity Analysis:
We have also checked the sensitivity analysis of DCF value per share on discount rate and terminal growth rate.
Discount Rates
Term
inal
Gro
wth
350.65 7.0% 7.5% 8.0% 8.9% 9.0% 9.5% 10.0% 10.5% 11.0% 12.0% 13.0%
2.5% 256.6 230.1 208.4 178.2 175.1 162.0 150.7 140.8 132.0 117.4 105.5
3.0% 285.1 252.5 226.5 191.0 187.4 172.4 159.5 148.4 138.7 122.5 109.5
3.5% 321.8 280.6 248.5 206.2 202.0 184.5 169.8 157.1 146.2 128.2 114.0
4.0% 370.7 316.7 276.2 224.6 219.5 198.9 181.7 167.2 154.8 134.6 118.9
4.5% 439.2 364.8 311.7 247.0 240.8 216.1 195.8 178.9 164.7 141.9 124.5
5.0% 542.0 432.2 359.0 275.3 267.6 237.1 212.7 192.8 176.2 150.2 130.7
5.9% 962.3 659.5 501.0 350.7 337.4 289.7 253.6 225.4 202.8 168.6 144.1
6.0% 1055.7 701.6 524.6 361.2 347.7 297.2 259.3 229.9 206.3 171.0 145.8
6.5% 2083.0 1038.5 690.3 431.1 411.8 342.3 292.6 255.3 226.4 184.3 155.1
6.9% 10301.9 1712.1 931.3 512.3 485.1 390.8 326.9 280.8 245.9 196.7 163.7
Relative Valuation Method: Favorable Valuation is derived based on relative valuation methodologies calculated over 2017 EPS estimates and industry multiples.
Relative Valuation
Particulars Multiples EPS & NAVPS Valuation
Average Historical PE multiple 32.62 (1) 9.52 310.40
Consumer Goods Forward PE 34.91 (2) 9.52 332.46
P/NAVPS 10.07 (3) 28.36 285.70
Average price per share 309.51

Valuation Report on Olympic Industries Limited Date: 10th August, 2017
Current Price (BDT): 285.70 Target Price (BDT): 334.19
16
Multiples (1 and 3) The historical Average PE Multiple of Olympic Industries stands at 32.62. On the other hand, the historical average P/NAVPS stands at 10.07 as on 10 August, 2017.
Multiple (2) Golden Harvest, Pran, RD foods and Fu Wang foods have been considered as the peer firms of Olympic Industries Limited. Forward P/E of these firms are as follows:
Determination of Target Price We recommend a higher weight of 60% on value that we derived from DCF valuation and a lower weight of 40% on the value derived from average relative price-earning based valuation and price to book value based valuation. Based on the weighted average of the DCF and relative valuation we get the target price of BDT 334.19 for the company. Based on historical P/E, OLYMPIC’s shares have an average P/E multiple of 33.62x for 2016-17 earnings.
Valuation Methods Estimated Value Weight
Discounted Cash Flow (FCFF)- Fair value 350.65 60%
Relative Valuation Models 309.51 40%
Weighted Average Price Per Share 334.19 100%
Current Price 285.70
Target Price 334.19
Expected Capital Gain 16.97%
STOCK RATING
1. Overweight: Expected to outperform the broader market averages; 2. Market weight: Expected to equal performance of broader market averages; 3. Underweight: expected to underperform broader market averages. 4. Not-Rated: Currently the analyst does not have adequate conviction about the stock's total return relative to the
broader market average.
Historical PE of Olympic Industries Limited
P/E (1) P/NAVPS (3)
Current P/E 32.65 11.28
PE at YE 2012 21.66 5.68
PE at YE 2013 30.00 7.58
PE at YE 2014 30.12 10.37
PE at YE 2015 40.83 11.02
PE at YE 2016 40.43 14.51
Average 32.62 10.07
Peer Firms in DSE Forward P/E
Golden Harvest 29.4
AMCL Pran 28.2
RD Food 36.5
Fu Wang Foods 45.7
Peer Firms Avg. PE 34.94

Valuation Report on Olympic Industries Limited Date: 10th August, 2017
Current Price (BDT): 285.70 Target Price (BDT): 334.19
17
STATEMENT OF COMPREHENSIVE INCOME
(In BDT)
Particulars 2013-14 A 2014-15 A 2015-16 A 2016-17 Exp. 2017-18 Exp. 2018-19 Exp.
Net Turnover 7,922,353,876 8,853,427,410 10,965,042,877 12,754,574,428 15,338,031,170 17,654,117,548
Cost of Goods Sold 5,639,774,637 6,218,232,676 7,274,288,716 8,456,282,846 10,123,100,572 11,828,258,757
GROSS PROFIT ,282,579,239 2,635,194,734 3,690,754,161 4,298,291,582 5,214,930,598 5,825,858,791
Total Operating Income 2,282,579,239 2,635,194,734 3,690,754,161 4,298,291,582 5,214,930,598 5,825,858,791
Operating Expenses: 1,097,663,470 1,207,281,574 1,574,314,081 1,785,640,420 2,254,690,582 2,595,155,280
PROFIT FROM OPERATIONS 1,184,915,769 1,427,913,160 2,116,440,080 2,512,651,162 2,960,240,016 3,230,703,511
Financial Expenses 64,214,399 98,622,402 89,632,361 102,128,540 188,962,924 204,542,376
Non-Operating Income 146,934,458 287,449,980 286,394,247 337,996,222 406,457,826 467,834,115
PROFIT BEFORE WPPF 1,267,192,947 1,616,740,738 2,312,452,251 2,748,518,845 3,177,734,918 3,493,995,250
Allocation for WPPF 60,342,521 76,987,654 110,116,774 137,425,942 158,886,746 174,699,763
PROFIT BEFORE TAX 1,206,850,426 1,539,753,084 2,202,335,477 2,611,092,903 3,018,848,172 3,319,295,488
Provision for Income Tax 325,318,027 424,572,941 579,522,658 708,487,302 819,126,579 900,649,189
Provision for Deferred Income Tax
12,496,186 25,185,742 (905,155) - - -
PROFIT AFTER TAX 869,036,213 1,089,994,401 1,623,717,974 1,902,605,601 2,199,721,593 2,418,646,299
EPS 7.39 6.87 8.53 9.52 11.00 12.10
Depreciation 148,127,530 193,520,169 229,655,942 355,523,021 352,164,628 354,811,753
Outstanding Share 117,541,968 158,681,565 190,417,987 199,938,887 199,938,887 199,938,887

Valuation Report on Olympic Industries Limited Date: 10th August, 2017
Current Price (BDT): 285.70 Target Price (BDT): 334.19
18
STATEMENT OF FINANCIAL POSITION
(In BDT)
Particulars 2013-14 A 2014-15 A 2015-16 A 2016-17 Exp. 2017-18 Exp. 2018-19 Exp.
ASSETS:
Non-Current Assets: 1,869,464,492 1,909,946,076 1,963,251,175 2,389,158,712 2,467,151,401 2,492,121,668
PPE-Carrying Value 1,142,580,878 1,679,103,330 1,671,383,385 2,131,998,339 2,140,898,785 2,170,986,850
Capital Work-in-Progress 701,072,154 211,484,151 278,962,060 250,707,508 319,799,751 321,134,818
Intangible Assets, net 25,811,460 19,358,595 12,905,730 6,452,865 6,452,865 0
Current Assets: 3,179,172,694 3,853,733,709 5,677,517,033 6,782,902,492 8,625,965,482 10,071,029,647
Inventories 661,070,355 697,852,284 581,286,241 675,992,445 920,281,870 1,059,247,053
Trade Debtors 18,264,397 107,576,409 170,337,813 71,825,797 86,374,212 99,416,964
Adv. Dep. and Prepayments
703,599,909 507,430,253 973,767,439 892,820,210 996,972,026 1,059,247,053
Cash and Cash Equivalents
486,934,939 456,924,258 381,708,726 371,847,226 551,920,559 582,701,763
Investment in FDR 1,309,303,094 2,083,950,505 3,570,416,814 4,770,416,814 6,070,416,814 7,270,416,814
Total assets 5,048,637,186 5,763,679,785 7,640,768,208 9,172,061,204 11,093,116,883 12,563,151,316
Shareholders' Equity: 2,522,397,546 3,381,654,099 4,531,272,360 5,670,260,758 6,670,349,031 7,689,423,125
Share Capital 1,175,419,680 1,586,816,560 1,904,179,870 1,999,388,866 1,999,388,866 1,999,388,866
Retained Earnings 1,346,977,866 1,794,837,539 2,627,092,490 3,670,871,892 4,670,960,166 5,690,034,259
Non-Current Liabilities: 549,007,596 393,926,705 249,778,869 419,129,554 397,766,034 376,294,914
Long Term Loans - Secured
444,933,166 248,422,067 136,749,676 298,479,768 256,907,854 217,098,685
Obligation under finance lease
34,586,904 50,831,370 19,261,080 21,319,983 21,408,988 21,709,869
Deferred Tax Liability 69,487,526 94,673,268 93,768,113 99,329,803 119,449,192 137,486,360
Current Liabilities: 1,977,232,044 1,988,098,981 2,859,716,979 3,082,670,893 4,025,001,817 4,497,433,277
Short Term Bank Loans 125,387,611 138,262,703 214,166,383 136,523,618 710,299,467 843,030,170
Trade Creditors 582,490,585 639,952,961 578,821,148 844,352,827 1,015,377,663 1,168,702,582
Long term Loan Cur. portion
104,587,517 174,406,672 196,356,242 191,879,851 192,680,891 195,388,817
Other Creditors 10,504,344 13,318,773 8,281,754 12,754,574 15,338,031 10,592,471
Current Tax Liabilities 580,949,742 388,485,302 968,656,378 1,007,402,633 1,047,698,738 1,089,606,688
Obligation under fin. lease
14,385,163 32,935,574 36,151,188 14,213,322 14,272,659 14,473,246
Provision for accruals 74,994,240 64,487,808 46,502,089 51,018,298 53,683,109 74,147,294
Interest Payable 12,980,465 138,062 116,426 5,699,178 10,544,882 11,414,277
Advance against sales 158,848,686 172,343,753 357,344,424 280,600,637 337,436,686 388,390,586
Liabilities for other finance
97,958,208 66,902,367 64,841,901 89,282,021 107,366,218 123,578,823
Provisions for WPFF - 253,073,981 318,284,296 329,822,261 381,328,190 419,279,430
Dividend payable 30,344,333 43,791,025 70,194,750 119,121,671 138,975,283 158,828,895
Total shareholders' equity and liabilities
5,048,637,186 5,763,679,785 7,640,768,208 9,172,061,204 11,093,116,883 12,563,151,316
NAVPS 21.5 21.3 23.8 28.36 33.36 38.46

Valuation Report on Olympic Industries Limited Date: 10th August, 2017
Current Price (BDT): 285.70 Target Price (BDT): 334.19
19
RATIO ANALYSIS
Particulars 2013-14 A 2014-15 A 2015-16 A 2016-17 Exp. 2017-18 Exp. 2018-19 Exp.
Liquidity Ratios:
Current Ratio 1.61 1.94 1.99 2.20 2.14 2.24
Quick Ratio 1.27 1.59 1.78 1.98 1.91 2.00
Cash Ratio 0.91 1.28 1.38 1.67 1.65 1.75
Operating Efficiency Ratios
Inventory Turnover Ratio
13.44 13.03 17.14 20.29 19.22 17.84
Receivable Turnover Ratio
385.08 140.71 78.91 105.34 193.91 190.04
Avg. Collection Period (Days)
0.93 2.56 4.56 3.42 1.86 1.89
Operating Cycle (Days)
27.72 30.19 25.56 17.74 18.73 20.18
A/C Payable Turn. ratio
10.23 10.17 11.94 11.88 10.89 10.83
Payables Pmt. Period (Days)
35.19 35.39 30.16 30.29 33.07 33.24
Cash Conversion Cycle (Days)
(7.47) (5.20) (4.60) (9.13) (12.48) (11.16)
Total Asset Turnover 181.24% 163.77% 163.60% 151.72% 151.37% 149.26%
Operating Profitability Ratios
Gross Profit Margin (GPM)
28.81% 29.76% 33.66% 33.70% 34.00% 33.00%
Op. Profit Margin (OPM)
14.96% 16.13% 19.30% 19.70% 19.30% 18.30%
Pre Tax Profit Margin
15.23% 17.39% 20.09% 20.47% 19.68% 18.80%
Net Profit Margin (NPM)
10.97% 12.31% 14.81% 14.92% 14.34% 13.70%
Return on Total Assets (ROA)
19.88% 20.16% 24.23% 22.63% 21.71% 20.45%
Return on Equity (ROE)
40.86% 36.92% 41.04% 37.30% 35.65% 33.69%
Leverage Ratios
Total Debt to Equity 26.8% 16.6% 12.1% 11.1% 17.4% 16.3%
Debt to Total Assets 13.4% 9.7% 7.2% 6.8% 10.5% 10.0%
Coverage Ratios
Times Interest Earned (TIE)
18.45 14.48 23.61 24.60 15.67 15.79
Valuation Ratios
P/B (price to book) Ratio
10.37 11.02 14.51 10.23 8.70 7.54
Dividend Payout Ratio
0.27 0.52 0.47 0.63 0.64 0.66
Retention Rate 0.73 0.56 0.53 0.37 0.36 0.34
P/E Ratio 30.11 34.18 40.49 30.49 26.37 23.98
EV/EBITDA 19.77 23.04 28.10 20.31 17.69 16.36
EV/Sales 3.33 4.22 6.01 4.57 3.82 3.32
Price/Sales 3.30 4.21 6.00 10.23 8.70 7.54
Sales/ Share 67.40 55.79 57.58 63.79 76.71 88.30
Growth Rates
EPS Growth Rate -5.85% -7.09% 24.14% 11.60% 15.62% 9.95%
Dividend Growth Rate
100.00% 50.00% 33.33% 50.00% 16.67% 14.29%
Sales Growth Rate 11.69% 11.75% 23.85% 16.32% 20.26% 15.10%
Gross Profit Growth 25.30% 15.45% 40.06% 16.46% 21.33% 11.71%
Valuation Report on Olympic Industries Limited Date: 10th August, 2017
Current Price (BDT): 285.70 Target Price (BDT): 334.19
20
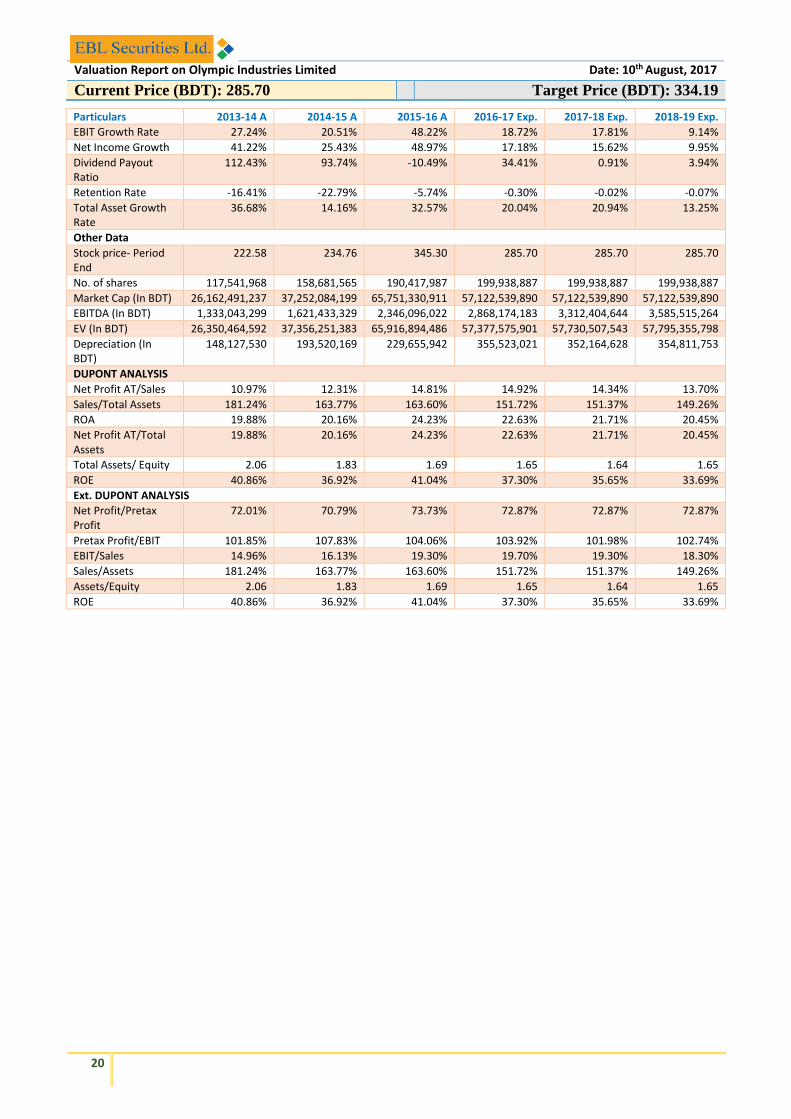
Particulars 2013-14 A 2014-15 A 2015-16 A 2016-17 Exp. 2017-18 Exp. 2018-19 Exp.
EBIT Growth Rate 27.24% 20.51% 48.22% 18.72% 17.81% 9.14%
Net Income Growth 41.22% 25.43% 48.97% 17.18% 15.62% 9.95%
Dividend Payout Ratio
112.43% 93.74% -10.49% 34.41% 0.91% 3.94%
Retention Rate -16.41% -22.79% -5.74% -0.30% -0.02% -0.07%
Total Asset Growth Rate
36.68% 14.16% 32.57% 20.04% 20.94% 13.25%
Other Data
Stock price- Period End
222.58 234.76 345.30 285.70 285.70 285.70
No. of shares 117,541,968 158,681,565 190,417,987 199,938,887 199,938,887 199,938,887
Market Cap (In BDT) 26,162,491,237 37,252,084,199 65,751,330,911 57,122,539,890 57,122,539,890 57,122,539,890
EBITDA (In BDT) 1,333,043,299 1,621,433,329 2,346,096,022 2,868,174,183 3,312,404,644 3,585,515,264
EV (In BDT) 26,350,464,592 37,356,251,383 65,916,894,486 57,377,575,901 57,730,507,543 57,795,355,798
Depreciation (In BDT)
148,127,530 193,520,169 229,655,942 355,523,021 352,164,628 354,811,753
DUPONT ANALYSIS
Net Profit AT/Sales 10.97% 12.31% 14.81% 14.92% 14.34% 13.70%
Sales/Total Assets 181.24% 163.77% 163.60% 151.72% 151.37% 149.26%
ROA 19.88% 20.16% 24.23% 22.63% 21.71% 20.45%
Net Profit AT/Total Assets
19.88% 20.16% 24.23% 22.63% 21.71% 20.45%
Total Assets/ Equity 2.06 1.83 1.69 1.65 1.64 1.65
ROE 40.86% 36.92% 41.04% 37.30% 35.65% 33.69%
Ext. DUPONT ANALYSIS
Net Profit/Pretax Profit
72.01% 70.79% 73.73% 72.87% 72.87% 72.87%
Pretax Profit/EBIT 101.85% 107.83% 104.06% 103.92% 101.98% 102.74%
EBIT/Sales 14.96% 16.13% 19.30% 19.70% 19.30% 18.30%
Sales/Assets 181.24% 163.77% 163.60% 151.72% 151.37% 149.26%
Assets/Equity 2.06 1.83 1.69 1.65 1.64 1.65
ROE 40.86% 36.92% 41.04% 37.30% 35.65% 33.69%

Valuation Report on Olympic Industries Limited Date: 10th August, 2017
Current Price (BDT): 285.70 Target Price (BDT): 334.19
21
DISCLAIMER This document has been prepared by the Research Team of EBL Securities Limited (EBLSL) for information only of its clients residing both in Bangladesh and abroad, on the basis of the publicly available information in the market and own research. This document has been prepared for information purpose only and does not solicit any action based on the material contained herein and should not be taken as an offer or solicitation to buy or sell or subscribe to any security. Neither EBLSL nor any of its directors, shareholders, member of the management or employee represents or warrants expressly or impliedly that the information or data of the sources used in the documents are genuine, accurate, complete, authentic and correct. However all reasonable care has been taken to ensure the accuracy of the contents of this document. EBLSL will not take any responsibility for any decisions made by investors based on the information herein.
ANALYST DISCLAIMER The person or persons named as the author(s) of this report hereby certify that the views expressed in the research report accurately reflect their personal views about the subject matters discussed. No part of their compensation was, is, or will be, directly or indirectly, related to the specific recommendations or views expressed in the research report. The views of the author(s) do not necessarily reflect the views of the EBL Securities Limited (EBLSL) and are subject to change without any notice. All reasonable care has been taken to ensure the accuracy of the contents of this document and the author(s) will not take any responsibility for any decisions made by investors based on the information herein.
ABOUT EBL SECURITIES LTD. EBL Securities Ltd. (EBLSL) is one of the fastest growing full-service brokerage companies in Bangladesh and a fully owned subsidiary of Eastern Bank Limited. EBLSL is also one of the top ten leading stock brokerage houses of the country. EBL Securities Limited is the TREC-holder of both exchanges of the country; DSE (TREC# 026) and CSE (TREC# 021). EBLSL takes pride in its strong commitment towards excellent client services and the development of the Bangladesh capital markets. EBLSL has developed a disciplined approach towards providing capital market services, including securities trading, margin loan facilities, depository services, online trading facilities, panel brokerage services, trading through NITA for foreign investors & NRBs etc.
EBLSL KEY MANAGEMENT
Md. Sayadur Rahman Managing Director [email protected]
Md. Humayan Kabir SVP & Chief Operating Officer (COO) [email protected]
EBLSL RESEARCH TEAM
M. Shahryar Faiz FAVP & Head of Research [email protected]
Md. Asrarul Haque Senior Officer-Research [email protected]
Mohammad Rehan Kabir Officer-Research [email protected]
Tajkera Rahman Officer-Research [email protected]
Md. Nazmus Sakib Officer-Research [email protected]
Md. Mosavvir Al Ashick Officer-Research [email protected]
Asaduzzaman Ashik Officer-Research [email protected] Farzana Hossain Laizu Assistant Officer- Research [email protected]
For any queries regarding this report: [email protected]
EBLSL BRANCHES
Head office: HO Extension-1 HO Extension-2 Dhanmondi Branch Chittagong Branch
59, Motijheel C/A (1st Floor) Dhaka-1000 +8802 7119631, 9556539 +8802 47111935; FAX: +8802 47112944 [email protected]
Modhumita Building 160 Motijheel C/A (2nd Floor) Dhaka-1000. +88 02 9569480, 9564393, +88 02 8825236 FAX: +8802 47112944 [email protected]
Bangladesh Sipping corporation (BSC) Tower 2-3, Rajuk Avenue (4th floor), Motijheel, Dhaka-1000 +880257160801-4
Sima Blossom (4th Floor) House # 390 (Old), 3 (New), Road # 27 (Old), 16 (New), Dhanmondi R/A, Dhaka-1209. +8802-9130268, +8802-9130294
Suraiya Mansion (2nd Floor); 30, Agrabad C/A Chittagong-4100 +031 2522041-43