Ohio 2015 Profile of Home Buyers and...
202
Ohio 2015 Profile of Home Buyers and Sellers Prepared by: NATIONAL ASSOCIATION OF REALTORS ® Research Division January 2016 The 2015 National Association of Realtors® Profile of Home Buyers and Sellers
Transcript of Ohio 2015 Profile of Home Buyers and...

Ohio
2015 Profile of Home Buyers and Sellers
Prepared by:
NATIONAL ASSOCIATION OF REALTORS®
Research Division
January 2016
The 2015 National Association of Realtors® Profile of Home Buyers and Sellers

CHARACTERISTICS OF HOME BUYERS
Exhibit 1-1 AGE OF HOME BUYERS, BY REGION
Exhibit 1-2 HOUSEHOLD INCOME OF HOME BUYERS, BY REGION, 2014
Exhibit 1-3 ADULT COMPOSITION OF HOME BUYER HOUSEHOLDS, 2001-2015
Exhibit 1-4 NUMBER OF CHILDREN UNDER THE AGE OF 18 RESIDING IN HOUSEHOLD
Exhibit 1-5 HOME PURCHASED WAS A MULTI-GENERATIONAL HOME (WILL HOME ADULT SIBLINGS,
ADULT CHILDREN, PARENTS, AND/OR GRANDPARENTS)
Exhibit 1-6 HOME BUYER SEXUAL ORIENTATION
Exhibit 1-7 RACE/ETHNICITY OF HOME BUYERS, BY REGION
Exhibit 1-8 RACE/ETHNICITY OF HOME BUYERS, BY ADULT COMPOSITION OF HOUSEHOLD
Exhibit 1-9 PRIMARY LANGUAGE SPOKEN IN HOME BUYER HOUSEHOLD, BY REGION
Exhibit 1-10 NATIONAL ORIGIN OF HOME BUYERS, BY REGION
Exhibit 1-11 SELF OR SPOUSE/PARTNER IS ACTIVE MILITARY OR VETERAN
Exhibit 1-12 FIRST-TIME HOME BUYERS
Exhibit 1-13 FIRST-TIME HOME BUYERS, BY REGION
Exhibit 1-14 FIRST-TIME AND REPEAT HOME BUYERS BY HOUSEHOLD TYPE
Exhibit 1-15 FIRST-TIME AND REPEAT HOME BUYERS BY CHILDREN IN HOUSEHOLD
Exhibit 1-16 AGE OF FIRST-TIME AND REPEAT BUYERS
Exhibit 1-17 HOUSEHOLD INCOME OF FIRST-TIME AND REPEAT BUYERS, 2014
Exhibit 1-18 RACE/ETHNICITY OF FIRST-TIME AND REPEAT BUYERS
Exhibit 1-19 PRIMARY LANGUAGE SPOKEN IN FIRST-TIME AND REPEAT BUYER HOUSEHOLDS
Exhibit 1-20 NATIONAL ORIGIN OF FIRST-TIME AND REPEAT BUYERS
Exhibit 1-21 PRIOR LIVING ARRANGEMENT OF FIRST-TIME AND REPEAT BUYERS
Exhibit 1-22 PRIOR LIVING ARRANGEMENT, BY ADULT COMPOSITION OF HOUSEHOLD
Exhibit 1-23 PRIMARY REASON FOR PURCHASING A HOME, FIRST-TIME AND REPEAT BUYERS
Exhibit 1-24 PRIMARY REASON FOR PURCHASING A HOME, BY ADULT COMPOSITION OF HOUSEHOLD
Exhibit 1-25 PRIMARY REASON FOR THE TIMING OF HOME PURCHASE, FIRST-TIME AND REPEAT BUYERS
Exhibit 1-26 OTHER HOMES OWNED, BY AGE
The 2015 National Association of Realtors® Profile of Home Buyers and Selle

CHARACTERISTICS OF HOME BUYERS
Ohio Number of Total Respondents = 315
Exhibit 1-1
AGE OF HOME BUYERS, BY REGION
(Percentage Distribution)
Ohio U.S. Northeast Midwest South West
18 to 24 years 4% 3% 3% 4% 2% 2%
25 to 34 years 31 28 33 36 24 24
35 to 44 years 19 20 21 18 21 19
45 to 54 years 18 15 15 12 16 17
55 to 64 years 12 17 16 14 17 18
65 to 74 years 13 14 10 13 15 15
75 years or older 4 4 4 3 4 4
Median age (years) 43 44 41 38 45 46
BUYERS WHO PURCHASED A HOME IN THE
The 2015 National Association of Realtors® Profile of Home Buyers and Sellers

CHARACTERISTICS OF HOME BUYERS
Exhibit 1-2
HOUSEHOLD INCOME OF HOME BUYERS, BY REGION, 2014
(Percentage Distribution)
Ohio U.S. Northeast Midwest South West
Less than $25,000 5% 3% 3% 3% 3% 2%
$25,000 to $34,999 9 5 5 7 5 4
$35,000 to $44,999 14 7 5 9 7 6
$45,000 to $54,999 11 7 8 8 7 7
$55,000 to $64,999 10 9 9 10 9 10
$65,000 to $74,999 10 9 9 9 9 9
$75,000 to $84,999 8 9 9 9 8 10
$85,000 to $99,999 9 10 12 8 9 10
$100,000 to $124,999 11 15 15 13 16 16
$125,000 to $149,999 5 9 8 11 8 9
$150,000 to $174,999 3 5 5 4 7 5
$175,000 to $199,999 1 3 3 3 4 3
$200,000 or more 4 8 10 6 9 8
Median income (2014) $66,800 $86,100 $87,200 $79,000 $89,500 $87,400
BUYERS WHO PURCHASED A HOME IN THE
The 2015 National Association of Realtors® Profile of Home Buyers and Sellers

CHARACTERISTICS OF HOME BUYERS
Exhibit 1-3
ADULT COMPOSITION OF HOME BUYER HOUSEHOLDS, 2001-2015
(Percentage Distribution)
Ohio
2015
Married couple 59%
Single female 22
Single male 6
Unmarried couple 11
Other 2
U.S.
2001 2003 2004 2005 2006 2007 2008 2009 2010 2011 2012 2013 2014 2015
Married couple 68% 59% 62% 61% 61% 62% 61% 60% 58% 64% 65% 66% 65% 67%
Single female 15 21 18 21 22 20 20 21 20 18 16 16 16 15
Single male 7 11 8 9 9 9 10 10 12 10 9 9 9 9
Unmarried couple 7 8 9 7 7 7 7 8 8 7 8 7 8 7
Other 3 1 2 2 1 2 2 1 1 1 2 2 2 2
68%
59%62% 61% 61% 62% 61%
60%58%
64% 65% 66% 65%67%
15
2118
21 2220 20 21 20
1816 16 16 15
7
118 9 9 9 10 10
1210 9 9 9 9
7 8 97 7 7 7 8 8
7 8 7 8 7
31 2 2 1 2 2 1 1 1 2 2 2 2
0%
10%
20%
30%
40%
50%
60%
70%
80%
2001 2003 2004 2005 2006 2007 2008 2009 2010 2011 2012 2013 2014 2015
Married couple Single female Single male Unmarried couple Other
The 2015 National Association of Realtors® Profile of Home Buyers and Sellers

CHARACTERISTICS OF HOME BUYERS
Exhibit 1-4
NUMBER OF CHILDREN UNDER THE AGE OF 18 RESIDING IN HOUSEHOLD
(Percentage Distribution of Households)
Ohio
One 19%
Two 13%
Three or more 8%
None 60%
U.S.
One 15%
Two 15%
Three or more 7%
None 63%
One, 19%
Two, 13%
Three or more, 8%
None, 60%
NUMBER OF CHILDREN UNDER THE AGE OF 18 RESIDING IN HOUSEHOLD
(Percentage Distribution of Households)
WISC
Ohio
One, 15%
Two, 15%
Three or more, 7%
None, 63%
NUMBER OF CHILDREN UNDER THE AGE OF 18 RESIDING IN HOUSEHOLD
(Percentage Distribution of Households)
U.S.
The 2015 National Association of Realtors® Profile of Home Buyers and Sellers

CHARACTERISTICS OF HOME BUYERS
Exhibit 1-5
HOME PURCHASED WAS A MULTI-GENERATIONAL HOME (WILL HOME ADULT SIBLINGS, ADULT CHILDREN, PARENTS, AND/OR GRANDPARENTS)
(Percent of Respondents)
Ohio
All Buyers
Married
couple
Single
female
Single
male
Unmarried
couple Other
Children
under 18
in home
No
children
in home
Multi-generational household 12% 13% 16% * 18% 20% 18% 8%
Reasons for purchase:
Health/Caretaking of aging parents 21 12 33 * 20 * 32 6
Cost Savings 13 16 * * 20 50 14 13
Children/relatives over 18 moving back into the house 18% 20% 33% * 40% * 14% 25%
To spend more time with aging parents 3 4 * * * * 5 *
Children/relatives over 18 never left home 8 12 8 * * * 9 6
Wanted a larger home that multiple incomes could afford together * * * * * * * *
None of the above 24 24 8 * 20 * 14 38
Other 13 12 17 * * 50 14 13
U.S.
All Buyers
Married
couple
Single
female
Single
male
Unmarried
couple Other
Children
under 18
in home
No
children
in home
Multi-generational household 13% 13% 11% 10% 8% 37% 15% 12%
Reasons for purchase:
Health/Caretaking of aging parents 21% 24% 14% 10% 22% 14% 24% 19%
Cost Savings 15 14 9 27 14 20 16 14
Children/relatives over 18 moving back into the house 11 11 13 13 14 8 10 12
To spend more time with aging parents 7 10 2 3 * 4 10 6
Children/relatives over 18 never left home 7 9 2 3 * 8 6 7
Wanted a larger home that multiple incomes could afford together 5 4 6 10 8 4 6 4
None of the above 29 24 50 32 33 28 24 33
Other 5 5 5 2 8 14 5 5
ADULT COMPOSITION OF HOUSEHOLD CHILDREN IN HOME
ADULT COMPOSITION OF HOUSEHOLD CHILDREN IN HOME
The 2015 National Association of Realtors® Profile of Home Buyers and Sellers

CHARACTERISTICS OF HOME BUYERS
Exhibit 1-6
HOME BUYER SEXUAL ORIENTATION
(Percentage Distribution)
Ohio
Heterosexual or straight 89%
Gay or lesbian 2%
Bisexual 1%
Prefer not to answer 8%
U.S.
Heterosexual or straight 90%
Gay or lesbian 3%
Bisexual 1%
Prefer not to answer 7%
The 2015 National Association of Realtors® Profile of Home Buyers and Sellers

CHARACTERISTICS OF HOME BUYERS
Exhibit 1-7
RACE/ETHNICITY OF HOME BUYERS, BY REGION
(Percent of Respondents)
Ohio U.S. Northeast Midwest South West
White/Caucasian 95% 85% 90% 93% 82% 81%Hispanic/Latino/Mexican/
Puerto Rican 2 6 4 2 8 8
Asian/Pacific Islander 0 5 3 1 4 8
Black/African-American 3 5 4 3 6 2
Other 1 2 2 2 2 3
Note: Respondents were permitted to select as many races and ethnicities as they felt applicable.
The percentage distribution may therefore sum to more than 100 percent.
BUYERS WHO PURCHASED A HOME IN THE
The 2015 National Association of Realtors® Profile of Home Buyers and Sellers

CHARACTERISTICS OF HOME BUYERS
Exhibit 1-8
RACE/ETHNICITY OF HOME BUYERS, BY ADULT COMPOSITION OF HOUSEHOLD
(Percent of Respondents)
Ohio
All Buyers
Married
couple
Single
female
Single
male
Unmarried
couple Other
Children
under 18
in home
No
children
in home
White/Caucasian 95% 94% 100% 90% 94% 60% 89% 98%
Black/African-American 3 3 * 5 6 20 6 1
Hispanic/Latino 2 3 * * 3 * 3 2
Asian/Pacific Islander 0 1 * * * * 1 *
Other 1 1 * 5 * 20 2 1
* Less than 1 percent
U.S.
All Buyers
Married
couple
Single
female
Single
male
Unmarried
couple Other
Children
under 18
in home
No
children
in home
White/Caucasian 85% 85% 83% 85% 91% 82% 78% 89%
Hispanic/Latino/Mexican/
Puerto Rican 6 6 5 8 6 6 10 4
Asian/Pacific Islander 5 5 2 3 3 7 7 3
Black/African-American 5 4 10 4 3 3 6 4
Other 2 2 2 4 1 2 2 2
Note: Respondents were permitted to select as many races and ethnicities as they felt applicable.
The percentage distribution may therefore sum to more than 100 percent.
ADULT COMPOSITION OF HOUSEHOLD
ADULT COMPOSITION OF HOUSEHOLD CHILDREN IN HOME
CHILDREN IN HOME
The 2015 National Association of Realtors® Profile of Home Buyers and Sellers

CHARACTERISTICS OF HOME BUYERS
Exhibit 1-9
PRIMARY LANGUAGE SPOKEN IN HOME BUYER HOUSEHOLD, BY REGION
(Percentage Distribution)
Ohio U.S. Northeast Midwest South West
English 100% 96% 97% 98% 96% 95%
Other * 4 3 2 4 5
BUYERS WHO PURCHASED A HOME IN THE
0%
10%
20%
30%
40%
50%
60%
70%
80%
90%
100%
U.S. Northeast Midwest South West
96% 97% 98% 96% 95%
4 3 2 4 5
English Other
The 2015 National Association of Realtors® Profile of Home Buyers and Sellers

CHARACTERISTICS OF HOME BUYERS
Exhibit 1-10
NATIONAL ORIGIN OF HOME BUYERS, BY REGION
(Percentage Distribution)
Ohio U.S. Northeast Midwest South West
Born in U.S. 97% 91% 91% 96% 89% 89%
Not born in U.S. 3 9 9 4 11 11
BUYERS WHO PURCHASED A HOME IN THE
0%
10%
20%
30%
40%
50%
60%
70%
80%
90%
100%
U.S. Northeast Midwest South West
91% 91%96%
89% 89%
9 94
11 11
Born in U.S. Not born in U.S.
The 2015 National Association of Realtors® Profile of Home Buyers and Sellers
CHARACTERISTICS OF HOME BUYERS
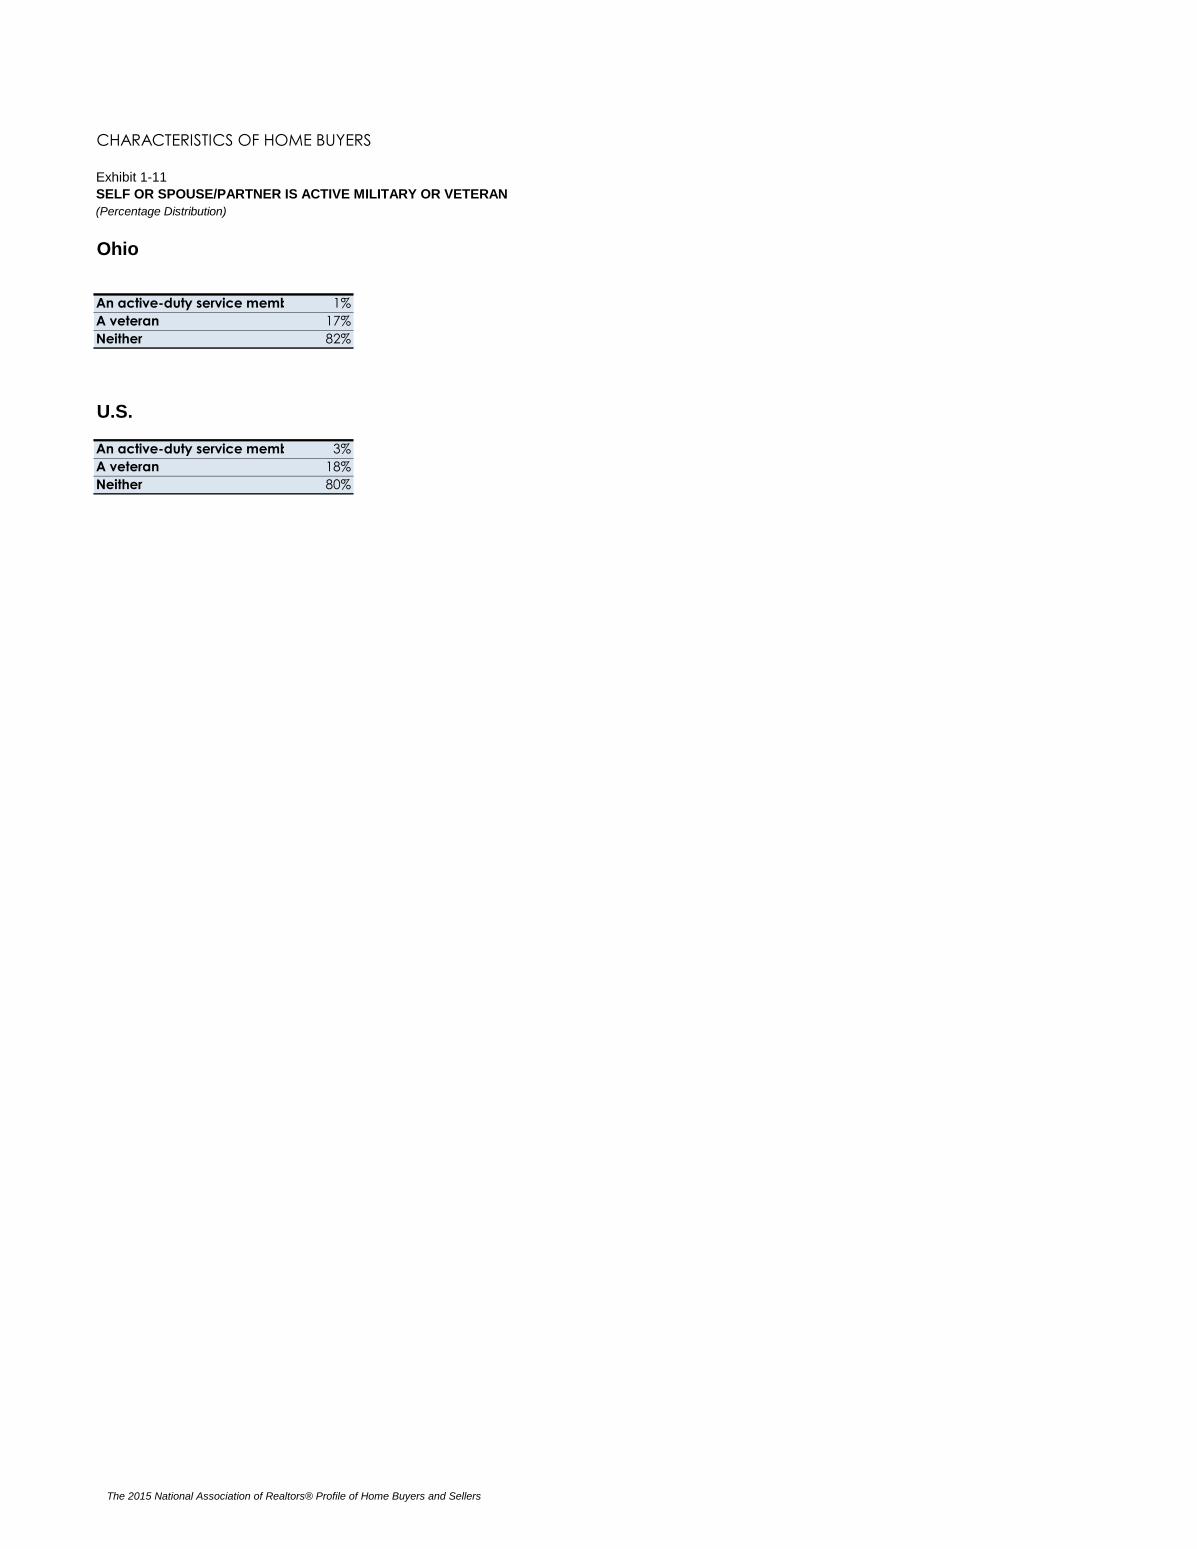
Exhibit 1-11
SELF OR SPOUSE/PARTNER IS ACTIVE MILITARY OR VETERAN
(Percentage Distribution)
Ohio
An active-duty service member 1%
A veteran 17%
Neither 82%
U.S.
An active-duty service member 3%
A veteran 18%
Neither 80%
The 2015 National Association of Realtors® Profile of Home Buyers and Sellers

CHARACTERISTICS OF HOME BUYERS
Exhibit 1-12
FIRST-TIME HOME BUYERS
(Percent of all Home Buyers)
Year Percentage
2001 42%
2003 40%
2004 40%
2005 40%
2006 36%
2007 39%
2008 41%
2009 47%
2010 50%
2011 37%
2012 39%
2013 38%
2014 33%
2015 US 32%
2015 Ohio 39%
42%40% 40% 40%
36%39%
41%
47%50%
37%39% 38%
33% 32%
39%
20%
25%
30%
35%
40%
45%
50%
55%
60%
65%
70%
75%
80%
2001 2003 2004 2005 2006 2007 2008 2009 2010 2011 2012 2013 2014 2015 2015
FIRST-TIME HOME BUYERS(Percent of all Home Buyers)
U.S.
The 2015 National Association of Realtors® Profile of Home Buyers and Sellers

CHARACTERISTICS OF HOME BUYERS
Exhibit 1-13
FIRST-TIME HOME BUYERS, BY REGION
(Percent of all Home Buyers)
Ohio 39%
U.S. 32%
Northeast 43%
Midwest 38%
South 30%
West 26%
39%
32%
43%
38%
30%
26%
20%
25%
30%
35%
40%
45%
50%
55%
60%
65%
70%
75%
80%
Ohio U.S. Northeast Midwest South West
FIRST-TIME HOME BUYERS, BY REGION(Percent of all Home Buyers)
The 2015 National Association of Realtors® Profile of Home Buyers and Sellers

CHARACTERISTICS OF HOME BUYERS
Exhibit 1-14
FIRST-TIME AND REPEAT HOME BUYERS BY HOUSEHOLD TYPE
(Percentage Distribution of Households)
Ohio Ohio
Married couple 50% Married couple 65%
Single female 21% Single female 23%
Single male 8% Single male 5%
Unmarried couple 19% Unmarried couple 6%
Other 2% Other 2%
U.S. U.S.
Married couple 56% Married couple 72%
Single female 18% Single female 14%
Single male 11% Single male 8%
Unmarried couple 13% Unmarried couple 5%
Other 2% Other 2%
Married couple, 50%
Single female, 21%
Single male, 8%
Unmarried couple, 19%
Other, 2%
FIRST-TIME HOME BUYERS(Percentage Distribution)
WISC
Ohio
Married couple, 56%
Single female, 18%
Single male, 11%
Unmarried couple, 13%
Other, 2%
FIRST-TIME HOME BUYERS(Percentage Distribution)
U.S.
The 2015 National Association of Realtors® Profile of Home Buyers and Sellers

Married couple, 65%
Single female, 23%
Single male, 5%
Unmarried couple, 6% Other, 2%
REPEAT HOME BUYERS(Percentage Distribution)
Ohio
Married couple, 72%
Single female, 14%
Single male, 8%
Unmarried couple, 5% Other, 2%
REPEAT HOME BUYERS(Percentage Distribution)
U.S.
The 2015 National Association of Realtors® Profile of Home Buyers and Sellers

CHARACTERISTICS OF HOME BUYERS
Exhibit 1-15
FIRST-TIME AND REPEAT HOME BUYERS BY CHILDREN IN HOUSEHOLD
(Percentage Distribution of Households)
Ohio Ohio
One 26% One 14%
Two 10% Two 16%
Three or more 12% Three or more 6%
None 52% None 64%
U.S. U.S.
One 19% One 13%
Two 14% Two 15%
Three or more 7% Three or more 7%
None 60% None 64%
One, 26%
Two, 10%
Three or more, 12%
None, 52%
FIRST-TIME HOME BUYERS(Percentage Distribution)
WISC
Ohio
One, 19%
Two, 14%
Three or more, 7%
None, 60%
FIRST-TIME HOME BUYERS(Percentage Distribution)
U.S.
None
The 2015 National Association of Realtors® Profile of Home Buyers and Sellers

One, 14%
Two, 16%
Three or more, 6%
None, 64%
REPEAT HOME BUYERS(Percentage Distribution)
Ohio
One, 13%
Two, 15%
Three or more, 7%
None, 64%
REPEAT HOME BUYERS(Percentage Distribution)
U.S.
The 2015 National Association of Realtors® Profile of Home Buyers and Sellers

CHARACTERISTICS OF HOME BUYERS
Exhibit 1-16
AGE OF FIRST-TIME AND REPEAT BUYERS
(Percentage Distribution)
Ohio
All Buyers First-time Buyers Repeat Buyers
18 to 24 years 4% 9% *
25 to 34 years 31 55 15
35 to 44 years 19 22 16
45 to 54 years 18 4 27
55 to 64 years 12 6 17
65 to 74 years 13 3 20
75 years or older 4 1 5
Median age (years) 43 30 51
Married couple 39 30 50
Single female 38 36 58
Single male 39 32 47
Unmarried couple 29 27 48
Other 49 46 49
U.S.
All Buyers First-time Buyers Repeat Buyers
18 to 24 years 3% 8% *
25 to 34 years 28 58 13
35 to 44 years 20 19 20
45 to 54 years 15 8 19
55 to 64 years 17 5 22
65 to 74 years 14 2 20
75 years or older 4 * 6
Median age (years) 44 31 53
Married couple 43 31 51
Single female 50 32 58
Single male 45 30 54
Unmarried couple 33 28 49
Other 54 45 62
* Less than 1 percent
The 2015 National Association of Realtors® Profile of Home Buyers and Sellers

CHARACTERISTICS OF HOME BUYERS
Exhibit 1-17
HOUSEHOLD INCOME OF FIRST-TIME AND REPEAT BUYERS, 2014
(Percentage Distribution)
Ohio
All Buyers First-time Buyers Repeat Buyers
Less than $25,000 5% 9% 3%
$25,000 to $34,999 9 11 8
$35,000 to $44,999 14 17 11
$45,000 to $54,999 11 15 7
$55,000 to $64,999 10 14 7
$65,000 to $74,999 10 8 11
$75,000 to $84,999 8 7 8
$85,000 to $99,999 9 10 9
$100,000 to $124,999 11 5 16
$125,000 to $149,999 5 3 7
$150,000 to $174,999 3 * 5
$175,000 to $199,999 1 * 2
$200,000 or more 4 1 7
Median income (2014) $66,800 $53,600 $75,000
Married couple $77,200 $59,500 $92,700
Single female $47,200 $60,000 $60,000
Single male $49,000 $48,300 $50,000
Unmarried couple $76,200 $70,100 $85,200Other $30,000 $30,000 $30,000
* Less than 1 percent
U.S.
All Buyers First-time Buyers Repeat Buyers
Less than $25,000 3% 4% 2%
$25,000 to $34,999 5 8 4
$35,000 to $44,999 7 10 5
$45,000 to $54,999 7 10 6
$55,000 to $64,999 9 13 8
$65,000 to $74,999 9 12 8
$75,000 to $84,999 9 10 8
$85,000 to $99,999 10 8 10
$100,000 to $124,999 15 12 17
$125,000 to $149,999 9 4 11
$150,000 to $174,999 5 4 6
$175,000 to $199,999 3 2 4
$200,000 or more 8 3 11
Median income (2014) $86,100 $69,400 $98,700
Married couple $99,400 $77,500 $108,600
Single female $57,300 $49,400 $62,300
Single male $67,000 $58,100 $71,900
Unmarried couple $87,600 $74,600 $107,300
Other $68,700 $63,800 $76,800
The 2015 National Association of Realtors® Profile of Home Buyers and Sellers

CHARACTERISTICS OF HOME BUYERS
Exhibit 1-18
RACE/ETHNICITY OF FIRST-TIME AND REPEAT BUYERS
(Percent of Respondents)
Ohio
All Buyers First-time Buyers Repeat Buyers
White/Caucasian 95% 90% 97%
Black/African-American 3 5 2
Asian/Pacific Islander 2 1 *
Hispanic/Latino 0 3 2
Other 1 3 1
* Less than 1 percent
U.S.
All Buyers First-time Buyers Repeat Buyers
White/Caucasian 85% 78% 88%
Hispanic/Latino/Mexican/Puerto Rican 6 9 5
Asian/Pacific Islander 5 6 4
Black/African-American 5 7 3
Other 2 3 2
Note: Respondents were permitted to select as many races and ethnicities as they felt applicable.
The percentage distribution may therefore sum to more than 100 percent.
The 2015 National Association of Realtors® Profile of Home Buyers and Sellers

CHARACTERISTICS OF HOME BUYERS
Exhibit 1-19
PRIMARY LANGUAGE SPOKEN IN FIRST-TIME AND REPEAT BUYER HOUSEHOLDS
(Percentage Distribution)
Ohio
All Buyers First-time Buyers Repeat Buyers
English 100% 100% 100%
Other * * *
U.S.
All Buyers First-time Buyers Repeat Buyers
English 96% 94% 98%
Other 4 6 2
The 2015 National Association of Realtors® Profile of Home Buyers and Sellers

CHARACTERISTICS OF HOME BUYERS
Exhibit 1-20
NATIONAL ORIGIN OF FIRST-TIME AND REPEAT BUYERS
(Percentage Distribution)
Ohio
All Buyers First-time Buyers Repeat Buyers
Born in U.S. 97% 95% 99%
Not born in U.S. 3 5 1
U.S.
All Buyers First-time Buyers Repeat Buyers
Born in U.S. 91% 88% 92%
Not born in U.S. 9 12 8
The 2015 National Association of Realtors® Profile of Home Buyers and Sellers

CHARACTERISTICS OF HOME BUYERS
Exhibit 1-21
PRIOR LIVING ARRANGEMENT OF FIRST-TIME AND REPEAT BUYERS
(Percentage Distribution)
Ohio
All Buyers
First-time
Buyers
Repeat
Buyers
Rented an apartment or house 38% 65% 21%
Owned previous residence 46 5 72
Lived with parents, relatives or friends 15 28 7
Rented the home buyer ultimately purchased 1 2 1
* Less than 1 percent
U.S.
All Buyers
First-time
Buyers
Repeat
Buyers
Rented an apartment or house 43% 75% 27%
Owned previous residence 46 4 66
Lived with parents, relatives or friends 10 19 6
Rented the home buyer ultimately purchased 2 2 1
Note: After selling their previous home, buyers may have rented a home or apartment before
purchasing their next home. A first-time buyer could have acquired ownership of their previous home
(as an inheritance or gift, for example) without having been the buyer of the home. Thus, a
first-time buyer could have owned a home prior to their first home purchase.
The 2015 National Association of Realtors® Profile of Home Buyers and Sellers

CHARACTERISTICS OF HOME BUYERS
Exhibit 1-22
PRIOR LIVING ARRANGEMENT, BY ADULT COMPOSITION OF HOUSEHOLD
(Percentage Distribution)
Ohio
All
Buyers
Married
couple
Single
female
Single
male
Unmarried
couple Other
Children
under 18
in home
No
children
in home
Rented an apartment or house 38% 34% 37% 58% 51% 40% 50% 31%
Owned previous residence 46 54 41 26 23 20 37 51
Lived with parents, relatives or friends 15 11 21 16 23 20 12 17
Rented the home buyer ultimately purchased 1 1 2 * 3 20 2 1
U.S.
All
Buyers
Married
couple
Single
female
Single
male
Unmarried
couple Other
Children
under 18
in home
No
children
in home
Rented an apartment or house 43% 39% 44% 50% 57% 51% 45% 41%
Owned previous residence 46 52 37 29 27 44 43 47
Lived with parents, relatives or friends 10 7 17 20 15 4 11 10
Rented the home buyer ultimately purchased 2 2 2 1 1 2 2 2
* Less than 1 percent
Note: After selling their previous home, buyers may have rented a home or apartment before
purchasing their next home. A first-time buyer could have acquired ownership of their previous home
(as an inheritance or gift, for example) without having been the buyer of the home. Thus, a
first-time buyer could have owned a home prior to their first home purchase.
ADULT COMPOSITION OF HOUSEHOLD
ADULT COMPOSITION OF HOUSEHOLD CHILDREN IN HOME
CHILDREN IN HOME
The 2015 National Association of Realtors® Profile of Home Buyers and Sellers

CHARACTERISTICS OF HOME BUYERS
Exhibit 1-23
PRIMARY REASON FOR PURCHASING A HOME, FIRST-TIME AND REPEAT BUYERS
(Percentage Distribution)
Ohio
All Buyers
First-time
Buyers
Repeat
Buyers
Desire to own a home 32% 65% 11%
Job-related relocation or move 7 3 10
Desire for larger home 10 2 15
Desire to be closer to family/friends/relatives 9 3 13
Change in family situation 10 9 11
Desire for a home in a better area 5 3 7
Retirement 3 1 4
Affordability of homes 3 3 4
Tax benefits 0 * 1
Desire to be closer to job/school/transit 2 1 3
Greater choice of homes on the market 0 * 1
Desire for smaller home 8 2 12
Desire for a newly built or custom-built home 0 1 *
Establish household 3 6 1
Financial security 2 2 2
Purchased home for family member or relative 0 1 *
Desire for vacation home/investment property 0 1 *
Other 5 * 8
U.S.
All Buyers
First-time
Buyers
Repeat
Buyers
Desire to own a home of my own 30% 64% 13%
Desire for larger home 10 4 13
Job-related relocation or move 8 3 11
Change in family situation (e.g. marriage, birth of
child, divorce, etc.) 7 6 8
Desire to be closer to family/friends/relatives 7 2 9
Desire for smaller home 6 * 9
Desire for a home in a better area 6 2 7
Retirement 5 1 7
Desire to be closer to job/school/transit 4 1 5
Affordability of homes 3 4 2
Financial security 2 3 2
Desire for a newly built or custom-built home 2 1 3
Establish a household 2 4 1
Tax benefits 1 1 1
Purchased home for family member or relative * * 1
Other 7 4 8
The 2015 National Association of Realtors® Profile of Home Buyers and Sellers

CHARACTERISTICS OF HOME BUYERS
Exhibit 1-24
PRIMARY REASON FOR PURCHASING A HOME, BY ADULT COMPOSITION OF HOUSEHOLD
(Percentage Distribution)
Ohio
All
Buyers
Married
couple
Single
female
Single
male
Unmarried
couple Other
Children
under 18
in home
No
children
in home
Desire to own a home 32% 26% 34% 61% 37% 50% 34% 30%
Job-related relocation or move 7 10 4 * * * 9 6
Desire for larger home 10 12 4 6 14 * 12 9
Desire to be closer to family/friends/relatives 9 10 9 * 6 * 7 10
Change in family situation 10 7 18 17 11 25 9 12
Desire for a home in a better area 5 7 3 * 6 * 10 3
Retirement 3 3 4 6 * * 1 4
Affordability of homes 3 4 4 * * * 4 3
Tax benefits 0 1 * * * * * 1
Desire to be closer to job/school/transit 2 3 * 6 * * 3 1
Greater choice of homes on the market 0 1 * * * * * 1
Desire for smaller home 8 8 15 * * * 2 12
Desire for a newly built or custom-built home 0 1 * * * * * 1
Establish household 3 1 * 6 11 25 3 2
Financial security 2 2 2 * 6 * 2 2
Purchased home for family member or relative 0 * 2 * * * * 1
Desire for vacation home/investment property 0 1 * * * * * 1
Other 5 6 2 * 9 * 4 6
U.S.
All
Buyers
Married
couple
Single
female
Single
male
Unmarried
couple Other
Children
under 18
in home
No
children
in home
Desire to own a home of my own 30% 24% 37% 47% 43% 36% 30% 29%
Desire for larger home 10 13 4 3 10 2 18 5
Job-related relocation or move 8 10 4 3 5 3 12 6
Change in family situation (e.g. marriage, birth of child, divorce, etc.)7 5 12 11 8 16 9 6
Desire to be closer to family/friends/relatives 7 7 9 6 2 9 3 9
Desire for smaller home 6 6 7 4 4 2 2 9
Desire for a home in a better area 6 6 4 3 6 8 7 5
Retirement 5 6 5 6 2 2 1 8
Desire to be closer to job/school/transit 4 4 3 1 1 5 6 3
Affordability of homes 3 3 3 4 5 2 3 3
Financial security 2 2 3 4 2 * 2 3
Desire for a newly built or custom-built home 2 3 * 1 1 2 2 2
Establish a household 2 2 * 2 4 2 3 1
Tax benefits 1 1 2 1 1 2 1 1
Purchased home for family member or relative * * 1 1 ( 2 * 1
Other 7 7 7 3 5 10 4 8
ADULT COMPOSITION OF HOUSEHOLD
ADULT COMPOSITION OF HOUSEHOLD CHILDREN IN HOME
CHILDREN IN HOME
The 2015 National Association of Realtors® Profile of Home Buyers and Sellers

CHARACTERISTICS OF HOME BUYERS
Exhibit 1-25
PRIMARY REASON FOR THE TIMING OF HOME PURCHASE, FIRST-TIME AND REPEAT BUYERS
(Percentage Distribution)
Ohio
All Buyers
First-time
Buyers
Repeat
Buyers
It was just the right time, the buyer was ready to
buy a home
47% 60% 39%
It was the best time because of affordability of
homes
6 8 4
Did not have much choice, had to purchase 17 9 23
It was the best time because of availability of
homes for sale
11 7 14
It was the best time because of mortgage
financing options available
6 9 3
Other 12 5 16
The buyer wished they had waited 1 3 1
U.S.
All Buyers
First-time
Buyers
Repeat
Buyers
It was just the right time for me, was ready to buy
a home46% 57% 41%
Did not have much choice, had to purchase
when did16 12 18
It was the best time for because of availability of
homes for sale11 6 13
It was the best time for because of mortgage
financing options available9 11 8
It was the best time for because of affordability
of homes8 7 8
Other 9 5 11
Wish had waited 2 2 2
The 2015 National Association of Realtors® Profile of Home Buyers and Sellers

CHARACTERISTICS OF HOME BUYERS
Exhibit 1-26
OTHER HOMES OWNED, BY AGE
(Percentage Distribution)
Ohio
All Buyers 18 to 24 25 to 44 45 to 64 65 or older
Recently purchased home only 81% 100% 86% 76% 71%
One or more vacation homes 3 * 1 3 10
One or more investment properties 8 * 6 12 4
Primary residence 3 * 3 3 2
Previous homes that buyer is trying to sell 5 5 5 5 5
Other 3 * 1 3 8
U.S.
All Buyers 18 to 24 25 to 44 45 to 64 65 or older
Recently purchased home only 81% 98% 85% 77% 78%
One or more investment properties 10 * 10 10 9
Previous homes that buyer is trying to sell 3 * 2 4 6
Primary residence 3 1 2 3 2
One or more vacation homes 4 * 1 6 6
Other 2 * 1 4 2
* Less than 1 percent
AGE OF HOME BUYER
AGE OF HOME BUYER
The 2015 National Association of Realtors® Profile of Home Buyers and Sellers

CHARACTERISTICS OF HOMES PURCHASED
Exhibit 2-1 NEW AND PREVIOUSLY OWNED HOMES PURCHASED, 2001-2015
Exhibit 2-2 NEW AND PREVIOUSLY OWNED HOMES PURCHASED, BY REGION
Exhibit 2-3 WHY NEW AND PREVIOUSLY OWNED HOMES PURCHASED
Exhibit 2-4 TYPE OF HOME PURCHASED, BY LOCATION
Exhibit 2-5 TYPE OF HOME PURCHASED BY FIRST-TIME AND REPEAT BUYERS, AND BUYERS OF NEW
AND PREVIOUSLY OWNED HOMES
Exhibit 2-6 TYPE OF HOME PURCHASED, BY ADULT COMPOSITION OF HOUSEHOLD
Exhibit 2-7 LOCATION OF HOME PURCHASED, BY REGION
Exhibit 2-8 LOCATION OF HOME PURCHASED BY FIRST-TIME AND REPEAT BUYERS, AND BUYERS OF
NEW AND PREVIOUSLY OWNED HOMES
Exhibit 2-9 LOCATION OF HOME PURCHASED VERSUS LOCATION OF HOME SOLD
Exhibit 2-10 SENIOR RELATED HOUSING BY TYPE OF HOME PURCHASED AND LOCATION
Exhibit 2-10 DISTANCE BETWEEN HOME PURCHASED AND PREVIOUS RESIDENCE
Exhibit 2-11 FACTORS INFLUENCING NEIGHBORHOOD CHOICE, BY LOCATION
Exhibit 2-12 FACTORS INFLUENCING NEIGHBORHOOD CHOICE, BY ADULT COMPOSITION OF
HOUSEHOLD AND CHILDREN IN HOUSHOLD
Exhibit 2-13 PRICE OF HOME PURCHASED, BY REGION
Exhibit 2-14 PRICE OF HOME PURCHASED, NEW AND PREVIOUSLY OWNED HOMES
Exhibit 2-15 PRICE OF HOME PURCHASED, FIRST-TIME AND REPEAT BUYERS
Exhibit 2-16 PURCHASE PRICE COMPARED WITH ASKING PRICE, BY REGION
Exhibit 2-17 SIZE OF HOME PURCHASED, FIRST-TIME AND REPEAT BUYERS, AND BUYERS OF NEW
AND PREVIOUSLY OWNED HOMES
Exhibit 2-18 SIZE OF HOME PURCHASED, BY ADULT COMPOSITION OF HOUSEHOLD
Exhibit 2-19 HOME SIZE AND PRICE PER SQUARE FOOT, BY REGION
Exhibit 2-20 NUMBER OF BEDROOMS AND BATHROOMS, BY FIRST-TIME AND REPEAT BUYERS, AND
BUYERS OF NEW AND PREVIOUSLY OWNED HOMES
Exhibit 2-21 NUMBER OF BEDROOMS AND BATHROOMS, BY ADULT HOUSEHOLD COMPOSITION AND
CHILDREN IN HOUSEHOLD
Exhibit 2-22 YEAR HOME BUILT, BY REGION
Exhibit 2-23 IMPORTANCE OF COMMUTING COSTS
Exhibit 2-24 IMPORTANCE OF HOME'S ENVIRONMENTALLY FRIENDLY FEATURES
Exhibit 2-25 ENVIRONMENTALLY FRIENDLY FEATURES CONSIDERED "VERY IMPORTANT", BY REGION
Exhibit 2-26 ENVIRONMENTALLY FRIENDLY FEATURES CONSIDERED "VERY IMPORTANT", BY YEAR
HOME WAS BUILT
Exhibit 2-27 CHARACTERISTICS OF HOME ON WHICH BUYER COMPROMISED, BY LOCATION
Exhibit 2-28 CHARACTERISTICS OF HOME ON WHICH BUYER COMPROMISED, FIRST-TIME AND REPEAT
BUYERS, AND BUYERS OF NEW AND PREVIOUSLY OWNED HOMES
Exhibit 2-29 CHARACTERISTICS OF HOME ON WHICH BUYER COMPROMISED, BY ADULT COMPOSITION
OF HOUSEHOLD
Exhibit 2-30 EXPECTED LENGTH OF TENURE IN HOME PURCHASED, FIRST-TIME AND REPEAT BUYERS,
AND BUYERS OF NEW AND PREVIOUSLY OWNED HOMES
Exhibit 2-31 EXPECTED LENGTH OF TENURE IN HOME PURCHASED, BY AGE
Exhibit 2-32 FACTORS THAT COULD CAUSE BUYER TO MOVE, BY AGE
Exhibit 2-33 FACTORS THAT COULD CAUSE BUYER TO MOVE, BY ADULT COMPOSITION OF HOUSEHOLD
The 2015 National Association of Realtors® Profile of Home Buyers and Selle Chapter 2, Page 1 o

CHARACTERISTICS OF HOMES PURCHASED
Exhibit 2-1
NEW AND PREVIOUSLY OWNED HOMES PURCHASED, 2001-2015
(Percentage Distribution)
New
Previously
Owned
2015 6% 94%
U.S.
New
Previously
Owned
2001FACTORS THAT COULD CAUSE BUYER TO MOVE, BY ADULT COMPOSITION OF HOUSEHOLD 79%
2003 28% 72%
2004 21% 79%
2005 23% 77%
2006 22% 78%
2007 23% 77%
2008 21% 79%
2009 18% 82%
2010 15% 85%
2011 16% 84%
2012 16% 84%
2013 16% 84%
2014 16% 84%
2015 16% 84%
Ohio
6%
94%
0%
20%
40%
60%
80%
100%
2015
NEW AND PREVIOUSLY OWNED HOMES PURCHASED(Percentage Distribution)
New Previously Owned
Ohio
0%
28%
21% 23% 22% 23% 21%18% 15% 16% 16% 16% 16%
79%
72%
79% 77% 78% 77% 79%82% 85% 84% 84% 84% 84%
0%
20%
40%
60%
80%
100%
2001 2003 2004 2005 2006 2007 2008 2009 2010 2011 2012 2013 2014
NEW AND PREVIOUSLY OWNED HOMES PURCHASED(Percentage Distribution)
New Previously Owned
U.S.
The 2015 National Association of Realtors® Profile of Home Buyers and Selle Chapter 2, Page 2 o

CHARACTERISTICS OF HOMES PURCHASED
Exhibit 2-2
NEW AND PREVIOUSLY OWNED HOMES PURCHASED, BY REGION
(Percentage Distribution)
U.S. Northeast Midwest South West
New 6% 16% 7% 8% 24% 15%
Previously Owned 94 84 93 91 76 85
BUYERS WHO PURCHASED A HOME IN THE
All Buyers Northeast Midwest South West
New 16% 7% 8% 24% 15%
Previously Owned 84% 93% 91% 76% 85%
FACTORS THAT COULD CAUSE BUYER TO MOVE, BY ADULT COMPOSITION OF HOUSEHOLD
BUYERS WHO PURCHASED A HOME IN THE
Ohio
16%
7% 8%
24%
15%
84%
93% 91%
76%
85%
%
10%
20%
30%
40%
50%
60%
70%
80%
90%
100%
All Buyers Northeast Midwest South West
New Previously Owned
The 2015 National Association of Realtors® Profile of Home Buyers and Selle Chapter 2, Page 3 o

CHARACTERISTICS OF HOMES PURCHASED
Exhibit 2-3
WHY NEW AND PREVIOUSLY OWNED HOMES PURCHASED
(Percent of Respondents)
Ohio
New Home: 6%Avoid renovations or problems with
plumbing or electricity 35%Ability to choose and customize
design features 19Amenities of new home construction
communities 8Lack of inventory of previously
owned home 4
Green/energy efficiency *
Other 39
Previously Owned Home: 94%
Better price 34%
Better overall value 29
More charm and character 22
Lack of inventory of new homes 6
Other 39
U.S.
New Home: Avoid renovations or problems with
plumbing or electricity 34%Ability to choose and customize
design features 30Amenities of new home construction
communities 17
Green/energy efficiency 11Lack of inventory of previously
owned home 7
Other 12
Previously Owned Home:
Better priceFACTORS THAT COULD CAUSE BUYER TO MOVE, BY ADULT COMPOSITION OF HOUSEHOLD
Better overall value 29
More charm and character 19
Lack of inventory of new homes 9
Other 17
The 2015 National Association of Realtors® Profile of Home Buyers and Selle Chapter 2, Page 4 o

CHARACTERISTICS OF HOMES PURCHASED
Exhibit 2-4
TYPE OF HOME PURCHASED, BY LOCATION
(Percentage Distribution)
Ohio
All
Buyers
Suburb/
Subdivision
Small
town
Urban/
Central city
Rural
area
Resort/
Recreation
area
Detached single-family home 83% 85% 81% 88% 80% 100%
Townhouse/row house 2 2 5 * 2 *
Apartment/condo in building
with 5 or more units3 3 3 3 2 *
Duplex/apartment/condo in 2 to
4 unit building4 3 6 3 2 *
Other 9 8 5 6 15 *
* Less than 1 percent
U.S.
All
Buyers
Suburb/
Subdivision
Small
town
Urban/
Central city
Rural
area
Resort/
Recreation
area
Detached single-family home 83% 86% 82% 78% 81% 68%
Townhouse/row house 7% 8% 6% 11% 2% 11%
Apartment/condo in building
with 5 or more units
1% 2% 1% 2% 1% 4%
Duplex/apartment/condo in 2 to
4 unit building
2% 2% 1% 4% 1% 9%
Other 7% 3% 10% 6% 16% 8%
* Less than 1 percent
BUYERS WHO PURCHASED A HOME IN A
BUYERS WHO PURCHASED A HOME IN A
83%86%
82%78%
81%
68%
7% 8% 6%11%
2%
11%
1% 2% 1% 2% 1%4%
2% 2% 1%4%
1%
9%7%
3%
10%6%
16%
8%
0%
10%
20%
30%
40%
50%
60%
70%
80%
90%
All Buyers Suburb/Subdivision
Small town Urban/ Central city Rural area Resort/ Recreationarea
Detached single-family home Townhouse/row house
Apartment/condo in building with 5 or more units Duplex/apartment/condo in 2 to 4 unit building
Other
The 2015 National Association of Realtors® Profile of Home Buyers and Selle Chapter 2, Page 5 o

CHARACTERISTICS OF HOMES PURCHASED
Exhibit 2-5
(Percentage Distribution)
Ohio
All
Buyers
First-time
Buyers
Repeat
Buyers
New
Homes
Previously
Owned
Homes
Detached single-family home 83% 87% 81% 58% 85%
Townhouse/row house 2 2 3 5 2
Apartment/condo in building with 5 or more units 3 1 4 11 2
Duplex/apartment/condo in 2 to 4 unit building 4 2 4 5 3
Other 9 9 8 21 8
* Less than 1 percent
U.S.
All
Buyers
First-time
Buyers
Repeat
Buyers
New
Homes
Previously
Owned
Homes
Detached single-family home 83% 80% 84% 83% 83%
Townhouse/row house 7% 9% 6% 9% 7%
Apartment/condo in building with 5 or more units 1% 1% 2% 2% 1%
Duplex/apartment/condo in 2 to 4 unit building 2% 2% 2% 2% 2%
Other 7% 8% 6% 4% 7%
BUYERS OF
BUYERS OF
TYPE OF HOME PURCHASED BY FIRST-TIME AND REPEAT BUYERS, AND BUYERS OF NEW AND
PREVIOUSLY OWNED HOMES
83%80%
84% 83% 83%
7% 9%6%
9%7%
1% 1% 2% 2% 1%2% 2% 2% 2% 2%
7% 8%6% 4%
7%
0%
10%
20%
30%
40%
50%
60%
70%
80%
90%
100%
All Buyers First-time Buyers Repeat Buyers New Homes Previously Owned Homes
Detached single-family home Townhouse/row house
Apartment/condo in building with 5 or more units Duplex/apartment/condo in 2 to 4 unit building
Other
The 2015 National Association of Realtors® Profile of Home Buyers and Selle Chapter 2, Page 6 o

CHARACTERISTICS OF HOMES PURCHASED
Exhibit 2-6
(Percentage Distribution)
Ohio
All
Buyers
Married
couple
Single
female
Single
male
Unmarried
couple Other
Children
under 18
in home
No
children
in home
Detached single-family home 83% 87% 78% 84% 71% 80% 91% 78%
Townhouse/row house 2 2 * 5 6 * 1 3
Apartment/condo in building with 5 or more units 3 1 7 5 * * 1 3
Duplex/apartment/condo in 2 to 4 unit building 4 3 7 * * * * 6
Other 9 6 7 5 23 20 7 9
* Less than 1 percent
U.S.
All
Buyers
Married
couple
Single
female
Single
male
Unmarried
couple Other
Children
under 18
in home
No
children
in home
Detached single-family home 83% 87% 72% 73% 85% 79% 89% 80%
Townhouse/row house 7 5 12 10 5 6 4 9
Apartment/condo in building with 5 or more units 1 1 4 2 1 2 1 2
Duplex/apartment/condo in 2 to 4 unit building 2 1 3 5 2 2 1 3
Other 7 5 9 10 7 11 5 7
FACTORS THAT COULD CAUSE BUYER TO MOVE, BY ADULT COMPOSITION OF HOUSEHOLD
TYPE OF HOME PURCHASED, BY ADULT COMPOSITION OF HOUSEHOLD
ADULT COMPOSITION OF HOUSEHOLD
ADULT COMPOSITION OF HOUSEHOLD CHILDREN IN HOME
CHILDREN IN HOME
The 2015 National Association of Realtors® Profile of Home Buyers and Selle Chapter 2, Page 7 o
CHARACTERISTICS OF HOMES PURCHASED
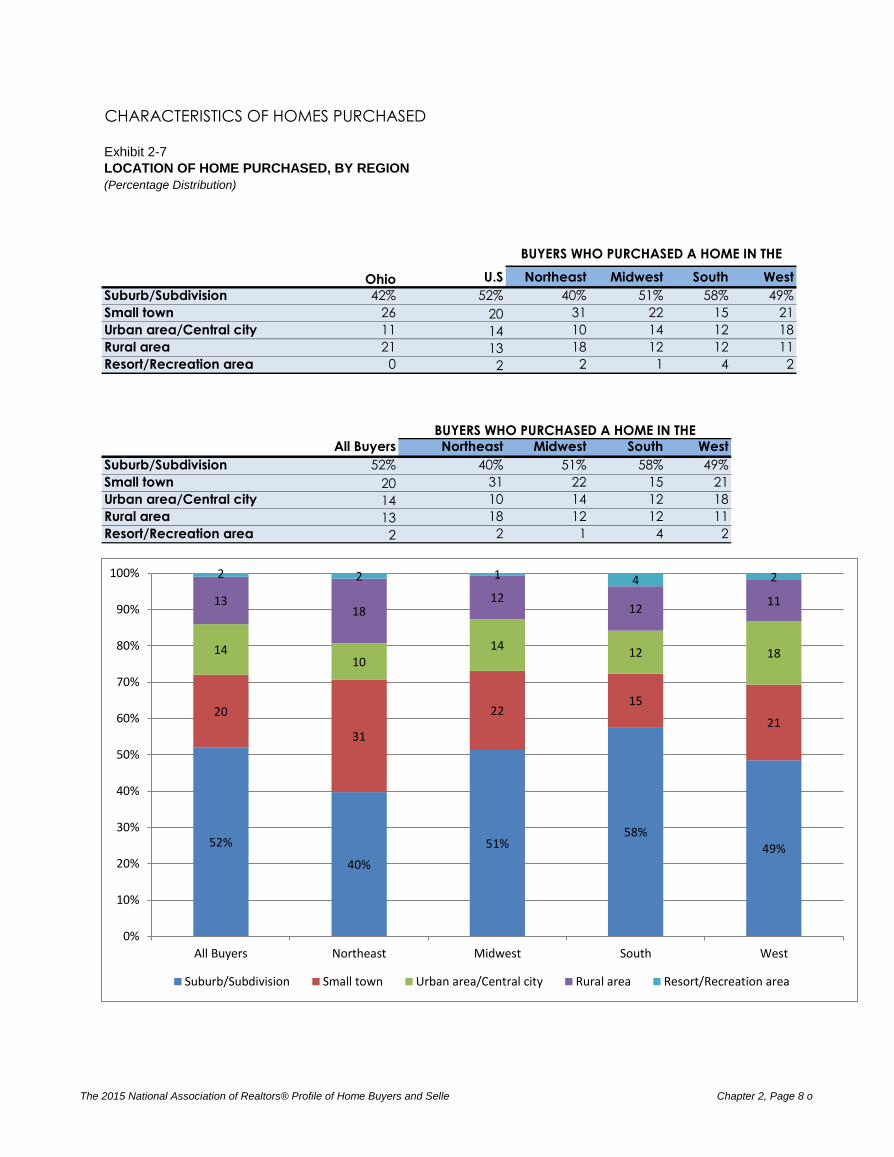
Exhibit 2-7
LOCATION OF HOME PURCHASED, BY REGION
(Percentage Distribution)
U.S Northeast Midwest South West
Suburb/Subdivision 42% 52% 40% 51% 58% 49%
Small town 26 20 31 22 15 21
Urban area/Central city 11 14 10 14 12 18
Rural area 21 13 18 12 12 11
Resort/Recreation area 0 2 2 1 4 2
All Buyers Northeast Midwest South West
Suburb/Subdivision 52% 40% 51% 58% 49%
Small town 20 31 22 15 21
Urban area/Central city 14 10 14 12 18
Rural area 13 18 12 12 11
Resort/Recreation area 2 2 1 4 2
FACTORS THAT COULD CAUSE BUYER TO MOVE, BY ADULT COMPOSITION OF HOUSEHOLD
BUYERS WHO PURCHASED A HOME IN THE
Ohio
BUYERS WHO PURCHASED A HOME IN THE
52%
40%
51%58%
49%
20
31
2215
21
1410
1412 18
1318
1212
11
2 2 1 4 2
0%
10%
20%
30%
40%
50%
60%
70%
80%
90%
100%
All Buyers Northeast Midwest South West
Suburb/Subdivision Small town Urban area/Central city Rural area Resort/Recreation area
The 2015 National Association of Realtors® Profile of Home Buyers and Selle Chapter 2, Page 8 o

CHARACTERISTICS OF HOMES PURCHASED
Exhibit 2-8
(Percentage Distribution)
Ohio
All
Buyers
First-time
Buyers
Repeat
Buyers
New
Homes
Previously
Owned
Homes
Suburb/Subdivision 42% 36% 45% 37% 42%
Small town 26 31 23 26 25
Urban area/Central city 11 13 10 11 12
Rural area 21 20 22 26 21
Resort/Recreation area 0 * 1 * 0
U.S.
All
Buyers
First-time
Buyers
Repeat
Buyers
New
Homes
Previously
Owned
Homes
Suburb/Subdivision 52% 49% 53% 60% 50%
Small town 20% 20% 20% 18% 20%
Urban area/Central city 14% 17% 12% 9% 15%
Rural area 13% 13% 12% 10% 13%
Resort/Recreation area 2% 1% 3% 3% 2%
BUYERS OF
LOCATION OF HOME PURCHASED BY FIRST-TIME AND REPEAT BUYERS, AND BUYERS OF
NEW AND PREVIOUSLY OWNED HOMES
BUYERS OF
52%
49%
53%
60%
50%
20% 20% 20%18%
20%
14%
17%
12%9%
15%13% 13% 12%
10%13%
2% 1%3% 3% 2%
0%
10%
20%
30%
40%
50%
60%
70%
All Buyers First-time Buyers Repeat Buyers New Homes Previously OwnedHomes
Suburb/Subdivision Small town Urban area/Central city Rural area Resort/Recreation area
The 2015 National Association of Realtors® Profile of Home Buyers and Selle Chapter 2, Page 9 o

CHARACTERISTICS OF HOMES PURCHASED
Exhibit 2-9
LOCATION OF HOME PURCHASED VERSUS LOCATION OF HOME SOLD
(Percentage Distribution Among those that Sold a Home)
Ohio
Suburb/
Subdivision
Small
town
Urban/
Central city
Rural
area
Resort/
Recreation
area
Suburb/Subdivision 57% 21% 20% 26% *
Small town 18 47 20 26 *
Urban area/Central city 12 3 33 5 *
Rural area 12 29 27 44 100
Resort/Recreation area 2 * * * *
U.S.
Suburb/
Subdivision
Small
town
Urban/
Central city
Rural
area
Resort/
Recreation
area
Suburb/Subdivision 35% 5% 3% 4% 1%
Small town 7 8 1 2 1
Urban area/Central city 6 3 5 2 *
Rural area 6 4 1 4 *
Resort/Recreation area 1 1 * * 1
* Less than 1 percent
FACTORS THAT COULD CAUSE BUYER TO MOVE, BY ADULT COMPOSITION OF HOUSEHOLD
LOCATION
OF HOME
SOLD
LOCATION OF HOME PURCHASED
LOCATION OF HOME PURCHASED
LOCATION
OF HOME
SOLD
The 2015 National Association of Realtors® Profile of Home Buyers and Selle Chapter 2, Page 10 o

CHARACTERISTICS OF HOMES PURCHASED
Exhibit 2-10
SENIOR RELATED HOUSING BY TYPE OF HOME PURCHASED AND LOCATION
(Percentage Distribution)
Ohio
All buyers over
50Share who purchased a home in senior related
housing 14%
Type of home purchased
Detached single-family home 38%
Townhouse/row house 6
Apartment/condo in building with 5 or more units 19
Duplex/apartment/condo in 2 to 4 unit building 25
Other 13
Location
Suburb/ Subdivision 38%
Small town 38
Urban/ Central city 19
Rural area 6
Resort/ Recreation area *
U.S.
All buyers over
50Share who purchased a home in senior related
housing 14%
Type of home purchased
Detached single-family home 67%
Townhouse/row house 7
Apartment/condo in building with 5 or more unitsFACTORS THAT COULD CAUSE BUYER TO MOVE, BY ADULT COMPOSITION OF HOUSEHOLD
Duplex/apartment/condo in 2 to 4 unit building 6
Other 15
Location
Suburb/ Subdivision 57%
Small town 21
Urban/ Central city 8
Rural area 3
Resort/ Recreation area 12
Buyers over 50 who purchased senior related housing:
Buyers over 50 who purchased senior related housing:
The 2015 National Association of Realtors® Profile of Home Buyers and Selle Chapter 2, Page 11 o

CHARACTERISTICS OF HOMES PURCHASED
Exhibit 2-10
DISTANCE BETWEEN HOME PURCHASED AND PREVIOUS RESIDENCE
(Median Miles)
Miles
Ohio 10
U.S. 14
Northeast 10
Midwest 10
South 15
West 15
10
14
10 10
15 15
0
2
4
6
8
10
12
14
16
18
20
Ohio U.S. Northeast Midwest South West
DISTANCE BETWEEN HOME PURCHASED AND PREVIOUS RESIDENCE
(Median Miles)
The 2015 National Association of Realtors® Profile of Home Buyers and Selle Chapter 2, Page 12 o

CHARACTERISTICS OF HOMES PURCHASED
Exhibit 2-11
FACTORS INFLUENCING NEIGHBORHOOD CHOICE, BY LOCATION
(Percent of Respondents)
Ohio
All
Buyers
Suburb/
Subdivision
Small
town
Urban/
Central
city
Rural
area
Resort/
Recreation
area
Quality of the neighborhood 54% 72% 49% 44% 29% 100%
Convenient to job 41 46 42 38 31 *
Overall affordability of homes 36 34 43 53 22 *
Convenient to friends/family 43 37 57 38 43 *
Quality of the school district 26 36 22 18 17 *
Design of neighborhood 21 31 19 12 8 *
Convenient to shopping 23 31 20 24 8 *
Convenient to schools 17 21 14 18 14 *
Convenient to entertainment/leisure activities 12 17 5 21 5 *
Convenient to parks/recreational facilities 16 17 19 24 8 *
Availability of larger lots or acreage 21 10 15 27 45 *
Convenient to health facilities 9 11 9 12 6 *
Home in a planned community 5 7 5 3 * *
Convenient to public transportation 1 1 1 6 * *
Convenient to airport 2 4 1 * * *
Other 3 3 4 * 5 *
* Less than 1 percent
U.S.
All
Buyers
Suburb/
Subdivision
Small
town
Urban/
Central
city
Rural
area
Resort/
Recreation
area
Quality of the neighborhood 59% 66% 56% 60% 41% 42%
Convenient to job 44 48 37 50 34 18
Overall affordability of homes 38 40 39 41 33 28
Convenient to friends/family 35 37 36 35 28 34
Convenient to shoppingFACTORS THAT COULD CAUSE BUYER TO MOVE, BY ADULT COMPOSITION OF HOUSEHOLD 30 19 25 12 26
Quality of the school district 25 31 21 16 22 7
Design of neighborhood 26 29 23 29 15 31
Convenient to entertainment/leisure activities 20 22 14 32 9 36
Convenient to schools 20 22 20 19 13 5
Convenient to parks/recreational facilities 17 18 17 22 10 22
Availability of larger lots or acreage 18 13 16 11 49 6
Convenient to health facilities 11 12 11 10 8 21
Home in a planned community 9 11 6 3 4 29
Convenient to public transportation 5 5 3 11 2 3
Convenient to airport 5 7 4 5 3 12
Other 5 5 5 4 7 12
BUYERS WHO PURCHASED A HOME IN A
BUYERS WHO PURCHASED A HOME IN A
The 2015 National Association of Realtors® Profile of Home Buyers and Selle Chapter 2, Page 13 o

CHARACTERISTICS OF HOMES PURCHASED
Exhibit 2-12
FACTORS INFLUENCING NEIGHBORHOOD CHOICE, BY ADULT COMPOSITION OF HOUSEHOLD AND CHILDREN IN HOUSHOLD
(Percent of Respondents)
Ohio
All
Buyers
Married
couple
Single
female
Single
male
Unmarried
couple Other
Children
under 18
in home
No
children
in home
Quality of the neighborhood 54% 59% 50% 47% 43% 25% 55% 54%
Convenient to job 41 39 40 42 51 25 41 41
Overall affordability of homes 36 31 44 37 46 * 37 35
Convenient to friends/family 43 43 50 37 37 * 36 47
Quality of the school district 26 34 12 11 20 50 46 13
Design of neighborhood 21 24 22 16 9 * 19 23
Convenient to shopping 23 24 21 16 20 25 14 28
Convenient to schools 17 22 6 21 11 25 34 6
Convenient to entertainment/leisure activities 12 12 10 11 17 * 11 13
Convenient to parks/recreational facilities 16 17 12 26 17 25 21 13
Availability of larger lots or acreage 21 26 7 21 23 * 21 21
Convenient to health facilities 9 10 9 16 3 25 4 13
Home in a planned community 5 4 4 * 9 * 2 6
Convenient to public transportation 1 1 2 5 * * 1 2
Convenient to airport 2 2 2 5 * * 1 3
Other 3 4 2 * * 25 2 4
* Less than 1 percent
U.S.
All
Buyers
Married
couple
Single
female
Single
male
Unmarried
couple Other
Children
under 18
in home
No
children
in home
Quality of the neighborhood 59% 61% 56% 51% 59% 64% 62% 58%
Convenient to job 44 44 41 43 53 33 49 41
Overall affordability of homes 38 36 42 42 47 45 39 39
Convenient to friends/family 35 34 43 36 41 30 31 38
Convenient to shoppingFACTORS THAT COULD CAUSE BUYER TO MOVE, BY ADULT COMPOSITION OF HOUSEHOLD 25 25 25 21 29 19 28
Quality of the school district 25 31 8 13 23 25 50 11
Design of neighborhood 26 26 25 22 27 30 25 26
Convenient to entertainment/leisure activities 20 20 19 24 26 12 15 24
Convenient to schools 20 24 12 7 16 26 43 6
Convenient to parks/recreational facilities 17 18 14 17 15 14 21 15
Availability of larger lots or acreage 18 21 10 13 16 10 20 17
Convenient to health facilities 11 11 11 12 7 10 6 14
Home in a planned community 9 10 8 4 4 12 6 10
Convenient to public transportation 5 5 5 5 5 5 4 5
Convenient to airport 5 6 5 5 4 3 4 6
Other 5 5 7 4 4 10 3 6
ADULT COMPOSITION OF HOUSEHOLD
ADULT COMPOSITION OF HOUSEHOLD CHILDREN IN HOME
CHILDREN IN HOME
The 2015 National Association of Realtors® Profile of Home Buyers and Selle Chapter 2, Page 14 o

CHARACTERISTICS OF HOMES PURCHASED
Exhibit 2-13
PRICE OF HOME PURCHASED, BY REGION
(Percentage Distribution)
U.S. Northeast Midwest South West
Less than $75,000 16% 4% 4% 7% 5% 2%
$75,000 to $99,999 17 5 5 10 5 2
$100,000 to $124,999 15 6 10 9 6 3
$125,000 to $149,999 13 10 9 13 11 6
$150,000 to $174,999 11 9 8 12 10 6
$175,000 to $199,999 5 9 9 9 9 8
$200,000 to $249,999 9 15 16 16 15 14
$250,000 to $299,999 7 12 12 10 12 13
$300,000 to $349,999 2 8 7 5 7 11
$350,000 to $399,999 3 5 5 3 6 7
$400,000 to $499,999 1 6 8 3 7 9
$500,000 or more 1 10 8 3 8 19
Median price $127,750 $220,000 $215,900 $170,000 $214,000 $280,000
BUYERS WHO PURCHASED A HOME IN THE
Ohio
The 2015 National Association of Realtors® Profile of Home Buyers and Selle Chapter 2, Page 15 o

CHARACTERISTICS OF HOMES PURCHASED
Exhibit 2-14
PRICE OF HOME PURCHASED, NEW AND PREVIOUSLY OWNED HOMES
(Percentage Distribution)
Ohio
All Buyers New Home Previously Owned Home
Less than $75,000 16% 11% 17%
$75,000 to $99,999 17 5 18
$100,000 to $124,999 15 5 16
$125,000 to $149,999 13 16 13
$150,000 to $174,999 11 5 11
$175,000 to $199,999 5 5 5
$200,000 to $249,999 9 21 8
$250,000 to $299,999 7 26 5
$300,000 to $349,999 2 * 2
$350,000 to $399,999 3 * 3
$400,000 to $499,999 1 5 1
$500,000 or more 1 * 1
Median price $127,750 $200,300 $124,000
* Less than 1 percent
U.S.
All Buyers New Home Previously Owned Home
Less than $75,000 4% 7% 3%
$75,000 to $99,999 5 9 3
$100,000 to $124,999 6 9 5
$125,000 to $149,999 10 15 8
$150,000 to $174,999FACTORS THAT COULD CAUSE BUYER TO MOVE, BY ADULT COMPOSITION OF HOUSEHOLD 12 8
$175,000 to $199,999 9 10 8
$200,000 to $249,999 15 14 16
$250,000 to $299,999 12 8 14
$300,000 to $349,999 8 4 9
$350,000 to $399,999 5 3 7
$400,000 to $499,999 6 4 8
$500,000 or more 10 5 12
Median price $220,000 $277,000 $209,000
BUYERS WHO PURCHASED A
BUYERS WHO PURCHASED A
The 2015 National Association of Realtors® Profile of Home Buyers and Selle Chapter 2, Page 16 o

CHARACTERISTICS OF HOMES PURCHASED
Exhibit 2-15
PRICE OF HOME PURCHASED, FIRST-TIME AND REPEAT BUYERS
(Percentage Distribution)
Ohio
All Buyers First-time Buyers Repeat Buyers
Less than $75,000 16% 28% 8%
$75,000 to $99,999 17 23 12
$100,000 to $124,999 15 22 11
$125,000 to $149,999 13 7 17
$150,000 to $174,999 11 7 13
$175,000 to $199,999 5 3 7
$200,000 to $249,999 9 5 12
$250,000 to $299,999 7 3 10
$300,000 to $349,999 2 1 3
$350,000 to $399,999 3 * 6
$400,000 to $499,999 1 * 2
$500,000 or more 1 2 1
Median price $127,750 $97,500 $152,500
* Less than 1 percent
U.S.All Buyers First-time Buyers Repeat Buyers
Less than $75,000 4% 2% 5%
$75,000 to $99,999 5 1 6
$100,000 to $124,999 6 1 7
$125,000 to $149,999 10 4 11
$150,000 to $174,999 9 8 10
$175,000 to $199,999 9 8 9
$200,000 to $249,999 15 17 15
$250,000 to $299,999FACTORS THAT COULD CAUSE BUYER TO MOVE, BY ADULT COMPOSITION OF HOUSEHOLD 16 11
$300,000 to $349,999 8 12 7
$350,000 to $399,999 5 9 5
$400,000 to $499,999 6 12 5
$500,000 or more 10 10 9
Median price $220,000 $170,000 $246,400
Married couple $242,000 $188,200 $266,800
Single female $169,100 $138,100 $187,000
Single male $160,000 $145,000 $170,300
Unmarried couple $187,400 $151,000 $251,000
Other $202,000 $186,700 $209,400
The 2015 National Association of Realtors® Profile of Home Buyers and Selle Chapter 2, Page 17 o

CHARACTERISTICS OF HOMES PURCHASED
Exhibit 2-16
PURCHASE PRICE COMPARED WITH ASKING PRICE, BY REGION
(Percentage Distribution)
Percent of asking price: U.S. Northeast Midwest South West
Less than 90% 16% 10% 15% 11% 9% 6%
90% to 94% 25 17 20 22 18 12
95% to 99% 36 36 38 38 36 35
100% 18 26 19 22 28 30
101% to 110% 4 9 7 6 8 15
More than 110% 1 1 1 1 1 3
Median (purchase price
as a percent of asking
price)
96% 98% 97% 97% 98% 99%
Ohio
BUYERS WHO PURCHASED A HOME IN THE
The 2015 National Association of Realtors® Profile of Home Buyers and Selle Chapter 2, Page 18 o

CHARACTERISTICS OF HOMES PURCHASED
Exhibit 2-17
(Percentage Distribution)
Ohio
All Buyers
First-time
Buyers
Repeat
Buyers
New
Homes
Previously
Owned
Homes
1,000 sq ft or less 0% * 1% * 0%
1,001 to 1,500 sq ft 19 32 12 22 19
1,501 to 2,000 sq ft 31 36 28 39 30
2,001 to 2,500 sq ft 27 24 28 17 27
2,501 to 3,000 sq ft 12 7 15 6 13
3,001 to 3,500 sq ft 3 * 6 6 3
3,501 sq ft or more 7 2 11 11 7
Median (sq ft) 1,750 1,540 1,880 1,670 1,760
U.S.
All Buyers
First-time
Buyers
Repeat
Buyers
New
Homes
Previously
Owned
Homes
1,000 sq ft or less * 1% * * 1%
1,001 to 1,500 sq ft 13 21 9 3 15
1,501 to 2,000 sq ft 28 37 23 17 30
2,001 to 2,500 sq ft 27 25 28 33 26
2,501 to 3,000 sq ft 15 9 17 22 13
3,001 to 3,500 sq ft 9 5 11 13 9
3,501 sq ft or more 9 3 11 12 8
Median (sq ft) 1,900 1,620 2,020 2,200 1,820
* Less than 1 percent
SIZE OF HOME PURCHASED, FIRST-TIME AND REPEAT BUYERS, AND
BUYERS OF NEW AND PREVIOUSLY OWNED HOMES
BUYERS OF
BUYERS OF
The 2015 National Association of Realtors® Profile of Home Buyers and Selle Chapter 2, Page 19 o

CHARACTERISTICS OF HOMES PURCHASED
Exhibit 2-18
SIZE OF HOME PURCHASED, BY ADULT COMPOSITION OF HOUSEHOLD
(Percentage Distribution)
Ohio
All Buyers
Married
couple
Single
female
Single
male
Unmarried
couple Other
Children
under 18
in home
No
children
in home
1,000 sq ft or less 0% 1% * * * * * 1%
1,001 to 1,500 sq ft 19 9 40 33 24 50 13 23
1,501 to 2,000 sq ft 31 28 35 33 39 * 30 32
2,001 to 2,500 sq ft 27 31 18 33 18 * 26 27
2,501 to 3,000 sq ft 12 16 3 * 15 50 17 9
3,001 to 3,500 sq ft 3 4 3 * 3 * 6 2
3,501 sq ft or more 7 12 * * * * 8 7
Median (sq ft) 1,750 1,950 1,400 1,680 1,640 1,830 1,900 1,700
U.S.
All Buyers
Married
couple
Single
female
Single
male
Unmarried
couple Other
Children
under 18
in home
No
children
in home
1,000 sq ft or less * * 1% * 1% 1% * *
1,001 to 1,500 sq ft 13 9 23 24 18 14 9 16
1,501 to 2,000 sq ft 28 23 38 42 34 22 22 30
2,001 to 2,500 sq ft 27 29 24 19 25 33 25 28
2,501 to 3,000 sq ft 15 17 9 8 13 15 17 14
3,001 to 3,500 sq ft 9 12 3 4 7 11 13 7
3,501 sq ft or more 9 12 2 2 3 4 15 5
Median (sq ft) 1,900 2,050 1,560 1,500 1,700 1,900 2,100 1,800
* Less than 1 percent
ADULT COMPOSITION OF HOUSEHOLD
ADULT COMPOSITION OF HOUSEHOLD CHILDREN IN HOME
CHILDREN IN HOME
The 2015 National Association of Realtors® Profile of Home Buyers and Selle Chapter 2, Page 20 o

CHARACTERISTICS OF HOMES PURCHASED
Exhibit 2-19
HOME SIZE AND PRICE PER SQUARE FOOT, BY REGION
(Median)
U.S. Northeast Midwest South West
All homes purchased
Square feet 1,750 1,900 1,750 1,800 2,010 1,800
Price per square foot $77 $110 $120 $95 $100 $150
Detached single-family home
Square feet 1,800 2,000 1,800 1,900 2,100 1,900
Price per square foot $77 $110 $120 $100 $100 $150
Townhouse or row house
Square feet 1,570 1,660 1,670 1,450 1,870 1,490
Price per square foot $95 $130 $130 $100 $125 $220
Duplex/apartment/condo in 2-4 unit building
Square feet 1,800 1,480 1,570 1,370 1,500 1,480
Price per square foot $88 $120 $120 $80 $115 $320
Apartment/condo in building with 5 or more units
Square feet 1,600 1,400 1,400 1,400 1,640 1,280
Price per square foot $99 $110 $160 $90 $105 $140
BUYERS WHO PURCHASED A HOME IN THE
Ohio
The 2015 National Association of Realtors® Profile of Home Buyers and Selle Chapter 2, Page 21 o

CHARACTERISTICS OF HOMES PURCHASED
Exhibit 2-20
NUMBER OF BEDROOMS AND BATHROOMS, BY FIRST-TIME AND REPEAT BUYERS,
AND BUYERS OF NEW AND PREVIOUSLY OWNED HOMES
(Percentage Distribution)
Ohio
All Buyers
First-time
Buyers
Repeat
Buyers
New
Homes
Previously
Owned
Homes
One bedroom * * * * *
Two bedrooms 13 8 16 32 11
Three bedrooms or more 87 92 84 68 89
Median number of bedrooms 3 3 3 3 3
One full bathroom 29 46 19 11 31
Two full bathrooms 55 48 60 74 54
Three full bathrooms or more 16 7 22 16 16
Median number of full bathrooms 2 2 2 2 2
U.S.
All Buyers
First-time
Buyers
Repeat
Buyers
New
Homes
Previously
Owned
Homes
One bedroom * 1% * * *
Two bedrooms 13 13 13 8 14
Three bedrooms or more 87 87 86 92 86
Median number of bedrooms 3 3 3 3 3
One full bathroom 15 27 9 2 18
Two full bathrooms 63 61 64 62 63
Three full bathrooms or more 22 12 27 36 19
Median number of full bathrooms 2 2 2 2 2
BUYERS OF
BUYERS OF
The 2015 National Association of Realtors® Profile of Home Buyers and Selle Chapter 2, Page 22 o

CHARACTERISTICS OF HOMES PURCHASED
Exhibit 2-21
NUMBER OF BEDROOMS AND BATHROOMS, BY ADULT HOUSEHOLD COMPOSITION AND CHILDREN IN HOUSEHOLD
(Percentage Distribution)
Ohio
All Buyers
Married
couple
Single
female
Single
male
Unmarried
couple Other
Children
under 18
in home
No
children
in home
One bedroom * * * * * * * *
Two bedrooms 13 7 32 16 6 20 2 20
Three bedrooms or more 87 93 68 84 94 80 98 80
Median number of bedrooms 3 3 3 3 3 3 3 3
One full bathroom 29 19 49 26 43 60 30 30
Two full bathrooms 55 57 46 74 51 40 50 57
Three full bathrooms or more 16 24 6 * 6 * 20 13
Median number of full bathrooms 2 2 2 2 2 1 2 2
U.S.
All Buyers
Married
couple
Single
female
Single
male
Unmarried
couple Other
Children
under 18
in home
No
children
in home
One bedroom * * 1% 2% * * * 1%
Two bedrooms 13 8 26 24 17 13 4 18
Three bedrooms or more 87 92 74 75 83 87 96 82
Median number of bedrooms 3 3 3 3 3 3 4 3
One full bathroom 15 10 24 25 26 19 13 17
Two full bathrooms 63 62 66 65 61 58 56 67
Three full bathrooms or more 22 28 10 10 13 23 31 17
Median number of full bathrooms 2 2 2 2 2 2 2 2
* Less than 1 percent
ADULT COMPOSITION OF HOUSEHOLD CHILDREN IN HOME
ADULT COMPOSITION OF HOUSEHOLD CHILDREN IN HOME
The 2015 National Association of Realtors® Profile of Home Buyers and Selle Chapter 2, Page 23 o

CHARACTERISTICS OF HOMES PURCHASED
Exhibit 2-22
YEAR HOME BUILT, BY REGION
(Median)
Ohio U.S. Northeast Midwest South West
2014 4% 15% 7% 8% 22% 14%
2013 through 2010 1 3 1 2 5 3
2009 through 2006 3 8 4 4 10 8
2005 through 2001 8 11 7 10 12 13
2000 through 1986 18 21 17 23 21 21
1985 through 1960 31 25 29 25 23 26
1959 through 1912 30 15 29 23 8 15
1911 or earlier 5 3 7 6 1 1
Median 1969 1991 1972 1980 2000 1992
BUYERS WHO PURCHASED A HOME IN THE
The 2015 National Association of Realtors® Profile of Home Buyers and Selle Chapter 2, Page 24 o

CHARACTERISTICS OF HOMES PURCHASED
Exhibit 2-23
IMPORTANCE OF COMMUTING COSTS
(Percentage Distribution)
Ohio
Very Important 22%
Somewhat Important 41%
Not Important 37%
U.S.
Very Important 30%
Somewhat ImportantFACTORS THAT COULD CAUSE BUYER TO MOVE, BY ADULT COMPOSITION OF HOUSEHOLD
Not Important 32%
Very Important, 22%
Somewhat Important, 41%
Not Important, 37%
IMPORTANCE OF COMMUTING COSTS(Percentage Distribution)
Ohio
Very Important, 30%
Somewhat Important, 0%
Not Important, 32%
IMPORTANCE OF COMMUTING COSTS(Percentage Distribution)
U.S.
The 2015 National Association of Realtors® Profile of Home Buyers and Selle Chapter 2, Page 25 o

CHARACTERISTICS OF HOMES PURCHASED
Exhibit 2-24
IMPORTANCE OF HOME'S ENVIRONMENTALLY FRIENDLY FEATURES
(Percentage Distribution)
Ohio
Very
Important
Somewhat
Important
Not
Important
Heating and cooling costs 36% 51% 13%
Energy efficient appliances 19 44 37
Energy efficient lighting 18 50 33
Landscaping for energy
conservation
8 32 60
Environmentally friendly
community features
5 35 60
Solar panels installed on home 1 5 94
U.S.
Very
Important
Somewhat
Important
Not
Important
Heating and cooling costs 35% 49% 15%
Energy efficient appliances 22 45 33
Energy efficient lighting 22 45 33
Landscaping for energy
conservation
10 37 53
Environmentally friendly
community features
10 34 56
Solar panels installed on home 2 9 89
A26 - How important were the following when you were searching for a home to purchase? - Solar panels installed on your home
Frequency Percent Valid PercentCumulative Percent
Valid Very Important 142 1.7 1.8 1.8
Somewhat Important664 7.9 8.4 10.2
Not Important 7088 83.8 89.8 100
Total 7895 93.4 100
Missing System 559 6.6
Total 8454 100
36%
19%
18%
8%
5%
1%
51%
44%
50%
32%
35%
5%
13%
37%
33%
60%
60%
94%
0% 20% 40% 60% 80% 100%
Heating and cooling costs
Energy efficient appliances
Energy efficient lighting
Landscaping for energyconservation
Environmentally friendly communityfeatures
Solar panels installed on home
IMPORTANCE OF HOME'S ENVIRONMENTALLY FRIENDLY FEATURES
(Percentage Distribution)
Very Important Somewhat Important Not Important
Ohio
35%
22%
22%
10%
10%
2%
49%
45%
45%
37%
34%
9%
15%
33%
33%
53%
56%
89%
0% 20% 40% 60% 80% 100%
Heating and cooling costs
Energy efficient appliances
Energy efficient lighting
Landscaping for energyconservation
Environmentally friendly communityfeatures
Solar panels installed on home
IMPORTANCE OF HOME'S ENVIRONMENTALLY FRIENDLY FEATURES
(Percentage Distribution)
Very Important Somewhat Important Not Important
U.S.
The 2015 National Association of Realtors® Profile of Home Buyers and Selle Chapter 2, Page 26 o

CHARACTERISTICS OF HOMES PURCHASED
Exhibit 2-25
ENVIRONMENTALLY FRIENDLY FEATURES CONSIDERED "VERY IMPORTANT", BY REGION
(Percentage Distribution)
U.S. Northeast Midwest South West
Heating and cooling costs 36% 35% 42% 31% 38% 30%
Energy efficient appliances 19 22 17 18 27 20
Energy efficient lighting 18 22 16 16 26 23
Landscaping for energy
conservation
8 10 6 6 11 14
Environmentally friendly
community features
5 10 8 7 11 12
Solar panels installed on home 1 2 2 1 3 3
BUYERS WHO PURCHASED A HOME IN THE
Ohio
The 2015 National Association of Realtors® Profile of Home Buyers and Selle Chapter 2, Page 27 o

CHARACTERISTICS OF HOMES PURCHASED
Exhibit 2-26
ENVIRONMENTALLY FRIENDLY FEATURES CONSIDERED "VERY IMPORTANT", BY YEAR HOME WAS BUILT
(Percentage Distribution)
U.S. 2014
2013
through
2010
2009
through
2006
2005
through
2001
2000
through
1986
1985
through
1960
1959
through
1911
1911 or
earlier
Heating and cooling costs 36% 35% 50% 44% 37% 31% 30% 33% 32% 36%
Energy efficient appliances 19 22 48 30 27 20 16 15 15 13
Energy efficient lighting 18 22 43 25 25 20 17 16 17 13
Landscaping for energy
conservation
8 10 18 10 13 9 9 9 7 6
Environmentally friendly
community features
5 10 22 10 8 8 8 7 7 7
Solar panels installed on home 1 2 5 3 2 2 2 2 1 2
Ohio
The 2015 National Association of Realtors® Profile of Home Buyers and Selle Chapter 2, Page 28 o

CHARACTERISTICS OF HOMES PURCHASED
Exhibit 2-27
CHARACTERISTICS OF HOME ON WHICH BUYER COMPROMISED, BY LOCATION
(Percent of Respondents)
Ohio
All Buyers
Suburb/
Subdivision
Small
town
Urban/
Central
city Rural
Resort/
Recreation
area
Price of home 14% 16% 14% 12% 14% *
Size of home 14 11 14 15 20 *
Condition of home 19 17 15 27 21 100
Distance from job 11 12 10 9 11 *
Lot size 12 12 13 12 14 *
Style of home 16 22 11 12 14 *
Distance from friends or family 7 5 8 6 11 *
Quality of the neighborhood 4 2 4 12 5 *
Quality of the schools 6 6 8 6 5 *
Distance from school 3 2 5 6 2 *
Other compromises not listed 5 6 5 3 3 *
None - Made no compromises 37 37 38 44 33 *
U.S.
All Buyers
Suburb/
Subdivision
Small
town
Urban/
Central
city Rural
Resort/
Recreation
area
Price of home 20% 20% 17% 25% 18% 20%
Size of home 17 16 20 21 16 17
Condition of home 19 17 19 21 19 17
Lot size 14 15 13 13 12 17
Style of home 13 13 13 14 14 14
Distance from job 13 13 13 11 17 7
Distance from friends or family 6 6 7 4 6 12
Quality of the neighborhood 6 5 4 13 5 4
Quality of the schoolsFACTORS THAT COULD CAUSE BUYER TO MOVE, BY ADULT COMPOSITION OF HOUSEHOLD 5 1 6 3 1
Distance from school 2 2 1 1 2 *
None - Made no compromises 35 35 39 31 39 35
Other compromises not listed 7 8 6 7 8 6
* Less than 1 percent
BUYERS WHO PURCHASED A HOME IN A
BUYERS WHO PURCHASED A HOME IN A
The 2015 National Association of Realtors® Profile of Home Buyers and Selle Chapter 2, Page 29 o

CHARACTERISTICS OF HOMES PURCHASED
Exhibit 2-28
(Percentage of Respondents)
Ohio
All
Buyers
First-time
Buyers
Repeat
Buyers
New
Homes
Previously
Owned
Homes
Price of home 14% 14% 14% 11% 15%
Size of home 14 18 11 22 14
Condition of home 19 19 19 6 20
Distance from job 11 8 12 6 11
Lot size 12 15 11 22 12
Style of home 16 16 17 11 17
Distance from friends or family 7 8 7 * 8
Quality of the neighborhood 4 5 3 * 4
Quality of the schools 6 9 4 * 6
Distance from school 3 3 3 6 3
Other compromises not listed 5 3 6 * 5
None - Made no compromises 37 30 41 56 35
U.S.
All
Buyers
First-time
Buyers
Repeat
Buyers
New
Homes
Previously
Owned
Homes
Price of home 20% 22% 19% 20% 20%
Size of home 17 20 16 16 18
Condition of home 19 19 19 3 22
Lot size 14 16 13 19 13
Style of home 13 15 12 11 14
Distance from job 13 18 11 14 13
Distance from friends or family 6 8 6 6 6
Quality of the neighborhood 6 8 5 7 6
Quality of the schoolsFACTORS THAT COULD CAUSE BUYER TO MOVE, BY ADULT COMPOSITION OF HOUSEHOLD 6 3 4 4
Distance from school 2 2 1 2 1
None - Made no compromises 35 29 39 43 34
Other compromises not listed 7 7 8 6 8
BUYERS OF
BUYERS OF
CHARACTERISTICS OF HOME ON WHICH BUYER COMPROMISED, FIRST-TIME AND
REPEAT BUYERS, AND BUYERS OF NEW AND PREVIOUSLY OWNED HOMES
The 2015 National Association of Realtors® Profile of Home Buyers and Selle Chapter 2, Page 30 o

CHARACTERISTICS OF HOMES PURCHASED
Exhibit 2-29
(Percentage of Respondents)
Ohio
All
Buyers
Married
couple
Single
female
Single
male
Unmarried
couple Other
Children
under 18
in home
No
children
in home
Price of home 14% 15% 15% 16% 6% 25% 17% 13%
Size of home 14 13 12 21 20 * 17 12
Condition of home 19 18 22 16 17 50 25 15
Distance from job 11 10 10 11 14 25 14 9
Lot size 12 14 8 5 14 25 18 9
Style of home 16 16 16 16 14 * 17 15
Distance from friends or family 7 5 8 5 14 25 3 9
Quality of the neighborhood 4 1 8 5 6 50 7 2
Quality of the schools 6 5 3 5 11 50 8 4
Distance from school 3 3 2 5 * 50 6 1
Other compromises not listed 5 5 6 * * * 3 5
None - Made no compromises 37 35 42 32 43 25 27 43
* Less than 1 percent
U.S.
All
Buyers
Married
couple
Single
female
Single
male
Unmarried
couple Other
Children
under 18
in home
No
children
in home
Price of home 20% 20% 20% 19% 21% 18% 21% 19%
Size of home 17 17 16 16 21 13 20 15
Condition of home 19 18 17 21 24 19 21 17
Lot size 14 15 10 12 19 7 17 12
Style of home 13 13 13 9 17 18 16 12
Distance from job 13 14 10 13 17 14 18 10
Distance from friends or familyFACTORS THAT COULD CAUSE BUYER TO MOVE, BY ADULT COMPOSITION OF HOUSEHOLD 6 4 6 11 6 7 6
Quality of the neighborhood 6 6 6 10 8 10 7 6
Quality of the schools 4 5 2 3 5 6 6 3
Distance from school 2 1 2 * 2 7 4 *
None - Made no compromises 35 34 41 41 27 38 29 39
Other compromises not listed 7 8 7 6 6 11 6 8
ADULT COMPOSITION OF HOUSEHOLD
CHARACTERISTICS OF HOME ON WHICH BUYER COMPROMISED, BY ADULT COMPOSITION OF
HOUSEHOLD
ADULT COMPOSITION OF HOUSEHOLD
CHILDREN IN HOME
CHILDREN IN HOME
The 2015 National Association of Realtors® Profile of Home Buyers and Selle Chapter 2, Page 31 o

CHARACTERISTICS OF HOMES PURCHASED
Exhibit 2-30
(Percentage Distribution)
Ohio
All Buyers
First-time
Buyers
Repeat
Buyers
New
Homes
Previously
Owned Homes
1 year or less 3% 2% 3% * 2%
2 to 3 years 1 1 1 * 1
4 to 5 years 6 9 4 11 5
6 to 7 years 3 6 2 * 4
8 to 10 years 9 13 6 5 8
11 to 15 years 8 6 9 5 8
16 or more years 28 27 29 16 29
Don't Know 43 37 46 63 42
Median 15 15 20 15 20
U.S.
All Buyers
First-time
Buyers
Repeat
Buyers
New
Homes
Previously
Owned Homes
1 year or less 2% 1% 2% 2% 2%
2 to 3 years 4 3 4 3 4
4 to 5 years 9 12 7 8 9
6 to 7 years 2 3 2 2 2
8 to 10 years 14 16 14 14 15
11 to 15 years 6 4 6 5 6
16 or more years 26 23 28 27 26
Don't Know 38 38 38 39 37
Median 14 10 15 15 11
EXPECTED LENGTH OF TENURE IN HOME PURCHASED, FIRST-TIME AND REPEAT
BUYERS, AND BUYERS OF NEW AND PREVIOUSLY OWNED HOMES
BUYERS OF
BUYERS OF
The 2015 National Association of Realtors® Profile of Home Buyers and Selle Chapter 2, Page 32 o

CHARACTERISTICS OF HOMES PURCHASED
Exhibit 2-31
EXPECTED LENGTH OF TENURE IN HOME PURCHASED, BY AGE
(Percentage Distribution)
Ohio
All Buyers 18 to 24 25 to 44 45 to 64 65 or older
1 year or less 3% * 1% 2% 4%
2 to 3 years 1 * 1 1 *
4 to 5 years 6 9 9 2 *
6 to 7 years 3 9 5 1 *
8 to 10 years 9 18 8 9 6
11 to 15 years 8 * 8 10 8
16 or more years 28 36 28 35 18
Don't Know 43 27 40 40 63
Median 15 20 15 20 18
* Less than 1 percent
U.S.
All Buyers 18 to 24 25 to 44 45 to 64 65 or older
1 year or less 2% * 1% 2% 3%
2 to 3 years 4 8 3 3 7
4 to 5 years 9 16 11 7 3
6 to 7 years 2 4 3 2 *
8 to 10 years 14 22 17 12 10
11 to 15 years 6 * 6 5 7
16 or more years 26 10 27 31 20
Don't Know 38 40 32 38 49
Median 14 8 10 15 15
* Less than 1 percent
AGE OF HOME BUYER
AGE OF HOME BUYER
The 2015 National Association of Realtors® Profile of Home Buyers and Selle Chapter 2, Page 33 o

CHARACTERISTICS OF HOMES PURCHASED
Exhibit 2-32
FACTORS THAT COULD CAUSE BUYER TO MOVE, BY AGE
(Percent of Respondents)
Ohio
All Buyers 18 to 24 25 to 44 45 to 64 65 or older
Move with life changes (addition to family,
marriage, children move out, retirement, etc.) 39% 86% 38% 42% 35%
Never moving-forever home 31 * 21 36 51
Move with job or career change 15 * 21 14 *
May desire better area/neighborhood 7 * 12 2 *
May outgrow home 3 14 4 1 2
Will flip home * * * * *
Other 5 * 3 4 12
U.S.
All Buyers 18 to 24 25 to 44 45 to 64 65 or older
Move with life changes (addition to family,
marriage, children move out, retirement, etc.) 40% 39% 37% 45% 41%
Never moving-forever home 23 7 15 27 40
Move with job or career change 16 30 24 13 2
May desire better area/neighborhood 8 7 10 7 5
May outgrow home 6 11 10 1 *
Will flip home 1 3 1 2 1
Other 6 2 3 6 11
* Less than 1 percent
The 2015 National Association of Realtors® Profile of Home Buyers and Selle Chapter 2, Page 34 o

CHARACTERISTICS OF HOMES PURCHASED
Exhibit 2-33
FACTORS THAT COULD CAUSE BUYER TO MOVE, BY ADULT COMPOSITION OF HOUSEHOLD
(Percent of Respondents)
Ohio
All Buyers
Married
couple
Single
female
Single
male
Unmarried
couple Other
Children
under 18
in home
No
children
in home
Move with life changes (addition to family,
marriage, children move out, retirement, etc.) 39% 38% 47% 47% 29% * 42% 42%
Never moving-forever home 31 33 32 21 17 60 32 32
Move with job or career change 15 16 6 16 26 20 14 14
May desire better area/neighborhood 7 6 7 5 17 * 4 4
May outgrow home 3 4 2 * 6 * 3 3
Will flip home * * * * * * * *
Other 5 4 6 11 6 20 6 6
U.S.
All Buyers
Married
couple
Single
female
Single
male
Unmarried
couple Other
Children
under 18
in home
No
children
in home
Move with life changes (addition to family,
marriage, children move out, retirement, etc.) 40% 38% 52% 38% 41% 43% 38% 42%
Never moving-forever home 23 25 21 20 15 26 19 26
Move with job or career change 16 18 9 18 14 8 22 13
May desire better area/neighborhood 8 8 8 9 10 6 9 7
May outgrow home 6 6 2 4 13 3 8 4
Will flip home 1 1 1 4 2 1 1 2
Other 6 5 7 7 6 13 3 7
ADULT COMPOSITION OF HOUSEHOLD CHILDREN IN HOME
ADULT COMPOSITION OF HOUSEHOLD CHILDREN IN HOME
The 2015 National Association of Realtors® Profile of Home Buyers and Selle Chapter 2, Page 35 o

THE HOME SEARCH PROCESS
Exhibit 3-1 FIRST STEP TAKEN DURING THE HOME BUYING PROCESS, FIRST-TIME AND REPEAT
BUYERS
Exhibit 3-2 FIRST STEP TAKEN DURING THE HOME BUYING PROCESS, BY AGE
Exhibit 3-3 INFORMATION SOURCES USED IN HOME SEARCH, BY FIRST-TIME AND REPEAT BUYERS,
AND BUYERS OF NEW AND PREVIOUSLY OWNED HOMES
Exhibit 3-4 INFORMATION SOURCES USED IN HOME SEARCH, BY AGE
Exhibit 3-5 FREQUENCY OF USE OF DIFFERENT INFORMATION SOURCES
Exhibit 3-6 USEFULNESS OF INFORMATION SOURCES
Exhibit 3-7 LENGTH OF SEARCH, BY REGION
Exhibit 3-8 LENGTH OF SEARCH FOR BUYERS WHO USED AN AGENT, BY FIRST-TIME AND REPEAT
BUYERS
Exhibit 3-9 WHERE BUYER FOUND THE HOME THEY PURCHASED, 2001-2014
Exhibit 3-10 BUYER INTEREST IN PURCHASING A HOME IN FORECLOSURE, BY FIRST-TIME AND REPEAT
BUYERS, AND BUYERS OF NEW AND PREVIOUSLY OWNED HOMES
Exhibit 3-11 MOST DIFFICULT STEPS OF HOME BUYING PROCESS BY FIRST-TIME AND REPEAT BUYERS
AND BUYERS OF NEW AND PREVIOUSLY OWNED HOMES
Exhibit 3-12 USE OF INTERNET TO SEARCH FOR HOMES, 2003-2015
Exhibit 3-13 ACTIONS TAKEN AS A RESULT OF INTERNET HOME SEARCH, FIRST-TIME AND REPEAT
BUYERS
Exhibit 3-14 CHARACTERISTICS OF HOME SEARCHERS AND SEARCH ACTIVITY, BY USE OF INTERNET
Exhibit 3-15 INFORMATION SOURCES USED IN HOME SEARCH, BY USE OF INTERNET
Exhibit 3-16 WHERE BUYERS FOUND THE HOME THEY PURCHASED, BY USE OF INTERNET
Exhibit 3-17 METHOD OF HOME PURCHASE, BY USE OF INTERNET
Exhibit 3-18 VALUE OF WEB SITE FEATURES
Exhibit 3-20 MOBILE SEARCH BY FIRST-TIME AND REPEAT BUYERS
Exhibit 3-21 SATISFACTION IN BUYING PROCESS
The 2014 National Association of Realtors® Profile of Home Buyers and Selle

THE HOME SEARCH PROCESS
Exhibit 3-1
FIRST STEP TAKEN DURING THE HOME BUYING PROCESS, FIRST-TIME AND REPEAT BUYERS
(Percentage Distribution)
Ohio
All
Buyers
First-time
Buyers
Repeat
Buyers
Looked online for properties for sale 48% 56% 44%
Contacted a real estate agent 8 11 6
Looked online for information about the home buying process 8 11 6
Drove-by homes/neighborhoods 8 * 13
Talked with a friend or relative about home buying process * * *
Contacted a bank or mortgage lender 12 22 6
Visited open houses * * *
Looked in newspapers, magazines, or home buying guides * * *
Contacted builder/visited builder models * * *
Contacted a home seller directly * * *
Attended a home buying seminar * * *
Looked up information about different neightborhoods or areas
(schools, local lifestyle/nightlife, parks, public transpo
4 * 6
Read books or guides about the home buying process * * *
Other 12 * 19
U.S.
All
Buyers
First-time
Buyers
Repeat
Buyers
Looked online for properties for sale 42% 33% 48%
Contacted a real estate agent 14 13 15
Looked online for information about the home buying process 13 23 6
Contacted a bank or mortgage lender 7 11 5
Drove-by homes/neighborhoods 7 3 9
Talked with a friend or relative about home buying process 5 10 2
Visited open houses 3 3 2
Looked up information about different neightborhoods or areas
(schools, local lifestyle/nightlife, parks, public transpo 2 1 3
Contacted builder/visited builder models 2 1 2
Attended a home buying seminar * * *
Contacted a home seller directly * * 1
Looked in newspapers, magazines, or home buying guides * * 1
Read books or guides about the home buying process * * *
Other 6 3 8
* Less than 1 percent
The 2014 National Association of Realtors® Profile of Home Buyers and Selle

THE HOME SEARCH PROCESS
Exhibit 3-2
FIRST STEP TAKEN DURING THE HOME BUYING PROCESS, BY AGE
(Percentage Distribution)
Ohio
18-24 25-44 45-64
65 or
older
Looked online for properties for sale 48% * 60% 40% *
Contacted a real estate agent 8 * 7 20 *
Looked online for information about the home buying process 8 * 13 * *
Drove-by homes/neighborhoods 8 * 7 * *
Talked with a friend or relative about home buying process * * * * *
Contacted a bank or mortgage lender 12 100 7 20 *
Visited open houses * 100 * * *
Looked in newspapers, magazines, or home buying guides * * * * *
Contacted builder/visited builder models * * * * *
Contacted a home seller directly * 25 * * *
Attended a home buying seminar * * * * *
Looked up information about different neightborhoods or areas
(schools, local lifestyle/nightlife, parks, public transpo
4 * * 20 *
Read books or guides about the home buying process * * * * *
Other 12 * 7 * *
U.S.
18 to 24 25 to 44 45 to 64
65 or
older
Looked online for properties for sale 42% 43% 40% 47% 34%
Contacted a real estate agent 14 * 13 15 29
Looked online for information about the home buying process 13 19 17 7 *
Contacted a bank or mortgage lender 7 5 9 6 *
Drove-by homes/neighborhoods 7 5 6 8 7
Talked with a friend or relative about home buying process 5 24 6 1 *
Visited open houses 3 * 2 4 *
Looked up information about different neightborhoods or areas
(schools, local lifestyle/nightlife, parks, public transpo 2 * 3 2 *
Contacted builder/visited builder models 2 * 1 2 9
Attended a home buying seminar * * 1 * *
Contacted a home seller directly * * * 1 *
Looked in newspapers, magazines, or home buying guides * * 1 * *
Read books or guides about the home buying process * * * * *
Other 6 5 2 7 22
* Less than 1 percent
AGE OF HOME BUYER
All Buyers
AGE OF HOME BUYER
All Buyers
The 2014 National Association of Realtors® Profile of Home Buyers and Selle

THE HOME SEARCH PROCESS
Exhibit 3-3
(Percent of Respondents)
Ohio
All Buyers First-time Buyers
Repeat
Buyers
New
Homes
Previously
Owned Homes
Online website 87% 92% 83% 63% 88%
Real estate agent 86 85 87 63 87
Yard sign 63 62 64 53 64
Open house 40 30 46 60 39Mobile or tablet website or
application 54 59 50 40 55
Mobile or tablet search engine 49 55 44 40 50
Online video site 28 26 30 27 28
Print newspaper advertisement 27 26 28 13 28
Home builder 7 5 9 31 6
Home book or magazine 14 12 15 20 13
Billboard 2 3 2 20 1
Television 1 2 * 7 0
Relocation company 3 1 4 7 2
U.S.
All Buyers First-time Buyers
Repeat
Buyers
New
Homes
Previously
Owned Homes
Online website 89% 90% 88% 81% 90%
Real estate agent 87 87 88 76 90
Mobile or tablet website or
application 57 65 53 50 59
Mobile or tablet search engine 54 61 50 49 55
Yard sign 51 49 51 44 51
Open house 48 44 49 56 46
Online video site 29 23 31 33 27
Home builder 20 16 22 68 10
Print newspaper advertisement 20 19 21 23 20
Home book or magazine 13 13 13 19 12
Billboard 6 6 5 16 3
Television 3 5 3 7 3
Relocation company 3 3 4 6 3
BUYERS OF
BUYERS OF
INFORMATION SOURCES USED IN HOME SEARCH, BY FIRST-TIME AND REPEAT BUYERS, AND BUYERS OF
NEW AND PREVIOUSLY OWNED HOMES
The 2014 National Association of Realtors® Profile of Home Buyers and Selle

THE HOME SEARCH PROCESS
Exhibit 3-4
INFORMATION SOURCES USED IN HOME SEARCH, BY AGE
(Percent of Respondents)
Ohio
18 to 24 25 to 44 45 to 64 65 or older
Online website 87% 100% 93% 86% 59%
Real estate agent 86 100 84 89 81
Yard sign 63 46 63 73 51
Open house 27 40 36 42 49
Mobile or tablet website or
application 7 100 68 44 19
Mobile or tablet search engine 14 100 60 39 23
Online video site 2 14 32 25 28
Print newspaper advertisement 1 20 23 34 36
Home builder 7 * 8 3 19
Home book or magazine 14 * 15 15 16
Billboard 2 * 4 1 *
Television 1 * 1 * *
Relocation company 3 * 4 3 *
* Less than 1 percent
U.S.
18 to 24 25 to 44 45 to 64 65 or older
Online website 89% 92% 94% 89% 77%
Real estate agent 87 90 86 89 88
Mobile or tablet website or
application 57 64 71 47 33
Mobile or tablet search engine 54 58 67 44 32
Yard sign 51 37 52 52 43
Open house 48 23 49 49 42
Online video site 29 16 26 31 32
Home builder 20 16 18 21 21
Print newspaper advertisement 20 21 17 23 24
Home book or magazine 13 10 13 14 14
Billboard 6 5 5 5 4
Television 3 2 4 4 2
Relocation company 3 3 4 5 2
All Buyers
AGE OF HOME BUYER
All Buyers
AGE OF HOME BUYER
The 2014 National Association of Realtors® Profile of Home Buyers and Selle

THE HOME SEARCH PROCESS
Exhibit 3-5
FREQUENCY OF USE OF DIFFERENT INFORMATION SOURCES
(Percentage Distribution)
Ohio
Frequently Occasionally
Rarely or
not at all
Online website 75% 12% 13%
Real estate agent 57 29 14
Mobile or tablet website or
application40 14 46
Mobile or tablet search engine 34 15 51
Yard sign 25 39 37
Open house 9 31 61
Online video site 14 14 72
Home builder 3 4 93
Print newspaper advertisement 7 20 73
Home book or magazine 3 11 86
Billboard 0 2 98
Television * 1 99
Relocation company 2 1 97
* Less than 1 percent
U.S.
Frequently Occasionally
Rarely or
not at all
Online website 77% 12% 12%
Real estate agent 68 19 12
Mobile or tablet website or
application 41 16 43
Mobile or tablet search engine 37 17 46
Yard sign 18 33 50
Open house 14 34 53
Online video site 12 17 72
Home builder 8 12 80
Print newspaper advertisement 4 16 80
Home book or magazine 3 10 87
Billboard 2 4 95
Television 1 3 97
Relocation company 1 2 96
75
57
40
34
25
9
14
3
7
3
0
0
2
12
29
14
15
39
31
14
4
20
11
2
1
1
13
14
46
51
37
61
72
93
73
86
98
99
97
0% 20% 40% 60% 80% 100%
Online website
Real estate agent
Mobile or tablet website or…
Mobile or tablet search engine
Yard sign
Open house
Online video site
Home builder
Print newspaper advertisement
Home book or magazine
Billboard
Television
Relocation company
FREQUENCY OF USE OF DIFFERENT INFORMATION SOURCES(Percentage Distribution)
Frequently Occasionally Rarely or not at all
Ohio
77
68
41
37
18
14
12
8
4
3
2
1
1
12
19
16
17
33
34
17
12
16
10
4
3
2
12
12
43
46
50
53
72
80
80
87
95
97
96
0% 20% 40% 60% 80% 100%
Online website
Real estate agent
Mobile or tablet website orapplication
Mobile or tablet search engine
Yard sign
Open house
Online video site
Home builder
Print newspaper advertisement
Home book or magazine
Billboard
Television
Relocation company
FREQUENCY OF USE OF DIFFERENT INFORMATION SOURCES(Percentage Distribution)
Frequently Occasionally Rarely or not at all
U.S.
The 2014 National Association of Realtors® Profile of Home Buyers and Selle

THE HOME SEARCH PROCESS
Exhibit 3-6
USEFULNESS OF INFORMATION SOURCES
(Percentage Distribution Among Buyers that Used Each Source)
Ohio
Very
Useful
Somewhat
Useful
Not
Useful
Online website 82% 16% 2%
Real estate agent 75 22 3
Mobile or tablet website or
application 72 26 2
Mobile or tablet search engine71 28 2
Home builder 47 37 16
Online video site 46 49 5
Open house 39 51 10
Yard sign 39 58 3
Relocation company 33 50 17
Billboard * 100 *
Print newspaper advertisement31 60 9
Television * 100 *
Home book or magazine 21 67 12
U.S.
Very
Useful
Somewhat
Useful
Not
Useful
Online website 82% 16% 2%
Real estate agent 78 19 3
Mobile or tablet website or
application72 27 2
Mobile or tablet search engine 67 31 3
Home builder 43 46 11
Online video site 44 49 7
Open house 38 54 8
Yard sign 35 57 8
Relocation company 33 53 14
Billboard 25 63 13
Print newspaper advertisement 18 63 19
Television 14 65 20
Home book or magazine 17 62 21
82
75
72
71
47
46
39
39
33
0
31
0
21
16
22
26
28
37
49
51
58
50
100
60
100
67
2
3
2
2
16
5
10
3
17
0
9
0
12
0% 20% 40% 60% 80% 100%
Online website
Real estate agent
Mobile or tablet website or…
Mobile or tablet search engine
Home builder
Online video site
Open house
Yard sign
Relocation company
Billboard
Print newspaper advertisement
Television
Home book or magazine
USEFULNESS OF INFORMATION SOURCES(Percentage Distribution Among Buyers that Used Each Source)
Very Useful Somewhat Useful Not Useful
Ohio
82
78
72
67
43
44
38
35
33
25
18
14
17
16
19
27
31
46
49
54
57
53
63
63
65
62
2
3
2
3
11
7
8
8
14
13
19
20
21
0% 20% 40% 60% 80% 100%
Online website
Real estate agent
Mobile or tablet website or…
Mobile or tablet search engine
Home builder
Online video site
Open house
Yard sign
Relocation company
Billboard
Print newspaper advertisement
Television
Home book or magazine
USEFULNESS OF INFORMATION SOURCES(Percentage Distribution Among Buyers that Used Each Source)
Very Useful Somewhat Useful Not Useful
U.S.
The 2014 National Association of Realtors® Profile of Home Buyers and Selle

THE HOME SEARCH PROCESS
Exhibit 3-7
LENGTH OF SEARCH, BY REGION(Median)
Number of Weeks Searched Northeast Midwest South West
2001 7 7 7 7 7
2003 8 10 8 8 6
2004 8 12 8 8 8
2005 8 10 8 8 6
2006 8 12 8 8 8
2007 8 12 8 8 8
2008 10 12 10 8 10
2009 12 12 10 10 12
2010 12 14 10 10 12
2011 12 12 10 10 12
2012 12 12 12 10 12
2013 12 12 10 10 12
2014 10 12 10 10 10
2015 10 10 12 10 10 10
Number of homes viewed 8 10 10 10 10 10
BUYERS WHO PURCHASED A HOME IN THE
U.S.Ohio
The 2014 National Association of Realtors® Profile of Home Buyers and Selle

THE HOME SEARCH PROCESS
Exhibit 3-8
LENGTH OF SEARCH FOR BUYERS WHO USED AN AGENT, BY FIRST-TIME AND REPEAT BUYERS
(Median Weeks)
Ohio
All
Buyers
Buyers who
Used an Agent
First-time
Buyers
Repeat
Buyers
Total number of weeks searched 10 10 11 10
Number of weeks searched before
contacting agent
3 3 3 2
U.S.
All
Buyers
Buyers who
Used an Agent
First-time
Buyers
Repeat
Buyers
Total number of weeks searched 10 10 12 10
Number of weeks searched before
contacting agent
N/A 2 3 2
NA=Not applicable
10 10
11
10
3 3
2
0
2
4
6
8
10
12
All Buyers Buyers who Used anAgent
First-time Buyers Repeat Buyers
LENGTH OF SEARCH FOR BUYERS WHO USED AN AGENT, BY AGE AND BY FIRST-TIME AND REPEAT BUYERS
(Median)
Total number of weeks searched Number of weeks searched before contacting agent
Ohio
10 10
12
10
23
2
0
2
4
6
8
10
12
14
All Buyers Buyers who Used anAgent
First-time Buyers Repeat Buyers
LENGTH OF SEARCH FOR BUYERS WHO USED AN AGENT, BY AGE AND BY FIRST-TIME AND REPEAT BUYERS
(Median)
Total number of weeks searched Number of weeks searched before contacting agent
U.S.
The 2014 National Association of Realtors® Profile of Home Buyers and Selle

THE HOME SEARCH PROCESS
Exhibit 3-9
WHERE BUYER FOUND THE HOME THEY PURCHASED, 2001-2014
(Percentage Distribution)
Ohio
2014
Real estate agent 23%
Internet 48
Yard sign/open house sign 14
Friend, relative or neighbor 10
Home builder or their agent 2
Print newspaper advertisement 1
Directly from sellers/Knew the sellers 3
Home book or magazine 1
Other *
U.S.
2001 2003 2004 2005 2006 2007 2008 2009 2010 2011 2012 2013 2014 2015
Internet 8% 11% 15% 24% 24% 29% 32% 36% 37% 40% 42% 43% 43% 44%
Real estate agent 48 41 38 36 36 34 34 36 38 35 34 33 33 33
Yard sign/open house sign 15 16 16 15 15 14 15 12 11 11 10 9 9 9
Friend, relative or neighbor 8 7 7 7 8 8 7 6 6 6 6 6 6 6
Home builder or their agent 3 7 7 7 8 8 7 5 4 5 5 5 5 6
Directly from sellers/Knew the sellers 4 4 5 3 3 3 2 2 2 2 2 2 3 2
Print newspaper advertisement 7 7 5 5 5 3 3 2 2 2 1 1 1 1
Home book or magazine 2 1 2 1 1 1 1 * * * * * * *
Other 5 6 4 -- -- -- -- -- -- -- -- 1 -- --
* Less than 1 percent
8%11%
15%
24% 24%29%
32%36% 37%
40% 42% 43% 43% 44%
48 4138
36 36
34
34
3638
3534
33 33 33
15
1616
15 15
14
15
1211 11 10 9 9 9
8
77
7 88
76
6 6 6 6 6 6
37
7
7 88
75
4 5 5 5 56
4 45
3 33 2 2 2 2 2 2 3
2
7 75
5 5 3 3 2 2 2 1 1 1
2 12
1 1 1 1 0 * * * * *5 6 4
0 0 0 0 0 0 1 0
0%
10%
20%
30%
40%
50%
60%
70%
80%
90%
100%
2001 2003 2004 2005 2006 2007 2008 2009 2010 2011 2012 2013 2014 2015
Internet Real estate agent Yard sign/open house sign Friend, relative or neighbor Home builder or their agent
Directly from sellers/Knew the sellers Print newspaper advertisement Home book or magazine Other
The 2014 National Association of Realtors® Profile of Home Buyers and Selle

THE HOME SEARCH PROCESS
Exhibit 3-10
(Percent of Respondents)
Ohio
All Buyers
First-time
Buyers
Repeat
Buyers
New
Homes
Previously
Owned Homes
Did not consider purchasing a home in foreclosure 58% 46% 65% 84% 56%
Considered purchasing a home in foreclosure, but did not:
Could not find the right home 23 28 21 11 24
The process was too difficult or complex 9 13 6 5 9
The home was in poor condition 11 16 8 11 11
The home price was too high 3 3 3 * 3
The neighborhood was undesirable 3 6 1 5 3
Financing options were not attractive 2 3 1 * 2
U.S.
All Buyers
First-time
Buyers
Repeat
Buyers
New
Homes
Previously
Owned Homes
Did not consider purchasing a home in foreclosure 59% 48% 64% 76% 55%
Considered purchasing a home in foreclosure, but did not:
Could not find the right home 23 28 21 14 25
The process was too difficult or complex 11 15 9 6 12
The home was in poor condition 10 15 7 5 11
The home price was too high 4 6 3 4 4
The neighborhood was undesirable 4 6 3 3 4
Financing options were not attractive 3 6 2 2 3
N/A- Not Applicable
BUYERS OF
BUYERS OF
BUYER INTEREST IN PURCHASING A HOME IN FORECLOSURE, BY FIRST-TIME AND REPEAT BUYERS, AND BUYERS
OF NEW AND PREVIOUSLY OWNED HOMES
The 2014 National Association of Realtors® Profile of Home Buyers and Selle

THE HOME SEARCH PROCESS
Exhibit 3-11
MOST DIFFICULT STEPS OF HOME BUYING PROCESS BY FIRST-TIME AND REPEAT BUYERS
AND BUYERS OF NEW AND PREVIOUSLY OWNED HOMES
(Percentage Distribution)
Ohio
All Buyers First-time Buyers Repeat Buyers
New
Homes
Previously
Owned Homes
Finding the right property 50% 53% 47% 21% 52%
Paperwork 23 29 19 21 23
Understanding the process and steps 17 33 7 21 17
No difficult steps 20 12 25 37 18
Getting a mortgage 13 17 10 16 12
Saving for the down payment 8 14 4 16 7
Appraisal of the property 4 5 3 5 4
Other 5 2 7 11 5
U.S.
All Buyers First-time Buyers Repeat Buyers
New
Homes
Previously
Owned Homes
Finding the right property 51% 51% 51% 43% 53%
Paperwork 23 29 20 21 24
Understanding the process and steps 14 30 6 12 14
Getting a mortgage 13 17 11 13 13
Saving for the down payment 13 25 7 12 13
Appraisal of the property 5 7 4 2 6
No difficult steps 17 9 21 21 16
Other 6 5 6 6 6
BUYERS OF
BUYERS OF
The 2014 National Association of Realtors® Profile of Home Buyers and Selle

THE HOME SEARCH PROCESS
Exhibit 3-12
USE OF INTERNET TO SEARCH FOR HOMES, 2003-2015
Frequently Occasionally
42% 29%
53% 24%
57% 22%
59% 21%
66% 18%
69% 18%
76% 13% 87%
74% 15%
75% 13%
79% 11%
2013 81% 11%
2014 80% 12%
2015 82% 10%
Ohio 75% 12%
2007
2012
2008
2011
2010
2009
U.S.
2003
2004
2005
2005
42%
53%57% 59%
66% 69%76% 74% 75%
79% 81% 80% 82%75%
29%
24%22% 21%
18%18%
13% 15% 13%11%
11% 12% 10%
12%
0%
10%
20%
30%
40%
50%
60%
70%
80%
90%
100%
2003 2004 2005 2005 2007 2008 2009 2010 2011 2012 2013 2014 2015 Ohio
USE OF INTERNET TO SEARCH FOR HOMES
Frequently Occasionally
The 2014 National Association of Realtors® Profile of Home Buyers and Selle

THE HOME SEARCH PROCESS
Exhibit 3-13
ACTIONS TAKEN AS A RESULT OF INTERNET HOME SEARCH, FIRST-TIME AND REPEAT BUYERS
(Percent of Respondents Among Buyers Who Used the Internet)
Ohio
All
Buyers
First-time
Buyers
Repeat
Buyers
Drove by or viewed home 10% 11% 8%
Walked through home viewed online 68 65 71
Found the agent used to search for or buy home 34 37 32
Requested more information 33 39 29
Looked for more information on how to get a mortgage and general home buyers tips16 32 5
Pre-qualified for a mortgage online 11 11 10
Contacted builder/developer 13 17 11
Applied for a mortgage online 9 9 9
Found a mortgage lender online 41 44 39
U.S.
All
Buyers
First-time
Buyers
Repeat
Buyers
Walked through home viewed online 65% 61% 67%Saw exterior of homes/neighborhood, but did not
walk through home 38 39 37
Found the agent used to search for or buy home 33 35 32
Requested more information 27 32 25Looked for more information on how to get a
mortgage and general home buyers tips 14 27 7
Pre-qualified for a mortgage online 13 14 12
Contacted builder/developer 17 18 17
Applied for a mortgage online 10 12 9
Found a mortgage lender online 8 13 6
The 2014 National Association of Realtors® Profile of Home Buyers and Selle

THE HOME SEARCH PROCESS
Exhibit 3-14
(Percentage Distribution)
Ohio
Household Compostion
Used Internet to
Search
Did Not Use Internet
to Search
Married couple 60% 51%
Single female 22 27
Single male 5 11
Unmarried couple 12 8
Other 1 3
Median age (years) #N/A #N/A
Median income (2013) $69,600 $69,600
Length of Search (Median weeks)
All buyers #N/A #N/A
First-time buyers #N/A #N/A
Repeat buyers #N/A #N/A
Number of Homes Visited (median) #N/A #N/A
* Less than 1 percent
U.S.
Household Compostion
Used Internet to
Search
Did Not Use Internet
to Search
Married couple 68% 55%
Single female 14 21
Single male 8 15
Unmarried couple 7 5
Other 2 4
Median age (years) 42 65
Median income (2012) $88,600 $64,400
Length of Search (Median weeks) 10 5
All buyers 10 5
First-time buyers 12 6
Repeat buyers 10 4
Buyers using an agent 10 *
Before contacting agent 3 *
Number of Homes Visited (median) 10 5
* Less than 1 percent
CHARACTERISTICS OF HOME SEARCHERS AND SEARCH ACTIVITY, BY
USE OF INTERNET
The 2014 National Association of Realtors® Profile of Home Buyers and Selle

THE HOME SEARCH PROCESS
Exhibit 3-15
INFORMATION SOURCES USED IN HOME SEARCH, BY USE OF INTERNET
(Percent of Respondents)
Ohio
Used
Internet to
Search
Did Not Use
Internet to
Search
Online website 93% 16%
Real estate agent 88 66
Yard sign 66 40
Mobile or tablet website or
application 58 8
Open house 42 19
Mobile or tablet search engine 54 *
Online video site 31 *
Print newspaper advertisement 28 19
Home builder 7 8
Home book or magazine 14 12
Billboard 2 *
Television 1 *
Relocation company 3 *
* Less than 1 percent
U.S.
Used
Internet to
Search
Did Not Use
Internet to
Search
Online website 94% N/A
Real estate agent 89 73
Mobile or tablet website or
application 61 N/A
Mobile or tablet search engine 58 N/A
Yard sign 51 38
Open house 48 38
Online video site 30 N/A
Print newspaper advertisement 20 22
Home builder 19 27
Home book or magazine 13 10
Billboard 5 8
Television 3 5
Relocation company 4 3
N/A Not Applicable
The 2014 National Association of Realtors® Profile of Home Buyers and Selle

THE HOME SEARCH PROCESS
Exhibit 3-16
WHERE BUYERS FOUND THE HOME THEY PURCHASED, BY USE OF INTERNET
(Percentage Distribution)
Ohio
Used Internet to
Search
Did Not Use
Internet to Search
Internet 53% 8%
Real estate agent 22 31
Yard sign/open house sign 13 17
Home builder or their agent 1 8
Friend, relative or neighbor 7 25
Print newspaper advertisement 1 *
Directly from sellers/Knew the sellers 2 8
Home book or magazine 1 3
* Less than 1 percent
U.S.
Used Internet to
Search
Did Not Use
Internet to Search
Internet 47% N/A
Real estate agent 32 41
Yard sign/open house sign 8 15
Home builder or their agent 5 13
Friend, relative or neighbor 5 15
Directly from sellers/Knew the sellers 1 5
Print newspaper advertisement 1 4
Billboard 1 1
* Less than 1 percent
47%
32
8
5 5
1 1 10%
41
1513
15
5 4
1
0%
5%
10%
15%
20%
25%
30%
35%
40%
45%
50%
Internet Real estateagent
Yard sign/openhouse sign
Home builderor their agent
Friend, relativeor neighbor
Directly fromsellers/Knew
the sellers
Printnewspaper
advertisement
Billboard
Used Internet to Search Did Not Use Internet to Search
The 2014 National Association of Realtors® Profile of Home Buyers and Selle

THE HOME SEARCH PROCESS
Exhibit 3-17
METHOD OF HOME PURCHASE, BY USE OF INTERNET
(Percentage Distribution)
Ohio
Used Internet
to Search
Did Not Use Internet
to Search
Through a real estate agent/broker 89% 64%
Directly from builder or builder's agent 2 6
Directly from previous owner whom buyer didn't know 4 6
Directly from previous owner whom buyer knew 4 17
Other 1 8
* Less than 1 percent
U.S.
Used Internet
to Search
Did Not Use Internet
to Search
Through a real estate agent/broker 88% 71%
Directly from builder or builder's agent 7 16
Directly from previous owner whom buyer didn't know 2 4
Directly from previous owner whom buyer knew 2 8
Other 1 1
88%
72 2 1
71%
16
48
10%
10%
20%
30%
40%
50%
60%
70%
80%
90%
100%
Through a real estateagent/broker
Directly from builder orbuilder's agent
Directly from previous ownerwhom buyer didn't know
Directly from previous ownerwhom buyer knew
Other
Used Internet to Search Did Not Use Internet to Search
The 2014 National Association of Realtors® Profile of Home Buyers and Selle

THE HOME SEARCH PROCESS
Exhibit 3-18
VALUE OF WEB SITE FEATURES
(Percentage Distribution Among Buyers Who Used the Internet)
Ohio
Very
Useful
Somewhat
Useful
Not
Useful
Did not
use/Not
Available
Photos 86% 11% 2% 1%
Detailed information about properties for sale 78 20 1 1
Virtual tours 41 33 10 16
Interactive maps 42 40 9 8
Real estate agent contact information 34 40 15 12
Neighborhood information 35 47 12 7
Detailed information about recently sold properties 23 46 17 15
Pending sales/contract status 23 39 20 18
Information about upcoming open houses 19 42 19 19
Videos 23 32 19 27
Real estate news or articles 7 29 25 40
* Less than 1 percent
U.S.
Very
Useful
Somewhat
Useful
Not
Useful
Did not
use/Not
Available
Real estate news or articles 8 24 28 39
Videos 22 33 20 26
Information about upcoming open houses 24 34 20 22
Pending sales/contract status 33 37 16 14
Detailed information about recently sold properties 37 41 13 9
Neighborhood information 40 42 9 9
Virtual tours 42 35 10 12
Real estate agent contact information 42 32 14 12
Interactive maps 45 33 11 11
Detailed information about properties for sale 84 15 * 1
Photos 87% 11% 1% 1%
8
22
24
33
37
40
42
42
45
84
87%
24
33
34
37
41
42
35
32
33
15
11%
28
20
20
16
13
9
10
14
11
0
1%
39
26
22
14
9
9
12
12
11
1
1%
0% 10% 20% 30% 40% 50% 60% 70% 80% 90% 100%
Real estate news or articles
Videos
Information about upcoming open houses
Pending sales/contract status
Detailed information about recently sold properties
Neighborhood information
Virtual tours
Real estate agent contact information
Interactive maps
Detailed information about properties for sale
Photos
Very Useful Somewhat Useful Not Useful Did not use/Not Available
The 2014 National Association of Realtors® Profile of Home Buyers and Selle

THE HOME SEARCH PROCESS
Exhibit 3-20
MOBILE SEARCH BY FIRST-TIME AND REPEAT BUYERS
(Percent of Respondents Among those Who Used Mobile Search)
All Buyers
First-time
Buyers
Repeat
Buyers
Found my home with a mobile
application 74 75 73Found my agent with a mobile
application 7 7 6Did not search for homes on
mobile device 23 22 23
All Buyers
First-time
Buyers
Repeat
Buyers
Found my home with a mobile
application 74% 75% 73%Found my agent with a mobile
application 7% 7% 6%
0%
10%
20%
30%
40%
50%
60%
70%
80%
All Buyers First-time Buyers Repeat Buyers
74% 75% 73%
7% 7% 6%
Found my home with a mobile application Found my agent with a mobile application
The 2014 National Association of Realtors® Profile of Home Buyers and Selle

THE HOME SEARCH PROCESS
Exhibit 3-21
SATISFACTION IN BUYING PROCESS
(Percentage Distribution)
OhioVery Satisfied 59%
Somewhat Satisfied 33
Somewhat Dissatisfied 5
Very Dissatisfied 3
U.S.Very Satisfied 59%
Somewhat Satisfied 32
Somewhat Dissatisfied 7
Very Dissatisfied 3
Very Satisfied58%Somewhat
Satisfied32%
Somewhat Dissatisfied
7%
Very Dissatisfied
3%
SATISFACTION IN BUYING PROCESS
Very Satisfied59%
Somewhat Satisfied
33%
Somewhat Dissatisfied
5%
Very Dissatisfied
3%
SATISFACTION IN BUYING PROCESS
The 2014 National Association of Realtors® Profile of Home Buyers and Selle

HOME BUYING AND REAL ESTATE PROFESSIONALS
Exhibit 4-1 METHOD OF HOME PURCHASE, 2001-2015
Exhibit 4-2 METHOD OF HOME PURCHASE, BY REGION
Exhibit 4-3 METHOD OF HOME PURCHASE, NEW AND PREVIOUSLY OWNED HOMES
Exhibit 4-4 METHOD OF HOME PURCHASE, BY ADULT COMPOSITION OF HOUSEHOLD
Exhibit 4-5 AGENT REPRESENTATION DISCLOSURE, FIRST-TIME AND REPEAT BUYERS
Exhibit 4-6 BUYER REPRESENTATIVE ARRANGEMENT WITH AGENT, FIRST-TIME AND REPEAT BUYERS
Exhibit 4-7 HOW REAL ESTATE AGENT WAS COMPENSATED
Exhibit 4-8 WHAT BUYERS WANT MOST FROM REAL ESTATE AGENTS
Exhibit 4-9 WHAT BUYERS WANT MOST FROM REAL ESTATE AGENTS, FIRST-TIME AND REPEAT BUYERS,
AND BUYERS OF NEW AND PREVIOUSLY OWNED HOMES
Exhibit 4-10 WHAT BUYERS WANT MOST FROM REAL ESTATE AGENTS, BY ADULT COMPOSITION OF
HOUSEHOLDExhibit 4-11 BENEFITS PROVIDED BY REAL ESTATE AGENT DURING HOME PURCHASE PROCESS, FIRST-
TIME AND REPEAT BUYERS
Exhibit 4-12 HOW BUYER FOUND REAL ESTATE AGENT, FIRST-TIME AND REPEAT BUYERS
Exhibit 4-13 HOW BUYER FOUND REAL ESTATE AGENT, BY ADULT COMPOSITION OF HOUSEHOLD
Exhibit 4-14 HOW MANY TIMES CONTACTED AGENT BEFORE RECEIVED RESPONSE AND ORIGINAL FORM
OF CONTACT
Exhibit 4-15 NUMBER OF REAL ESTATE AGENTS INTERVIEWED BY FIRST-TIME AND REPEAT BUYERS
Exhibit 4-16 MOST IMPORTANT FACTORS WHEN CHOOSING AN AGENT
Exhibit 4-17 IMPORTANCE OF REAL ESTATE AGENT SKILLS AND QUALITIES
Exhibit 4-18 AGENT SKILLS AND QUALITIES CONSIDERED 'VERY IMPORTANT' BY FIRST-TIME AND REPEAT
BUYERS, AND BUYERS OF NEW AND PREVIOUSLY OWNED HOMES
Exhibit 4-19 AGENT SKILLS AND QUALITIES CONSIDERED 'VERY IMPORTANT' BY ADULT COMPOSITION OF
HOUSEHOLD
Exhibit 4-20 IMPORTANCE OF AGENT COMMUNICATIONS
Exhibit 4-21 SATISFACTION WITH REAL ESTATE AGENT SKILLS AND QUALITIES
Exhibit 4-22 WOULD BUYER USE REAL ESTATE AGENT AGAIN OR RECOMMEND TO OTHERS
Exhibit 4-24 HOW MANY TIMES BUYER RECOMMENDED TYPICAL AGENT
The 2014 National Association of Realtors® Profile of Home Buyers and Selle Chapter 4, Page 1 o

HOME BUYING AND REAL ESTATE PROFESSIONALS
Exhibit 4-1
METHOD OF HOME PURCHASE, 2001-2015
(Percentage Distribution)
Ohio
2015
Through a real estate agent or broker 86%
Directly from builder or builder's agent 2
Directly from the previous owner 10
U.S.
2001 2003 2004 2005 2006 2007 2008 2009 2010 2011 2012 2013 2014 2015
Through a real estate agent or broker 69% 75% 77% 77% 77% 79% 81% 77% 83% 89% 89% 88% 88% 87%
Directly from builder or builder's agent 15 14 12 12 13 12 10 8 6 7 6 7 7 8
Directly from the previous owner 15 9 9 9 9 7 6 5 5 4 5 5 5 5
69%
75%77% 77% 77%
79% 81%77%
83%
89% 89% 88% 88% 87%
15 1412 12 13 12
108 6 7 6 7 7 8
15
9 9 9 9 7 6 5 5 4 5 5 5 5
0%
10%
20%
30%
40%
50%
60%
70%
80%
90%
100%
2001 2003 2004 2005 2006 2007 2008 2009 2010 2011 2012 2013 2014 2015
Through a real estate agent or broker Directly from builder or builder's agent Directly from the previous owner
The 2014 National Association of Realtors® Profile of Home Buyers and Selle Chapter 4, Page 2 o

HOME BUYING AND REAL ESTATE PROFESSIONALS
Exhibit 4-2
METHOD OF HOME PURCHASE, BY REGION
(Percentage Distribution)
Ohio U.S. Northeast Midwest South West
Through a real estate agent or broker 86% 87% 90% 87% 84% 90%
Directly from builder or builder's agent 2 8 3 4 11 7
Directly from the previous owner 10 5 7 8 4 3
Knew previous owner 6 3 4 4 2 2
Did not know previous owner 4 2 3 4 2 1
BUYERS WHO PURCHASED A HOME IN THE
The 2014 National Association of Realtors® Profile of Home Buyers and Selle Chapter 4, Page 3 o

HOME BUYING AND REAL ESTATE PROFESSIONALS
Exhibit 4-3
METHOD OF HOME PURCHASE, NEW AND PREVIOUSLY OWNED HOMES
(Percentage Distribution)
Ohio
All Buyers New Homes
Previously
Owned Homes
Through a real estate agent or broker 86% 58% 88%
Directly from builder or builder's agent 2 32 *
Directly from the previous owner 10 10 10
Knew previous owner 6 5 6
Did not know previous owner 4 5 4
*Less than 1 percent
U.S.
All Buyers New Homes
Previously
Owned Homes
Through a real estate agent or broker 87% 54% 93%
Directly from builder or builder's agent 8 44 *
Directly from the previous owner 5 2 6
Knew previous owner 3 1 3
Did not know previous owner 2 * 3
NA- Not Applicable
BUYERS OF
BUYERS OF
The 2014 National Association of Realtors® Profile of Home Buyers and Selle Chapter 4, Page 4 o

HOME BUYING AND REAL ESTATE PROFESSIONALS
Exhibit 4-4
METHOD OF HOME PURCHASE, BY ADULT COMPOSITION OF HOUSEHOLD
(Percentage Distribution)
Ohio
All Buyers
Married
couple
Single
female
Single
male
Unmarried
couple Other
Through a real estate agent or broker 86% 88% 84% 84% 83% 100%
Directly from builder or builder's agent 2 3 * 5 * *
Directly from the previous owner 10 7 16 5 14 *
Knew previous owner 6 4 12 5 3 *
Did not know previous owner 4 3 5 * 11 *
*Less than 1 percent
U.S.
All
Buyers
Married
couple
Single
female
Single
male
Unmarried
couple Other
Through a real estate agent or broker 87% 85% 90% 89% 88% 84%
Directly from builder or builder's agent 8 9 5 4 6 8
Directly from the previous owner 5 5 5 7 6 3
Knew previous owner 3 3 2 4 2 2
Did not know previous owner 2 2 3 2 4 2
ADULT COMPOSITION OF HOUSEHOLD
ADULT COMPOSITION OF HOUSEHOLD
The 2014 National Association of Realtors® Profile of Home Buyers and Selle Chapter 4, Page 5 o

HOME BUYING AND REAL ESTATE PROFESSIONALS
Exhibit 4-5
AGENT REPRESENTATION DISCLOSURE, FIRST-TIME AND REPEAT BUYERS
(Percentage Distribution)
Ohio
Disclosure Statement Signed? All Buyers First-time Buyers Repeat Buyers
Yes, at first meeting 32% 28% 35%
Yes, when contract was written 25 24 25
Yes, at some other time 12 11 12
No 16 18 15
Don’t know 15 19 13
U.S.
Disclosure Statement Signed? All Buyers First-time Buyers Repeat Buyers
Yes, at first meeting 27% 22% 29%
Yes, when contract was written 22 19 24
Yes, at some other time 12 12 12
No 22 27 19
Don’t know 18 20 16
The 2014 National Association of Realtors® Profile of Home Buyers and Selle Chapter 4, Page 6 o

HOME BUYING AND REAL ESTATE PROFESSIONALS
Exhibit 4-6
BUYER REPRESENTATIVE ARRANGEMENT WITH AGENT, FIRST-TIME AND REPEAT BUYERS
(Percentage Distribution)
Ohio
All Buyers First-time Buyers Repeat Buyers
Yes, a written arrangement 39% 36% 41%
Yes, an oral arrangement 11 11 10
No 37 36 38
Don’t know 13 17 10
U.S.
All Buyers First-time Buyers Repeat Buyers
Yes, a written arrangement 40% 37% 42%
Yes, an oral arrangement 18 20 18
No 29 26 31
Don't know 13 18 10
The 2014 National Association of Realtors® Profile of Home Buyers and Selle Chapter 4, Page 7 o

HOME BUYING AND REAL ESTATE PROFESSIONALS
Exhibit 4-7
HOW REAL ESTATE AGENT WAS COMPENSATED
(Percentage Distribution)
Ohio
All Types of
Representation Buyer Only
Seller or
Seller and Buyer
Paid by seller 60% 60% 60%
Paid by buyer and seller 9 11 7
Paid by buyer only 21 22 21
Other 1 1 2
Don't know 9 6 12
U.S.
All Types of
Representation Buyer Only
Seller or
Seller and Buyer
Paid by seller 56% 59% 53%
Paid by buyer and seller 12 12 12
Paid by buyer only 21 22 21
Percent of sales price 18 18 17
Flat fee 2 2 2
Other * * *
Don't know 2 2 3
Other 2 1 2
Don’t know 9 6 12
*Less than 1 percent
TYPE OF AGENT REPRESENTATION
TYPE OF AGENT REPRESENTATION
The 2014 National Association of Realtors® Profile of Home Buyers and Selle Chapter 4, Page 8 o

HOME BUYING AND REAL ESTATE PROFESSIONALS
Exhibit 4-8
WHAT BUYERS WANT MOST FROM REAL ESTATE AGENTS
(Percentage Distribution)
Ohio U.S.Help find the right home to purchase 48% 53%
Help buyer negotiate the terms of sale 17% 12%
Help with the price negotiations 11% 11%
Determine what comparable homes were selling for 5% 7%
Help with paperwork 8% 6%
Help determining how much home buyer can afford 3% 4%
Help find and arrange financing 4% 4%
Help teach buyer more about neighborhood or area (restaurants, parks,
public transportation) 1% 1%
Help find renters for buyer's property 0% 0%
Help find the right home to purchase, 48%
Help buyer negotiate the terms of sale, 17%
Help with the price negotiations, 11%
Determine what comparable homes were selling for, 5%
Help with paperwork, 8%
Help determining how much home buyer can
afford, 3%Help find and arrange
financing, 4%
Help teach buyer more about neighborhood or
area (restaurants, parks, public
transportation), 1%
Help find renters for
buyer's property, 0%
WHAT BUYERS WANT MOST FROM REAL ESTATE PROFESSIONALS(Percentage Distribution)
Ohio
Help find the right home to purchase, 53%
Help buyer negotiate the terms of sale, 12%
Help with the price negotiations, 11%
Determine what comparable homes were selling for, 7%
Help with paperwork, 6%
Help determining how much home buyer can afford, 4%
Help find and arrange financing, 4%
Help teach buyer more about neighborhood or area
(restaurants, parks, public transportation), 1%Help find renters for buyer's
property, 0%
WHAT BUYERS WANT MOST FROM REAL ESTATE PROFESSIONALS(Percentage Distribution)
U.S.
The 2014 National Association of Realtors® Profile of Home Buyers and Selle Chapter 4, Page 9 o

HOME BUYING AND REAL ESTATE PROFESSIONALS
Exhibit 4-9
(Percentage Distribution)
Ohio
All
Buyers
First-time
Buyers
Repeat
Buyers
New
Homes
Previously
Owned Homes
Help find the right home to purchase 48% 46% 49% 70% 48%
Help with the price negotiations 11 13 10 * 12
Help buyer negotiate the terms of sale 17 13 19 30 16
Determine what comparable homes were selling for 5 4 6 * 5
Help with paperwork 8 9 8 * 9
Help determining how much home buyer can afford 3 6 1 * 3
Help find and arrange financing 4 6 3 * 5Help teach buyer more about neighborhood or area
(restaurants, parks, public transportation)1 * 1 * 1
Other 2 2 2 * 2
*Less than 1 percent
U.S.All
Buyers
First-time
Buyers
Repeat
Buyers
New
Homes
Previously
Owned Homes
Help find the right home to purchase 53% 51% 53% 51% 52%
Help buyer negotiate the terms of sale 12 12 12 12 13
Help with the price negotiations 11 11 11 11 11
Determine what comparable homes were selling for 7 6 8 6 7Help with paperwork 6 7 6 7 6Help determining how much home buyer can afford 4 6 3 6 4Help find and arrange financing 4 5 3 5 4Help teach buyer more about neighborhood or area 1 1 2 1 1Help find renters for buyer's property * * * * *Other 2 1 2 1 2
*Less than 1 percent
WHAT BUYERS WANT MOST FROM REAL ESTATE AGENTS, FIRST-TIME AND REPEAT BUYERS, AND
BUYERS OF NEW AND PREVIOUSLY OWNED HOMES
BUYERS OF
BUYERS OF
The 2014 National Association of Realtors® Profile of Home Buyers and Selle Chapter 4, Page 10 o

HOME BUYING AND REAL ESTATE PROFESSIONALS
Exhibit 4-10
WHAT BUYERS WANT MOST FROM REAL ESTATE AGENTS, BY ADULT COMPOSITION OF HOUSEHOLD
(Percentage Distribution)
Ohio
All
Buyers
Married
couple
Single
female
Single
male
Unmarried
couple Other
Help find the right home to purchase 48% 48% 53% 53% 41% *
Help with the price negotiations 11 14 7 * 7 33
Help buyer negotiate the terms of sale 17 16 22 7 10 33
Determine what comparable homes were selling for 5 5 2 20 7 *
Help with paperwork 8 6 11 7 17 *
Help determining how much home buyer can afford 3 3 2 7 3 33
Help find and arrange financing 4 5 2 * 10 *Help teach buyer more about neighborhood or area
(restaurants, parks, public transportation)1 1 * * * *
Other 2 3 2 * * *
U.S.All
Buyers
Married
couple
Single
female
Single
male
Unmarried
couple Other
Help find the right home to purchase 53% 52% 55% 57% 46% 51%
Help buyer negotiate the terms of sale 12 13 10 11 13 6
Help with the price negotiations 11 11 12 8 14 9
Determine what comparable homes were selling for 7 8 5 7 9 4
Help with paperwork 6 6 6 6 7 12
Help determining how much home buyer can afford 4 3 7 3 5 6
Help find and arrange financing 4 3 3 6 5 5Help teach buyer more about neighborhood or area
(restaurants, parks, public transportation) 1 2 1 * 1 3
Help find renters for buyer's property * * 1 * * *
Other 2 2 1 2 1 6
*Less than 1 percent
ADULT COMPOSITION OF HOUSEHOLD
ADULT COMPOSITION OF HOUSEHOLD
The 2014 National Association of Realtors® Profile of Home Buyers and Selle Chapter 4, Page 11 o

HOME BUYING AND REAL ESTATE PROFESSIONALS
Exhibit 4-11
(Percent of Respondents)
Ohio
All Buyers
First-time
Buyers
Repeat
Buyers
Helped buyer understand the process 62% 78% 53%
Pointed out unnoticed features/faults with property 54 60 50
Negotiated better sales contract terms 48 54 44
Improved buyer's knowledge of search areas 31 41 26
Provided a better list of service providers 45 46 45
Negotiated a better price 45 48 42
Shortened buyer's home search 32 33 31
Provided better list of mortgage lenders 22 26 19
Narrowed buyer's search area 13 14 12
Expanded buyer's search area 12 13 11
Other 2 1 3
None of the above 7 6 7
U.S.
All Buyers
First-time
Buyers
Repeat
Buyers
Helped buyer understand the process 60% 79% 51%
Pointed out unnoticed features/faults with property 55 61 52
Negotiated better sales contract terms 48 53 45
Provided a better list of service providers (e.g. home inspector) 47 48 47
Improved buyer's knowledge of search areas 45 48 43
Negotiated a better price 37 39 36
Shortened buyer's home search 30 31 30
Provided better list of mortgage lenders 22 25 21
Expanded buyer's search area 20 23 19
Narrowed buyer's search area 17 16 17
None of the above 6 5 6
Other 2 1 2
BENEFITS PROVIDED BY REAL ESTATE AGENT DURING HOME PURCHASE PROCESS, FIRST-
TIME AND REPEAT BUYERS
The 2014 National Association of Realtors® Profile of Home Buyers and Selle Chapter 4, Page 12 o

HOME BUYING AND REAL ESTATE PROFESSIONALS
Exhibit 4-12
HOW BUYER FOUND REAL ESTATE AGENT, FIRST-TIME AND REPEAT BUYERS
(Percentage Distribution)
OhioAll
Buyers
First-time
Buyers
Repeat
Buyers
Referred by (or is) a friend, neighbor or relative 37% 42% 33%Used agent previously to buy or sell a home 11 3 16Internet Web site (without a specific reference) 10 9 11Visited an open house and met agent 6 6 6Saw contact information on For Sale/Open House sign 5 4 6Referred by another real estate agent/broker 6 8 4Personal contact by agent (telephone, e-mail, etc.) 5 3 6Referred through employer or relocation company 4 3 5Walked into or called office and agent was on duty 3 6 1
Search engine 0 * 1Newspaper, Yellow Pages or home book ad 1 1 1Direct mail (newsletter, flyer, postcard, etc.) 0 1 *Mobile or tablet application 2 3 1Advertising specialty (calendar, magnet, etc.) * * *Crowdsourcing through social media/knew the person
through social media 0 * 1
Saw the agent's social media page without a connection * * *
U.S.All
Buyers
First-time
Buyers
Repeat
Buyers
Referred by (or is) a friend, neighbor or relative 41% 50% 36%Used agent previously to buy or sell a home 12 2 17Internet Web site (without a specific reference) 10 11 10Visited an open house and met agent 5 5 5
Saw contact information on For Sale/Open House sign 5 5 5Referred by another real estate agent/broker 5 6 5Personal contact by agent (telephone, e-mail, etc.) 4 4 4
Referred through employer or relocation company 3 2 4Walked into or called office and agent was on duty 2 2 3Search engine 1 1 1Mobile or tablet application 1 1 1Newspaper, Yellow Pages or home book ad * * 1Direct mail (newsletter, flyer, postcard, etc.) * * *Advertising specialty (calendar, magnet, etc.) * * *Crowdsourcing through social media/knew the person
through social media * * *
Saw the agent's social media page without a connection * * *Other 10 11 10
*Less than 1 percent
The 2014 National Association of Realtors® Profile of Home Buyers and Selle Chapter 4, Page 13 o

HOME BUYING AND REAL ESTATE PROFESSIONALS
Exhibit 4-13
HOW BUYER FOUND REAL ESTATE AGENT, BY ADULT COMPOSITION OF HOUSEHOLD
(Percentage Distribution)
OhioAll
Buyers
Married
couple
Single
female
Single
male
Unmarried
couple Other
Referred by (or is) a friend, neighbor or relative 37% 35% 35% 53% 45% 25%
Used agent previously to buy or sell a home 11 11 15 * 10 *
Internet Web site (without a specific reference) 10 10 9 7 14 25
Visited an open house and met agent 6 6 6 * 7 *Saw contact information on For Sale/Open House
sign 5 6 2 * 10 *
Referred by another real estate agent/broker 6 6 6 7 3 *
Personal contact by agent (telephone, e-mail, etc.) 5 6 4 7 3 *
Referred through employer or relocation company 4 6 * * * 25
Walked into or called office and agent was on duty 3 3 2 7 * 25
Search engine 0 * * 7 * *
Newspaper, Yellow Pages or home book ad 1 * 2 7 * *
Direct mail (newsletter, flyer, postcard, etc.) 0 1 * * * *
Mobile or tablet application 2 2 2 * * *
Advertising specialty (calendar, magnet, etc.) * * * * * *Crowdsourcing through social media/knew the
person through social media 0 * * * 3 *Saw the agent's social media page without a
connection * * * * * *
U.S.All
Buyers
Married
couple
Single
female
Single
male
Unmarried
couple Other
Referred by (or is) a friend, neighbor or relative 41% 40 43 39 46 45
Used agent previously to buy or sell a home 12 13 10 10 6 9
Internet Web site (without a specific reference) 10 11 9 10 11 12
Referred by another real estate agent/broker 5 5 6 5 4
Visited an open house and met agent 5 6 3 2 8 4Saw contact information on For Sale/Open House
sign 5 4 5 6 7 8
Personal contact by agent (telephone, e-mail, etc.) 4 4 5 8 1 4
Referred through employer or relocation company 3 4 3 3 2 2
Walked into or called office and agent was on duty 2 2 3 3 3 *
Search engine 1 1 1 2 1 1
Mobile or tablet application 1 1 1 2 1 *
Newspaper, Yellow Pages or home book ad * * 1 1 * *
Advertising specialty (calendar, magnet, etc.) * 1 * * * *
Direct mail (newsletter, flyer, postcard, etc.) * * * * 1 *Crowdsourcing through social media/knew the
person through social media * * * * * *Saw the agent's social media page without a
connection * * * * * *
Other 10 9 11 13 9 17
*Less than 1 percent
ADULT COMPOSITION OF HOUSEHOLD
ADULT COMPOSITION OF HOUSEHOLD
The 2014 National Association of Realtors® Profile of Home Buyers and Selle Chapter 4, Page 14 o

HOME BUYING AND REAL ESTATE PROFESSIONALS
Exhibit 4-14
HOW MANY TIMES CONTACTED AGENT BEFORE RECEIVED RESPONSE AND ORIGINAL FORM OF CONTACT
(Median, Percentage Distribution)
Ohio
Phone call 50%
E-mail 15
Contacted friend/family 8
Web form on home listing website 4
Text message 3
Through agent's website 3
Social Media (FaceBook, Twitter, LinkedIn, etc.) 2
Talked to them in person 16
Number of Times Contacted (median) 1
U.S.
Phone call 44%
Talked to them in person 20
E-mail 17
Contacted friend/family 9
Web form on home listing website 5
Text message 3
Through agent's website 2
Social Media (FaceBook, Twitter, LinkedIn, etc.) 1
Number of Times Contacted (median) 1
The 2014 National Association of Realtors® Profile of Home Buyers and Selle Chapter 4, Page 15 o

HOME BUYING AND REAL ESTATE PROFESSIONALS
Exhibit 4-15
NUMBER OF REAL ESTATE AGENTS INTERVIEWED BY FIRST-TIME AND REPEAT BUYERS
(Percentage Distribution)
Ohio
All Buyers First-time Buyers Repeat Buyers
One 64% 52% 72%
Two 22 26 19
Three 11 16 7
Four or more 3 5 2
U.S.
All Buyers First-time Buyers Repeat Buyers
One 67% 62% 70%
Two 20 22 18
Three 9 10 8
Four or more 5 6 4
67%
62%
70%
20
22
18
9
10
8
5
6
4
0% 20% 40% 60% 80% 100%
All Buyers
First-time Buyers
Repeat Buyers
One Two Three Four or more
The 2014 National Association of Realtors® Profile of Home Buyers and Selle Chapter 4, Page 16 o

HOME BUYING AND REAL ESTATE PROFESSIONALS
Exhibit 4-16
MOST IMPORTANT FACTORS WHEN CHOOSING AN AGENT
(Percentage Distribution)
Ohio U.S.
Reputation of agent 24% 23%
Agent is honest and trustworthy 25% 21%
Agent is friend or family member 14% 16%Agent's knowledge of the neighborhood 7% 13%
Agent has caring personality/good listener 11% 8%
Agent is timely with responses 5% 7%Agent seems 100% accessible because of
use of technology like tablet or smart
phone 7% 5%
Agent's association with a particular firm 4% 3%
Professional designations held by agent 2% 1%
Other 1% 1%
Reputation of agent, 24%
Agent is honest and trustworthy, 25%
Agent is friend or family member, 14%Agent's knowledge of
the neighborhood, 7%
Agent has caring personality/good
listener, 11%
Agent is timely with responses, 5%
Agent seems 100% accessible because of use of technology like tablet or smart phone,
7%
Agent's association with a particular firm,
4%
MOST IMPORTANT FACTORS IN CHOOSING AN AGENT(Percentage Distribution)
Ohio
Reputation of agent, 23%
Agent is honest and trustworthy, 21%
Agent is friend or family member, 16%
Agent's knowledge of the neighborhood, 13%
Agent has caring personality/good
listener, 8%
Agent is timely with responses, 7%
Agent seems 100% accessible because of use of technology like tablet or smart phone,
5%
Agent's association with a particular firm, 3%
Professional designations
held by agent, 1%
Other, 1%
MOST IMPORTANT FACTORS IN CHOOSING AN AGENT(Percentage Distribution)
U.S.
The 2014 National Association of Realtors® Profile of Home Buyers and Selle Chapter 4, Page 17 o

HOME BUYING AND REAL ESTATE PROFESSIONALS
Exhibit 4-17
IMPORTANCE OF REAL ESTATE AGENT SKILLS AND QUALITIES
(Percentage Distribution)
Ohio
Very
Important
Somewhat
Important
Not
Important
Honesty and integrity 97% 3% 0%
Knowledge of purchase process 92 8 1
Responsiveness 91 8 1
Knowledge of real estate market 83 15 2
Communication skills 88 11 1
Negotiation skills 83 16 1
People skills 78 21 1
Knowledge of local area 74 25 1
Skills with technology 40 49 11
U.S.
Very
Important
Somewhat
Important
Not
Important
Skills with technology 46 45 9
Knowledge of local area 77 20 3
People skills 79 19 1
Negotiation skills 83 16 1
Communication skills 86 13 1
Knowledge of real estate market 90 9 1
Knowledge of purchase process 92 7 1
Responsiveness 93 7 0
Honesty and integrity 97% 3% 0%
*Less than 1 percent
46
77
79
83
86
90
92
93
97%
45
20
19
16
13
9
7
7
3%
9
3
1
1
1
1
1
0
0%
0 10 20 30 40 50 60 70 80 90 100
Skills with technology
Knowledge of local area
People skills
Negotiation skills
Communication skills
Knowledge of real estate market
Knowledge of purchase process
Responsiveness
Honesty and integrity
Very Important Somewhat Important Not Important
The 2014 National Association of Realtors® Profile of Home Buyers and Selle Chapter 4, Page 18 o

HOME BUYING AND REAL ESTATE PROFESSIONALS
Exhibit 4-18
(Percent of Respondents)
Ohio
All Buyers
First-time
Buyers
Repeat
Buyers
New
Homes
Previously
Owned Homes
Honesty and integrity 97% 95% 98% 100% 96%
Knowledge of purchase process 92 93 90 100 91
Responsiveness 91 90 92 90 91
Knowledge of real estate market 83 80 85 80 84
Communication skills 88 89 87 80 87
Negotiation skills 83 82 84 80 84
People skills 78 84 74 80 78
Knowledge of local area 74 67 79 70 74
Skills with technology 40 40 41 30 40
U.S.
All Buyers
First-time
Buyers
Repeat
Buyers
New
Homes
Previously
Owned Homes
Honesty and integrity 97% 97% 97% 94% 98%
Knowledge of purchase process 92 95 90 89 92
Responsiveness 93 93 93 90 93
Knowledge of real estate market 90 88 91 88 90
Communication skills 86 88 85 84 86
Negotiation skills 83 83 83 80 83
People skills 79 81 79 75 80
Knowledge of local area 77 73 79 74 77
Skills with technology 46 45 47 51 46
AGENT SKILLS AND QUALITIES CONSIDERED 'VERY IMPORTANT' BY FIRST-TIME AND
REPEAT BUYERS, AND BUYERS OF NEW AND PREVIOUSLY OWNED HOMES
BUYERS OF
BUYERS OF
The 2014 National Association of Realtors® Profile of Home Buyers and Selle Chapter 4, Page 19 o

HOME BUYING AND REAL ESTATE PROFESSIONALS
Exhibit 4-19
(Percentage Distribution)
Ohio
All Buyers
Married
couple
Single
female
Single
male
Unmarried
couple Other
Honesty and integrity 97% 99% 94% 93% 90% 100%
Knowledge of purchase process 92 92 94 87 86 100
Responsiveness 91 93 93 73 86 100
Knowledge of real estate market 83 86 83 73 76 67
Communication skills 88 88 83 87 90 100
Negotiation skills 83 84 83 73 83 100
People skills 78 81 74 67 79 100
Knowledge of local area 74 80 74 73 48 100
Skills with technology 40 39 41 47 38 100
U.S.
All Buyers
Married
couple
Single
female
Single
male
Unmarried
couple Other
Honesty and integrity 97% 97% 99% 94% 99% 93%
Knowledge of purchase process 92 91 95 89 95 90
Responsiveness 93 94 95 86 94 89
Knowledge of real estate market 90 91 92 88 92 82
Communication skills 86 87 88 80 85 76
Negotiation skills 83 82 85 79 86 76
People skills 79 80 83 71 79 71
Knowledge of local area 77 78 77 71 74 75
Skills with technology 46 46 51 42 41 34
AGENT SKILLS AND QUALITIES CONSIDERED 'VERY IMPORTANT' BY ADULT
COMPOSITION OF HOUSEHOLD
ADULT COMPOSITION OF HOUSEHOLD
ADULT COMPOSITION OF HOUSEHOLD
The 2014 National Association of Realtors® Profile of Home Buyers and Selle Chapter 4, Page 20 o

HOME BUYING AND REAL ESTATE PROFESSIONALS
Exhibit 4-20
(Percent of Respondents)
Ohio
All Buyers
First-time
Buyers
Repeat
Buyers
Calls personally to inform of activities 85% 85% 85%Sends postings as soon as a property is
listed/the price changes/under contract 62 70 57
Sends emails about specific needs 55 61 51Can send market reports on recent listings
and sales 46 43 47Sends property info and communicates via
text message 55 64 50
Has a web page 29 25 31
Has a mobile site to show properties 29 30 28
Sends an email newsletter 9 8 10
Advertises in newspapers 13 10 14
Is active on Facebook 14 12 15
Has a blog 1 * 1
U.S.
All Buyers
First-time
Buyers
Repeat
Buyers
Calls personally to inform of activities 78% 76% 79%Sends postings as soon as a property is
listed/the price changes/under contract 68 66 69
Sends property info and communicates via
text message 55 58 54
Sends emails about specific needs 54 59 51
Can send market reports on recent listings
and sales 51 46 54
Has a web page 29 29 29
Has a mobile site to show properties 27 27 27
Is active on Facebook/Twitter 12 11 12
Sends an email newsletter 9 8 9
Advertises in newspapers 5 4 6
Has a blog 2 1 2
IMPORTANCE OF AGENT COMMUNICATIONS
The 2014 National Association of Realtors® Profile of Home Buyers and Selle Chapter 4, Page 21 o

HOME BUYING AND REAL ESTATE PROFESSIONALS
Exhibit 4-21
SATISFACTION WITH REAL ESTATE AGENT SKILLS AND QUALITIES
(Percentage Distribution)
Ohio
Very Satisfied Somewhat Satisfied Not Satisfied
Knowledge of purchase process 87% 9% 3%
Honesty and integrity 86 11 4
Knowledge of real estate market 85 12 3
People skills 84 14 3
Responsiveness 84 13 3
Knowledge of local area 82 15 3
Communication skills 82 14 3
Skills with technology 77 20 3
Negotiation skills 74 20 6
U.S.
Very Satisfied Somewhat Satisfied Not Satisfied
Negotiation skills 75 20 6
Skills with technology 80 17 3
Communication skills 82 14 4
Knowledge of local area 82 15 3
Responsiveness 85 12 3
People skills 85 12 3
Knowledge of real estate market 86 13 2
Knowledge of purchase process 87 11 2
Honesty and integrity 88% 10% 3%
75
80
82
82
85
85
86
87
88%
20
17
14
15
12
12
13
11
10%
6
3
4
3
3
3
2
2
3%
0% 10% 20% 30% 40% 50% 60% 70% 80% 90% 100%
Negotiation skills
Skills with technology
Communication skills
Knowledge of local area
Responsiveness
People skills
Knowledge of real estate market
Knowledge of purchase process
Honesty and integrity
Very Satisfied Somewhat Satisfied Not Satisfied
The 2014 National Association of Realtors® Profile of Home Buyers and Selle Chapter 4, Page 22 o

HOME BUYING AND REAL ESTATE PROFESSIONALS
Exhibit 4-22
WOULD BUYER USE REAL ESTATE AGENT AGAIN OR RECOMMEND TO OTHERS
(Percentage distribution)
Ohio
Definitely 71%
Probably 16%
Probably Not 7%
Definitely Not 5%
Don’t Know 2%
U.S.All
Buyers
Definitely 72%
Probably 16
Probably Not 5
Definitely Not 5Don't Know 2
71%
16%
7%5%
2%
0%
10%
20%
30%
40%
50%
60%
70%
80%
Definitely Probably Probably Not Definitely Not Don’t Know
WOULD BUYER USE ESTATE AGENT AGAIN OR RECOMMEND TO OTHERS
(Percentage Distribution)
0%
20%
40%
60%
80%
Definitely Probably ProbablyNot
DefinitelyNot
Don't Know
72%
16
5 5 2
WOULD BUYER USE ESTATE AGENT AGAIN OR RECOMMEND TO OTHERS
(Percentage Distribution)
The 2014 National Association of Realtors® Profile of Home Buyers and Selle Chapter 4, Page 23 o

HOME BUYING AND REAL ESTATE PROFESSIONALS
Exhibit 4-23
HOW MANY TIMES BUYER RECOMMENDED TYPICAL AGENT
(Percentage distribution)
Ohio
All Buyers
None 36%
One time 17
Two times 22
Three times 10
4 or more 15Times recommended since
buying (median) 1
U.S.All Buyers
None 36%
One time 15
Two times 19
Three times 11
Four or more times 19Times recommended since
buying (median) 1
The 2014 National Association of Realtors® Profile of Home Buyers and Selle Chapter 4, Page 24 o

FINANCING THE HOME PURCHASE
Exhibit 5-1 BUYERS WHO FINANCED THEIR HOME PURCHASE, BY AGE
Exhibit 5-2 BUYERS WHO FINANCED THEIR HOME PURCHASE, BY ADULT COMPOSITION OF HOUSEHOLD
Exhibit 5-3 PERCENT OF HOME FINANCED BY FIRST-TIME AND REPEAT BUYERS, AND BUYERS OF NEW AND
PREVIOUSLY OWNED HOMES
Exhibit 5-4 SOURCES OF DOWNPAYMENT, FIRST-TIME AND REPEAT BUYERS
Exhibit 5-5 SOURCES OF DOWNPAYMENT, BY ADULT COMPOSITION OF HOUSEHOLD
Exhibit 5-6 LENGTH OF TIME TO SAVE FOR A DOWNPAYMENT, FIRST-TIME AND REPEAT BUYERS
Exhibit 5-7 LENGTH OF TIME TO SAVE FOR A DOWNPAYMENT, BY ADULT COMPOSITION OF HOUSEHOLD
Exhibit 5-8 YEARS DEBT DELAYED HOME BUYERS FROM SAVING FOR A DOWNPAYMENT OR BUYING A HOME
Exhibit 5-9 EXPENSES THAT DELAYED SAVING FOR A DOWNPAYMENT OR SAVING FOR A HOME PURCHASE, BY
FIRST-TIME AND REPEAT BUYERS
Exhibit 5-10 EXPENSES THAT DELAYED SAVING FOR A DOWNPAYMENT OR SAVING FOR A HOME PURCHASE, BY
ADULT COMPOSITION OF HOUSEHOLD
Exhibit 5-11 SACRIFICES MADE TO PURCHASE HOME, BY FIRST-TIME AND REPEAT BUYERS
Exhibit 5-12 SACRIFICES MADE TO PURCHASE HOME, BY ADULT COMPOSITION OF HOUSEHOLD
Exhibit 5-13 DIFFICULTY OF MORTGAGE APPLICATION AND APPROVAL PROCESS, BY FIRST-TIME AND REPEAT
BUYERS
Exhibit 5-14 DIFFICULTY OF MORTGAGE APPLICATION AND APPROVAL PROCESS, BY ADULT COMPOSITION OF
HOUSEHOLD
Exhibit 5-15 BUYERS WHO HAVE STUDENT LOAN DEBT
Exhibit 5-16 BUYER PREVIOUSLY SOLD A DISTRESSED PROPERTY (SHORT SALE OR FORECLOSURE)
Exhibit 5-17 TYPE OF MORTGAGE, FIRST-TIME AND REPEAT BUYERS
Exhibit 5-18 TYPE OF LOAN, FIRST-TIME AND REPEAT BUYERS
Exhibit 5-19 BUYERS' VIEW OF HOMES AS A FINANCIAL INVESTMENT, FIRST-TIME AND REPEAT BUYERS, AND
BUYERS OF NEW AND PREVIOUSLY OWNED HOMES
Exhibit 5-20 BUYERS' VIEW OF HOMES AS A FINANCIAL INVESTMENT, BY ADULT COMPOSITION OF HOUSEHOLD
The 2015 National Association of Realtors® Profile of Home Buyers and Selle Chapter 5, Page 1 o

FINANCING THE HOME PURCHASE
Exhibit 5-1
BUYERS WHO FINANCED THEIR HOME PURCHASE, BY AGE
(Percent of Respondents)
Ohio
All Buyers 84%
18 to 24 91%
25 to 44 97%
45 to 64 82%
65 or older 50%
U.S.
All Buyers 86%
18 to 24 98%
25 to 44 97%
45 to 64 84%
65 or older 63%
84%
91%97%
82%
50%
0%
20%
40%
60%
80%
100%
All Buyers 18 to 24 25 to 44 45 to 64 65 or older
BUYERS WHO FINANCED THEIR HOME PURCHASE, BY AGE
(Percent of Respondents)
Ohio
86%
98% 97%
84%
63%
0
20
40
60
80
100
All Buyers 18 to 24 25 to 44 45 to 64 65 or older
BUYERS WHO FINANCED THEIR HOME PURCHASE, BY AGE
(Percent of Respondents)
Age
U.S.
Age
The 2015 National Association of Realtors® Profile of Home Buyers and Selle Chapter 5, Page 2 o

FINANCING THE HOME PURCHASE
Exhibit 5-2
BUYERS WHO FINANCED THEIR HOME PURCHASE, BY ADULT COMPOSITION OF HOUSEHOLD
(Percent of Respondents)
Ohio
All Buyers
Married
couple
Single
female
Single
male
Unmarried
couple Other
All Buyers 84% 86% 72% 94% 91% 75%
First-time Buyers 93 93 88 100 96 100
Repeat Buyers 78 83 63 88 83 67
U.S.
All Buyers
Married
couple
Single
female
Single
male
Unmarried
couple Other
All Buyers 86% 87% 83% 86% 92% 81%
First-time Buyers 95 96 94 91 98 91
Repeat Buyers 82 84 75 81 83 75
ADULT COMPOSITION OF HOUSEHOLD
ADULT COMPOSITION OF HOUSEHOLD
The 2015 National Association of Realtors® Profile of Home Buyers and Selle Chapter 5, Page 3 o

FINANCING THE HOME PURCHASE
Exhibit 5-3
(Percentage Distribution)
Ohio
All Buyers
First-time
Buyers
Repeat
Buyers
New
Homes
Previously
Owned Homes
Less than 50% 8% 6% 9% 14% 7%
50% to 59% 1 * 2 * 1
60% to 69% 4 1 6 7 3
70% to 79% 9 4 13 14 9
80% to 89% 23 14 30 36 23
90% to 94% 13 13 14 7 14
95% to 99% 24 38 13 21 24
100% – Financed the entire
purchase price with a mortgage
19 25 13 * 19
Median percent financed 92% 95% 90% 90% 91%
* Less than 1 percent
U.S.
All Buyers
First-time
Buyers
Repeat
Buyers
New
Homes
Previously
Owned Homes
Less than 50% 9% 7% 11% 11% 9%
50% to 59% 3 1 5 3 4
60% to 69% 4 2 5 6 3
70% to 79% 13 8 15 16 12
80% to 89% 22 17 25 20 23
90% to 94% 15 18 13 13 15
95% to 99% 20 29 15 18 20
100% – Financed the entire
purchase price with a mortgage
14 19 12 13 15
Median percent financed 90% 94% 86% 87% 90%
PERCENT OF HOME FINANCED BY FIRST-TIME AND REPEAT BUYERS, AND BUYERS OF NEW
AND PREVIOUSLY OWNED HOMES
BUYERS OF
BUYERS OF
The 2015 National Association of Realtors® Profile of Home Buyers and Selle Chapter 5, Page 4 o

FINANCING THE HOME PURCHASE
Exhibit 5-4
SOURCES OF DOWNPAYMENT, FIRST-TIME AND REPEAT BUYERS
(Percent of Respondents Among those who Made a Downpayment)
Ohio
All
Buyers
First-time
Buyers
Repeat
Buyers
Savings 61% 74% 53%
Proceeds from sale of primary residence 28 3 43
Gift from relative or friend 11 20 6
Sale of stocks or bonds 6 3 8
401k/pension fund including a loan 7 9 6
Loan from relative or friend 2 2 2
Equity from primary residence buyer continue to own 3 1 4
Inheritance 5 1 6
Individual Retirement Account (IRA) 2 1 3
Loan or financial assistance from source other than employer 1 2 *
Proceeds from sale of real estate other than primary residence 2 1 3
Loan from financial institution other than a mortgage 2 3 1
Loan or financial assistance through employer 0 * 1
Other 10 11 9
U.S.
All
Buyers
First-time
Buyers
Repeat
Buyers
Other 5% 6% 4%
Loan from financial institution other than a mortgage 1% 1% 1%
Loan or financial assistance from source other than employer 1% 2% 1%
Equity from primary residence buyer continue to own 2% 1% 3%
Proceeds from sale of real estate other than primary residence 2% 1% 3%
Loan from relative or friend 3% 5% 2%
Individual Retirement Account (IRA) 4% 4% 4%
Inheritance 5% 5% 4%
Sale of stocks or bonds 8% 8% 7%
401k/pension fund including a loan 8% 8% 8%
Gift from relative or friend 13% 27% 7%
Proceeds from sale of primary residence 38% 3% 53%
Savings 60% 81% 51%
* Less than 1 percent
1%
1%
3%
3%
2%
4%
4%
7%
8%
7%
53%
51%
1%
2%
1%
1%
5%
4%
5%
8%
8%
27%
3%
81%
1%
1%
2%
2%
3%
4%
5%
8%
8%
13%
38%
60%
0% 10% 20% 30% 40% 50% 60% 70% 80% 90%
Loan from financial institution other thana mortgage
Loan or financial assistance from sourceother than employer
Equity from primary residence buyercontinue to own
Proceeds from sale of real estate otherthan primary residence
Loan from relative or friend
Individual Retirement Account (IRA)
Inheritance
Sale of stocks or bonds
401k/pension fund including a loan
Gift from relative or friend
Proceeds from sale of primary residence
Savings
All Buyers First-time Buyers Repeat Buyers
The 2015 National Association of Realtors® Profile of Home Buyers and Selle Chapter 5, Page 5 o

FINANCING THE HOME PURCHASE
Exhibit 5-5
SOURCES OF DOWNPAYMENT, BY ADULT COMPOSITION OF HOUSEHOLD
(Percent of Respondents Among those who Made a Downpayment)
Ohio
All Buyers
Married
couple
Single
female
Single
male
Unmarried
couple Other
Savings 61% 60% 51% 85% 73% 50%
Proceeds from sale of primary residence 28 33 30 8 3 *
Gift from relative or friend 11 9 12 23 13 *
Sale of stocks or bonds 6 7 7 8 * *
401k/pension fund including a loan 7 7 4 15 10 *
Loan from relative or friend 2 1 5 * * *
Equity from primary residence buyer continue to own 3 3 2 * 7 *
Inheritance 5 5 9 * * *
Individual Retirement Account (IRA) 2 1 4 * * *Loan or financial assistance from source other than employer 1 1 * * 3 *
Proceeds from sale of real estate other than primary residence 2 2 4 * 3 *
Loan from financial institution other than a mortgage 2 3 * * * 50
Loan or financial assistance through employer 0 1 * * * *
Other 10 7 18 8 10 *
U.S.
All Buyers
Married
couple
Single
female
Single
male
Unmarried
couple Other
Savings 60% 59% 52% 74% 72% 58%Proceeds from sale of primary residence 38 43 34 22 22 27Gift from relative or friend 13 12 15 8 19 11401k/pension fund including a loan 8 7 6 9 9 18Sale of stocks or bonds 8 7 6 9 10 14Inheritance 5 4 4 6 5 11Individual Retirement Account (IRA) 4 4 3 5 3 4Loan from relative or friend 3 3 3 2 6 6Proceeds from sale of real estate other than primary residence 2 2 3 2 1 7Equity from primary residence buyer continue to own 2 2 1 3 1 7Loan or financial assistance from source other than employer 1 1 2 1 2 *Loan from financial institution other than a mortgage 1 1 1 * * 5Loan or financial assistance through employer * * * 1 * *Other 5 4 7 3 4 6
* Less than 1 percent
ADULT COMPOSITION OF HOUSEHOLD
ADULT COMPOSITION OF HOUSEHOLD
The 2015 National Association of Realtors® Profile of Home Buyers and Selle Chapter 5, Page 6 o

FINANCING THE HOME PURCHASE
Exhibit 5-6
LENGTH OF TIME TO SAVE FOR A DOWNPAYMENT, FIRST-TIME AND REPEAT BUYERS
(Percentage Distribution Among those who Made a Downpayment)
Ohio
All Buyers
First-time
Buyers
Repeat
Buyers
6 months or less 47% 45% 47%
6 to 12 months 18 20 18
12 to 18 months 8 9 7
18 to 24 months 8 11 7
24 months to 5 years 11 10 12
More than 5 years 9 5 9
U.S.
All Buyers
First-time
Buyers
Repeat
Buyers
6 months or less 46% 33% 54%
6 to 12 months 14% 18% 12%
12 to 18 months 8% 12% 6%
18 to 24 months 7% 9% 5%
24 months to 5 years 14% 17% 13%
More than 5 years 10% 10% 11%
46%
14%
8% 7%
14%10%
33%
18%
12%9%
17%
10%
54%
12%
6% 5%
13% 11%
0%
10%
20%
30%
40%
50%
60%
6 months orless
6 to 12months
12 to 18months
18 to 24months
24 months to5 years
More than 5years
All Buyers First-time Buyers Repeat Buyers
The 2015 National Association of Realtors® Profile of Home Buyers and Selle Chapter 5, Page 7 o

FINANCING THE HOME PURCHASE
Exhibit 5-7
LENGTH OF TIME TO SAVE FOR A DOWNPAYMENT, BY ADULT COMPOSITION OF HOUSEHOLD
(Percentage Distribution Among those who Made a Downpayment)
Ohio
All Buyers
Married
couple
Single
female
Single
male
Unmarried
couple Other
6 months or less 47% 46% 55% 33% 47% *
6 to 12 months 18 21 17 7 17 *
12 to 18 months 8 9 2 * 13 *
18 to 24 months 8 6 10 40 3 *
24 months to 5 years 11 12 10 13 13 *
More than 5 years 9 6 7 7 7 100
U.S.
All Buyers
Married
couple
Single
female
Single
male
Unmarried
couple Other
6 months or less 46% 48% 46% 39% 40% 52%
6 to 12 months 14% 13% 18% 14% 16% 5%
12 to 18 months 8% 8% 7% 11% 13% 7%
18 to 24 months 7% 7% 6% 6% 9% 2%
24 months to 5 years 14% 14% 12% 19% 12% 22%
More than 5 years 10% 10% 12% 11% 9% 13%
ADULT COMPOSITION OF HOUSEHOLD
ADULT COMPOSITION OF HOUSEHOLD
46%48%
46%
39% 40%
52%
14% 13%
18%
14%16%
5%
8% 8% 7%
11%13%
7%7% 7% 6% 6%
9%
2%
14% 14%12%
19%
12%
22%
10% 10%12% 11%
9%
13%
0%
10%
20%
30%
40%
50%
60%
All Buyers Married couple Single female Single male Unmarried couple Other
6 months or less 6 to 12 months 12 to 18 months 18 to 24 months 24 months to 5 years More than 5 years
The 2015 National Association of Realtors® Profile of Home Buyers and Selle Chapter 5, Page 8 o

FINANCING THE HOME PURCHASE
Exhibit 5-8
YEARS DEBT DELAYED HOME BUYERS FROM SAVING FOR A DOWNPAYMENT OR BUYING A HOME
(Percentage Distribution)
Ohio
All Buyers
First-time
Buyers
Repeat
Buyers
One year 16% 17% 14%
Two years 21 19 23
Three years 12 14 9
Four years 7 * 18
Five years 19 19 18
More than five years 26 31 18
Median 4 4 4
U.S.
All Buyers
First-time
Buyers
Repeat
Buyers
One year 16% 17% 15%
Two years 19 21 17
Three years 14 13 15
Four years 7 8 7
Five years 20 19 19
More than five years 24 22 27
Median 4 3 4
The 2015 National Association of Realtors® Profile of Home Buyers and Selle Chapter 5, Page 9 o

FINANCING THE HOME PURCHASE
Exhibit 5-9
EXPENSES THAT DELAYED SAVING FOR A DOWNPAYMENT OR SAVING FOR A HOME PURCHASE, BY FIRST-TIME AND REPEAT BUYERS
(Percent of Respondents Who Reported Saving for a Down Payment was Difficult)
Ohio
All Buyers
First-time
Buyers Repeat Buyers
Share Saving for Downpayment was
Most Difficult Task in Buying Process: 8% 14% 4%
Debt that Delayed Saving:
Student Loans 48% 40% 63%
Credit card debt 65 67 63
Car loan 39 47 25
Child care expenses 22 13 38
Health care costs 17 27 *
Other 4 * 13
U.S.
All Buyers
First-time
Buyers Repeat Buyers
Share Saving for Downpayment was
Most Difficult Task in Buying Process: 13% 25% 7%
Debt that Delayed Saving:
Student Loans 51% 58% 36%
Credit card debt 47 47 46
Car loan 35 37 30
Child care expenses 18 15 23
Health care costs 13 13 13
Other 17 11 29Median Years Debt Delayed Home
Purchase Among Those Who Had
Difficulty Saving
3 3 3
The 2015 National Association of Realtors® Profile of Home Buyers and Selle Chapter 5, Page 10 o

FINANCING THE HOME PURCHASE
Exhibit 5-10
EXPENSES THAT DELAYED SAVING FOR A DOWNPAYMENT OR SAVING FOR A HOME PURCHASE, BY ADULT COMPOSITION OF HOUSEHOLD
(Percent of Respondents Who Reported Saving for a Down Payment was Difficult)
Ohio
All Buyers
Married
couple
Single
female
Single
male
Unmarried
couple Other
Share Saving for Downpayment was
Most Difficult Task in Buying Process: 8% 10% 3% 11% 6% 20%
Debt that Delayed Saving:
Student Loans 48% 59% * * 50% *
Credit card debt 65 65 100 50 50 100
Car loan 39 41 * 100 * *
Child care expenses 22 24 * * 50 *
Health care costs 17 12 * * 50 100
Other 4 * 100 * * *
U.S.
All Buyers
Married
couple
Single
female
Single
male
Unmarried
couple Other
Share Saving for Downpayment was
Most Difficult Task in Buying Process: 13% 12% 10% 14% 23% 15%
Debt that Delayed Saving:
Student Loans 51% 53% 51% 42% 51% 50%
Credit card debt 47 47 56 40 40 63
Car loan 35 35 27 22 53 33
Child care expenses 18 20 11 8 8 56
Health care costs 13 14 11 13 7 27
Other 17 14 25 27 15 25Median Years Debt Delayed Home
Purchase Among Those Who Had
Difficulty Saving
3 3 5 4 4 7
The 2015 National Association of Realtors® Profile of Home Buyers and Selle Chapter 5, Page 11 o

FINANCING THE HOME PURCHASE
Exhibit 5-11
SACRIFICES MADE TO PURCHASE HOME, BY FIRST-TIME AND REPEAT BUYERS
(Percent of Respondents)
Ohio
All
Buyers
First-time
Buyers
Repeat
Buyers
Cut spending on luxury items or non-essential items 36% 50% 27%
Cut spending on entertainment 26 33 21
Cut spending on clothes 22 30 17
Cancelled vacation plans 14 13 14
Earned extra income through a second job 6 9 4
Sold a vehicle or decided not to purchase a vehicle 6 8 4
Other 4 6 3
Did not need to make any sacrifices 53 39 62
U.S.All
Buyers
First-time
Buyers
Repeat
Buyers
Other 3% 3% 3%
Did not need to make any sacrifices 54% 36% 63%
Sold a vehicle or decided not to purchase a vehicle 7% 9% 6%
Earned extra income through a second job 8% 12% 5%
Canceled vacation plans 15% 20% 12%
Cut spending on clothes 20% 33% 14%
Cut spending on entertainment 25% 39% 18%
Cut spending on luxury items or non-essential items 33% 49% 26%
3%
63%
6%
5%
12%
14%
18%
26%
3%
36%
9%
12%
20%
33%
39%
49%
3%
54%
7%
8%
15%
20%
25%
33%
0% 10% 20% 30% 40% 50% 60% 70%
Other
Did not need to make any sacrifices
Sold a vehicle or decided not to purchase a vehicle
Earned extra income through a second job
Canceled vacation plans
Cut spending on clothes
Cut spending on entertainment
Cut spending on luxury items or non-essentialitems
All Buyers First-time Buyers Repeat Buyers
The 2015 National Association of Realtors® Profile of Home Buyers and Selle Chapter 5, Page 12 o

FINANCING THE HOME PURCHASE
Exhibit 5-12
SACRIFICES MADE TO PURCHASE HOME, BY ADULT COMPOSITION OF HOUSEHOLD
(Percent of Respondents)
Ohio
All
Buyers
Married
couple
Single
female
Single
male
Unmarried
couple Other
Cut spending on luxury items or non-essential items 36% 35% 34% 35% 43% 20%
Cut spending on entertainment 26 23 31 35 26 20Cut spending on clothes 22 19 30 29 20 20Cancelled vacation plans 14 16 9 18 11 20Earned extra income through a second job 6 5 8 18 3 20Sold a vehicle or decided not to purchase a vehicle 6 7 3 * 6 20
Other 4 4 3 * 9 20
Did not need to make any sacrifices 53 54 58 41 49 60
U.S.
All
Buyers
Married
couple
Single
female
Single
male
Unmarried
couple Other
Cut spending on luxury items or non-essential items 33% 32% 34% 29% 45% 30%
Cut spending on entertainment 25 23 28 26 36 31Cut spending on clothes 20 18 27 17 28 25Canceled vacation plans 15 14 13 16 21 15Earned extra income through a second job 8 7 9 7 7 2Sold a vehicle or decided not to purchase a vehicle 7 8 6 8 7 2Other 3 3 3 3 4 8Did not need to make any sacrifices 54 56 52 58 43 56
ADULT COMPOSITION OF HOUSEHOLD
ADULT COMPOSITION OF HOUSEHOLD
The 2015 National Association of Realtors® Profile of Home Buyers and Selle Chapter 5, Page 13 o

FINANCING THE HOME PURCHASE
Exhibit 5-13
(Percentage Distribution Among those who Financed their Home Purchase)
Ohio
All Buyers
First-time
Buyers
Repeat
Buyers
Much more difficult than expected 14% 15% 13%
Somewhat more difficult than expected 20 23 17
Not difficult/No more difficult than expected 43 33 51
Easier than expected 23 28 19
* Less than 1 percent
U.S.
Repeat
Buyers
First-time
Buyers All Buyers
Much more difficult than expected 15% 17% 16%
Somewhat more difficult than expected 22% 28% 24%
Not difficult/No more difficult than expected 47% 35% 43%
Easier than expected 16% 20% 17%
DIFFICULTY OF MORTGAGE APPLICATION AND APPROVAL PROCESS, BY FIRST-TIME AND
REPEAT BUYERS
15%
17%
16%
22%
28%
24%
47%
35%
43%
16%
20%
17%
0% 10% 20% 30% 40% 50% 60% 70% 80% 90% 100%
Repeat Buyers
First-time Buyers
All Buyers
Much more difficult than expected Somewhat more difficult than expected
Not difficult/No more difficult than expected Easier than expected
The 2015 National Association of Realtors® Profile of Home Buyers and Selle Chapter 5, Page 14 o

FINANCING THE HOME PURCHASE
Exhibit 5-14
(Percentage Distribution Among those who Financed their Home Purchase)
Ohio
All Buyers
Married
couple
Single
female
Single
male
Unmarried
couple Other
Much more difficult than expected 14% 13% 19% 12% 13% *
Somewhat more difficult than expected 20 19 21 24 16 67
Not difficult/No more difficult than expected 43 47 44 41 32 *
Easier than expected 23 21 17 24 39 33
* Less than 1 percent
U.S.
Other
Unmarrie
d couple
Single
male
Single
female
Married
couple
All
Buyers
Much more difficult than expected 18% 15% 17% 18% 15% 16%
Somewhat more difficult than expected 28% 28% 28% 18% 24% 24%
Not difficult/No more difficult than expected 37% 41% 37% 43% 44% 43%
Easier than expected 17% 16% 17% 21% 17% 17%
ADULT COMPOSITION OF HOUSEHOLD
ADULT COMPOSITION OF HOUSEHOLD
DIFFICULTY OF MORTGAGE APPLICATION AND APPROVAL PROCESS, BY ADULT COMPOSITION OF
HOUSEHOLD
18%
15%
17%
18%
15%
16%
28%
28%
28%
18%
24%
24%
37%
41%
37%
43%
44%
43%
17%
16%
17%
21%
17%
17%
0% 10% 20% 30% 40% 50% 60% 70% 80% 90% 100%
Other
Unmarried couple
Single male
Single female
Married couple
All Buyers
Much more difficult than expected Somewhat more difficult than expected
Not difficult/No more difficult than expected Easier than expected
The 2015 National Association of Realtors® Profile of Home Buyers and Selle Chapter 5, Page 15 o

FINANCING THE HOME PURCHASE
Exhibit 5-15
BUYERS WHO HAVE STUDENT LOAN DEBT
(Percenage Distribution)
Ohio
All Buyers
First-time
Buyers Repeat Buyers
Have student loan debt 33% 53% 20%
Under $10,000 22% 25% 17%
$10,000 to $24,999 24 20 31
$25,000 to $49,999 16 20 9
$50,000 to $74,999 17 14 23
$75,000 or more 20 20 20
Median amount of
student loan debt
$26,000 $29,000 $29,000
U.S.
All Buyers
First-time
Buyers Repeat Buyers
Have student loan debt 25% 41% 17%
Under $10,000 21% 21% 22%
$10,000 to $24,999 28 28 29
$25,000 to $49,999 22 21 23
$50,000 to $74,999 13 12 13
$75,000 or more 16 19 13
Median amount of
student loan debt
$25,000 $25,000 $25,000
The 2015 National Association of Realtors® Profile of Home Buyers and Selle Chapter 5, Page 16 o

FINANCING THE HOME PURCHASE
Exhibit 5-16
BUYER PREVIOUSLY SOLD A DISTRESSED PROPERTY (SHORT SALE OR FORECLOSURE)
(Percentage Distribution)
Ohio
All Buyers
Previously had a distressed property sale 7%
Median year of sale 2010
U.S.
All BuyersPreviously had a distressed property
sale 9%
Median year of sale 2010
The 2015 National Association of Realtors® Profile of Home Buyers and Selle Chapter 5, Page 17 o

FINANCING THE HOME PURCHASE
Exhibit 5-17
TYPE OF MORTGAGE, FIRST-TIME AND REPEAT BUYERS
(Percentage Distribution Among those who Financed their Home Purchase)
Ohio
All Buyers
First-time
Buyers Repeat Buyers
Fixed-rate mortgage 75% 81% 71%
Fixed-then adjustable rate mortgage 4% 6% 3%
Adjustable-rate mortgage 2 1 3
Don't know 2 5 1
Other 1 1 1
* Less than 1 percent
U.S.
Repeat
Buyers
First-time
Buyers All Buyers
Fixed-rate mortgage 92% 91% 91%
Fixed-then adjustable rate mortgage 4% 3% 4%
Adjustable-rate mortgage 2% 2% 2%
Don't know 1% 4% 2%
Other 1% 1% 1%
* Less than 1 percent
92%
91%
91%
4%
3%
4%
2%
2%
2%
1%
4%
2%
1%
1%
1%
84% 86% 88% 90% 92% 94% 96% 98% 100%
Repeat Buyers
First-time Buyers
All Buyers
Fixed-rate mortgage Fixed-then adjustable rate mortgage
Adjustable-rate mortgage Don't know
Other
The 2015 National Association of Realtors® Profile of Home Buyers and Selle Chapter 5, Page 18 o

FINANCING THE HOME PURCHASE
Exhibit 5-18
TYPE OF LOAN, FIRST-TIME AND REPEAT BUYERS
(Percentage Distribution Among those who Financed their Home Purchase)
Ohio
All Buyers
First-time
Buyers Repeat Buyers
Conventional 53% 38% 65%
VA 12 13 11
FHA 29 44 18
Don't know 3 4 3
Other 3 2 4
* Less than 1 percent
U.S.
Repeat
Buyers
First-time
Buyers All Buyers
Conventional 66% 47% 59%
FHA 16% 34% 23%
VA 13% 9% 11%
Don't Know 3% 6% 4%
Other 3% 5% 3%
66%
47%
59%
16%
34%
23%
13%
9%
11%
3%
6%
4%
3%
5%
3%
0% 10% 20% 30% 40% 50% 60% 70% 80% 90% 100%
Repeat Buyers
First-time Buyers
All Buyers
Conventional FHA VA Don't Know Other
The 2015 National Association of Realtors® Profile of Home Buyers and Selle Chapter 5, Page 19 o

FINANCING THE HOME PURCHASE
Exhibit 5-19
(Percentage Distribution)
Ohio
All Buyers
First-time
Buyers
Repeat
Buyers
New
Homes
Previously
Owned Homes
Good financial investment 73% 72% 73% 90% 72%
Better than stocks 38 48 31 42 38
About as good as stocks 23 15 28 21 23
Not as good as stocks 12 9 14 26 11
Not a good financial investment 8 7 10 5 9
Don’t know 19 21 18 5 19
* Less than 1 percent
U.S.
All Buyers
First-time
Buyers
Repeat
Buyers
New
Homes
Previously
Owned Homes
Good financial investment 80% 84% 78% 82% 80%
Better than stocks 43 48 40 42 43
About as good as stocks 25 25 26 25 26
Not as good as stocks 12 11 12 15 11
Not a good financial investment 6 3 7 6 6
Don't know 14 13 15 13 15
BUYERS' VIEW OF HOMES AS A FINANCIAL INVESTMENT, FIRST-TIME AND REPEAT BUYERS,
AND BUYERS OF NEW AND PREVIOUSLY OWNED HOMES
BUYERS OF
BUYERS OF
The 2015 National Association of Realtors® Profile of Home Buyers and Selle Chapter 5, Page 20 o

FINANCING THE HOME PURCHASE
Exhibit 5-20
BUYERS' VIEW OF HOMES AS A FINANCIAL INVESTMENT, BY ADULT COMPOSITION OF HOUSEHOLD
(Percentage Distribution)
Ohio
All Buyers
Married
couple
Single
female
Single
male
Unmarried
couple Other
Good financial investment 73% 76% 63% 63% 86% 40%
Better than stocks 38 39 32 21 49 20
About as good as stocks 23 23 22 32 23 20
Not as good as stocks 12 13 9 11 14 *
Not a good financial investment 8 7 12 11 6 20
Don’t know 19 17 25 26 9 40
* Less than 1 percent
U.S.
All Buyers
Married
couple
Single
female
Single
male
Unmarried
couple Other
Good financial investment 80% 80% 79% 79% 83% 74%
Better than stocks 43 42 47 42 44 50
About as good as stocks 25 26 23 25 28 18
Not as good as stocks 12 12 9 12 11 6
Not a good financial investment 6 6 6 5 5 6
Don't know 14 14 15 16 13 20
ADULT COMPOSITION OF HOUSEHOLD
ADULT COMPOSITION OF HOUSEHOLD
The 2015 National Association of Realtors® Profile of Home Buyers and Selle Chapter 5, Page 21 o

HOME SELLERS AND THEIR SELLING EXPERIENCE
Exhibit 6-1 AGE OF HOME SELLERS, BY REGION
Exhibit 6-2 HOUSEHOLD INCOME OF HOME SELLERS, 2014
Exhibit 6-3 ADULT COMPOSITION OF HOME SELLER HOUSEHOLDS
Exhibit 6-4 NUMBER OF CHILDREN UNDER THE AGE OF 18 RESIDING IN HOME SELLER HOUSEHOLD
Exhibit 6-5 RACE/ETHNICITY OF HOME SELLERS, BY REGION
Exhibit 6-6 PRIMARY LANGUAGE SPOKEN IN HOME SELLER HOUSEHOLD, BY REGION
Exhibit 6-7 HOME SELLING SITUATION AMONG REPEAT BUYERS
Exhibit 6-8 FIRST-TIME OR REPEAT SELLER
Exhibit 6-9 HOMES SOLD AND FOR SALE, BY REGION
Exhibit 6-10 LOCATION OF HOME SOLD
Exhibit 6-11 PROXIMITY OF HOME SOLD TO HOME PURCHASED
Exhibit 6-12 TYPE OF HOME SOLD, BY LOCATION
Exhibit 6-13 SIZE OF HOME PURCHASED COMPARED TO HOME RECENTLY SOLD
Exhibit 6-14 SIZE OF HOME PURCHASED COMPARED TO HOME RECENTLY SOLD, BY AGE OF SELLER
Exhibit 6-15 NUMBER OF BEDROOMS AND BATHROOMS BY ADULT COMPOSITION OF HOUSEHOLD
AND CHILDREN IN HOUSEHOLD
Exhibit 6-16 AGE OF HOME PURCHASED COMPARED TO HOME RECENTLY SOLD
Exhibit 6-17 PRICE OF HOME PURCHASED COMPARED TO HOME RECENTLY SOLD
Exhibit 6-18 PRICE OF HOME PURCHASED COMPARED TO HOME RECENTLY SOLD, BY AGE OF SELLER
Exhibit 6-19 PRIMARY REASON FOR SELLING PREVIOUS HOME, BY MILES MOVED
Exhibit 6-20 PRIMARY REASON FOR SELLING PREVIOUS HOME, BY FIRST-TIME AND REPEAT SELLERS
Exhibit 6-21 SELLER WANTED TO SELL EARLIER BUT WAITED OR STALLED BECAUSE HOME WAS WORTH
LESS THAN MORTGAGE, BY FIRST-TIME AND REPEAT SELLERS
Exhibit 6-22 SELLER WANTED TO SELL EARLIER BUT WAITED OR STALLED BECAUSE HOME WAS WORTH
LESS THAN MORTGAGE, BY TENURE IN HOME
Exhibit 6-23 TENURE IN PREVIOUS HOME
Exhibit 6-24 TENURE IN PREVIOUS HOME, BY AGE OF SELLER
Exhibit 6-25 DISTANCE BETWEEN HOME PURCHASED AND HOME RECENTLY SOLD, BY REGION
Exhibit 6-26 DISTANCE BETWEEN HOME PURCHASED AND HOME RECENTLY SOLD, BY AGE
Exhibit 6-27 METHOD USED TO SELL HOME, BY REGION
Exhibit 6-28 METHOD USED TO SELL HOME, BY SELLER URGENCY
Exhibit 6-29 METHOD OF SALE, BY BUYER AND SELLER RELATIONSHIP
Exhibit 6-30 METHOD USED TO SELL HOME, 2001-2015
Exhibit 6-31 SALES PRICE COMPARED WITH LISTING PRICE, BY REGION
Exhibit 6-32 SALES PRICE COMPARED WITH LISTING PRICE, BY SELLER URGENCY
Exhibit 6-33 NUMBER OF WEEKS RECENTLY SOLD HOME WAS ON THE MARKET, BY REGION
Exhibit 6-34 SALES PRICE COMPARED WITH LISTING PRICE, BY NUMBER OF WEEKS HOME WAS ON THE
MARKET
Exhibit 6-35 NUMBER OF TIMES ASKING PRICE WAS REDUCED, BY NUMBER OF WEEKS HOME WAS ON
THE MARKET
Exhibit 6-36 INCENTIVES OFFERED TO ATTRACT BUYERS, BY REGION
Exhibit 6-37 INCENTIVES OFFERED TO ATTRACT BUYERS, BY NUMBER OF WEEKS HOME WAS ON THE
MARKET
Exhibit 6-38 EQUITY EARNED IN HOME RECENTLY SOLD, BY TENURE IN HOME
Exhibit 6-39 SATISFACTION WITH THE SELLING PROCESS
The 2015 National Association of Realtors® Profile of Home Buyers and

HOME SELLERS AND THEIR SELLING EXPERIENCE
Exhibit 6-1
AGE OF HOME SELLERS, BY REGION
(Percentage Distribution)
U.S. Northeast Midwest South West
18 to 34 years 16% 15% 11% 17% 14% 18%
35 to 44 years 18 17 19 23 18 17
45 to 54 years 22 15 18 16 15 17
55 to 64 years 15 20 24 21 22 20
65 to 74 years 21 21 21 18 26 25
75 years or older 7 5 7 6 6 4
Median age (years) 51 54 55 51 55 54
* Less than 1 percent
SELLERS WHO SOLD A HOME IN THE
Ohio
The 2015 National Association of Realtors® Profile of Home Buyers and

HOME SELLERS AND THEIR SELLING EXPERIENCE
Exhibit 6-2
HOUSEHOLD INCOME OF HOME SELLERS, 2014
(Percentage Distribution)
U.S. Northeast Midwest South West
Less than $25,000 2% 2% 2% 2% 3% 2%
$25,000 to $34,999 8 4 3 5 3 4
$35,000 to $44,999 13 5 3 5 5 6
$45,000 to $54,999 5 6 7 6 5 6
$55,000 to $64,999 5 6 4 5 6 8
$65,000 to $74,999 11 8 7 10 6 9
$75,000 to $84,999 8 8 8 9 7 9
$85,000 to $99,999 9 10 12 10 10 9
$100,000 to $124,999 19 18 18 17 17 19
$125,000 to $149,999 7 12 12 12 13 11
$150,000 to $174,999 5 7 6 6 9 4
$175,000 to $199,999 2 4 4 2 5 4
$200,000 or more 7 11 13 11 11 10
Median income (2014) $76,200 $104,139 $108,306 $99,970 $111,721 $98,300
SELLERS WHO SOLD A HOME IN THE
Ohio
The 2015 National Association of Realtors® Profile of Home Buyers and

HOME SELLERS AND THEIR SELLING EXPERIENCE
Exhibit 6-3
ADULT COMPOSITION OF HOME SELLER HOUSEHOLDS
(Percentage Distribution)
Ohio
2015
Married couple 77%
Single female 17
Single male 2
Unmarried couple 4
Other *
* Less than 1 percent
U.S.
2004 2005 2006 2007 2008 2009 2010 2011 2012 2013 2014 2015
Married couple 74% 71% 72% 75% 74% 75% 75% 77% 76% 77% 74% 77%
Single female 15 17 17 15 15 14 16 16 14 14 14 12
Single male 5 6 6 6 7 6 6 6 5 5 7 6
Unmarried couple 5 3 4 3 3 4 3 3 4 4 4 4
Other 1 1 1 1 1 1 1 1 1 1 1 2
74%71% 72%
75% 74% 75% 75%77% 76% 77%
74%77%
1517 17
15 15 1416 16
14 14 1412
5 6 6 6 7 6 6 6 5 57 65
3 4 3 3 4 3 3 4 4 4 41 1 1 1 1 1 1 1 1 1 1 2
0%
10%
20%
30%
40%
50%
60%
70%
80%
90%
2004 2005 2006 2007 2008 2009 2010 2011 2012 2013 2014 2015
Married couple Single female Single male Unmarried couple Other
The 2015 National Association of Realtors® Profile of Home Buyers and

HOME SELLERS AND THEIR SELLING EXPERIENCE
Exhibit 6-4
NUMBER OF CHILDREN UNDER THE AGE OF 18 RESIDING IN HOME SELLER HOUSEHOLD
(Percentage Distribution of Home Seller Households)
One 15%
Two 16%
Three or more 8%
None 61%
U.S.
One 13%
Two 16%
Three or more 6%
None 65%
Ohio
One, 15%
Two, 16%
Three or more, 8%
None, 61%
NUMBER OF CHILDREN UNDER THE AGE OF 18 RESIDING IN HOME SELLER HOUSEHOLD
(Percentage Distribution)
WISC
Ohio
One, 13%
Two, 16%
Three or more, 6%None, 65%
NUMBER OF CHILDREN UNDER THE AGE OF 18 RESIDING IN HOME SELLER HOUSEHOLD
(Percentage Distribution)
U.S.
The 2015 National Association of Realtors® Profile of Home Buyers and

HOME SELLERS AND THEIR SELLING EXPERIENCE
Exhibit 6-5
RACE/ETHNICITY OF HOME SELLERS, BY REGION
(Percent of Respondents)
U.S. Northeast Midwest South West
White/Caucasian 99% 91% 93% 95% 91% 86%
Asian/Pacific Islander * 3 2 2 2 7Hispanic/Latino/Mexican/
Puerto Rican 1 4 4 2 4 6
Black/African-American 1 2 1 2 3 1
Other * 1 * 1 1 2
* Less than 1 percent
Note: Respondents were permitted to select as many races and ethnicities as they felt applicable.
The percentage distribution may therefore sum to more than 100 percent.
SELLERS WHO SOLD A HOME IN THE
Ohio
The 2015 National Association of Realtors® Profile of Home Buyers and

HOME SELLERS AND THEIR SELLING EXPERIENCE
Exhibit 6-6
PRIMARY LANGUAGE SPOKEN IN HOME SELLER HOUSEHOLD, BY REGION
(Percentage Distribution)
U.S. Northeast Midwest South West
English 100% 98% 99% 99% 99% 97%
Other * 2 1 1 1 3
SELLERS WHO SOLD A HOME IN THE
Ohio
The 2015 National Association of Realtors® Profile of Home Buyers and

HOME SELLERS AND THEIR SELLING EXPERIENCE
Exhibit 6-7
HOME SELLING SITUATION AMONG REPEAT BUYERS
(Percentage Distribution)
Sold in 2015 33%
Sold in 2014 24%
Sold in 2013 or
earlier
16%
Home has not yet
sold and is
currently vacant
9%
Home has not yet
sold, but currently
renting to others
3%
Do not plan to sell
previous home
11%
Did not own
previous home
4%
U.S.
Sold in 2015 30%
Sold in 2014 36%
Sold in 2013 or
earlier
15%
Home has not yet
sold and is
currently vacant
3%
Home has not yet
sold, but currently
renting to others
3%
Do not plan to sell
previous home
7%
Did not own
previous home
5%
Ohio
Sold in 2015, 30%
Sold in 2014, 36%
Sold in 2013 or earlier, 15%
Home has not yet sold and is
currently vacant, 3%
Home has not yet sold, but
currently renting to
others, 3%
Do not plan to sell previous home, 7% Did not own
previous home, 5%
HOME SELLING SITUATION AMONG REPEAT BUYERS(Percentage Distribution
U.S.
Sold in 2015, 33%
Sold in 2014, 24%
Sold in 2013 or earlier, 16%
Home has not yet sold and is
currently vacant, 9%
Home has not yet sold, but
currently renting to
others, 3%
Do not plan to sell previous home, 11%
Did not own previous home,
4%
HOME SELLING SITUATION AMONG REPEAT BUYERS(Percentage Distribution
Ohio
The 2015 National Association of Realtors® Profile of Home Buyers and

HOME SELLERS AND THEIR SELLING EXPERIENCE
Exhibit 6-8
FIRST-TIME OR REPEAT SELLER
(Percentage Distribution)
First-time
seller 44%
Repeat
seller
56%
U.S.
First-time
seller
37%
Repeat
seller
63%
Ohio
First-time seller, 37%
Repeat seller, 63%
FIRST-TIME OR REPEAT SELLER(Percentage Distribution
U.S.
First-time seller, 44%
Repeat seller, 56%
FIRST-TIME OR REPEAT SELLER(Percentage Distribution
The 2015 National Association of Realtors® Profile of Home Buyers and

HOME SELLERS AND THEIR SELLING EXPERIENCE
Exhibit 6-9
HOMES SOLD AND FOR SALE, BY REGION
(Percentage Distribution)
U.S.
Homes
Sold
Home has not
yet sold and is
currently vacant
Home has not yet
sold, but currently
renting to others
Northeast 14% 17% 16%
Midwest 22 27 19
South 40 47 44
West 24 10 22
The 2015 National Association of Realtors® Profile of Home Buyers and

HOME SELLERS AND THEIR SELLING EXPERIENCE
Exhibit 6-10
LOCATION OF HOME SOLD
(Percentage Distribution)
Ohio
Homes Sold
Home has not
yet sold and is
currently vacant
Home has not yet
sold, but currently
renting to others
Suburb/Subdivision 38% 50% *
Small town 25 13 100
Urban area/Central city 9 19 *
Rural area 28 19 *
Resort/Recreation area * * *
* Less than 1 percent
U.S.
Homes Sold
Home has not
yet sold and is
currently vacant
Home has not yet
sold, but currently
renting to others
Suburb/Subdivision 49% 39% 47%
Small town 19 26 23
Urban area/Central city 16 16 9
Rural area 14 18 18
Resort/Recreation area 3 1 3
The 2015 National Association of Realtors® Profile of Home Buyers and

HOME SELLERS AND THEIR SELLING EXPERIENCE
Exhibit 6-11
PROXIMITY OF HOME SOLD TO HOME PURCHASED
(Percentage Distribution)
Ohio
Same state 77%
Same region 7%
Other region 17%
U.S.
Same state 70%
Same region 13%
Other region 17%
Same state, 77%
Same region, 7%
Other region, 17%
PROXIMITY OF HOME SOLD TO HOME PURCHASED(Percentage Distribution of Households)
WISC
Ohio
Same state, 70%
Same region, 13%
Other region, 17%
PROXIMITY OF HOME SOLD TO HOME PURCHASED(Percentage Distribution of Households)
U.S.
The 2015 National Association of Realtors® Profile of Home Buyers and

HOME SELLERS AND THEIR SELLING EXPERIENCE
Exhibit 6-12
TYPE OF HOME SOLD, BY LOCATION
(Percentage Distribution)
Ohio
All
Sellers
Suburb/
Subdivision
Small
town
Urban/
Central city
Rural
area
Resort/
Recreation
area
Detached single-family home 84% 93% 73% 80% 80% *
Townhouse/row house 2 * 4 10 * *Apartment/condo in a building
with 5 or more units2 * 4 * * *
Duplex/apartment/condo in 2 to
4 unit building1 3 * * * *
Other 11 5 19 10 20 *
U.S.
All
Sellers
Suburb/
Subdivision
Small
town
Urban/
Central city
Rural
area
Resort/
Recreation
area
Detached single-family home 82% 86% 83% 70% 81% 58%
Townhouse/row house 6 7 4 8 3 12
Apartment/condo in a building
with 5 or more units5 4 3 14 2 12
Duplex/apartment/condo in 2 to
4 unit building2 1 3 4 * 3
Other 6 3 8 5 15 16
* Less than 1 percent
SELLERS WHO SOLD A HOME IN A
SELLERS WHO SOLD A HOME IN A
The 2015 National Association of Realtors® Profile of Home Buyers and

HOME SELLERS AND THEIR SELLING EXPERIENCE
Exhibit 6-13
SIZE OF HOME PURCHASED COMPARED TO HOME RECENTLY SOLD
(Percentage Distribution)
Ohio
1,000 sq ft or
less
1,001 sq ft to
1,500 sq ft
1,501 sq ft to
2,000 sq ft
2,001 sq ft to
2,500 sq ft
2,501 sq ft to
3,000 sq ft
More than
3,000 sq ft1,000 sq ft or less * * 8% * * *
1,001 to 1,500 sq ft * 33 13 21 19 8
1,501 to 2,000 sq ft * 40 25 26 31 21
2,001 to 2,500 sq ft 100 13 23 19 23 25
2,501 to 3,000 sq ft * 7 23 17 8 17
More than 3,000 sq ft * 7 10 17 19 29
U.S.
1,000 sq ft or
less
1,001 sq ft to
1,500 sq ft
1,501 sq ft to
2,000 sq ft
2,001 sq ft to
2,500 sq ft
2,501 sq ft to
3,000 sq ft
More than
3,000 sq ft1,000 sq ft or less * * * * * *
1,001 to 1,500 sq ft * 2 5 4 2 1
1,501 to 2,000 sq ft * 2 6 6 5 4
2,001 to 2,500 sq ft * 2 5 8 5 6
2,501 to 3,000 sq ft * 1 3 6 4 4
More than 3,000 sq ft * * 2 6 4 9
42% Trading Up
* Less than 1 percent 29% Remaining at the same size range
31% Trading Down
SIZE OF
HOME SOLD
SIZE OF HOME PURCHASED
SIZE OF HOME PURCHASED
SIZE OF
HOME SOLD
The 2015 National Association of Realtors® Profile of Home Buyers and

HOME SELLERS AND THEIR SELLING EXPERIENCE
Exhibit 6-14
SIZE OF HOME PURCHASED COMPARED TO HOME RECENTLY SOLD, BY AGE OF SELLER
(Median Square Feet)
U.S.
Size of home
sold
Size of home
purchased Difference
18 to 34 years 1,600 2,200 600
35 to 44 years 1,900 2,600 700
45 to 54 years 2,200 2,300 100
55 to 64 years 2,000 2,000 *
65 to 74 years 2,200 2,000 -200
75 years or older 2,000 1,800 -200
The 2015 National Association of Realtors® Profile of Home Buyers and

HOME SELLERS AND THEIR SELLING EXPERIENCE
Exhibit 6-15
NUMBER OF BEDROOMS AND BATHROOMS BY ADULT COMPOSITION OF HOUSEHOLD AND CHILDREN IN HOUSEHOLD
(Precentage Distribution)
Ohio
All Sellers
Married
couple
Single
female
Single
male
Unmarried
couple Other
Children
under 18
in home
No
children
in home
One bedroom * * * * * * * *
Two bedrooms 16 14 22 * 25 * 7 21
Three bedrooms or more 84 86 78 100 75 * 93 79
Median number of bedrooms 3 3 3 3 3 3 3 3
One full bathroom 23 24 22 * 25 * 27 21
Two full bathrooms 57 61 39 100 50 * 66 51
Three full bathrooms or more 20 16 39 * 25 * 7 29
Median number of full bathrooms 2 2 2 2 2 2 2 2
U.S.
All Sellers
Married
couple
Single
female
Single
male
Unmarried
couple Other
Children
under 18
in home
No
children
in home
One bedroom 1% 1% 2% 1% * * * 1%
Two bedrooms 12 10 17 21 17 16 8 14
Three bedrooms or more 88 89 81 79 84 84 92 85
Median number of bedrooms 3 3 3 3 3 3 3 3
One full bathroom 13 12 17 15 18 11 14 13
Two full bathrooms 58 58 58 60 62 59 58 58
Three full bathrooms or more 29 30 25 25 20 30 28 29
Median number of full bathrooms 2 2 2 2 2 2 2 2
* Less than 1 percent
ADULT COMPOSITION OF HOUSEHOLD
ADULT COMPOSITION OF HOUSEHOLD CHILDREN IN HOME
CHILDREN IN HOME
The 2015 National Association of Realtors® Profile of Home Buyers and

HOME SELLERS AND THEIR SELLING EXPERIENCE
Exhibit 6-16
AGE OF HOME PURCHASED COMPARED TO HOME RECENTLY SOLD
(Percentage Distribution)
Ohio
2014
2010
through
2013
2006
through
2009
2001
through
2005
1986
through
2000
1960
through
1985
1912
through
1959
1750
through
1911
2014 * * * * * * * *
2010 through 2013 * * * * * * * *
2006 through 2009 * * * * * * * *
2001 through 2005 * * * * * * * *
1986 through 2000 * * * * * * * *
1960 through 1985 * * * * * * * *
1912 through 1959 * * * * * * * *
1750 through 1911 * * * * * * * *
* Less than 1 percent
U.S.
2014
2010
through
2013
2006
through
2009
2001
through
2005
1986
through
2000
1960
through
1985
1912
through
1959
1750
through
1911
2014 * * * * * * * *
2010 through 2013 2 3 * * 2 2 * *
2006 through 2009 5 * 1 1 1 1 * *
2001 through 2005 5 3 3 3 4 4 1 *
1986 through 2000 4 1 3 4 5 5 4 *
1960 through 1985 5 1 2 3 4 7 2 *
1912 through 1959 1 * * 1 1 4 2 *
1750 through 1911 * * * * 1 * 1 *
* Less than 1 percent
27% Purchased Older Home
21% Purchased a Home the Same Age
54% Purchased a Newer Home
YEAR PURCHASED HOME WAS BUILT
Year home sold was built
YEAR PURCHASED HOME WAS BUILT
Year home sold was built
The 2015 National Association of Realtors® Profile of Home Buyers and

HOME SELLERS AND THEIR SELLING EXPERIENCE
Exhibit 6-17
PRICE OF HOME PURCHASED COMPARED TO HOME RECENTLY SOLD
(Percentage Distribution)
Ohio
Less than
$100,000
$100,000
to
$149,999
$150,000
to
$199,999
$200,000
to
$249,999
$250,000
to
$299,999
$300,000
to
$349,999
$350,000
to
$399,999
$400,000
to
$499,999
$500,000
or more
Less than $100,000 57 47 41 28 7 * 43 25 *
$100,000 to $149,999 24 17 11 17 20 * 14 * *
$150,000 to $199,999 10 20 37 17 33 25 * * *
$200,000 to $249,999 5 10 4 6 7 75 14 25 *
$250,000 to $299,999 * * 4 6 20 * * * *
$300,000 to $349,999 5 3 * 11 * * * * *
$350,000 to $399,999 * * * 17 7 * * 25 *
$400,000 to $499,999 * * 4 * 7 * * 25 *
$500,000 or more * 3 * * * * 29 * *
U.S.
Less than
$100,000
$100,000
to
$149,999
$150,000
to
$199,999
$200,000
to
$249,999
$250,000
to
$299,999
$300,000
to
$349,999
$350,000
to
$399,999
$400,000
to
$499,999
$500,000
or more
Less than $100,000 2% 2% 2% 1% * * * * *
$100,000 to $149,999 1 3 4 3 2 * 1 * *
$150,000 to $199,999 1 2 3 4 3 2 1 1 *
$200,000 to $249,999 * 1 3 3 3 1 2 1 *
$250,000 to $299,999 * * 2 1 2 2 2 2 1
$300,000 to $349,999 * * 1 4 1 1 1 1 1
$350,000 to $399,999 * * 1 1 1 1 1 1 1
$400,000 to $499,999 * * * 1 1 1 * 1 2
$500,000 or more * * * 1 1 1 1 2 7
* Less than 1 percent 47% Trading Up
23% Remaining at the same price range
30% Trading Down
PRICE OF
HOME
SOLD
PRICE OF
HOME
SOLD
PRICE OF HOME PURCHASED
PRICE OF HOME PURCHASED
The 2015 National Association of Realtors® Profile of Home Buyers and

HOME SELLERS AND THEIR SELLING EXPERIENCE
Exhibit 6-18
PRICE OF HOME PURCHASED COMPARED TO HOME RECENTLY SOLD, BY AGE OF SELLER
(Median)
U.S.
Price of home
sold
Price of home
purchased Difference
18 to 34 years $190,000 $260,000 $70,000
35 to 44 years $233,000 $308,000 $75,000
45 to 54 years $265,000 $289,000 $24,000
55 to 64 years $250,000 $255,000 $5,000
65 to 74 years $278,000 $220,000 -$58,000
75 years or older $240,000 $207,000 -$33,000
The 2015 National Association of Realtors® Profile of Home Buyers and

HOME SELLERS AND THEIR SELLING EXPERIENCE
Exhibit 6-19
PRIMARY REASON FOR SELLING PREVIOUS HOME, BY MILES MOVED
(Percentage Distribution)
Ohio
All Sellers
10 miles
or less
11 to 20
miles
21 to 50
miles
51 to 100
miles
101 to 500
miles
501 miles
or more
Job relocation 9% * 5% * * 56% 61%
Home is too small 18 26 5 15 * * 3
Change in family situation (e.g., marriage, birth of a child,
divorce)
8 14 15 * * 11 3
Want to move closer to friends or family 15 5 * 31 50 22 19
Neighborhood has become less desirable 10 10 15 23 25 * 3
Home is too large 14 24 5 8 * * *
Moving due to retirement 3 2 * * * 11 3
Want to move closer to current job 5 * 15 8 25 * 3
Upkeep of home is too difficult due to health or financial
limitations
7 2 25 * * * *
Can not afford the mortgage and other expenses of owning
home
3 5 * * * * 3
Other 10 12 15 15 * * *
U.S.
All Sellers
10 miles
or less
11 to 20
miles
21 to 50
miles
51 to 100
miles
101 to 500
miles
501 miles
or more
Home is too small 16% 30% 19% 11% 4% 1% 1%
Job relocation 14 3 4 6 19 31 38
Want to move closer to friends or family 13 3 7 13 18 28 24
Neighborhood has become less desirable 10 13 17 19 4 1 3
Change in family situation (e.g., marriage, birth of a child,
divorce)
10 15 11 10 4 5 4
Home is too large 9 14 11 7 8 2 2
Moving due to retirement 7 3 2 7 12 11 16
Upkeep of home is too difficult due to health or financial
limitations
6 4 8 2 8 17 2
Want to move closer to current job 5 2 11 14 18 2 1
Can not afford the mortgage and other expenses of owning
home
2 3 2 3 1 1 2
To avoid possible foreclosure * * * * * * *
Other 8 11 7 7 4 1 7
* Less than 1 percent
MILES MOVED
AGE OF HOME SELLER
The 2015 National Association of Realtors® Profile of Home Buyers and

HOME SELLERS AND THEIR SELLING EXPERIENCE
Exhibit 6-20
PRIMARY REASON FOR SELLING PREVIOUS HOME, BY FIRST-TIME AND REPEAT SELLERS
(Percentage Distribution)
Ohio
All Sellers First-time Seller Repeat Seller
Home is too small 18% 23% 9%
Job relocation 9 9 11
Want to move closer to friends or
family
15 16 16
Neighborhood has become less
desirable
10 11 11
Home is too large 14 5 16
Change in family situation (e.g.,
marriage, birth of a child, divorce)
8 11 9
Moving due to retirement 3 * 4
Want to move closer to current job 5 5 5
Upkeep of home is too difficult due
to health or financial limitations
7 2 9
Can not afford the mortgage and
other expenses of owning home
3 2 4
To avoid possible foreclosure * * *
Other 10 16 7
U.S.
All Sellers First-time Seller Repeat Seller
Home is too small 16% 29% 8%
Job relocation 14 14 15
Want to move closer to friends or
family
13 8 16
Neighborhood has become less
desirable
10 13 8
Change in family situation (e.g.,
marriage, birth of a child, divorce)
10 10 10
Home is too large 9 4 11
Moving due to retirement 7 4 9
Upkeep of home is too difficult due
to health or financial limitations
6 2 8
Want to move closer to current job 5 6 5
Can not afford the mortgage and
other expenses of owning home
2 1 3
To avoid possible foreclosure * * *
Other 8 8 8
* Less than 1 percent
The 2015 National Association of Realtors® Profile of Home Buyers and

HOME SELLERS AND THEIR SELLING EXPERIENCE
Exhibit 6-21
SELLER WANTED TO SELL EARLIER BUT WAITED OR STALLED BECAUSE HOME WAS
WORTH LESS THAN MORTGAGE, BY FIRST-TIME AND REPEAT SELLERS
(Percentage Distribution)
Ohio
All Sellers
First-time
Seller
Repeat
Seller
Yes, and lived in home 11% 11% 11%
Yes, but rented home to
others and lived elsewhere
2 2 2
No, sold home when I
wanted to sell
88 87 88
U.S.
All Sellers
First-time
Seller
Repeat
Seller
Yes, and lived in home 12% 14% 11%
Yes, but rented home to
others and lived elsewhere
2 2 2
No, sold home when I
wanted to sell
87 85 88
12% 14% 11%
22
2
87 85 88
0%
10%
20%
30%
40%
50%
60%
70%
80%
90%
100%
All Sellers First-time Seller Repeat Seller
Yes, and lived in home Yes, but rented home to others and lived elsewhere No, sold home when I wanted to sell
The 2015 National Association of Realtors® Profile of Home Buyers and

HOME SELLERS AND THEIR SELLING EXPERIENCE
Exhibit 6-22
SELLER WANTED TO SELL EARLIER BUT WAITED OR STALLED BECAUSE HOME WAS WORTH LESS THAN MORTGAGE, BY TENURE IN HOME
(Percentage Distribution)
Ohio
All Sellers
1 year or
less
2 to 3
years
4 to 5
years
6 to 7
years
8 to 10
years
11 to 15
years
16 to 20
years
21 years
or more
Yes, and lived in home 11% * * * * 29% * 15% 14%
Yes, but rented home to others
and lived elsewhere
2 * * * * 14 * * 4
No, sold home when I wanted
to sell
88 100 100 * 100 57 100 85 82
U.S.
All Sellers
3 years
or less
4 to 5
years
6 to 7
years
8 to 10
years
11 to 15
years
16 to 20
years
21 years
or more
Yes, and lived in home 12% 5% 5% 15% 26% 13% 9% 8%
Yes, but rented home to others
and lived elsewhere
2 1 1 3 3 1 1 *
No, sold home when I wanted
to sell
87 94 94 82 70 87 91 92
* Less than 1 percent
12%5% 5%
15%
26%
13%9% 8%
2
1 1
3
3
11 0
87
94 94
82
70
8791 92
0%
10%
20%
30%
40%
50%
60%
70%
80%
90%
100%
All Sellers 3 years or less 4 to 5 years 6 to 7 years 8 to 10 years 11 to 15 years 16 to 20 years 21 years or more
Yes, and lived in home Yes, but rented home to others and lived elsewhere No, sold home when I wanted to sell
The 2015 National Association of Realtors® Profile of Home Buyers and

HOME SELLERS AND THEIR SELLING EXPERIENCE
Exhibit 6-23
TENURE IN PREVIOUS HOME
(Percentage Distribution)
Ohio
All Types
1 year or less 2%
2 to 3 years 8
4 to 5 years 10
6 to 7 years 15
8 to 10 years 9
11 to 15 years 24
16 to 20 years 12
21 years or more 21
Median 12
U.S.
All Types
Cabin/
cottage
Duplex/
apartment/
condo in
2-4 unit
structure
Apartment/
condo in
building with
5 or more
units
Townhouse/
row house
Detached
single-
family
home
Mobile/
manufactured
home Other
1 year or less 4% * * 6% 1% 4% 1% 8%
2 to 3 years 10 5 23 11 17 9 13 3
4 to 5 years 13 10 18 22 11 13 9 6
6 to 7 years 14 10 23 16 20 14 10 5
8 to 10 years 15 19 13 20 20 15 13 16
11 to 15 years 19 19 20 16 22 19 27 11
16 to 20 years 9 10 * 1 8 10 17 11
21 years or more 16 29 5 9 3 17 10 40
Median 9 14 6 7 8 9 12 16
* Less than 1 percent
The 2015 National Association of Realtors® Profile of Home Buyers and

HOME SELLERS AND THEIR SELLING EXPERIENCE
Exhibit 6-24
TENURE IN PREVIOUS HOME, BY AGE OF SELLER
(Percentage Distribution)
Ohio
All Sellers
1 year or less 2%
2 to 3 years 8
4 to 5 years 10
6 to 7 years 15
8 to 10 years 9
11 to 15 years 24
16 to 20 years 12
21 years or more 21
Median 12
U.S.
All Sellers
18 to 34
years
35 to 44
years
45 to 54
years
55 to 64
years
65 to 74
years
75 years
or older
1 year or less 4% 3% 5% 3% 3% 4% 4%
2 to 3 years 10 17 9 11 8 7 8
4 to 5 years 13 36 17 11 6 5 4
6 to 7 years 14 27 17 13 10 13 7
8 to 10 years 15 12 26 18 11 13 13
11 to 15 years 19 4 21 24 23 22 9
16 to 20 years 9 * 3 13 16 9 9
21 years or more 16 * 1 8 23 28 47
Median 9 5 8 9 13 12 18
* Less than 1 percent
NA= Not applicable
AGE OF HOME SELLER
The 2015 National Association of Realtors® Profile of Home Buyers and

HOME SELLERS AND THEIR SELLING EXPERIENCE
Exhibit 6-25
DISTANCE BETWEEN HOME PURCHASED AND HOME RECENTLY SOLD, BY REGION
(Median Miles)
Ohio U.S. Northeast Midwest South West
2014 13 20 15 18 20 20
SELLERS WHO SOLD A HOME IN THE:
13
20
15
18
20 20
0
5
10
15
20
25
Ohio U.S. Northeast Midwest South West
DISTANCE BETWEEN HOME PURCHASED AND HOME RECENTLY SOLD, BY REGION
(Median Miles)
Region of Home Sold
The 2015 National Association of Realtors® Profile of Home Buyers and

HOME SELLERS AND THEIR SELLING EXPERIENCE
Exhibit 6-26
DISTANCE BETWEEN HOME PURCHASED AND HOME RECENTLY SOLD, BY AGE
(Percentage Distribution)
Ohio
All Sellers
18 to 34
years
35 to 44
years
45 to 54
years
55 to 64
years
65 to 74
years
75 years
or older
5 miles or less 31% 13% 22% 36% 14% 38% 57%
6 to 10 miles 15 13 17 27 14 5 14
11 to 15 miles 12 6 6 * 29 24 14
16 to 20 miles 6 13 6 14 * 5 *
21 to 50 miles 14 6 22 5 29 10 14
51 to 100 miles 5 13 6 * 14 * *
101 to 500 miles 8 25 22 5 * * *
501 to 1,000 miles 6 6 * 9 * 14 *1,001 miles or more 4 6 * 5 * 5 *
Median (miles) 13 51 20 8 14 * *
U.S.
All Sellers
18 to 34
years
35 to 44
years
45 to 54
years
55 to 64
years
65 to 74
years
75 years
or older
5 miles or less 30% 32% 34% 25% 22% 16% 22%
6 to 10 miles 17 15 15 17 12 10 10
11 to 15 miles 9 9 8 10 11 8 6
16 to 20 miles 7 10 6 5 6 4 6
21 to 50 miles 12 13 12 10 9 10 7
51 to 100 miles 4 3 2 4 7 6 8
101 to 500 miles 9 7 10 11 12 23 12
501 to 1,000 miles 5 6 4 10 8 10 131,001 miles or more 8 5 9 10 14 13 16
Median (miles) 20 13 12 15 20 60 35
AGE OF HOME SELLER
AGE OF HOME SELLER
The 2015 National Association of Realtors® Profile of Home Buyers and

HOME SELLERS AND THEIR SELLING EXPERIENCE
Exhibit 6-27
METHOD USED TO SELL HOME, BY REGION
(Percentage Distribution)
Ohio U.S. Northeast Midwest South West
Sold home using an agent or broker 81% 89% 86% 87% 88% 93%Seller used agent/broker only 81 85 85 86 87 92
Seller first tried to sell it themselves, but then used an agent * 4 1 1 1 1
For-sale-by-owner (FSBO) 16 8 11 9 8 6
Seller sold home without using a real estate agent or broker 15 7 10 8 7 5
First listed with an agent, but then sold home themselves 1 1 1 1 1 1
Sold home to a homebuying company * 1 * 1 1 *
Other 3 2 2 2 2 1
* Less than 1 percent
SELLERS WHO SOLD A HOME IN THE:
The 2015 National Association of Realtors® Profile of Home Buyers and

HOME SELLERS AND THEIR SELLING EXPERIENCE
Exhibit 6-28
METHOD USED TO SELL HOME, BY SELLER URGENCY
(Percentage Distribution)
Ohio
All Sellers
Very
urgently
Somewhat
urgently
Not
urgently
Sold home using an agent or broker 81% 88% 77% 85%
Seller used agent/broker only 81 88 77 85
Seller first tried to sell it themselves, but then used an agent * * * *
For-sale-by-owner (FSBO) 16 13 19 15
Seller sold home without using a real estate agent or broker 15 13 19 13
First listed with an agent, but then sold home themselves 1 * * 3
Sold home to a homebuying company * * * *
Other 3 * 5 *
U.S.
All Sellers
Very
urgently
Somewhat
urgently
Not
urgently
Sold home using an agent or broker 89% 86% 92% 87%
Seller used agent/broker only 85 85 91 86
Seller first tried to sell it themselves, but then used an agent 4 1 1 1
For-sale-by-owner (FSBO) 8 7 7 11
Seller sold home without using a real estate agent or broker 7 6 6 10
First listed with an agent, but then sold home themselves 1 1 1 1
Sold home to a homebuying company 1 2 * *
Other 2 4 1 2
* Less than 1 percent
SELLER NEEDED TO SELL
SELLER NEEDED TO SELL
The 2015 National Association of Realtors® Profile of Home Buyers and

HOME SELLERS AND THEIR SELLING EXPERIENCE
Exhibit 6-29
METHOD OF SALE, BY BUYER AND SELLER RELATIONSHIP
(Percentage Distribution)
U.S.
Buyer and Seller Relationship
Seller Knew
Buyer
Seller did not
Know Buyer
All sellers 6% 94%
Sold home using an agent or broker 3 97
Seller used agent/broker only 3 97
Seller first tried to sell it themselves, but then used an agent 4 96
For-sale-by-owner (FSBO) 36 64
Sold home without using a real estate agent or broker 36 64
First listed with an agent, but then sold home themselves 35 65
Other 51 49
The 2015 National Association of Realtors® Profile of Home Buyers and

HOME SELLERS AND THEIR SELLING EXPERIENCE
Exhibit 6-30
METHOD USED TO SELL HOME, 2001-2015
(Percentage Distribution)
Ohio
2015
Sold home using an agent or broker 81%
For-sale-by-owner (FSBO) 16
Sold it to a home buying company *
Other 3
U.S.
2001 2003 2004 2005 2006 2007 2008 2009 2010 2011 2012 2013 2014 2015
Sold home using an agent or broker 79% 83% 82% 85% 84% 85% 84% 85% 88% 87% 88% 88% 88% 89%
For-sale-by-owner (FSBO) 13 14 14 13 12 12 13 11 9 9 9 9 9 8
Sold to home buying company 1 1 1 1 1 1 1 1 1 1 1 1 1 1
Other 7 3 3 2 3 2 2 3 3 3 2 2 2 2
79%83% 82% 85% 84% 85% 84% 85%
88% 87% 88% 88% 88% 89%
13
14 1413 12 12 13 11
9 9 9 9 9 81
1 1 1 1 1 1 1 1 1 1 1 1 173 3 2 3 2 2 3 3 3 2 2 2 2
0%
10%
20%
30%
40%
50%
60%
70%
80%
90%
100%
2001 2003 2004 2005 2006 2007 2008 2009 2010 2011 2012 2013 2014 2015
Sold home using an agent or broker For-sale-by-owner (FSBO) Sold to home buying company Other
The 2015 National Association of Realtors® Profile of Home Buyers and

HOME SELLERS AND THEIR SELLING EXPERIENCE
Exhibit 6-31
SALES PRICE COMPARED WITH LISTING PRICE, BY REGION
(Percentage Distribution of Sales Price as a Percent of List Price)
U.S. Northeast Midwest South West
Less than 90% 14% 9% 13% 11% 9% 6%
90% to 94% 19 15 20 14 15 13
95% to 99% 36 41 36 46 41 37
100% 25 24 22 21 27 23
101% to 110% 7 8 7 5 6 15
More than 110% * 3 2 3 2 7
Median (sales price as a
percent of listing price)
97% 98% 97% 97% 98% 99%
SELLERS WHO SOLD A HOME IN THE
Ohio
The 2015 National Association of Realtors® Profile of Home Buyers and

HOME SELLERS AND THEIR SELLING EXPERIENCE
Exhibit 6-32
SALES PRICE COMPARED WITH LISTING PRICE, BY SELLER URGENCY
(Percentage Distribution of Sales Price as a Percent of Listing Price)
Ohio
Very
urgently
Somewhat
urgently
Not
urgently
Less than 90% 14% 25% 12% 10%
90% to 94% 19 19 24 13
95% to 99% 36 19 39 41
100% 25 31 22 23
101% to 110% 7 6 2 13
More than 110% * * * *
Median (sales price as a
percent of listing price)
97% 98% 96% 98%
* Less than 1 percent
U.S.
All Sellers
Very
urgently
Somewhat
urgently
Not
urgently
Less than 90% 9% 13% 10% 6%
90% to 94% 15 16 15 15
95% to 99% 41 31 42 43
100% 24 23 24 25
101% to 110% 8 11 7 9
More than 110% 3 6 3 2
Median (sales price as a
percent of listing price)
98% 97% 98% 98%
All Sellers
SELLER NEEDED TO SELL
SELLER NEEDED TO SELL
The 2015 National Association of Realtors® Profile of Home Buyers and

HOME SELLERS AND THEIR SELLING EXPERIENCE
Exhibit 6-33
NUMBER OF WEEKS RECENTLY SOLD HOME WAS ON THE MARKET, BY REGION
(Percentage Distribution)
U.S. Northeast Midwest South West
Less than 1 week 12% 6% 5% 7% 6% 5%
1 to 2 weeks 33 36 32 36 33 43
3 to 4 weeks 13 12 12 11 12 13
5 to 6 weeks 6 6 6 7 6 5
7 to 8 weeks 5 7 6 7 8 5
9 to 10 weeks 4 5 4 3 5 5
11 to 12 weeks 4 7 5 6 6 8
13 to 16 weeks 4 4 6 6 4 3
17 to 24 weeks 4 6 5 6 6 4
25 to 36 weeks 5 5 7 4 5 4
37 to 52 weeks 6 5 10 5 4 3
53 or more weeks 2 3 5 2 4 1
Median weeks 4 4 6 4 4 3
SELLERS WHO SOLD A HOME IN THE
Ohio
The 2015 National Association of Realtors® Profile of Home Buyers and

HOME SELLERS AND THEIR SELLING EXPERIENCE
Exhibit 6-34
SALES PRICE COMPARED WITH LISTING PRICE, BY NUMBER OF WEEKS HOME WAS ON THE MARKET
(Percentage Distribution of Sales Price as a Percent of Listing Price)
Ohio
All Sellers
Less than
1 week
1 to 2
weeks
3 to 4
weeks
5 to 8
weeks
9 to 16
weeks
17 or
more
weeks
Less than 90% 14% * 3% 8% 18% 17% 41%
90% to 94% 19 17 9 23 * 33 29
95% to 99% 36 17 50 31 55 33 24
100% 25 67 25 23 18 17 6
101% to 110% 7 * 13 15 9 * *
More than 110% * * * * * * *
* Less than 1 percent
U.S.
All Sellers
Less than
1 week
1 to 2
weeks
3 to 4
weeks
5 to 8
weeks
9 to 16
weeks
17 or
more
weeks
Less than 90% 9% 4% 1% 5% 8% 11% 28%
90% to 94% 15 3 5 15 16 23 31
95% to 99% 41 24 33 55 56 54 30
100% 24 50 39 20 17 9 7
101% to 110% 8 9 17 5 2 2 2
More than 110% 3 10 5 1 1 2 1
Median (sales price
as a percent of listing
price)
98% 100% 100% 97% 97% 96% 93%
* Less than 1 percent
SELLERS WHOSE HOME WAS ON THE MARKET FOR
SELLERS WHOSE HOME WAS ON THE MARKET FOR
The 2015 National Association of Realtors® Profile of Home Buyers and

HOME SELLERS AND THEIR SELLING EXPERIENCE
Exhibit 6-35
NUMBER OF TIMES ASKING PRICE WAS REDUCED, BY NUMBER OF WEEKS HOME WAS ON THE MARKET
(Percentage Distribution)
Ohio
All Sellers
Less than
1 week
1 to 2
weeks
3 to 4
weeks
5 to 8
weeks
9 to 16
weeks
17 or
more
weeks
None, did not reduce
the asking price
61% 93% 81% 83% 55% 50% 6%
One 18 7 16 17 27 25 24
Two 11 * 3 * 18 8 35
Three 4 * * * * 8 12
Four or more 6 * * * * 8 24
U.S.
All Sellers
Less than
1 week
1 to 2
weeks
3 to 4
weeks
5 to 8
weeks
9 to 16
weeks
17 or
more
weeks
None, did not reduce
the asking price
57% 89% 88% 58% 46% 29% 13%
One 22 10 11 32 31 41 20
Two 12 1 1 9 16 19 30
Three 6 * * 1 6 9 20
Four or more 4 * * * 1 3 16
* Less than 1 percent
SELLERS WHOSE HOME WAS ON THE MARKET FOR
SELLERS WHOSE HOME WAS ON THE MARKET FOR
The 2015 National Association of Realtors® Profile of Home Buyers and

HOME SELLERS AND THEIR SELLING EXPERIENCE
Exhibit 6-36
INCENTIVES OFFERED TO ATTRACT BUYERS, BY REGION
(Percent of Respondents)
Ohio U.S. Northeast Midwest South West
None 60% 63% 69% 64% 59% 68%
Home warranty policies 24 21 7 23 26 20
Assistance with closing costs 20 16 16 14 18 13
Credit toward remodeling or repairs 5 7 7 5 7 8
Other incentives, such as a car, flat screen TV, etc. 4 4 4 4 4 4
Assistance with condo association fees * 1 1 1 * 1
Other 4 3 5 2 3 3
* Less than 1 percent
SELLERS WHO SOLD A HOME IN THE
The 2015 National Association of Realtors® Profile of Home Buyers and

HOME SELLERS AND THEIR SELLING EXPERIENCE
Exhibit 6-37
INCENTIVES OFFERED TO ATTRACT BUYERS, BY NUMBER OF WEEKS HOME WAS ON THE MARKET
(Percent of Respondents)
Ohio
Less than 1
week
1 to 2
weeks
3 to 4
weeks
5 to 8
weeks
9 to 16
weeks
17 or more
weeks
None 60% 100% 78% 46% 64% 42% 25%
Assistance with closing costs 20 * 13 23 18 17 38
Home warranty policies 24 * 13 46 18 50 31
Credit toward remodeling or repairs 5 * 3 8 * 8 13
Other incentives, such as a car, flat screen TV, etc. 4 * * 8 18 * 6
Assistance with condo association fees * * * * * * *
Other 4 * 3 * 9 * 13
U.S.
Less than 1
week
1 to 2
weeks
3 to 4
weeks
5 to 8
weeks
9 to 16
weeks
17 or more
weeks
None 63% 85% 70% 67% 62% 60% 45%
Home warranty policies 21 9 20 19 17 21 31
Assistance with closing costs 16 5 9 16 18 19 29
Credit toward remodeling or repairs 7 4 3 7 7 9 13
Other incentives, such as a car, flat screen TV, etc. 4 * 2 4 4 6 8
Assistance with condo association fees 1 * 1 * * * 1
Other 3 1 2 3 2 3 7
* Less than 1 percent
All
Sellers
All
Sellers
SELLERS WHOSE HOME WAS ON THE MARKET FOR
SELLERS WHOSE HOME WAS ON THE MARKET FOR
The 2015 National Association of Realtors® Profile of Home Buyers and

HOME SELLERS AND THEIR SELLING EXPERIENCE
Exhibit 6-38
EQUITY EARNED IN HOME RECENTLY SOLD, BY TENURE IN HOME
(Median)
TENURE IN HOME
Dollar value Percent Dollar value Percent
1 year or less $31,000 14% Median $11,250 9%
2 to 3 years $30,000 15%
4 to 5 years $35,000 19%
6 to 7 years $31,000 14%
8 to 10 years $3,000 1%
11 to 15 years $38,000 23%
16 to 20 years $95,000 63%
21 years or more $138,000 145%
Median $40,000 23%
OhioU.S.
The 2015 National Association of Realtors® Profile of Home Buyers and

HOME SELLERS AND THEIR SELLING EXPERIENCE
Exhibit 6-39
SATISFACTION WITH THE SELLING PROCESS
(Percentage Distribution)
U.S.Very Satisfied 54% 61%
Somewhat Satisfied 33 27
Somewhat Dissatisfied 9 8
Very Dissatisfied 4 5
Ohio
Very Satisfied, 54%
Somewhat Satisfied, 33%
Somewhat Dissatisfied, 9%
Very Dissatisfied, 4%
Satisfaction with Selling Process(Percentage Distribution)
Very Satisfied, 61%
Somewhat Satisfied, 27
Somewhat Dissatisfied, 8
Very Dissatisfied, 5
Satisfaction with Selling Process(Percentage Distribution)
U.S.
The 2015 National Association of Realtors® Profile of Home Buyers and

HOME SELLING AND REAL ESTATE PROFESSIONALS
Exhibit 7-1 METHOD USED TO FIND REAL ESTATE AGENT, BY FIRST TIME OR REPEAT SELLER
Exhibit 7-2 METHOD USED TO FIND REAL ESTATE AGENT, BY MILES MOVED
Exhibit 7-3 NUMBER OF AGENTS CONTACTED BEFORE SELECTING ONE TO ASSIST WITH SALE OF
HOME
Exhibit 7-4 SELLER USED THE SAME REAL ESTATE AGENT FOR THEIR HOME PURCHASE, BY MILES
MOVED
Exhibit 7-5 HOME LISTED ON MULTIPLE LISTING SERVICE
Exhibit 7-6 LEVEL OF SERVICE PROVIDED BY THE REAL ESTATE AGENT
Exhibit 7-7 WHAT SELLERS MOST WANT FROM REAL ESTATE AGENTS, BY LEVEL OF SERVICE
PROVIDED BY THE AGENT
Exhibit 7-8 MOST IMPORTANT FACTOR IN CHOOSING A REAL ESTATE AGENT TO SELL HOME, BY LEVEL
OF SERVICE PROVIDED BY THE AGENT
Exhibit 7-9 METHODS REAL ESTATE AGENT USED TO MARKET HOME
Exhibit 7-10 HOW REAL ESTATE AGENT WAS COMPENSATED
Exhibit 7-11 NEGOTIATING THE COMMISSION RATE OR FEE WITH THE REAL ESTATE AGENT
Exhibit 7-12 WOULD SELLER USE REAL ESTATE AGENT AGAIN OR RECOMMEND TO OTHERS
Exhibit 7-13 HOW MANY TIMES SELLER RECOMMENDED TYPICAL AGENT
The 2015 Profile of Home Buyers and Seller

HOME SELLING AND REAL ESTATE PROFESSIONALS
Exhibit 7-1
METHOD USED TO FIND REAL ESTATE AGENT, BY FIRST TIME OR REPEAT SELLER
(Percentage Distribution)
OhioFirst-time
Seller
Repeat
Seller
Referred by (or is) a friend, neighbor or relative 36% 49% 27%
Used agent previously to buy or sell a home 33 26 38
Visited an open house and met agent 2 3 2
Internet website (without a specific reference) 1 3 *
Personal contact by agent (telephone, email, etc.) 2 * 4
Referred by another real estate or broker 3 * 6
Saw contact information on For Sale/Open House sign 2 3 2
Referred through employer or relocation company 2 3 2
Direct mail (newsletter, flyer, postcard, etc.) 3 6 2
Walked into or called office and agent was on duty 1 * 2
Newspaper, Yellow pages or home book ad * * *
Advertising specialty (calendar, magnet, etc.) * * *
Crowdsourcing through social media/knew the person through social media* * *
Saw the person's social media page without a connection * * *
Other 13 9 15
U.S.
All sellers
First-time
Seller
Repeat
Seller
Referred by (or is) a friend, neighbor or relative 42% 47% 39%
Used agent previously to buy or sell a home 24 20 26
Internet website (without a specific reference) 4 6 4
Personal contact by agent (telephone, email, etc.) 4 3 5
Referred by another real estate or broker 4 4 4
Visited an open house and met agent 3 3 3
Saw contact information on For Sale/Open House sign 3 4 2
Referred through employer or relocation company 3 3 3
Direct mail (newsletter, flyer, postcard, etc.) 1 2 1Walked into or called office and agent was on duty 1 1 1
Newspaper, Yellow pages or home book ad 1 * 1
Advertising specialty (calendar, magnet, etc.) 1 1 1Crowdsourcing through social media/knew the person
through social media * * *Saw the person's social media page without a
connection * * *
Other 9 7 10
* Less than 1 percent
The 2015 Profile of Home Buyers and Seller

HOME SELLING AND REAL ESTATE PROFESSIONALS
Exhibit 7-2
METHOD USED TO FIND REAL ESTATE AGENT, BY MILES MOVED
(Percentage Distribution)
Ohio
All sellers
10 miles
or less
11 to 20
miles
21 to 50
miles
51 to 100
miles
101 to
500 miles
501or
more
Referred by (or is) a friend, neighbor or relative 36% 21% 63% 27% 80% 50% 35%
Used agent previously to buy or sell a home 33 41 19 27 20 25 24
Visited an open house and met agent 2 3 6 * * * 9
Internet website (without a specific reference) 1 3 * * * * 3
Personal contact by agent (telephone, email, etc.) 2 * * 9 * * 3
Referred by another real estate or broker 3 3 13 * * * 3
Saw contact information on For Sale/Open House sign 2 * * 9 * * 9
Referred through employer or relocation company 2 * * * * 13 6
Direct mail (newsletter, flyer, postcard, etc.) 3 * * 18 * 13 *
Walked into or called office and agent was on duty 1 3 * * * * 3
Newspaper, Yellow pages or home book ad * * * * * * *
Advertising specialty (calendar, magnet, etc.) * * * * * * 3
Crowdsourcing through social media/knew the person through social media * * * * * * *
Saw the person's social media page without a connection * * * * * * *
Other 13 27 * 9 * * 3
U.S.
All sellers
10 miles
or less
11 to 20
miles
21 to 50
miles
51 to 100
miles
101 to
500 miles
501or
more
Referred by (or is) a friend, neighbor or relative 42% 45% 43% 36% 43% 49% 37%
Used agent previously to buy or sell a home 24 27 21 26 17 18 21
Internet website (without a specific reference 4 4 8 6 6 2 3
Personal contact by agent (telephone, email, etc.) 4 3 3 7 6 2 7
Referred by another real estate or broker 4 2 3 6 3 6 4
Visited an open house and met agent 3 4 3 2 * 1 1
Saw contact information on For Sale/Open House sign 3 2 5 4 * 4 2
Referred through employer or relocation company 3 * 1 1 3 7 9
Direct mail (newsletter, flyer, postcard, etc.) 1 1 * 2 3 1 2
Walked into or called office and agent was on duty 1 1 1 * 4 1 1
Newspaper, Yellow pages or home book ad 1 * 1 * * 2 2
Advertising specialty (calendar, magnet, etc.) 1 * 2 * 5 * 1
Crowdsourcing through social media/knew the person through social media * * * * 1 * *
Saw the person's social media page without a connection * * * * * * *
Other 9 10 8 10 10 7 9
The 2015 Profile of Home Buyers and Seller

HOME SELLING AND REAL ESTATE PROFESSIONALS
Exhibit 7-3
NUMBER OF AGENTS CONTACTED BEFORE SELECTING ONE TO ASSIST WITH SALE OF HOME
(Percentage Distribution)
Ohio
One 67%
Two 22%
Three 5%
Four 3%
Five or more 4%
* Less than 1 percent
U.S.
One 72%
Two 15
Three 9
Four 2
Five or more 1
67%
22%
5%3% 4%
0%
10%
20%
30%
40%
50%
60%
70%
80%
90%
One Two Three Four Five or more
NUMBER OF AGENTS CONTACTED BEFORE SELECTING ONE TO ASSIST WITH SALE OF HOME
(Percentage Distribution)
Ohio
72%
15%
9%
2% 1%
0%
10%
20%
30%
40%
50%
60%
70%
80%
One Two Three Four Five or more
NUMBER OF AGENTS CONTACTED BEFORE SELECTING ONE TO ASSIST WITH SALE OF HOME
(Percentage Distribution)
U.S
The 2015 Profile of Home Buyers and Seller
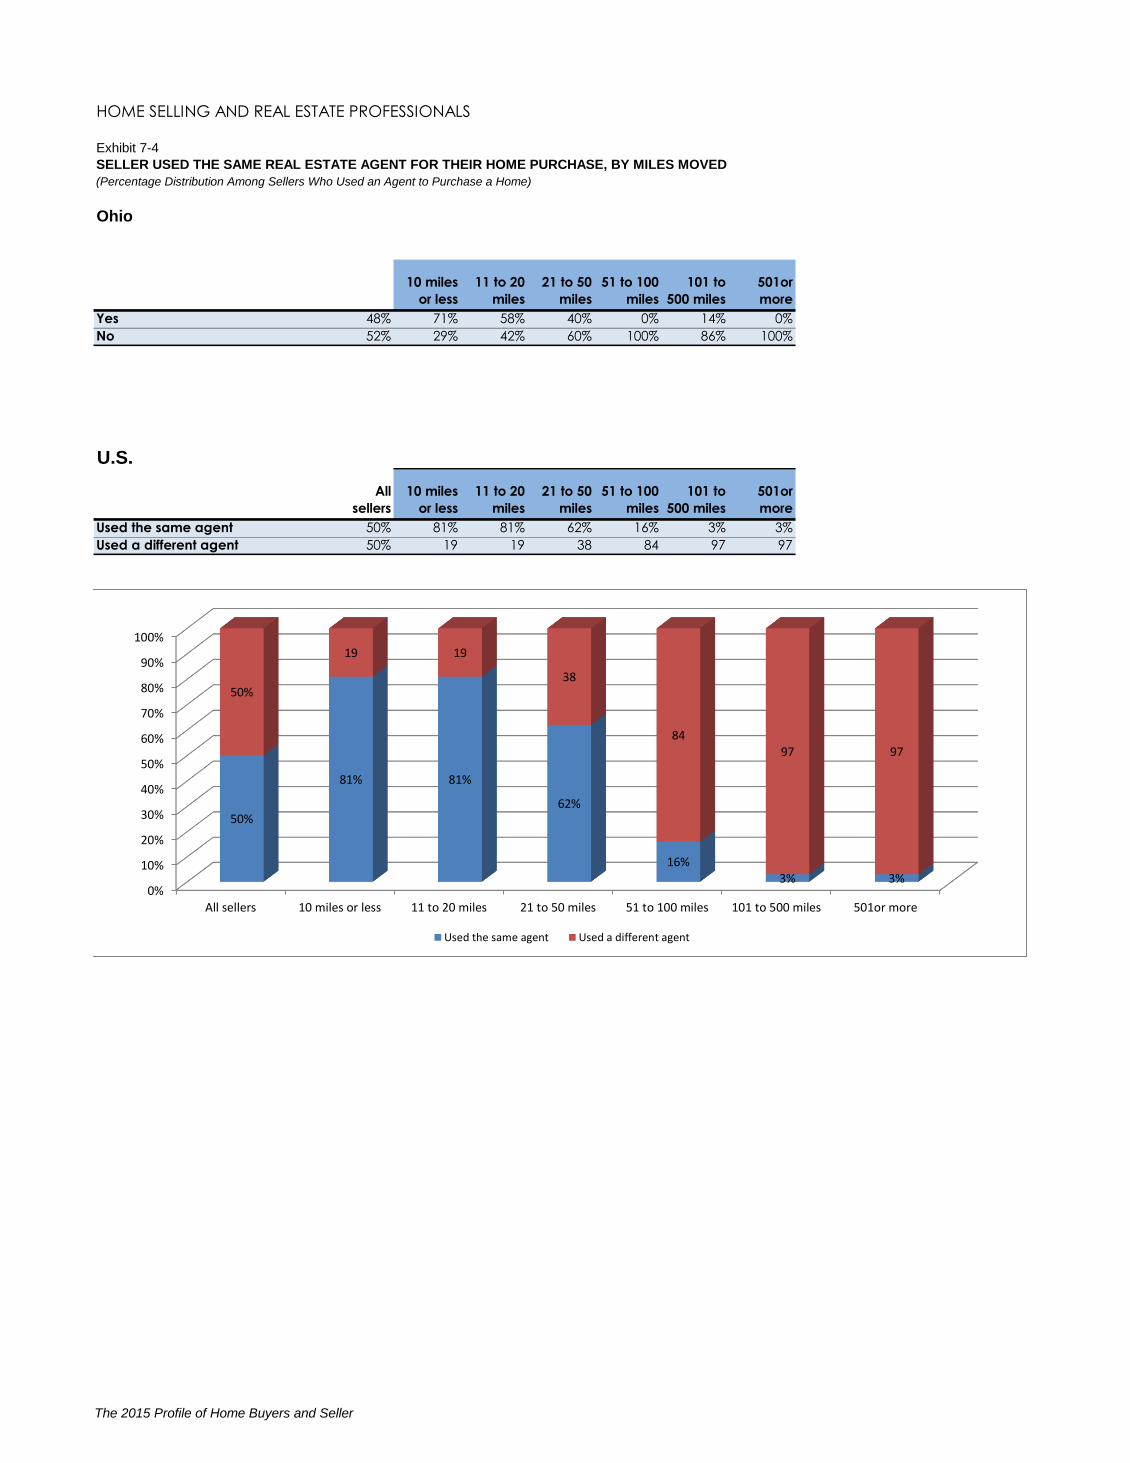
HOME SELLING AND REAL ESTATE PROFESSIONALS
Exhibit 7-4
SELLER USED THE SAME REAL ESTATE AGENT FOR THEIR HOME PURCHASE, BY MILES MOVED
(Percentage Distribution Among Sellers Who Used an Agent to Purchase a Home)
Ohio
10 miles
or less
11 to 20
miles
21 to 50
miles
51 to 100
miles
101 to
500 miles
501or
more
Yes 48% 71% 58% 40% 0% 14% 0%
No 52% 29% 42% 60% 100% 86% 100%
U.S.
All
sellers
10 miles
or less
11 to 20
miles
21 to 50
miles
51 to 100
miles
101 to
500 miles
501or
more
Used the same agent 50% 81% 81% 62% 16% 3% 3%
Used a different agent 50% 19 19 38 84 97 97
0%
10%
20%
30%
40%
50%
60%
70%
80%
90%
100%
All sellers 10 miles or less 11 to 20 miles 21 to 50 miles 51 to 100 miles 101 to 500 miles 501or more
50%
81% 81%
62%
16%3% 3%
50%
19 19
38
8497 97
Used the same agent Used a different agent
The 2015 Profile of Home Buyers and Seller

HOME SELLING AND REAL ESTATE PROFESSIONALS
Exhibit 7-5
HOME LISTED ON MULTIPLE LISTING SERVICE
(Percentage Distribution)
Ohio
Yes 88%
No 5%
Don't know 8%
U.S.
Yes 91%
No 4%
Don't know 5%
Yes, 88%
No, 5%
Don't know, 8%
HOME LISTED ON MULTIPLE LISTING SERVICE(Percentage Distribution)
Ohio
Yes, 91%
No, 4%
Don't know, 5%
HOME LISTED ON MULTIPLE LISTING SERVICE(Percentage Distribution)
U.S.
The 2015 Profile of Home Buyers and Seller

HOME SELLING AND REAL ESTATE PROFESSIONALS
Exhibit 7-6
LEVEL OF SERVICE PROVIDED BY THE REAL ESTATE AGENT
(Percentage Distribution)
Ohio
A broad range of
services and
management of most
aspects of the home
sale
77%
A limited set of
services as requested
by the seller
15%
The agent listed the
home on the MLS and
performed few if any
additional services
8%
U.S.
A broad range of
services and
management of most
aspects of the home
sale
79%
A limited set of
services as requested
by the seller
9%
The agent listed the
home on the MLS and
performed few if any
additional services
12%
A broad range of services and
management of most aspects of the home sale,
77%
A limited set of services as
requested by the seller, 15%
The agent listed the home on the
MLS and performed few if any additional services, 8%
LEVEL OF SERVICE PROVIDED BY THE REAL ESTATE AGENT
(Percentage Distribution)
Ohio
Ohio
A broad range of services and
management of most aspects of the home sale,
79%A limited set of
services as requested by the
seller, 9%
The agent listed the home on the
MLS and performed few if any additional services, 12%
LEVEL OF SERVICE PROVIDED BY THE REAL ESTATE AGENT
(Percentage Distribution)
U.S.
The 2015 Profile of Home Buyers and Seller

HOME SELLING AND REAL ESTATE PROFESSIONALS
Exhibit 7-7
WHAT SELLERS MOST WANT FROM REAL ESTATE AGENTS, BY LEVEL OF SERVICE PROVIDED BY THE AGENT
(Percentage Distribution)
Ohio
All sellers
A broad range of
services and
management of
most aspects of the
home sale
A limited set of
services as
requested by the
seller
The agent listed the
home on the MLS and
performed few if any
additional services
Help price home competitively 16% 14% 17% 29%
Help sell the home within specific timeframe 24 19 42 43
Help find a buyer for home 15 18 * 14
Help seller market home to potential buyers 22 25 17 *
Help seller find ways to fix up home to sell it for more 13 13 17 *
Help with negotiation and dealing with buyers 1 * * 14
Help with paperwork/inspections/preparing for settlement 6 8 * *
Help seller see homes available to purchase 2 3 * *
Other 1 * 8 *
* Less than 1 percent
U.S.
All sellers
A broad range of
services and
management of
most aspects of the
home sale
A limited set of
services as
requested by the
seller
The agent listed the
home on the MLS and
performed few if any
additional services
Help seller market home to potential buyers 21% 20% 19% 27%
Help sell the home within specific timeframe 21 21 23 17
Help find a buyer for home 17 18 17 16
Help price home competitively 16 16 24 14
Help seller find ways to fix up home to sell it for more 14 16 9 10
Help with negotiation and dealing with buyers 5 5 5 7
Help with paperwork/inspections/preparing for settlement 3 3 1 3
Help seller see homes available to purchase 2 2 2 3
Help create and post videos to provide tour of my home * * * 1
Other 1 1 1 2
* Less than 1 percent
LEVEL OF SERVICE SOUGHT FROM THE AGENT BY THE SELLER
LEVEL OF SERVICE SOUGHT FROM THE AGENT BY THE SELLER
The 2015 Profile of Home Buyers and Seller

HOME SELLING AND REAL ESTATE PROFESSIONALS
Exhibit 7-8
MOST IMPORTANT FACTOR IN CHOOSING A REAL ESTATE AGENT TO SELL HOME, BY LEVEL OF SERVICE PROVIDED BY THE AGENT
(Percentage Distribution)
Ohio
All sellers
A broad range of
services and
management of
most aspects of the
home sale
A limited set of
services as
requested by the
seller
The agent listed the
home on the MLS and
performed few if any
additional services
Reputation of agent 38% 41% 33% 29%
Agent is honest and trustworthy 21 19 17 43
Agent is friend or family member 16 16 17 14
Agent’s knowledge of the neighborhood 11 13 8 *
Agent’s association with a particular firm 4 2 8 14
Agent has caring personality/good listener 4 5 * *
Agent's commission 2 2 8 *
Agent seems 100% accessible because of use of technology like tablet or smartphone1 2 * *
Professional designations held by agent * * * *
Other 4 2 8 *
U.S.
All sellers
A broad range of
services and
management of
most aspects of the
home sale
A limited set of
services as
requested by the
seller
The agent listed the
home on the MLS and
performed few if any
additional services
Reputation of agent 34% 35% 29% 29%
Agent is honest and trustworthy 18 19 17 13
Agent is friend or family member 16 16 16 10
Agent’s knowledge of the neighborhood 15 15 18 13
Agent has caring personality/good listener 4 4 3 3
Agent’s association with a particular firm 4 3 6 8
Agent's commission 4 3 3 7Agent seems 100% accessible because of use of
technology like tablet or smartphone 2 2 1 6
Professional designations held by agent 2 2 3 2
Other 3 2 5 9
LEVEL OF SERVICE SOUGHT FROM THE AGENT BY THE SELLER
LEVEL OF SERVICE SOUGHT FROM THE AGENT BY THE SELLER
The 2015 Profile of Home Buyers and Seller

HOME SELLING AND REAL ESTATE PROFESSIONALS
Exhibit 7-9
METHODS REAL ESTATE AGENT USED TO MARKET HOME
(Percent of Respondents Among Sellers Who Used an Agent)
Ohio
All Homes
Multiple Listing (MLS) website 80%
Yard sign 75
Open house 41
Real estate agent website 51
Real estate company website 45
Realtor.com 58
Third party aggregators 35
Print newspaper advertisement 18
Direct mail (flyers, postcards, etc.) 16
Real estate magazine 7
Newspaper website 11
Video 4
Other Web sites with real estate listings (e.g.
Google, Yahoo) 2
Real estate magazine website 8
Social networking websites (e.g. Facebook,Twitter,
etc.) 8
Online Classified Ads 7
Video hosting Web sites (e.g. Youtube, etc.) *
Television *
Other 5
* Less than 1 percent
U.S.All Homes
Multiple Listing (MLS) website 89%
Yard sign 69
Real estate agent website 51
Open house 51
Realtor.com 50
Real estate company website 43
Third party aggregators 40
Social networking websites (e.g. Facebook,Twitter,
etc.) 12
Print newspaper advertisement 11
Direct mail (flyers, postcards, etc.) 10
Video 9
Newspaper website 9
Real estate magazine 9
Other Web sites with real estate listings (e.g.
Google, Yahoo) 6
Online Classified Ads 6
The 2015 Profile of Home Buyers and Seller

HOME SELLING AND REAL ESTATE PROFESSIONALS
Exhibit 7-10
HOW REAL ESTATE AGENT WAS COMPENSATED
(Percentage Distribution)
Ohio
Paid by seller 75%
Percent of sales price 91
Flat fee 5
Per task fee 1
Other *
Don't Know 3
Paid by buyer and seller 16
Paid by buyer only 2
Other 5
Don't Know 2
U.S.
Paid by seller 76%
Percent of sales price 72
Flat fee 3
Per task fee *
Other *
Don't Know 1
Paid by buyer and seller 10
Paid by buyer only 7
Other 4
Don't Know 3
* Less than 1 percent
The 2015 Profile of Home Buyers and Seller

HOME SELLING AND REAL ESTATE PROFESSIONALS
Exhibit 7-11
NEGOTIATING THE COMMISSION RATE OR FEE WITH THE REAL ESTATE AGENT
(Percentage Distribution)
Ohio
Real estate agent initiated discussion of
compensation
48%
Client brought up the topic and the real estate
agent was able and willing to negotiate their
commission or fee
23
Client brought up the topic and the real estate
agent was unwilling or unable to negotiate
their commission or fee
8
Client did know commissions and fees could
be negotiated but did not bring up the topic
9
Client did not know commissions and fees
could be negotiated
14
U.S.
Real estate agent initiated discussion of
compensation
46%
Client brought up the topic and the real estate
agent was able and willing to negotiate their
commission or fee
20
Client brought up the topic and the real estate
agent was unwilling or unable to negotiate
their commission or fee
8
Client did know commissions and fees could
be negotiated but did not bring up the topic
10
Client did not know commissions and fees
could be negotiated
16
Real estate agent initiated discussion of compensation, 46%
Client brought up the topic and the real
estate agent was able and willing to negotiate
their commission or fee, 20
Client brought up the topic and the real estate agent was
unwilling or unable to negotiate their
commission or fee, 8
Client did know commissions and fees could be negotiated but did not bring up
the topic, 10
Client did not know commissions and fees
could be negotiated, 16
The 2015 Profile of Home Buyers and Seller

HOME SELLING AND REAL ESTATE PROFESSIONALS
Exhibit 7-12
WOULD SELLER USE REAL ESTATE AGENT AGAIN OR RECOMMEND TO OTHERS
(Percentage Distribution)
Ohio
10 miles or
less
11 to 20
miles
21 to 50
miles
51 to 100
miles
101 to
500 miles
501or
more
Definitely 66% 56% 67% 55% 100% 75% 66%
Probably 18% 31% 13% 18% 0% 0% 18%
Probably Not 10% 3% 13% 27% 0% 25% 10%
Definitely Not 6% 6% 7% 0% 0% 0% 6%
Don't Know/
Not Sure1% 3% 0% 0% 0% 0% 1%
U.S.All
sellers
10 miles or
less
11 to 20
miles
21 to 50
miles
51 to 100
miles
101 to
500 miles
501or
more
Definitely 67% 69% 67% 67% 68% 71% 60%
Probably 17 18 19 13 12 14 20
Probably Not 7 6 6 9 8 11 9
Definitely Not 7 6 8 9 11 4 9Don't Know/
Not Sure 1 1 1 2 2 * 2
The 2015 Profile of Home Buyers and Seller

HOME SELLING AND REAL ESTATE PROFESSIONALS
Exhibit 7-13
HOW MANY TIMES SELLER RECOMMENDED TYPICAL AGENT
(Percentage distribution)
Ohio
All Sellers
None *
One time 67
Two times 22
Three times 5
Four or more times 3
Times recommended
since buying (median) 1
U.S.
All Sellers
None 38%
One time 13
Two times 17
Three times 12
Four or more times 20
Times recommended
since buying (median) 1
The 2015 Profile of Home Buyers and Seller

FOR SALE BY OWNERS SELLERS
Exhibit 8-1 FSBO AND AGENT-ASSISTED SALES, 2003-2015
Exhibit 8-2 FSBO AND AGENT-ASSISTED SALES, BY LOCATION
Exhibit 8-3 CHARACTERISTICS OF FSBO AND AGENT-ASSISTED SELLERS
Exhibit 8-4 TYPE OF HOME SOLD, FSBO AND AGENT-ASSISTED SELLERS
Exhibit 8-5 LOCATION OF HOME SOLD, FSBO AND AGENT-ASSISTED SELLERS
Exhibit 8-6 SELLING PRICE, FSBO AND AGENT-ASSISTED SELLERS
Exhibit 8-7 HOW FSBO SELLER DETERMINED ASKING PRICE OF HOME SOLD
Exhibit 8-8 TIME ON THE MARKET, FSBO AND AGENT-ASSISTED SELLERS
Exhibit 8-9 SELLER URGENCY, FSBO AND AGENT-ASSISTED SELLERS
Exhibit 8-10 INCENTIVES OFFERED TO ATTRACT BUYERS, FSBO AND AGENT-ASSISTED SELLERS
Exhibit 8-11 MOST IMPORTANT REASON FOR SELLING HOME AS FSBO
Exhibit 8-12 SELLER WANTED TO SELL EARLIER BUT WAITED OR STALLED BECAUSE
HOME WAS WORTH LESS THAN MORTGAGE
Exhibit 8-13 METHOD USED BY FSBO SELLERS TO MARKET HOME
Exhibit 8-14 MOST DIFFICULT TASK FOR FSBO SELLERS
Exhibit 8-15 HOW FSBO SELLERS WILL SELL THEIR CURRENT HOME
Exhibit 8-16 FSBO SELLERS SATISFACTION PROCESS OF SELLING HOME
The 2015 National Association of Realtors® Profile of Home Buyers and Selle Chapter 8, Page 1 o

FOR SALE BY OWNERS SELLERS
Exhibit 8-1
FSBO AND AGENT-ASSISTED SALES, 2003-2015
(Percentage Distribution)
Ohio
2015
All FSBO (For-sale-by-owner) 20%
Seller knew buyer 9
Seller did not know buyer 11
Agent-assisted 80
Other *
U.S.
2003 2004 2005 2006 2007 2008 2009 2010 2011 2012 2013 2014 2015
All FSBO (For-sale-by-owner) 14% 14% 13% 12% 12% 13% 11% 9% 10% 9% 9% 9% 8%
Seller knew buyer 5 5 5 5 5 6 5 5 4 3 4 4 3
Seller did not know buyer 9 10 8 7 7 7 6 5 6 6 6 5 5
Agent-assisted 83 82 85 84 85 84 85 88 87 88 88 88 89
Other 4 4 2 3 3 3 4 3 3 2 3 2 3
The 2015 National Association of Realtors® Profile of Home Buyers and Selle Chapter 8, Page 2 o

FOR SALE BY OWNERS SELLERS
Exhibit 8-2
FSBO AND AGENT-ASSISTED SALES, BY LOCATION
(Percentage Distribution)
Ohio
All Sellers
Suburb/
Subdivision Small town
Urban/
Central
city
Rural
area
Resort/
Recreation
area
For-sale-by-owner (FSBO) 20% * * * * *
Seller knew buyer 9 * * * * *
Seller did not know buyer 11 * * * * *
Agent-assisted 80 100 100 86 92 *
Other * * * 14 8 *
U.S.
Suburb/
Subdivision Small town
Urban/
Central
city
Rural
area
Resort/
Recreation
area
For-sale-by-owner (FSBO) 8% 5% 13% 8% 15% 16%
Seller knew buyer 3 1 5 2 9 2
Seller did not know buyer 5 4 7 7 5 10
Agent-assisted 89 94 85 90 83 84
Other 3 2 3 2 3 *
* Less than 1 percent
SELLERS WHO SOLD A HOME IN A
All Sellers
SELLERS WHO SOLD A HOME IN A
The 2015 National Association of Realtors® Profile of Home Buyers and Selle Chapter 8, Page 3 o

FOR SALE BY OWNERS SELLERS
Exhibit 8-3
CHARACTERISTICS OF FSBO AND AGENT-ASSISTED SELLERS
Ohio
All Sellers All FSBO
Seller
Knew
Buyer
Seller did
not Know
Buyer
All Agent-
assisted
Agent-
assisted
only
First FSBO,
then Agent-
assisted
Median age 51 53 65 42 51 51 *
Median income (2014) $72,000 $76,600 $50,000 $45,000 $76,900 $77,900 $64,900
Household composition
Married couple 77% 71% 57% 78% 80% 80% *
Single female 17 18 29 11 16 16 *
Single male 2 6 14 * 1 1 *
Unmarried couple 4 6 * 11 4 4 *
Other * * * * * * *
U.S.
All Sellers All FSBO
Seller
Knew
Buyer
Seller did
not Know
Buyer
All Agent-
assisted
Agent-
assisted
only
First FSBO,
then Agent-
assisted
Median age 54 56 54 57 54 54 54
Median income (2014) $104,100 $84,000 $75,000 $92,500 $105,600 $107,000 $89,600
Household composition
Married couple 77% 74% 63% 81% 79% 78% 86%
Single female 12 14 24 9 11 11 4
Single male 6 7 8 6 5 5 4
Unmarried couple 4 5 5 4 4 4 7
Other 2 1 * 1 2 2 *
* Less than 1 percent
FSBO
FSBO AGENT-ASSISTED
AGENT-ASSISTED
The 2015 National Association of Realtors® Profile of Home Buyers and Selle Chapter 8, Page 4 o

FOR SALE BY OWNERS SELLERS
Exhibit 8-4
TYPE OF HOME SOLD, FSBO AND AGENT-ASSISTED SELLERS
(Percentage Distribution)
Ohio
All
Sellers All FSBO
Seller
Knew
Buyer
Seller did
not Know
Buyer
Agent-
Assisted
Detached single-family home 83% 65% 57% 67% 87%
Townhouse/row house 2 * * * 2
Duplex/apartment/condo in 2 to 4 unit building 1 6 * 11 *
Apartment/condo in a building with 5 or more units 1 * * * 1
Mobile/manufactured home 9 29 43 22 4
Other 5 * * * 6
* Less than 1 percent
U.S.
All
Sellers All FSBO
Seller
Knew
Buyer
Seller did
not Know
Buyer
Agent-
Assisted
Detached single-family home 81% 75% 80% 72% 82%
Townhouse/row house 6 2 3 2 6
Duplex/apartment/condo in 2 to 4 unit building 2 1 3 * 2
Apartment/condo in a building with 5 or more units 5 7 3 9 5
Mobile/manufactured home 3 10 9 10 2
Other 3 6 4 6 3
FSBO
FSBO
The 2015 National Association of Realtors® Profile of Home Buyers and Selle Chapter 8, Page 5 o

FOR SALE BY OWNERS SELLERS
Exhibit 8-5
LOCATION OF HOME SOLD, FSBO AND AGENT-ASSISTED SELLERS
(Percentage Distribution)
Ohio
All Sellers All FSBO
Seller Knew
Buyer
Seller did not
Know Buyer Agent-Assisted
Suburb/Subdivision 38% 24% 29% 22% 42%
Small town 25 24 29 11 25
Urban area/Central city 9 18 29 11 7
Rural area 28 35 14 56 26
Resort/Recreation area * * * * *
* Less than 1 percent
U.S.
All Sellers All FSBO
Seller Knew
Buyer
Seller did not
Know Buyer Agent-Assisted
Suburb/Subdivision 49% 28% 23% 32% 51%
Small town 19 18 28 29 18
Urban area/Central city 16 15 9 18 16
Rural area 14 24 38 15 13
Resort/Recreation area 3 5 3 6 3
* Less than 1 percent
FSBO
FSBO
The 2015 National Association of Realtors® Profile of Home Buyers and Selle Chapter 8, Page 6 o

FOR SALE BY OWNERS SELLERS
Exhibit 8-6
SELLING PRICE, FSBO AND AGENT-ASSISTED SELLERS
(Percentage Distribution)
Ohio
All Sellers All FSBO
Seller Knew
Buyer
Seller did
not Know
Buyer
All Agent-
assisted
Agent-
assisted only
First FSBO,
then Agent-
assisted
Median selling price $148,800 $135,000 $95,000 $135,000 $164,500 $164,500 *
Lowest selling price $2,000 $2,000 $2,000 $2,000 $21,000 $21,000 *
Highest selling price $895,000 $238,000 $238,000 $200,000 $895,000 $895,000 *
Sample size 102 17 7 9 84 84 *
Sales price compared with asking price:
Less than 90% 14% 18% 14% 22% 13% 13% *
90% to 94% 19 12 * 11 20 20 *
95% to 99% 36 29 29 33 37 37 *
100% 25 41 57 33 21 21 *
101% to 110% 7 * * * 8 8 *
More than 110% * * * * * * *
Median (sales price as a
percent of asking price)
97% 98% 100% 96% 97% 97% 0%
Number of times asking price was reduced:
None 61% 71% 86% 56% 59% 59% *
One 18 29 14 44 16 16 *
Two 11 * * * 13 13 *
Three 4 * * * 5 5 *
Four or more 6 * * * 7 7 *
U.S.
All Sellers All FSBO
Seller Knew
Buyer
Seller did
not Know
Buyer
All Agent-
assisted
Agent-
assisted only
First FSBO,
then Agent-
assisted
Median selling price $245,000 $210,000 $151,900 $223,800 $249,000 $249,000 $228,000
Sales price compared with asking price:
Less than 90% 9% 13% 9% 15% 9% 9% 13%
90% to 94% 15 13 14 12 15 15 46
95% to 99% 41 35 30 37 41 42 33
100% 24 34 45 29 23 23 8
101% to 110% 8 3 * 5 9 9 *
More than 110% 3 2 3 2 3 3 *
Median (sales price as a
percent of asking price)
98% 98% 99% 98% 98% 98% 93%
Number of times asking price was reduced:
None 57% 60% 61% 60% 56% 56% 22%
One 22 31 33 28 22 21 41
Two 12 6 1 8 12 12 33
Three 6 3 5 1 6 6 4
Four or more 4 2 * 2 4 4 *
* Less than 1 percent
N/A- Not Available
FSBO
FSBO AGENT-ASSISTED
AGENT-ASSISTED
CAUTIONARY NOTE: Small sample sizes in some cases do not allow statistically robust results to be obtained. Please use
caution when interpreting the results in cases where sample sizes are small.
The 2015 National Association of Realtors® Profile of Home Buyers and Selle Chapter 8, Page 7 o

FOR SALE BY OWNERS SELLERS
Exhibit 8-7
HOW FSBO SELLER DETERMINED ASKING PRICE OF HOME SOLD
(Percent of Respondents)
Ohio
All FSBO
Seller Knew
Buyer
Seller did not
Know Buyer
Recent home sold in area 44% 29% 63%
Agent presentation-who seller did not use to sell
home 6 14 *
Profit seller needed from sale 25 29 13
Attending open houses in area/viewing homes
for sale online 13 * 25
Online home evaluation tool 25 29 25
To cover what was owed on home 6 * *
Other 25 14 25
U.S.
All FSBO
Seller Knew
Buyer
Seller did not
Know Buyer
Other 11% 16% 8%
Attending open houses in area/viewing homes
for sale online 11% 4% 14%
Agent presentation-who seller did not use to sell
home 13% 22% 7%
To cover what was owed on home 14% 12% 14%
Online home evaluation tool 15% 19% 13%
Profit seller needed from sale 19% 18% 20%
Recent home sold in area 50% 25% 65%
8%
14%
7%
14%
13%
20%
65%
16%
4%
22%
12%
19%
18%
25%
11%
11%
13%
14%
15%
19%
50%
0% 10% 20% 30% 40% 50% 60% 70%
Other
Attending open houses in area/viewinghomes for sale online
Agent presentation-who seller did not useto sell home
To cover what was owed on home
Online home evaluation tool
Profit seller needed from sale
Recent home sold in area
All FSBO Seller Knew Buyer Seller did not Know Buyer
The 2015 National Association of Realtors® Profile of Home Buyers and Selle Chapter 8, Page 8 o

FOR SALE BY OWNERS SELLERS
Exhibit 8-8
TIME ON THE MARKET, FSBO AND AGENT-ASSISTED SELLERS
(Percentage Distribution)
Ohio
All Sellers All FSBO
Seller
Knew
Buyer
Seller did
not Know
Buyer
All Agent-
assisted
Agent-
assisted
only
First FSBO,
then Agent-
assisted
Less than 1 week 12% 31% 57% 13% 9% 9% *
1 to 2 weeks 33 38 29 50 32 32 *
3 to 4 weeks 13 13 * 13 14 14 *
5 to 6 weeks 6 * * * 7 7 *
7 to 8 weeks 5 6 14 * 5 5 *
9 to 10 weeks 4 * * * 5 5 *
11 to 12 weeks 4 * * * 5 5 *
13 to 16 weeks 4 * * * 5 5 *
17 to 24 weeks 4 6 * 13 4 4 *
25 to 36 weeks 5 * * * 6 6 *
37 to 52 weeks 6 6 * 13 6 6 *
53 or more weeks 2 * * * 3 3 *
Median weeks 4 1 * 2 4 4 *
* Less than 1 percent
N/A- Not Available
U.S.
All Sellers All FSBO
Seller
Knew
Buyer
Seller did
not Know
Buyer
All Agent-
assisted
Agent-
assisted
only
First FSBO,
then Agent-
assisted
Less than 1 week 6% 18% 28% 12% 4% 4% 7%
1 to 2 weeks 36 32 32 33 36 37 10
3 to 4 weeks 12 10 13 9 12 12 3
5 to 6 weeks 6 5 * 7 6 6 17
7 to 8 weeks 7 7 7 7 7 7 3
9 to 10 weeks 5 6 1 8 5 4 13
11 to 12 weeks 7 8 3 9 7 6 17
13 to 16 weeks 4 6 7 6 4 4 13
17 to 24 weeks 6 1 * 1 6 6 3
25 to 36 weeks 5 1 * 1 5 5 *
37 to 52 weeks 5 4 4 5 5 5 10
53 or more weeks 3 3 6 1 3 3 3
Median weeks 4 3 1 4 4 4 10
* Less than 1 percent
FSBO
FSBO AGENT-ASSISTED
AGENT-ASSISTED
The 2015 National Association of Realtors® Profile of Home Buyers and Selle Chapter 8, Page 9 o

FOR SALE BY OWNERS SELLERS
Exhibit 8-9
SELLER URGENCY, FSBO AND AGENT-ASSISTED SELLERS
(Percentage Distribution)
Ohio
Sellers needed to sell: All Sellers All FSBO
Seller
Knew
Buyer
Seller did
not Know
Buyer
All Agent-
assisted
Agent-
assisted
only
First FSBO,
then Agent-
assisted
Very urgently 16% 13% 14% 11% 18% 18% *
Somewhat urgently 44 50 57 44 41 41 *Not urgently 40 38 29 44 41 41 *
* Less than 1 percent
N/A- Not Available
U.S.
Sellers needed to sell: All Sellers All FSBO
Seller
Knew
Buyer
Seller did
not Know
Buyer
All Agent-
assisted
Agent-
assisted
only
First FSBO,
then Agent-
assisted
Very urgently 16% 13% 21% 9% 16% 16% 19%
Somewhat urgently 41 32 33 33 42 42 33
Not urgently 43 54 47 58 42 42 48
FSBO
FSBO AGENT-ASSISTED
AGENT-ASSISTED
The 2015 National Association of Realtors® Profile of Home Buyers and Selle Chapter 8, Page 10 o

FOR SALE BY OWNERS SELLERS
Exhibit 8-10
INCENTIVES OFFERED TO ATTRACT BUYERS, FSBO AND AGENT-ASSISTED SELLERS
(Percent of Respondents)
Ohio
All Sellers All FSBO
Seller
Knew
Buyer
Seller did
not Know
Buyer
All Agent-
assisted
Agent-
assisted
only
First FSBO,
then Agent-
assisted
None 60% 82% 100% 67% 54% 54% *
Home warranty policies 24 6 * 11 28 28 *
Assistance with closing costs 20 * * * 24 24 *
Credit toward remodeling or
repairs
5 * * * 6 6 *
Other incentives, such as a
car, flat screen TV, etc.
4 6 * 11 4 4 *
Other 4 6 * 11 4 4 *
* Less than 1 percent
U.S.
All Sellers All FSBO
Seller
Knew
Buyer
Seller did
not Know
Buyer
All Agent-
assisted
Agent-
assisted
only
First FSBO,
then Agent-
assisted
None 63% 86% 93% 83% 61% 61% 39%
Home warranty policies 21 5 * 7 23 23 32
Assistance with closing costs 16 4 3 6 17 17 25
Credit toward remodeling or
repairs
7 2 1 3 7 7 4
Other incentives, such as a
car, flat screen TV, etc.
4 3 * 4 4 4 7
Assistance with condo
association fees
1 * * * 1 1 *
Other 3 2 4 1 3 3 7
* Less than 1 percent
FSBO AGENT-ASSISTED
FSBO AGENT-ASSISTED
The 2015 National Association of Realtors® Profile of Home Buyers and Selle Chapter 8, Page 11 o

FOR SALE BY OWNERS SELLERS
Exhibit 8-11
MOST IMPORTANT REASON FOR SELLING HOME AS FSBO
(Percentage Distribution)
Ohio
All FSBO
Seller Knew
Buyer
Seller did not
Know Buyer
Did not want to pay a commission or fee 31% 14% 50%
Sold it to a relative, friend or neighbor 19 43 *
Buyers contacted seller directly 38 29 38
Did not want to deal with an agent 6 * 13
Agent was unable to sell home * * *
Seller has real estate license * * *
Could not find an agent to handle transaction * * *
Other 6 14 *
* Less than 1 percent
U.S.
All FSBO
Seller Knew
Buyer
Seller did not
Know Buyer
Other 1% * 1%
Could not find an agent to handle transaction 1% 1% *
Seller has real estate license 2% * 4%
Agent was unable to sell home 5% 7% 4%
Did not want to deal with an agent 6% 4% 6%
Buyers contacted seller directly 18% 7% 23%
Sold it to a relative, friend or neighbor 21% 53% 4%
Did not want to pay a commission or fee 48% 28% 59%
* Less than 1 percent
1%
0%
4%
4%
6%
23%
4%
59%
0%
1%
0%
7%
4%
7%
53%
28%
1%
1%
2%
5%
6%
18%
21%
48%
0% 10% 20% 30% 40% 50% 60% 70%
Other
Could not find an agent to handletransaction
Seller has real estate license
Agent was unable to sell home
Did not want to deal with an agent
Buyers contacted seller directly
Sold it to a relative, friend or neighbor
Did not want to pay a commission or fee
All FSBO Seller Knew Buyer Seller did not Know Buyer
The 2015 National Association of Realtors® Profile of Home Buyers and Selle Chapter 8, Page 12 o

FOR SALE BY OWNERS SELLERS
Exhibit 8-12
SELLER WANTED TO SELL EARLIER BUT WAITED OR STALLED BECAUSE HOME WAS WORTH LESS THAN MORTGAGE
(Percentage Distribution)
Ohio
All Sellers All FSBO
Seller
Knew
Buyer
Seller
did not
Know
Buyer
All Agent-
assisted
Agent-
assisted
only
First FSBO,
then Agent-
assisted
Yes, and lived in home 11% 11% 14% 11% 11% 11% *
Yes, but rented home to
others and lived
elsewhere
2 2 * * 2 2 *
No, sold home when I
wanted to sell
88 88 86 89 88 87 *
All Sellers All FSBO
Seller
Knew
Buyer
Seller
did not
Know
Buyer
All Agent-
assisted
Agent-
assisted
only
First FSBO,
then Agent-
assisted
Yes, and lived in home 12% 10% 8% 10% 12% 12% 7%
Yes, but rented home to
others and lived
elsewhere
2 3 4 2 1 1 7
No, sold home when I
wanted to sell
87 88 89 88 87 87 86
FSBO AGENT-ASSISTED
FSBO AGENT-ASSISTED
The 2015 National Association of Realtors® Profile of Home Buyers and Selle Chapter 8, Page 13 o

FOR SALE BY OWNERS SELLERS
Exhibit 8-13
METHOD USED BY FSBO SELLERS TO MARKET HOME
(Percent of Respondents)
Ohio
All FSBO
Seller Knew
Buyer
Seller did not
Know Buyer
Yard sign 19% * *
For-sale-by-owner Web site 6 * *
Social networking Web sites 6 * *
Multiple Listing Service (MLS) website 6 * *
Open house 13 * *
Online classified ads 6 * *
Third party aggregator 19 * *
Friends, relatives, or neighbors 38 * *
Newspaper website * * *
Other Web sites with real estate listings * * *
Print newspaper advertisement 6 * *
Realtor.com 6 * *
For-sale-by-owner magazine * * *
Direct mail (flyers, postcards, etc) * * *
Video * * *
Television * * *
Video hosting Web sites * * *
None - Did not actively market home 44 67 *
Other * * *
U.S.
All FSBO
Seller Knew
Buyer
Seller did not
Know BuyerNone - Did not actively market home 25% 46% 12%
Other 1% * 2%
Television 1% * 2%
Video hosting Web sites 1% * 2%
For-sale-by-owner magazine 2% * 3%
Video 2% 3% 2%
Print newspaper advertisement 3% 1% 5%
Direct mail (flyers, postcards, etc) 3% * 5%
Other Web sites with real estate listings 4% * 6%
Realtor.com 5% 3% 7%
Newspaper website 6% 7% 6%
Multiple Listing Service (MLS) website 10% 4% 13%
Open house 14% 8% 17%
Online classified ads 14% 1% 20%
For-sale-by-owner Web site 15% 3% 22%
Social networking Web sites 15% 8% 19%
Third party aggregator 21% 1% 31%
Friends, relatives, or neighbors 32% 42% 28%
Yard sign 42% 15% 58%
12%
2%
2%
2%
3%
2%
5%
5%
6%
7%
6%
13%
17%
20%
22%
19%
31%
28%
58%
46%
0%
0%
0%
0%
3%
1%
0%
0%
3%
7%
4%
8%
1%
3%
8%
1%
42%
15%
25%
1%
1%
1%
2%
2%
3%
3%
4%
5%
6%
10%
14%
14%
15%
15%
21%
32%
42%
0% 10% 20% 30% 40% 50% 60% 70%
None - Did not actively market home
Other
Television
Video hosting Web sites
For-sale-by-owner magazine
Video
Print newspaper advertisement
Direct mail (flyers, postcards, etc)
Other Web sites with real estate listings
Realtor.com
Newspaper website
Multiple Listing Service (MLS) website
Open house
Online classified ads
For-sale-by-owner Web site
Social networking Web sites
Third party aggregator
Friends, relatives, or neighbors
Yard sign
All FSBO Seller Knew Buyer Seller did not Know Buyer
The 2015 National Association of Realtors® Profile of Home Buyers and Selle Chapter 8, Page 14 o

FOR SALE BY OWNERS SELLERS
Exhibit 8-14
MOST DIFFICULT TASK FOR FSBO SELLERS
(Percentage of Distribution)
Ohio
All FSBO
Seller Knew
Buyer
Seller did not
Know Buyer
Understanding and performing paperwork * * *
Preparing or fixing up the home for sale * * *
Getting the price right * * *
Selling within the length of time planned * * *
Attracting potential buyers * * *
Having enough time to devote to all aspects of the sale 100 * 100
Helping buyer obtain financing * * *
None/Nothing * * *
* Less than 1 percent
U.S.
All FSBO
Seller Knew
Buyer
Seller did not
Know Buyer
Getting the price right 6% 25% *
Selling within the length of time planned 18 50 8
Preparing or fixing up the home for sale 6 * 8
Understanding and performing paperwork 12 * 15
Having enough time to devote to all aspects of the sale 6 * 8
Helping buyer obtain financing * * *
Attracting potential buyers * * *
Other * * *
None/Nothing 53 25 62
* Less than 1 percent
The 2015 National Association of Realtors® Profile of Home Buyers and Selle Chapter 8, Page 15 o

FOR SALE BY OWNERS SELLERS FOR SALE BY OWNERS SELLERS
Exhibit 8-15
HOW FSBO SELLERS WILL SELL THEIR CURRENT HOME HOW FSBO SELLERS WILL SELL THEIR CURRENT HOME
(Percentage of Distribution) (Percentage of Distribution)
Ohio U.S.
Sell Themselves 30% Sell Themselves 16%Use a Real Estate
Agent20% Use a Real Estate
Agent28%
Don't Know/ Not
Sure50% Don't Know/ Not
Sure56%
Sell Themselves 33% Sell Themselves 37%Use a Real Estate
Agent33% Use a Real Estate
Agent18%
Don't Know/ Not
Sure33% Don't Know/ Not
Sure45%
FSBO- Seller Did Not
Know Buyer
FSBO- Seller Knew
Buyer
FSBO- Seller Did Not
Know Buyer
FSBO- Seller Knew
Buyer
Sell Themselves,
33%
Use a Real Estate Agent,
33%
Don't Know/ Not Sure, 33%
HOW FSBO SELLERS WILL SELL THEIR CURRENT HOME - FSBO, Seller Did Not Know
Buyer (Percentage Distribution)
Ohio
Sell Themselves,
30%
Use a Real Estate Agent,
20%
Don't Know/ Not Sure, 50%
HOW FSBO SELLERS WILL SELL THEIR CURRENT HOME - FSBO, Seller Knew Buyer
(Percentage Distribution)
Ohio
Sell Themselves,
37%
Use a Real Estate Agent,
18%
Don't Know/ Not Sure, 45%
HOW FSBO SELLERS WILL SELL THEIR CURRENT HOME - FSBO, Seller Did Not Know
Buyer (Percentage Distribution)
U.S.
Sell Themselves,
16%
Use a Real Estate Agent,
28%
Don't Know/ Not Sure, 56%
HOW FSBO SELLERS WILL SELL THEIR CURRENT HOME - FSBO, Seller Knew Buyer
(Percentage Distribution)
F
U.S.
The 2015 National Association of Realtors® Profile of Home Buyers and Selle Chapter 8, Page 16 o

FOR SALE BY OWNERS SELLERS
Exhibit 8-16
FSBO SELLERS SATISFACTION PROCESS OF SELLING HOME
(Percentage of Distribution)
Ohio U.S.
Very satisfied 55% Very satisfied 78%Somewhat
satisfied36% Somewhat
satisfied15%
Somewhat
dissatisfied9% Somewhat
dissatisfied5%
Very dissatisfied* Very
dissatisfied2%
Very satisfied 43% Very satisfied 67%Somewhat
satisfied43% Somewhat
satisfied25%
Somewhat
dissatisfied* Somewhat
dissatisfied5%
Very dissatisfied14% Very
dissatisfied3%
FSBO- Seller Knew
Buyer
FSBO- Seller Did Not
Know Buyer
FSBO- Seller Knew
Buyer
FSBO- Seller Did Not
Know Buyer
Very satisfied78%
Somewhat satisfied
15%
Somewhat dissatisfied
5%
Very dissatisfied2%
FSBO SELLERS SATISFACTION PROCESS OF SELLING HOME -Seller Knew Buyer
Very satisfied67%
Somewhat satisfied
25%
Somewhat dissatisfied
5%
Very dissatisfied3%
FSBO SELLERS SATISFACTION PROCESS OF SELLING HOME -Seller Did Not Know Buyer
Very satisfied, 55%
Somewhat satisfied, 36%
Somewhat dissatisfied, 9%
Very dissatisfied, 0%
FSBO SELLERS SATISFACTION PROCESS OF SELLING HOME -Seller Knew Buyer
Very satisfied, 43%
Somewhat satisfied, 43%
Somewhat dissatisfied, 0%
Very dissatisfied, 14%
FSBO SELLERS SATISFACTION PROCESS OF SELLING HOME -Seller Did Not Know Buyer
The 2015 National Association of Realtors® Profile of Home Buyers and Selle Chapter 8, Page 17 o