2016 Profile of Home Buyers & Sellers
144
2016 PROFILE OF HOME BUYERS AND SELLERS National Association of REALTORS® 35th Anniversary Edition e Voice for Real Estate®
-
Upload
jerry-charlton -
Category
Real Estate
-
view
761 -
download
0
Transcript of 2016 Profile of Home Buyers & Sellers

2016 PROFILE OF HOME BUYERS AND SELLERS
National Association of REALTORS®
35th Anniversary Edition
The Voice for Real Estate®
NAR RESEARCH STAFF
Lawrence Yun, Ph.D. Chief Economist and Senior Vice President
Caroline Van Hollen Manager, Budget Administration and Strategic Planning
Paul C. Bishop, Ph.D. Vice President
Stephanie Davis Administrative Coordinator
Jessica Lautz Managing Director, Survey Research and Communications
Meredith Dunn Research Communications Manager
Brandi Snowden Research Survey Analyst
Amanda Riggs Research Survey Analyst
Brian Horowitz Research Survey Analyst
Ken Fears Director, Regional Economics and Housing Finance
George Ratiu Director, Quantitative and Commercial Research
Danielle Hale Managing Director of Housing Statistics
Scholastica Cororaton Research Economist
Michael Hyman Research Data Specialist
Hua Zhong Data Analyst
Nadia Evangelou Research Economist
2016 LEADERSHIP TEAM
President Tom Salomone
President-Elect Bill Brown
First Vice President Elizabeth Mendenhall, ABR, ABRM, CIPS, CRB, GRI, PMN, EPRO
Treasurer Michael McGrew, CRB, CRS
Immediate Past President Chris Polychron, ABR, CIPS, CRS, GRI
Vice President Michael Labout, GRI, EPRO
Vice President Sherri Meadows, CIPS, CRB, GRI, PMN
Chief Executive Officer Dale Stinton, CAE, CPA, CMA, RCE

1
National Association of REALTORS®
National Association of REALTORS® n PROFILE OF HOME BUYERS AND SELLERS 2016©2016 National Association of REALTORS®
2016 PROFILE OF HOME BUYERS AND SELLERS
National Association of REALTORS®
35th Anniversary Edition

2016 PROFILE OF HOME BUYERS AND SELLERS
National Association of REALTORS® n PROFILE OF HOME BUYERS AND SELLERS 2016
3
National Association of REALTORS®
National Association of REALTORS® n PROFILE OF HOME BUYERS AND SELLERS 2016
Contents
Introduction ..................................................................................................................................4
Highlights ...................................................................................................................................... 6
Chapter 1: Characteristics of Home Buyers .......................................................................... 8
Chapter 2: Characteristics of Homes Purchased ..............................................................26
Chapter 3: The Home Search Process ................................................................................ 48
Chapter 4: Home Buying and Real Estate Professionals .................................................63
Chapter 5: Financing the Home Purchase ...........................................................................77
Chapter 6: Home Sellers and Their Selling Experience ................................................... 91
Chapter 7: Home Selling and Real Estate Professionals ................................................. 112
Chapter 8: For-Sale-by-Owner (FSBO) Sellers ................................................................. 121
Methodology ............................................................................................................................ 133
List of Exhibits .......................................................................................................................... 134

4
2016 PROFILE OF HOME BUYERS AND SELLERS
National Association of REALTORS® n PROFILE OF HOME BUYERS AND SELLERS 2016
Introduction
Buying a primary residence for home buyers is a financial
decision but also an emotional decision that involves
many lifestyle factors. For most home buyers, the
purchase of a primary residence is one of the largest financial
transactions they will make. Buyers purchase a home not only
for the desire to own a home of their own, but also because of
changes in jobs, family situations, and the need for a smaller
or larger living area.
This annual survey conducted by the NATIONAL
ASSOCIATION OF REALTORS® of recent home buyers and
sellers helps to gain insight into detailed information about
their unique experience with this transaction. The information
provided supplies understanding, from the consumer level, of
the trends that are transpiring. The survey covers information
on demographics, housing characteristics and the experience
of consumers in the housing market. Buyers and sellers also
provide valuable information on the role that real estate
professionals play in home sales transactions.
This year’s 2016 Profile of Home Buyers and Sellers is a special
commemorative anniversary report. NAR has administered the
survey since 1981. To mark the 35th year of publication, the
report highlights key trends in home buyer and seller behavior
that has changed or stayed the same over the decades with
historical trend line data. In this year’s edition, there are
expanded time series using the history of the collection.
The report has grown and evolved to keep up with changing
home buying trends and the need for more information. The
1981 survey was just 59 questions long. The 2016 survey
contained 132 questions. Although the report has evolved,
data has been collected for more than three decades
describing the demographic characteristics of home buyers
and sellers, buyers and sellers’ experience in the home
transaction process as well as market characteristics including
the use of real estate agents. One measure of how the market
has changed is the manner in which the data is collected.
In 1981, only a paper copy of the survey was offered. Today
recent home buyers can take the survey via paper or online,
and in English or Spanish. Because of its long history and
timely information available each year, the report is valued by
REALTORS®, market analysts, and policymakers.
Data is collected from a nationally representative sample
of recent home buyers who purchased a primary residence
in the 12-month period between July and June. Data is also
representative of the geographic distribution of home sales.
Consumer names are obtained from Experian, a firm that
maintains an extensive database of recent home buyers
derived from county records.
Today the data set provides a wealth of data that is used to
create a number of spin-off NAR reports including: Home
Buyer and Seller Generational Trends Report, Recent Home Buyer
Profiles, Profile of Home Buyers and Sellers in Sub-regions, Real
Estate in a Digital Age, Veterans and Active Military Home Buyers
and Sellers Profile, and Moving with Kids.
Jessica Lautz Meredith Dunn Brandi Snowden Amanda Riggs Brian Horowitz
October 2016
5
National Association of REALTORS®
National Association of REALTORS® n PROFILE OF HOME BUYERS AND SELLERS 2016
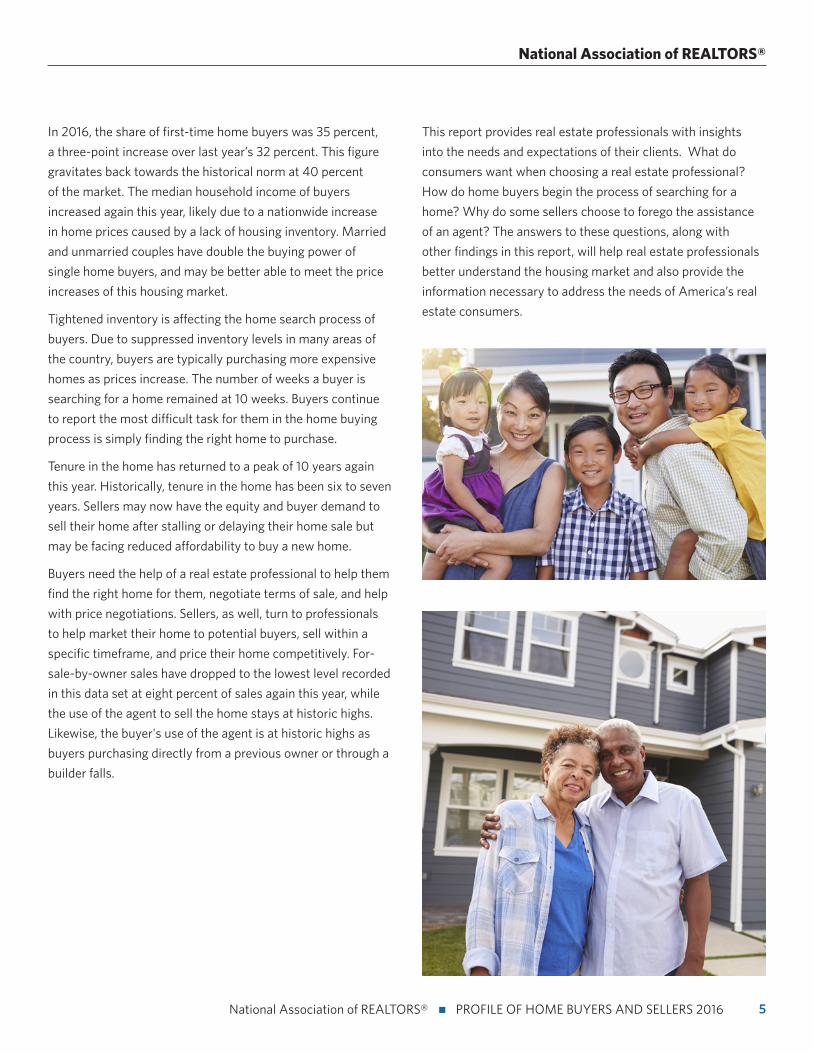
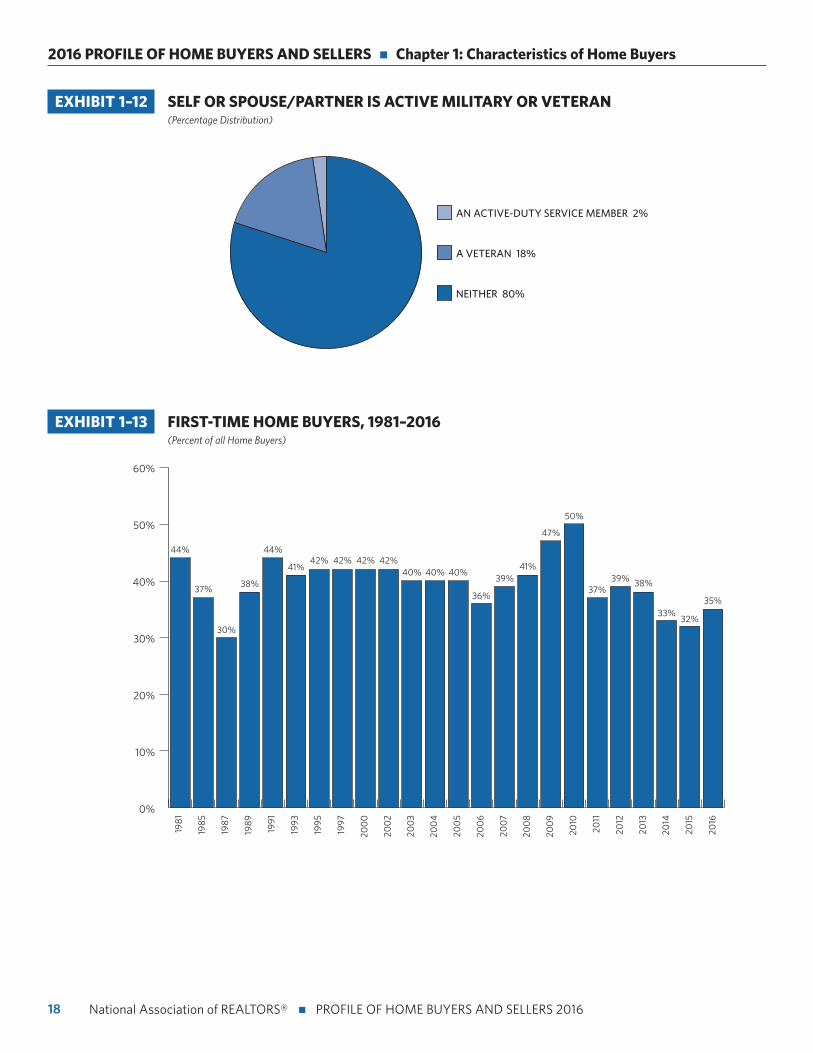
In 2016, the share of first-time home buyers was 35 percent,
a three-point increase over last year’s 32 percent. This figure
gravitates back towards the historical norm at 40 percent
of the market. The median household income of buyers
increased again this year, likely due to a nationwide increase
in home prices caused by a lack of housing inventory. Married
and unmarried couples have double the buying power of
single home buyers, and may be better able to meet the price
increases of this housing market.
Tightened inventory is affecting the home search process of
buyers. Due to suppressed inventory levels in many areas of
the country, buyers are typically purchasing more expensive
homes as prices increase. The number of weeks a buyer is
searching for a home remained at 10 weeks. Buyers continue
to report the most difficult task for them in the home buying
process is simply finding the right home to purchase.
Tenure in the home has returned to a peak of 10 years again
this year. Historically, tenure in the home has been six to seven
years. Sellers may now have the equity and buyer demand to
sell their home after stalling or delaying their home sale but
may be facing reduced affordability to buy a new home.
Buyers need the help of a real estate professional to help them
find the right home for them, negotiate terms of sale, and help
with price negotiations. Sellers, as well, turn to professionals
to help market their home to potential buyers, sell within a
specific timeframe, and price their home competitively. For-
sale-by-owner sales have dropped to the lowest level recorded
in this data set at eight percent of sales again this year, while
the use of the agent to sell the home stays at historic highs.
Likewise, the buyer's use of the agent is at historic highs as
buyers purchasing directly from a previous owner or through a
builder falls.
This report provides real estate professionals with insights
into the needs and expectations of their clients. What do
consumers want when choosing a real estate professional?
How do home buyers begin the process of searching for a
home? Why do some sellers choose to forego the assistance
of an agent? The answers to these questions, along with
other findings in this report, will help real estate professionals
better understand the housing market and also provide the
information necessary to address the needs of America’s real
estate consumers.
6
2016 PROFILE OF HOME BUYERS AND SELLERS
National Association of REALTORS® n PROFILE OF HOME BUYERS AND SELLERS 20166
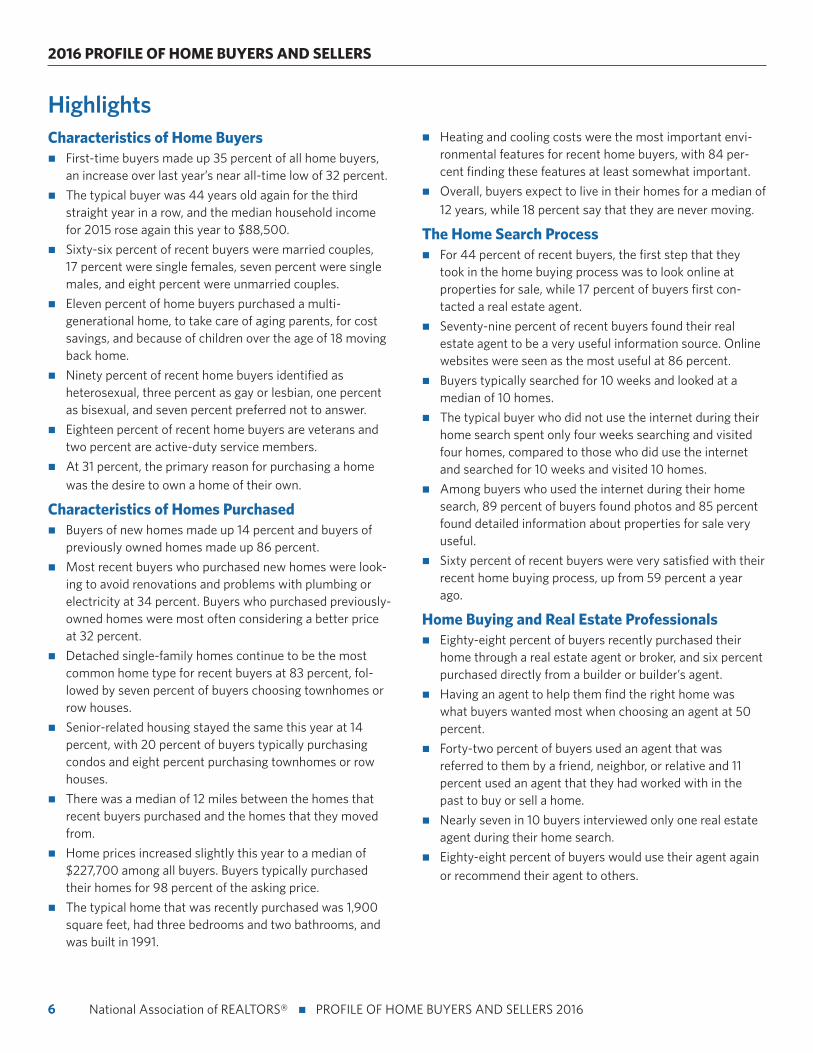
HighlightsCharacteristics of Home Buyersn First-time buyers made up 35 percent of all home buyers,
an increase over last year’s near all-time low of 32 percent.
n The typical buyer was 44 years old again for the third straight year in a row, and the median household income for 2015 rose again this year to $88,500.
n Sixty-six percent of recent buyers were married couples, 17 percent were single females, seven percent were single males, and eight percent were unmarried couples.
n Eleven percent of home buyers purchased a multi-generational home, to take care of aging parents, for cost savings, and because of children over the age of 18 moving back home.
n Ninety percent of recent home buyers identified as heterosexual, three percent as gay or lesbian, one percent as bisexual, and seven percent preferred not to answer.
n Eighteen percent of recent home buyers are veterans and two percent are active-duty service members.
n At 31 percent, the primary reason for purchasing a home was the desire to own a home of their own.
Characteristics of Homes Purchasedn Buyers of new homes made up 14 percent and buyers of
previously owned homes made up 86 percent.
nMost recent buyers who purchased new homes were look-ing to avoid renovations and problems with plumbing or electricity at 34 percent. Buyers who purchased previously-owned homes were most often considering a better price at 32 percent.
nDetached single-family homes continue to be the most common home type for recent buyers at 83 percent, fol-lowed by seven percent of buyers choosing townhomes or row houses.
nSenior-related housing stayed the same this year at 14 percent, with 20 percent of buyers typically purchasing condos and eight percent purchasing townhomes or row houses.
nThere was a median of 12 miles between the homes that recent buyers purchased and the homes that they moved from.
nHome prices increased slightly this year to a median of $227,700 among all buyers. Buyers typically purchased their homes for 98 percent of the asking price.
nThe typical home that was recently purchased was 1,900 square feet, had three bedrooms and two bathrooms, and was built in 1991.
nHeating and cooling costs were the most important envi-ronmental features for recent home buyers, with 84 per-cent finding these features at least somewhat important.
nOverall, buyers expect to live in their homes for a median of 12 years, while 18 percent say that they are never moving.
The Home Search Processn For 44 percent of recent buyers, the first step that they
took in the home buying process was to look online at properties for sale, while 17 percent of buyers first con-tacted a real estate agent.
n Seventy-nine percent of recent buyers found their real estate agent to be a very useful information source. Online websites were seen as the most useful at 86 percent.
n Buyers typically searched for 10 weeks and looked at a median of 10 homes.
n The typical buyer who did not use the internet during their home search spent only four weeks searching and visited four homes, compared to those who did use the internet and searched for 10 weeks and visited 10 homes.
n Among buyers who used the internet during their home search, 89 percent of buyers found photos and 85 percent found detailed information about properties for sale very useful.
n Sixty percent of recent buyers were very satisfied with their recent home buying process, up from 59 percent a year ago.
Home Buying and Real Estate Professionalsn Eighty-eight percent of buyers recently purchased their
home through a real estate agent or broker, and six percent purchased directly from a builder or builder’s agent.
n Having an agent to help them find the right home was what buyers wanted most when choosing an agent at 50 percent.
n Forty-two percent of buyers used an agent that was referred to them by a friend, neighbor, or relative and 11 percent used an agent that they had worked with in the past to buy or sell a home.
n Nearly seven in 10 buyers interviewed only one real estate agent during their home search.
n Eighty-eight percent of buyers would use their agent again or recommend their agent to others.
7
National Association of REALTORS®
National Association of REALTORS® n PROFILE OF HOME BUYERS AND SELLERS 2016 7
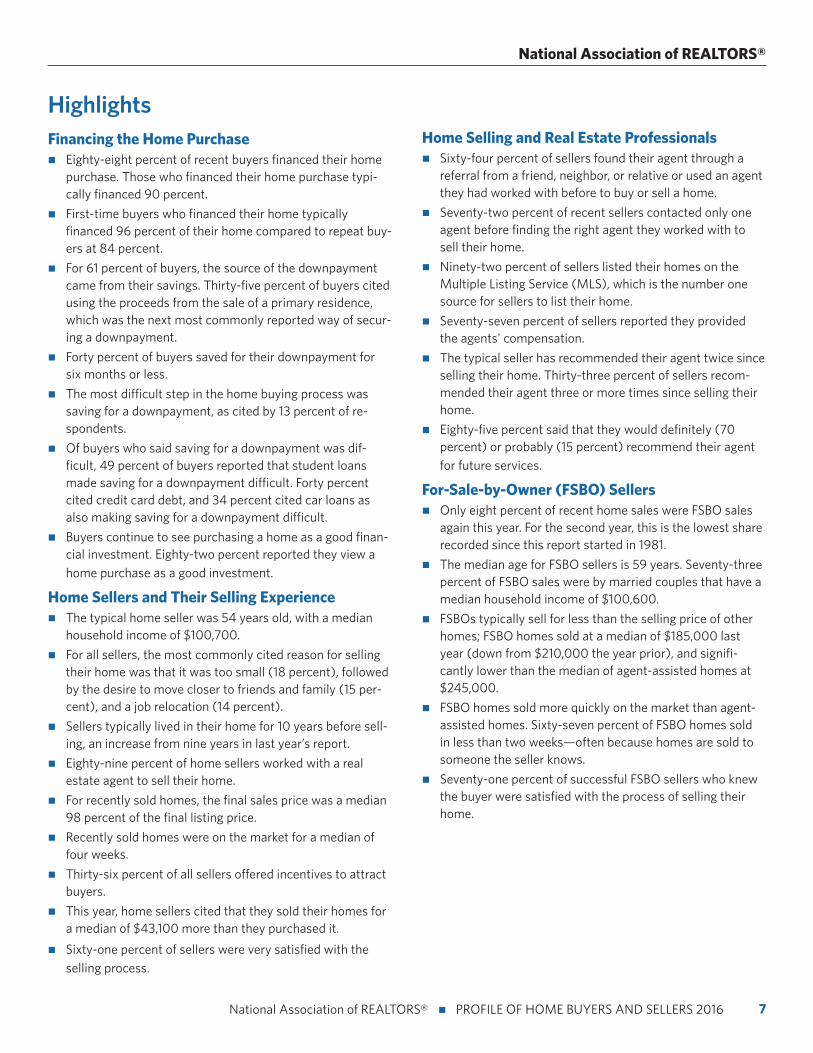
Financing the Home Purchasen Eighty-eight percent of recent buyers financed their home
purchase. Those who financed their home purchase typi-cally financed 90 percent.
n First-time buyers who financed their home typically financed 96 percent of their home compared to repeat buy-ers at 84 percent.
n For 61 percent of buyers, the source of the downpayment came from their savings. Thirty-five percent of buyers cited using the proceeds from the sale of a primary residence, which was the next most commonly reported way of secur-ing a downpayment.
n Forty percent of buyers saved for their downpayment for six months or less.
n The most difficult step in the home buying process was saving for a downpayment, as cited by 13 percent of re-spondents.
n Of buyers who said saving for a downpayment was dif-ficult, 49 percent of buyers reported that student loans made saving for a downpayment difficult. Forty percent cited credit card debt, and 34 percent cited car loans as also making saving for a downpayment difficult.
n Buyers continue to see purchasing a home as a good finan-cial investment. Eighty-two percent reported they view a home purchase as a good investment.
Home Sellers and Their Selling Experiencen The typical home seller was 54 years old, with a median
household income of $100,700.
n For all sellers, the most commonly cited reason for selling their home was that it was too small (18 percent), followed by the desire to move closer to friends and family (15 per-cent), and a job relocation (14 percent).
n Sellers typically lived in their home for 10 years before sell-ing, an increase from nine years in last year’s report.
n Eighty-nine percent of home sellers worked with a real estate agent to sell their home.
n For recently sold homes, the final sales price was a median 98 percent of the final listing price.
n Recently sold homes were on the market for a median of four weeks.
n Thirty-six percent of all sellers offered incentives to attract buyers.
n This year, home sellers cited that they sold their homes for a median of $43,100 more than they purchased it.
n Sixty-one percent of sellers were very satisfied with the selling process.
Home Selling and Real Estate Professionalsn Sixty-four percent of sellers found their agent through a
referral from a friend, neighbor, or relative or used an agent they had worked with before to buy or sell a home.
n Seventy-two percent of recent sellers contacted only one agent before finding the right agent they worked with to sell their home.
n Ninety-two percent of sellers listed their homes on the Multiple Listing Service (MLS), which is the number one source for sellers to list their home.
n Seventy-seven percent of sellers reported they provided the agents' compensation.
n The typical seller has recommended their agent twice since selling their home. Thirty-three percent of sellers recom-mended their agent three or more times since selling their home.
n Eighty-five percent said that they would definitely (70 percent) or probably (15 percent) recommend their agent for future services.
For-Sale-by-Owner (FSBO) Sellersn Only eight percent of recent home sales were FSBO sales
again this year. For the second year, this is the lowest share recorded since this report started in 1981.
n The median age for FSBO sellers is 59 years. Seventy-three percent of FSBO sales were by married couples that have a median household income of $100,600.
n FSBOs typically sell for less than the selling price of other homes; FSBO homes sold at a median of $185,000 last year (down from $210,000 the year prior), and signifi-cantly lower than the median of agent-assisted homes at $245,000.
n FSBO homes sold more quickly on the market than agent-assisted homes. Sixty-seven percent of FSBO homes sold in less than two weeks—often because homes are sold to someone the seller knows.
n Seventy-one percent of successful FSBO sellers who knew the buyer were satisfied with the process of selling their home.
Highlights
2016 PROFILE OF HOME BUYERS AND SELLERS
National Association of REALTORS® n PROFILE OF HOME BUYERS AND SELLERS 2016National Association of REALTORS® | PROFILE OF HOME BUYERS AND SELLERS 20158
CHAPTER 1:
Characteristics of Home Buyers
The NATIONAL ASSOCIATION OF REALTORS®’s Profile of Home Buyers and Sellers report has become a leading industry source of trusted insight into consumer behavior. This year marks the 35th anniversary of the Profile of
Home Buyers and Sellers report, and we examine the 2016 data by comparing trends over the last three and a half decades. The share of first-time home buyers has been a key indicator of the market. In 2016, the share of first-time home buyers was 35 percent, an increase over last year’s near all-time low of 32 percent. This figure is still below the historical norm of 40 percent of primary residence home buyers in the market.
By comparison in 1981, the share of first-time buyers was 44 percent. In 1987, the number fell to an all-time low of 30 percent, but jumped back to 44 percent in 1991. The share remained between 40 and 42 percent from 1993 to 2005 until it took a dip in 2006 to 36 percent. In 2010, with the help of the federal government tax credit to boost home sales demand of first-time buyers, the share reached a peak at 50 percent—the highest in NAR’s 35-years of data. From 2011 to 2016, the share of first-time home buyers has been under the historical norm of 40 percent as buy-ers face tight inventory, rising home prices, rising rents, and high student debt loads.
The largest share of home buyers continues to be the 25 to 34 age group, account-ing for 26 percent of all buyers. The median household income for 2015 rose again this year to $88,500 from $86,100 in last year’s report. The share of married cou-ples decreased to 66 percent this year, and single females increased to 17 percent in 2016. Thirty-eight percent of all buyers had children under the age of 18 living at home, up from 37 percent last year.
As to be expected, 74 percent of first-time home buyers rented their previous living arrangement, whereas 70 percent (up from 66 percent in the previous year) of repeat buyers owned their previous residence. For first-time home buyers, 67 per-cent purchased for the desire to own a home of their own (jumping up from 64 percent last year).
9
National Association of REALTORS®
National Association of REALTORS® n PROFILE OF HOME BUYERS AND SELLERS 2016
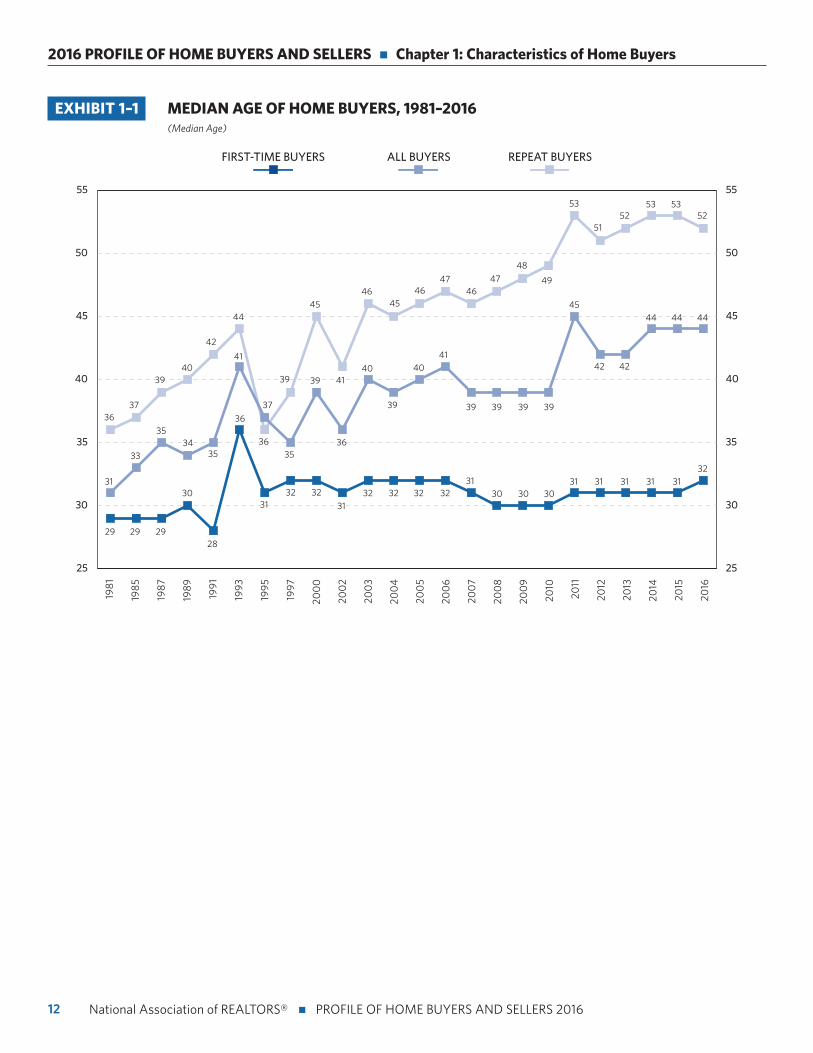
Demographic Characteristics of Home Buyers
• Exhibits 1–1 through 1–6
The demographics of home buyers continue to shift over
the last several years due to tightened credit conditions and
sparse inventory on the market which are driving up home
sale prices. The Profile of Home Buyers and Sellers has collected
data on the median age over the course of its 35-year history.
The median age remained at 44 years old again for the third
straight year in a row. The median age for first-time buyers
rose slightly to 32 years after staying at 31 years since 2011,
and the median age for repeat buyers fell slightly to 52 years
after holding at 53 years for two years in a row.
By comparison, the median age for all buyers in 1981 was
31 years. The median age for all buyers had predominantly
been in the mid-thirties from 1985 to 2004 with brief years
peaking at 41 in 1993, 40 in 2003 and 2005, and 41 in 2006.
From 2007 through 2010, the median age held steady at 39
years, but was broken in 2011 when it jumped up to the oldest
median age of 45 years for all buyers in the history of NAR
collecting the data.
Similarly, the median age of first-time buyers was 29 in 1981.
The median age for first-time buyers peaked at 36 years in
1993, then remained between 30 to 32 for over 20 years
from 1995 to 2016. The median age for all buyers rose as the
median age for repeat buyers has increased over time. In 1981,
the median age for repeat buyers was 36. It was only that low
once more in 1995, whence it has steadily increased over the
years. In 2011, it broke the 50-year mark and rose to a median
of 53 years, the highest age in three and a half decades. The
median age remained at 53 years in 2014 and 2015 before
declining to 52 years in 2016.
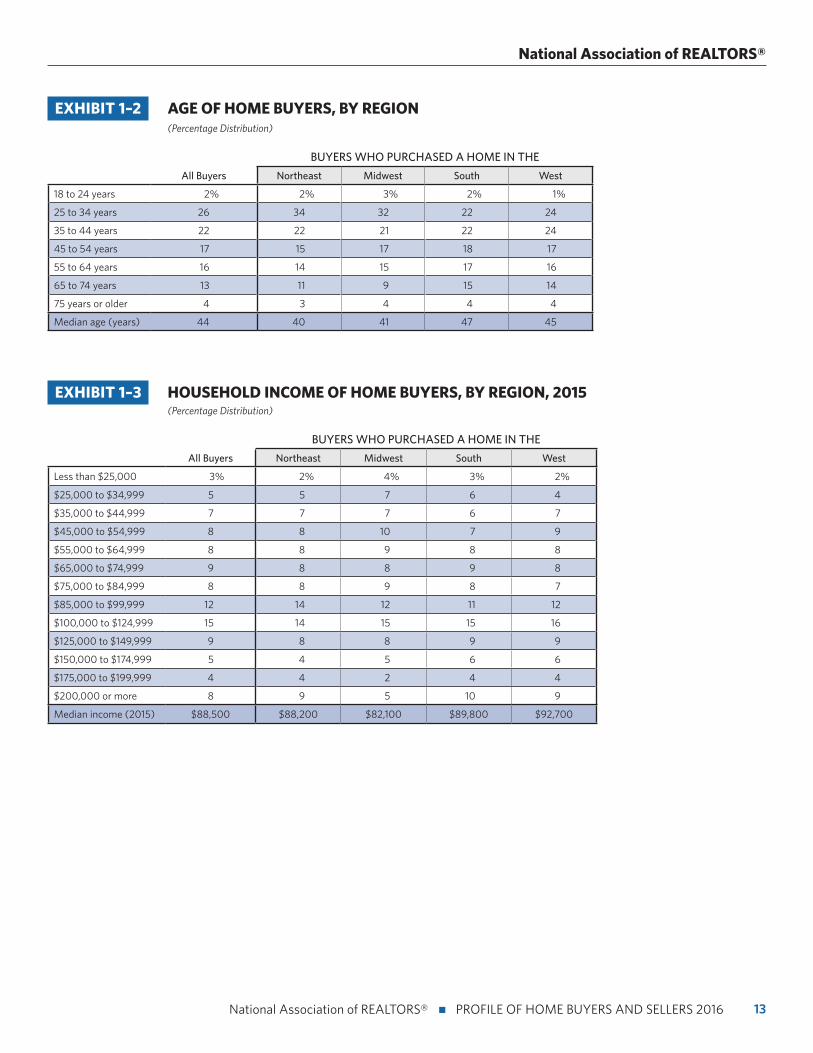
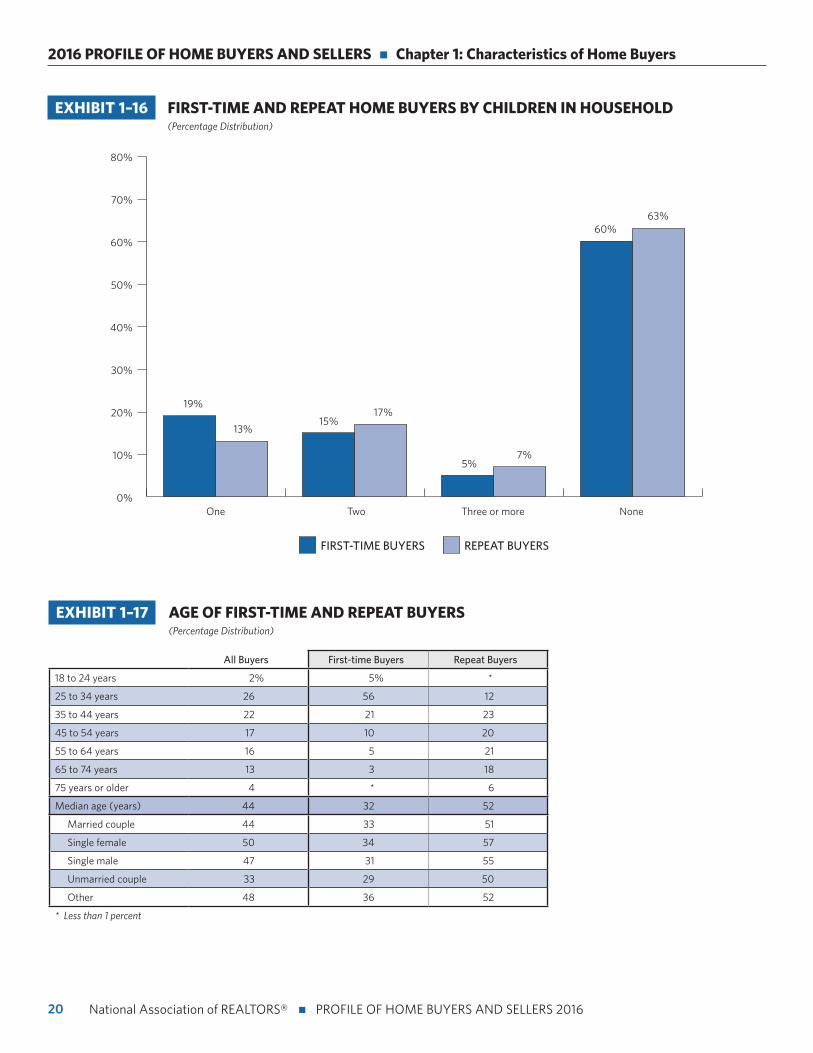
The largest share of home buyers continues to be in the 25 to
34 age group, accounting for 26 percent of all buyers (down
from 28 percent last year), followed by 35 to 44 years at
22 percent (up from 20 percent), and 45 to 54 years at 17
percent. The median household income for 2015 rose again
this year to $88,500 from $86,100 in last year’s report. Buyers
in the Northeast region tend to be younger, while buyers in
the West and South regions tend to be older. Buyers in the
West region had the highest incomes this year, followed by
the South.
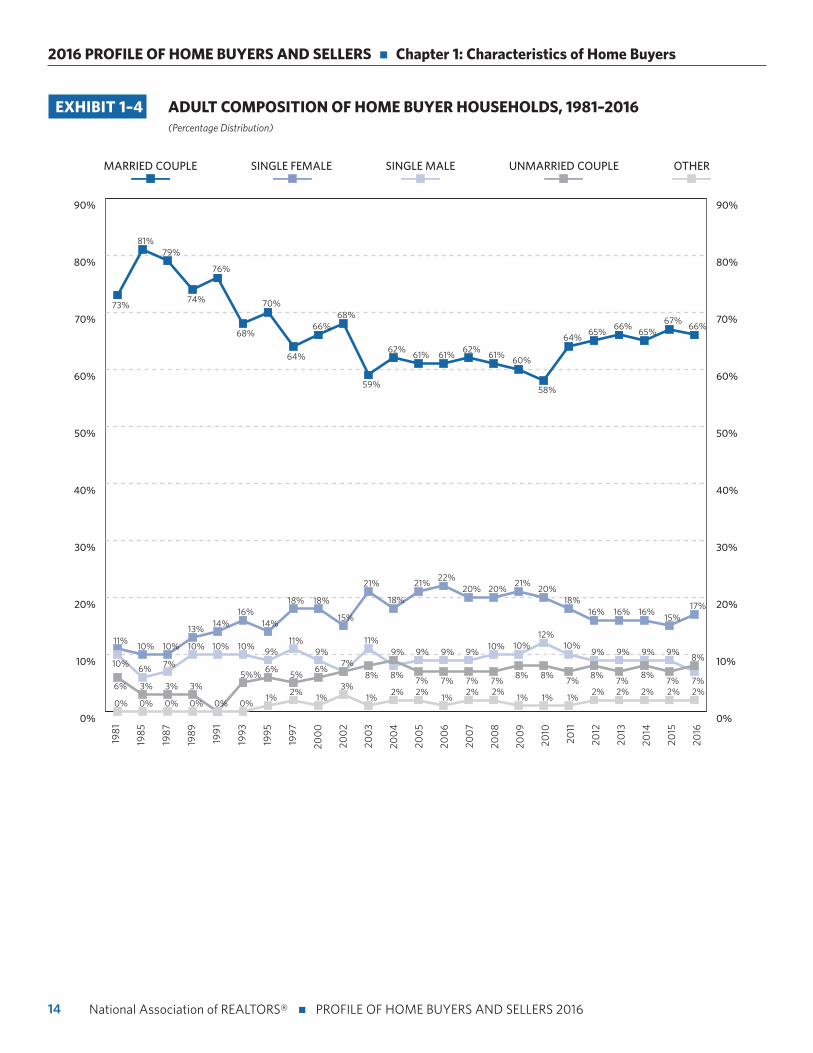
The share of married couples decreased to 66 percent this
year, down slightly from 67 percent. The share of single
females increased to 17 percent in 2016 from 15 percent last
year, and single males dropped to seven percent from nine in
2015, both suppressed due to market conditions. Unmarried
couples increased slightly to eight percent from seven percent
in the previous year. Dual incomes from married couples had
stronger purchasing power than single buyers.
The Profile of Home Buyers and Sellers report has collected
data on household composition since 1981, when the share
of married couples accounted for 73 percent of all homes
purchased, single females purchased 11 percent of homes, and
single males 10 percent. The share of married couples peaked
at 81 percent in 1985, then steadily declined over the years.
In 2010, the share of married couples was at a low point at
58 percent of all homes purchased. Single females remained
above 20 percent from 2005 to 2010, at which point the share
started to decline, hovering at 16 percent from 2012 through
2014. The share of single male buyers hit a 35-year peak in
2010 at 12 percent before steadily declining to seven percent
in 2016.
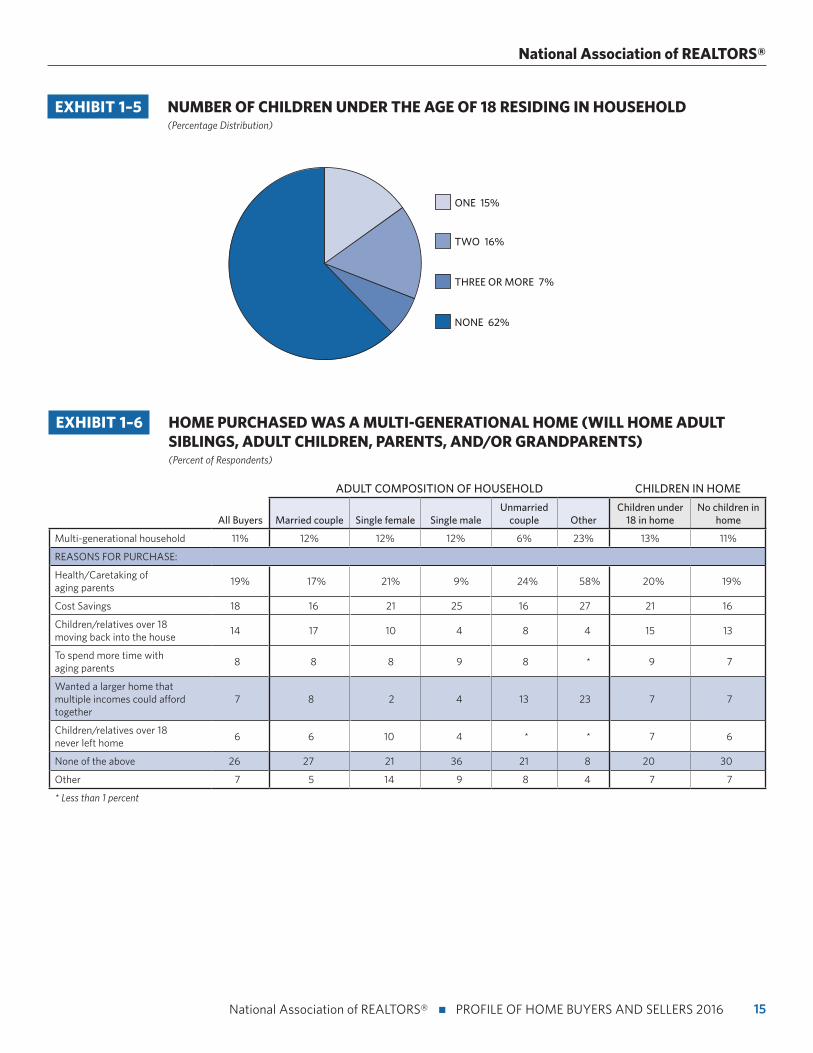
Thirty-eight percent of all buyers had children under the age of
18 living at home, up from 37 percent last year. Eleven percent
(down from 13 percent last year) of home buyers purchased
a multi-generational home—a home that had adult siblings,
adult children over the age of 18, parents, and/or grandparents
in the household. The top three reasons for purchasing a
multi-generational home was to take care of aging parents
(19 percent), cost savings (18 percent, up from 15 percent last
year), and children over the age of 18 moving back home (14
percent, up from 11 percent last year).
10
2016 PROFILE OF HOME BUYERS AND SELLERS n Chapter 1: Characteristics of Home Buyers
National Association of REALTORS® n PROFILE OF HOME BUYERS AND SELLERS 2016
Demographic Characteristics of First-Time and Repeat Home Buyers
• Exhibits 1–13 through 1–18
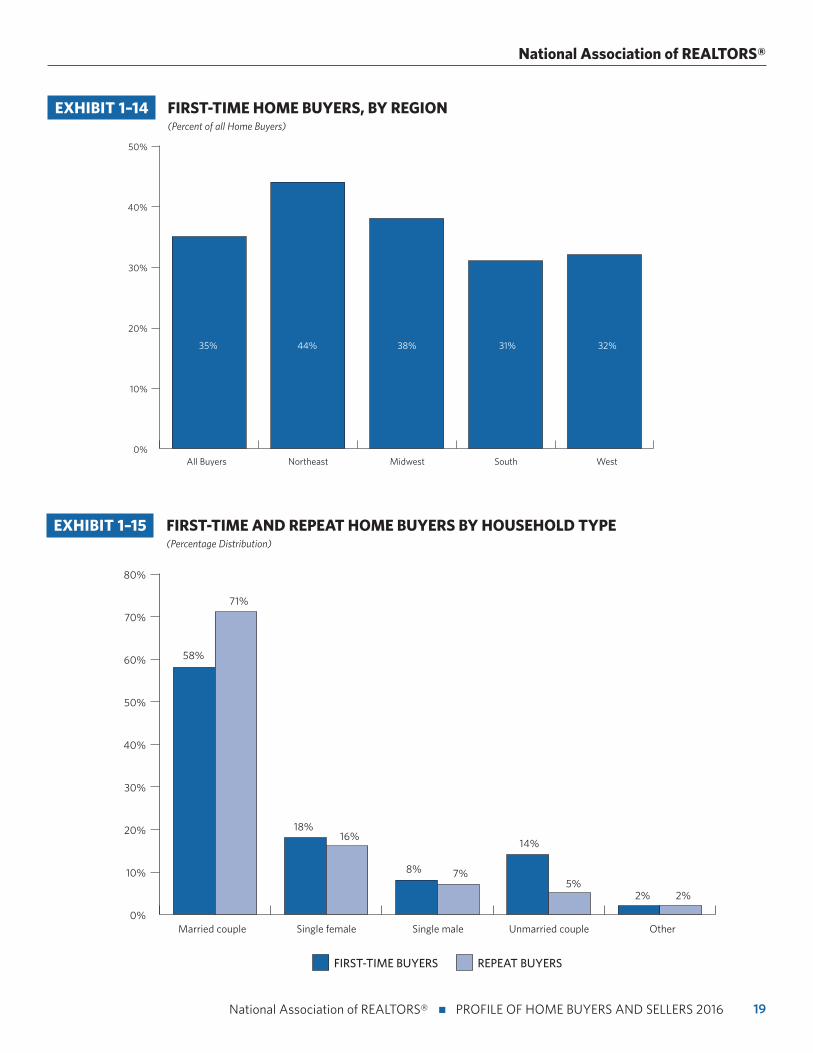
First-time home buyers increased to 35 percent of the market
share (up from 32 percent last year), but still are below the
historical norm of 40 percent among primary residence
home buyers. Since 2011, the share of first-time home buyers
has been suppressed. In 2015, it was the lowest share since
1987, when the share of first-time home buyers reported was
30 percent. The Northeast region had the largest share of
first-time home buyers at 44 percent and the South had the
smallest share at 31 percent.
The share of married couples rose again among first-time
buyers to 58 percent, up from 56 percent last year, and repeat
buyers declined to 71 percent this year, down from 72 percent
the year before. Thirty-nine percent of first-time buyers
reported having children under the age of 18 living at home,
compared to 37 percent for repeat buyers. The median age of
first-time buyers increased slightly to 32 (up from 31 last year)
and decreased to 52 for repeat buyers (down from 53 years).
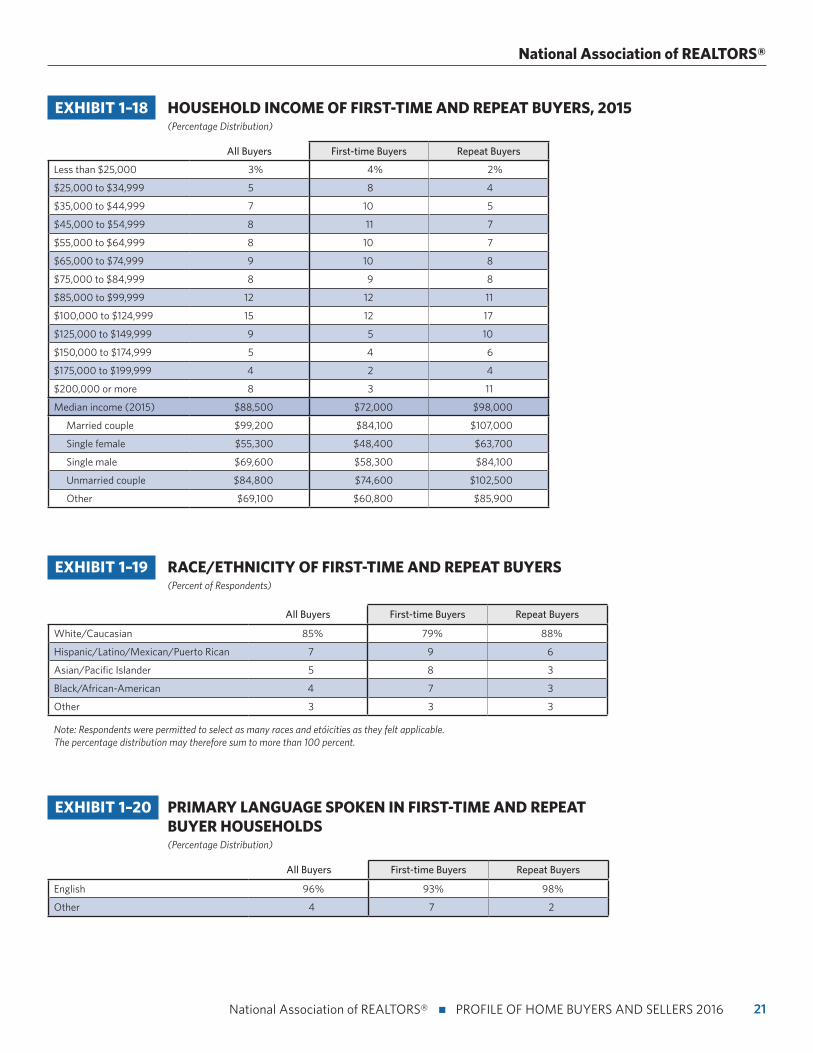
The median household income rose for first-time buyers
and remained nearly flat for repeat buyers, although the gap
between them varies greatly. First-time home buyers reported
a median income of $72,000 (up from $69,400 last year) and
$98,000 (down from $98,700 last year) for repeat buyers.
Married repeat buyers have the highest income among all
buyers at $107,000. Increased median household income
could suggest stricter financing and rising home prices is
forcing low income buyers out of the market.
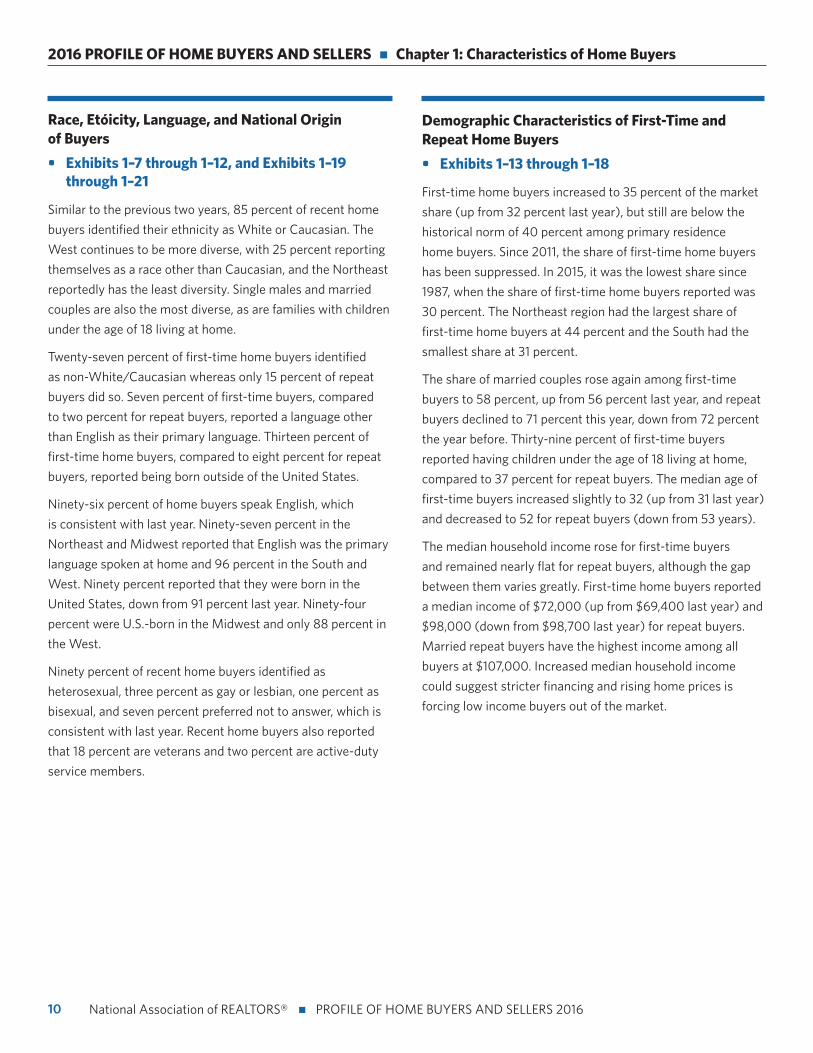
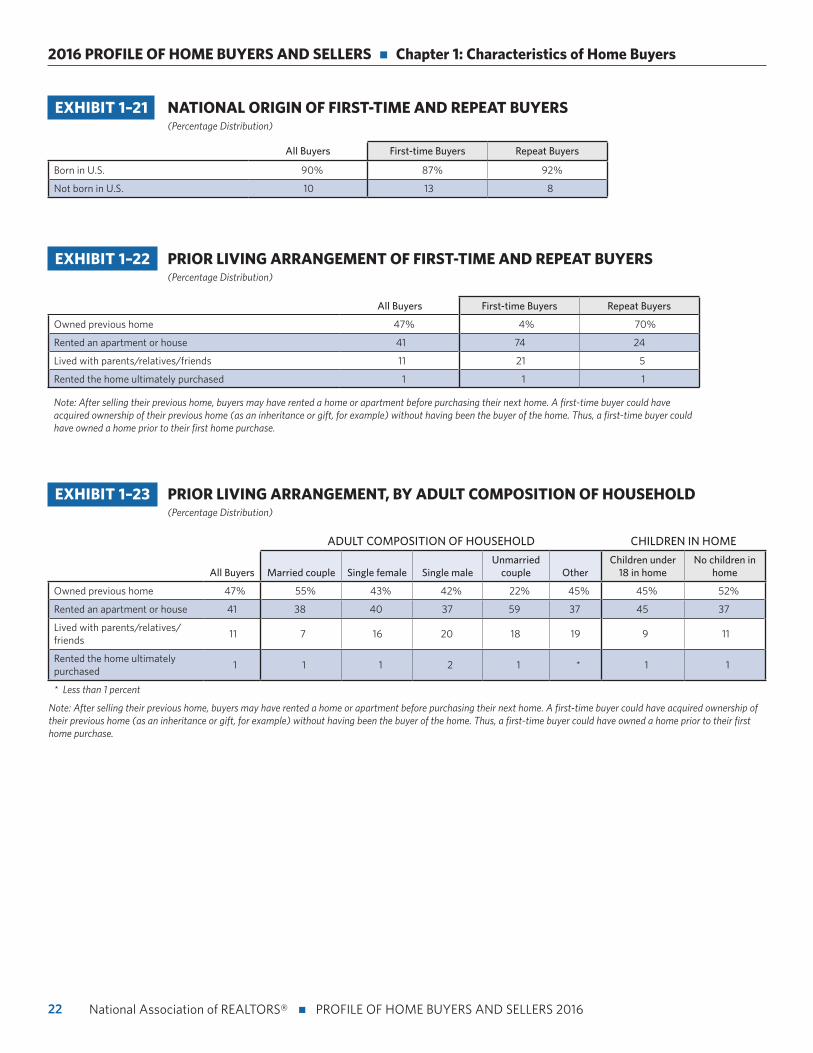
Race, Ethnicity, Language, and National Origin of Buyers
• Exhibits 1–7 through 1–12, and Exhibits 1–19 through 1–21
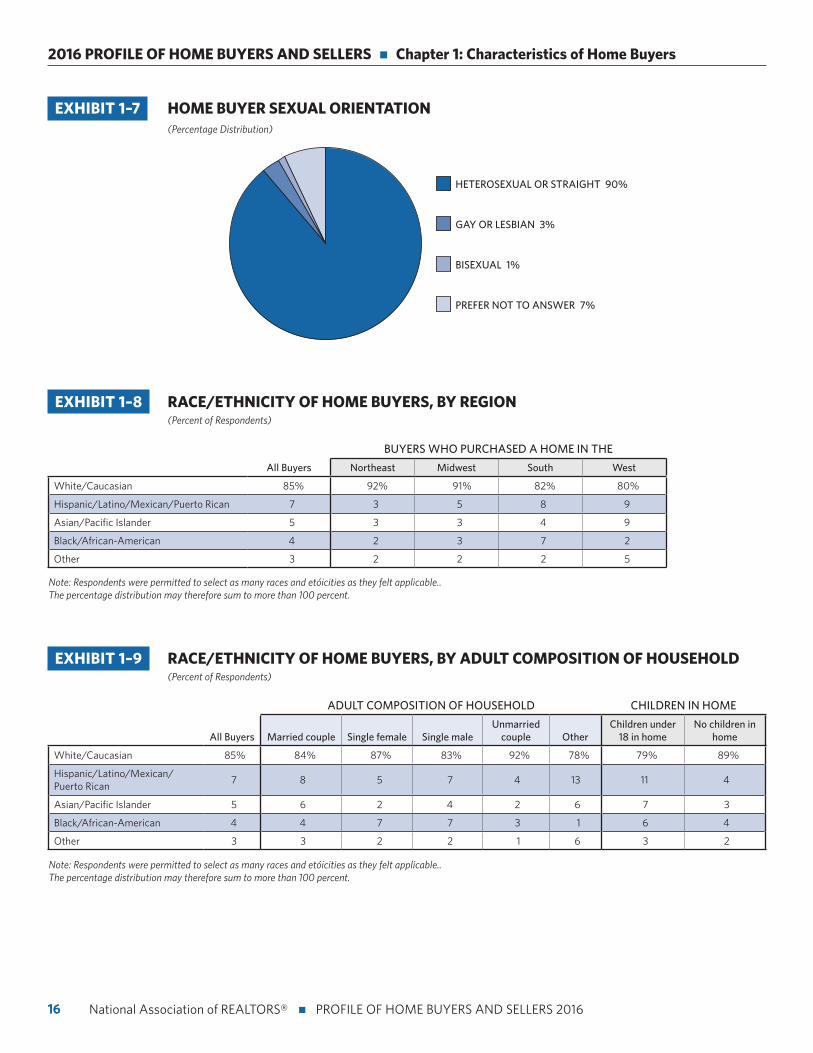
Similar to the previous two years, 85 percent of recent home
buyers identified their ethnicity as White or Caucasian. The
West continues to be more diverse, with 25 percent reporting
themselves as a race other than Caucasian, and the Northeast
reportedly has the least diversity. Single males and married
couples are also the most diverse, as are families with children
under the age of 18 living at home.
Twenty-seven percent of first-time home buyers identified
as non-White/Caucasian whereas only 15 percent of repeat
buyers did so. Seven percent of first-time buyers, compared
to two percent for repeat buyers, reported a language other
than English as their primary language. Thirteen percent of
first-time home buyers, compared to eight percent for repeat
buyers, reported being born outside of the United States.
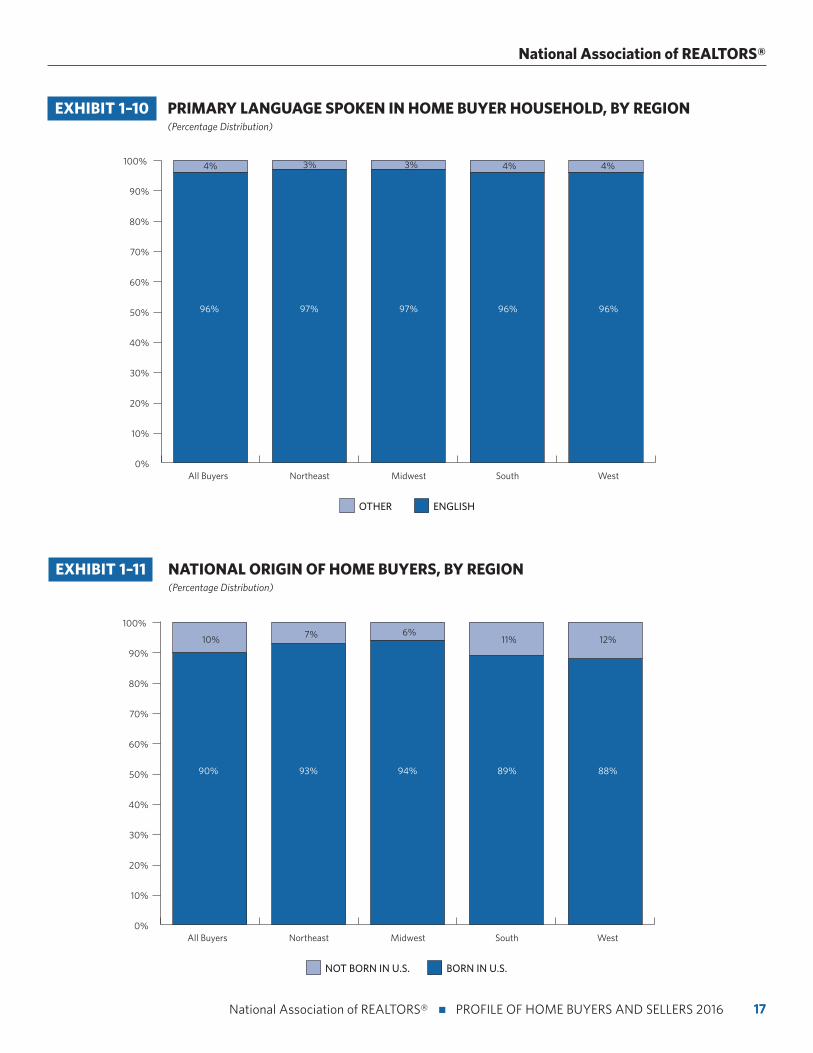
Ninety-six percent of home buyers speak English, which
is consistent with last year. Ninety-seven percent in the
Northeast and Midwest reported that English was the primary
language spoken at home and 96 percent in the South and
West. Ninety percent reported that they were born in the
United States, down from 91 percent last year. Ninety-four
percent were U.S.-born in the Midwest and only 88 percent in
the West.
Ninety percent of recent home buyers identified as
heterosexual, three percent as gay or lesbian, one percent as
bisexual, and seven percent preferred not to answer, which is
consistent with last year. Recent home buyers also reported
that 18 percent are veterans and two percent are active-duty
service members.
11
National Association of REALTORS®
National Association of REALTORS® n PROFILE OF HOME BUYERS AND SELLERS 2016
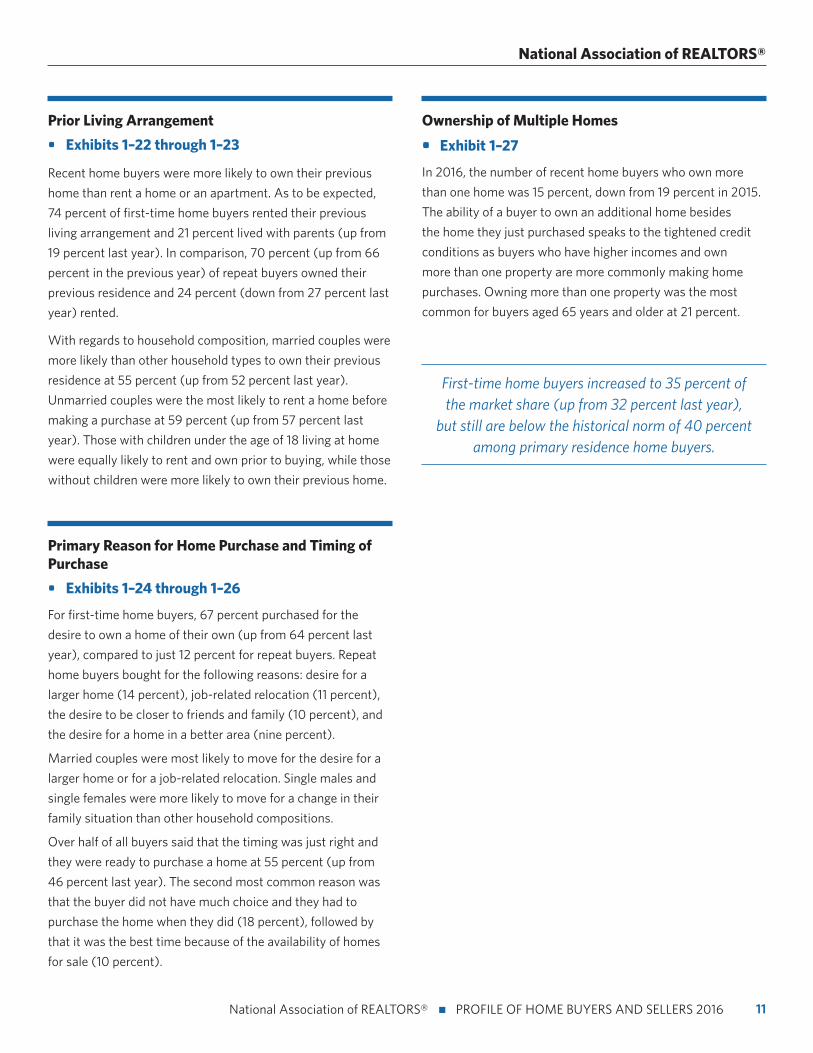
Prior Living Arrangement
• Exhibits 1–22 through 1–23
Recent home buyers were more likely to own their previous
home than rent a home or an apartment. As to be expected,
74 percent of first-time home buyers rented their previous
living arrangement and 21 percent lived with parents (up from
19 percent last year). In comparison, 70 percent (up from 66
percent in the previous year) of repeat buyers owned their
previous residence and 24 percent (down from 27 percent last
year) rented.
With regards to household composition, married couples were
more likely than other household types to own their previous
residence at 55 percent (up from 52 percent last year).
Unmarried couples were the most likely to rent a home before
making a purchase at 59 percent (up from 57 percent last
year). Those with children under the age of 18 living at home
were equally likely to rent and own prior to buying, while those
without children were more likely to own their previous home.
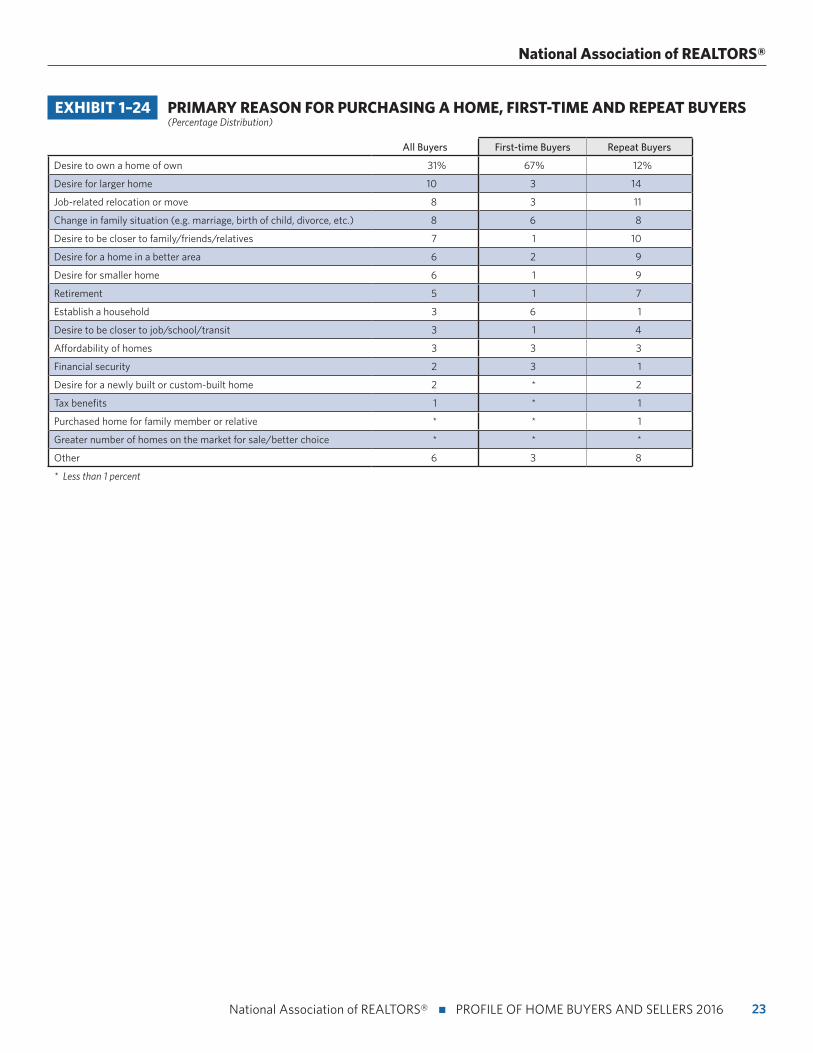
Primary Reason for Home Purchase and Timing of Purchase
• Exhibits 1–24 through 1–26
For first-time home buyers, 67 percent purchased for the
desire to own a home of their own (up from 64 percent last
year), compared to just 12 percent for repeat buyers. Repeat
home buyers bought for the following reasons: desire for a
larger home (14 percent), job-related relocation (11 percent),
the desire to be closer to friends and family (10 percent), and
the desire for a home in a better area (nine percent).
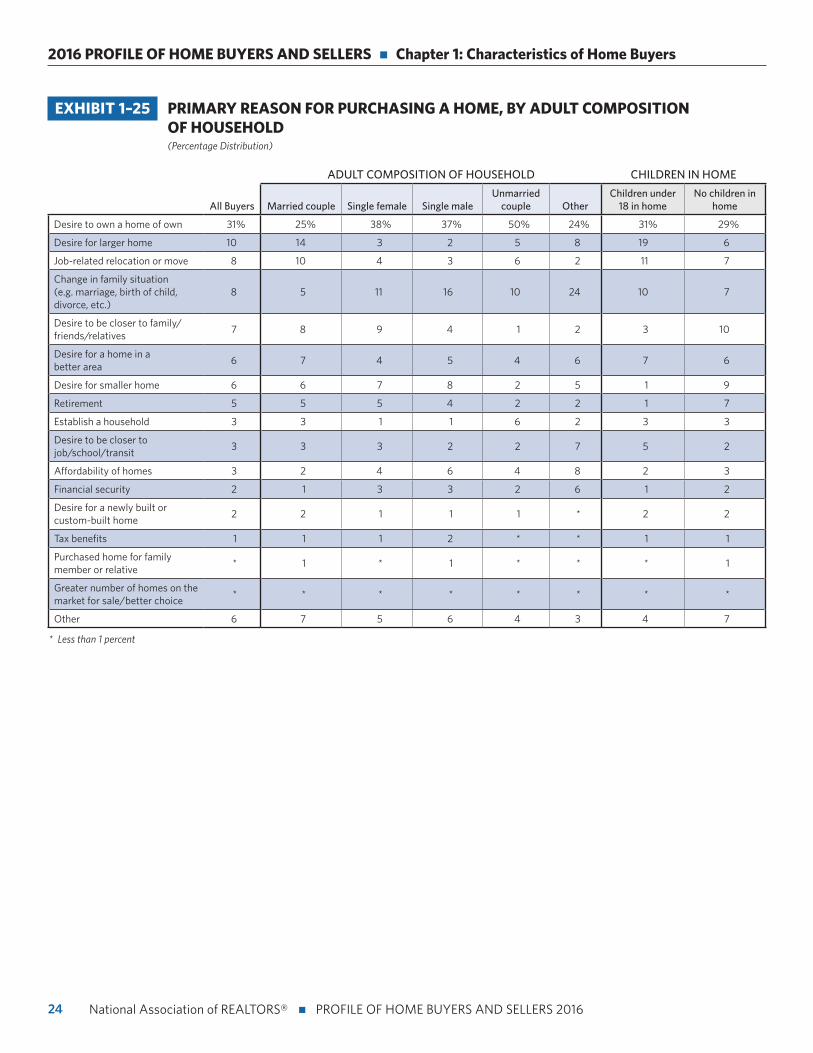
Married couples were most likely to move for the desire for a
larger home or for a job-related relocation. Single males and
single females were more likely to move for a change in their
family situation than other household compositions.
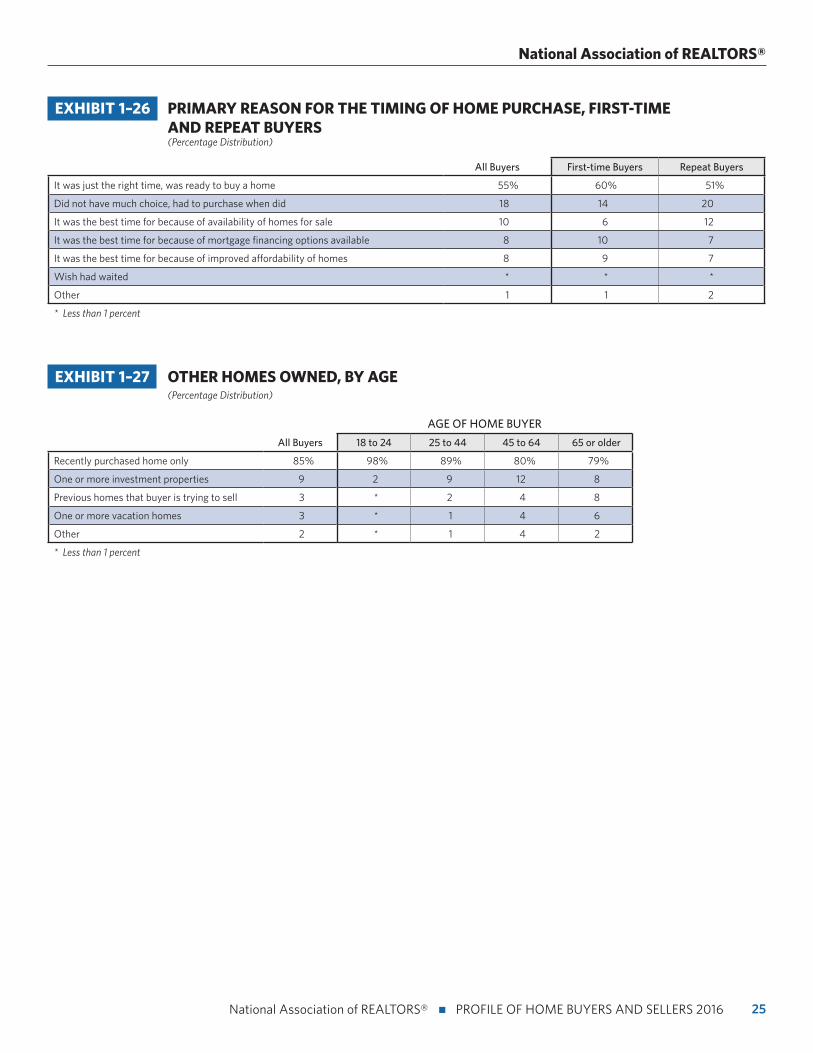
Over half of all buyers said that the timing was just right and
they were ready to purchase a home at 55 percent (up from
46 percent last year). The second most common reason was
that the buyer did not have much choice and they had to
purchase the home when they did (18 percent), followed by
that it was the best time because of the availability of homes
for sale (10 percent).
Ownership of Multiple Homes
• Exhibit 1–27
In 2016, the number of recent home buyers who own more
than one home was 15 percent, down from 19 percent in 2015.
The ability of a buyer to own an additional home besides
the home they just purchased speaks to the tightened credit
conditions as buyers who have higher incomes and own
more than one property are more commonly making home
purchases. Owning more than one property was the most
common for buyers aged 65 years and older at 21 percent.
First-time home buyers increased to 35 percent of the market share (up from 32 percent last year),
but still are below the historical norm of 40 percent among primary residence home buyers.
12
2016 PROFILE OF HOME BUYERS AND SELLERS n Chapter 1: Characteristics of Home Buyers
National Association of REALTORS® n PROFILE OF HOME BUYERS AND SELLERS 2016
EXHIBIT 1–1 MEDIAN AGE OF HOME BUYERS, 1981–2016 (Median Age)
25
30
35
40
45
50
55
25
30
35
40
45
50
55
REPEAT BUYERSALL BUYERSFIRST-TIME BUYERS
45
41
4645
4647
4647
48
49
53
51
5352
5352
39
36
44
42
4039
3736
31
33
3534
35
36
37
35
39
36
40
39
4041
39 39 3939
45
42 42
44 44 44
29 29 29
30
28
3132 32
3132 32 32 32
3130 30 30
31 31 31 31 3132
41
13
National Association of REALTORS®
National Association of REALTORS® n PROFILE OF HOME BUYERS AND SELLERS 2016
EXHIBIT 1–3 HOUSEHOLD INCOME OF HOME BUYERS, BY REGION, 2015 (Percentage Distribution)
BUYERS WHO PURCHASED A HOME IN THE
All Buyers Northeast Midwest South West
Less than $25,000 3% 2% 4% 3% 2%
$25,000 to $34,999 5 5 7 6 4
$35,000 to $44,999 7 7 7 6 7
$45,000 to $54,999 8 8 10 7 9
$55,000 to $64,999 8 8 9 8 8
$65,000 to $74,999 9 8 8 9 8
$75,000 to $84,999 8 8 9 8 7
$85,000 to $99,999 12 14 12 11 12
$100,000 to $124,999 15 14 15 15 16
$125,000 to $149,999 9 8 8 9 9
$150,000 to $174,999 5 4 5 6 6
$175,000 to $199,999 4 4 2 4 4
$200,000 or more 8 9 5 10 9
Median income (2015) $88,500 $88,200 $82,100 $89,800 $92,700
EXHIBIT 1–2 AGE OF HOME BUYERS, BY REGION (Percentage Distribution)
BUYERS WHO PURCHASED A HOME IN THE
All Buyers Northeast Midwest South West
18 to 24 years 2% 2% 3% 2% 1%
25 to 34 years 26 34 32 22 24
35 to 44 years 22 22 21 22 24
45 to 54 years 17 15 17 18 17
55 to 64 years 16 14 15 17 16
65 to 74 years 13 11 9 15 14
75 years or older 4 3 4 4 4
Median age (years) 44 40 41 47 45
14
2016 PROFILE OF HOME BUYERS AND SELLERS n Chapter 1: Characteristics of Home Buyers
National Association of REALTORS® n PROFILE OF HOME BUYERS AND SELLERS 2016
EXHIBIT 1–4 ADULT COMPOSITION OF HOME BUYER HOUSEHOLDS, 1981–2016 (Percentage Distribution)
0%
10%
20%
30%
40%
50%
60%
70%
80%
90%
0%
10%
20%
30%
40%
50%
60%
70%
80%
90%
OTHERUNMARRIED COUPLESINGLE MALESINGLE FEMALEMARRIED COUPLE
74%
10%
68%
76%
70%
64%
66%
62%
58%
60%
64%65%
67%66%
65%66%
10%
5%%
79%
11%
8%
9%
7%
9%11%
3%
7%
3%
13%
6%
10%
18%
9% 9%11%
73%
81%
7%
2%2%
6%
61%
68%
59%
61%61%62%
0% 0% 0%
10%
0% 0% 0%2%
1% 1%3%
1%2% 2%
1%2% 2%
1% 1% 1%2% 2% 2%
8%6% 3%
6%10%
10%
7%
9%
7%
9%10%
7%
10%
8% 8%
12%10%
7%8%
9%
7%
9%
8%
9%
7%
9%
7%
8%
14%16%
14%
18%
15%
21%
18%
21%22%
20% 20%21%
20%18%
16% 16% 16%15%
17%
5%
15
National Association of REALTORS®
National Association of REALTORS® n PROFILE OF HOME BUYERS AND SELLERS 2016
EXHIBIT 1–5 NUMBER OF CHILDREN UNDER THE AGE OF 18 RESIDING IN HOUSEHOLD (Percentage Distribution)
EXHIBIT 1–6 HOME PURCHASED WAS A MULTI-GENERATIONAL HOME (WILL HOME ADULT SIBLINGS, ADULT CHILDREN, PARENTS, AND/OR GRANDPARENTS) (Percent of Respondents)
ADULT COMPOSITION OF HOUSEHOLD CHILDREN IN HOME
All Buyers Married couple Single female Single maleUnmarried
couple OtherChildren under
18 in homeNo children in
home
Multi-generational household 11% 12% 12% 12% 6% 23% 13% 11%
REASONS FOR PURCHASE:
Health/Caretaking of aging parents
19% 17% 21% 9% 24% 58% 20% 19%
Cost Savings 18 16 21 25 16 27 21 16
Children/relatives over 18 moving back into the house
14 17 10 4 8 4 15 13
To spend more time with aging parents
8 8 8 9 8 * 9 7
Wanted a larger home that multiple incomes could afford together
7 8 2 4 13 23 7 7
Children/relatives over 18 never left home
6 6 10 4 * * 7 6
None of the above 26 27 21 36 21 8 20 30
Other 7 5 14 9 8 4 7 7
* Less than 1 percent
ONE 15%
NONE 62%
THREE OR MORE 7%
TWO 16%
16
2016 PROFILE OF HOME BUYERS AND SELLERS n Chapter 1: Characteristics of Home Buyers
National Association of REALTORS® n PROFILE OF HOME BUYERS AND SELLERS 201616
EXHIBIT 1–9 RACE/ETHNICITY OF HOME BUYERS, BY ADULT COMPOSITION OF HOUSEHOLD (Percent of Respondents)
ADULT COMPOSITION OF HOUSEHOLD CHILDREN IN HOME
All Buyers Married couple Single female Single maleUnmarried
couple OtherChildren under
18 in homeNo children in
home
White/Caucasian 85% 84% 87% 83% 92% 78% 79% 89%
Hispanic/Latino/Mexican/Puerto Rican
7 8 5 7 4 13 11 4
Asian/Pacific Islander 5 6 2 4 2 6 7 3
Black/African-American 4 4 7 7 3 1 6 4
Other 3 3 2 2 1 6 3 2
Note: Respondents were permitted to select as many races and ethnicities as they felt applicable.. The percentage distribution may therefore sum to more than 100 percent.
EXHIBIT 1–7 HOME BUYER SEXUAL ORIENTATION (Percentage Distribution)
PREFER NOT TO ANSWER 7%
BISEXUAL 1%
GAY OR LESBIAN 3%
HETEROSEXUAL OR STRAIGHT 90%
EXHIBIT 1–8 RACE/ETHNICITY OF HOME BUYERS, BY REGION (Percent of Respondents)
BUYERS WHO PURCHASED A HOME IN THE
All Buyers Northeast Midwest South West
White/Caucasian 85% 92% 91% 82% 80%
Hispanic/Latino/Mexican/Puerto Rican 7 3 5 8 9
Asian/Pacific Islander 5 3 3 4 9
Black/African-American 4 2 3 7 2
Other 3 2 2 2 5
Note: Respondents were permitted to select as many races and ethnicities as they felt applicable.. The percentage distribution may therefore sum to more than 100 percent.
17
National Association of REALTORS®
National Association of REALTORS® n PROFILE OF HOME BUYERS AND SELLERS 2016 17
EXHIBIT 1–10 PRIMARY LANGUAGE SPOKEN IN HOME BUYER HOUSEHOLD, BY REGION (Percentage Distribution)
EXHIBIT 1–11 NATIONAL ORIGIN OF HOME BUYERS, BY REGION (Percentage Distribution)
0%
10%
20%
30%
40%
50%
60%
70%
80%
90%
100%
96% 97% 97% 96%
4%
96%
3% 3% 4% 4%
All Buyers Northeast Midwest South West
ENGLISHOTHER
0%
10%
20%
30%
40%
50%
60%
70%
80%
90%
100%
90% 93% 94% 89%
10%
88%
7% 6%11% 12%
All Buyers Northeast Midwest South West
BORN IN U.S.NOT BORN IN U.S.
18
2016 PROFILE OF HOME BUYERS AND SELLERS n Chapter 1: Characteristics of Home Buyers
National Association of REALTORS® n PROFILE OF HOME BUYERS AND SELLERS 2016
EXHIBIT 1–13 FIRST-TIME HOME BUYERS, 1981–2016 (Percent of all Home Buyers)
EXHIBIT 1–12 SELF OR SPOUSE/PARTNER IS ACTIVE MILITARY OR VETERAN (Percentage Distribution)
NEITHER 80%
A VETERAN 18%
AN ACTIVE-DUTY SERVICE MEMBER 2%
0%
10%
20%
30%
40%
50%
60%
44%
37%
30%
38%
44%
41%42% 42% 42% 42%
40% 40%
36%
39%40%
41%
47%
50%
37%39%
33%32%
35%
38%
19
National Association of REALTORS®
National Association of REALTORS® n PROFILE OF HOME BUYERS AND SELLERS 2016
EXHIBIT 1–15 FIRST-TIME AND REPEAT HOME BUYERS BY HOUSEHOLD TYPE (Percentage Distribution)
EXHIBIT 1–14 FIRST-TIME HOME BUYERS, BY REGION (Percent of all Home Buyers)
0%
10%
20%
30%
40%
50%
35% 44% 38% 31% 32%
All Buyers Northeast Midwest South West
0%
10%
20%
30%
40%
50%
60%
70%
80%
58%
14%
71%
16%
7%5%
2%
Married couple Single female Single male Unmarried couple Other
18%
8%
REPEAT BUYERSFIRST-TIME BUYERS
2%
20
2016 PROFILE OF HOME BUYERS AND SELLERS n Chapter 1: Characteristics of Home Buyers
National Association of REALTORS® n PROFILE OF HOME BUYERS AND SELLERS 2016
EXHIBIT 1–16 FIRST-TIME AND REPEAT HOME BUYERS BY CHILDREN IN HOUSEHOLD (Percentage Distribution)
EXHIBIT 1–17 AGE OF FIRST-TIME AND REPEAT BUYERS (Percentage Distribution)
All Buyers First-time Buyers Repeat Buyers
18 to 24 years 2% 5% *
25 to 34 years 26 56 12
35 to 44 years 22 21 23
45 to 54 years 17 10 20
55 to 64 years 16 5 21
65 to 74 years 13 3 18
75 years or older 4 * 6
Median age (years) 44 32 52
Married couple 44 33 51
Single female 50 34 57
Single male 47 31 55
Unmarried couple 33 29 50
Other 48 36 52
* Less than 1 percent
0%
10%
20%
30%
40%
50%
60%
70%
80%
19%
7%
13%
17%
5%
63%
One Two Three or more None
15%
REPEAT BUYERSFIRST-TIME BUYERS
60%
21
National Association of REALTORS®
National Association of REALTORS® n PROFILE OF HOME BUYERS AND SELLERS 2016
EXHIBIT 1–18 HOUSEHOLD INCOME OF FIRST-TIME AND REPEAT BUYERS, 2015 (Percentage Distribution)
All Buyers First-time Buyers Repeat Buyers
Less than $25,000 3% 4% 2%
$25,000 to $34,999 5 8 4
$35,000 to $44,999 7 10 5
$45,000 to $54,999 8 11 7
$55,000 to $64,999 8 10 7
$65,000 to $74,999 9 10 8
$75,000 to $84,999 8 9 8
$85,000 to $99,999 12 12 11
$100,000 to $124,999 15 12 17
$125,000 to $149,999 9 5 10
$150,000 to $174,999 5 4 6
$175,000 to $199,999 4 2 4
$200,000 or more 8 3 11
Median income (2015) $88,500 $72,000 $98,000
Married couple $99,200 $84,100 $107,000
Single female $55,300 $48,400 $63,700
Single male $69,600 $58,300 $84,100
Unmarried couple $84,800 $74,600 $102,500
Other $69,100 $60,800 $85,900
EXHIBIT 1–19 RACE/ETHNICITY OF FIRST-TIME AND REPEAT BUYERS (Percent of Respondents)
All Buyers First-time Buyers Repeat Buyers
White/Caucasian 85% 79% 88%
Hispanic/Latino/Mexican/Puerto Rican 7 9 6
Asian/Pacific Islander 5 8 3
Black/African-American 4 7 3
Other 3 3 3
Note: Respondents were permitted to select as many races and ethnicities as they felt applicable. The percentage distribution may therefore sum to more than 100 percent.
EXHIBIT 1–20 PRIMARY LANGUAGE SPOKEN IN FIRST-TIME AND REPEAT BUYER HOUSEHOLDS (Percentage Distribution)
All Buyers First-time Buyers Repeat Buyers
English 96% 93% 98%
Other 4 7 2
22
2016 PROFILE OF HOME BUYERS AND SELLERS n Chapter 1: Characteristics of Home Buyers
National Association of REALTORS® n PROFILE OF HOME BUYERS AND SELLERS 2016
EXHIBIT 1–21 NATIONAL ORIGIN OF FIRST-TIME AND REPEAT BUYERS (Percentage Distribution)
All Buyers First-time Buyers Repeat Buyers
Born in U.S. 90% 87% 92%
Not born in U.S. 10 13 8
EXHIBIT 1–22 PRIOR LIVING ARRANGEMENT OF FIRST-TIME AND REPEAT BUYERS (Percentage Distribution)
All Buyers First-time Buyers Repeat Buyers
Owned previous home 47% 4% 70%
Rented an apartment or house 41 74 24
Lived with parents/relatives/friends 11 21 5
Rented the home ultimately purchased 1 1 1
Note: After selling their previous home, buyers may have rented a home or apartment before purchasing their next home. A first-time buyer could have acquired ownership of their previous home (as an inheritance or gift, for example) without having been the buyer of the home. Thus, a first-time buyer could have owned a home prior to their first home purchase.
EXHIBIT 1–23 PRIOR LIVING ARRANGEMENT, BY ADULT COMPOSITION OF HOUSEHOLD (Percentage Distribution)
ADULT COMPOSITION OF HOUSEHOLD CHILDREN IN HOME
All Buyers Married couple Single female Single maleUnmarried
couple OtherChildren under
18 in homeNo children in
home
Owned previous home 47% 55% 43% 42% 22% 45% 45% 52%
Rented an apartment or house 41 38 40 37 59 37 45 37
Lived with parents/relatives/friends
11 7 16 20 18 19 9 11
Rented the home ultimately purchased
1 1 1 2 1 * 1 1
* Less than 1 percent
Note: After selling their previous home, buyers may have rented a home or apartment before purchasing their next home. A first-time buyer could have acquired ownership of their previous home (as an inheritance or gift, for example) without having been the buyer of the home. Thus, a first-time buyer could have owned a home prior to their first home purchase.
23
National Association of REALTORS®
National Association of REALTORS® n PROFILE OF HOME BUYERS AND SELLERS 2016
EXHIBIT 1–24 PRIMARY REASON FOR PURCHASING A HOME, FIRST-TIME AND REPEAT BUYERS (Percentage Distribution)
All Buyers First-time Buyers Repeat Buyers
Desire to own a home of own 31% 67% 12%
Desire for larger home 10 3 14
Job-related relocation or move 8 3 11
Change in family situation (e.g. marriage, birth of child, divorce, etc.) 8 6 8
Desire to be closer to family/friends/relatives 7 1 10
Desire for a home in a better area 6 2 9
Desire for smaller home 6 1 9
Retirement 5 1 7
Establish a household 3 6 1
Desire to be closer to job/school/transit 3 1 4
Affordability of homes 3 3 3
Financial security 2 3 1
Desire for a newly built or custom-built home 2 * 2
Tax benefits 1 * 1
Purchased home for family member or relative * * 1
Greater number of homes on the market for sale/better choice * * *
Other 6 3 8
* Less than 1 percent
24
2016 PROFILE OF HOME BUYERS AND SELLERS n Chapter 1: Characteristics of Home Buyers
National Association of REALTORS® n PROFILE OF HOME BUYERS AND SELLERS 2016
EXHIBIT 1–25 PRIMARY REASON FOR PURCHASING A HOME, BY ADULT COMPOSITION OF HOUSEHOLD (Percentage Distribution)
ADULT COMPOSITION OF HOUSEHOLD CHILDREN IN HOME
All Buyers Married couple Single female Single maleUnmarried
couple OtherChildren under
18 in homeNo children in
home
Desire to own a home of own 31% 25% 38% 37% 50% 24% 31% 29%
Desire for larger home 10 14 3 2 5 8 19 6
Job-related relocation or move 8 10 4 3 6 2 11 7
Change in family situation (e.g. marriage, birth of child, divorce, etc.)
8 5 11 16 10 24 10 7
Desire to be closer to family/friends/relatives
7 8 9 4 1 2 3 10
Desire for a home in a better area
6 7 4 5 4 6 7 6
Desire for smaller home 6 6 7 8 2 5 1 9
Retirement 5 5 5 4 2 2 1 7
Establish a household 3 3 1 1 6 2 3 3
Desire to be closer to job/school/transit
3 3 3 2 2 7 5 2
Affordability of homes 3 2 4 6 4 8 2 3
Financial security 2 1 3 3 2 6 1 2
Desire for a newly built or custom-built home
2 2 1 1 1 * 2 2
Tax benefits 1 1 1 2 * * 1 1
Purchased home for family member or relative
* 1 * 1 * * * 1
Greater number of homes on the market for sale/better choice
* * * * * * * *
Other 6 7 5 6 4 3 4 7
* Less than 1 percent
25
National Association of REALTORS®
National Association of REALTORS® n PROFILE OF HOME BUYERS AND SELLERS 2016
EXHIBIT 1–26 PRIMARY REASON FOR THE TIMING OF HOME PURCHASE, FIRST-TIME AND REPEAT BUYERS (Percentage Distribution)
All Buyers First-time Buyers Repeat Buyers
It was just the right time, was ready to buy a home 55% 60% 51%
Did not have much choice, had to purchase when did 18 14 20
It was the best time for because of availability of homes for sale 10 6 12
It was the best time for because of mortgage financing options available 8 10 7
It was the best time for because of improved affordability of homes 8 9 7
Wish had waited * * *
Other 1 1 2
* Less than 1 percent
EXHIBIT 1–27 OTHER HOMES OWNED, BY AGE (Percentage Distribution)
AGE OF HOME BUYER
All Buyers 18 to 24 25 to 44 45 to 64 65 or older
Recently purchased home only 85% 98% 89% 80% 79%
One or more investment properties 9 2 9 12 8
Previous homes that buyer is trying to sell 3 * 2 4 8
One or more vacation homes 3 * 1 4 6
Other 2 * 1 4 2
* Less than 1 percent
2016 PROFILE OF HOME BUYERS AND SELLERS n Chapter 2: Characteristics of Homes Purchased
National Association of REALTORS® n PROFILE OF HOME BUYERS AND SELLERS 2016
National Association of REALTORS®
National Association of REALTORS® | PROFILE OF HOME BUYERS AND SELLERS 201526
CHAPTER 2:
Characteristics of Homes Purchased
NAR is celebrating 35 years of collecting data for the Profile of Home Buyers and Sellers. We have tracked the types of homes purchased since 1981. When choosing to purchase either a new or previously owned home, buyers typi-
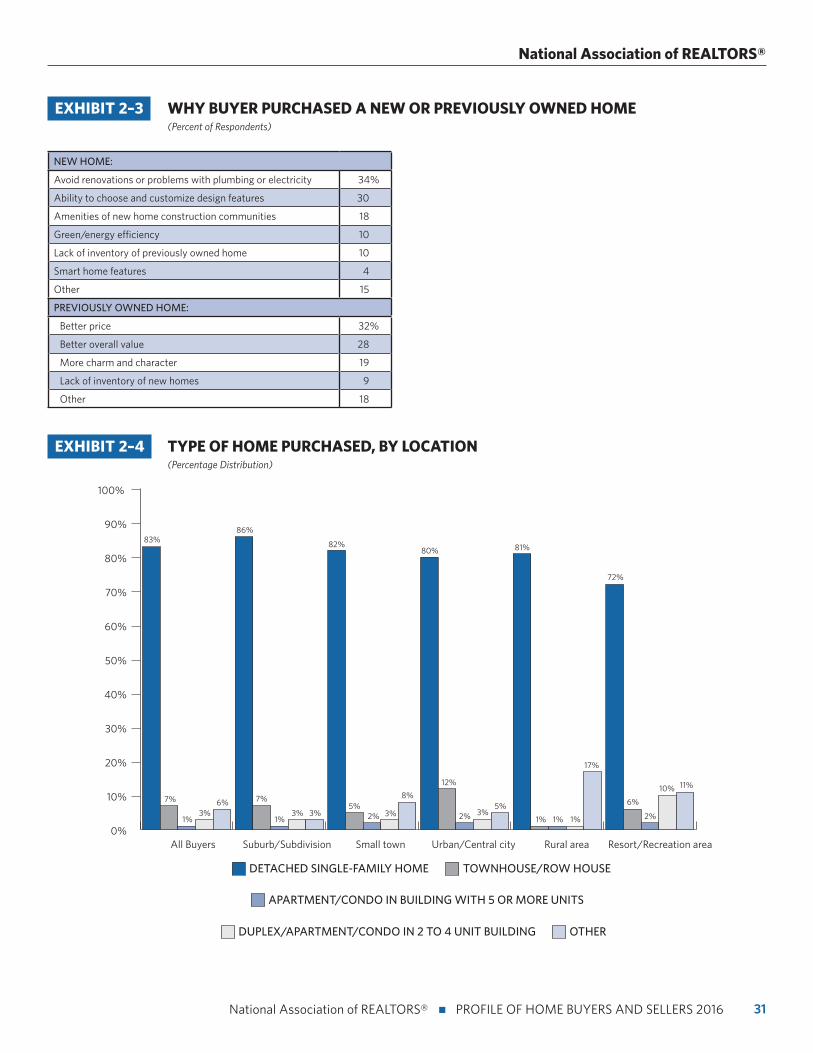
cally chose one or the other for specific reasons. For example, buyers of new homes typically are looking to avoid renovations or plumbing and electrical problems, as well as having the ability to choose and customize design features. Buyers of previ-ously owned homes are looking for a better price and overall value in a home.
Due to a lack of new home construction, the share of new homes purchased dropped slightly to 14 percent (from 16 percent where it had remained since 2011 through 2015). This is the lowest share of new homes purchased since the survey started in 1981. Previously-owned home purchases increased to 86 percent, up from 84 percent last year. By way of comparison, in 1981 new home purchases made up 18 percent of the market share and previously-owned homes were 82 percent. New home purchases reached a high of 29 percent in 1989 and 28 percent in 2003. Since 2007, new home purchases have been on the decline and hit a record low of 14 percent this year.
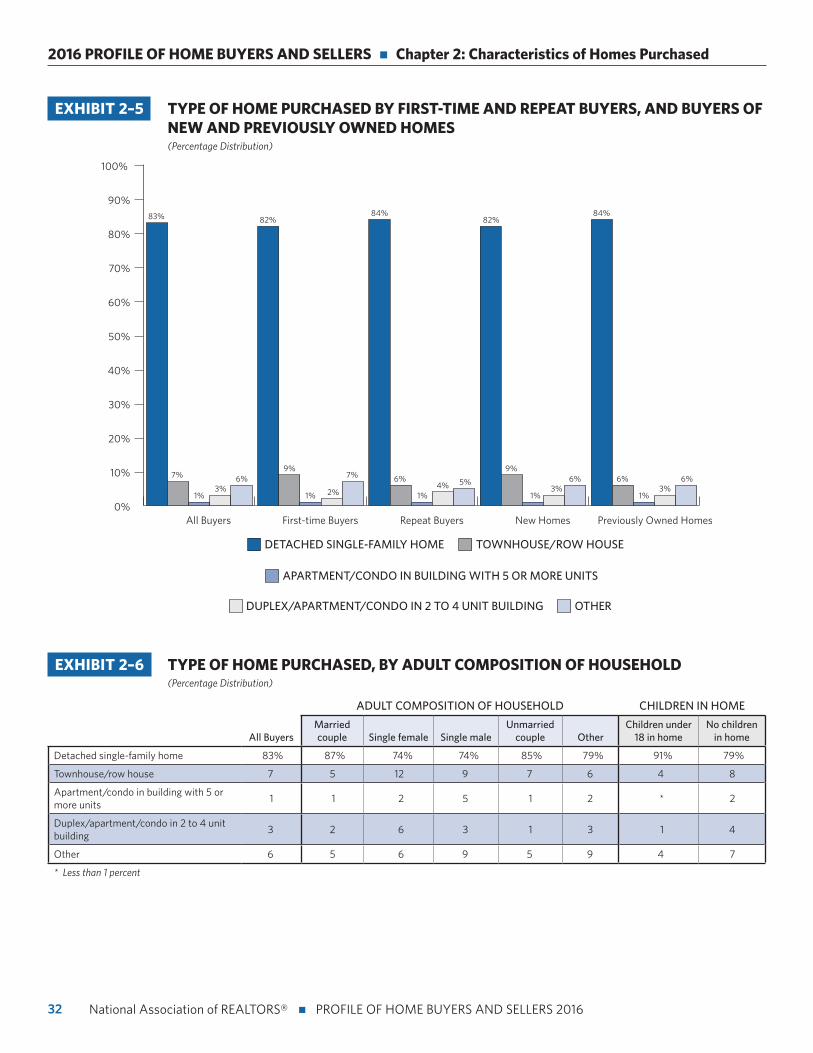
The most frequently purchased housing type among all buyers was a detached single-family home. Single females and single males were the most likely to have purchased a townhome or row house, over any other household type. The share of senior-related housing purchases stayed the same this year at 14 percent, with buy-ers over 50 purchasing townhomes, row houses, and condos at higher rates than other buyers.
Overall, buyers expect that they will live in their homes for 12 years. The expected tenure increases with age, and is also higher among repeat buyers. The biggest fac-tor that would cause a buyer to move from their newly purchased home is due to life changes, including additions to their family, marriage, children moving out, or retirement. While 26 percent of buyers report that life changes could cause them to move, 18 percent of recent buyers say that this is their forever home and have no intention of moving.
27 National Association of REALTORS® n PROFILE OF HOME BUYERS AND SELLERS 2016
National Association of REALTORS®
New and Previously Owned Homes Purchased
• Exhibits 2–1 through 2–3
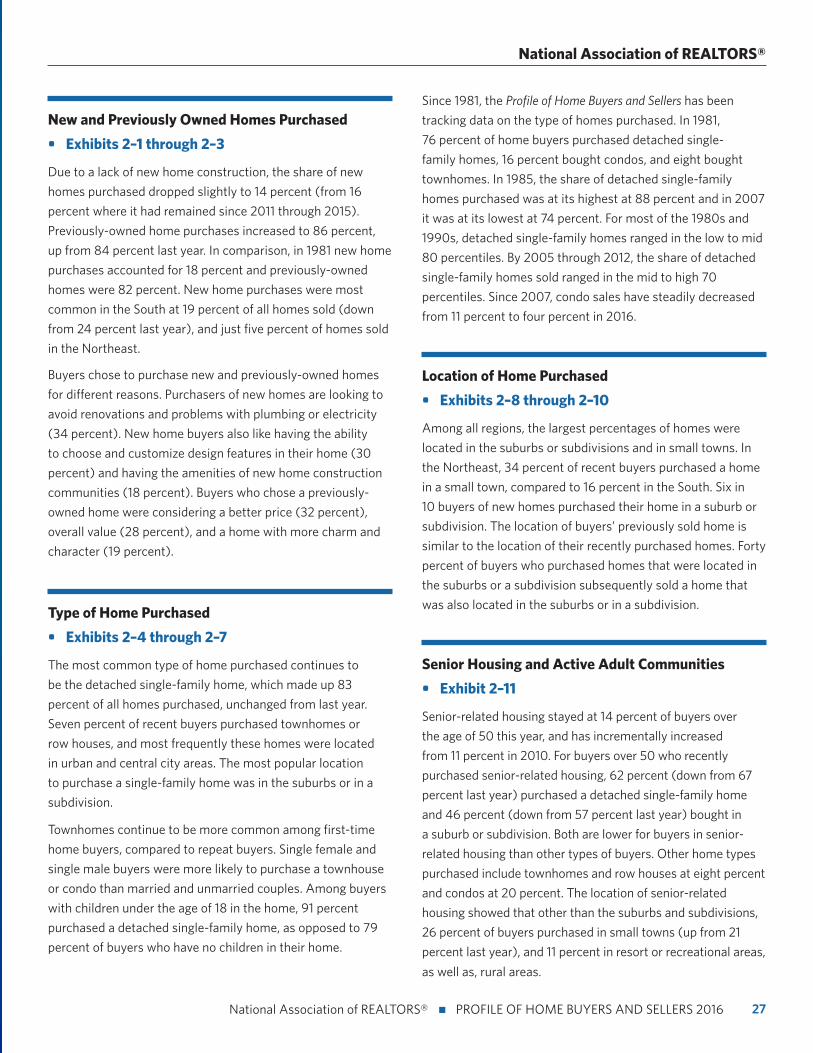
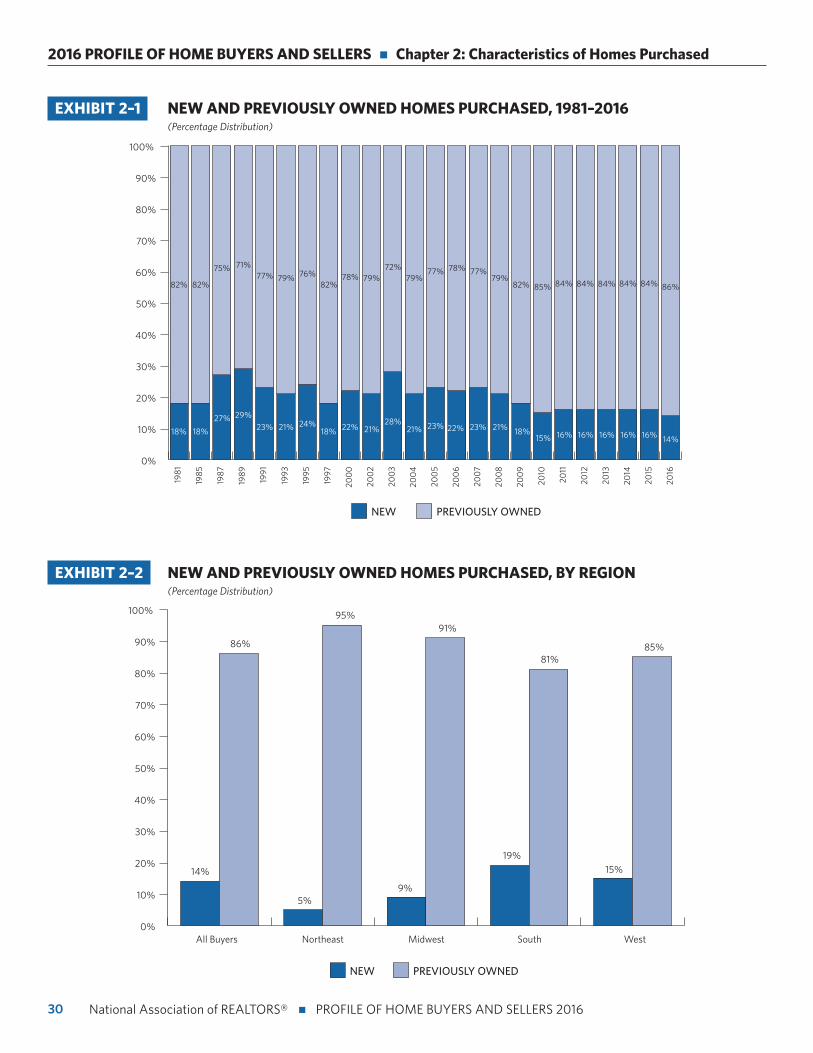
Due to a lack of new home construction, the share of new
homes purchased dropped slightly to 14 percent (from 16
percent where it had remained since 2011 through 2015).
Previously-owned home purchases increased to 86 percent,
up from 84 percent last year. In comparison, in 1981 new home
purchases accounted for 18 percent and previously-owned
homes were 82 percent. New home purchases were most
common in the South at 19 percent of all homes sold (down
from 24 percent last year), and just five percent of homes sold
in the Northeast.
Buyers chose to purchase new and previously-owned homes
for different reasons. Purchasers of new homes are looking to
avoid renovations and problems with plumbing or electricity
(34 percent). New home buyers also like having the ability
to choose and customize design features in their home (30
percent) and having the amenities of new home construction
communities (18 percent). Buyers who chose a previously-
owned home were considering a better price (32 percent),
overall value (28 percent), and a home with more charm and
character (19 percent).
Type of Home Purchased
• Exhibits 2–4 through 2–7
The most common type of home purchased continues to
be the detached single-family home, which made up 83
percent of all homes purchased, unchanged from last year.
Seven percent of recent buyers purchased townhomes or
row houses, and most frequently these homes were located
in urban and central city areas. The most popular location
to purchase a single-family home was in the suburbs or in a
subdivision.
Townhomes continue to be more common among first-time
home buyers, compared to repeat buyers. Single female and
single male buyers were more likely to purchase a townhouse
or condo than married and unmarried couples. Among buyers
with children under the age of 18 in the home, 91 percent
purchased a detached single-family home, as opposed to 79
percent of buyers who have no children in their home.
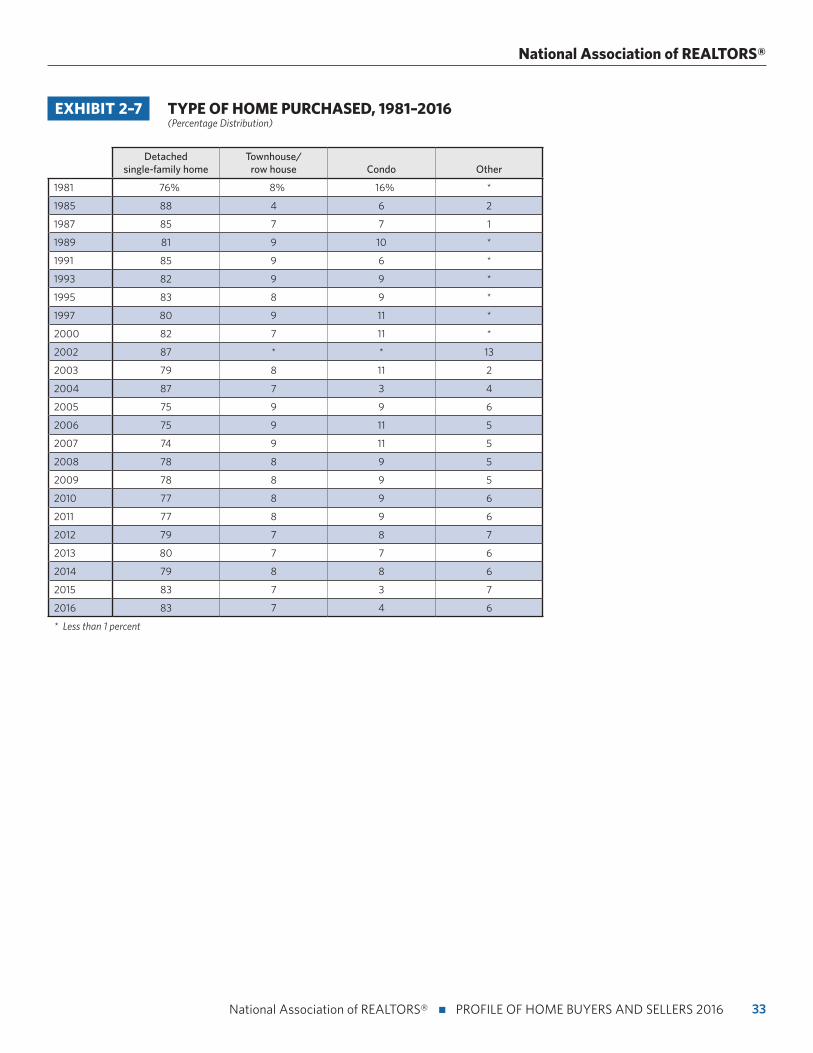
Since 1981, the Profile of Home Buyers and Sellers has been
tracking data on the type of homes purchased. In 1981,
76 percent of home buyers purchased detached single-
family homes, 16 percent bought condos, and eight bought
townhomes. In 1985, the share of detached single-family
homes purchased was at its highest at 88 percent and in 2007
it was at its lowest at 74 percent. For most of the 1980s and
1990s, detached single-family homes ranged in the low to mid
80 percentiles. By 2005 through 2012, the share of detached
single-family homes sold ranged in the mid to high 70
percentiles. Since 2007, condo sales have steadily decreased
from 11 percent to four percent in 2016.
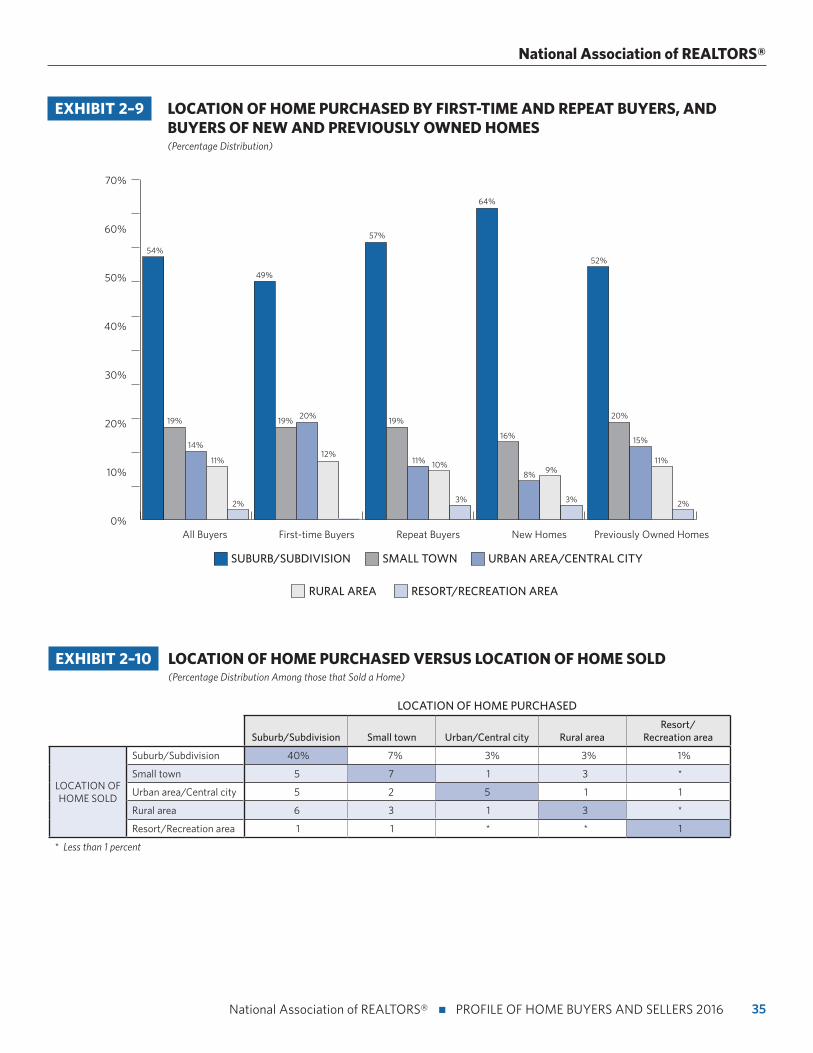
Location of Home Purchased
• Exhibits 2–8 through 2–10
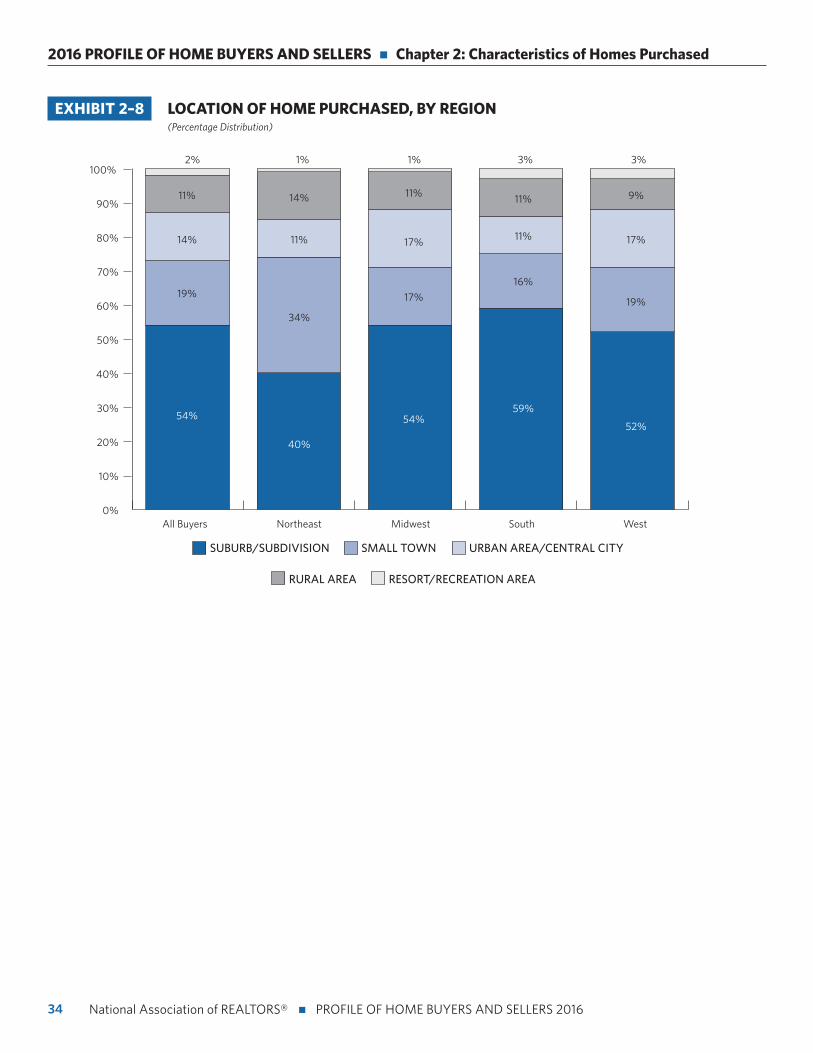
Among all regions, the largest percentages of homes were
located in the suburbs or subdivisions and in small towns. In
the Northeast, 34 percent of recent buyers purchased a home
in a small town, compared to 16 percent in the South. Six in
10 buyers of new homes purchased their home in a suburb or
subdivision. The location of buyers’ previously sold home is
similar to the location of their recently purchased homes. Forty
percent of buyers who purchased homes that were located in
the suburbs or a subdivision subsequently sold a home that
was also located in the suburbs or in a subdivision.
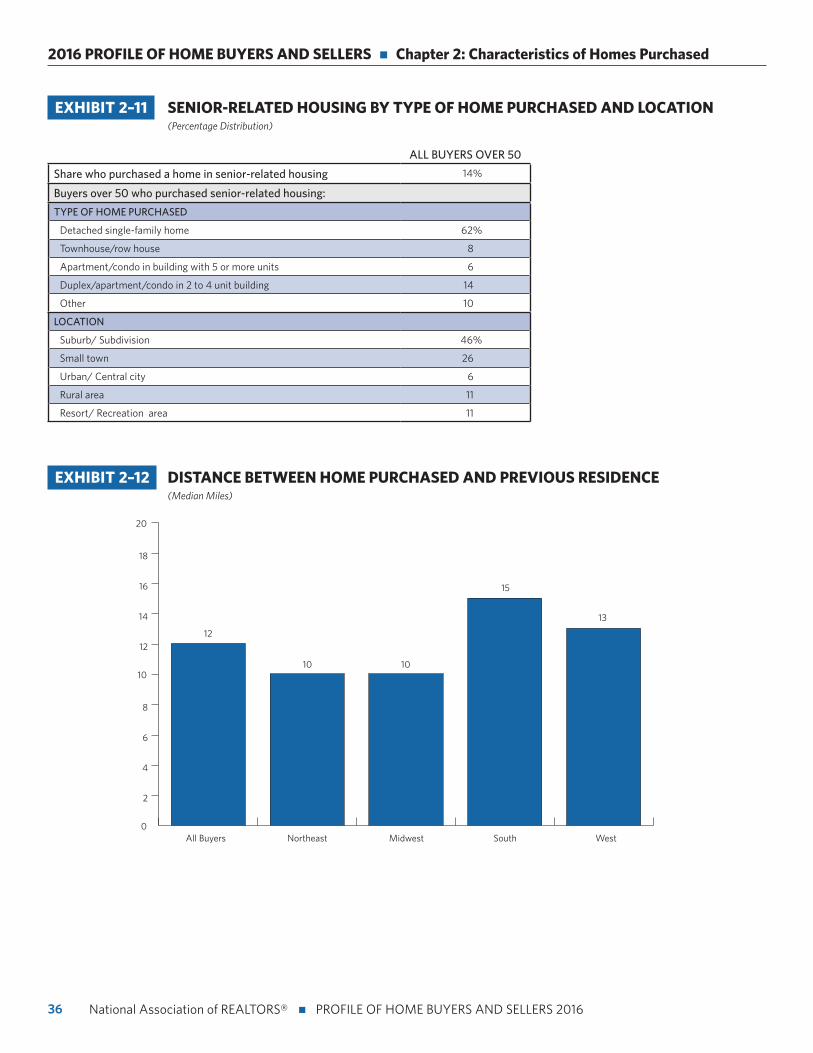
Senior Housing and Active Adult Communities
• Exhibit 2–11
Senior-related housing stayed at 14 percent of buyers over
the age of 50 this year, and has incrementally increased
from 11 percent in 2010. For buyers over 50 who recently
purchased senior-related housing, 62 percent (down from 67
percent last year) purchased a detached single-family home
and 46 percent (down from 57 percent last year) bought in
a suburb or subdivision. Both are lower for buyers in senior-
related housing than other types of buyers. Other home types
purchased include townhomes and row houses at eight percent
and condos at 20 percent. The location of senior-related
housing showed that other than the suburbs and subdivisions,
26 percent of buyers purchased in small towns (up from 21
percent last year), and 11 percent in resort or recreational areas,
as well as, rural areas.
28
2016 PROFILE OF HOME BUYERS AND SELLERS n Chapter 2: Characteristics of Homes Purchased
National Association of REALTORS® n PROFILE OF HOME BUYERS AND SELLERS 2016
Distance Between Home Purchased and Previous Residence
• Exhibit 2–12
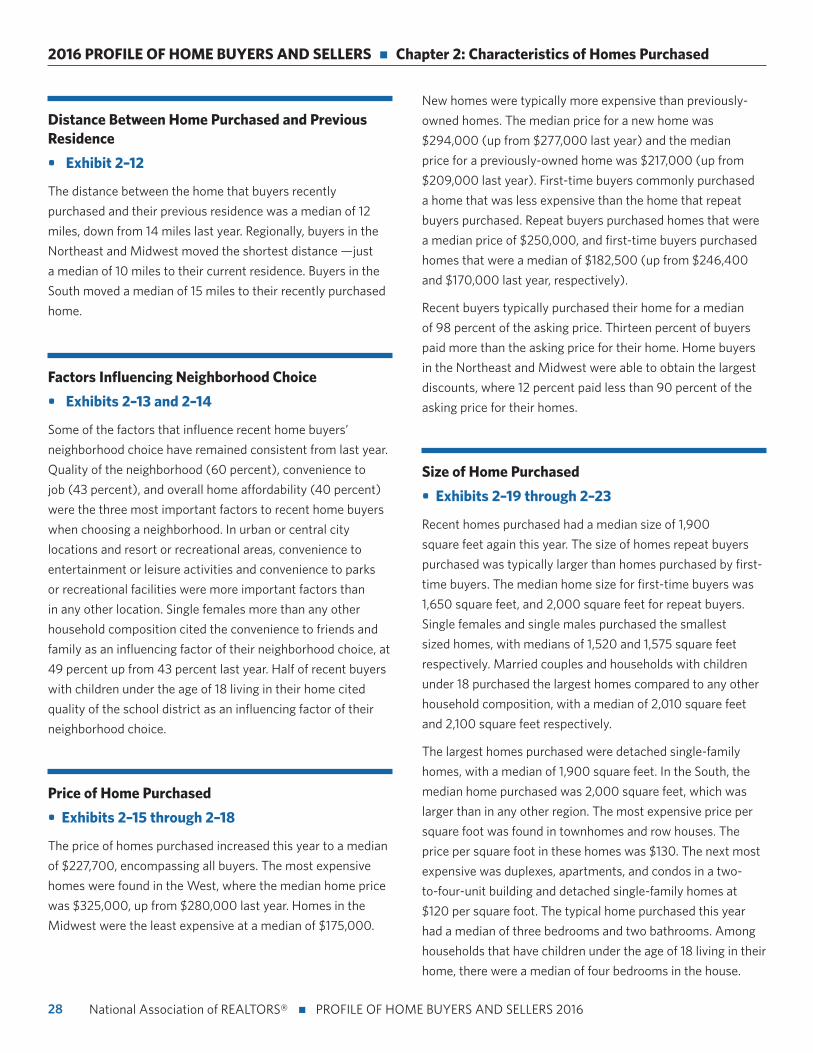
The distance between the home that buyers recently
purchased and their previous residence was a median of 12
miles, down from 14 miles last year. Regionally, buyers in the
Northeast and Midwest moved the shortest distance —just
a median of 10 miles to their current residence. Buyers in the
South moved a median of 15 miles to their recently purchased
home.
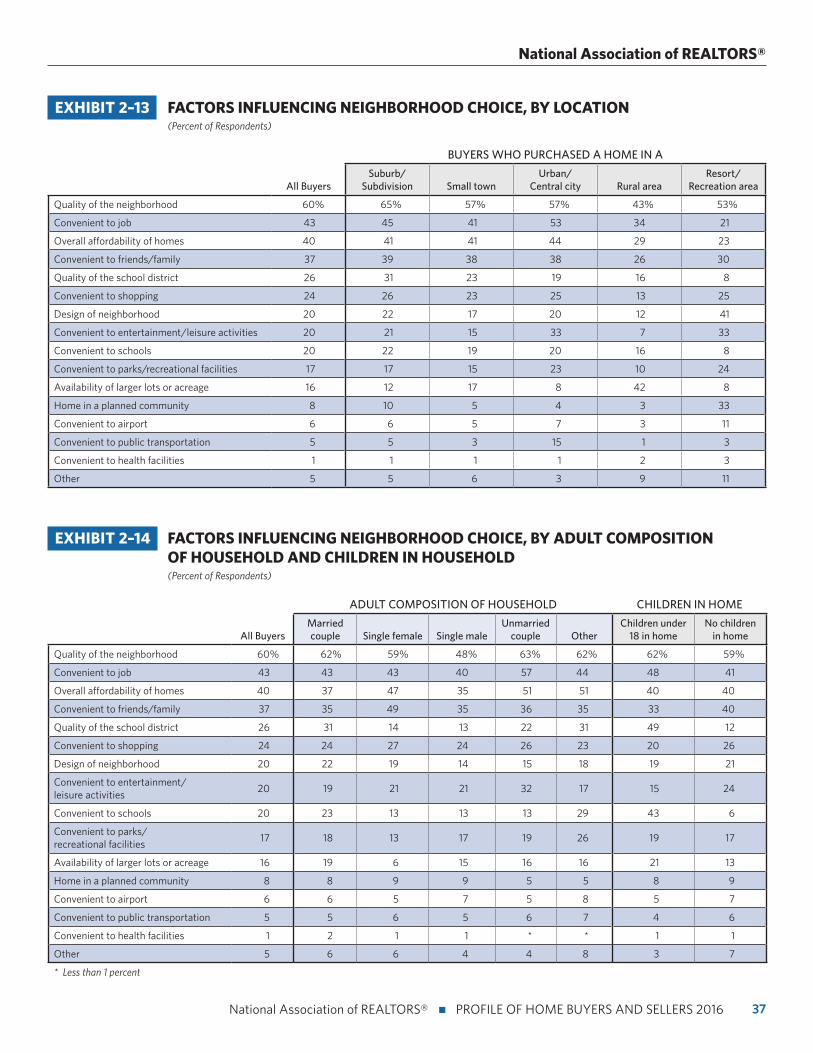
Factors Influencing Neighborhood Choice
• Exhibits 2–13 and 2–14
Some of the factors that influence recent home buyers’
neighborhood choice have remained consistent from last year.
Quality of the neighborhood (60 percent), convenience to
job (43 percent), and overall home affordability (40 percent)
were the three most important factors to recent home buyers
when choosing a neighborhood. In urban or central city
locations and resort or recreational areas, convenience to
entertainment or leisure activities and convenience to parks
or recreational facilities were more important factors than
in any other location. Single females more than any other
household composition cited the convenience to friends and
family as an influencing factor of their neighborhood choice, at
49 percent up from 43 percent last year. Half of recent buyers
with children under the age of 18 living in their home cited
quality of the school district as an influencing factor of their
neighborhood choice.
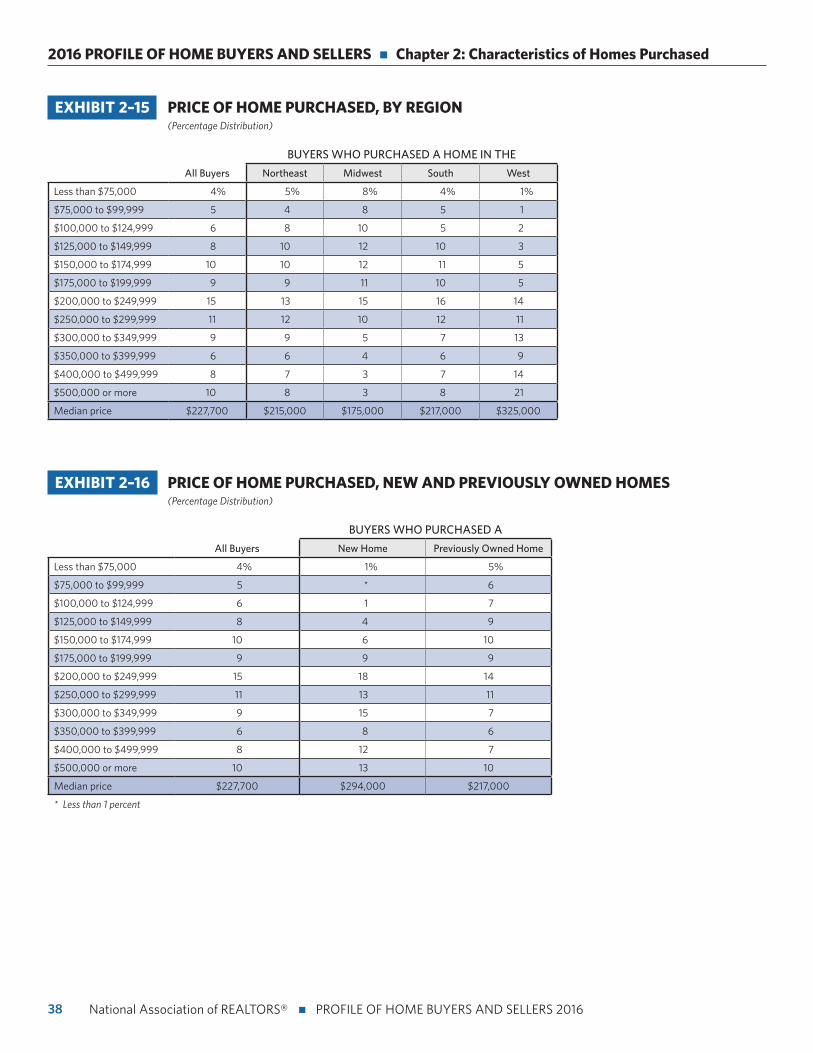
Price of Home Purchased
• Exhibits 2–15 through 2–18
The price of homes purchased increased this year to a median
of $227,700, encompassing all buyers. The most expensive
homes were found in the West, where the median home price
was $325,000, up from $280,000 last year. Homes in the
Midwest were the least expensive at a median of $175,000.
New homes were typically more expensive than previously-
owned homes. The median price for a new home was
$294,000 (up from $277,000 last year) and the median
price for a previously-owned home was $217,000 (up from
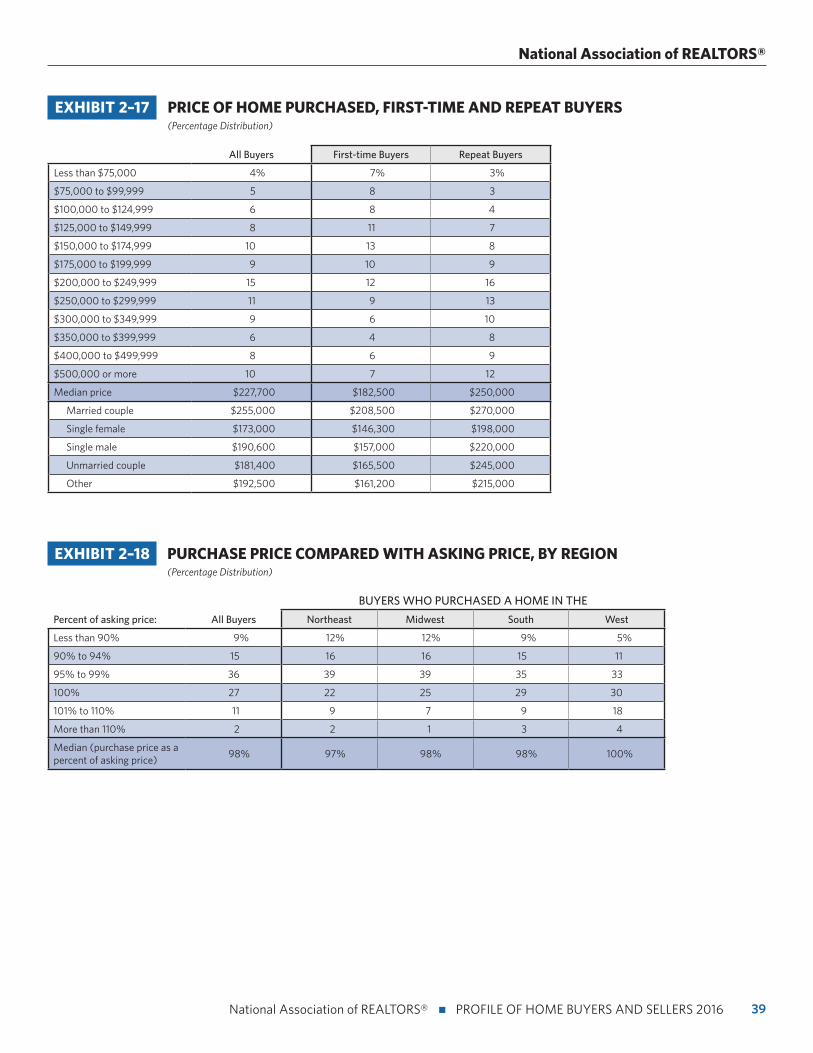
$209,000 last year). First-time buyers commonly purchased
a home that was less expensive than the home that repeat
buyers purchased. Repeat buyers purchased homes that were
a median price of $250,000, and first-time buyers purchased
homes that were a median of $182,500 (up from $246,400
and $170,000 last year, respectively).
Recent buyers typically purchased their home for a median
of 98 percent of the asking price. Thirteen percent of buyers
paid more than the asking price for their home. Home buyers
in the Northeast and Midwest were able to obtain the largest
discounts, where 12 percent paid less than 90 percent of the
asking price for their homes.
Size of Home Purchased
• Exhibits 2–19 through 2–23
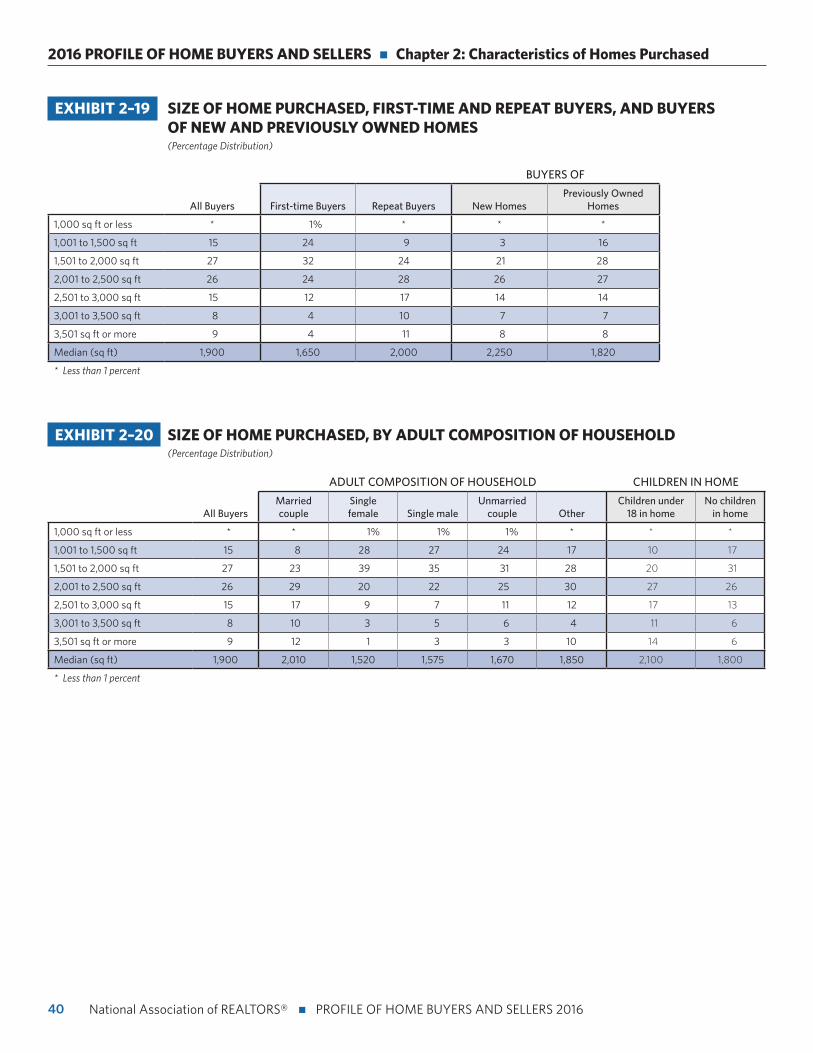
Recent homes purchased had a median size of 1,900
square feet again this year. The size of homes repeat buyers
purchased was typically larger than homes purchased by first-
time buyers. The median home size for first-time buyers was
1,650 square feet, and 2,000 square feet for repeat buyers.
Single females and single males purchased the smallest
sized homes, with medians of 1,520 and 1,575 square feet
respectively. Married couples and households with children
under 18 purchased the largest homes compared to any other
household composition, with a median of 2,010 square feet
and 2,100 square feet respectively.
The largest homes purchased were detached single-family
homes, with a median of 1,900 square feet. In the South, the
median home purchased was 2,000 square feet, which was
larger than in any other region. The most expensive price per
square foot was found in townhomes and row houses. The
price per square foot in these homes was $130. The next most
expensive was duplexes, apartments, and condos in a two-
to-four-unit building and detached single-family homes at
$120 per square foot. The typical home purchased this year
had a median of three bedrooms and two bathrooms. Among
households that have children under the age of 18 living in their
home, there were a median of four bedrooms in the house.

29 National Association of REALTORS® n PROFILE OF HOME BUYERS AND SELLERS 2016
National Association of REALTORS®
Year Home Was Built
• Exhibit 2–24
This year, the homes purchased were slightly older than in
previous years. The typical home purchased was built in 1991.
The South had the newest homes purchased, where the typical
home was built in 1999. The oldest built homes were found in
the Northeast, where the median year built was 1965.
Environment Features and Commuting Costs
• Exhibits 2–25 through 2–28
Commuting costs were somewhat important at 39 percent
of buyers and 32 percent said commuting costs were not
important to them when they recently purchased their home.
Most recent buyers thought their home’s environmentally-
friendly features were at least somewhat important to them.
The most important environmental feature to buyers in all
regions was heating and cooling costs, which 84 percent of
buyers found at least somewhat important. As the home’s age
increases, buyers place less importance on environmentally-
friendly features compared to buyers of newer homes.
Characteristics of Home on Which Buyer Compromised
• Exhibits 2–29 through 2–31
When deciding on a home to purchase, recent buyers made
compromises on some home characteristics. The most
common compromise made was the price of the home
at 21 percent, followed by the condition of the home at 19
percent. Thirty-two percent of buyers said that they made no
compromises when purchasing their home. Single males were
least likely to make compromises when choosing their home
at 38 percent. Quality of schools and distance from schools
continues to be the least likely characteristics home buyers
compromise on.
Expected Length of Tenure in Home Purchased
• Exhibits 2–32 through 2–35
The expected tenure in homes has decreased to a median of
12 years from 14 years in the last report. First-time and repeat
buyers are intending to stay in their homes for the same
length of time as the previous year at 10 years and 15 years
respectively. The youngest buyers between the ages of 18 and
44 had the shortest expected tenure of 10 years, compared to
buyers aged 45 and older who expect to stay in their homes
for 15 years.
While buyers can estimate the timeframe that they will live
in their homes, there are factors which could cause buyers
to move. Twenty-six percent of buyers said that they would
potentially move because of a life change such as an addition
to the family, marriage, children moving out, or retirement.
Buyers between the ages of 25 and 44 were more likely than
any other age group to potentially move because of a job or
career change. Households with no children were the most
likely at 22 percent to say that they are never moving and that
this is their forever home.
Due to a lack of new home construction, the share of new homes purchased dropped slightly to 14 percent (from 16 percent where it had remained
since 2011 through 2015). This is the lowest share of new homes purchased since the
survey started in 1981.
30
2016 PROFILE OF HOME BUYERS AND SELLERS n Chapter 2: Characteristics of Homes Purchased
National Association of REALTORS® n PROFILE OF HOME BUYERS AND SELLERS 2016
EXHIBIT 2–1 NEW AND PREVIOUSLY OWNED HOMES PURCHASED, 1981–2016 (Percentage Distribution)
EXHIBIT 2–2 NEW AND PREVIOUSLY OWNED HOMES PURCHASED, BY REGION (Percentage Distribution)
0%
10%
20%
30%
40%
50%
60%
70%
80%
90%
100%
14%
19%
86%
95%91%
81%85%
All Buyers Northeast Midwest South West
5%9%
PREVIOUSLY OWNEDNEW
15%
0%
10%
20%
30%
40%
50%
60%
70%
80%
90%
100%
18%
PREVIOUSLY OWNEDNEW
18%
27% 29%23% 21% 24%
18% 22% 21%28% 23% 22% 23%21% 21% 18%
15% 16% 16% 16% 16% 14%16%
82% 82%
75% 71%77% 79% 76%
82%78% 79%
72% 77% 78% 77%79% 79%
82% 85% 84% 84% 84% 84% 86%84%
31 National Association of REALTORS® n PROFILE OF HOME BUYERS AND SELLERS 2016
National Association of REALTORS®
EXHIBIT 2–4 TYPE OF HOME PURCHASED, BY LOCATION (Percentage Distribution)
EXHIBIT 2–3 WHY BUYER PURCHASED A NEW OR PREVIOUSLY OWNED HOME (Percent of Respondents)
NEW HOME:
Avoid renovations or problems with plumbing or electricity 34%
Ability to choose and customize design features 30
Amenities of new home construction communities 18
Green/energy efficiency 10
Lack of inventory of previously owned home 10
Smart home features 4
Other 15
PREVIOUSLY OWNED HOME:
Better price 32%
Better overall value 28
More charm and character 19
Lack of inventory of new homes 9
Other 18
0%
10%
20%
30%
40%
50%
60%
70%
80%
90%
100%
83%86%
82%80% 81%
72%
All Buyers Suburb/Subdivision Small town Urban/Central city Rural area
TOWNHOUSE/ROW HOUSEDETACHED SINGLE-FAMILY HOME
Resort/Recreation area
APARTMENT/CONDO IN BUILDING WITH 5 OR MORE UNITS
DUPLEX/APARTMENT/CONDO IN 2 TO 4 UNIT BUILDING OTHER
7% 7%5%
12%
1%
6%
1% 1% 2% 2% 1% 2%3% 3% 3% 3%1%
10%
6%3%
8%5%
17%
11%
32
2016 PROFILE OF HOME BUYERS AND SELLERS n Chapter 2: Characteristics of Homes Purchased
National Association of REALTORS® n PROFILE OF HOME BUYERS AND SELLERS 2016
EXHIBIT 2–5 TYPE OF HOME PURCHASED BY FIRST-TIME AND REPEAT BUYERS, AND BUYERS OF NEW AND PREVIOUSLY OWNED HOMES (Percentage Distribution)
0%
10%
20%
30%
40%
50%
60%
70%
80%
90%
100%
83% 82%84%
82%84%
All Buyers First-time Buyers Repeat Buyers New Homes Previously Owned Homes
TOWNHOUSE/ROW HOUSEDETACHED SINGLE-FAMILY HOME
APARTMENT/CONDO IN BUILDING WITH 5 OR MORE UNITS
DUPLEX/APARTMENT/CONDO IN 2 TO 4 UNIT BUILDING OTHER
7% 7%4%
1%
6%9%
5%3%
1%1% 1%
6% 6%3%3% 2% 1%
9%6%6%
EXHIBIT 2–6 TYPE OF HOME PURCHASED, BY ADULT COMPOSITION OF HOUSEHOLD (Percentage Distribution)
ADULT COMPOSITION OF HOUSEHOLD CHILDREN IN HOME
All BuyersMarried couple Single female Single male
Unmarried couple Other
Children under 18 in home
No children in home
Detached single-family home 83% 87% 74% 74% 85% 79% 91% 79%
Townhouse/row house 7 5 12 9 7 6 4 8
Apartment/condo in building with 5 or more units
1 1 2 5 1 2 * 2
Duplex/apartment/condo in 2 to 4 unit building
3 2 6 3 1 3 1 4
Other 6 5 6 9 5 9 4 7
* Less than 1 percent
33 National Association of REALTORS® n PROFILE OF HOME BUYERS AND SELLERS 2016
National Association of REALTORS®
EXHIBIT 2–7 TYPE OF HOME PURCHASED, 1981–2016 (Percentage Distribution)
Detached single-family home
Townhouse/ row house Condo Other
1981 76% 8% 16% *
1985 88 4 6 2
1987 85 7 7 1
1989 81 9 10 *
1991 85 9 6 *
1993 82 9 9 *
1995 83 8 9 *
1997 80 9 11 *
2000 82 7 11 *
2002 87 * * 13
2003 79 8 11 2
2004 87 7 3 4
2005 75 9 9 6
2006 75 9 11 5
2007 74 9 11 5
2008 78 8 9 5
2009 78 8 9 5
2010 77 8 9 6
2011 77 8 9 6
2012 79 7 8 7
2013 80 7 7 6
2014 79 8 8 6
2015 83 7 3 7
2016 83 7 4 6
* Less than 1 percent
34
2016 PROFILE OF HOME BUYERS AND SELLERS n Chapter 2: Characteristics of Homes Purchased
National Association of REALTORS® n PROFILE OF HOME BUYERS AND SELLERS 2016
EXHIBIT 2–8 LOCATION OF HOME PURCHASED, BY REGION (Percentage Distribution)
0%
10%
20%
30%
40%
50%
60%
70%
80%
90%
100%
54%
40%
54%59%
2%
52%
1% 1% 3% 3%
All Buyers Northeast Midwest South West
19%
34%
17%
16%
19%
14% 11% 17% 11% 17%
11% 14% 11% 11% 9%
SMALL TOWNSUBURB/SUBDIVISION URBAN AREA/CENTRAL CITY
RURAL AREA RESORT/RECREATION AREA
35 National Association of REALTORS® n PROFILE OF HOME BUYERS AND SELLERS 2016
National Association of REALTORS®
EXHIBIT 2–9 LOCATION OF HOME PURCHASED BY FIRST-TIME AND REPEAT BUYERS, AND BUYERS OF NEW AND PREVIOUSLY OWNED HOMES (Percentage Distribution)
0%
10%
20%
30%
40%
50%
60%
70%
54%
49%
57%
64%
52%
All Buyers First-time Buyers Repeat Buyers New Homes Previously Owned Homes
SMALL TOWNSUBURB/SUBDIVISION URBAN AREA/CENTRAL CITY
RURAL AREA RESORT/RECREATION AREA
19%
10%8%
20%19%
3%
9%
15%14%
20%19%
3%
11%11%12%
11%
16%
2%2%
EXHIBIT 2–10 LOCATION OF HOME PURCHASED VERSUS LOCATION OF HOME SOLD (Percentage Distribution Among those that Sold a Home)
LOCATION OF HOME PURCHASED
Suburb/Subdivision Small town Urban/Central city Rural areaResort/
Recreation area
LOCATION OF HOME SOLD
Suburb/Subdivision 40% 7% 3% 3% 1%
Small town 5 7 1 3 *
Urban area/Central city 5 2 5 1 1
Rural area 6 3 1 3 *
Resort/Recreation area 1 1 * * 1
* Less than 1 percent
36
2016 PROFILE OF HOME BUYERS AND SELLERS n Chapter 2: Characteristics of Homes Purchased
National Association of REALTORS® n PROFILE OF HOME BUYERS AND SELLERS 2016
EXHIBIT 2–11 SENIOR-RELATED HOUSING BY TYPE OF HOME PURCHASED AND LOCATION (Percentage Distribution)
ALL BUYERS OVER 50
Share who purchased a home in senior-related housing 14%
Buyers over 50 who purchased senior-related housing:
TYPE OF HOME PURCHASED
Detached single-family home 62%
Townhouse/row house 8
Apartment/condo in building with 5 or more units 6
Duplex/apartment/condo in 2 to 4 unit building 14
Other 10
LOCATION
Suburb/ Subdivision 46%
Small town 26
Urban/ Central city 6
Rural area 11
Resort/ Recreation area 11
EXHIBIT 2–12 DISTANCE BETWEEN HOME PURCHASED AND PREVIOUS RESIDENCE (Median Miles)
0
2
4
6
8
10
12
14
16
18
20
12
10 10
15
13
All Buyers Northeast Midwest South West
37 National Association of REALTORS® n PROFILE OF HOME BUYERS AND SELLERS 2016
National Association of REALTORS®
EXHIBIT 2–13 FACTORS INFLUENCING NEIGHBORHOOD CHOICE, BY LOCATION (Percent of Respondents)
BUYERS WHO PURCHASED A HOME IN A
All BuyersSuburb/
Subdivision Small townUrban/
Central city Rural areaResort/
Recreation area
Quality of the neighborhood 60% 65% 57% 57% 43% 53%
Convenient to job 43 45 41 53 34 21
Overall affordability of homes 40 41 41 44 29 23
Convenient to friends/family 37 39 38 38 26 30
Quality of the school district 26 31 23 19 16 8
Convenient to shopping 24 26 23 25 13 25
Design of neighborhood 20 22 17 20 12 41
Convenient to entertainment/leisure activities 20 21 15 33 7 33
Convenient to schools 20 22 19 20 16 8
Convenient to parks/recreational facilities 17 17 15 23 10 24
Availability of larger lots or acreage 16 12 17 8 42 8
Home in a planned community 8 10 5 4 3 33
Convenient to airport 6 6 5 7 3 11
Convenient to public transportation 5 5 3 15 1 3
Convenient to health facilities 1 1 1 1 2 3
Other 5 5 6 3 9 11
EXHIBIT 2–14 FACTORS INFLUENCING NEIGHBORHOOD CHOICE, BY ADULT COMPOSITION OF HOUSEHOLD AND CHILDREN IN HOUSEHOLD (Percent of Respondents)
ADULT COMPOSITION OF HOUSEHOLD CHILDREN IN HOME
All BuyersMarried couple Single female Single male
Unmarried couple Other
Children under 18 in home
No children in home
Quality of the neighborhood 60% 62% 59% 48% 63% 62% 62% 59%
Convenient to job 43 43 43 40 57 44 48 41
Overall affordability of homes 40 37 47 35 51 51 40 40
Convenient to friends/family 37 35 49 35 36 35 33 40
Quality of the school district 26 31 14 13 22 31 49 12
Convenient to shopping 24 24 27 24 26 23 20 26
Design of neighborhood 20 22 19 14 15 18 19 21
Convenient to entertainment/ leisure activities
20 19 21 21 32 17 15 24
Convenient to schools 20 23 13 13 13 29 43 6
Convenient to parks/ recreational facilities
17 18 13 17 19 26 19 17
Availability of larger lots or acreage 16 19 6 15 16 16 21 13
Home in a planned community 8 8 9 9 5 5 8 9
Convenient to airport 6 6 5 7 5 8 5 7
Convenient to public transportation 5 5 6 5 6 7 4 6
Convenient to health facilities 1 2 1 1 * * 1 1
Other 5 6 6 4 4 8 3 7
* Less than 1 percent
38
2016 PROFILE OF HOME BUYERS AND SELLERS n Chapter 2: Characteristics of Homes Purchased
National Association of REALTORS® n PROFILE OF HOME BUYERS AND SELLERS 2016
EXHIBIT 2–15 PRICE OF HOME PURCHASED, BY REGION (Percentage Distribution)
BUYERS WHO PURCHASED A HOME IN THE
All Buyers Northeast Midwest South West
Less than $75,000 4% 5% 8% 4% 1%
$75,000 to $99,999 5 4 8 5 1
$100,000 to $124,999 6 8 10 5 2
$125,000 to $149,999 8 10 12 10 3
$150,000 to $174,999 10 10 12 11 5
$175,000 to $199,999 9 9 11 10 5
$200,000 to $249,999 15 13 15 16 14
$250,000 to $299,999 11 12 10 12 11
$300,000 to $349,999 9 9 5 7 13
$350,000 to $399,999 6 6 4 6 9
$400,000 to $499,999 8 7 3 7 14
$500,000 or more 10 8 3 8 21
Median price $227,700 $215,000 $175,000 $217,000 $325,000
EXHIBIT 2–16 PRICE OF HOME PURCHASED, NEW AND PREVIOUSLY OWNED HOMES (Percentage Distribution)
BUYERS WHO PURCHASED A
All Buyers New Home Previously Owned Home
Less than $75,000 4% 1% 5%
$75,000 to $99,999 5 * 6
$100,000 to $124,999 6 1 7
$125,000 to $149,999 8 4 9
$150,000 to $174,999 10 6 10
$175,000 to $199,999 9 9 9
$200,000 to $249,999 15 18 14
$250,000 to $299,999 11 13 11
$300,000 to $349,999 9 15 7
$350,000 to $399,999 6 8 6
$400,000 to $499,999 8 12 7
$500,000 or more 10 13 10
Median price $227,700 $294,000 $217,000
* Less than 1 percent
39 National Association of REALTORS® n PROFILE OF HOME BUYERS AND SELLERS 2016
National Association of REALTORS®
EXHIBIT 2–17 PRICE OF HOME PURCHASED, FIRST-TIME AND REPEAT BUYERS (Percentage Distribution)
All Buyers First-time Buyers Repeat Buyers
Less than $75,000 4% 7% 3%
$75,000 to $99,999 5 8 3
$100,000 to $124,999 6 8 4
$125,000 to $149,999 8 11 7
$150,000 to $174,999 10 13 8
$175,000 to $199,999 9 10 9
$200,000 to $249,999 15 12 16
$250,000 to $299,999 11 9 13
$300,000 to $349,999 9 6 10
$350,000 to $399,999 6 4 8
$400,000 to $499,999 8 6 9
$500,000 or more 10 7 12
Median price $227,700 $182,500 $250,000
Married couple $255,000 $208,500 $270,000
Single female $173,000 $146,300 $198,000
Single male $190,600 $157,000 $220,000
Unmarried couple $181,400 $165,500 $245,000
Other $192,500 $161,200 $215,000
EXHIBIT 2–18 PURCHASE PRICE COMPARED WITH ASKING PRICE, BY REGION (Percentage Distribution)
BUYERS WHO PURCHASED A HOME IN THE
Percent of asking price: All Buyers Northeast Midwest South West
Less than 90% 9% 12% 12% 9% 5%
90% to 94% 15 16 16 15 11
95% to 99% 36 39 39 35 33
100% 27 22 25 29 30
101% to 110% 11 9 7 9 18
More than 110% 2 2 1 3 4
Median (purchase price as a percent of asking price)
98% 97% 98% 98% 100%
40
2016 PROFILE OF HOME BUYERS AND SELLERS n Chapter 2: Characteristics of Homes Purchased
National Association of REALTORS® n PROFILE OF HOME BUYERS AND SELLERS 2016
EXHIBIT 2–19 SIZE OF HOME PURCHASED, FIRST-TIME AND REPEAT BUYERS, AND BUYERS OF NEW AND PREVIOUSLY OWNED HOMES (Percentage Distribution)
BUYERS OF
All Buyers First-time Buyers Repeat Buyers New HomesPreviously Owned
Homes
1,000 sq ft or less * 1% * * *
1,001 to 1,500 sq ft 15 24 9 3 16
1,501 to 2,000 sq ft 27 32 24 21 28
2,001 to 2,500 sq ft 26 24 28 26 27
2,501 to 3,000 sq ft 15 12 17 14 14
3,001 to 3,500 sq ft 8 4 10 7 7
3,501 sq ft or more 9 4 11 8 8
Median (sq ft) 1,900 1,650 2,000 2,250 1,820
* Less than 1 percent
EXHIBIT 2–20 SIZE OF HOME PURCHASED, BY ADULT COMPOSITION OF HOUSEHOLD (Percentage Distribution)
ADULT COMPOSITION OF HOUSEHOLD CHILDREN IN HOME
All BuyersMarried couple
Single female Single male
Unmarried couple Other
Children under 18 in home
No children in home
1,000 sq ft or less * * 1% 1% 1% * * *
1,001 to 1,500 sq ft 15 8 28 27 24 17 10 17
1,501 to 2,000 sq ft 27 23 39 35 31 28 20 31
2,001 to 2,500 sq ft 26 29 20 22 25 30 27 26
2,501 to 3,000 sq ft 15 17 9 7 11 12 17 13
3,001 to 3,500 sq ft 8 10 3 5 6 4 11 6
3,501 sq ft or more 9 12 1 3 3 10 14 6
Median (sq ft) 1,900 2,010 1,520 1,575 1,670 1,850 2,100 1,800
* Less than 1 percent
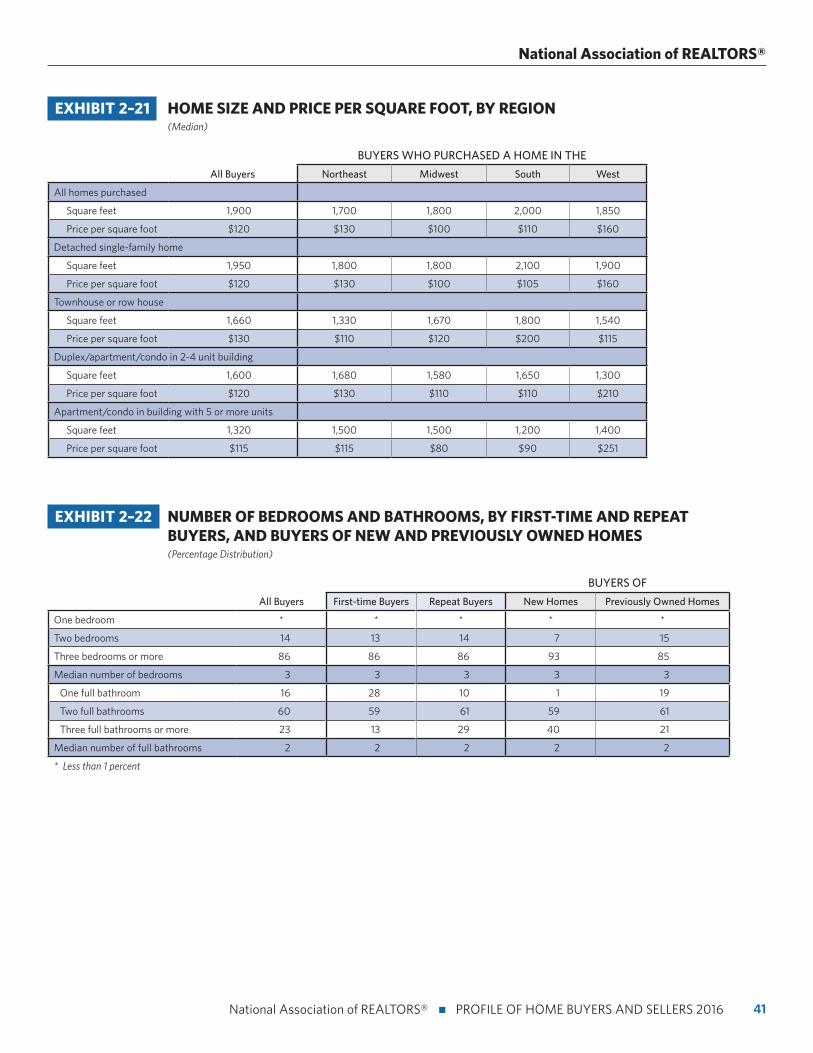
41 National Association of REALTORS® n PROFILE OF HOME BUYERS AND SELLERS 2016
National Association of REALTORS®
EXHIBIT 2–21 HOME SIZE AND PRICE PER SQUARE FOOT, BY REGION (Median)
BUYERS WHO PURCHASED A HOME IN THE
All Buyers Northeast Midwest South West
All homes purchased
Square feet 1,900 1,700 1,800 2,000 1,850
Price per square foot $120 $130 $100 $110 $160
Detached single-family home
Square feet 1,950 1,800 1,800 2,100 1,900
Price per square foot $120 $130 $100 $105 $160
Townhouse or row house
Square feet 1,660 1,330 1,670 1,800 1,540
Price per square foot $130 $110 $120 $200 $115
Duplex/apartment/condo in 2-4 unit building
Square feet 1,600 1,680 1,580 1,650 1,300
Price per square foot $120 $130 $110 $110 $210
Apartment/condo in building with 5 or more units
Square feet 1,320 1,500 1,500 1,200 1,400
Price per square foot $115 $115 $80 $90 $251
EXHIBIT 2–22 NUMBER OF BEDROOMS AND BATHROOMS, BY FIRST-TIME AND REPEAT BUYERS, AND BUYERS OF NEW AND PREVIOUSLY OWNED HOMES (Percentage Distribution)
BUYERS OF
All Buyers First-time Buyers Repeat Buyers New Homes Previously Owned Homes
One bedroom * * * * *
Two bedrooms 14 13 14 7 15
Three bedrooms or more 86 86 86 93 85
Median number of bedrooms 3 3 3 3 3
One full bathroom 16 28 10 1 19
Two full bathrooms 60 59 61 59 61
Three full bathrooms or more 23 13 29 40 21
Median number of full bathrooms 2 2 2 2 2
* Less than 1 percent
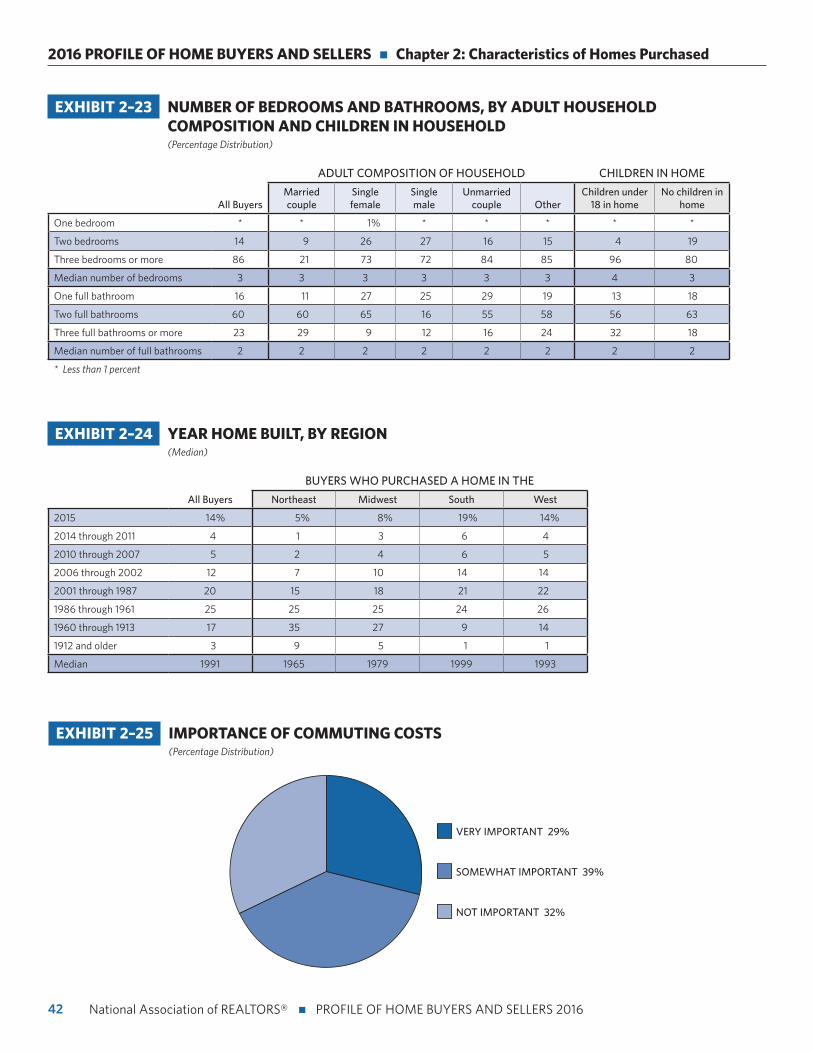
42
2016 PROFILE OF HOME BUYERS AND SELLERS n Chapter 2: Characteristics of Homes Purchased
National Association of REALTORS® n PROFILE OF HOME BUYERS AND SELLERS 2016
EXHIBIT 2–25 IMPORTANCE OF COMMUTING COSTS (Percentage Distribution)
NOT IMPORTANT 32%
SOMEWHAT IMPORTANT 39%
VERY IMPORTANT 29%
EXHIBIT 2–23 NUMBER OF BEDROOMS AND BATHROOMS, BY ADULT HOUSEHOLD COMPOSITION AND CHILDREN IN HOUSEHOLD (Percentage Distribution)
ADULT COMPOSITION OF HOUSEHOLD CHILDREN IN HOME
All BuyersMarried couple
Single female
Single male
Unmarried couple Other
Children under 18 in home
No children in home
One bedroom * * 1% * * * * *
Two bedrooms 14 9 26 27 16 15 4 19
Three bedrooms or more 86 21 73 72 84 85 96 80
Median number of bedrooms 3 3 3 3 3 3 4 3
One full bathroom 16 11 27 25 29 19 13 18
Two full bathrooms 60 60 65 16 55 58 56 63
Three full bathrooms or more 23 29 9 12 16 24 32 18
Median number of full bathrooms 2 2 2 2 2 2 2 2
* Less than 1 percent
EXHIBIT 2–24 YEAR HOME BUILT, BY REGION (Median)
BUYERS WHO PURCHASED A HOME IN THE
All Buyers Northeast Midwest South West
2015 14% 5% 8% 19% 14%
2014 through 2011 4 1 3 6 4
2010 through 2007 5 2 4 6 5
2006 through 2002 12 7 10 14 14
2001 through 1987 20 15 18 21 22
1986 through 1961 25 25 25 24 26
1960 through 1913 17 35 27 9 14
1912 and older 3 9 5 1 1
Median 1991 1965 1979 1999 1993
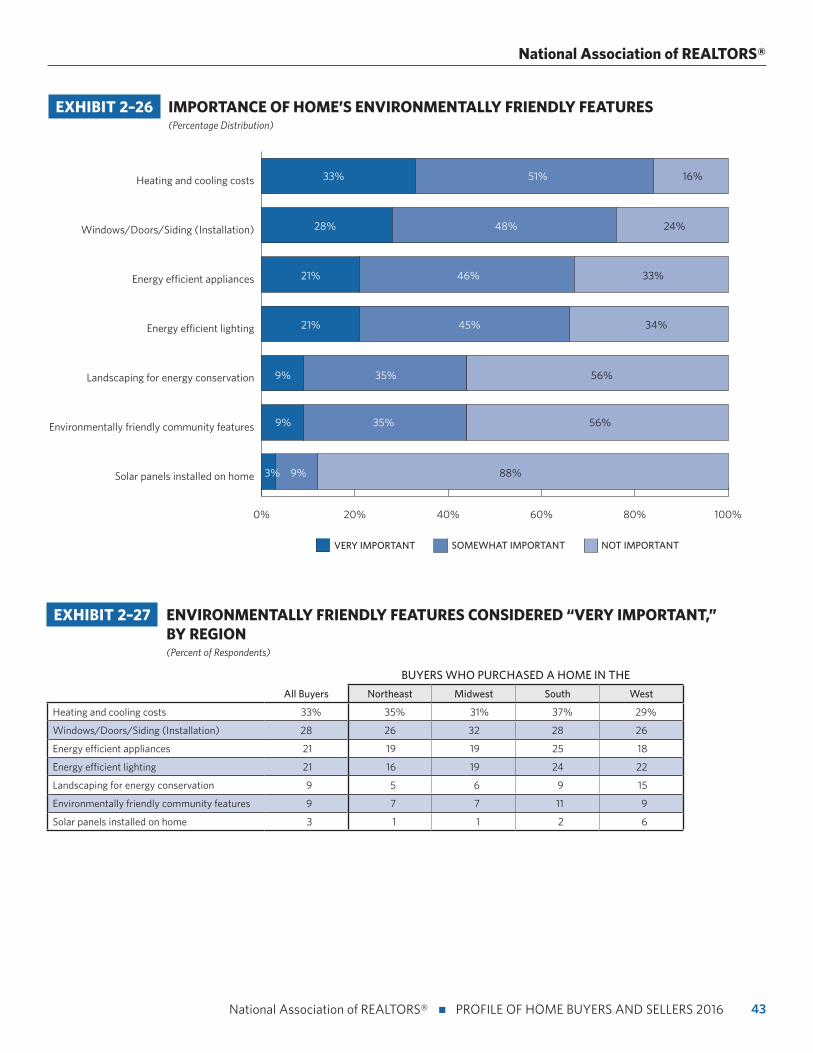
43 National Association of REALTORS® n PROFILE OF HOME BUYERS AND SELLERS 2016
National Association of REALTORS®
EXHIBIT 2–26 IMPORTANCE OF HOME’S ENVIRONMENTALLY FRIENDLY FEATURES (Percentage Distribution)
0% 20% 40% 60% 80% 100%
Solar panels installed on home
Environmentally friendly community features
Landscaping for energy conservation
Energy efficient lighting
Energy efficient appliances
Windows/Doors/Siding (Installation)
Heating and cooling costs
VERY IMPORTANT SOMEWHAT IMPORTANT NOT IMPORTANT
33% 51% 16%
28% 48% 24%
21% 46% 33%
21% 45% 34%
9% 35% 56%
9% 35% 56%
3% 9% 88%
EXHIBIT 2–27 ENVIRONMENTALLY FRIENDLY FEATURES CONSIDERED “VERY IMPORTANT,” BY REGION (Percent of Respondents)
BUYERS WHO PURCHASED A HOME IN THE
All Buyers Northeast Midwest South West
Heating and cooling costs 33% 35% 31% 37% 29%
Windows/Doors/Siding (Installation) 28 26 32 28 26
Energy efficient appliances 21 19 19 25 18
Energy efficient lighting 21 16 19 24 22
Landscaping for energy conservation 9 5 6 9 15
Environmentally friendly community features 9 7 7 11 9
Solar panels installed on home 3 1 1 2 6
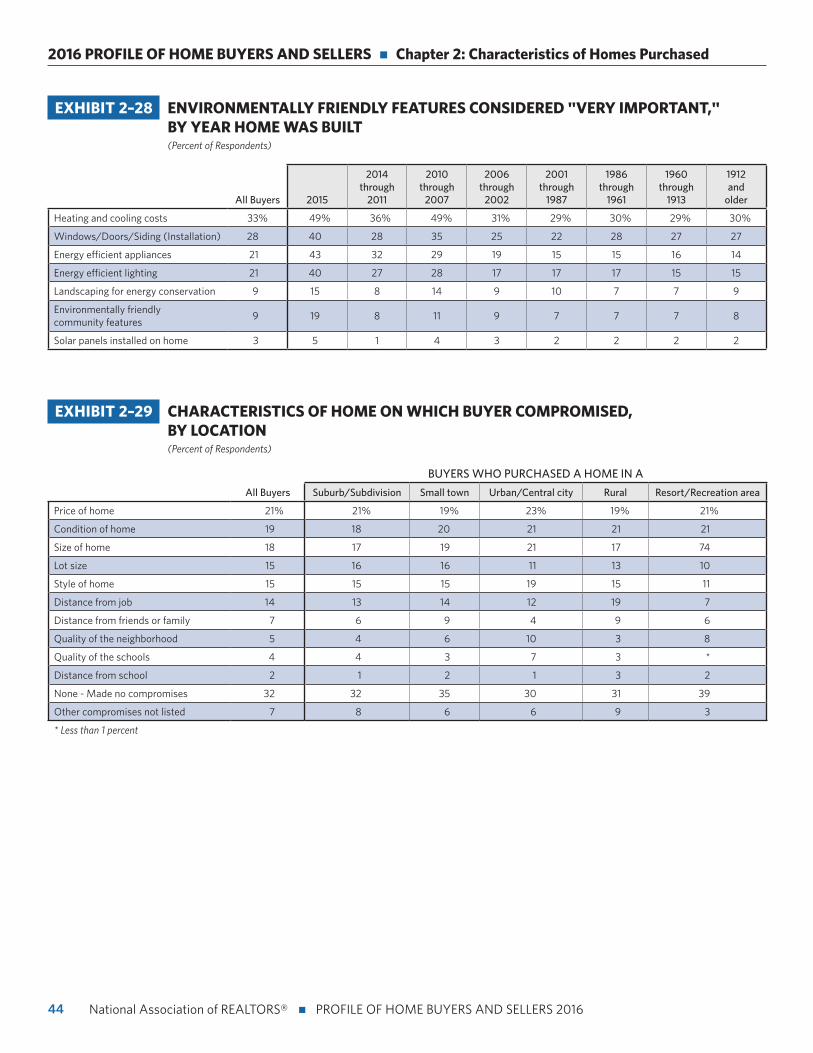
44
2016 PROFILE OF HOME BUYERS AND SELLERS n Chapter 2: Characteristics of Homes Purchased
National Association of REALTORS® n PROFILE OF HOME BUYERS AND SELLERS 2016
EXHIBIT 2–28 ENVIRONMENTALLY FRIENDLY FEATURES CONSIDERED "VERY IMPORTANT," BY YEAR HOME WAS BUILT (Percent of Respondents)
All Buyers 2015
2014 through
2011
2010 through
2007
2006 through
2002
2001 through
1987
1986 through
1961
1960 through
1913
1912 and
older
Heating and cooling costs 33% 49% 36% 49% 31% 29% 30% 29% 30%
Windows/Doors/Siding (Installation) 28 40 28 35 25 22 28 27 27
Energy efficient appliances 21 43 32 29 19 15 15 16 14
Energy efficient lighting 21 40 27 28 17 17 17 15 15
Landscaping for energy conservation 9 15 8 14 9 10 7 7 9
Environmentally friendly community features
9 19 8 11 9 7 7 7 8
Solar panels installed on home 3 5 1 4 3 2 2 2 2
EXHIBIT 2–29 CHARACTERISTICS OF HOME ON WHICH BUYER COMPROMISED, BY LOCATION (Percent of Respondents)
BUYERS WHO PURCHASED A HOME IN A
All Buyers Suburb/Subdivision Small town Urban/Central city Rural Resort/Recreation area
Price of home 21% 21% 19% 23% 19% 21%
Condition of home 19 18 20 21 21 21
Size of home 18 17 19 21 17 74
Lot size 15 16 16 11 13 10
Style of home 15 15 15 19 15 11
Distance from job 14 13 14 12 19 7
Distance from friends or family 7 6 9 4 9 6
Quality of the neighborhood 5 4 6 10 3 8
Quality of the schools 4 4 3 7 3 *
Distance from school 2 1 2 1 3 2
None - Made no compromises 32 32 35 30 31 39
Other compromises not listed 7 8 6 6 9 3
* Less than 1 percent
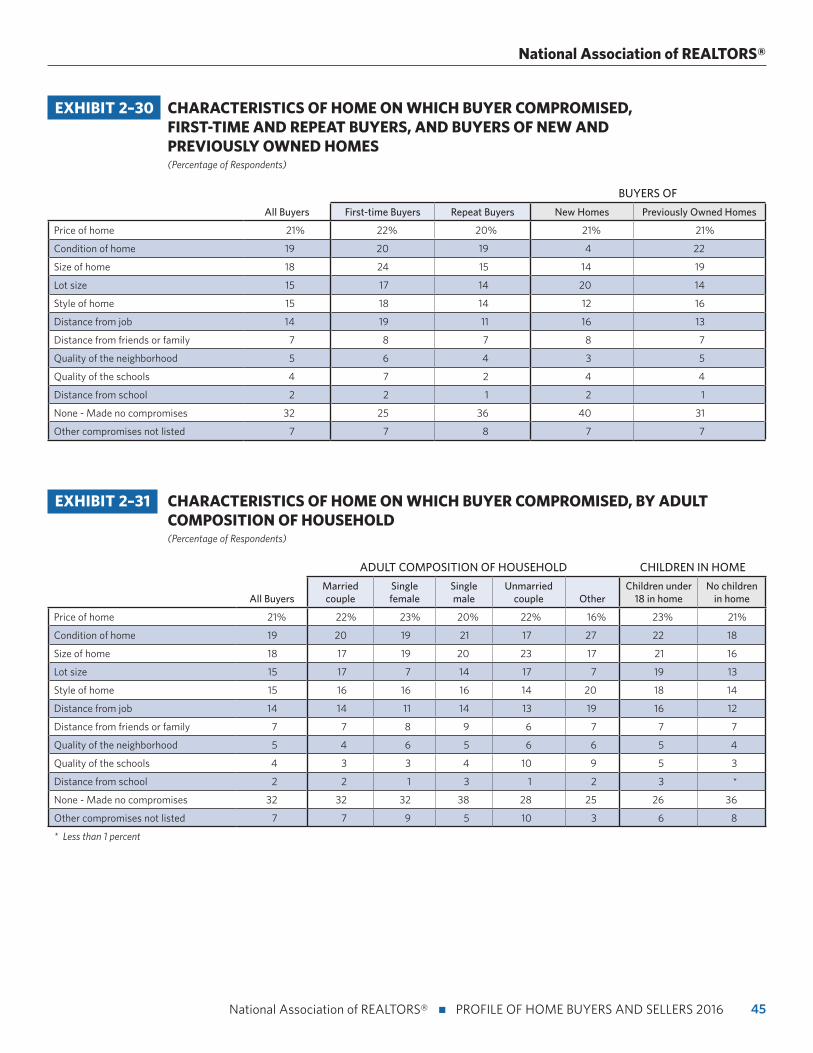
45 National Association of REALTORS® n PROFILE OF HOME BUYERS AND SELLERS 2016
National Association of REALTORS®
EXHIBIT 2–30 CHARACTERISTICS OF HOME ON WHICH BUYER COMPROMISED, FIRST-TIME AND REPEAT BUYERS, AND BUYERS OF NEW AND PREVIOUSLY OWNED HOMES (Percentage of Respondents)
BUYERS OF
All Buyers First-time Buyers Repeat Buyers New Homes Previously Owned Homes
Price of home 21% 22% 20% 21% 21%
Condition of home 19 20 19 4 22
Size of home 18 24 15 14 19
Lot size 15 17 14 20 14
Style of home 15 18 14 12 16
Distance from job 14 19 11 16 13
Distance from friends or family 7 8 7 8 7
Quality of the neighborhood 5 6 4 3 5
Quality of the schools 4 7 2 4 4
Distance from school 2 2 1 2 1
None - Made no compromises 32 25 36 40 31
Other compromises not listed 7 7 8 7 7
EXHIBIT 2–31 CHARACTERISTICS OF HOME ON WHICH BUYER COMPROMISED, BY ADULT COMPOSITION OF HOUSEHOLD (Percentage of Respondents)
ADULT COMPOSITION OF HOUSEHOLD CHILDREN IN HOME
All BuyersMarried couple
Single female
Single male
Unmarried couple Other
Children under 18 in home
No children in home
Price of home 21% 22% 23% 20% 22% 16% 23% 21%
Condition of home 19 20 19 21 17 27 22 18
Size of home 18 17 19 20 23 17 21 16
Lot size 15 17 7 14 17 7 19 13
Style of home 15 16 16 16 14 20 18 14
Distance from job 14 14 11 14 13 19 16 12
Distance from friends or family 7 7 8 9 6 7 7 7
Quality of the neighborhood 5 4 6 5 6 6 5 4
Quality of the schools 4 3 3 4 10 9 5 3
Distance from school 2 2 1 3 1 2 3 *
None - Made no compromises 32 32 32 38 28 25 26 36
Other compromises not listed 7 7 9 5 10 3 6 8
* Less than 1 percent
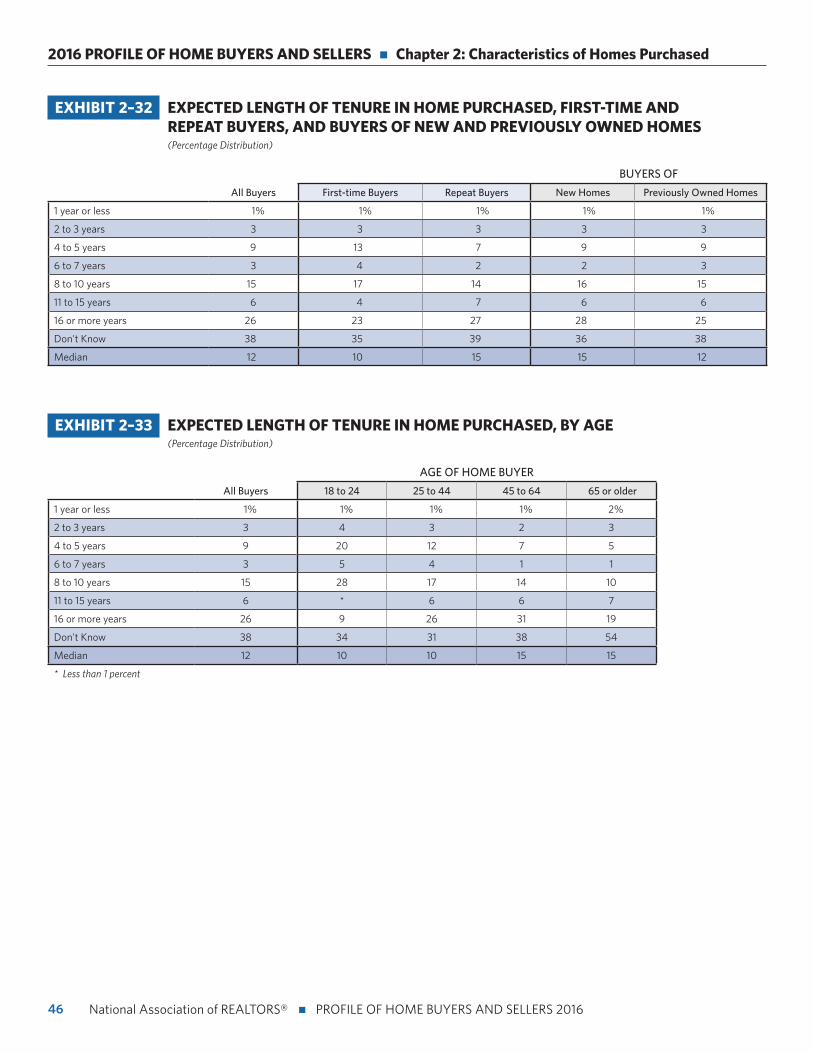
46
2016 PROFILE OF HOME BUYERS AND SELLERS n Chapter 2: Characteristics of Homes Purchased
National Association of REALTORS® n PROFILE OF HOME BUYERS AND SELLERS 2016
EXHIBIT 2–33 EXPECTED LENGTH OF TENURE IN HOME PURCHASED, BY AGE (Percentage Distribution)
AGE OF HOME BUYER
All Buyers 18 to 24 25 to 44 45 to 64 65 or older
1 year or less 1% 1% 1% 1% 2%
2 to 3 years 3 4 3 2 3
4 to 5 years 9 20 12 7 5
6 to 7 years 3 5 4 1 1
8 to 10 years 15 28 17 14 10
11 to 15 years 6 * 6 6 7
16 or more years 26 9 26 31 19
Don't Know 38 34 31 38 54
Median 12 10 10 15 15
* Less than 1 percent
EXHIBIT 2–32 EXPECTED LENGTH OF TENURE IN HOME PURCHASED, FIRST-TIME AND REPEAT BUYERS, AND BUYERS OF NEW AND PREVIOUSLY OWNED HOMES (Percentage Distribution)
BUYERS OF
All Buyers First-time Buyers Repeat Buyers New Homes Previously Owned Homes
1 year or less 1% 1% 1% 1% 1%
2 to 3 years 3 3 3 3 3
4 to 5 years 9 13 7 9 9
6 to 7 years 3 4 2 2 3
8 to 10 years 15 17 14 16 15
11 to 15 years 6 4 7 6 6
16 or more years 26 23 27 28 25
Don't Know 38 35 39 36 38
Median 12 10 15 15 12
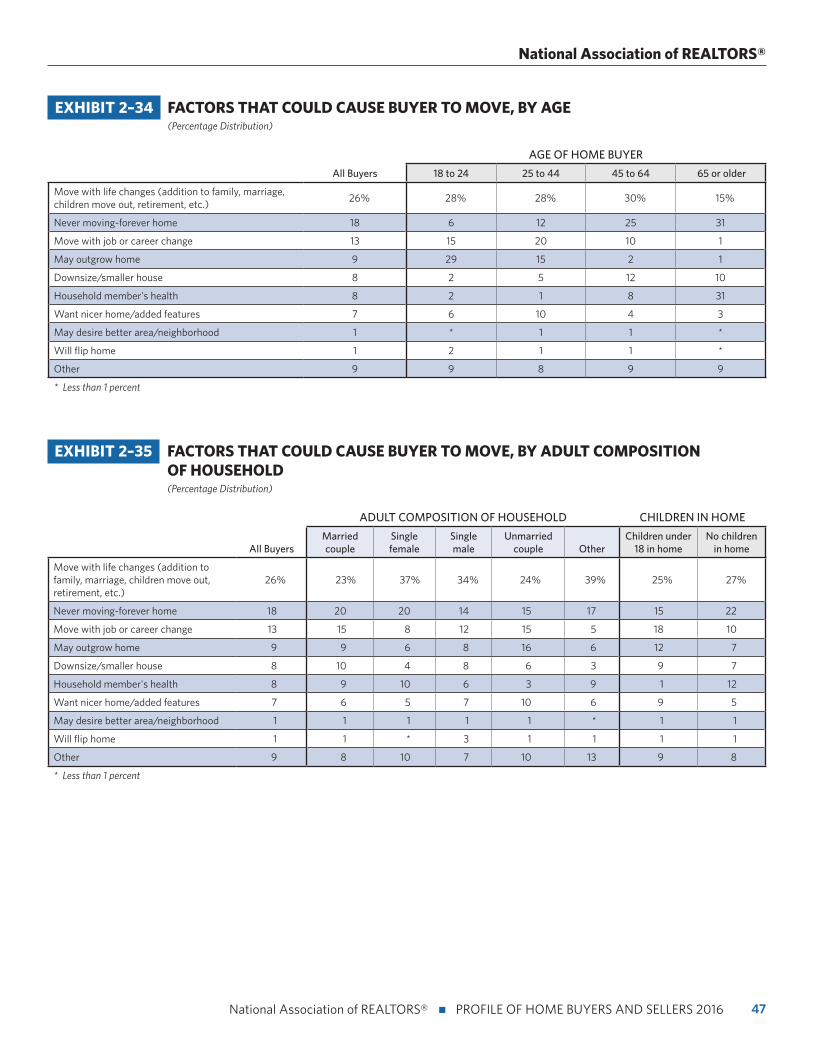
47 National Association of REALTORS® n PROFILE OF HOME BUYERS AND SELLERS 2016
National Association of REALTORS®
EXHIBIT 2–34 FACTORS THAT COULD CAUSE BUYER TO MOVE, BY AGE (Percentage Distribution)
AGE OF HOME BUYER
All Buyers 18 to 24 25 to 44 45 to 64 65 or older
Move with life changes (addition to family, marriage, children move out, retirement, etc.)
26% 28% 28% 30% 15%
Never moving-forever home 18 6 12 25 31
Move with job or career change 13 15 20 10 1
May outgrow home 9 29 15 2 1
Downsize/smaller house 8 2 5 12 10
Household member's health 8 2 1 8 31
Want nicer home/added features 7 6 10 4 3
May desire better area/neighborhood 1 * 1 1 *
Will flip home 1 2 1 1 *
Other 9 9 8 9 9
* Less than 1 percent
EXHIBIT 2–35 FACTORS THAT COULD CAUSE BUYER TO MOVE, BY ADULT COMPOSITION OF HOUSEHOLD (Percentage Distribution)
ADULT COMPOSITION OF HOUSEHOLD CHILDREN IN HOME
All BuyersMarried couple
Single female
Single male
Unmarried couple Other
Children under 18 in home
No children in home
Move with life changes (addition to family, marriage, children move out, retirement, etc.)
26% 23% 37% 34% 24% 39% 25% 27%
Never moving-forever home 18 20 20 14 15 17 15 22
Move with job or career change 13 15 8 12 15 5 18 10
May outgrow home 9 9 6 8 16 6 12 7
Downsize/smaller house 8 10 4 8 6 3 9 7
Household member's health 8 9 10 6 3 9 1 12
Want nicer home/added features 7 6 5 7 10 6 9 5
May desire better area/neighborhood 1 1 1 1 1 * 1 1
Will flip home 1 1 * 3 1 1 1 1
Other 9 8 10 7 10 13 9 8
* Less than 1 percent
48
The Home Search Process
CHAPTER 3:
National Association of REALTORS® n PROFILE OF HOME BUYERS AND SELLERS 2016
The Profile of Home Buyers and Sellers has tracked an immense amount of data on the home search process since its inception. This year we celebrate the report’s 35th anniversary, and in doing so we look at data going back to 1981.
Starting the home buying process online continues to be the first step that many home buyers are taking. Forty-four percent of recent buyers first looked online for the properties for sale, with 95 percent of all recent buyers using the internet at some point during the home search process.
Since 1987, we have collected data on how many weeks buyers searched for the home they bought and how many homes they viewed. While the number of weeks increased with time, home buyers viewed roughly the same number of homes for three decades. In 2016, home buyers searched for a median of 10 weeks. By com-parison, in 1987 home buyers searched for a median of just seven weeks. From 1989 to 2007, buyers typically searched for a home for eight weeks, with 2001 as the exception at just seven weeks. From 2009 to 2013, the search time jumped up to twelve weeks, then came back down to 10 weeks in 2014 and remained there for the last three years.
Buyers viewed a median of 10 homes in 2016, compared to 12 homes in 1987. Home buyers continued to view a median of 12 homes from 1991 through 1995 and again in 2009 through 2011. There was a brief period from 2004 to 2006 when buyers only looked at a median of nine homes. All other years, home buyers viewed a median of 10 homes before purchasing.
Among the 72 percent who used a mobile or tablet in the home buying process, nearly six in 10 recent home buyers found the home their ultimately purchased on that device. Of the 95 percent of home buyers who used the internet to search for a home, 50 percent found the home that they ultimately bought online.
Real estate agents remain a vital part of the home search process, and are the sec-ond most frequented information source for home buyers. With tightened inven-tory conditions in many areas of the country, finding the right property remains the most difficult step in the home buying process. Overall, home buyers continue to be satisfied with the home buying process at 92 percent, slightly up from 91 percent in 2015.
49 National Association of REALTORS® n PROFILE OF HOME BUYERS AND SELLERS 2016
National Association of REALTORS®
The Search Process
• Exhibits 3–7 through 3–11
The typical search period stayed the same from last year’s
report at 10 weeks for a buyer to find a home. From 2009 to
2013, the typical home search process took 12 weeks for a
buyer. Buyers typically looked at a median of 10 homes before
finding a home to purchase. In the most recent report, in
the West, buyers searched for only nine weeks, the shortest
amount of time, and buyers in the Northeast searched for the
longest at 12 weeks. The Midwest and the South followed the
median trend at 10 weeks to find a home.
Buyers who used an agent typically spent three weeks
searching before they contacted an agent. First-time buyers
usually searched longer than repeat buyers for a home at 12
weeks, compared with repeat buyers who searched for 10
weeks.
The internet has become the main source where buyers are
finding the home that they purchased. Today 51 percent of
recent buyers (up from 44 percent last year) found their
home through the internet. Only eight percent of buyers
found their home through the internet 15 years ago. Finding a
home through a real estate agent has shifted from being the
most common source for finding a property to the second
most common source. Sources such as yard signs, friends,
relatives and neighbors, or home builders, have incrementally
declined throughout the years with the rise of the internet as
an information source.
Thirty-nine percent of recent buyers considered purchasing a
home in foreclosure (down from 41 percent last year), but the
top reason for ultimately not purchasing a foreclosure property
was not being able to find the right home. Other reasons
for not purchasing a home in foreclosure included that the
process was too difficult or complex and the poor condition
of the home. This year, first-time buyers made up the largest
group who considered purchasing a home in foreclosure.
Among all buyers, the most difficult step in the home buying
process was finding the right home to purchase at 52 percent.
For 24 percent of buyers, the most difficult step was the
paperwork, and 17 percent cited the most difficult step was
understanding the process and steps involved. While 16
percent of recent buyers had no difficult steps, this was much
more common among repeat buyers.
The First Step in the Home Buying Process
• Exhibits 3–1 and 3–2
Forty-four percent of home buyers first looked online for
properties for sale as their first step in the home buying
process, while 17 percent of buyers first contacted a real
estate agent. Repeat home buyers were more likely than first-
time buyers to look online for properties for sale as a first
step. First-time home buyers were more likely to look online
information about the home buying process at 21 percent. The
first steps of contacting a real estate agent and contacting
a builder/visiting builder models increased as the age of the
home buyer also increased. Across all age groups, reading
books or guides about the home buying process was the least
taken first step.
Information Sources
• Exhibits 3–3 through 3–6
Throughout the home search process, online websites
and real estate agents continue to be the two most used
resources. Home buyers under the age of 45 were the most
likely to search for homes through an online website, while
buyers between the ages of 18 and 24 most frequently used
a real estate agent as an information source. An increasing
percentage of home buyers are using mobile or tablet search
devices at 72 percent. The use of yard signs and open
houses as information sources remained relatively the same
compared to last year, both of which have historically been
used most frequently after online websites and real estate
agents.
Online websites, real estate agents, mobile or tablet search
devices, and open online video sites were the most used
sources. Only eight percent of recent home buyers rarely used,
or did not use, a real estate agent. Online websites were seen
as the most useful information source during the home search
process at 86 percent.
50
2016 PROFILE OF HOME BUYERS AND SELLERS n Chapter 3: The Home Search Process
National Association of REALTORS® n PROFILE OF HOME BUYERS AND SELLERS 2016
Internet Usage Trends
• Exhibits 3–12 and 3–13
The percentage of home buyers who used the internet to
search for a home increased to 95 percent after holding
steady at 92 percent for three years in a row. The Profile of
Home Buyers and Sellers started collecting data on the use of
the internet for the home search process in 1995, where only
two percent of buyers looked online at that time. In 1997, that
number jumped to 18 percent of home buyers who used the
internet in their search. That number doubled over the years
and by 2009, 90 percent of buyers used the internet at some
point in their search. That share dropped a few percentage
points in the next several years until 2012 when it slowly
started increasing.
As a result of searching for a home on the internet, 67 percent
of buyers walked through the homes that they viewed online,
and 44 percent saw the exterior of these homes and drove
through the neighborhoods. First-time buyers were the most
likely to request more information as a result of searching
online.
Characteristics of Internet Searchers and Sources Used
• Exhibits 3–14 through 3–17
Comparing buyers who use the internet during their home
search to those who do not, it is interesting to see how the
demographics vary. Typically, a buyer who used the internet in
their home search is 43 years old and had a median household
income in 2015 of $89,900. In comparison, the typical buyer
who did not use the internet to search for a home was 63
years old and had a median household income in 2015 of
$73,900 (up from $64,400 in 2014). The typical buyer who
did not use the internet during their home search spent only
four weeks searching and visited four homes, compared to
those who did use the internet and searched for 10 weeks and
visited 10 homes.
Among buyers who did not use the internet in their home
search process, real estate agents were the most used
information source at 69 percent (down from 73 percent in the
year prior). Additionally, they used yard signs, open houses,
and home builders as information sources. Those who did
not use the internet to search used home builders and print
newspaper advertisements more often in their home search
than those who used the internet to search. Buyers who did
use the internet used two sources more than any other: online
websites (94 percent) and real estate agents (89 percent),
which is consistent with last year.
Fifty percent of buyers who used the internet during their
home search process ultimately found the home that they
purchased through the internet. Thirty-nine percent of buyers
who did not use the internet during their home search process
found their home through a real estate agent, compared to
only 30 percent of buyers who did use the internet. Buyers
who did not use the internet found their home more frequently
through a yard sign, through a friend, relative or neighbor,
through a builder or builder’s agent, or directly from the sellers
than those who used the internet to search.
It is evident that while a majority of home buyers are using the
internet during the home search process, the internet cannot
replace the role of the real estate agent in the transaction. Of
home buyers who used the internet to search for homes, 90
percent ultimately purchased their home through a real estate
agent. Interestingly, there is a larger percentage of buyers who
used the internet and still purchased their home through an
agent (90 percent), than buyers who did not use the internet
and purchased through an agent during their search (70
percent).
51 National Association of REALTORS® n PROFILE OF HOME BUYERS AND SELLERS 2016
National Association of REALTORS®
Website Features and Mobile Search
• Exhibits 3–18 and 3–19
Among buyers who used the internet during their home
search, 89 percent of buyers found photos and detailed
information about properties for sale (85 percent) to be very
useful. The next most useful website features included: floor
plans, virtual tours, detailed information about properties for
sale, and neighborhood information.
Using mobile devices is becoming more common among all
home buyers. Fifty-eight percent of buyers who used their
mobile device to search found their home through a mobile
application (down from 66 percent last year). First-time
buyers found their homes through a mobile application (60
percent) slightly more than repeat buyers (57 percent).
Satisfaction in Buying Process
• Exhibit 3–20
Sixty percent of recent buyers were very satisfied with their
recent home buying process, up from 59 percent a year ago.
Thirty-two percent of buyers were somewhat satisfied with
the buying process. Only eight percent of recent buyers were
dissatisfied with the buying process.
The Profile of Home Buyers and Sellers started collecting data on the use of the internet for the
home search process in 1995, where only two percent of buyers looked online at that time.
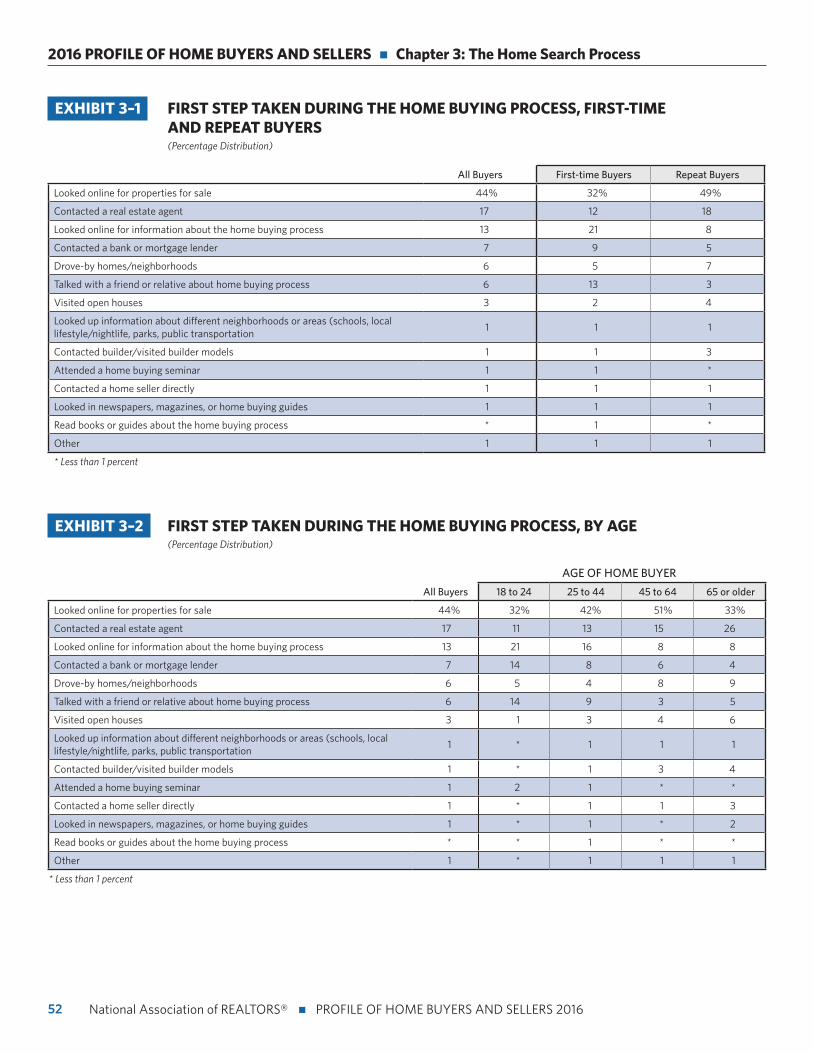
52
2016 PROFILE OF HOME BUYERS AND SELLERS n Chapter 3: The Home Search Process
National Association of REALTORS® n PROFILE OF HOME BUYERS AND SELLERS 2016
EXHIBIT 3–1 FIRST STEP TAKEN DURING THE HOME BUYING PROCESS, FIRST-TIME AND REPEAT BUYERS (Percentage Distribution)
All Buyers First-time Buyers Repeat Buyers
Looked online for properties for sale 44% 32% 49%
Contacted a real estate agent 17 12 18
Looked online for information about the home buying process 13 21 8
Contacted a bank or mortgage lender 7 9 5
Drove-by homes/neighborhoods 6 5 7
Talked with a friend or relative about home buying process 6 13 3
Visited open houses 3 2 4
Looked up information about different neighborhoods or areas (schools, local lifestyle/nightlife, parks, public transportation
1 1 1
Contacted builder/visited builder models 1 1 3
Attended a home buying seminar 1 1 *
Contacted a home seller directly 1 1 1
Looked in newspapers, magazines, or home buying guides 1 1 1
Read books or guides about the home buying process * 1 *
Other 1 1 1
* Less than 1 percent
EXHIBIT 3–2 FIRST STEP TAKEN DURING THE HOME BUYING PROCESS, BY AGE (Percentage Distribution)
AGE OF HOME BUYER
All Buyers 18 to 24 25 to 44 45 to 64 65 or older
Looked online for properties for sale 44% 32% 42% 51% 33%
Contacted a real estate agent 17 11 13 15 26
Looked online for information about the home buying process 13 21 16 8 8
Contacted a bank or mortgage lender 7 14 8 6 4
Drove-by homes/neighborhoods 6 5 4 8 9
Talked with a friend or relative about home buying process 6 14 9 3 5
Visited open houses 3 1 3 4 6
Looked up information about different neighborhoods or areas (schools, local lifestyle/nightlife, parks, public transportation
1 * 1 1 1
Contacted builder/visited builder models 1 * 1 3 4
Attended a home buying seminar 1 2 1 * *
Contacted a home seller directly 1 * 1 1 3
Looked in newspapers, magazines, or home buying guides 1 * 1 * 2
Read books or guides about the home buying process * * 1 * *
Other 1 * 1 1 1
* Less than 1 percent
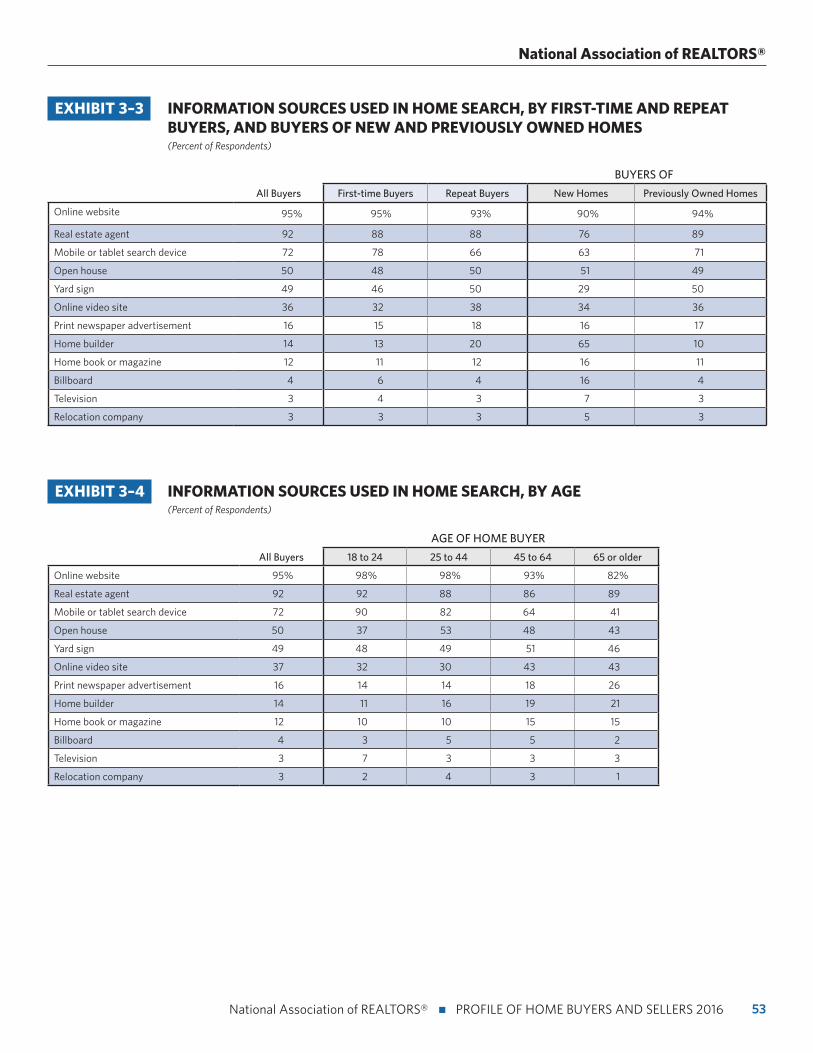
53 National Association of REALTORS® n PROFILE OF HOME BUYERS AND SELLERS 2016
National Association of REALTORS®
EXHIBIT 3–3 INFORMATION SOURCES USED IN HOME SEARCH, BY FIRST-TIME AND REPEAT BUYERS, AND BUYERS OF NEW AND PREVIOUSLY OWNED HOMES (Percent of Respondents)
BUYERS OF
All Buyers First-time Buyers Repeat Buyers New Homes Previously Owned Homes
Online website 95% 95% 93% 90% 94%
Real estate agent 92 88 88 76 89
Mobile or tablet search device 72 78 66 63 71
Open house 50 48 50 51 49
Yard sign 49 46 50 29 50
Online video site 36 32 38 34 36
Print newspaper advertisement 16 15 18 16 17
Home builder 14 13 20 65 10
Home book or magazine 12 11 12 16 11
Billboard 4 6 4 16 4
Television 3 4 3 7 3
Relocation company 3 3 3 5 3
EXHIBIT 3–4 INFORMATION SOURCES USED IN HOME SEARCH, BY AGE (Percent of Respondents)
AGE OF HOME BUYER
All Buyers 18 to 24 25 to 44 45 to 64 65 or older
Online website 95% 98% 98% 93% 82%
Real estate agent 92 92 88 86 89
Mobile or tablet search device 72 90 82 64 41
Open house 50 37 53 48 43
Yard sign 49 48 49 51 46
Online video site 37 32 30 43 43
Print newspaper advertisement 16 14 14 18 26
Home builder 14 11 16 19 21
Home book or magazine 12 10 10 15 15
Billboard 4 3 5 5 2
Television 3 7 3 3 3
Relocation company 3 2 4 3 1
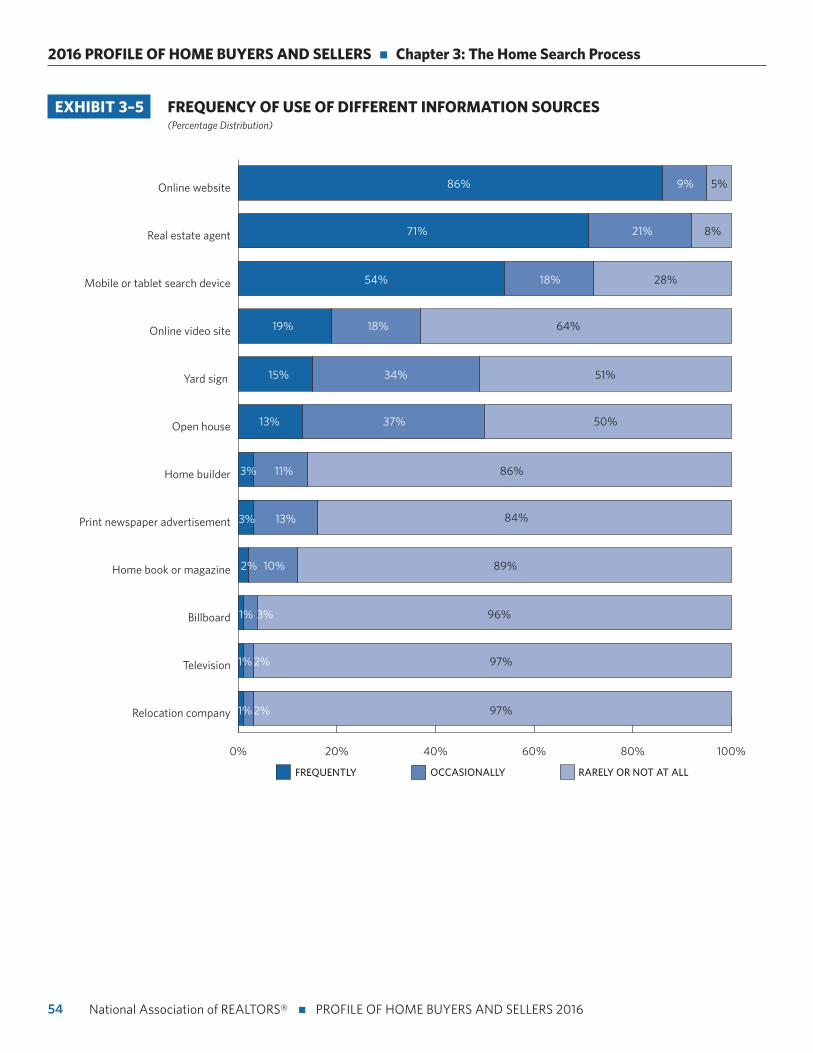
54
2016 PROFILE OF HOME BUYERS AND SELLERS n Chapter 3: The Home Search Process
National Association of REALTORS® n PROFILE OF HOME BUYERS AND SELLERS 2016
EXHIBIT 3–5 FREQUENCY OF USE OF DIFFERENT INFORMATION SOURCES (Percentage Distribution)
0% 20% 40% 60% 80% 100%
Relocation company
Television
Billboard
Home book or magazine
Print newspaper advertisement
Home builder
Open house
Yard sign
Online video site
Mobile or tablet search device
Real estate agent
Online website
RARELY OR NOT AT ALLOCCASIONALLYFREQUENTLY
2% 97%
2% 97%
1% 3% 96%
2% 10% 89%
3% 13% 84%
3% 11% 86%
13% 37% 50%
15% 34% 51%
19% 18% 64%
54% 18% 28%
71% 21% 8%
86% 9% 5%
1%
1%
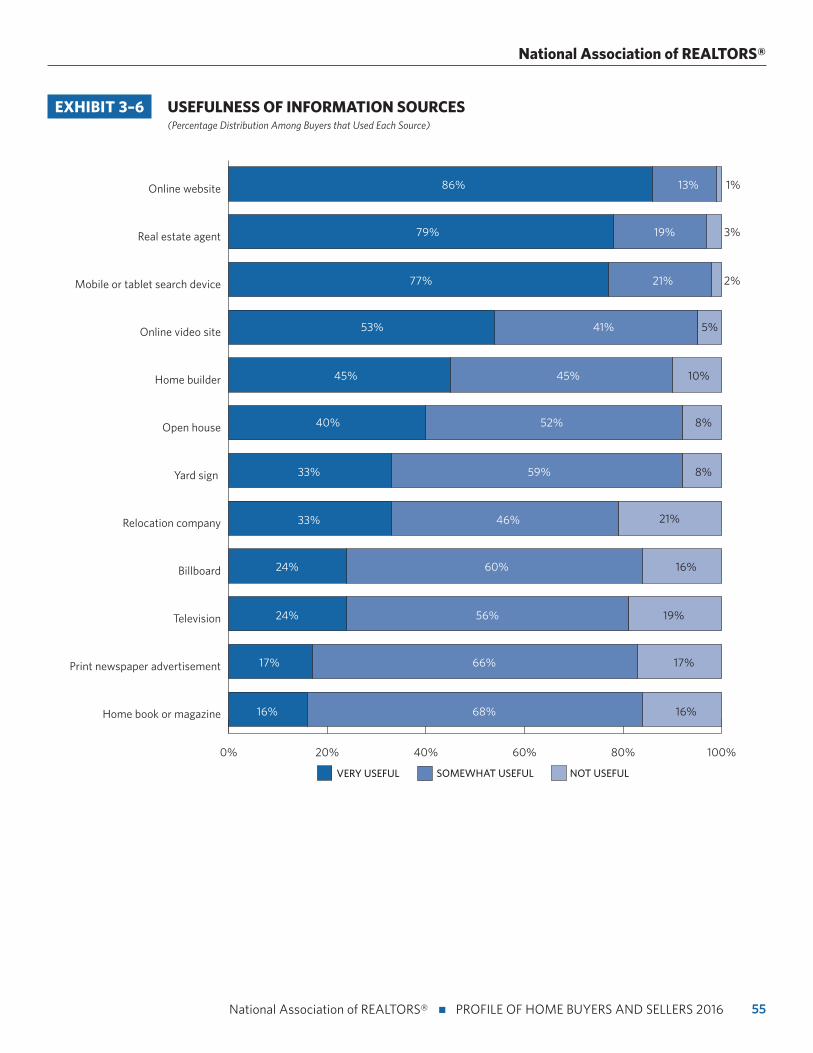
55 National Association of REALTORS® n PROFILE OF HOME BUYERS AND SELLERS 2016
National Association of REALTORS®
EXHIBIT 3–6 USEFULNESS OF INFORMATION SOURCES (Percentage Distribution Among Buyers that Used Each Source)
0% 20% 40% 60% 80% 100%
Home book or magazine
Print newspaper advertisement
Television
Billboard
Relocation company
Yard sign
Open house
Home builder
Online video site
Mobile or tablet search device
Real estate agent
Online website
NOT USEFULSOMEWHAT USEFULVERY USEFUL
68% 16%
66% 17%
24% 56% 19%
24% 60% 16%
33% 46% 21%
33% 59% 8%
40% 52% 8%
45% 45% 10%
53% 41% 5%
77% 21% 2%
79% 19% 3%
86% 13% 1%
17%
16%
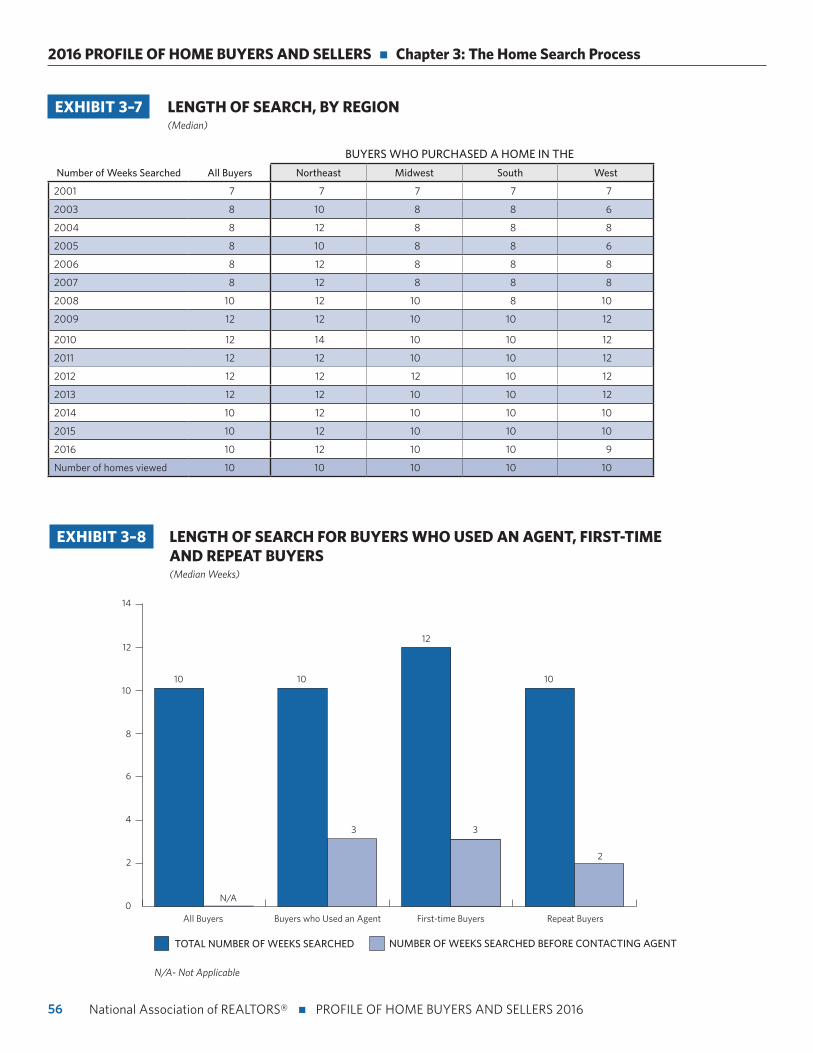
56
2016 PROFILE OF HOME BUYERS AND SELLERS n Chapter 3: The Home Search Process
National Association of REALTORS® n PROFILE OF HOME BUYERS AND SELLERS 2016
EXHIBIT 3–8 LENGTH OF SEARCH FOR BUYERS WHO USED AN AGENT, FIRST-TIME AND REPEAT BUYERS (Median Weeks)
0
2
4
6
8
10
12
14
All Buyers Buyers who Used an Agent First-time Buyers Repeat Buyers
10 10
12
10
3 3
2
N/A
NUMBER OF WEEKS SEARCHED BEFORE CONTACTING AGENTTOTAL NUMBER OF WEEKS SEARCHED
EXHIBIT 3–7 LENGTH OF SEARCH, BY REGION (Median)
BUYERS WHO PURCHASED A HOME IN THE
Number of Weeks Searched All Buyers Northeast Midwest South West
2001 7 7 7 7 7
2003 8 10 8 8 6
2004 8 12 8 8 8
2005 8 10 8 8 6
2006 8 12 8 8 8
2007 8 12 8 8 8
2008 10 12 10 8 10
2009 12 12 10 10 12
2010 12 14 10 10 12
2011 12 12 10 10 12
2012 12 12 12 10 12
2013 12 12 10 10 12
2014 10 12 10 10 10
2015 10 12 10 10 10
2016 10 12 10 10 9
Number of homes viewed 10 10 10 10 10
N/A- Not Applicable
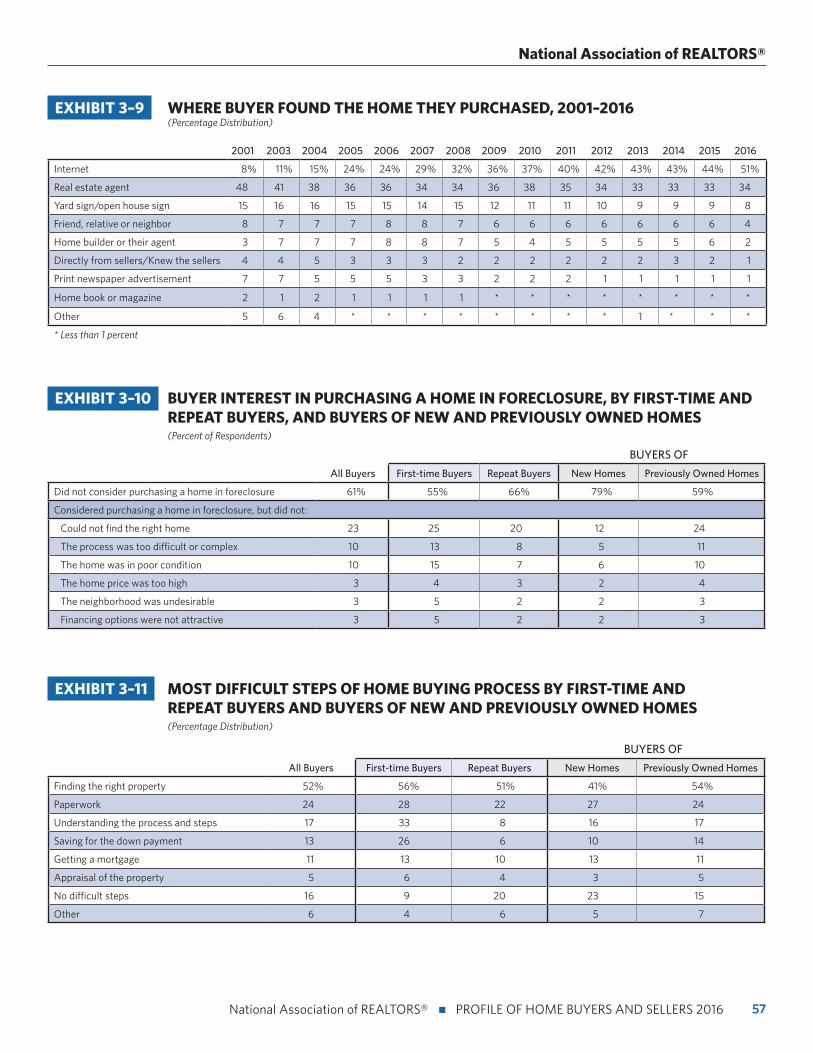
57 National Association of REALTORS® n PROFILE OF HOME BUYERS AND SELLERS 2016
National Association of REALTORS®
EXHIBIT 3–9 WHERE BUYER FOUND THE HOME THEY PURCHASED, 2001–2016 (Percentage Distribution)
2001 2003 2004 2005 2006 2007 2008 2009 2010 2011 2012 2013 2014 2015 2016
Internet 8% 11% 15% 24% 24% 29% 32% 36% 37% 40% 42% 43% 43% 44% 51%
Real estate agent 48 41 38 36 36 34 34 36 38 35 34 33 33 33 34
Yard sign/open house sign 15 16 16 15 15 14 15 12 11 11 10 9 9 9 8
Friend, relative or neighbor 8 7 7 7 8 8 7 6 6 6 6 6 6 6 4
Home builder or their agent 3 7 7 7 8 8 7 5 4 5 5 5 5 6 2
Directly from sellers/Knew the sellers 4 4 5 3 3 3 2 2 2 2 2 2 3 2 1
Print newspaper advertisement 7 7 5 5 5 3 3 2 2 2 1 1 1 1 1
Home book or magazine 2 1 2 1 1 1 1 * * * * * * * *
Other 5 6 4 * * * * * * * * 1 * * *
* Less than 1 percent
EXHIBIT 3–10 BUYER INTEREST IN PURCHASING A HOME IN FORECLOSURE, BY FIRST-TIME AND REPEAT BUYERS, AND BUYERS OF NEW AND PREVIOUSLY OWNED HOMES (Percent of Respondents)
BUYERS OF
All Buyers First-time Buyers Repeat Buyers New Homes Previously Owned Homes
Did not consider purchasing a home in foreclosure 61% 55% 66% 79% 59%
Considered purchasing a home in foreclosure, but did not:
Could not find the right home 23 25 20 12 24
The process was too difficult or complex 10 13 8 5 11
The home was in poor condition 10 15 7 6 10
The home price was too high 3 4 3 2 4
The neighborhood was undesirable 3 5 2 2 3
Financing options were not attractive 3 5 2 2 3
EXHIBIT 3–11 MOST DIFFICULT STEPS OF HOME BUYING PROCESS BY FIRST-TIME AND REPEAT BUYERS AND BUYERS OF NEW AND PREVIOUSLY OWNED HOMES (Percentage Distribution)
BUYERS OF
All Buyers First-time Buyers Repeat Buyers New Homes Previously Owned Homes
Finding the right property 52% 56% 51% 41% 54%
Paperwork 24 28 22 27 24
Understanding the process and steps 17 33 8 16 17
Saving for the down payment 13 26 6 10 14
Getting a mortgage 11 13 10 13 11
Appraisal of the property 5 6 4 3 5
No difficult steps 16 9 20 23 15
Other 6 4 6 5 7
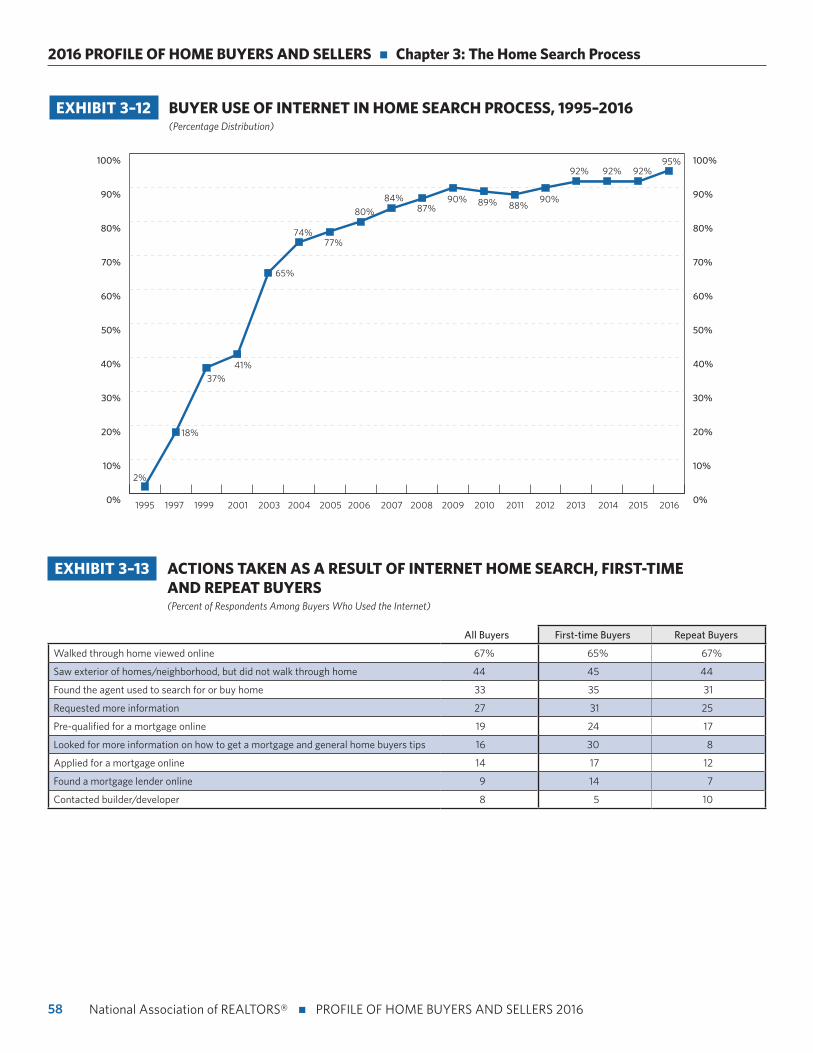
58
2016 PROFILE OF HOME BUYERS AND SELLERS n Chapter 3: The Home Search Process
National Association of REALTORS® n PROFILE OF HOME BUYERS AND SELLERS 2016
0%
10%
20%
30%
40%
50%
60%
70%
80%
90%
100%
0%
10%
20%
30%
40%
50%
60%
70%
80%
90%
100%
1995 1997 1999 2001 2003 2004 2005 2006 2007 2008 2009 2010 2011 2012 20162013 2014 2015
74%77%
65%
80%
84%87%
90%88%89% 90%
92% 92%95%
92%
37%41%
2%
18%
EXHIBIT 3–12 BUYER USE OF INTERNET IN HOME SEARCH PROCESS, 1995–2016 (Percentage Distribution)
EXHIBIT 3–13 ACTIONS TAKEN AS A RESULT OF INTERNET HOME SEARCH, FIRST-TIME AND REPEAT BUYERS (Percent of Respondents Among Buyers Who Used the Internet)
All Buyers First-time Buyers Repeat Buyers
Walked through home viewed online 67% 65% 67%
Saw exterior of homes/neighborhood, but did not walk through home 44 45 44
Found the agent used to search for or buy home 33 35 31
Requested more information 27 31 25
Pre-qualified for a mortgage online 19 24 17
Looked for more information on how to get a mortgage and general home buyers tips 16 30 8
Applied for a mortgage online 14 17 12
Found a mortgage lender online 9 14 7
Contacted builder/developer 8 5 10
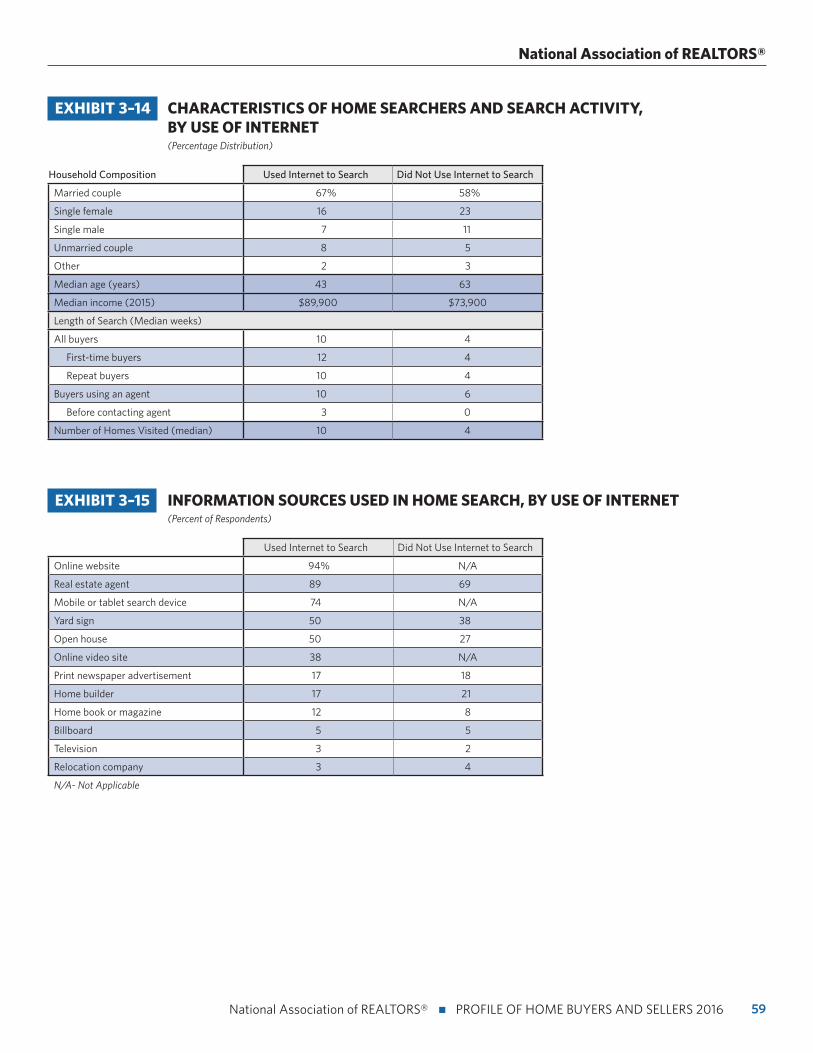
59 National Association of REALTORS® n PROFILE OF HOME BUYERS AND SELLERS 2016
National Association of REALTORS®
EXHIBIT 3–14 CHARACTERISTICS OF HOME SEARCHERS AND SEARCH ACTIVITY, BY USE OF INTERNET (Percentage Distribution)
Household Composition Used Internet to Search Did Not Use Internet to Search
Married couple 67% 58%
Single female 16 23
Single male 7 11
Unmarried couple 8 5
Other 2 3
Median age (years) 43 63
Median income (2015) $89,900 $73,900
Length of Search (Median weeks)
All buyers 10 4
First-time buyers 12 4
Repeat buyers 10 4
Buyers using an agent 10 6
Before contacting agent 3 0
Number of Homes Visited (median) 10 4
EXHIBIT 3–15 INFORMATION SOURCES USED IN HOME SEARCH, BY USE OF INTERNET (Percent of Respondents)
Used Internet to Search Did Not Use Internet to Search
Online website 94% N/A
Real estate agent 89 69
Mobile or tablet search device 74 N/A
Yard sign 50 38
Open house 50 27
Online video site 38 N/A
Print newspaper advertisement 17 18
Home builder 17 21
Home book or magazine 12 8
Billboard 5 5
Television 3 2
Relocation company 3 4
N/A- Not Applicable
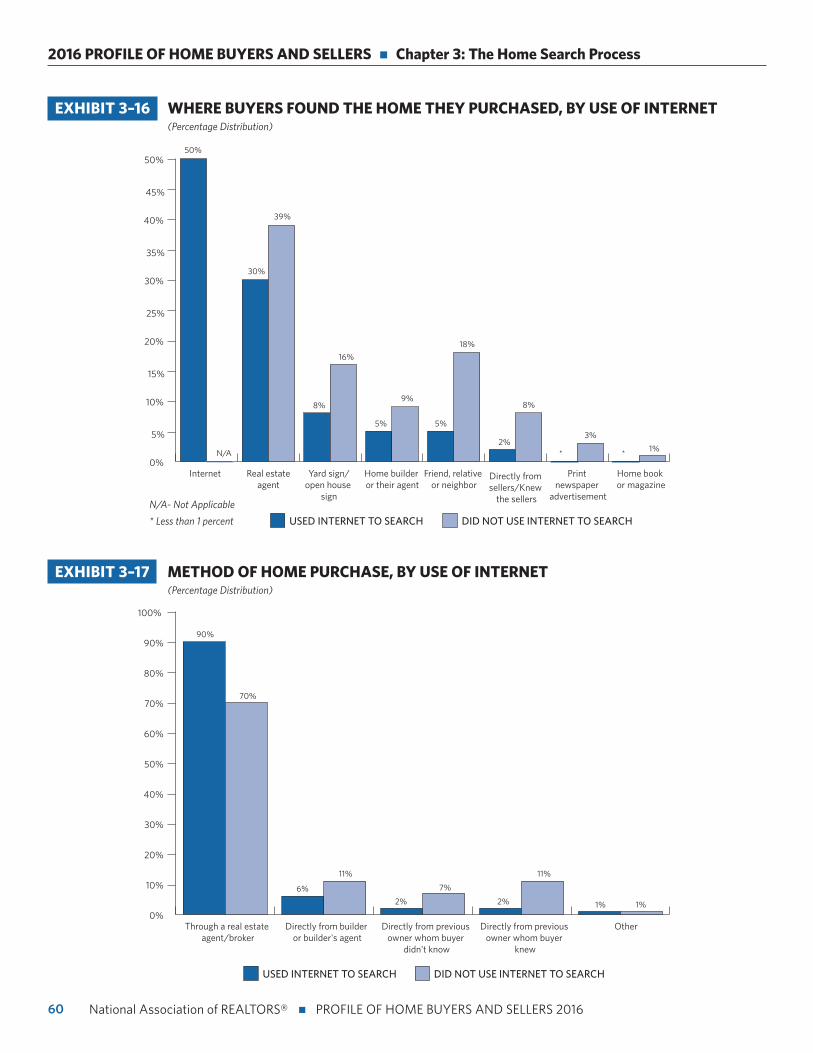
60
2016 PROFILE OF HOME BUYERS AND SELLERS n Chapter 3: The Home Search Process
National Association of REALTORS® n PROFILE OF HOME BUYERS AND SELLERS 2016
EXHIBIT 3–16 WHERE BUYERS FOUND THE HOME THEY PURCHASED, BY USE OF INTERNET (Percentage Distribution)
0%
5%
10%
15%
20%
25%
30%
35%
40%
45%
50%50%
DID NOT USE INTERNET TO SEARCHUSED INTERNET TO SEARCH
N/A
30%
39%
8%
16%
5%
9%
5%
18%
2%
8%
*
3%
* 1%
Internet Real estateagent
Yard sign/open house
sign
Home builder or their agent
Friend, relative or neighbor
Directly from sellers/Knew
the sellers
Print newspaper
advertisement
Home book or magazine
0%
10%
20%
30%
40%
50%
60%
70%
80%
90%
100%
90%
DID NOT USE INTERNET TO SEARCHUSED INTERNET TO SEARCH
70%
6%
11%
2%
7%
2%
11%
1% 1%
Through a real estate agent/broker
Directly from builder or builder's agent
Directly from previous owner whom buyer
didn't know
Directly from previous owner whom buyer
knew
Other
EXHIBIT 3–17 METHOD OF HOME PURCHASE, BY USE OF INTERNET (Percentage Distribution)
N/A- Not Applicable
* Less than 1 percent
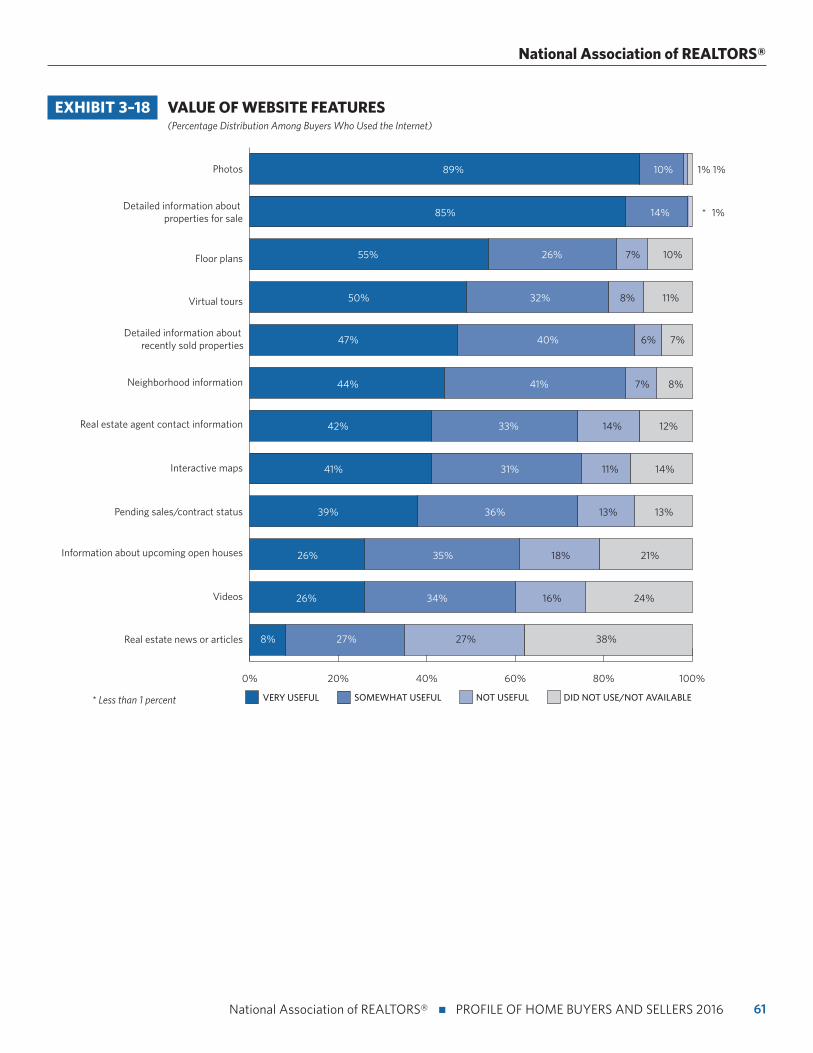
61 National Association of REALTORS® n PROFILE OF HOME BUYERS AND SELLERS 2016
National Association of REALTORS®
EXHIBIT 3–18 VALUE OF WEBSITE FEATURES (Percentage Distribution Among Buyers Who Used the Internet)
0% 20% 40% 60% 80% 100%
Real estate news or articles
Videos
Information about upcoming open houses
Pending sales/contract status
Interactive maps
Real estate agent contact information
Neighborhood information
Detailed information about properties for sale
Virtual tours
Floor plans
Detailed information about recently sold properties
Photos
NOT USEFULSOMEWHAT USEFULVERY USEFUL
8% 27% 38%
26% 34%
21%26% 35% 18%
13%36% 13%39%
14%
11%41% 31% 14%
42% 33% 12%
44% 41% 7%
47% 40% 7%
10%
6%
55% 26% 7%
85% 14%
89% 10% 1%
DID NOT USE/NOT AVAILABLE
24%16%
27%
8%
1%
50% 32% 11%8%
* 1%
* Less than 1 percent
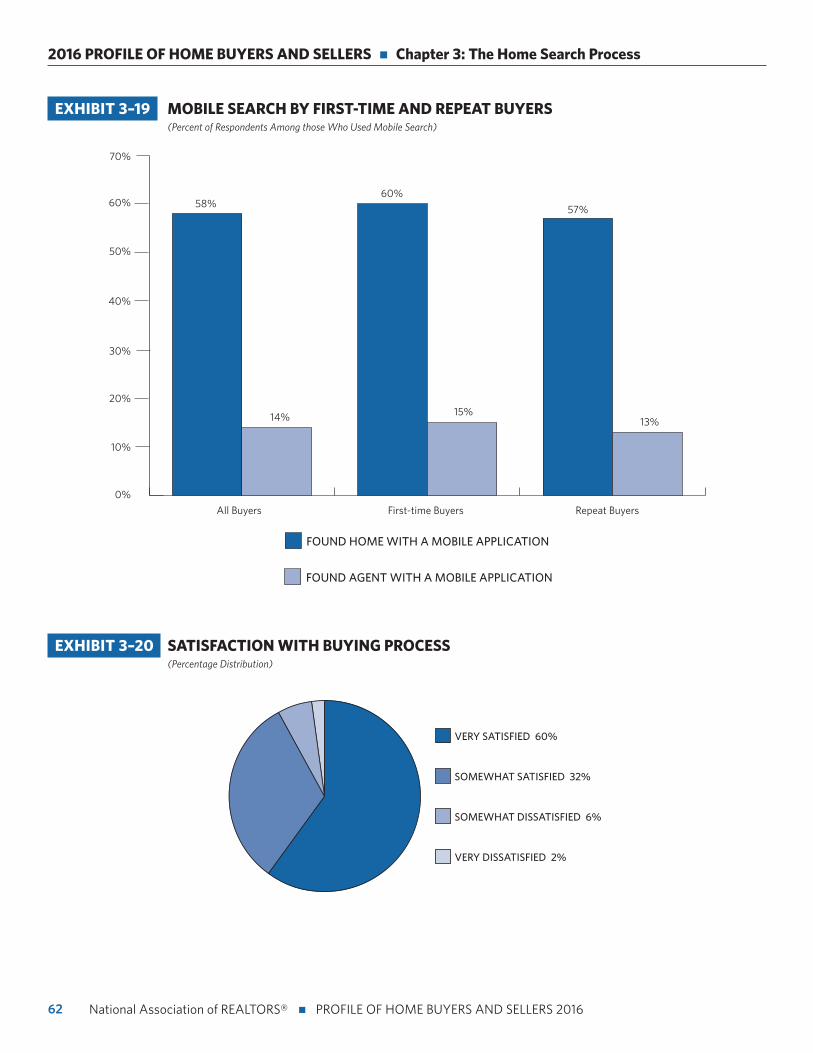
62
2016 PROFILE OF HOME BUYERS AND SELLERS n Chapter 3: The Home Search Process
National Association of REALTORS® n PROFILE OF HOME BUYERS AND SELLERS 2016
EXHIBIT 3–20 SATISFACTION WITH BUYING PROCESS (Percentage Distribution)
VERY DISSATISFIED 2%
SOMEWHAT DISSATISFIED 6%
SOMEWHAT SATISFIED 32%
VERY SATISFIED 60%
0%
10%
20%
30%
40%
50%
60%
70%
58%60%
57%
All Buyers First-time Buyers Repeat Buyers
14% 15%
FOUND AGENT WITH A MOBILE APPLICATION
FOUND HOME WITH A MOBILE APPLICATION
13%
EXHIBIT 3–19 MOBILE SEARCH BY FIRST-TIME AND REPEAT BUYERS (Percent of Respondents Among those Who Used Mobile Search)
63 National Association of REALTORS® n PROFILE OF HOME BUYERS AND SELLERS 2016
CHAPTER 4:
Home Buying and Real Estate Professionals
This year the Profile of Home Buyers and Sellers celebrates its 35th anniversary and has collected data on the buyer’s method of purchase since 1981. Purchasing a home through a real estate agent is a consistent trend that con-
tinued again this year. Up slightly from 87 percent in 2015, 88 percent of buyers in 2016 purchased their home through a real estate agent or broker, six percent directly from a builder or builder’s agent, and five percent from the previous owner. Looking back to 1981, 82 percent purchased through an agent, eight percent direct-ly through a builder or builder’s agent, and 10 percent from the previous owner. In 1987 and 2000, purchases directly from the owner were at a peak of 15 percent and seven in 10 buyers purchased through an agent. Since then, the share of those work-ing with an agent to purchase a home has steadily grown, peaking at 89 percent in 2011 and 2012 and hovering around 88 percent since 2013.
By household composition, unmarried couples tended to purchase their homes through real estate agents and brokers at a higher rate than any other household composition. Four in 10 buyers of new homes purchased their home directly from a builder or builder’s agent, but 60 percent used a real estate agent to purchase a newly built home. The majority of buyers who purchased a previously owned home bought their home through a real estate agent or broker; buying directly from the previous owner was the next most common purchase method.
Over half of recent buyers signed a disclosure agreements either at first meeting, when the contract was written, or at some other time. The most common arrange-ment was a written arrangement, followed by an oral arrangement. The most com-mon compensation structure for real estate agents was payment through the seller, which was the case for over half of recent home buyers.
With tight housing inventory in many areas of the countries, what buyers wanted most from their agent is to help them find the right home to purchase. Buyers were also looking for help to negotiate the terms of sale and with price negotiations. The most common way that buyers found their real estate agent was through a referral by a friend, neighbor, or relative. Buyers typically interviewed only one real estate agent before working with them, and the most important factor was that the agent is honest and trustworthy. Another important factor was the agent’s experience. Recent buyers were overall very satisfied with their real estate agent’s skills and qualities, and definitely would use their agent again or recommend them to others.
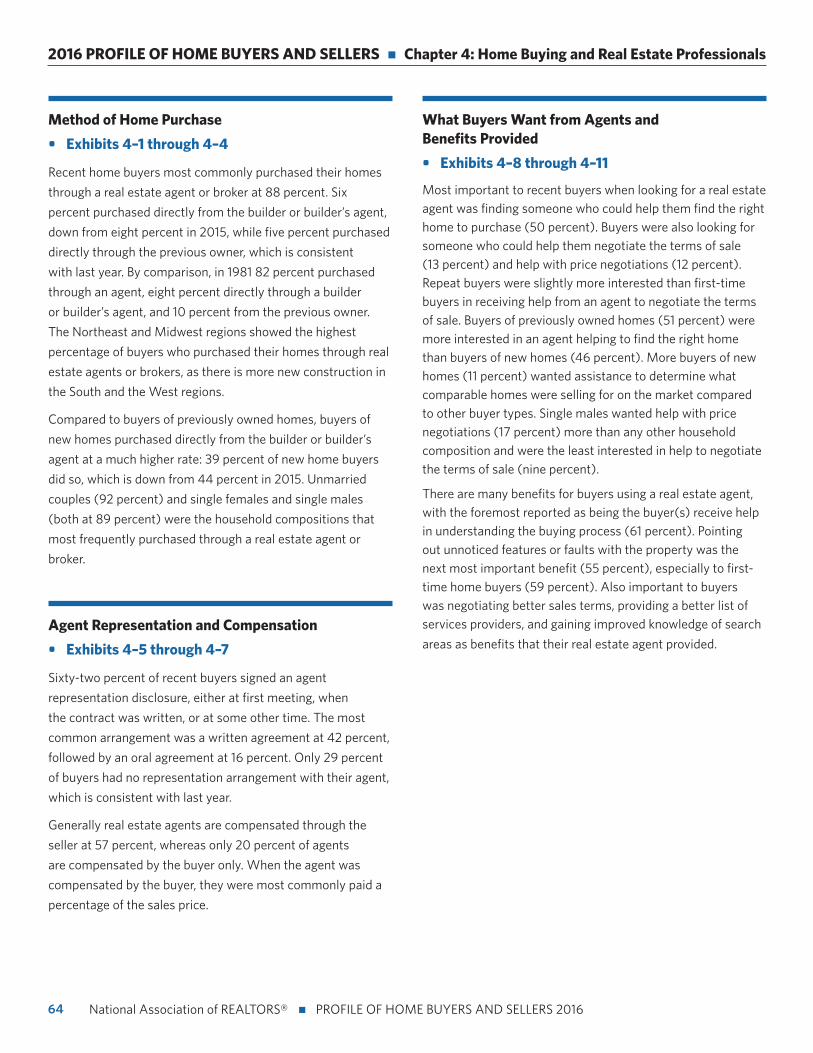
64
2016 PROFILE OF HOME BUYERS AND SELLERS n Chapter 4: Home Buying and Real Estate Professionals
National Association of REALTORS® n PROFILE OF HOME BUYERS AND SELLERS 2016
Method of Home Purchase
• Exhibits 4–1 through 4–4
Recent home buyers most commonly purchased their homes
through a real estate agent or broker at 88 percent. Six
percent purchased directly from the builder or builder’s agent,
down from eight percent in 2015, while five percent purchased
directly through the previous owner, which is consistent
with last year. By comparison, in 1981 82 percent purchased
through an agent, eight percent directly through a builder
or builder’s agent, and 10 percent from the previous owner.
The Northeast and Midwest regions showed the highest
percentage of buyers who purchased their homes through real
estate agents or brokers, as there is more new construction in
the South and the West regions.
Compared to buyers of previously owned homes, buyers of
new homes purchased directly from the builder or builder’s
agent at a much higher rate: 39 percent of new home buyers
did so, which is down from 44 percent in 2015. Unmarried
couples (92 percent) and single females and single males
(both at 89 percent) were the household compositions that
most frequently purchased through a real estate agent or
broker.
Agent Representation and Compensation
• Exhibits 4–5 through 4–7
Sixty-two percent of recent buyers signed an agent
representation disclosure, either at first meeting, when
the contract was written, or at some other time. The most
common arrangement was a written agreement at 42 percent,
followed by an oral agreement at 16 percent. Only 29 percent
of buyers had no representation arrangement with their agent,
which is consistent with last year.
Generally real estate agents are compensated through the
seller at 57 percent, whereas only 20 percent of agents
are compensated by the buyer only. When the agent was
compensated by the buyer, they were most commonly paid a
percentage of the sales price.
What Buyers Want from Agents and Benefits Provided
• Exhibits 4–8 through 4–11
Most important to recent buyers when looking for a real estate agent was finding someone who could help them find the right home to purchase (50 percent). Buyers were also looking for someone who could help them negotiate the terms of sale (13 percent) and help with price negotiations (12 percent). Repeat buyers were slightly more interested than first-time buyers in receiving help from an agent to negotiate the terms of sale. Buyers of previously owned homes (51 percent) were more interested in an agent helping to find the right home than buyers of new homes (46 percent). More buyers of new homes (11 percent) wanted assistance to determine what comparable homes were selling for on the market compared to other buyer types. Single males wanted help with price negotiations (17 percent) more than any other household composition and were the least interested in help to negotiate the terms of sale (nine percent).
There are many benefits for buyers using a real estate agent, with the foremost reported as being the buyer(s) receive help in understanding the buying process (61 percent). Pointing out unnoticed features or faults with the property was the next most important benefit (55 percent), especially to first-time home buyers (59 percent). Also important to buyers was negotiating better sales terms, providing a better list of services providers, and gaining improved knowledge of search
areas as benefits that their real estate agent provided.
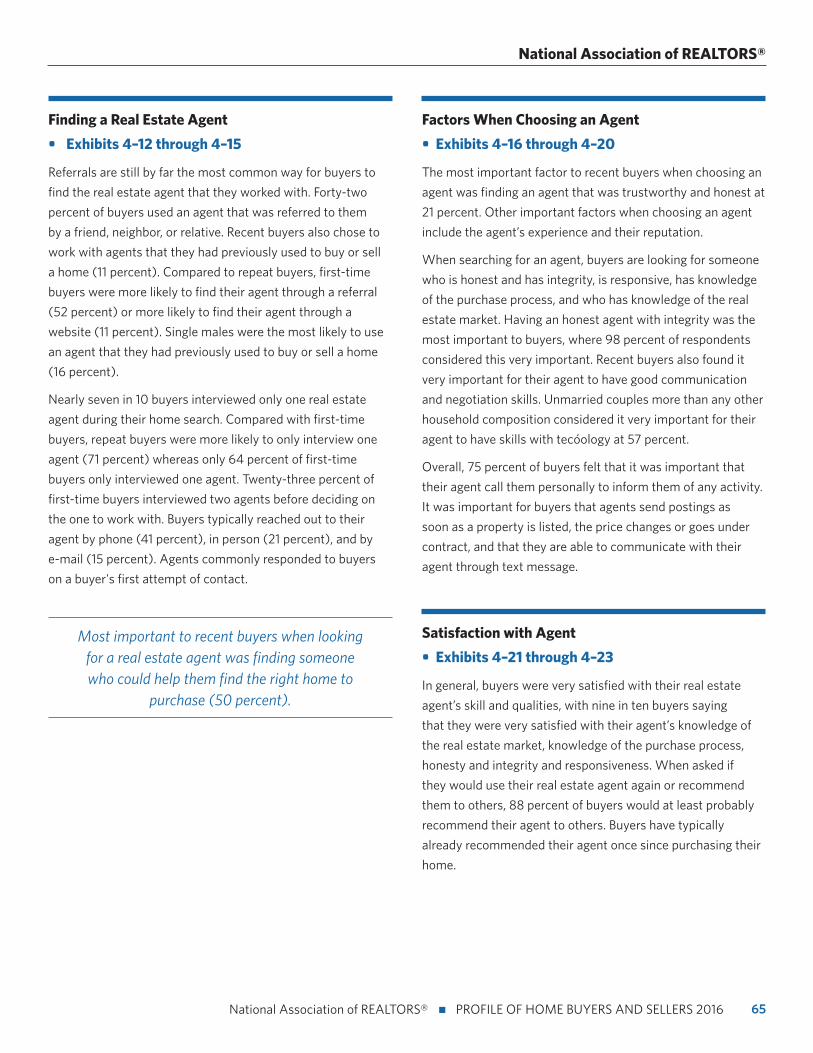
65 National Association of REALTORS® n PROFILE OF HOME BUYERS AND SELLERS 2016
National Association of REALTORS®
Finding a Real Estate Agent
• Exhibits 4–12 through 4–15
Referrals are still by far the most common way for buyers to
find the real estate agent that they worked with. Forty-two
percent of buyers used an agent that was referred to them
by a friend, neighbor, or relative. Recent buyers also chose to
work with agents that they had previously used to buy or sell
a home (11 percent). Compared to repeat buyers, first-time
buyers were more likely to find their agent through a referral
(52 percent) or more likely to find their agent through a
website (11 percent). Single males were the most likely to use
an agent that they had previously used to buy or sell a home
(16 percent).
Nearly seven in 10 buyers interviewed only one real estate
agent during their home search. Compared with first-time
buyers, repeat buyers were more likely to only interview one
agent (71 percent) whereas only 64 percent of first-time
buyers only interviewed one agent. Twenty-three percent of
first-time buyers interviewed two agents before deciding on
the one to work with. Buyers typically reached out to their
agent by phone (41 percent), in person (21 percent), and by
e-mail (15 percent). Agents commonly responded to buyers
on a buyer's first attempt of contact.
Factors When Choosing an Agent
• Exhibits 4–16 through 4–20
The most important factor to recent buyers when choosing an
agent was finding an agent that was trustworthy and honest at
21 percent. Other important factors when choosing an agent
include the agent’s experience and their reputation.
When searching for an agent, buyers are looking for someone
who is honest and has integrity, is responsive, has knowledge
of the purchase process, and who has knowledge of the real
estate market. Having an honest agent with integrity was the
most important to buyers, where 98 percent of respondents
considered this very important. Recent buyers also found it
very important for their agent to have good communication
and negotiation skills. Unmarried couples more than any other
household composition considered it very important for their
agent to have skills with technology at 57 percent.
Overall, 75 percent of buyers felt that it was important that
their agent call them personally to inform them of any activity.
It was important for buyers that agents send postings as
soon as a property is listed, the price changes or goes under
contract, and that they are able to communicate with their
agent through text message.
Satisfaction with Agent
• Exhibits 4–21 through 4–23
In general, buyers were very satisfied with their real estate
agent’s skill and qualities, with nine in ten buyers saying
that they were very satisfied with their agent’s knowledge of
the real estate market, knowledge of the purchase process,
honesty and integrity and responsiveness. When asked if
they would use their real estate agent again or recommend
them to others, 88 percent of buyers would at least probably
recommend their agent to others. Buyers have typically
already recommended their agent once since purchasing their
home.
Most important to recent buyers when looking for a real estate agent was finding someone who could help them find the right home to
purchase (50 percent).
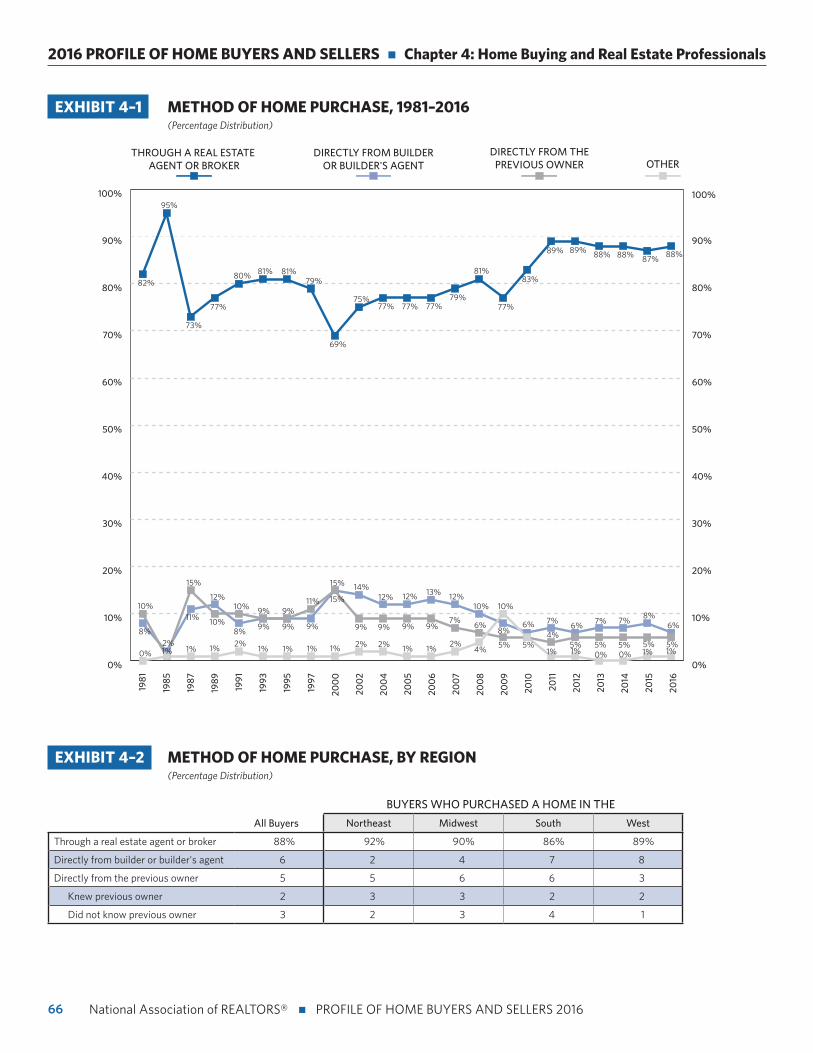
66
2016 PROFILE OF HOME BUYERS AND SELLERS n Chapter 4: Home Buying and Real Estate Professionals
National Association of REALTORS® n PROFILE OF HOME BUYERS AND SELLERS 2016
EXHIBIT 4–1 METHOD OF HOME PURCHASE, 1981–2016
(Percentage Distribution)
EXHIBIT 4–2 METHOD OF HOME PURCHASE, BY REGION (Percentage Distribution)
BUYERS WHO PURCHASED A HOME IN THE
All Buyers Northeast Midwest South West
Through a real estate agent or broker 88% 92% 90% 86% 89%
Directly from builder or builder's agent 6 2 4 7 8
Directly from the previous owner 5 5 6 6 3
Knew previous owner 2 3 3 2 2
Did not know previous owner 3 2 3 4 1
0%
10%
20%
30%
40%
50%
60%
70%
80%
90%
100%
0%
10%
20%
30%
40%
50%
60%
70%
80%
90%
100%
OTHERDIRECTLY FROM THE
PREVIOUS OWNERDIRECTLY FROM BUILDER
OR BUILDER'S AGENTTHROUGH A REAL ESTATE
AGENT OR BROKER
1981
1985
1987
1989
1991
1993
1995
1997
200
0
200
2
200
4
200
5
200
6
200
7
200
8
200
9
2010
2011
2012
2013
2014
2015
2016
73%
81%80% 81%
77%
79%
79%
83%
77%
89% 89%87%
88%88%88%
95%
82%
81%
75%
69%
77%77%77%
0% 1% 1% 1%2%
1%2%
10%
1% 0% 0% 1% 1%1%5%
6%8%
5%5%
7%
5%
7%
5%
6%4%
7%6%
5%
10%
8%
5%
10%
6%
4%
12%
7%
2%
13%
9%
1%
12%
9%
1%
12%
9%
2%
14%
9%
2%
15%
11%
9%
1%
9%
9%
1%
15%9%
9%
1%
10%
8%
12%
10%11%
15%
8%
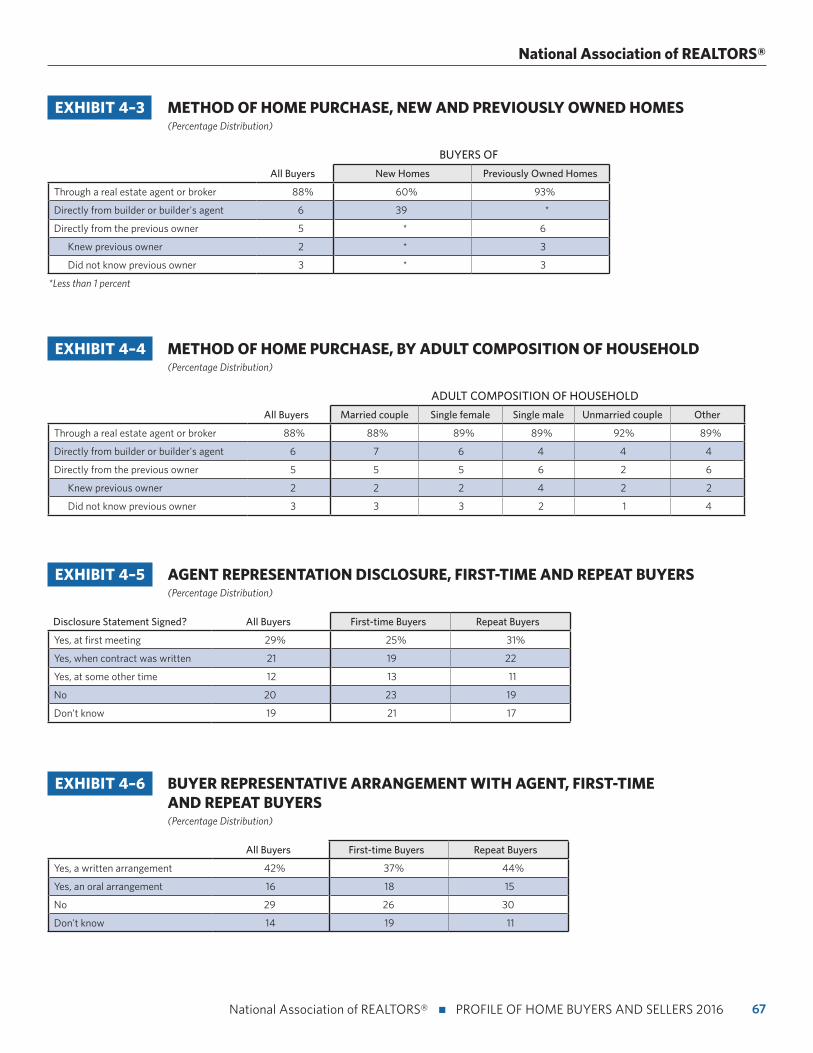
67 National Association of REALTORS® n PROFILE OF HOME BUYERS AND SELLERS 2016
National Association of REALTORS®
EXHIBIT 4–3 METHOD OF HOME PURCHASE, NEW AND PREVIOUSLY OWNED HOMES (Percentage Distribution)
BUYERS OF
All Buyers New Homes Previously Owned Homes
Through a real estate agent or broker 88% 60% 93%
Directly from builder or builder's agent 6 39 *
Directly from the previous owner 5 * 6
Knew previous owner 2 * 3
Did not know previous owner 3 * 3
*Less than 1 percent
EXHIBIT 4–4 METHOD OF HOME PURCHASE, BY ADULT COMPOSITION OF HOUSEHOLD (Percentage Distribution)
ADULT COMPOSITION OF HOUSEHOLD
All Buyers Married couple Single female Single male Unmarried couple Other
Through a real estate agent or broker 88% 88% 89% 89% 92% 89%
Directly from builder or builder's agent 6 7 6 4 4 4
Directly from the previous owner 5 5 5 6 2 6
Knew previous owner 2 2 2 4 2 2
Did not know previous owner 3 3 3 2 1 4
EXHIBIT 4–5 AGENT REPRESENTATION DISCLOSURE, FIRST-TIME AND REPEAT BUYERS (Percentage Distribution)
Disclosure Statement Signed? All Buyers First-time Buyers Repeat Buyers
Yes, at first meeting 29% 25% 31%
Yes, when contract was written 21 19 22
Yes, at some other time 12 13 11
No 20 23 19
Don’t know 19 21 17
EXHIBIT 4–6 BUYER REPRESENTATIVE ARRANGEMENT WITH AGENT, FIRST-TIME AND REPEAT BUYERS (Percentage Distribution)
All Buyers First-time Buyers Repeat Buyers
Yes, a written arrangement 42% 37% 44%
Yes, an oral arrangement 16 18 15
No 29 26 30
Don't know 14 19 11
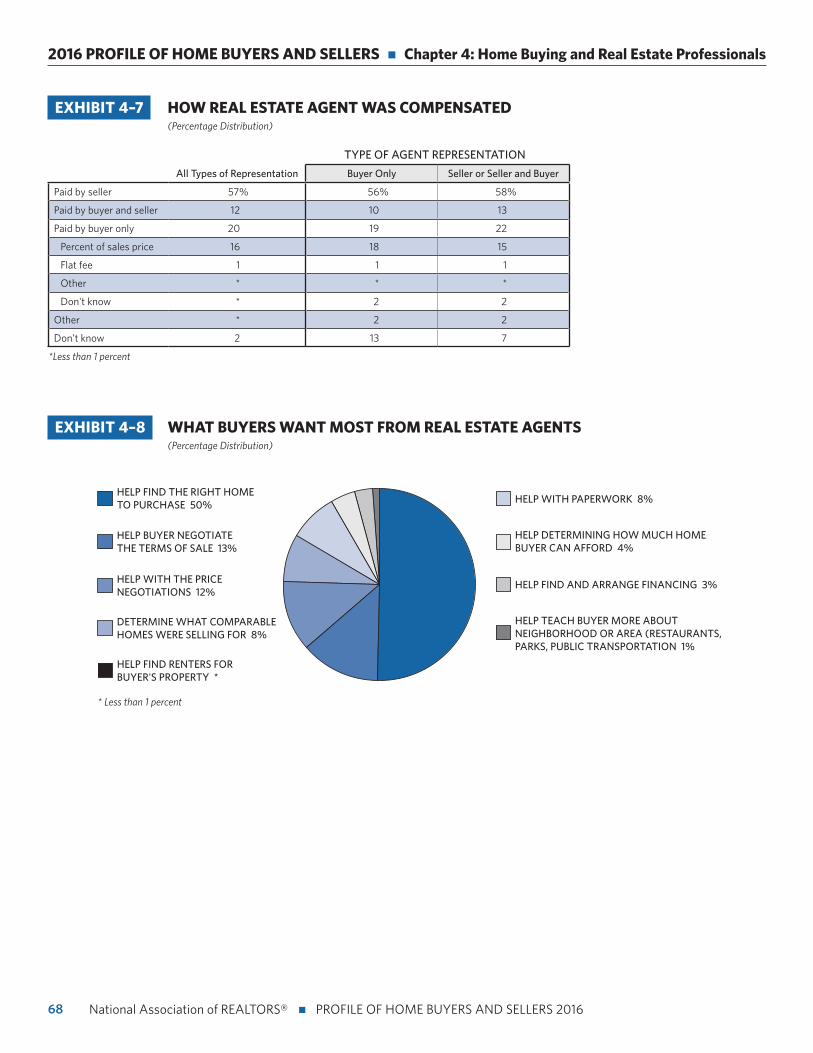
68
2016 PROFILE OF HOME BUYERS AND SELLERS n Chapter 4: Home Buying and Real Estate Professionals
National Association of REALTORS® n PROFILE OF HOME BUYERS AND SELLERS 2016
EXHIBIT 4–8 WHAT BUYERS WANT MOST FROM REAL ESTATE AGENTS (Percentage Distribution)
HELP WITH PAPERWORK 8%
DETERMINE WHAT COMPARABLE HOMES WERE SELLING FOR 8%
HELP WITH THE PRICE NEGOTIATIONS 12%
HELP FIND THE RIGHT HOME TO PURCHASE 50%
HELP BUYER NEGOTIATE THE TERMS OF SALE 13%
HELP TEACH BUYER MORE ABOUT NEIGHBORHOOD OR AREA (RESTAURANTS, PARKS, PUBLIC TRANSPORTATION 1%
HELP DETERMINING HOW MUCH HOME BUYER CAN AFFORD 4%
HELP FIND AND ARRANGE FINANCING 3%
HELP FIND RENTERS FOR BUYER'S PROPERTY *
EXHIBIT 4–7 HOW REAL ESTATE AGENT WAS COMPENSATED (Percentage Distribution)
TYPE OF AGENT REPRESENTATION
All Types of Representation Buyer Only Seller or Seller and Buyer
Paid by seller 57% 56% 58%
Paid by buyer and seller 12 10 13
Paid by buyer only 20 19 22
Percent of sales price 16 18 15
Flat fee 1 1 1
Other * * *
Don't know * 2 2
Other * 2 2
Don’t know 2 13 7
*Less than 1 percent
* Less than 1 percent
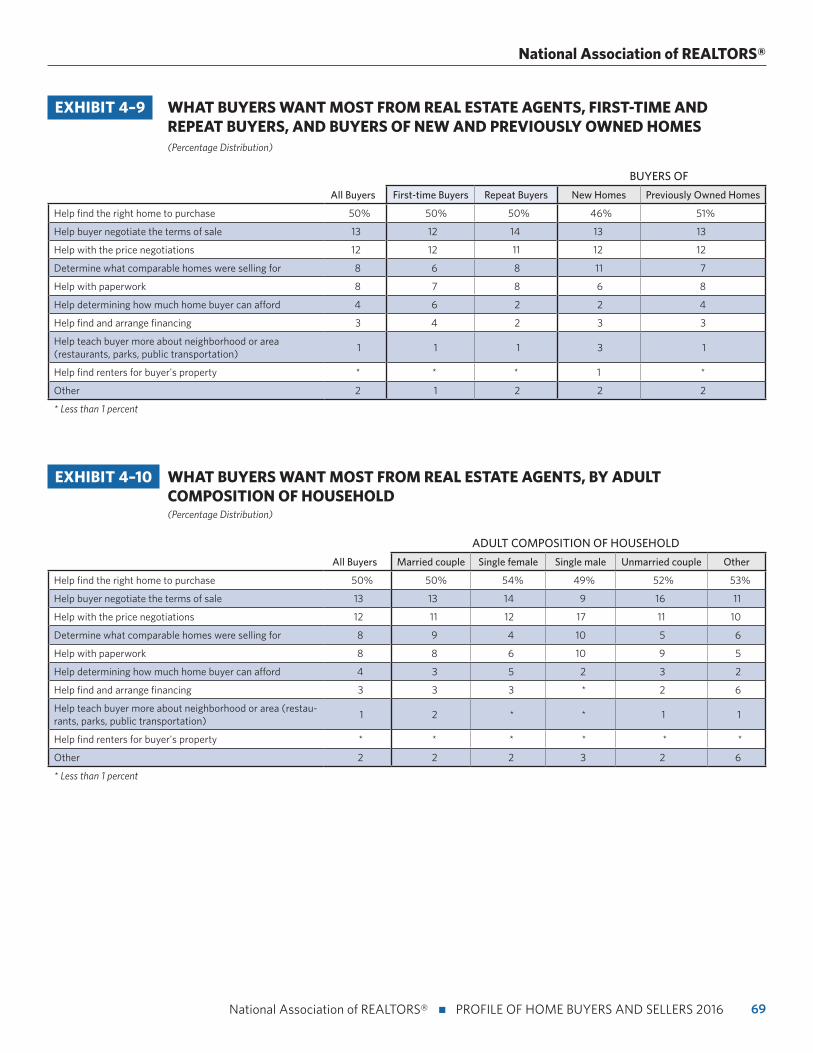
69 National Association of REALTORS® n PROFILE OF HOME BUYERS AND SELLERS 2016
National Association of REALTORS®
EXHIBIT 4–9 WHAT BUYERS WANT MOST FROM REAL ESTATE AGENTS, FIRST-TIME AND REPEAT BUYERS, AND BUYERS OF NEW AND PREVIOUSLY OWNED HOMES (Percentage Distribution)
BUYERS OF
All Buyers First-time Buyers Repeat Buyers New Homes Previously Owned Homes
Help find the right home to purchase 50% 50% 50% 46% 51%
Help buyer negotiate the terms of sale 13 12 14 13 13
Help with the price negotiations 12 12 11 12 12
Determine what comparable homes were selling for 8 6 8 11 7
Help with paperwork 8 7 8 6 8
Help determining how much home buyer can afford 4 6 2 2 4
Help find and arrange financing 3 4 2 3 3
Help teach buyer more about neighborhood or area (restaurants, parks, public transportation)
1 1 1 3 1
Help find renters for buyer's property * * * 1 *
Other 2 1 2 2 2
* Less than 1 percent
EXHIBIT 4–10 WHAT BUYERS WANT MOST FROM REAL ESTATE AGENTS, BY ADULT COMPOSITION OF HOUSEHOLD (Percentage Distribution)
ADULT COMPOSITION OF HOUSEHOLD
All Buyers Married couple Single female Single male Unmarried couple Other
Help find the right home to purchase 50% 50% 54% 49% 52% 53%
Help buyer negotiate the terms of sale 13 13 14 9 16 11
Help with the price negotiations 12 11 12 17 11 10
Determine what comparable homes were selling for 8 9 4 10 5 6
Help with paperwork 8 8 6 10 9 5
Help determining how much home buyer can afford 4 3 5 2 3 2
Help find and arrange financing 3 3 3 * 2 6
Help teach buyer more about neighborhood or area (restau-rants, parks, public transportation)
1 2 * * 1 1
Help find renters for buyer's property * * * * * *
Other 2 2 2 3 2 6
* Less than 1 percent
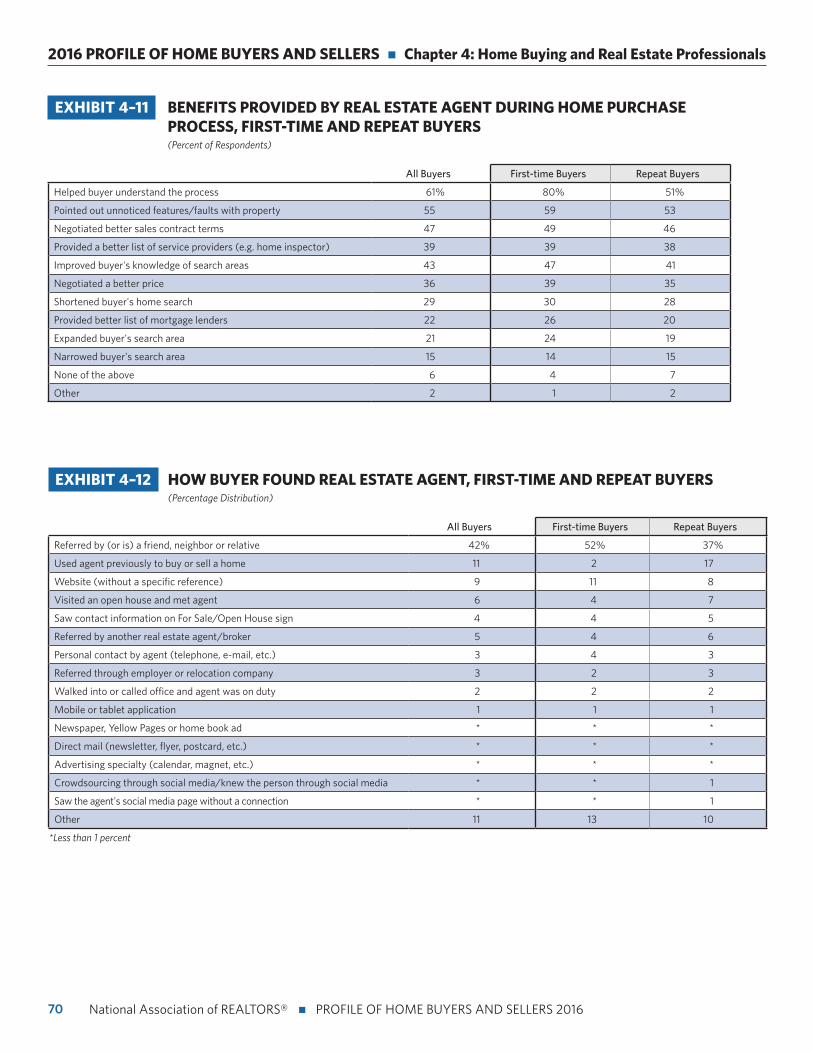
70
2016 PROFILE OF HOME BUYERS AND SELLERS n Chapter 4: Home Buying and Real Estate Professionals
National Association of REALTORS® n PROFILE OF HOME BUYERS AND SELLERS 2016
EXHIBIT 4–11 BENEFITS PROVIDED BY REAL ESTATE AGENT DURING HOME PURCHASE PROCESS, FIRST-TIME AND REPEAT BUYERS (Percent of Respondents)
All Buyers First-time Buyers Repeat Buyers
Helped buyer understand the process 61% 80% 51%
Pointed out unnoticed features/faults with property 55 59 53
Negotiated better sales contract terms 47 49 46
Provided a better list of service providers (e.g. home inspector) 39 39 38
Improved buyer's knowledge of search areas 43 47 41
Negotiated a better price 36 39 35
Shortened buyer's home search 29 30 28
Provided better list of mortgage lenders 22 26 20
Expanded buyer's search area 21 24 19
Narrowed buyer's search area 15 14 15
None of the above 6 4 7
Other 2 1 2
EXHIBIT 4–12 HOW BUYER FOUND REAL ESTATE AGENT, FIRST-TIME AND REPEAT BUYERS (Percentage Distribution)
All Buyers First-time Buyers Repeat Buyers
Referred by (or is) a friend, neighbor or relative 42% 52% 37%
Used agent previously to buy or sell a home 11 2 17
Website (without a specific reference) 9 11 8
Visited an open house and met agent 6 4 7
Saw contact information on For Sale/Open House sign 4 4 5
Referred by another real estate agent/broker 5 4 6
Personal contact by agent (telephone, e-mail, etc.) 3 4 3
Referred through employer or relocation company 3 2 3
Walked into or called office and agent was on duty 2 2 2
Mobile or tablet application 1 1 1
Newspaper, Yellow Pages or home book ad * * *
Direct mail (newsletter, flyer, postcard, etc.) * * *
Advertising specialty (calendar, magnet, etc.) * * *
Crowdsourcing through social media/knew the person through social media * * 1
Saw the agent's social media page without a connection * * 1
Other 11 13 10
*Less than 1 percent
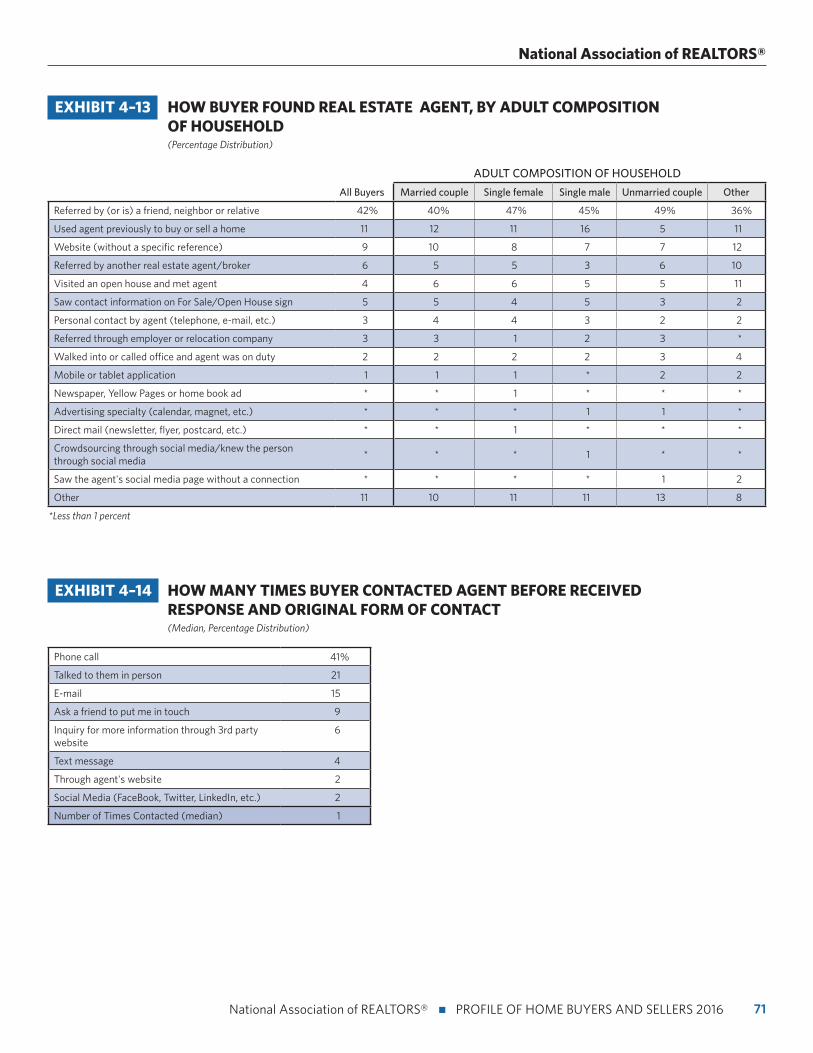
71 National Association of REALTORS® n PROFILE OF HOME BUYERS AND SELLERS 2016
National Association of REALTORS®
EXHIBIT 4–13 HOW BUYER FOUND REAL ESTATE AGENT, BY ADULT COMPOSITION OF HOUSEHOLD (Percentage Distribution)
ADULT COMPOSITION OF HOUSEHOLD
All Buyers Married couple Single female Single male Unmarried couple Other
Referred by (or is) a friend, neighbor or relative 42% 40% 47% 45% 49% 36%
Used agent previously to buy or sell a home 11 12 11 16 5 11
Website (without a specific reference) 9 10 8 7 7 12
Referred by another real estate agent/broker 6 5 5 3 6 10
Visited an open house and met agent 4 6 6 5 5 11
Saw contact information on For Sale/Open House sign 5 5 4 5 3 2
Personal contact by agent (telephone, e-mail, etc.) 3 4 4 3 2 2
Referred through employer or relocation company 3 3 1 2 3 *
Walked into or called office and agent was on duty 2 2 2 2 3 4
Mobile or tablet application 1 1 1 * 2 2
Newspaper, Yellow Pages or home book ad * * 1 * * *
Advertising specialty (calendar, magnet, etc.) * * * 1 1 *
Direct mail (newsletter, flyer, postcard, etc.) * * 1 * * *
Crowdsourcing through social media/knew the person through social media
* * * 1 * *
Saw the agent's social media page without a connection * * * * 1 2
Other 11 10 11 11 13 8
*Less than 1 percent
EXHIBIT 4–14 HOW MANY TIMES BUYER CONTACTED AGENT BEFORE RECEIVED RESPONSE AND ORIGINAL FORM OF CONTACT (Median, Percentage Distribution)
Phone call 41%
Talked to them in person 21
E-mail 15
Ask a friend to put me in touch 9
Inquiry for more information through 3rd party website
6
Text message 4
Through agent's website 2
Social Media (FaceBook, Twitter, LinkedIn, etc.) 2
Number of Times Contacted (median) 1
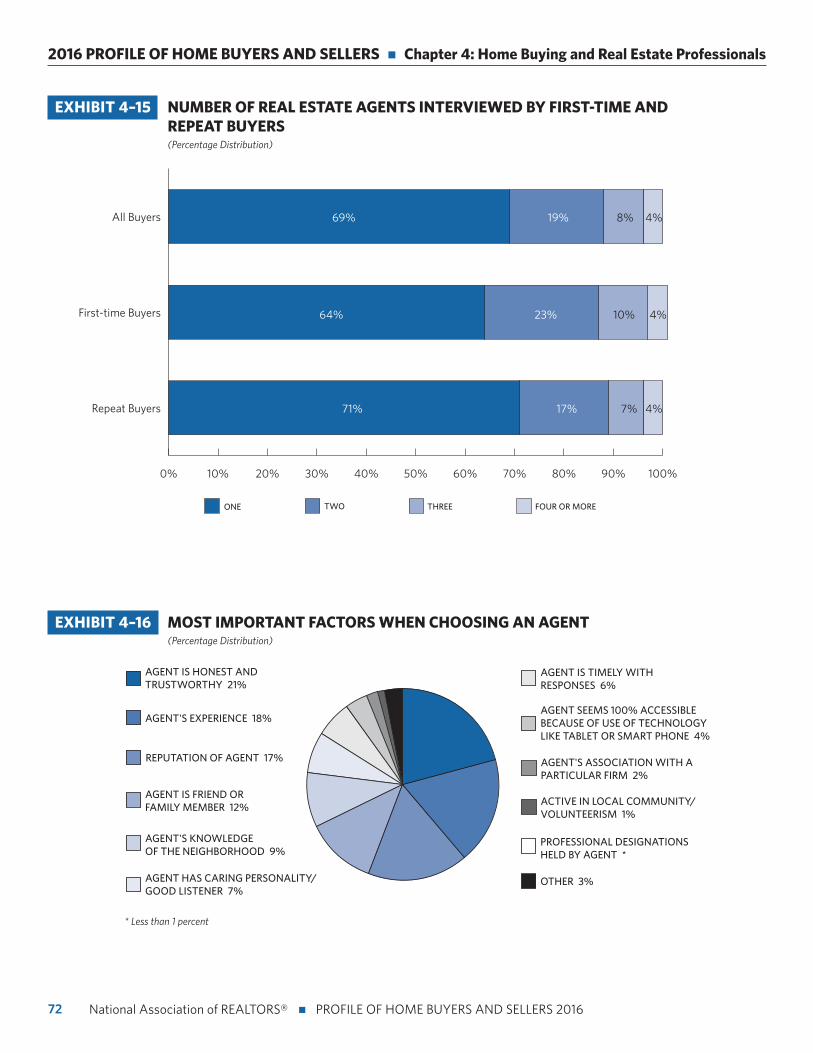
72
2016 PROFILE OF HOME BUYERS AND SELLERS n Chapter 4: Home Buying and Real Estate Professionals
National Association of REALTORS® n PROFILE OF HOME BUYERS AND SELLERS 2016
EXHIBIT 4–15 NUMBER OF REAL ESTATE AGENTS INTERVIEWED BY FIRST-TIME AND REPEAT BUYERS (Percentage Distribution)
EXHIBIT 4–16 MOST IMPORTANT FACTORS WHEN CHOOSING AN AGENT (Percentage Distribution)
AGENT'S KNOWLEDGE OF THE NEIGHBORHOOD 9%
OTHER 3%
AGENT IS FRIEND OR FAMILY MEMBER 12%
REPUTATION OF AGENT 17%
AGENT IS HONEST AND TRUSTWORTHY 21%
AGENT'S EXPERIENCE 18%
PROFESSIONAL DESIGNATIONS HELD BY AGENT *
AGENT SEEMS 100% ACCESSIBLE BECAUSE OF USE OF TECHNOLOGY LIKE TABLET OR SMART PHONE 4%
AGENT HAS CARING PERSONALITY/GOOD LISTENER 7%
AGENT IS TIMELY WITH RESPONSES 6%
AGENT'S ASSOCIATION WITH A PARTICULAR FIRM 2%
ACTIVE IN LOCAL COMMUNITY/VOLUNTEERISM 1%
0% 10% 20% 30% 40% 50% 60% 70% 80% 90% 100%
Repeat Buyers
First-time Buyers
All Buyers 8%69% 19% 4%
64% 23% 10% 4%
71% 7%17% 4%
THREETWOONE FOUR OR MORE
* Less than 1 percent
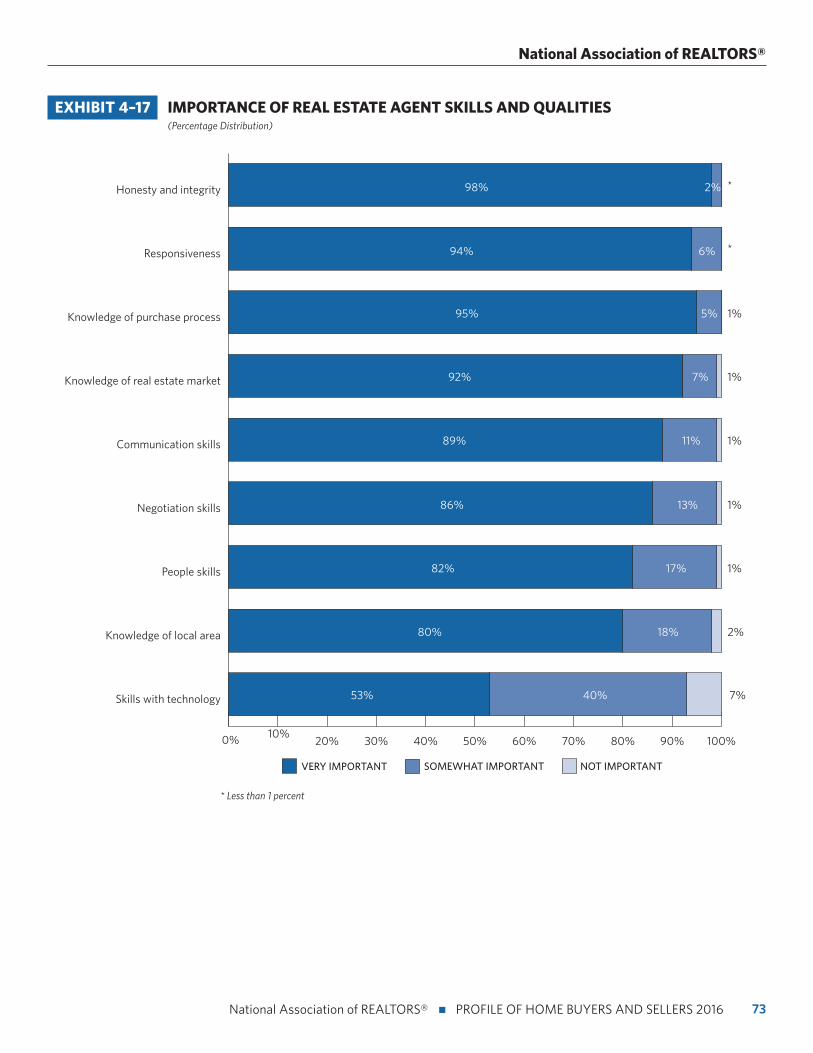
73 National Association of REALTORS® n PROFILE OF HOME BUYERS AND SELLERS 2016
National Association of REALTORS®
EXHIBIT 4–17 IMPORTANCE OF REAL ESTATE AGENT SKILLS AND QUALITIES (Percentage Distribution)
0% 10%20% 30% 40% 50% 60% 70% 80% 90% 100%
Skills with technology
Knowledge of local area
People skills
Negotiation skills
Communication skills
Knowledge of real estate market
Knowledge of purchase process
Responsiveness
Honesty and integrity
NOT IMPORTANTSOMEWHAT IMPORTANTVERY IMPORTANT
53% 40% 7%
80% 18% 2%
82% 17% 1%
13%86% 1%
89% 11% 1%
92% 7% 1%
95% 5% 1%
94% 6%
98% 2%
*
*
* Less than 1 percent
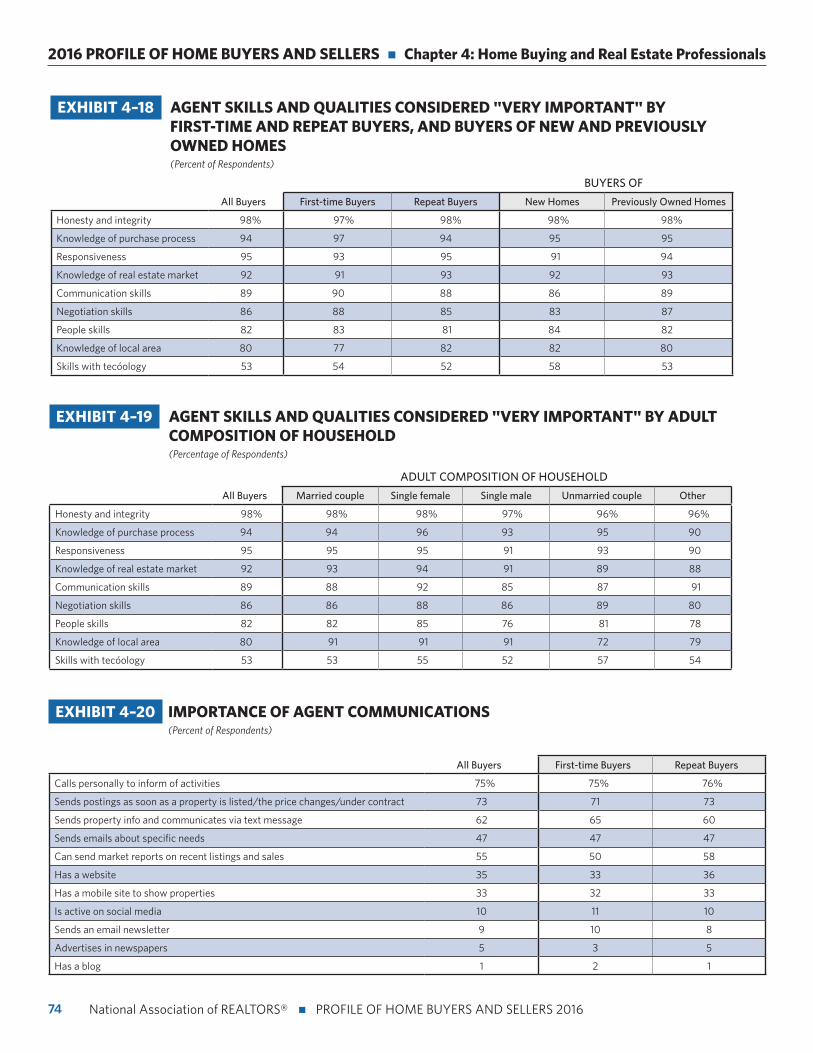
74
2016 PROFILE OF HOME BUYERS AND SELLERS n Chapter 4: Home Buying and Real Estate Professionals
National Association of REALTORS® n PROFILE OF HOME BUYERS AND SELLERS 2016
EXHIBIT 4–18 AGENT SKILLS AND QUALITIES CONSIDERED "VERY IMPORTANT" BY FIRST-TIME AND REPEAT BUYERS, AND BUYERS OF NEW AND PREVIOUSLY OWNED HOMES (Percent of Respondents)
BUYERS OF
All Buyers First-time Buyers Repeat Buyers New Homes Previously Owned Homes
Honesty and integrity 98% 97% 98% 98% 98%
Knowledge of purchase process 94 97 94 95 95
Responsiveness 95 93 95 91 94
Knowledge of real estate market 92 91 93 92 93
Communication skills 89 90 88 86 89
Negotiation skills 86 88 85 83 87
People skills 82 83 81 84 82
Knowledge of local area 80 77 82 82 80
Skills with technology 53 54 52 58 53
EXHIBIT 4–19 AGENT SKILLS AND QUALITIES CONSIDERED "VERY IMPORTANT" BY ADULT COMPOSITION OF HOUSEHOLD (Percentage of Respondents)
ADULT COMPOSITION OF HOUSEHOLD
All Buyers Married couple Single female Single male Unmarried couple Other
Honesty and integrity 98% 98% 98% 97% 96% 96%
Knowledge of purchase process 94 94 96 93 95 90
Responsiveness 95 95 95 91 93 90
Knowledge of real estate market 92 93 94 91 89 88
Communication skills 89 88 92 85 87 91
Negotiation skills 86 86 88 86 89 80
People skills 82 82 85 76 81 78
Knowledge of local area 80 91 91 91 72 79
Skills with technology 53 53 55 52 57 54
EXHIBIT 4–20 IMPORTANCE OF AGENT COMMUNICATIONS (Percent of Respondents)
All Buyers First-time Buyers Repeat Buyers
Calls personally to inform of activities 75% 75% 76%
Sends postings as soon as a property is listed/the price changes/under contract 73 71 73
Sends property info and communicates via text message 62 65 60
Sends emails about specific needs 47 47 47
Can send market reports on recent listings and sales 55 50 58
Has a website 35 33 36
Has a mobile site to show properties 33 32 33
Is active on social media 10 11 10
Sends an email newsletter 9 10 8
Advertises in newspapers 5 3 5
Has a blog 1 2 1
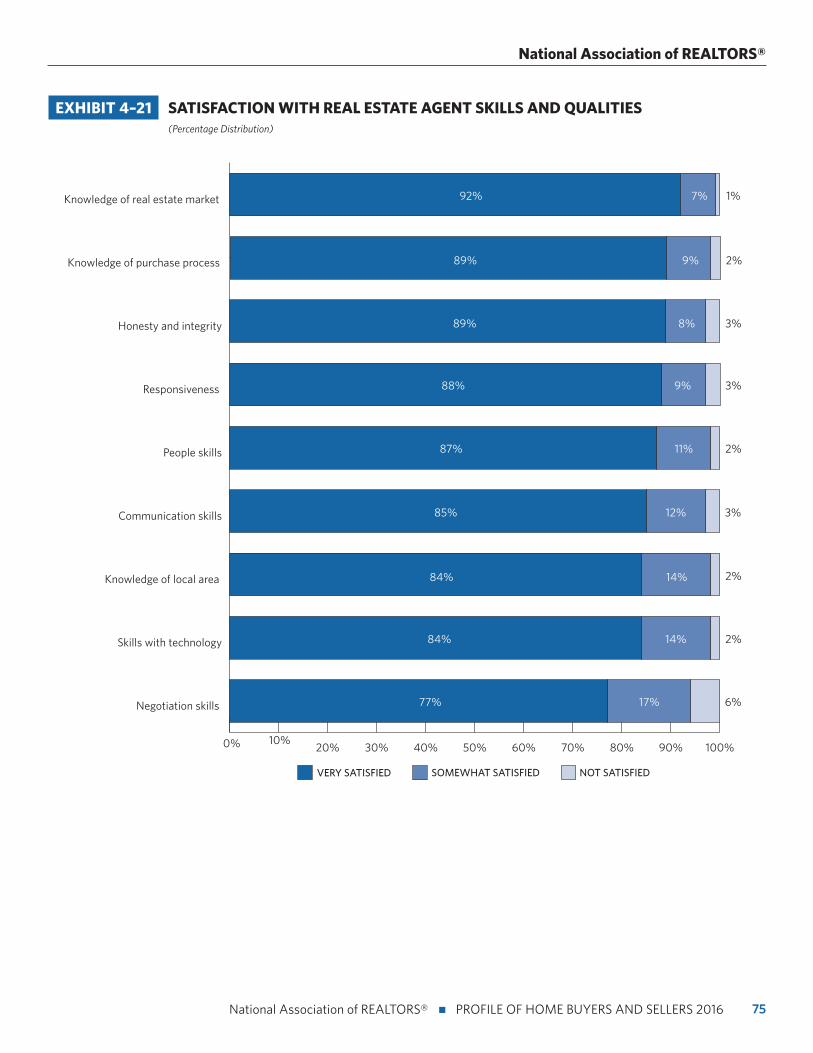
75 National Association of REALTORS® n PROFILE OF HOME BUYERS AND SELLERS 2016
National Association of REALTORS®
0% 10%20% 30% 40% 50% 60% 70% 80% 90% 100%
Negotiation skills
Skills with technology
Knowledge of purchase process
NOT SATISFIEDSOMEWHAT SATISFIEDVERY SATISFIED
77% 17% 6%
84% 14% 2%
Communication skills 85% 12% 3%
Knowledge of local area 14%84% 2%
Responsiveness 88% 9% 3%
People skills 87% 11% 2%
Knowledge of real estate market 92% 7% 1%
89% 9% 2%
Honesty and integrity 89% 8% 3%
EXHIBIT 4–21 SATISFACTION WITH REAL ESTATE AGENT SKILLS AND QUALITIES (Percentage Distribution)
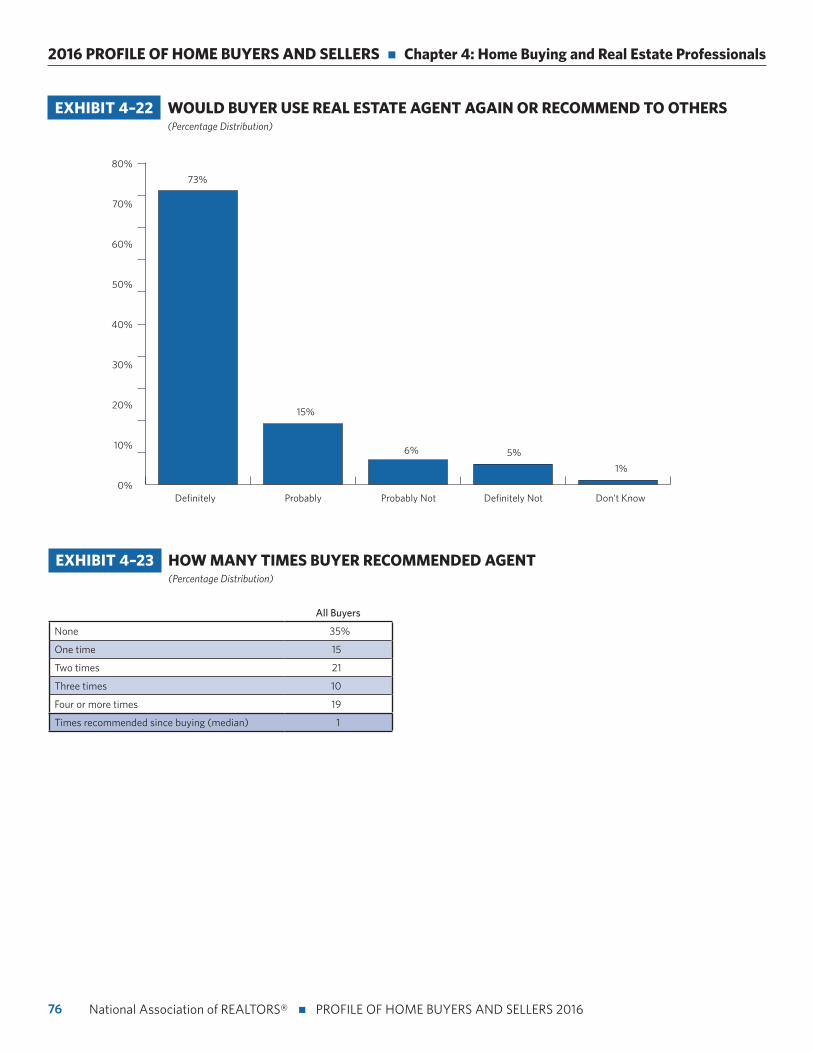
76
2016 PROFILE OF HOME BUYERS AND SELLERS n Chapter 4: Home Buying and Real Estate Professionals
National Association of REALTORS® n PROFILE OF HOME BUYERS AND SELLERS 2016
EXHIBIT 4–22 WOULD BUYER USE REAL ESTATE AGENT AGAIN OR RECOMMEND TO OTHERS (Percentage Distribution)
0%
10%
20%
30%
40%
50%
60%
70%
80%
73%
15%
6% 5%
1%
Definitely Probably Probably Not Definitely Not Don’t Know
EXHIBIT 4–23 HOW MANY TIMES BUYER RECOMMENDED AGENT (Percentage Distribution)
All Buyers
None 35%
One time 15
Two times 21
Three times 10
Four or more times 19
Times recommended since buying (median) 1
77 National Association of REALTORS® n PROFILE OF HOME BUYERS AND SELLERS 2016
CHAPTER 5:
Financing the Home Purchase
To help celebrate NAR’s 35th anniversary of the Profile of Home Buyers and Sellers report, we take a look at financing over three decades. While many share the desire to own their own home, financing the purchase has a variety
of obstacles, according to this year’s survey responses. NAR has collected data since 1989 on the median downpayment for all buyers, as well as first-time and repeat buyers. Eighty-eight percent of all buyers financed their homes last year and, consistent with previous years, younger buyers are more likely to finance their home purchase.
In 2016, the median downpayment was 10 percent for all buyers, six percent for first-time buyers, and 14 percent for repeat buyers. The median downpayment has decreased over time. To compare to this trend, in 1989 the median downpayment for all buyers was 20 percent, 10 percent for first-time buyers, and 23 percent for repeat buyers. Between 1991 and 1999, the median downpayment was closer to 10 percent for all buyers, peaking back up to 18 percent in 2001. In 2006 to 2008, the median downpayment was nine percent followed by eight percent in 2009 and 2010. For all buyers, the median downpayment has remained steady at 10 percent for the last four years in a row.
For repeat buyers, the median downpayment was near 20 percent through 2005, with a peak at its highest percent of downpayment at 25 percent in 2001. By 2006, it decreased to 16 percent downpayment and is now at 14 percent. For first-time buy-ers, the median downpayment has been 10 percent or below since 1989. The down-payment dropped to its lowest point in 2005 and 2006 at just two percent. The median downpayment among first-time buyers increased to six percent in 2014 where it has stayed for the last three years.
Savings remain a key source of the downpayment for home buyers, both for first-time and repeat buyers alike. Sixty-one percent of recent home buyers used their savings to finance their home purchase, nearly flat from 60 percent last year. Overall, this is still above the historical norm of 55 percent since 2000. For all buy-ers who saved for a downpayment, 40 percent saved in less than six months, which is down from 46 percent last year. Sixty percent of buyers did not need to make any financial sacrifices to purchase their home, up from 54 percent last year. For those who did, the most common sacrifices buyers reported making were cuts in spend-ing on luxury goods, entertainment, and clothes shopping.
While the share of home buyers (36 percent in 2016) who reported that the process of obtaining a mortgage is more difficult than expected was considerably higher in the 2009 and 2010 reports, it has steadily decreased in the last few years. Conventional financing was the most common mortgage type, followed by FHA loans again this year.
78
2016 PROFILE OF HOME BUYERS AND SELLERS n Chapter 5: Financing the Home Purchase
National Association of REALTORS® n PROFILE OF HOME BUYERS AND SELLERS 2016
Buyers Who Financed Their Home
• Exhibits 5–1 through 5–4
Eighty-eight percent of all buyers financed their homes last
year, up from 86 percent the year prior. Consistent with
previous years, younger buyers are more likely to finance their
home purchase. Ninety-eight percent of buyers aged 18 to 44
years old financed, whereas only 63 percent of buyers over the
age of 65 years financed their home.
First-time home buyers were more likely to finance their
home at 96 percent compared to repeat buyers at 84 percent.
Nearly all unmarried couples that were first-time home buyers
financed their homes compared to only 77 percent of single
female repeat buyers.
Fourteen percent of buyers, the same as the last two years,
financed 100 percent of the entire purchase price with a
mortgage. The median percent financed for first-time buyers
was 94 percent compared to 86 percent for repeat buyers,
which was consistent with last year.
In 2016, the median downpayment was 10 percent for all
buyers, six percent for first-time buyers, and 14 percent for
repeat buyers. In 1989, the median downpayment for all
buyers was 20 percent, 10 percent for first-time buyers, and
23 percent for repeat buyers.
Sources of Downpayment
• Exhibits 5–5 through 5–8
Sixty-one percent of recent home buyers used their savings
for their downpayment, nearly flat from 60 percent last
year. Overall, this is still above the historical norm collected
in the series of 55 percent since 2000. For all buyers, the
proceeds from the sale of a primary residence was the next
most commonly cited source of downpayment at 35 percent,
down from 38 percent last year. For repeat buyers, savings
surpassed proceeds from the sale of a primary residence as
the most common downpayment source at 53 percent. The
proceeds from the sale of a primary residence came in at a
close second at 52 percent, up from 47 percent in 2014 and
more than double the 25 percent in 2012, likely due to the
increase in property values allowing buyers to use equity from
their previous home at higher rates. For first-time buyers, they
cited using savings (76 percent, down from 81 percent last
year) and a gift from relative or friend (24 percent).
For all buyers who saved for a downpayment, 40 percent
saved in less than six months, down from 46 percent last year.
Forty-nine percent of first-time buyers saved for a year or less,
down from 51 percent last year, and compared to 60 percent
of repeat buyers which is down from 66 percent the year prior.
Unmarried couples surpassed single males with the highest
percent of savings used for the downpayment at 70 percent.
Seventy-four percent of single males used savings to finance
the downpayment in 2015, which declined to 66 percent
this year. Married couples and single females were the most
likely to save for a downpayment in less than six months (41
percent). Married couples and single females were the most
likely to use proceeds from the sale of a primary home (41
percent and 33 percent respectively).
Expenses that Delayed Saving for a Downpayment or Home Purchase
• Exhibits 5–9 through 5–11
Over one-fifth of buyers (22 percent) were delayed in
purchasing a home by more than five years if they had debt
that impeded them. The median length of time buyers waited
to buy a home while saving for the downpayment was three
years. Buyers were asked what difficulties they encountered
in their home search and home buying process. The share
that cited their most difficult step in the home buying process
was saving for a downpayment was 13 percent again this
year. These buyers were asked what expenses made saving
for a downpayment difficult. Forty-nine percent of all buyers
reported student loans (down from 51 percent), 40 percent
credit card debt (down from 47 percent), and 34 percent car
loans.
For first-time home buyers, 26 percent said saving for a
downpayment was the most difficult step in the process.
Of that share, 55 percent said student loan debt delayed
them in saving for a home. Among the six percent of repeat
buyers who reported that saving for a downpayment was
the most difficult task, 49 percent reported credit card debt
delayed them in saving for a home (up from 46 percent).
Eighteen percent of unmarried couples reported saving for a
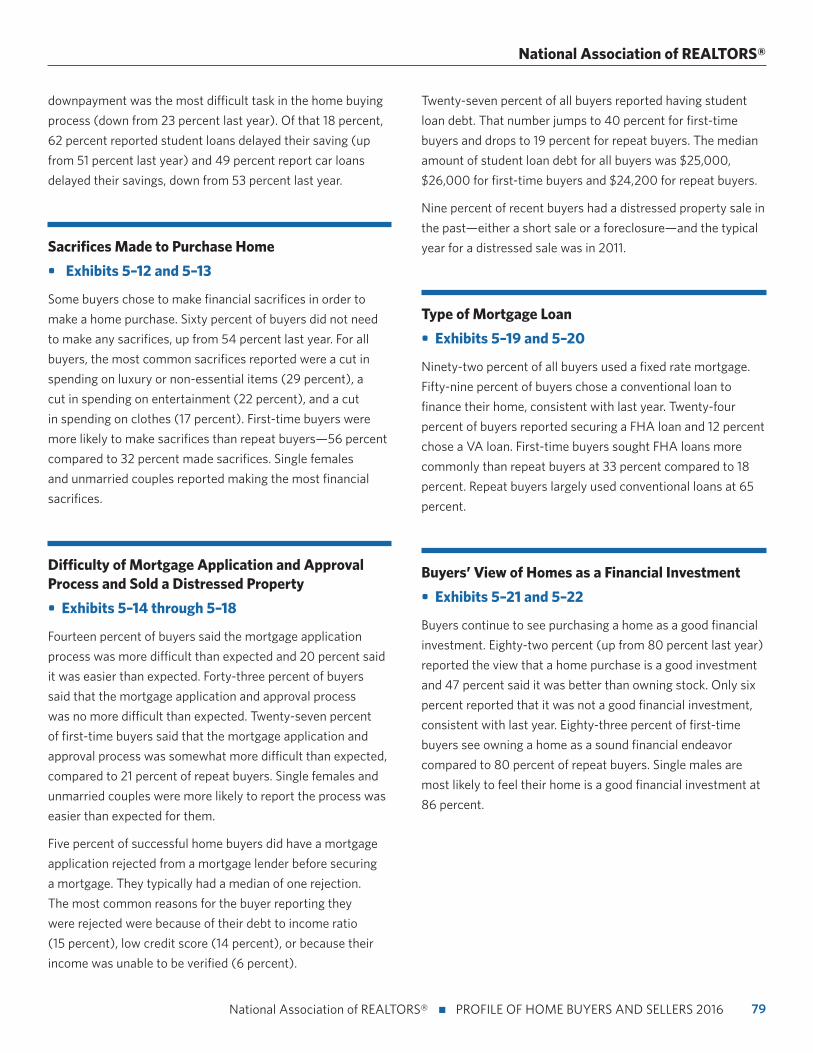
79 National Association of REALTORS® n PROFILE OF HOME BUYERS AND SELLERS 2016
National Association of REALTORS®
downpayment was the most difficult task in the home buying
process (down from 23 percent last year). Of that 18 percent,
62 percent reported student loans delayed their saving (up
from 51 percent last year) and 49 percent report car loans
delayed their savings, down from 53 percent last year.
Sacrifices Made to Purchase Home
• Exhibits 5–12 and 5–13
Some buyers chose to make financial sacrifices in order to
make a home purchase. Sixty percent of buyers did not need
to make any sacrifices, up from 54 percent last year. For all
buyers, the most common sacrifices reported were a cut in
spending on luxury or non-essential items (29 percent), a
cut in spending on entertainment (22 percent), and a cut
in spending on clothes (17 percent). First-time buyers were
more likely to make sacrifices than repeat buyers—56 percent
compared to 32 percent made sacrifices. Single females
and unmarried couples reported making the most financial
sacrifices.
Difficulty of Mortgage Application and Approval Process and Sold a Distressed Property
• Exhibits 5–14 through 5–18
Fourteen percent of buyers said the mortgage application
process was more difficult than expected and 20 percent said
it was easier than expected. Forty-three percent of buyers
said that the mortgage application and approval process
was no more difficult than expected. Twenty-seven percent
of first-time buyers said that the mortgage application and
approval process was somewhat more difficult than expected,
compared to 21 percent of repeat buyers. Single females and
unmarried couples were more likely to report the process was
easier than expected for them.
Five percent of successful home buyers did have a mortgage
application rejected from a mortgage lender before securing
a mortgage. They typically had a median of one rejection.
The most common reasons for the buyer reporting they
were rejected were because of their debt to income ratio
(15 percent), low credit score (14 percent), or because their
income was unable to be verified (6 percent).
Twenty-seven percent of all buyers reported having student
loan debt. That number jumps to 40 percent for first-time
buyers and drops to 19 percent for repeat buyers. The median
amount of student loan debt for all buyers was $25,000,
$26,000 for first-time buyers and $24,200 for repeat buyers.
Nine percent of recent buyers had a distressed property sale in
the past—either a short sale or a foreclosure—and the typical
year for a distressed sale was in 2011.
Type of Mortgage Loan
• Exhibits 5–19 and 5–20
Ninety-two percent of all buyers used a fixed rate mortgage.
Fifty-nine percent of buyers chose a conventional loan to
finance their home, consistent with last year. Twenty-four
percent of buyers reported securing a FHA loan and 12 percent
chose a VA loan. First-time buyers sought FHA loans more
commonly than repeat buyers at 33 percent compared to 18
percent. Repeat buyers largely used conventional loans at 65
percent.
Buyers’ View of Homes as a Financial Investment
• Exhibits 5–21 and 5–22
Buyers continue to see purchasing a home as a good financial
investment. Eighty-two percent (up from 80 percent last year)
reported the view that a home purchase is a good investment
and 47 percent said it was better than owning stock. Only six
percent reported that it was not a good financial investment,
consistent with last year. Eighty-three percent of first-time
buyers see owning a home as a sound financial endeavor
compared to 80 percent of repeat buyers. Single males are
most likely to feel their home is a good financial investment at
86 percent.
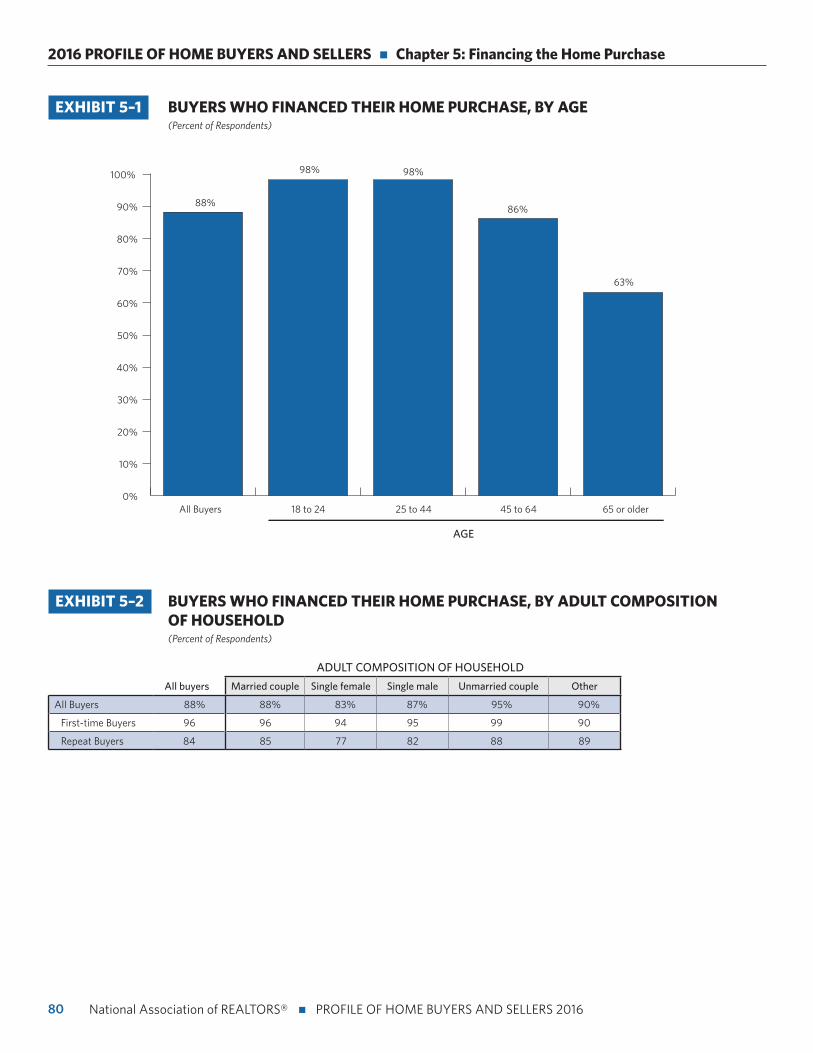
80
2016 PROFILE OF HOME BUYERS AND SELLERS n Chapter 5: Financing the Home Purchase
National Association of REALTORS® n PROFILE OF HOME BUYERS AND SELLERS 2016
EXHIBIT 5–1 BUYERS WHO FINANCED THEIR HOME PURCHASE, BY AGE (Percent of Respondents)
0%
10%
20%
30%
40%
50%
60%
70%
80%
90%
100%
88%
98% 98%
86%
63%
All Buyers 18 to 24 25 to 44 45 to 64 65 or older
AGE
EXHIBIT 5–2 BUYERS WHO FINANCED THEIR HOME PURCHASE, BY ADULT COMPOSITION OF HOUSEHOLD (Percent of Respondents)
ADULT COMPOSITION OF HOUSEHOLD
All buyers Married couple Single female Single male Unmarried couple Other
All Buyers 88% 88% 83% 87% 95% 90%
First-time Buyers 96 96 94 95 99 90
Repeat Buyers 84 85 77 82 88 89
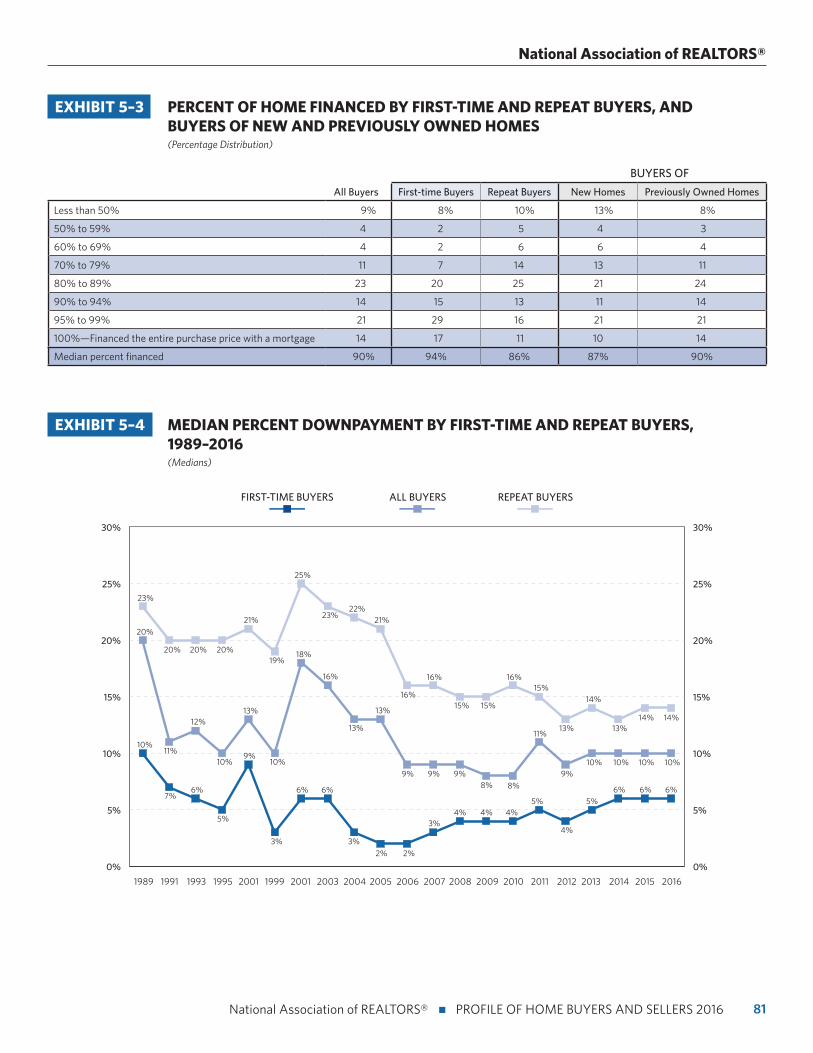
81 National Association of REALTORS® n PROFILE OF HOME BUYERS AND SELLERS 2016
National Association of REALTORS®
EXHIBIT 5–3 PERCENT OF HOME FINANCED BY FIRST-TIME AND REPEAT BUYERS, AND BUYERS OF NEW AND PREVIOUSLY OWNED HOMES (Percentage Distribution)
BUYERS OF
All Buyers First-time Buyers Repeat Buyers New Homes Previously Owned Homes
Less than 50% 9% 8% 10% 13% 8%
50% to 59% 4 2 5 4 3
60% to 69% 4 2 6 6 4
70% to 79% 11 7 14 13 11
80% to 89% 23 20 25 21 24
90% to 94% 14 15 13 11 14
95% to 99% 21 29 16 21 21
100%—Financed the entire purchase price with a mortgage 14 17 11 10 14
Median percent financed 90% 94% 86% 87% 90%
EXHIBIT 5–4 MEDIAN PERCENT DOWNPAYMENT BY FIRST-TIME AND REPEAT BUYERS, 1989–2016 (Medians)
0%
5%
10%
15%
20%
25%
30%
0%
5%
10%
15%
20%
25%
30%
REPEAT BUYERSALL BUYERSFIRST-TIME BUYERS
25%
13%
23%22%
21%
23%
20% 20% 18%
21%
20%
11%
20%
10%
7%
12%
10%
13%
10%9%
16%
9%
13%
9%
16%
16%
15%
16%15%
15%
13%14% 14%
14%
13%
6%
5%
3%
6% 6%
3%2% 2%
3%4% 4% 4%
5%
4%
5%6% 6% 6%
19%
9%8% 8%
9%
11%
10%10% 10% 10%
1989 1991 1993 1995 1999 2001 2003 2004 2005 2007 2008 2009 2010 20112001 2006 20162012 2013 2014 2015
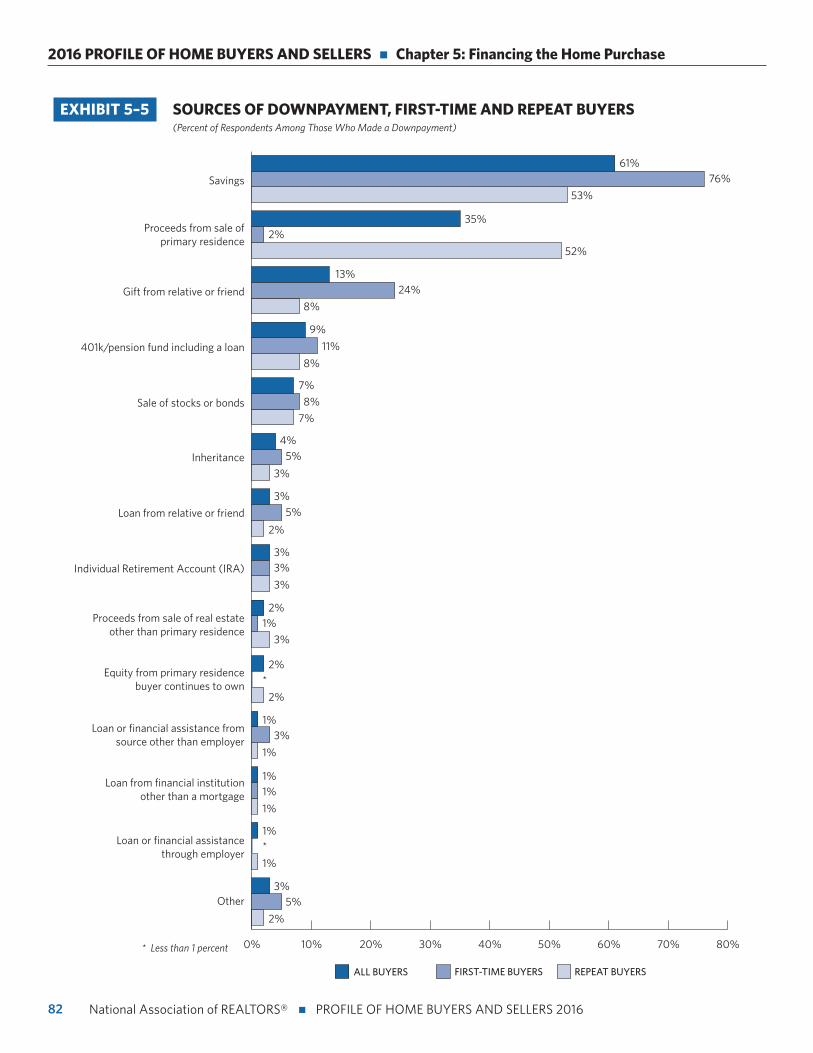
82
2016 PROFILE OF HOME BUYERS AND SELLERS n Chapter 5: Financing the Home Purchase
National Association of REALTORS® n PROFILE OF HOME BUYERS AND SELLERS 2016
EXHIBIT 5–5 SOURCES OF DOWNPAYMENT, FIRST-TIME AND REPEAT BUYERS (Percent of Respondents Among Those Who Made a Downpayment)
0% 10% 20% 30% 40% 50% 60% 70% 80%
Other
Loan or financial assistancethrough employer
Loan from financial institutionother than a mortgage
Loan or financial assistance fromsource other than employer
Equity from primary residencebuyer continues to own
Proceeds from sale of real estateother than primary residence
Individual Retirement Account (IRA)
Loan from relative or friend
Inheritance
Sale of stocks or bonds
401k/pension fund including a loan
Gift from relative or friend
Proceeds from sale ofprimary residence
Savings
REPEAT BUYERSFIRST-TIME BUYERSALL BUYERS
3%
3%
2%
3%
4%5%
5%
3%
7%
3%
8%
8%
7%
8%
9%
11%
52%
2%
13%
53%
35%
61%76%
24%
3%
2%1%
2%
2%*
1%
1%3%
1%
1%1%
1%
1%*
2%
3%5%
* Less than 1 percent
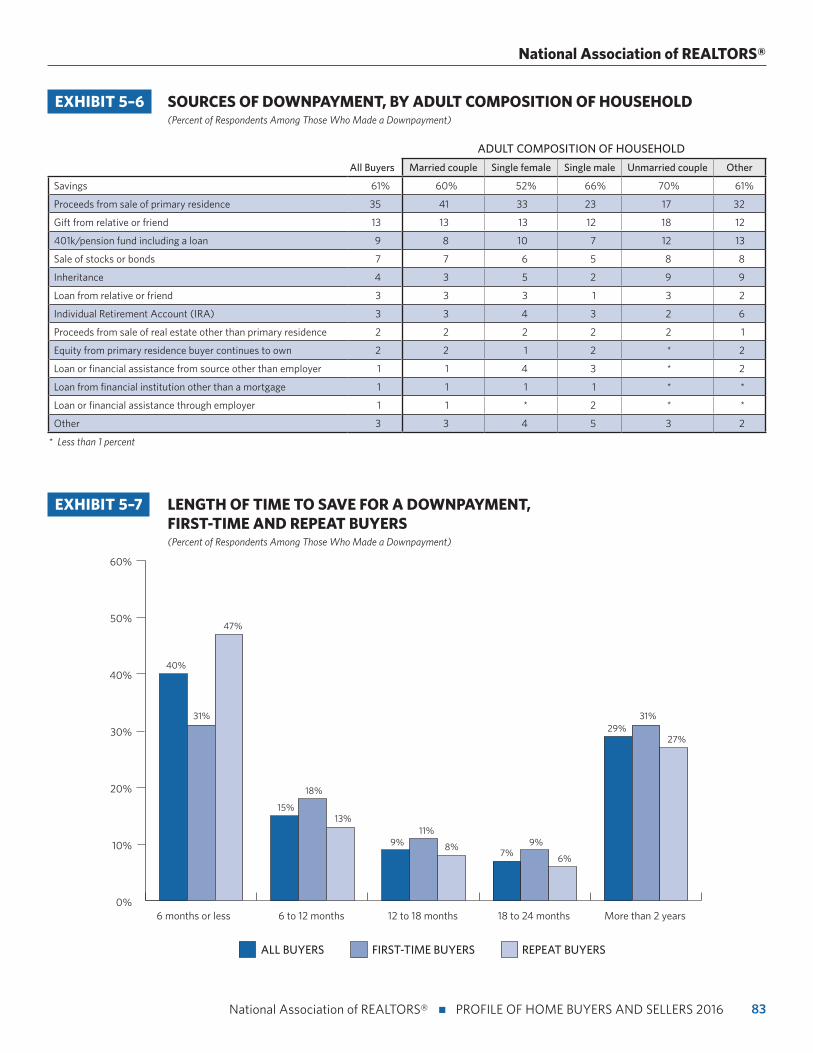
83 National Association of REALTORS® n PROFILE OF HOME BUYERS AND SELLERS 2016
National Association of REALTORS®
EXHIBIT 5–6 SOURCES OF DOWNPAYMENT, BY ADULT COMPOSITION OF HOUSEHOLD (Percent of Respondents Among Those Who Made a Downpayment)
ADULT COMPOSITION OF HOUSEHOLD
All Buyers Married couple Single female Single male Unmarried couple Other
Savings 61% 60% 52% 66% 70% 61%
Proceeds from sale of primary residence 35 41 33 23 17 32
Gift from relative or friend 13 13 13 12 18 12
401k/pension fund including a loan 9 8 10 7 12 13
Sale of stocks or bonds 7 7 6 5 8 8
Inheritance 4 3 5 2 9 9
Loan from relative or friend 3 3 3 1 3 2
Individual Retirement Account (IRA) 3 3 4 3 2 6
Proceeds from sale of real estate other than primary residence 2 2 2 2 2 1
Equity from primary residence buyer continues to own 2 2 1 2 * 2
Loan or financial assistance from source other than employer 1 1 4 3 * 2
Loan from financial institution other than a mortgage 1 1 1 1 * *
Loan or financial assistance through employer 1 1 * 2 * *
Other 3 3 4 5 3 2
* Less than 1 percent
0%
10%
20%
30%
40%
50%
60%
40%
6 months or less 6 to 12 months 12 to 18 months 18 to 24 months More than 2 years
31%
13%
8%
29%
15%
11%9%
31%
47%
7%
18%
9%
6%
27%
REPEAT BUYERSFIRST-TIME BUYERSALL BUYERS
EXHIBIT 5–7 LENGTH OF TIME TO SAVE FOR A DOWNPAYMENT, FIRST-TIME AND REPEAT BUYERS (Percent of Respondents Among Those Who Made a Downpayment)
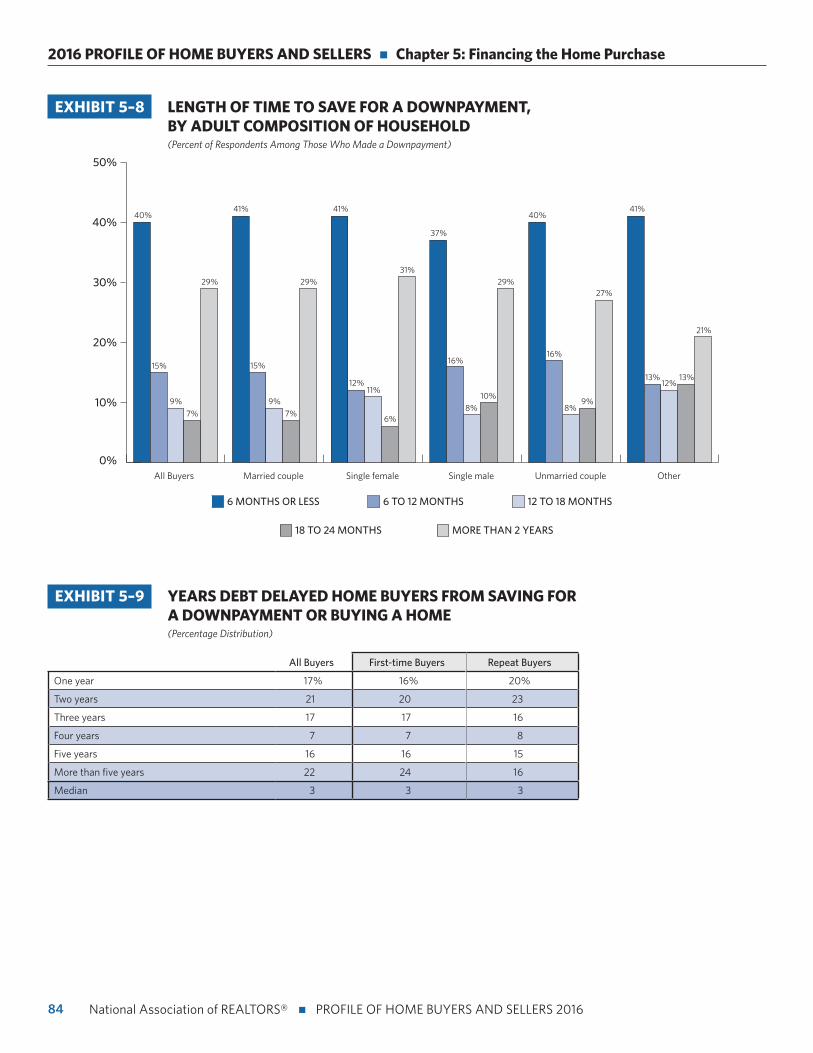
84
2016 PROFILE OF HOME BUYERS AND SELLERS n Chapter 5: Financing the Home Purchase
National Association of REALTORS® n PROFILE OF HOME BUYERS AND SELLERS 2016
EXHIBIT 5–8 LENGTH OF TIME TO SAVE FOR A DOWNPAYMENT, BY ADULT COMPOSITION OF HOUSEHOLD (Percent of Respondents Among Those Who Made a Downpayment)
0%
10%
20%
30%
40%
50%
All Buyers Married couple Single female Single male Unmarried couple
6 TO 12 MONTHS6 MONTHS OR LESS
Other
12 TO 18 MONTHS
18 TO 24 MONTHS MORE THAN 2 YEARS
40%41%41% 41%
37%
40%
15% 15%
12%
29%
9%
7%
9%
7%
31%
16%
11%
8%10%
16%
8%9%
27%29%
21%
13%12%
13%
29%
6%
EXHIBIT 5–9 YEARS DEBT DELAYED HOME BUYERS FROM SAVING FOR A DOWNPAYMENT OR BUYING A HOME (Percentage Distribution)
All Buyers First-time Buyers Repeat Buyers
One year 17% 16% 20%
Two years 21 20 23
Three years 17 17 16
Four years 7 7 8
Five years 16 16 15
More than five years 22 24 16
Median 3 3 3
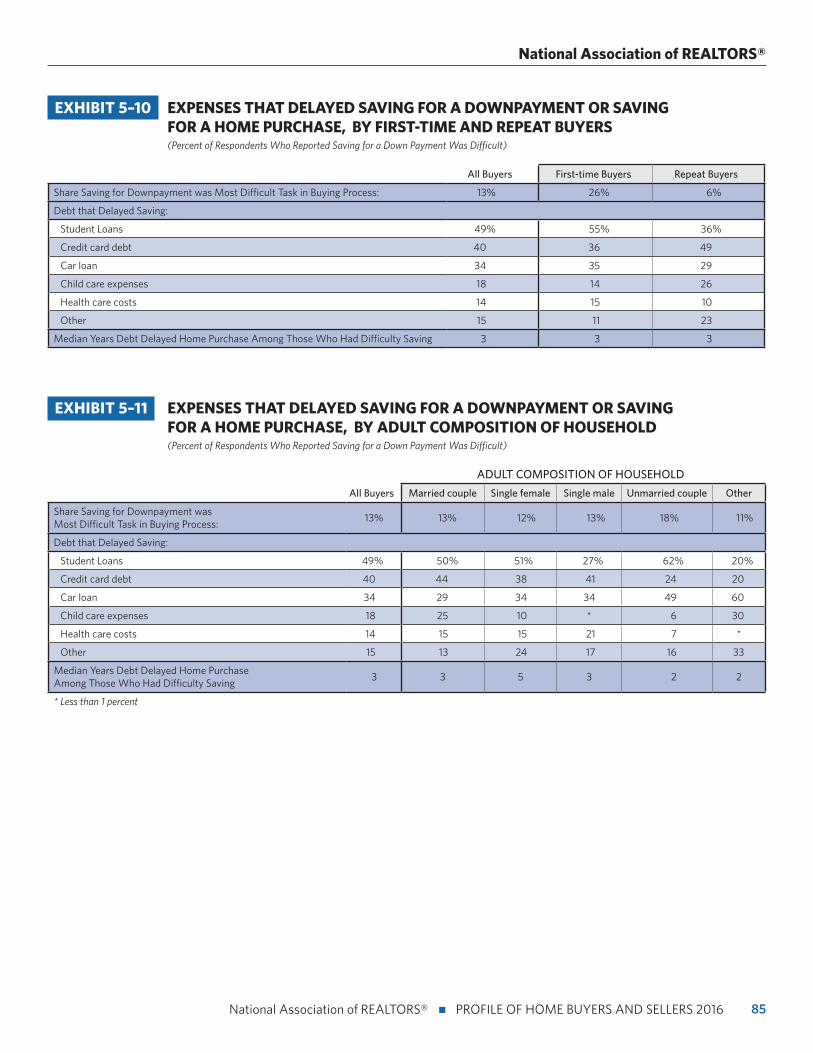
85 National Association of REALTORS® n PROFILE OF HOME BUYERS AND SELLERS 2016
National Association of REALTORS®
EXHIBIT 5–10 EXPENSES THAT DELAYED SAVING FOR A DOWNPAYMENT OR SAVING FOR A HOME PURCHASE, BY FIRST-TIME AND REPEAT BUYERS (Percent of Respondents Who Reported Saving for a Down Payment Was Difficult)
All Buyers First-time Buyers Repeat Buyers
Share Saving for Downpayment was Most Difficult Task in Buying Process: 13% 26% 6%
Debt that Delayed Saving:
Student Loans 49% 55% 36%
Credit card debt 40 36 49
Car loan 34 35 29
Child care expenses 18 14 26
Health care costs 14 15 10
Other 15 11 23
Median Years Debt Delayed Home Purchase Among Those Who Had Difficulty Saving 3 3 3
EXHIBIT 5–11 EXPENSES THAT DELAYED SAVING FOR A DOWNPAYMENT OR SAVING FOR A HOME PURCHASE, BY ADULT COMPOSITION OF HOUSEHOLD (Percent of Respondents Who Reported Saving for a Down Payment Was Difficult)
ADULT COMPOSITION OF HOUSEHOLD
All Buyers Married couple Single female Single male Unmarried couple Other
Share Saving for Downpayment was Most Difficult Task in Buying Process:
13% 13% 12% 13% 18% 11%
Debt that Delayed Saving:
Student Loans 49% 50% 51% 27% 62% 20%
Credit card debt 40 44 38 41 24 20
Car loan 34 29 34 34 49 60
Child care expenses 18 25 10 * 6 30
Health care costs 14 15 15 21 7 *
Other 15 13 24 17 16 33
Median Years Debt Delayed Home Purchase Among Those Who Had Difficulty Saving
3 3 5 3 2 2
* Less than 1 percent
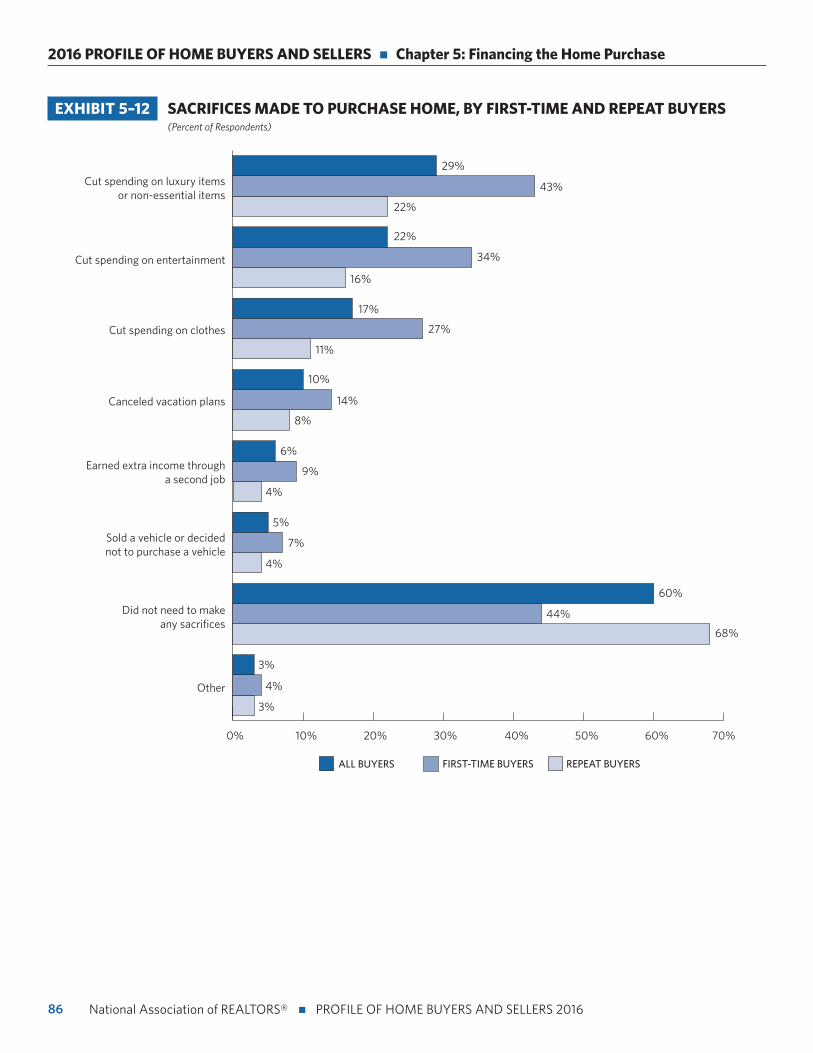
86
2016 PROFILE OF HOME BUYERS AND SELLERS n Chapter 5: Financing the Home Purchase
National Association of REALTORS® n PROFILE OF HOME BUYERS AND SELLERS 2016
0% 10% 20% 30% 40% 50% 60% 70%
Other
Did not need to makeany sacrifices
Sold a vehicle or decidednot to purchase a vehicle
Earned extra income througha second job
Canceled vacation plans
Cut spending on clothes
Cut spending on entertainment
Cut spending on luxury itemsor non-essential items
REPEAT BUYERSFIRST-TIME BUYERSALL BUYERS
3%
44%
68%
3%
5%
7%
60%
4%
6%
4%
8%
9%
4%
11%
10%
14%
34%
16%
17%
22%
22%
29%
43%
27%
EXHIBIT 5–12 SACRIFICES MADE TO PURCHASE HOME, BY FIRST-TIME AND REPEAT BUYERS (Percent of Respondents)
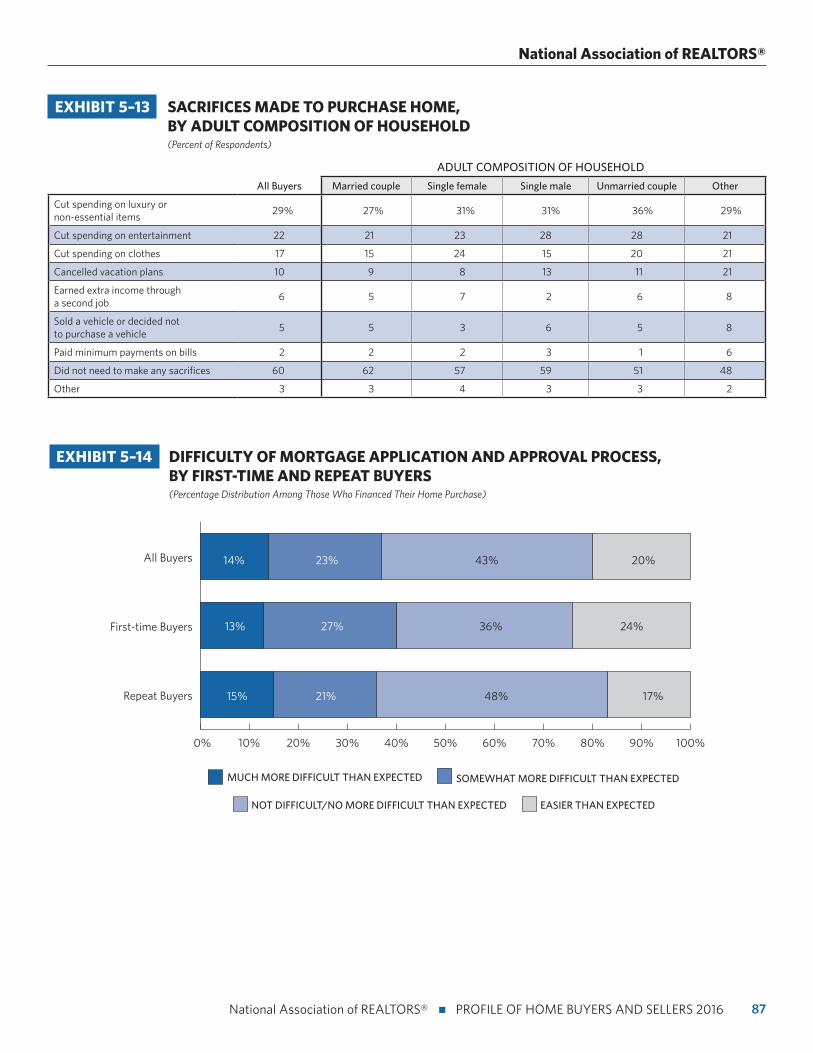
87 National Association of REALTORS® n PROFILE OF HOME BUYERS AND SELLERS 2016
National Association of REALTORS®
EXHIBIT 5–13 SACRIFICES MADE TO PURCHASE HOME, BY ADULT COMPOSITION OF HOUSEHOLD (Percent of Respondents)
ADULT COMPOSITION OF HOUSEHOLD
All Buyers Married couple Single female Single male Unmarried couple Other
Cut spending on luxury or non-essential items
29% 27% 31% 31% 36% 29%
Cut spending on entertainment 22 21 23 28 28 21
Cut spending on clothes 17 15 24 15 20 21
Cancelled vacation plans 10 9 8 13 11 21
Earned extra income through a second job
6 5 7 2 6 8
Sold a vehicle or decided not to purchase a vehicle
5 5 3 6 5 8
Paid minimum payments on bills 2 2 2 3 1 6
Did not need to make any sacrifices 60 62 57 59 51 48
Other 3 3 4 3 3 2
EXHIBIT 5–14 DIFFICULTY OF MORTGAGE APPLICATION AND APPROVAL PROCESS, BY FIRST-TIME AND REPEAT BUYERS (Percentage Distribution Among Those Who Financed Their Home Purchase)
0% 10% 20% 30% 40% 50% 60% 70% 80% 90% 100%
Repeat Buyers
First-time Buyers
All Buyers
NOT DIFFICULT/NO MORE DIFFICULT THAN EXPECTED
MUCH MORE DIFFICULT THAN EXPECTED SOMEWHAT MORE DIFFICULT THAN EXPECTED
EASIER THAN EXPECTED
15% 21%
13% 27%
14% 23%
48% 17%
36% 24%
43% 20%
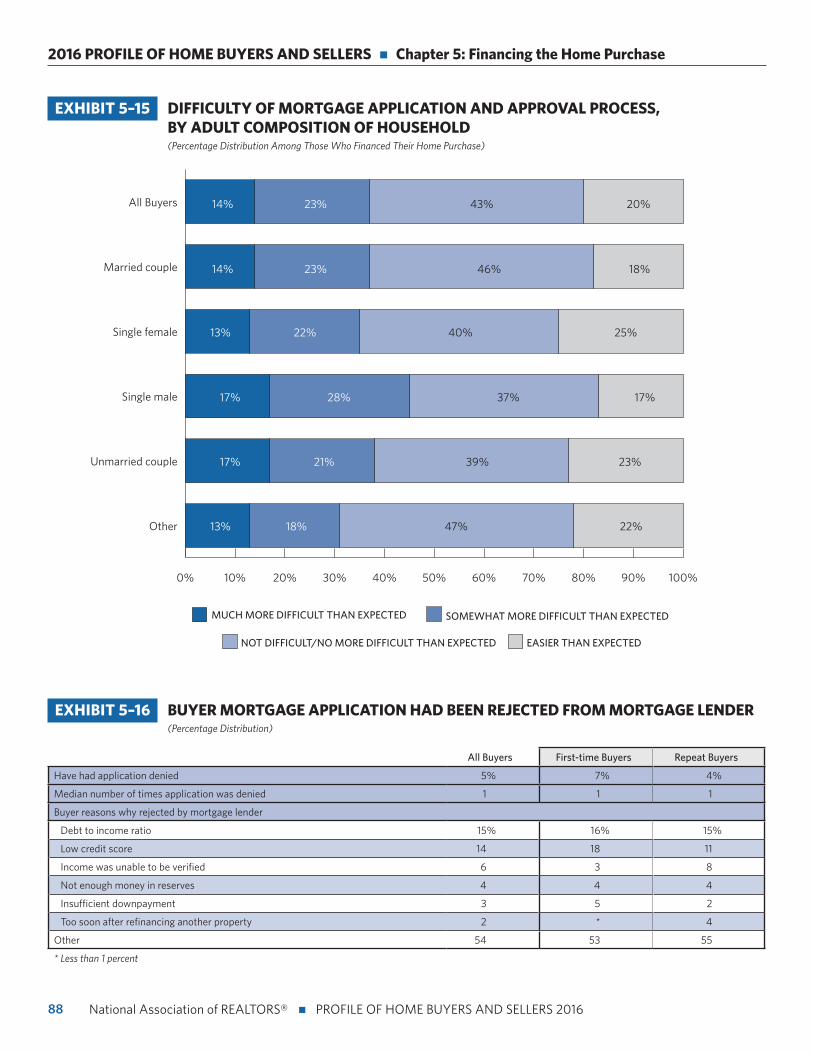
88
2016 PROFILE OF HOME BUYERS AND SELLERS n Chapter 5: Financing the Home Purchase
National Association of REALTORS® n PROFILE OF HOME BUYERS AND SELLERS 2016
EXHIBIT 5–15 DIFFICULTY OF MORTGAGE APPLICATION AND APPROVAL PROCESS, BY ADULT COMPOSITION OF HOUSEHOLD (Percentage Distribution Among Those Who Financed Their Home Purchase)
0% 10% 20% 30% 40% 50% 60% 70% 80% 90% 100%
Other
Unmarried couple
Single male
Single female
Married couple
All Buyers
NOT DIFFICULT/NO MORE DIFFICULT THAN EXPECTED
MUCH MORE DIFFICULT THAN EXPECTED SOMEWHAT MORE DIFFICULT THAN EXPECTED
EASIER THAN EXPECTED
13% 22%
14% 23%
14% 23%
40% 25%
46% 18%
43% 20%
13% 18%
17% 21%
17% 28%
47% 22%
39% 23%
37% 17%
EXHIBIT 5–16 BUYER MORTGAGE APPLICATION HAD BEEN REJECTED FROM MORTGAGE LENDER (Percentage Distribution)
All Buyers First-time Buyers Repeat Buyers
Have had application denied 5% 7% 4%
Median number of times application was denied 1 1 1
Buyer reasons why rejected by mortgage lender
Debt to income ratio 15% 16% 15%
Low credit score 14 18 11
Income was unable to be verified 6 3 8
Not enough money in reserves 4 4 4
Insufficient downpayment 3 5 2
Too soon after refinancing another property 2 * 4
Other 54 53 55
* Less than 1 percent
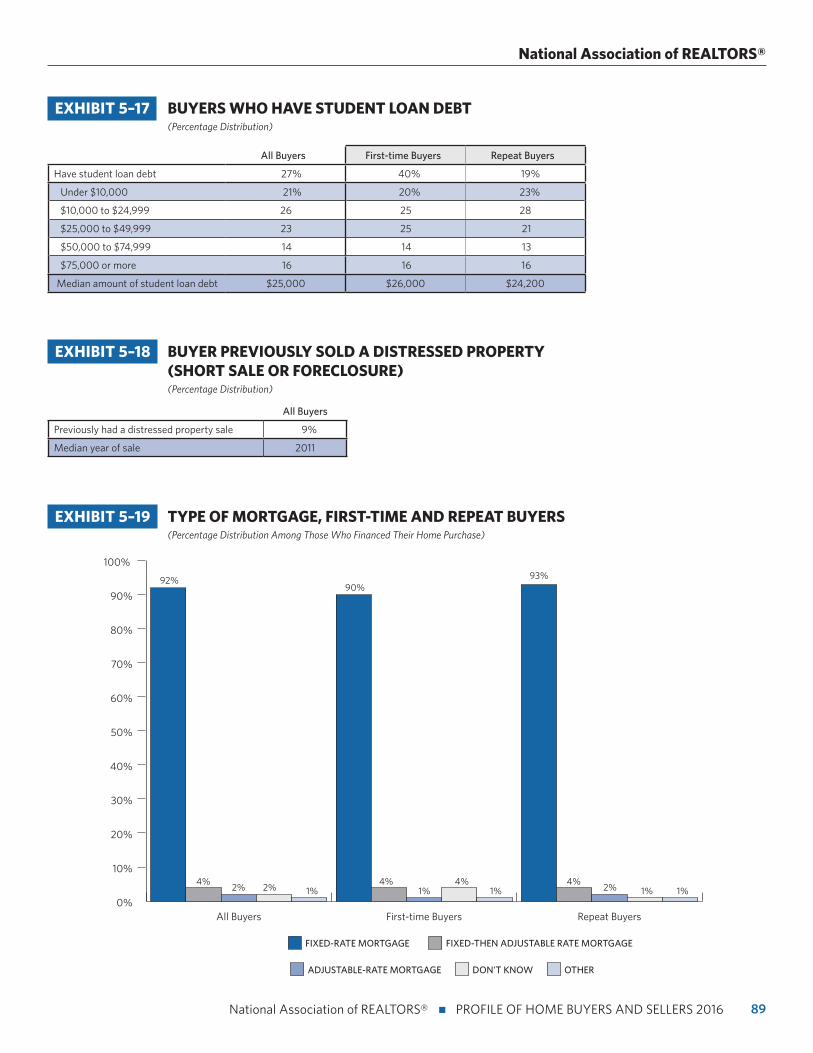
89 National Association of REALTORS® n PROFILE OF HOME BUYERS AND SELLERS 2016
National Association of REALTORS®
EXHIBIT 5–18 BUYER PREVIOUSLY SOLD A DISTRESSED PROPERTY (SHORT SALE OR FORECLOSURE) (Percentage Distribution)
All Buyers
Previously had a distressed property sale 9%
Median year of sale 2011
0%
10%
20%
30%
40%
50%
60%
70%
80%
90%
100%
Repeat BuyersFirst-time BuyersAll Buyers
92%
4%
90%93%
2%4% 4% 4%
1%2% 1% 1%1% 2% 1%
FIXED-THEN ADJUSTABLE RATE MORTGAGEFIXED-RATE MORTGAGE
ADJUSTABLE-RATE MORTGAGE DON'T KNOW OTHER
EXHIBIT 5–19 TYPE OF MORTGAGE, FIRST-TIME AND REPEAT BUYERS (Percentage Distribution Among Those Who Financed Their Home Purchase)
EXHIBIT 5–17 BUYERS WHO HAVE STUDENT LOAN DEBT (Percentage Distribution)
All Buyers First-time Buyers Repeat Buyers
Have student loan debt 27% 40% 19%
Under $10,000 21% 20% 23%
$10,000 to $24,999 26 25 28
$25,000 to $49,999 23 25 21
$50,000 to $74,999 14 14 13
$75,000 or more 16 16 16
Median amount of student loan debt $25,000 $26,000 $24,200
EXHIBIT 5–16 BUYER MORTGAGE APPLICATION HAD BEEN REJECTED FROM MORTGAGE LENDER (Percentage Distribution)
All Buyers First-time Buyers Repeat Buyers
Have had application denied 5% 7% 4%
Median number of times application was denied 1 1 1
Buyer reasons why rejected by mortgage lender
Debt to income ratio 15% 16% 15%
Low credit score 14 18 11
Income was unable to be verified 6 3 8
Not enough money in reserves 4 4 4
Insufficient downpayment 3 5 2
Too soon after refinancing another property 2 * 4
Other 54 53 55
* Less than 1 percent
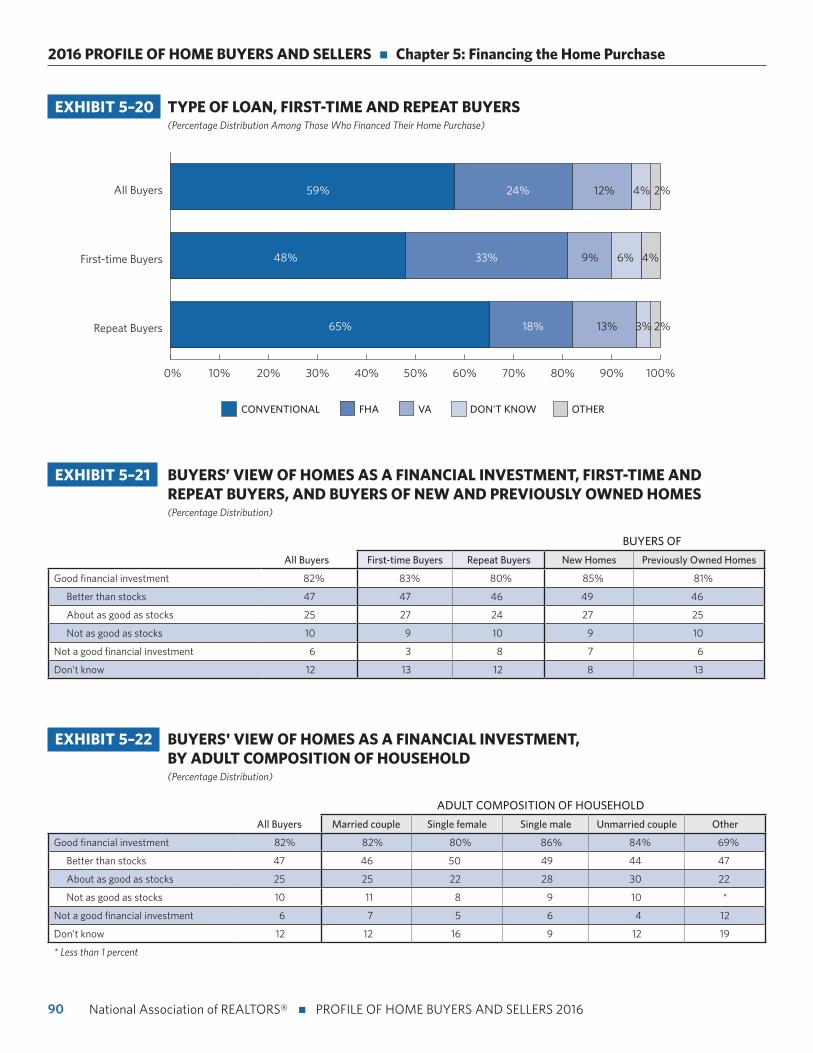
90
2016 PROFILE OF HOME BUYERS AND SELLERS n Chapter 5: Financing the Home Purchase
National Association of REALTORS® n PROFILE OF HOME BUYERS AND SELLERS 2016
0% 10% 20% 30% 40% 50% 60% 70% 80% 90% 100%
Repeat Buyers
First-time Buyers
All Buyers
DON'T KNOWCONVENTIONAL FHA OTHER
65% 18%
48% 33%
59% 24%
13%
2%
9%
12% 4%
VA
4%6%
2%3%
EXHIBIT 5–20 TYPE OF LOAN, FIRST-TIME AND REPEAT BUYERS (Percentage Distribution Among Those Who Financed Their Home Purchase)
EXHIBIT 5–21 BUYERS’ VIEW OF HOMES AS A FINANCIAL INVESTMENT, FIRST-TIME AND REPEAT BUYERS, AND BUYERS OF NEW AND PREVIOUSLY OWNED HOMES (Percentage Distribution)
BUYERS OF
All Buyers First-time Buyers Repeat Buyers New Homes Previously Owned Homes
Good financial investment 82% 83% 80% 85% 81%
Better than stocks 47 47 46 49 46
About as good as stocks 25 27 24 27 25
Not as good as stocks 10 9 10 9 10
Not a good financial investment 6 3 8 7 6
Don't know 12 13 12 8 13
EXHIBIT 5–22 BUYERS' VIEW OF HOMES AS A FINANCIAL INVESTMENT, BY ADULT COMPOSITION OF HOUSEHOLD (Percentage Distribution)
ADULT COMPOSITION OF HOUSEHOLD
All Buyers Married couple Single female Single male Unmarried couple Other
Good financial investment 82% 82% 80% 86% 84% 69%
Better than stocks 47 46 50 49 44 47
About as good as stocks 25 25 22 28 30 22
Not as good as stocks 10 11 8 9 10 *
Not a good financial investment 6 7 5 6 4 12
Don't know 12 12 16 9 12 19
* Less than 1 percent
EXHIBIT 5–21 BUYERS’ VIEW OF HOMES AS A FINANCIAL INVESTMENT, FIRST-TIME AND REPEAT BUYERS, AND BUYERS OF NEW AND PREVIOUSLY OWNED HOMES (Percentage Distribution)
BUYERS OF
All Buyers First-time Buyers Repeat Buyers New Homes Previously Owned Homes
Good financial investment 82% 83% 80% 85% 81%
Better than stocks 47 47 46 49 46
About as good as stocks 25 27 24 27 25
Not as good as stocks 10 9 10 9 10
Not a good financial investment 6 3 8 7 6
Don't know 12 13 12 8 13
Home Sellers and Their Selling Experience
The Profile of Home Buyers and Sellers reaches its 35th anniversary this year, and we celebrate the survey by looking back at how long residents lived in their homes before selling. NAR has collected data on the median tenure in the
home since 1985. In 2016, the median tenure for sellers was 10 years. In 1985, the median tenure was just five years. In the last 30 years, sellers have remained in the same home for longer periods of time. From 1987 to 2008, sellers stayed in the home for a median of six years, with the only exception of 1997 when the median tenure bumped up to seven years. After 2008, the median tenure in home began to increase by one year each year. By 2011, the median tenure reached nine years, where it remained for three consecutive years, and jumped up again in 2014 to 10 years. Last year, it decreased to nine years, but rose in 2016 to a median of 10 years, effectively doubling since the data collection started three decades prior.
Tightened inventory continues to cause prices to increase in many areas of the country. While housing inventory is reduced in many areas, sellers see a favorable market where they receive a median of 98 percent of their asking price and sell their homes typically within four weeks.
Increased home prices have lowered the share of home sellers who report they delayed the sale of their home because their home was worth less than their mort-gage. That share of sellers dropped from 14 percent in the 2015 report to 12 percent in the 2016 report. However, sellers who purchased their home eight to 10 years ago continue to report stalling their home sale at higher rates—31 percent of sellers reported delaying their home sale.
The typical seller had $43,100 in equity from their home when their home sold, in comparison to the original purchase price of their home.
91 National Association of REALTORS® n PROFILE OF HOME BUYERS AND SELLERS 2016
CHAPTER 6:
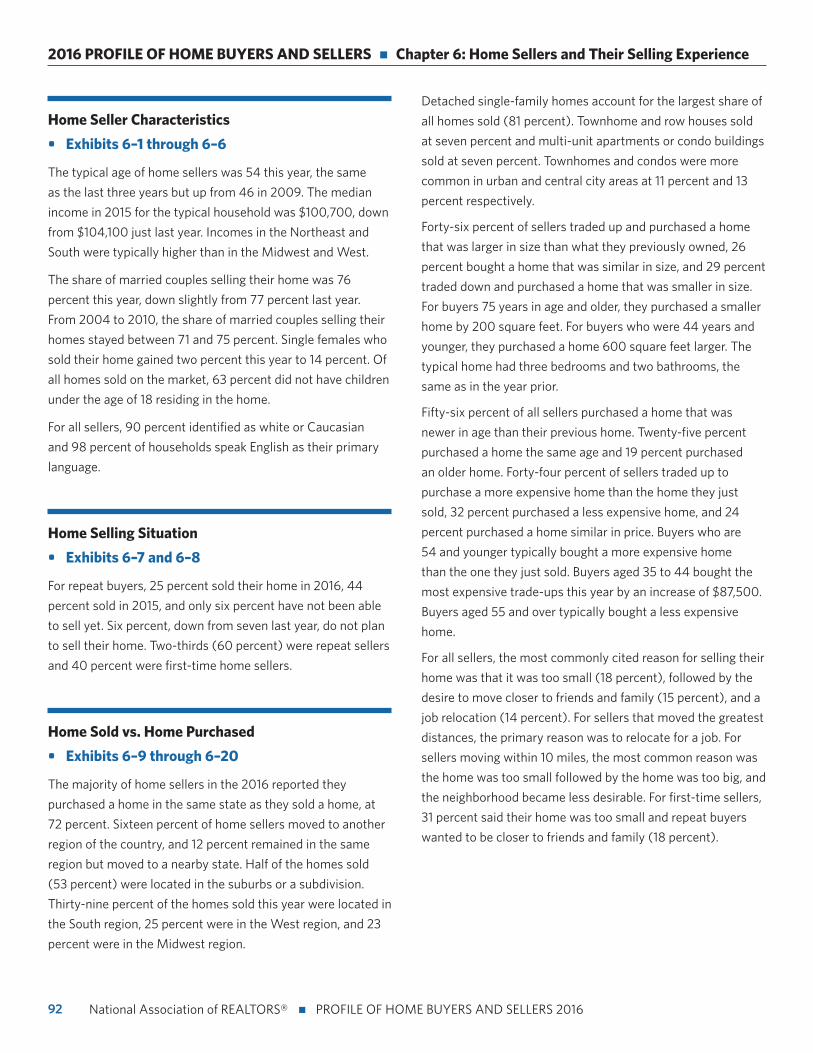
92
2016 PROFILE OF HOME BUYERS AND SELLERS n Chapter 6: Home Sellers and Their Selling Experience
National Association of REALTORS® n PROFILE OF HOME BUYERS AND SELLERS 2016
Home Seller Characteristics
• Exhibits 6–1 through 6–6
The typical age of home sellers was 54 this year, the same
as the last three years but up from 46 in 2009. The median
income in 2015 for the typical household was $100,700, down
from $104,100 just last year. Incomes in the Northeast and
South were typically higher than in the Midwest and West.
The share of married couples selling their home was 76
percent this year, down slightly from 77 percent last year.
From 2004 to 2010, the share of married couples selling their
homes stayed between 71 and 75 percent. Single females who
sold their home gained two percent this year to 14 percent. Of
all homes sold on the market, 63 percent did not have children
under the age of 18 residing in the home.
For all sellers, 90 percent identified as white or Caucasian
and 98 percent of households speak English as their primary
language.
Home Selling Situation
• Exhibits 6–7 and 6–8
For repeat buyers, 25 percent sold their home in 2016, 44
percent sold in 2015, and only six percent have not been able
to sell yet. Six percent, down from seven last year, do not plan
to sell their home. Two-thirds (60 percent) were repeat sellers
and 40 percent were first-time home sellers.
Home Sold vs. Home Purchased
• Exhibits 6–9 through 6–20
The majority of home sellers in the 2016 reported they
purchased a home in the same state as they sold a home, at
72 percent. Sixteen percent of home sellers moved to another
region of the country, and 12 percent remained in the same
region but moved to a nearby state. Half of the homes sold
(53 percent) were located in the suburbs or a subdivision.
Thirty-nine percent of the homes sold this year were located in
the South region, 25 percent were in the West region, and 23
percent were in the Midwest region.
Detached single-family homes account for the largest share of
all homes sold (81 percent). Townhome and row houses sold
at seven percent and multi-unit apartments or condo buildings
sold at seven percent. Townhomes and condos were more
common in urban and central city areas at 11 percent and 13
percent respectively.
Forty-six percent of sellers traded up and purchased a home
that was larger in size than what they previously owned, 26
percent bought a home that was similar in size, and 29 percent
traded down and purchased a home that was smaller in size.
For buyers 75 years in age and older, they purchased a smaller
home by 200 square feet. For buyers who were 44 years and
younger, they purchased a home 600 square feet larger. The
typical home had three bedrooms and two bathrooms, the
same as in the year prior.
Fifty-six percent of all sellers purchased a home that was
newer in age than their previous home. Twenty-five percent
purchased a home the same age and 19 percent purchased
an older home. Forty-four percent of sellers traded up to
purchase a more expensive home than the home they just
sold, 32 percent purchased a less expensive home, and 24
percent purchased a home similar in price. Buyers who are
54 and younger typically bought a more expensive home
than the one they just sold. Buyers aged 35 to 44 bought the
most expensive trade-ups this year by an increase of $87,500.
Buyers aged 55 and over typically bought a less expensive
home.
For all sellers, the most commonly cited reason for selling their
home was that it was too small (18 percent), followed by the
desire to move closer to friends and family (15 percent), and a
job relocation (14 percent). For sellers that moved the greatest
distances, the primary reason was to relocate for a job. For
sellers moving within 10 miles, the most common reason was
the home was too small followed by the home was too big, and
the neighborhood became less desirable. For first-time sellers,
31 percent said their home was too small and repeat buyers
wanted to be closer to friends and family (18 percent).
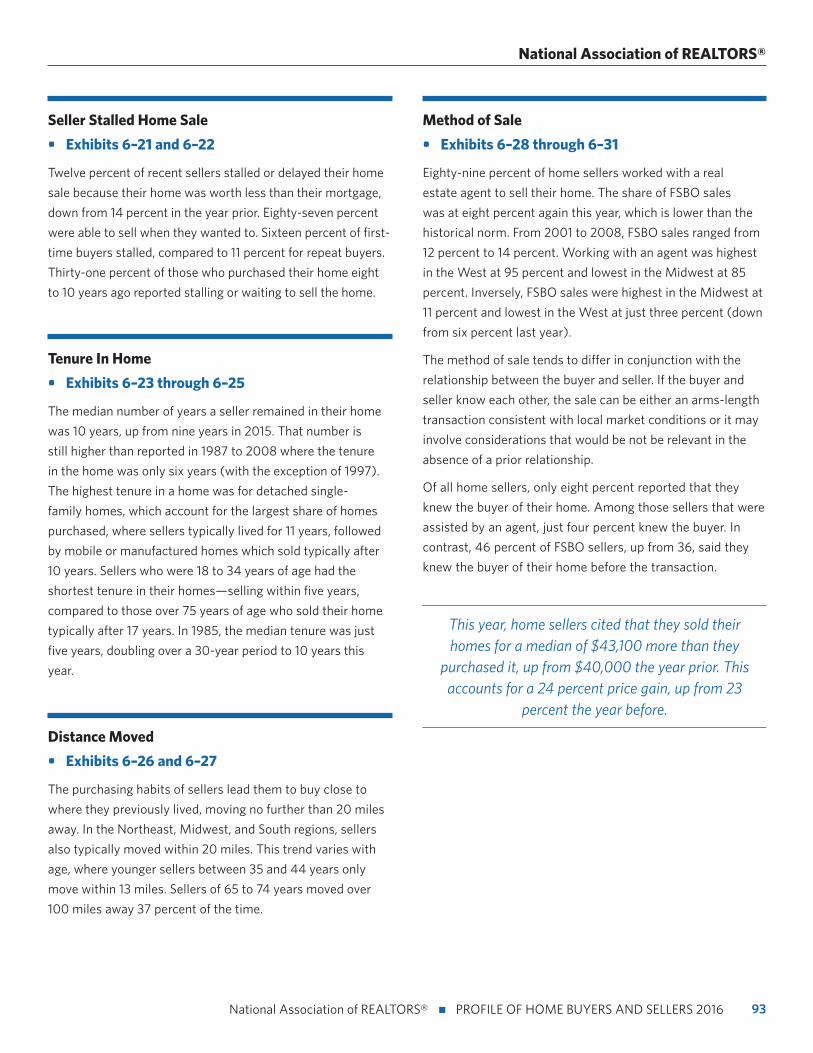
93 National Association of REALTORS® n PROFILE OF HOME BUYERS AND SELLERS 2016
National Association of REALTORS®
Seller Stalled Home Sale
• Exhibits 6–21 and 6–22
Twelve percent of recent sellers stalled or delayed their home
sale because their home was worth less than their mortgage,
down from 14 percent in the year prior. Eighty-seven percent
were able to sell when they wanted to. Sixteen percent of first-
time buyers stalled, compared to 11 percent for repeat buyers.
Thirty-one percent of those who purchased their home eight
to 10 years ago reported stalling or waiting to sell the home.
Tenure In Home
• Exhibits 6–23 through 6–25
The median number of years a seller remained in their home
was 10 years, up from nine years in 2015. That number is
still higher than reported in 1987 to 2008 where the tenure
in the home was only six years (with the exception of 1997).
The highest tenure in a home was for detached single-
family homes, which account for the largest share of homes
purchased, where sellers typically lived for 11 years, followed
by mobile or manufactured homes which sold typically after
10 years. Sellers who were 18 to 34 years of age had the
shortest tenure in their homes—selling within five years,
compared to those over 75 years of age who sold their home
typically after 17 years. In 1985, the median tenure was just
five years, doubling over a 30-year period to 10 years this
year.
Distance Moved
• Exhibits 6–26 and 6–27
The purchasing habits of sellers lead them to buy close to
where they previously lived, moving no further than 20 miles
away. In the Northeast, Midwest, and South regions, sellers
also typically moved within 20 miles. This trend varies with
age, where younger sellers between 35 and 44 years only
move within 13 miles. Sellers of 65 to 74 years moved over
100 miles away 37 percent of the time.
Method of Sale
• Exhibits 6–28 through 6–31
Eighty-nine percent of home sellers worked with a real
estate agent to sell their home. The share of FSBO sales
was at eight percent again this year, which is lower than the
historical norm. From 2001 to 2008, FSBO sales ranged from
12 percent to 14 percent. Working with an agent was highest
in the West at 95 percent and lowest in the Midwest at 85
percent. Inversely, FSBO sales were highest in the Midwest at
11 percent and lowest in the West at just three percent (down
from six percent last year).
The method of sale tends to differ in conjunction with the
relationship between the buyer and seller. If the buyer and
seller know each other, the sale can be either an arms-length
transaction consistent with local market conditions or it may
involve considerations that would be not be relevant in the
absence of a prior relationship.
Of all home sellers, only eight percent reported that they
knew the buyer of their home. Among those sellers that were
assisted by an agent, just four percent knew the buyer. In
contrast, 46 percent of FSBO sellers, up from 36, said they
knew the buyer of their home before the transaction.
This year, home sellers cited that they sold their homes for a median of $43,100 more than they
purchased it, up from $40,000 the year prior. This accounts for a 24 percent price gain, up from 23
percent the year before.
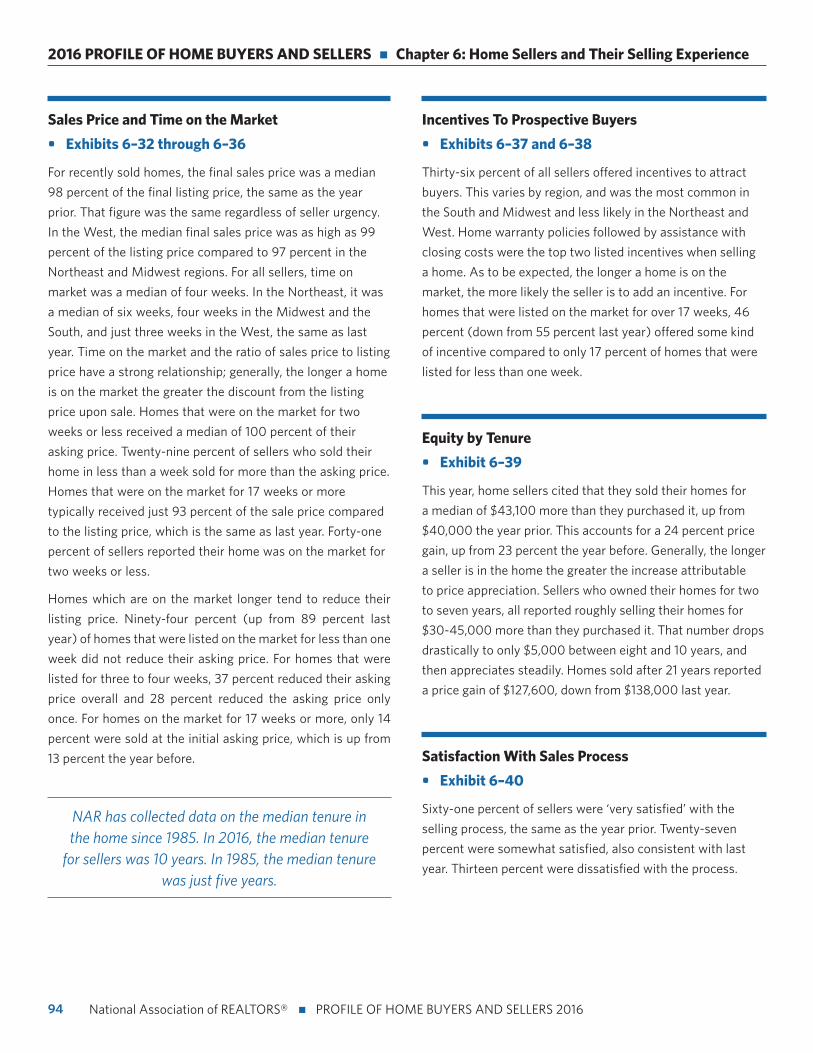
94
2016 PROFILE OF HOME BUYERS AND SELLERS n Chapter 6: Home Sellers and Their Selling Experience
National Association of REALTORS® n PROFILE OF HOME BUYERS AND SELLERS 2016
Sales Price and Time on the Market
• Exhibits 6–32 through 6–36
For recently sold homes, the final sales price was a median
98 percent of the final listing price, the same as the year
prior. That figure was the same regardless of seller urgency.
In the West, the median final sales price was as high as 99
percent of the listing price compared to 97 percent in the
Northeast and Midwest regions. For all sellers, time on
market was a median of four weeks. In the Northeast, it was
a median of six weeks, four weeks in the Midwest and the
South, and just three weeks in the West, the same as last
year. Time on the market and the ratio of sales price to listing
price have a strong relationship; generally, the longer a home
is on the market the greater the discount from the listing
price upon sale. Homes that were on the market for two
weeks or less received a median of 100 percent of their
asking price. Twenty-nine percent of sellers who sold their
home in less than a week sold for more than the asking price.
Homes that were on the market for 17 weeks or more
typically received just 93 percent of the sale price compared
to the listing price, which is the same as last year. Forty-one
percent of sellers reported their home was on the market for
two weeks or less.
Homes which are on the market longer tend to reduce their
listing price. Ninety-four percent (up from 89 percent last
year) of homes that were listed on the market for less than one
week did not reduce their asking price. For homes that were
listed for three to four weeks, 37 percent reduced their asking
price overall and 28 percent reduced the asking price only
once. For homes on the market for 17 weeks or more, only 14
percent were sold at the initial asking price, which is up from
13 percent the year before.
Incentives To Prospective Buyers
• Exhibits 6–37 and 6–38
Thirty-six percent of all sellers offered incentives to attract
buyers. This varies by region, and was the most common in
the South and Midwest and less likely in the Northeast and
West. Home warranty policies followed by assistance with
closing costs were the top two listed incentives when selling
a home. As to be expected, the longer a home is on the
market, the more likely the seller is to add an incentive. For
homes that were listed on the market for over 17 weeks, 46
percent (down from 55 percent last year) offered some kind
of incentive compared to only 17 percent of homes that were
listed for less than one week.
Equity by Tenure
• Exhibit 6–39
This year, home sellers cited that they sold their homes for
a median of $43,100 more than they purchased it, up from
$40,000 the year prior. This accounts for a 24 percent price
gain, up from 23 percent the year before. Generally, the longer
a seller is in the home the greater the increase attributable
to price appreciation. Sellers who owned their homes for two
to seven years, all reported roughly selling their homes for
$30-45,000 more than they purchased it. That number drops
drastically to only $5,000 between eight and 10 years, and
then appreciates steadily. Homes sold after 21 years reported
a price gain of $127,600, down from $138,000 last year.
Satisfaction With Sales Process
• Exhibit 6–40
Sixty-one percent of sellers were ‘very satisfied’ with the
selling process, the same as the year prior. Twenty-seven
percent were somewhat satisfied, also consistent with last
year. Thirteen percent were dissatisfied with the process.
NAR has collected data on the median tenure in the home since 1985. In 2016, the median tenure
for sellers was 10 years. In 1985, the median tenure was just five years.
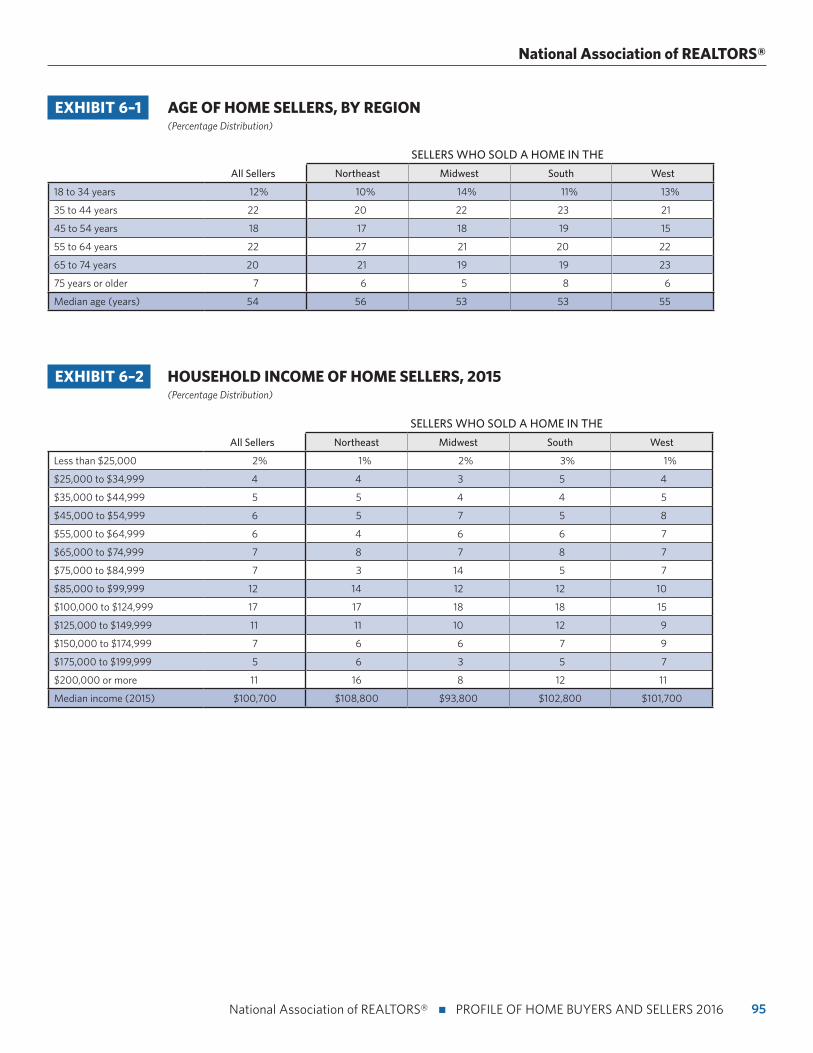
95 National Association of REALTORS® n PROFILE OF HOME BUYERS AND SELLERS 2016
National Association of REALTORS®
EXHIBIT 6–1 AGE OF HOME SELLERS, BY REGION (Percentage Distribution)
SELLERS WHO SOLD A HOME IN THE
All Sellers Northeast Midwest South West
18 to 34 years 12% 10% 14% 11% 13%
35 to 44 years 22 20 22 23 21
45 to 54 years 18 17 18 19 15
55 to 64 years 22 27 21 20 22
65 to 74 years 20 21 19 19 23
75 years or older 7 6 5 8 6
Median age (years) 54 56 53 53 55
EXHIBIT 6–2 HOUSEHOLD INCOME OF HOME SELLERS, 2015 (Percentage Distribution)
SELLERS WHO SOLD A HOME IN THE
All Sellers Northeast Midwest South West
Less than $25,000 2% 1% 2% 3% 1%
$25,000 to $34,999 4 4 3 5 4
$35,000 to $44,999 5 5 4 4 5
$45,000 to $54,999 6 5 7 5 8
$55,000 to $64,999 6 4 6 6 7
$65,000 to $74,999 7 8 7 8 7
$75,000 to $84,999 7 3 14 5 7
$85,000 to $99,999 12 14 12 12 10
$100,000 to $124,999 17 17 18 18 15
$125,000 to $149,999 11 11 10 12 9
$150,000 to $174,999 7 6 6 7 9
$175,000 to $199,999 5 6 3 5 7
$200,000 or more 11 16 8 12 11
Median income (2015) $100,700 $108,800 $93,800 $102,800 $101,700
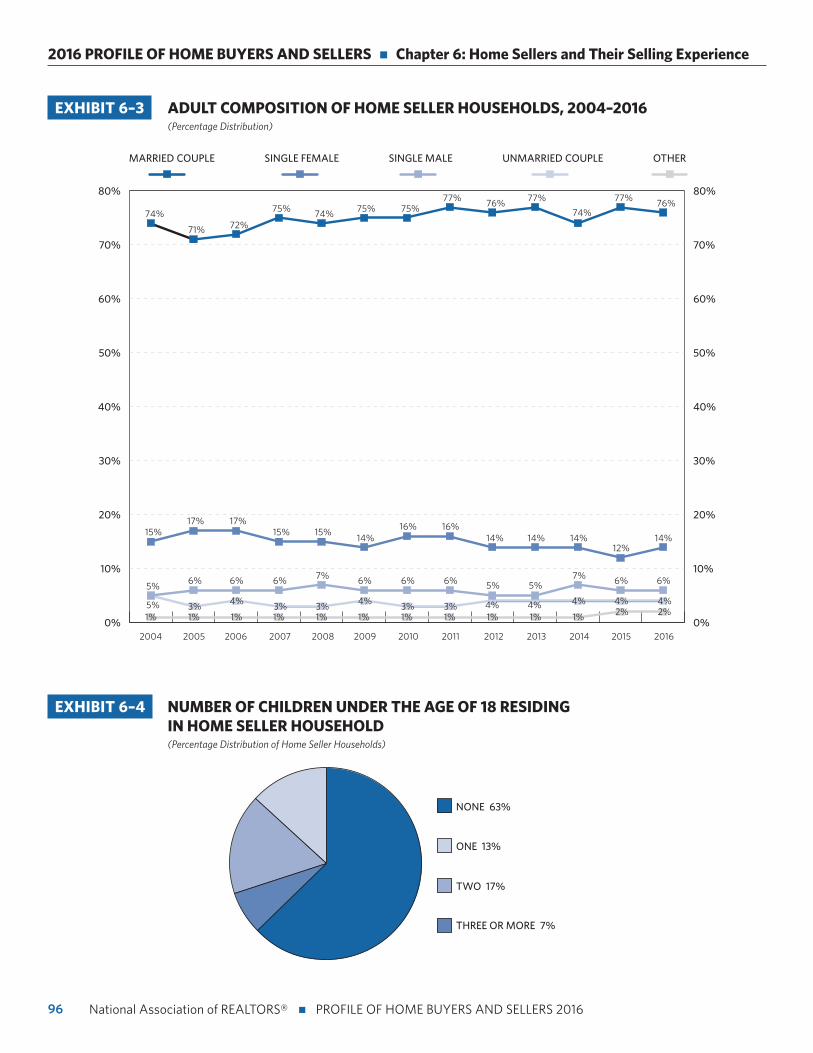
96
2016 PROFILE OF HOME BUYERS AND SELLERS n Chapter 6: Home Sellers and Their Selling Experience
National Association of REALTORS® n PROFILE OF HOME BUYERS AND SELLERS 2016
EXHIBIT 6–4 NUMBER OF CHILDREN UNDER THE AGE OF 18 RESIDING IN HOME SELLER HOUSEHOLD (Percentage Distribution of Home Seller Households)
NONE 63%
THREE OR MORE 7%
TWO 17%
ONE 13%
EXHIBIT 6–3 ADULT COMPOSITION OF HOME SELLER HOUSEHOLDS, 2004–2016 (Percentage Distribution)
0%
10%
20%
30%
40%
50%
60%
70%
80%
0%
10%
20%
30%
40%
50%
60%
70%
80%
2005 2006 2007 2008 2009 2010 2011 2012 2013 2014 20162004
74%
71% 72%
75% 74% 75% 75%77% 76% 77%
74%
15%17% 17%
15% 15%14%
16% 16%14% 14% 14%
12%
4%
5%6% 6% 6% 7% 6% 6% 6% 5% 5%
7%
1% 2%
6%
4%3% 4% 3% 3% 4% 3% 3% 4% 4%
1%1%1%1%1%1%1%1%1%1%5%
OTHERUNMARRIED COUPLESINGLE MALESINGLE FEMALEMARRIED COUPLE
2015
77% 76%
14%
6%
2%4%
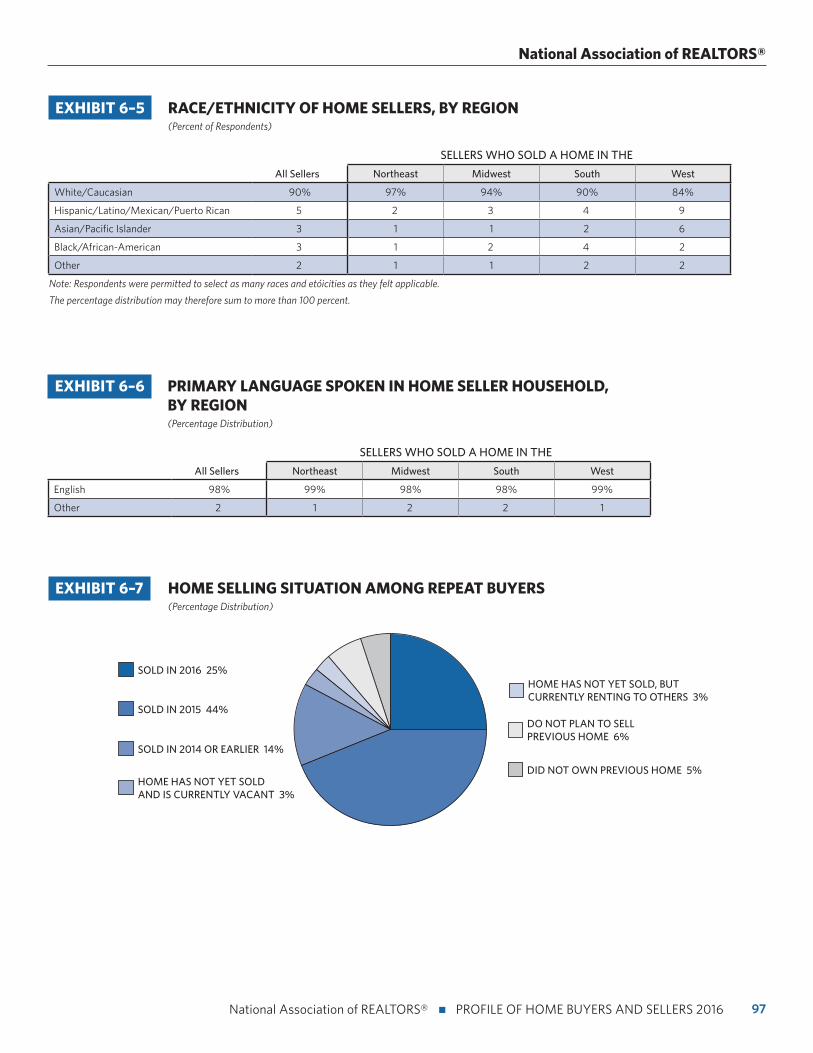
97 National Association of REALTORS® n PROFILE OF HOME BUYERS AND SELLERS 2016
National Association of REALTORS®
EXHIBIT 6–7 HOME SELLING SITUATION AMONG REPEAT BUYERS (Percentage Distribution)
HOME HAS NOT YET SOLD, BUT CURRENTLY RENTING TO OTHERS 3%
HOME HAS NOT YET SOLD AND IS CURRENTLY VACANT 3%
SOLD IN 2014 OR EARLIER 14%
SOLD IN 2016 25%
SOLD IN 2015 44%DO NOT PLAN TO SELL PREVIOUS HOME 6%
DID NOT OWN PREVIOUS HOME 5%
EXHIBIT 6–5 RACE/ETHNICITY OF HOME SELLERS, BY REGION (Percent of Respondents)
SELLERS WHO SOLD A HOME IN THE
All Sellers Northeast Midwest South West
White/Caucasian 90% 97% 94% 90% 84%
Hispanic/Latino/Mexican/Puerto Rican 5 2 3 4 9
Asian/Pacific Islander 3 1 1 2 6
Black/African-American 3 1 2 4 2
Other 2 1 1 2 2
Note: Respondents were permitted to select as many races and ethnicities as they felt applicable.
The percentage distribution may therefore sum to more than 100 percent.
EXHIBIT 6–6 PRIMARY LANGUAGE SPOKEN IN HOME SELLER HOUSEHOLD, BY REGION (Percentage Distribution)
SELLERS WHO SOLD A HOME IN THE
All Sellers Northeast Midwest South West
English 98% 99% 98% 98% 99%
Other 2 1 2 2 1
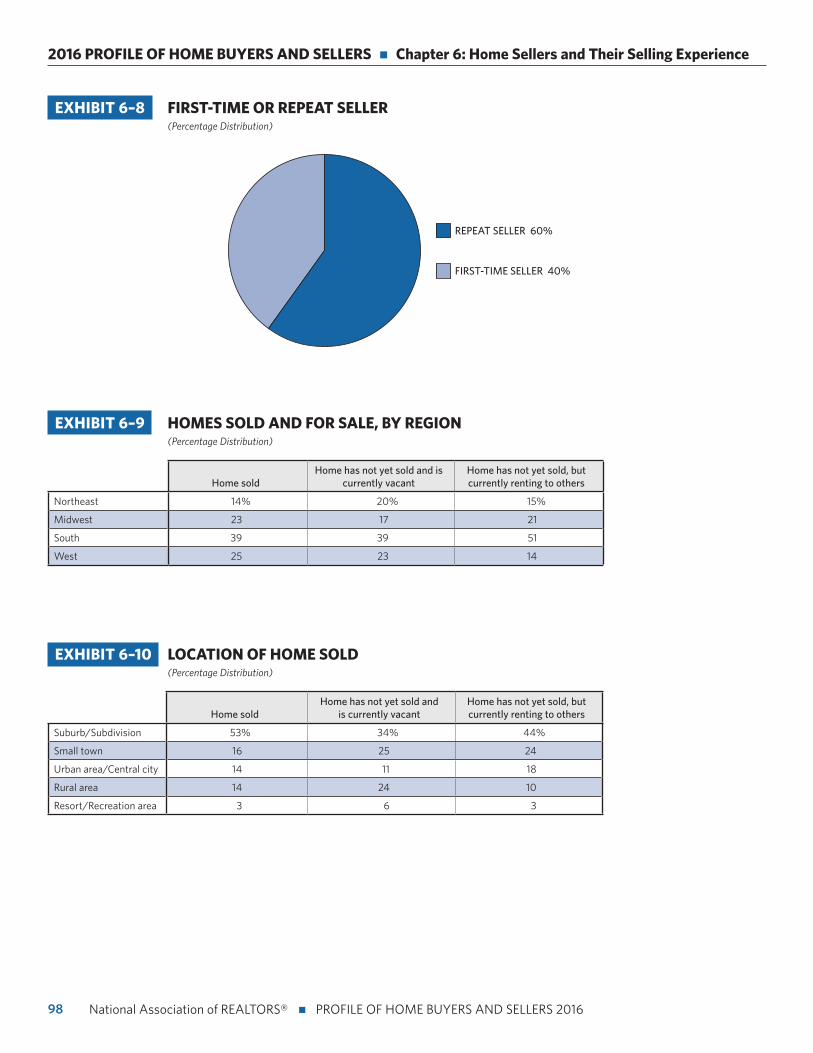
98
2016 PROFILE OF HOME BUYERS AND SELLERS n Chapter 6: Home Sellers and Their Selling Experience
National Association of REALTORS® n PROFILE OF HOME BUYERS AND SELLERS 2016
EXHIBIT 6–8 FIRST-TIME OR REPEAT SELLER (Percentage Distribution)
REPEAT SELLER 60%
FIRST-TIME SELLER 40%
EXHIBIT 6–9 HOMES SOLD AND FOR SALE, BY REGION (Percentage Distribution)
Home soldHome has not yet sold and is
currently vacantHome has not yet sold, but currently renting to others
Northeast 14% 20% 15%
Midwest 23 17 21
South 39 39 51
West 25 23 14
EXHIBIT 6–10 LOCATION OF HOME SOLD (Percentage Distribution)
Home soldHome has not yet sold and
is currently vacantHome has not yet sold, but currently renting to others
Suburb/Subdivision 53% 34% 44%
Small town 16 25 24
Urban area/Central city 14 11 18
Rural area 14 24 10
Resort/Recreation area 3 6 3
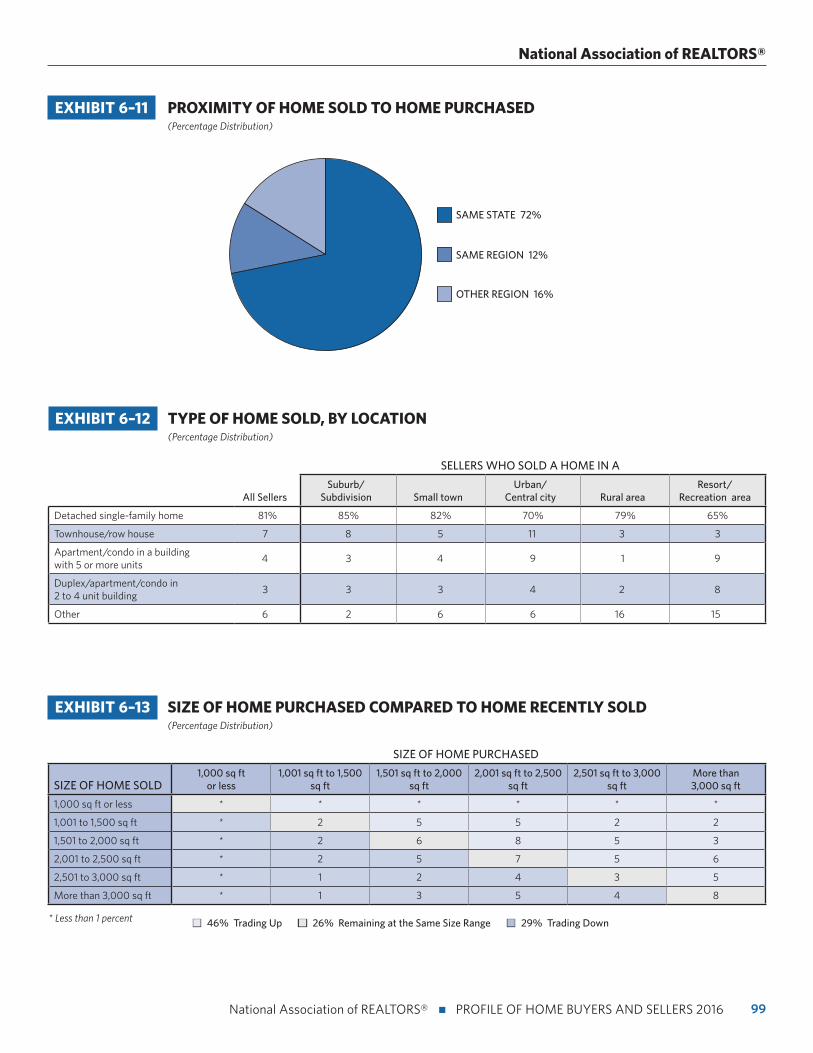
99 National Association of REALTORS® n PROFILE OF HOME BUYERS AND SELLERS 2016
National Association of REALTORS®
EXHIBIT 6–11 PROXIMITY OF HOME SOLD TO HOME PURCHASED (Percentage Distribution)
OTHER REGION 16%
SAME STATE 72%
SAME REGION 12%
EXHIBIT 6–12 TYPE OF HOME SOLD, BY LOCATION (Percentage Distribution)
SELLERS WHO SOLD A HOME IN A
All SellersSuburb/
Subdivision Small townUrban/
Central city Rural areaResort/
Recreation area
Detached single-family home 81% 85% 82% 70% 79% 65%
Townhouse/row house 7 8 5 11 3 3
Apartment/condo in a building with 5 or more units
4 3 4 9 1 9
Duplex/apartment/condo in 2 to 4 unit building
3 3 3 4 2 8
Other 6 2 6 6 16 15
EXHIBIT 6–13 SIZE OF HOME PURCHASED COMPARED TO HOME RECENTLY SOLD (Percentage Distribution)
SIZE OF HOME PURCHASED
SIZE OF HOME SOLD1,000 sq ft
or less1,001 sq ft to 1,500
sq ft1,501 sq ft to 2,000
sq ft2,001 sq ft to 2,500
sq ft2,501 sq ft to 3,000
sq ftMore than 3,000 sq ft
1,000 sq ft or less * * * * * *
1,001 to 1,500 sq ft * 2 5 5 2 2
1,501 to 2,000 sq ft * 2 6 8 5 3
2,001 to 2,500 sq ft * 2 5 7 5 6
2,501 to 3,000 sq ft * 1 2 4 3 5
More than 3,000 sq ft * 1 3 5 4 8
* Less than 1 percent n 46% Trading Up n 26% Remaining at the Same Size Range n 29% Trading Down
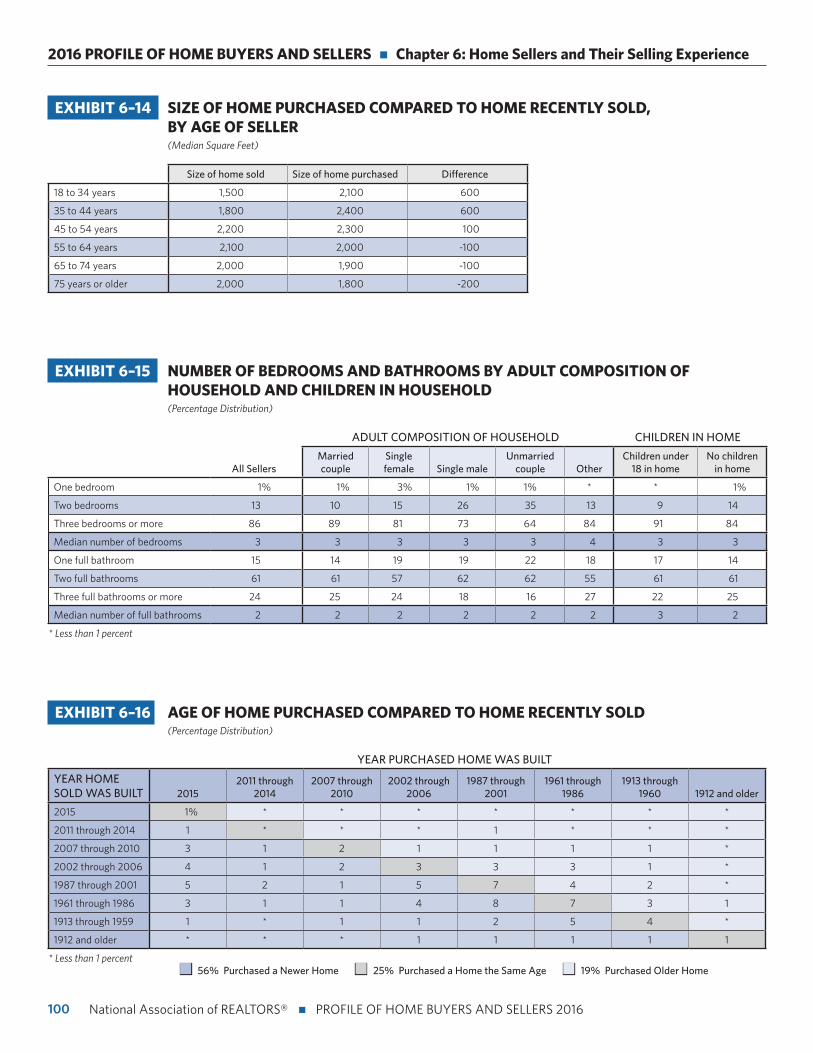
100
2016 PROFILE OF HOME BUYERS AND SELLERS n Chapter 6: Home Sellers and Their Selling Experience
National Association of REALTORS® n PROFILE OF HOME BUYERS AND SELLERS 2016
EXHIBIT 6–14 SIZE OF HOME PURCHASED COMPARED TO HOME RECENTLY SOLD, BY AGE OF SELLER (Median Square Feet)
Size of home sold Size of home purchased Difference
18 to 34 years 1,500 2,100 600
35 to 44 years 1,800 2,400 600
45 to 54 years 2,200 2,300 100
55 to 64 years 2,100 2,000 -100
65 to 74 years 2,000 1,900 -100
75 years or older 2,000 1,800 -200
EXHIBIT 6–15 NUMBER OF BEDROOMS AND BATHROOMS BY ADULT COMPOSITION OF HOUSEHOLD AND CHILDREN IN HOUSEHOLD (Percentage Distribution)
ADULT COMPOSITION OF HOUSEHOLD CHILDREN IN HOME
All SellersMarried couple
Single female Single male
Unmarried couple Other
Children under 18 in home
No children in home
One bedroom 1% 1% 3% 1% 1% * * 1%
Two bedrooms 13 10 15 26 35 13 9 14
Three bedrooms or more 86 89 81 73 64 84 91 84
Median number of bedrooms 3 3 3 3 3 4 3 3
One full bathroom 15 14 19 19 22 18 17 14
Two full bathrooms 61 61 57 62 62 55 61 61
Three full bathrooms or more 24 25 24 18 16 27 22 25
Median number of full bathrooms 2 2 2 2 2 2 3 2
* Less than 1 percent
EXHIBIT 6–16 AGE OF HOME PURCHASED COMPARED TO HOME RECENTLY SOLD (Percentage Distribution)
YEAR PURCHASED HOME WAS BUILT
YEAR HOME SOLD WAS BUILT 2015
2011 through 2014
2007 through 2010
2002 through 2006
1987 through 2001
1961 through 1986
1913 through 1960 1912 and older
2015 1% * * * * * * *
2011 through 2014 1 * * * 1 * * *
2007 through 2010 3 1 2 1 1 1 1 *
2002 through 2006 4 1 2 3 3 3 1 *
1987 through 2001 5 2 1 5 7 4 2 *
1961 through 1986 3 1 1 4 8 7 3 1
1913 through 1959 1 * 1 1 2 5 4 *
1912 and older * * * 1 1 1 1 1
* Less than 1 percentn 56% Purchased a Newer Home n 25% Purchased a Home the Same Age n 19% Purchased Older Home
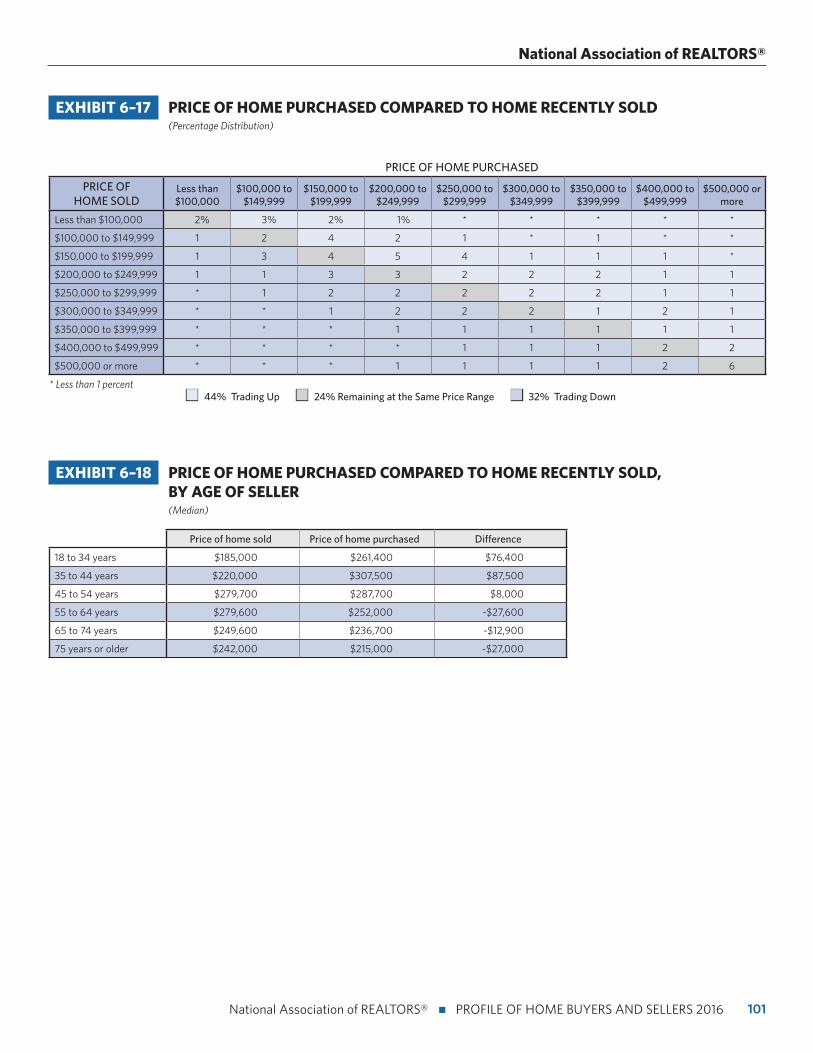
101 National Association of REALTORS® n PROFILE OF HOME BUYERS AND SELLERS 2016
National Association of REALTORS®
EXHIBIT 6–17 PRICE OF HOME PURCHASED COMPARED TO HOME RECENTLY SOLD (Percentage Distribution)
PRICE OF HOME PURCHASED
PRICE OF HOME SOLD
Less than $100,000
$100,000 to $149,999
$150,000 to $199,999
$200,000 to $249,999
$250,000 to $299,999
$300,000 to $349,999
$350,000 to $399,999
$400,000 to $499,999
$500,000 or more
Less than $100,000 2% 3% 2% 1% * * * * *
$100,000 to $149,999 1 2 4 2 1 * 1 * *
$150,000 to $199,999 1 3 4 5 4 1 1 1 *
$200,000 to $249,999 1 1 3 3 2 2 2 1 1
$250,000 to $299,999 * 1 2 2 2 2 2 1 1
$300,000 to $349,999 * * 1 2 2 2 1 2 1
$350,000 to $399,999 * * * 1 1 1 1 1 1
$400,000 to $499,999 * * * * 1 1 1 2 2
$500,000 or more * * * 1 1 1 1 2 6
* Less than 1 percent
EXHIBIT 6–18 PRICE OF HOME PURCHASED COMPARED TO HOME RECENTLY SOLD, BY AGE OF SELLER (Median)
Price of home sold Price of home purchased Difference
18 to 34 years $185,000 $261,400 $76,400
35 to 44 years $220,000 $307,500 $87,500
45 to 54 years $279,700 $287,700 $8,000
55 to 64 years $279,600 $252,000 -$27,600
65 to 74 years $249,600 $236,700 -$12,900
75 years or older $242,000 $215,000 -$27,000
n 44% Trading Up n 24% Remaining at the Same Price Range n 32% Trading Down
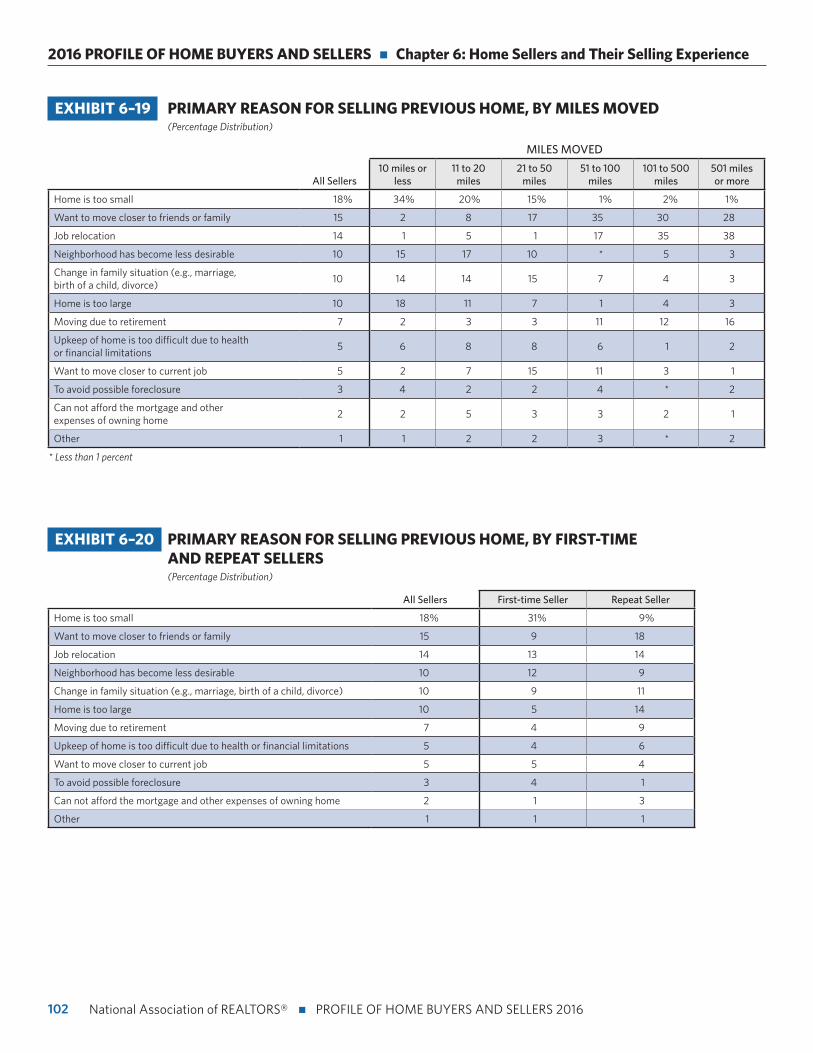
102
2016 PROFILE OF HOME BUYERS AND SELLERS n Chapter 6: Home Sellers and Their Selling Experience
National Association of REALTORS® n PROFILE OF HOME BUYERS AND SELLERS 2016
EXHIBIT 6–19 PRIMARY REASON FOR SELLING PREVIOUS HOME, BY MILES MOVED (Percentage Distribution)
MILES MOVED
All Sellers10 miles or
less11 to 20
miles21 to 50
miles51 to 100
miles101 to 500
miles501 miles or more
Home is too small 18% 34% 20% 15% 1% 2% 1%
Want to move closer to friends or family 15 2 8 17 35 30 28
Job relocation 14 1 5 1 17 35 38
Neighborhood has become less desirable 10 15 17 10 * 5 3
Change in family situation (e.g., marriage, birth of a child, divorce)
10 14 14 15 7 4 3
Home is too large 10 18 11 7 1 4 3
Moving due to retirement 7 2 3 3 11 12 16
Upkeep of home is too difficult due to health or financial limitations
5 6 8 8 6 1 2
Want to move closer to current job 5 2 7 15 11 3 1
To avoid possible foreclosure 3 4 2 2 4 * 2
Can not afford the mortgage and other expenses of owning home
2 2 5 3 3 2 1
Other 1 1 2 2 3 * 2
* Less than 1 percent
EXHIBIT 6–20 PRIMARY REASON FOR SELLING PREVIOUS HOME, BY FIRST-TIME AND REPEAT SELLERS (Percentage Distribution)
All Sellers First-time Seller Repeat Seller
Home is too small 18% 31% 9%
Want to move closer to friends or family 15 9 18
Job relocation 14 13 14
Neighborhood has become less desirable 10 12 9
Change in family situation (e.g., marriage, birth of a child, divorce) 10 9 11
Home is too large 10 5 14
Moving due to retirement 7 4 9
Upkeep of home is too difficult due to health or financial limitations 5 4 6
Want to move closer to current job 5 5 4
To avoid possible foreclosure 3 4 1
Can not afford the mortgage and other expenses of owning home 2 1 3
Other 1 1 1
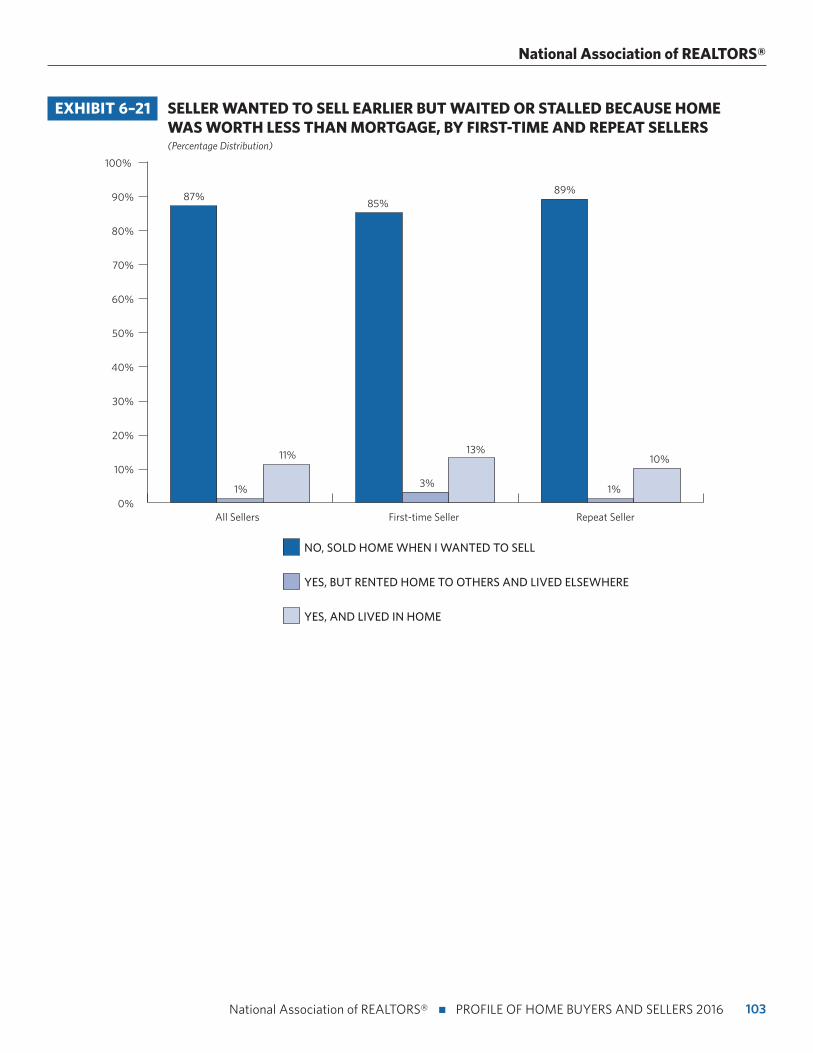
103 National Association of REALTORS® n PROFILE OF HOME BUYERS AND SELLERS 2016
National Association of REALTORS®
EXHIBIT 6–21 SELLER WANTED TO SELL EARLIER BUT WAITED OR STALLED BECAUSE HOME WAS WORTH LESS THAN MORTGAGE, BY FIRST-TIME AND REPEAT SELLERS (Percentage Distribution)
0%
10%
20%
30%
40%
50%
60%
70%
80%
90%
100%
87%
11%
89%
All Sellers First-time Seller Repeat Seller
1%
85%
YES, BUT RENTED HOME TO OTHERS AND LIVED ELSEWHERE
YES, AND LIVED IN HOME
3% 1%
13%10%
NO, SOLD HOME WHEN I WANTED TO SELL
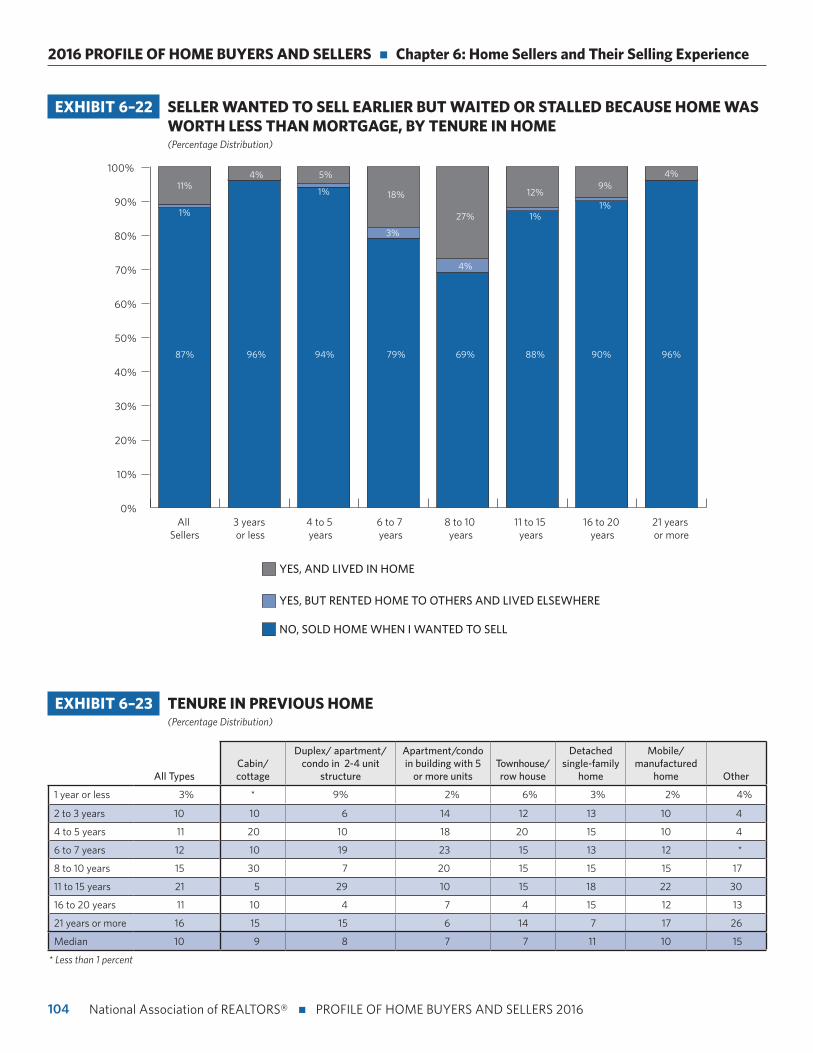
104
2016 PROFILE OF HOME BUYERS AND SELLERS n Chapter 6: Home Sellers and Their Selling Experience
National Association of REALTORS® n PROFILE OF HOME BUYERS AND SELLERS 2016
0%
10%
20%
30%
40%
50%
60%
70%
80%
90%
100%
11%4%
79%
12%
90%
All Sellers
3 years or less
YES, BUT RENTED HOME TO OTHERS AND LIVED ELSEWHERE
YES, AND LIVED IN HOME
NO, SOLD HOME WHEN I WANTED TO SELL
5%
4%
69%
4%
94%
3%
88% 96%
1%
96%
18%1%
1%
87%
27%
9%
1%
21 years or more
4 to 5 years
6 to 7 years
8 to 10 years
11 to 15 years
16 to 20 years
EXHIBIT 6–22 SELLER WANTED TO SELL EARLIER BUT WAITED OR STALLED BECAUSE HOME WAS WORTH LESS THAN MORTGAGE, BY TENURE IN HOME (Percentage Distribution)
EXHIBIT 6–23 TENURE IN PREVIOUS HOME (Percentage Distribution)
All TypesCabin/ cottage
Duplex/ apartment/condo in 2-4 unit
structure
Apartment/condo in building with 5
or more unitsTownhouse/ row house
Detached single-family
home
Mobile/ manufactured
home Other
1 year or less 3% * 9% 2% 6% 3% 2% 4%
2 to 3 years 10 10 6 14 12 13 10 4
4 to 5 years 11 20 10 18 20 15 10 4
6 to 7 years 12 10 19 23 15 13 12 *
8 to 10 years 15 30 7 20 15 15 15 17
11 to 15 years 21 5 29 10 15 18 22 30
16 to 20 years 11 10 4 7 4 15 12 13
21 years or more 16 15 15 6 14 7 17 26
Median 10 9 8 7 7 11 10 15
* Less than 1 percent
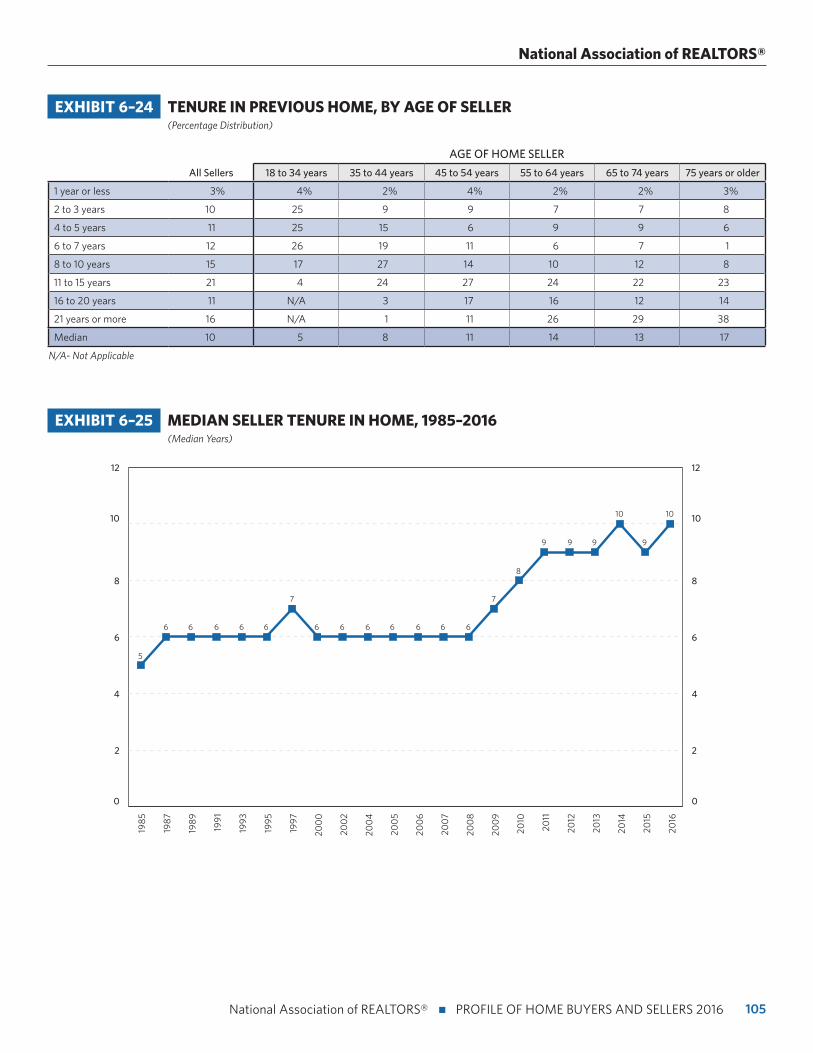
105 National Association of REALTORS® n PROFILE OF HOME BUYERS AND SELLERS 2016
National Association of REALTORS®
EXHIBIT 6–24 TENURE IN PREVIOUS HOME, BY AGE OF SELLER (Percentage Distribution)
AGE OF HOME SELLER
All Sellers 18 to 34 years 35 to 44 years 45 to 54 years 55 to 64 years 65 to 74 years 75 years or older
1 year or less 3% 4% 2% 4% 2% 2% 3%
2 to 3 years 10 25 9 9 7 7 8
4 to 5 years 11 25 15 6 9 9 6
6 to 7 years 12 26 19 11 6 7 1
8 to 10 years 15 17 27 14 10 12 8
11 to 15 years 21 4 24 27 24 22 23
16 to 20 years 11 N/A 3 17 16 12 14
21 years or more 16 N/A 1 11 26 29 38
Median 10 5 8 11 14 13 17
N/A- Not Applicable
EXHIBIT 6–25 MEDIAN SELLER TENURE IN HOME, 1985–2016 (Median Years)
0
2
4
6
8
10
12
0
2
4
6
8
10
12
5
6
198
5
1987
1989
1991
1993
1995
1997
200
0
200
2
200
4
200
5
200
6
200
7
200
8
200
9
2010
2011
2012
2013
2014
2015
2016
6 6 6 6
7
6 6 6 6 6 6 6
7
8
9 9 9 9
10 10
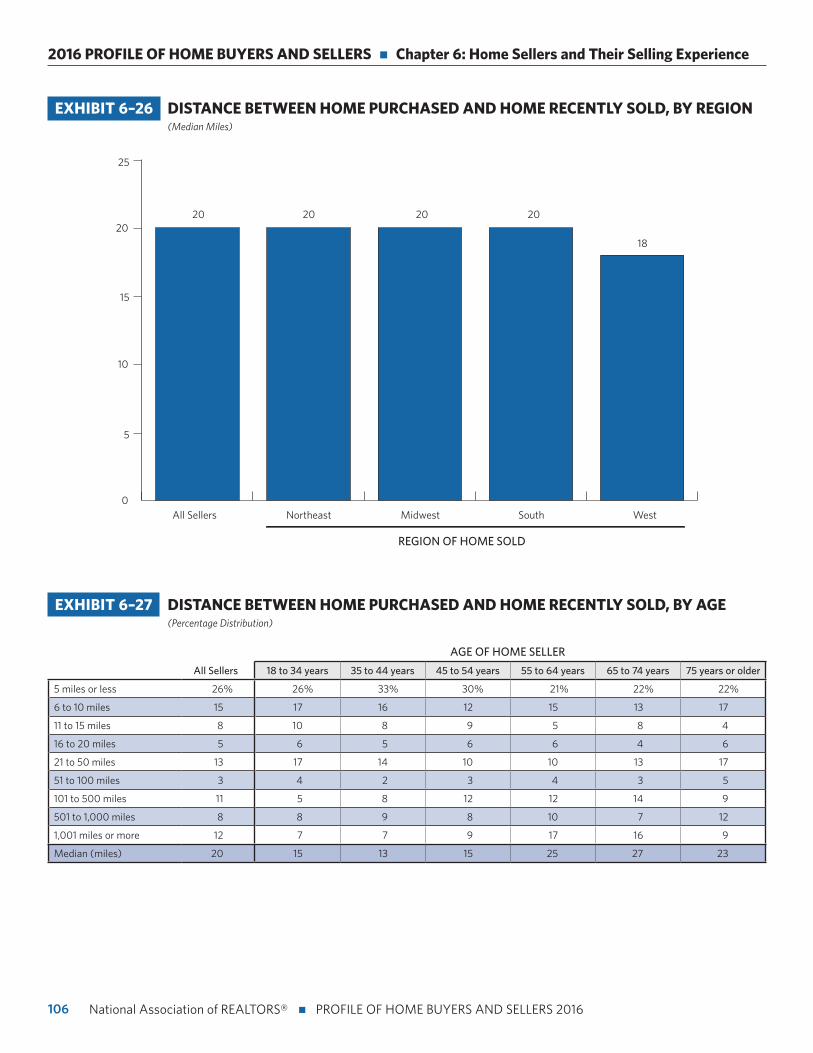
106
2016 PROFILE OF HOME BUYERS AND SELLERS n Chapter 6: Home Sellers and Their Selling Experience
National Association of REALTORS® n PROFILE OF HOME BUYERS AND SELLERS 2016
EXHIBIT 6–26 DISTANCE BETWEEN HOME PURCHASED AND HOME RECENTLY SOLD, BY REGION (Median Miles)
0
5
10
15
20
25
20 20 20 20
18
All Sellers Northeast Midwest South West
REGION OF HOME SOLD
EXHIBIT 6–27 DISTANCE BETWEEN HOME PURCHASED AND HOME RECENTLY SOLD, BY AGE (Percentage Distribution)
AGE OF HOME SELLER
All Sellers 18 to 34 years 35 to 44 years 45 to 54 years 55 to 64 years 65 to 74 years 75 years or older
5 miles or less 26% 26% 33% 30% 21% 22% 22%
6 to 10 miles 15 17 16 12 15 13 17
11 to 15 miles 8 10 8 9 5 8 4
16 to 20 miles 5 6 5 6 6 4 6
21 to 50 miles 13 17 14 10 10 13 17
51 to 100 miles 3 4 2 3 4 3 5
101 to 500 miles 11 5 8 12 12 14 9
501 to 1,000 miles 8 8 9 8 10 7 12
1,001 miles or more 12 7 7 9 17 16 9
Median (miles) 20 15 13 15 25 27 23
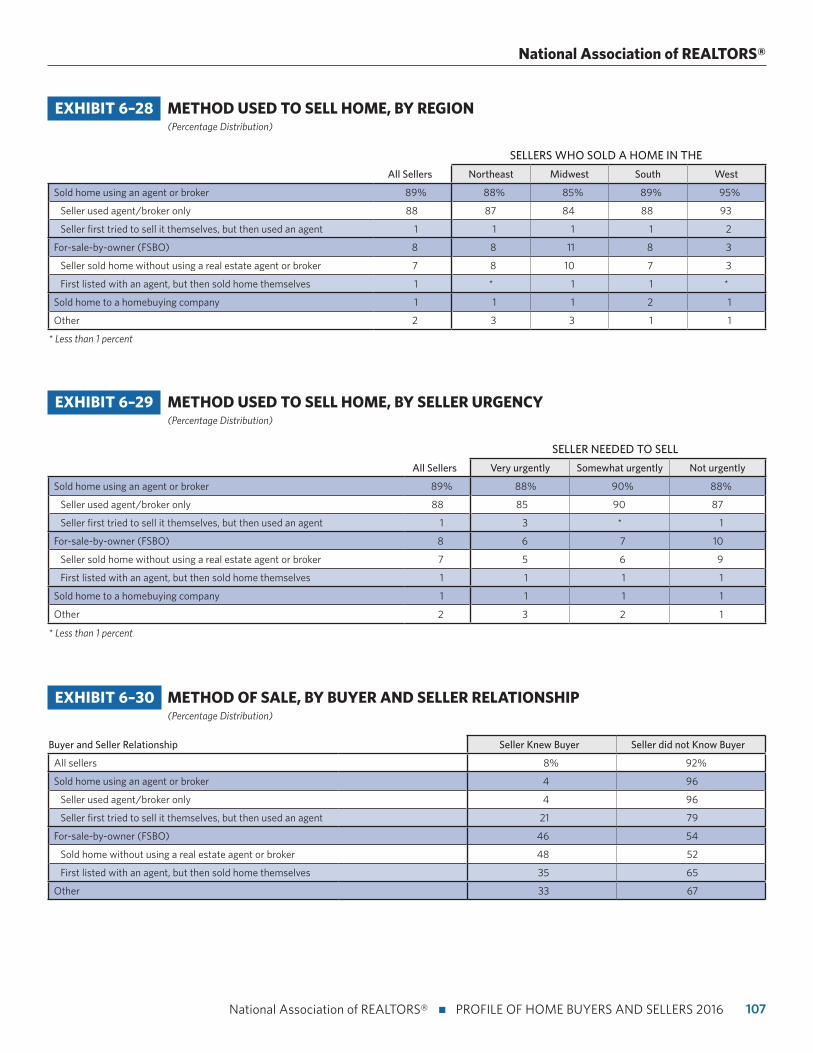
107 National Association of REALTORS® n PROFILE OF HOME BUYERS AND SELLERS 2016
National Association of REALTORS®
EXHIBIT 6–28 METHOD USED TO SELL HOME, BY REGION (Percentage Distribution)
SELLERS WHO SOLD A HOME IN THE
All Sellers Northeast Midwest South West
Sold home using an agent or broker 89% 88% 85% 89% 95%
Seller used agent/broker only 88 87 84 88 93
Seller first tried to sell it themselves, but then used an agent 1 1 1 1 2
For-sale-by-owner (FSBO) 8 8 11 8 3
Seller sold home without using a real estate agent or broker 7 8 10 7 3
First listed with an agent, but then sold home themselves 1 * 1 1 *
Sold home to a homebuying company 1 1 1 2 1
Other 2 3 3 1 1
* Less than 1 percent
EXHIBIT 6–29 METHOD USED TO SELL HOME, BY SELLER URGENCY (Percentage Distribution)
SELLER NEEDED TO SELL
All Sellers Very urgently Somewhat urgently Not urgently
Sold home using an agent or broker 89% 88% 90% 88%
Seller used agent/broker only 88 85 90 87
Seller first tried to sell it themselves, but then used an agent 1 3 * 1
For-sale-by-owner (FSBO) 8 6 7 10
Seller sold home without using a real estate agent or broker 7 5 6 9
First listed with an agent, but then sold home themselves 1 1 1 1
Sold home to a homebuying company 1 1 1 1
Other 2 3 2 1
* Less than 1 percent
EXHIBIT 6–30 METHOD OF SALE, BY BUYER AND SELLER RELATIONSHIP (Percentage Distribution)
Buyer and Seller Relationship Seller Knew Buyer Seller did not Know Buyer
All sellers 8% 92%
Sold home using an agent or broker 4 96
Seller used agent/broker only 4 96
Seller first tried to sell it themselves, but then used an agent 21 79
For-sale-by-owner (FSBO) 46 54
Sold home without using a real estate agent or broker 48 52
First listed with an agent, but then sold home themselves 35 65
Other 33 67
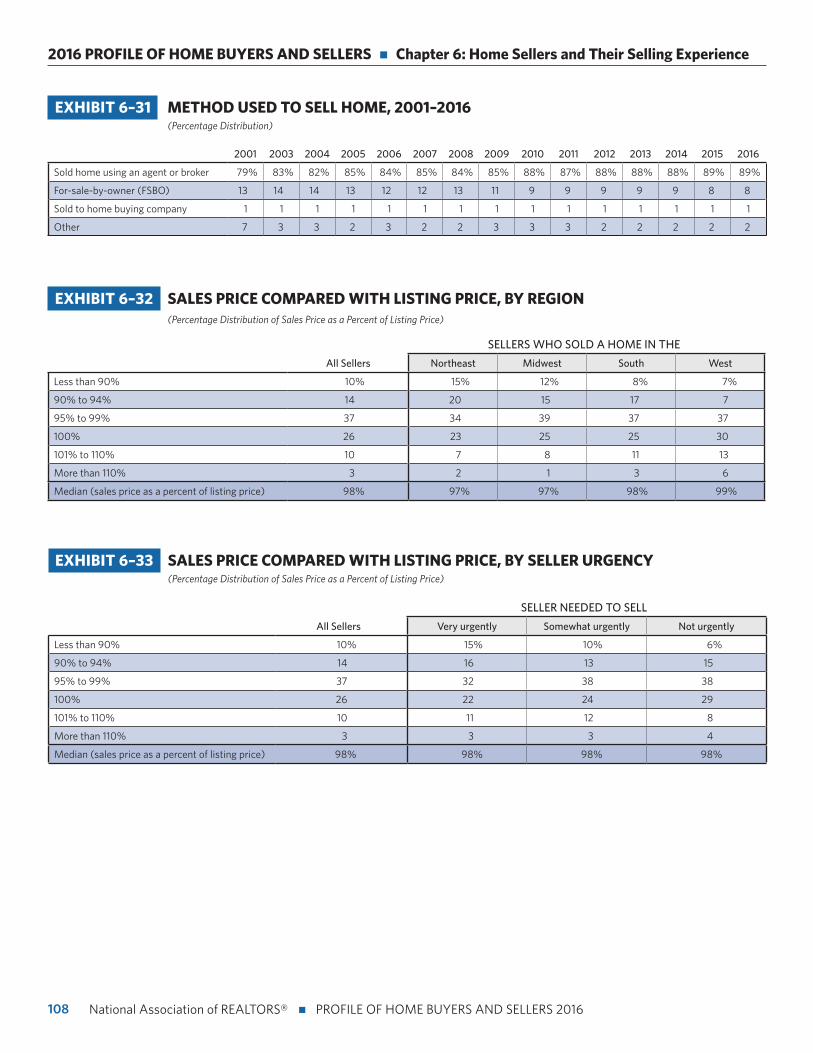
108
2016 PROFILE OF HOME BUYERS AND SELLERS n Chapter 6: Home Sellers and Their Selling Experience
National Association of REALTORS® n PROFILE OF HOME BUYERS AND SELLERS 2016
EXHIBIT 6–33 SALES PRICE COMPARED WITH LISTING PRICE, BY SELLER URGENCY (Percentage Distribution of Sales Price as a Percent of Listing Price)
SELLER NEEDED TO SELL
All Sellers Very urgently Somewhat urgently Not urgently
Less than 90% 10% 15% 10% 6%
90% to 94% 14 16 13 15
95% to 99% 37 32 38 38
100% 26 22 24 29
101% to 110% 10 11 12 8
More than 110% 3 3 3 4
Median (sales price as a percent of listing price) 98% 98% 98% 98%
EXHIBIT 6–31 METHOD USED TO SELL HOME, 2001–2016 (Percentage Distribution)
2001 2003 2004 2005 2006 2007 2008 2009 2010 2011 2012 2013 2014 2015 2016
Sold home using an agent or broker 79% 83% 82% 85% 84% 85% 84% 85% 88% 87% 88% 88% 88% 89% 89%
For-sale-by-owner (FSBO) 13 14 14 13 12 12 13 11 9 9 9 9 9 8 8
Sold to home buying company 1 1 1 1 1 1 1 1 1 1 1 1 1 1 1
Other 7 3 3 2 3 2 2 3 3 3 2 2 2 2 2
EXHIBIT 6–32 SALES PRICE COMPARED WITH LISTING PRICE, BY REGION (Percentage Distribution of Sales Price as a Percent of Listing Price)
SELLERS WHO SOLD A HOME IN THE
All Sellers Northeast Midwest South West
Less than 90% 10% 15% 12% 8% 7%
90% to 94% 14 20 15 17 7
95% to 99% 37 34 39 37 37
100% 26 23 25 25 30
101% to 110% 10 7 8 11 13
More than 110% 3 2 1 3 6
Median (sales price as a percent of listing price) 98% 97% 97% 98% 99%
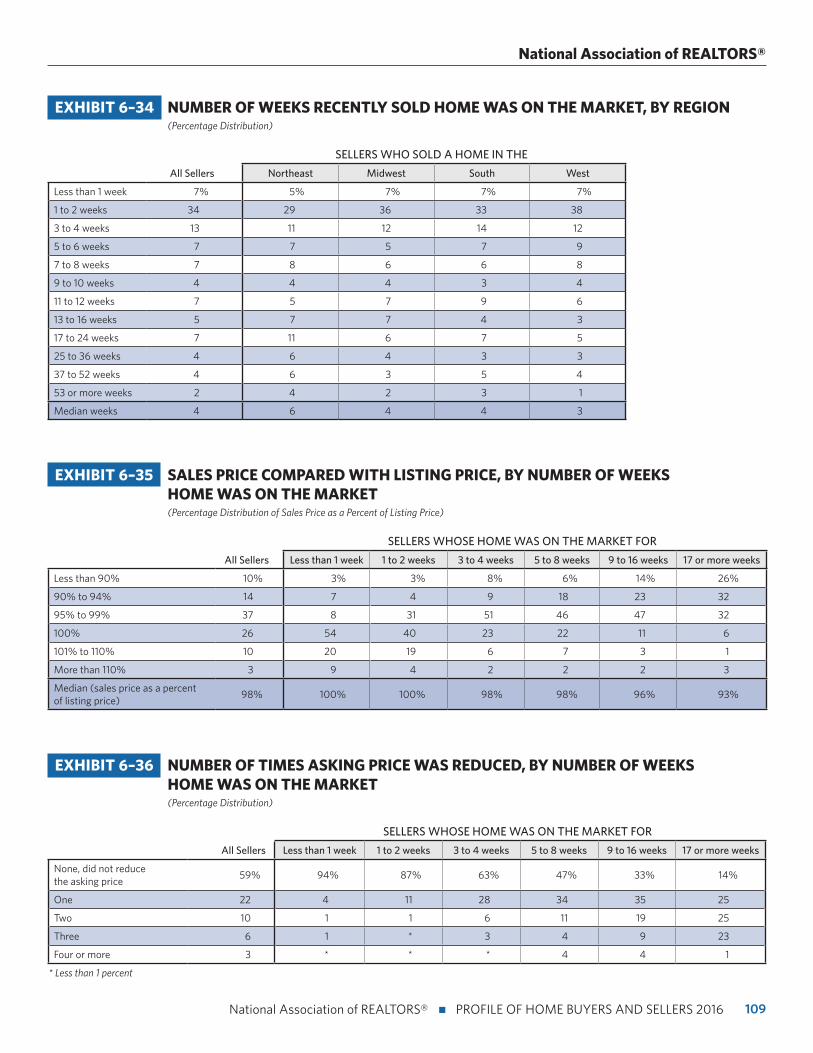
109 National Association of REALTORS® n PROFILE OF HOME BUYERS AND SELLERS 2016
National Association of REALTORS®
EXHIBIT 6–35 SALES PRICE COMPARED WITH LISTING PRICE, BY NUMBER OF WEEKS HOME WAS ON THE MARKET (Percentage Distribution of Sales Price as a Percent of Listing Price)
SELLERS WHOSE HOME WAS ON THE MARKET FOR
All Sellers Less than 1 week 1 to 2 weeks 3 to 4 weeks 5 to 8 weeks 9 to 16 weeks 17 or more weeks
Less than 90% 10% 3% 3% 8% 6% 14% 26%
90% to 94% 14 7 4 9 18 23 32
95% to 99% 37 8 31 51 46 47 32
100% 26 54 40 23 22 11 6
101% to 110% 10 20 19 6 7 3 1
More than 110% 3 9 4 2 2 2 3
Median (sales price as a percent of listing price)
98% 100% 100% 98% 98% 96% 93%
EXHIBIT 6–36 NUMBER OF TIMES ASKING PRICE WAS REDUCED, BY NUMBER OF WEEKS HOME WAS ON THE MARKET (Percentage Distribution)
SELLERS WHOSE HOME WAS ON THE MARKET FOR
All Sellers Less than 1 week 1 to 2 weeks 3 to 4 weeks 5 to 8 weeks 9 to 16 weeks 17 or more weeks
None, did not reduce the asking price
59% 94% 87% 63% 47% 33% 14%
One 22 4 11 28 34 35 25
Two 10 1 1 6 11 19 25
Three 6 1 * 3 4 9 23
Four or more 3 * * * 4 4 1
* Less than 1 percent
EXHIBIT 6–34 NUMBER OF WEEKS RECENTLY SOLD HOME WAS ON THE MARKET, BY REGION (Percentage Distribution)
SELLERS WHO SOLD A HOME IN THE
All Sellers Northeast Midwest South West
Less than 1 week 7% 5% 7% 7% 7%
1 to 2 weeks 34 29 36 33 38
3 to 4 weeks 13 11 12 14 12
5 to 6 weeks 7 7 5 7 9
7 to 8 weeks 7 8 6 6 8
9 to 10 weeks 4 4 4 3 4
11 to 12 weeks 7 5 7 9 6
13 to 16 weeks 5 7 7 4 3
17 to 24 weeks 7 11 6 7 5
25 to 36 weeks 4 6 4 3 3
37 to 52 weeks 4 6 3 5 4
53 or more weeks 2 4 2 3 1
Median weeks 4 6 4 4 3
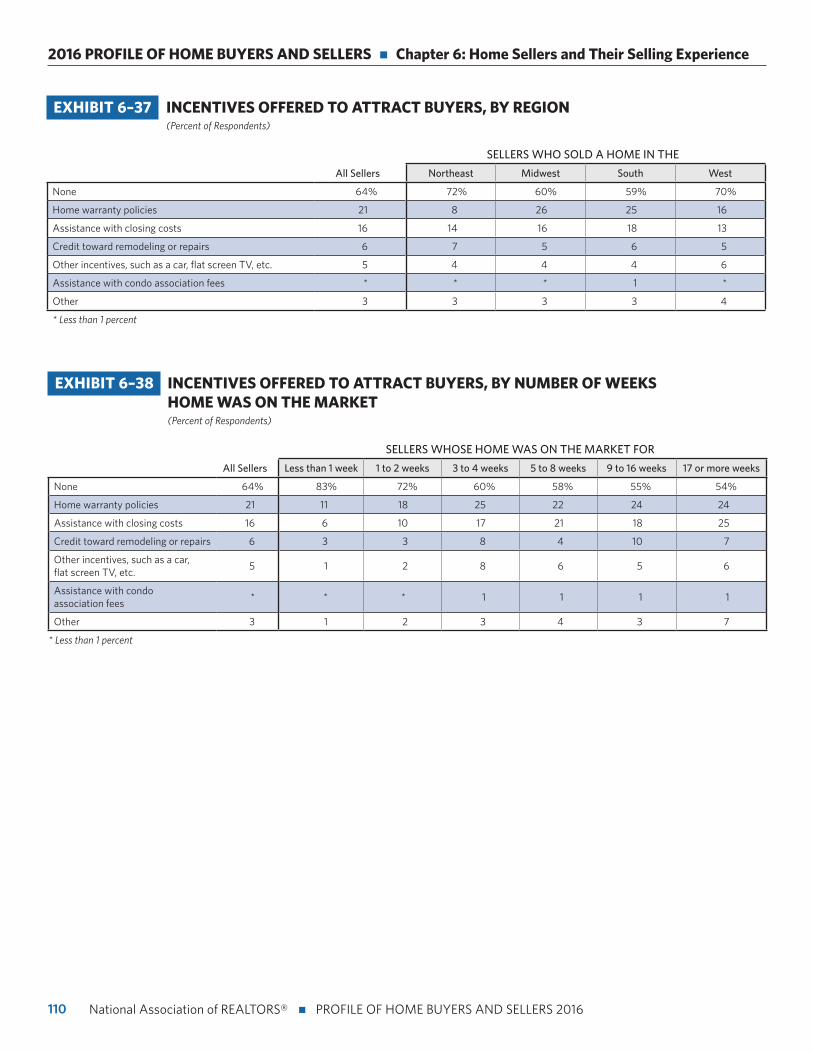
110
2016 PROFILE OF HOME BUYERS AND SELLERS n Chapter 6: Home Sellers and Their Selling Experience
National Association of REALTORS® n PROFILE OF HOME BUYERS AND SELLERS 2016
EXHIBIT 6–37 INCENTIVES OFFERED TO ATTRACT BUYERS, BY REGION (Percent of Respondents)
SELLERS WHO SOLD A HOME IN THE
All Sellers Northeast Midwest South West
None 64% 72% 60% 59% 70%
Home warranty policies 21 8 26 25 16
Assistance with closing costs 16 14 16 18 13
Credit toward remodeling or repairs 6 7 5 6 5
Other incentives, such as a car, flat screen TV, etc. 5 4 4 4 6
Assistance with condo association fees * * * 1 *
Other 3 3 3 3 4
* Less than 1 percent
EXHIBIT 6–38 INCENTIVES OFFERED TO ATTRACT BUYERS, BY NUMBER OF WEEKS HOME WAS ON THE MARKET (Percent of Respondents)
SELLERS WHOSE HOME WAS ON THE MARKET FOR
All Sellers Less than 1 week 1 to 2 weeks 3 to 4 weeks 5 to 8 weeks 9 to 16 weeks 17 or more weeks
None 64% 83% 72% 60% 58% 55% 54%
Home warranty policies 21 11 18 25 22 24 24
Assistance with closing costs 16 6 10 17 21 18 25
Credit toward remodeling or repairs 6 3 3 8 4 10 7
Other incentives, such as a car, flat screen TV, etc.
5 1 2 8 6 5 6
Assistance with condo association fees
* * * 1 1 1 1
Other 3 1 2 3 4 3 7
* Less than 1 percent
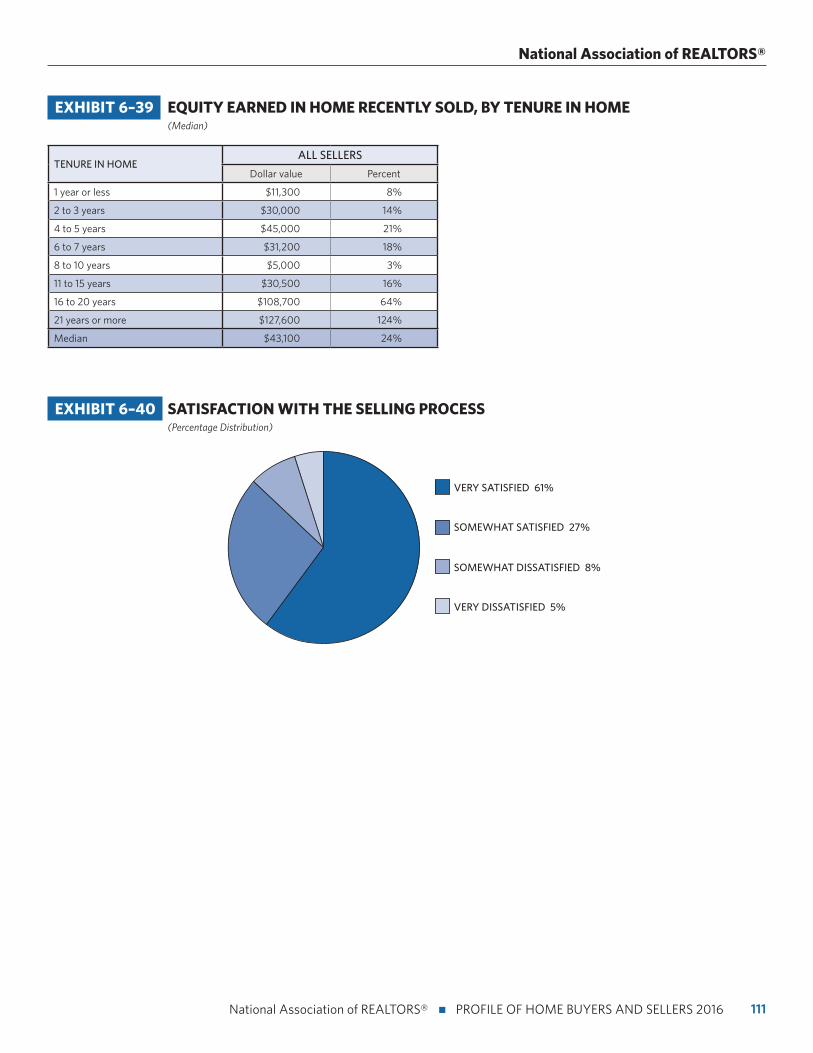
111 National Association of REALTORS® n PROFILE OF HOME BUYERS AND SELLERS 2016
National Association of REALTORS®
EXHIBIT 6–40 SATISFACTION WITH THE SELLING PROCESS (Percentage Distribution)
VERY DISSATISFIED 5%
SOMEWHAT DISSATISFIED 8%
SOMEWHAT SATISFIED 27%
VERY SATISFIED 61%
EXHIBIT 6–39 EQUITY EARNED IN HOME RECENTLY SOLD, BY TENURE IN HOME (Median)
TENURE IN HOMEALL SELLERS
Dollar value Percent
1 year or less $11,300 8%
2 to 3 years $30,000 14%
4 to 5 years $45,000 21%
6 to 7 years $31,200 18%
8 to 10 years $5,000 3%
11 to 15 years $30,500 16%
16 to 20 years $108,700 64%
21 years or more $127,600 124%
Median $43,100 24%
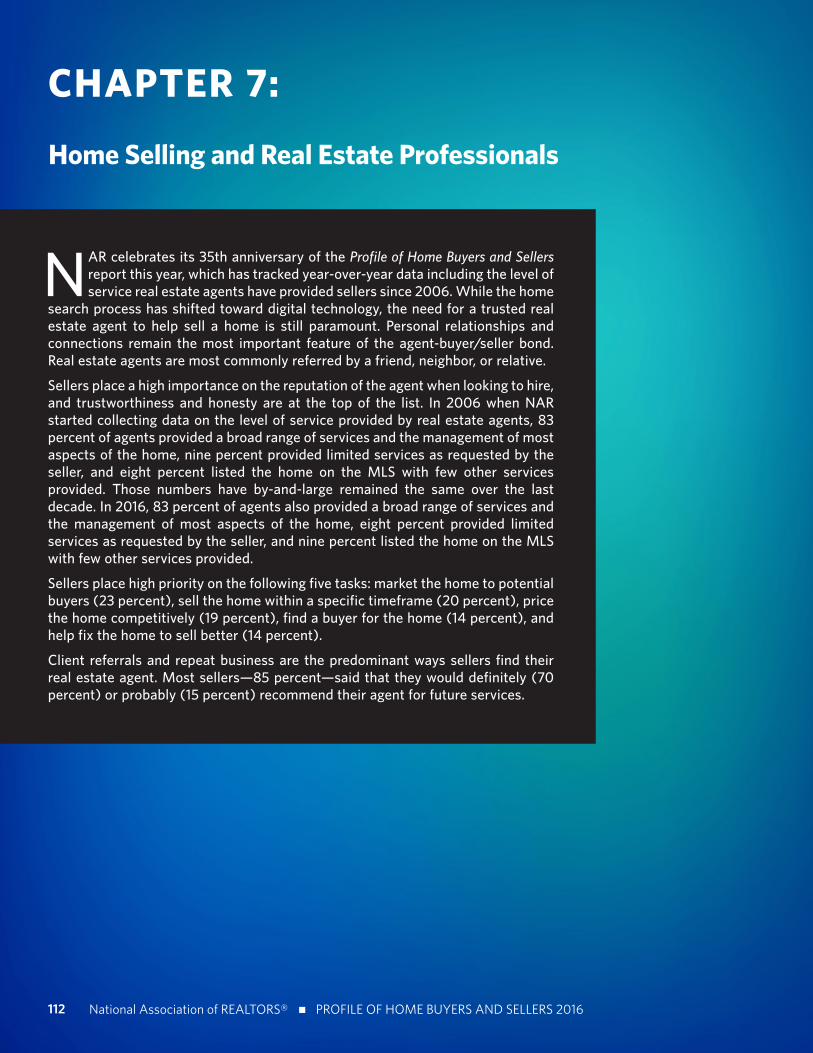
112 National Association of REALTORS® n PROFILE OF HOME BUYERS AND SELLERS 2016
CHAPTER 7:
Home Selling and Real Estate Professionals
NAR celebrates its 35th anniversary of the Profile of Home Buyers and Sellers report this year, which has tracked year-over-year data including the level of service real estate agents have provided sellers since 2006. While the home
search process has shifted toward digital technology, the need for a trusted real estate agent to help sell a home is still paramount. Personal relationships and connections remain the most important feature of the agent-buyer/seller bond. Real estate agents are most commonly referred by a friend, neighbor, or relative.
Sellers place a high importance on the reputation of the agent when looking to hire, and trustworthiness and honesty are at the top of the list. In 2006 when NAR started collecting data on the level of service provided by real estate agents, 83 percent of agents provided a broad range of services and the management of most aspects of the home, nine percent provided limited services as requested by the seller, and eight percent listed the home on the MLS with few other services provided. Those numbers have by-and-large remained the same over the last decade. In 2016, 83 percent of agents also provided a broad range of services and the management of most aspects of the home, eight percent provided limited services as requested by the seller, and nine percent listed the home on the MLS with few other services provided.
Sellers place high priority on the following five tasks: market the home to potential buyers (23 percent), sell the home within a specific timeframe (20 percent), price the home competitively (19 percent), find a buyer for the home (14 percent), and help fix the home to sell better (14 percent).
Client referrals and repeat business are the predominant ways sellers find their real estate agent. Most sellers—85 percent—said that they would definitely (70 percent) or probably (15 percent) recommend their agent for future services.
113 National Association of REALTORS® n PROFILE OF HOME BUYERS AND SELLERS 2016
National Association of REALTORS®
Finding a Real Estate Agent
• Exhibits 7–1 through 7–4
Nearly two-thirds (64 percent) of recent sellers used an agent that was referred to them or used an agent they had worked with in the past to buy or sell a home. Roughly half of first-time sellers worked with an agent that was referred to them by a friend or family member to sell their home (46 percent). For repeat buyers, many used an agent they previously worked with (28 percent).
Seven in 10 recent sellers contacted only one agent before finding the right agent they worked with to sell their home, the same as last year.
Fifty-five percent of recent home sellers used the same real
estate agent to represent them purchasing their home as selling
their home, which is up from 50 percent last year. That number
jumps to 86 percent for all sellers within 10 miles of their
home purchase. If the seller moved out of state or to another
region, they typically used a different agent for each real estate
transaction.
Home Listed on Multiple Listing Service and Level of Service
• Exhibits 7–5 and 7–6
Consistent with last year, 92 percent of sellers listed their
homes on the Multiple Listing Service (MLS), which is the
number one source for sellers to list their home. Only three
percent opted not to list on a MLS.
Real estate agents provide a wide range of services and
conduct the management of most aspects of the home sale.
Eighty-three percent of sellers reported that their agents
provided the lion’s share of these services, which is up from 79
percent last year. Eight percent of sellers note that their agent
only provided a limited set of services and nine percent said
their agent listed the home on a MLS but performed few other
services.
By way of comparison, in 2006 when NAR started collecting
data on the level of service provided by real estate agents, those
numbers were nearly identical. Eighty-three percent of agents
provided a broad range of services and the management of most
aspects of the home, nine percent provided limited services as
requested by the seller, and eight percent listed the home on
the MLS with few other services provided in 2006.
What Sellers Want Most and Level of Service
• Exhibits 7–7 and 7–8
Sellers place high priority on the following five tasks: market
the home to potential buyers (23 percent), sell the home
within a specific timeframe (20 percent), price the home
competitively (19 percent), find a buyer for home (14 percent),
and help fix the home to sell better (14 percent).
The reputation of the real estate agent was by far the most
important factor when sellers selected an agent to sell their
home (31 percent). Sellers also place value on the agent’s
trustworthiness and honesty (21 percent), whether the agent
is a friend or family member (14 percent), and the agent's
knowledge of the neighborhood (14 percent).
Client referrals and repeat business are the predominant sources of business for real estate agents. Most sellers— 85 percent—said that
they would definitely (70 percent) or probably (15 percent) recommend their agent for
future services.
114
2016 PROFILE OF HOME BUYERS AND SELLERS n Chapter 7: Home Selling and Real Estate Professionals
National Association of REALTORS® n PROFILE OF HOME BUYERS AND SELLERS 2016
Methods Used to Market the Home
• Exhibit 7–9
Real estate agents list homes on MLSs first and foremost (89
percent). They also create yard signs (70 percent), list on
Realtor.com (52 percent), list the home on their website (50
percent), host an open house (47 percent), and list on their
company’s website (45 percent). Real estate agents also list
homes on social media (four percent), which is down from 12
percent from last year.
Agent’s Performance and Compensation
• Exhibits 7–10 through 7–13
Agents receive their compensation predominantly from sellers
at 77 percent, slightly up from the previous year at 76 percent.
Of that compensation, 72 percent of sellers pay a percent
of the sales price. Only a small fraction pays a flat fee (two
percent), and only 12 percent of overall compensation is paid
by both the buyer and seller. Six percent of sellers reported
buyers paying as the only means of compensation.
The real estate agent most often initiated the discussion of
compensation (48 percent), up from 46 percent the year
before. The client initiated the discussion and the agent was
able and willing to negotiate 22 percent of the time, up from
20 percent last year. In 14 percent of cases, the client did not
know that commissions and fees could be negotiated, which
was down from 16 percent in 2015.
Client referrals and repeat business are the predominant
sources of business for real estate agents. Most sellers—
85 percent—said that they would definitely (70 percent)
or probably (15 percent) recommend their agent for future
services. Sellers that moved less than 10 miles away were
generally (88 percent) more inclined to recommend their
agent. That figure decreases the further in distance a seller
moves. For sellers that moved more than 500 miles, they
reported recommending their agent 82 percent of the time.
The typical seller has recommended their agent twice
since selling their home. Thirty-three percent of sellers
recommended their agent three or more times since selling
their home.
Consistent with last year, 92 percent of sellers listed their homes on the Multiple Listing Service (MLS),
which is the number one source for sellers to list their home.
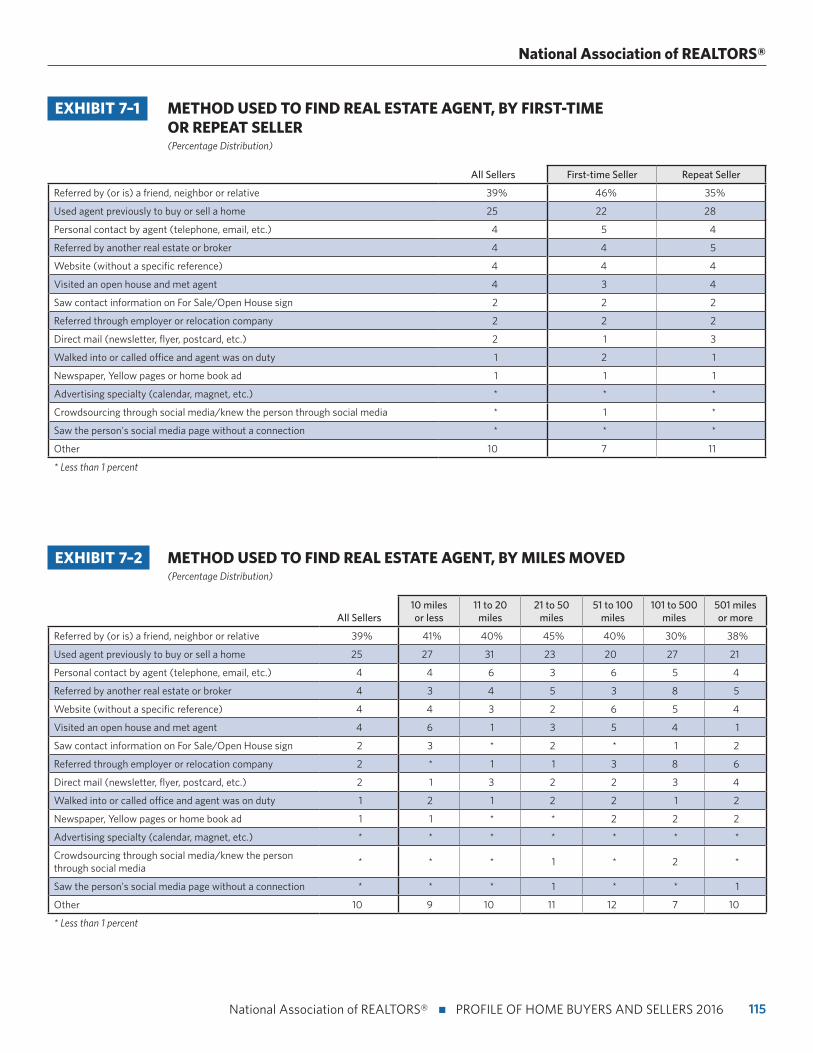
115 National Association of REALTORS® n PROFILE OF HOME BUYERS AND SELLERS 2016
National Association of REALTORS®
EXHIBIT 7–1 METHOD USED TO FIND REAL ESTATE AGENT, BY FIRST-TIME OR REPEAT SELLER (Percentage Distribution)
All Sellers First-time Seller Repeat Seller
Referred by (or is) a friend, neighbor or relative 39% 46% 35%
Used agent previously to buy or sell a home 25 22 28
Personal contact by agent (telephone, email, etc.) 4 5 4
Referred by another real estate or broker 4 4 5
Website (without a specific reference) 4 4 4
Visited an open house and met agent 4 3 4
Saw contact information on For Sale/Open House sign 2 2 2
Referred through employer or relocation company 2 2 2
Direct mail (newsletter, flyer, postcard, etc.) 2 1 3
Walked into or called office and agent was on duty 1 2 1
Newspaper, Yellow pages or home book ad 1 1 1
Advertising specialty (calendar, magnet, etc.) * * *
Crowdsourcing through social media/knew the person through social media * 1 *
Saw the person's social media page without a connection * * *
Other 10 7 11
* Less than 1 percent
EXHIBIT 7–2 METHOD USED TO FIND REAL ESTATE AGENT, BY MILES MOVED (Percentage Distribution)
All Sellers10 miles or less
11 to 20 miles
21 to 50 miles
51 to 100 miles
101 to 500 miles
501 miles or more
Referred by (or is) a friend, neighbor or relative 39% 41% 40% 45% 40% 30% 38%
Used agent previously to buy or sell a home 25 27 31 23 20 27 21
Personal contact by agent (telephone, email, etc.) 4 4 6 3 6 5 4
Referred by another real estate or broker 4 3 4 5 3 8 5
Website (without a specific reference) 4 4 3 2 6 5 4
Visited an open house and met agent 4 6 1 3 5 4 1
Saw contact information on For Sale/Open House sign 2 3 * 2 * 1 2
Referred through employer or relocation company 2 * 1 1 3 8 6
Direct mail (newsletter, flyer, postcard, etc.) 2 1 3 2 2 3 4
Walked into or called office and agent was on duty 1 2 1 2 2 1 2
Newspaper, Yellow pages or home book ad 1 1 * * 2 2 2
Advertising specialty (calendar, magnet, etc.) * * * * * * *
Crowdsourcing through social media/knew the person through social media
* * * 1 * 2 *
Saw the person's social media page without a connection * * * 1 * * 1
Other 10 9 10 11 12 7 10
* Less than 1 percent
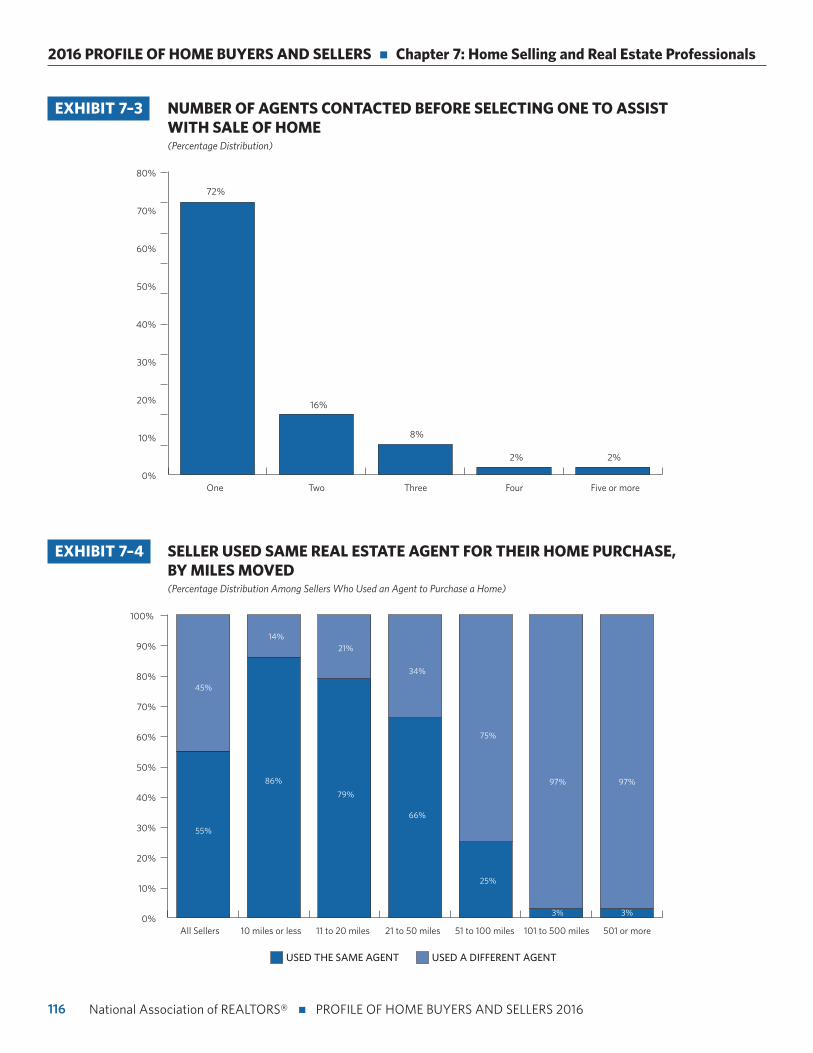
116
2016 PROFILE OF HOME BUYERS AND SELLERS n Chapter 7: Home Selling and Real Estate Professionals
National Association of REALTORS® n PROFILE OF HOME BUYERS AND SELLERS 2016
EXHIBIT 7–3 NUMBER OF AGENTS CONTACTED BEFORE SELECTING ONE TO ASSIST WITH SALE OF HOME (Percentage Distribution)
0%
10%
20%
30%
40%
50%
60%
70%
80%
72%
16%
8%
2% 2%
One Two Three Four Five or more
0%
10%
20%
30%
40%
50%
60%
70%
80%
90%
100%
45%
14%
79%
75%
3%
All Sellers 10 miles or less
USED A DIFFERENT AGENTUSED THE SAME AGENT
21%
66%
97%
25%
3%
86%
55%
34%
97%
11 to 20 miles 21 to 50 miles 51 to 100 miles 101 to 500 miles 501 or more
EXHIBIT 7–4 SELLER USED SAME REAL ESTATE AGENT FOR THEIR HOME PURCHASE, BY MILES MOVED (Percentage Distribution Among Sellers Who Used an Agent to Purchase a Home)
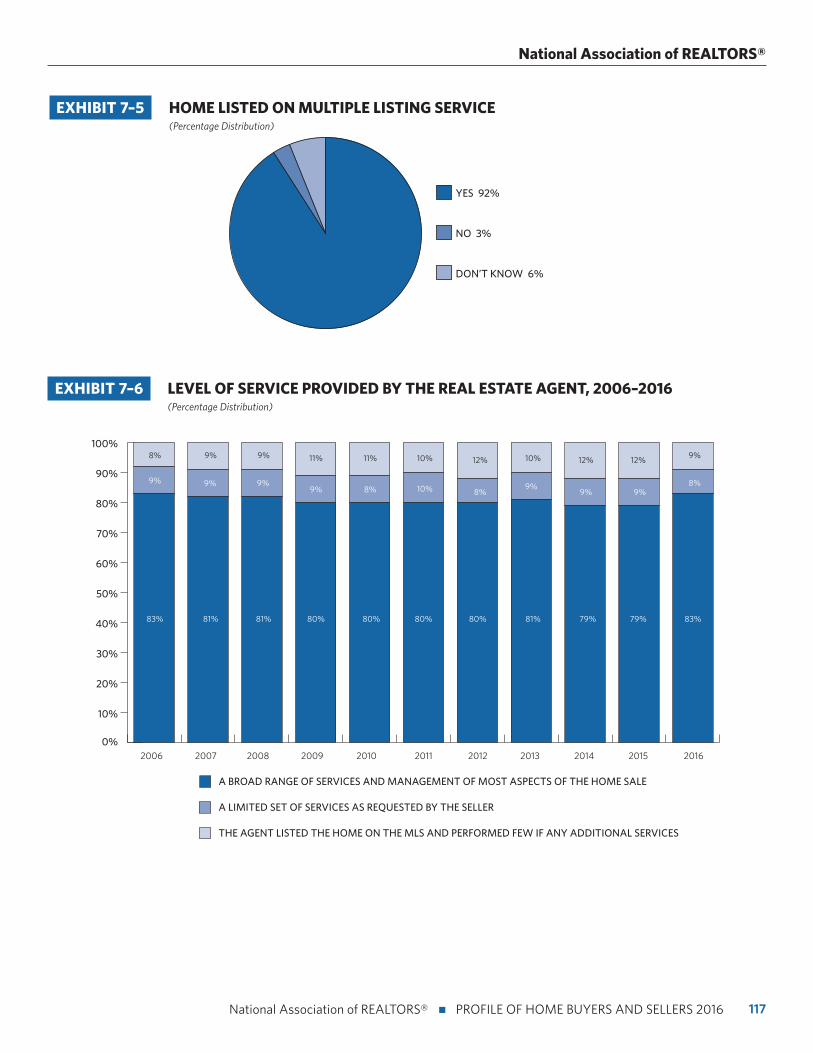
117 National Association of REALTORS® n PROFILE OF HOME BUYERS AND SELLERS 2016
National Association of REALTORS®
EXHIBIT 7–5 HOME LISTED ON MULTIPLE LISTING SERVICE (Percentage Distribution)
DON’T KNOW 6%
NO 3%
YES 92%
EXHIBIT 7–6 LEVEL OF SERVICE PROVIDED BY THE REAL ESTATE AGENT, 2006–2016 (Percentage Distribution)
0%
10%
20%
30%
40%
50%
60%
70%
80%
90%
100%
2006
A LIMITED SET OF SERVICES AS REQUESTED BY THE SELLER
A BROAD RANGE OF SERVICES AND MANAGEMENT OF MOST ASPECTS OF THE HOME SALE
THE AGENT LISTED THE HOME ON THE MLS AND PERFORMED FEW IF ANY ADDITIONAL SERVICES
8%
9%
9% 11% 10% 12%9%
9%
80%81%
9%
83% 81%
9%
80%
10%
11%
80% 80%
10%
9%
81%
12%
8%
9%
9%
79%
12%
9% 8%
20162007 2008 2009 2011 2012 2013 20142010 2015
8%
79% 83%
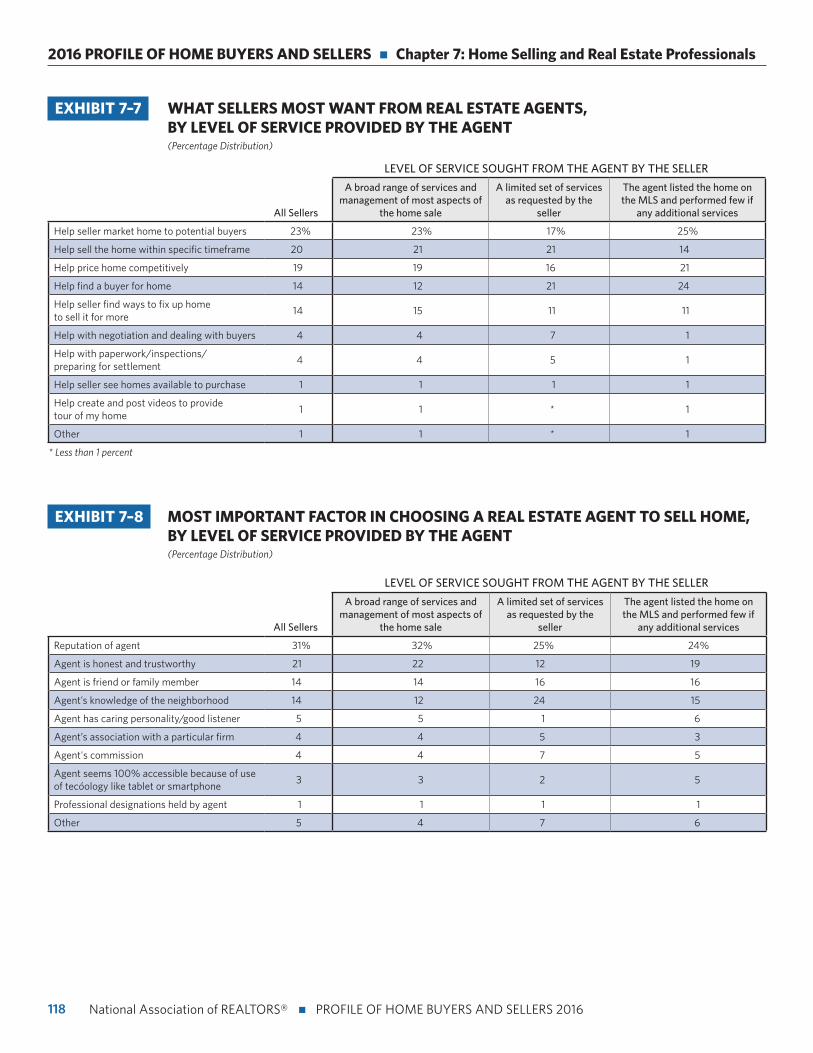
118
2016 PROFILE OF HOME BUYERS AND SELLERS n Chapter 7: Home Selling and Real Estate Professionals
National Association of REALTORS® n PROFILE OF HOME BUYERS AND SELLERS 2016
EXHIBIT 7–8 MOST IMPORTANT FACTOR IN CHOOSING A REAL ESTATE AGENT TO SELL HOME, BY LEVEL OF SERVICE PROVIDED BY THE AGENT (Percentage Distribution)
LEVEL OF SERVICE SOUGHT FROM THE AGENT BY THE SELLER
All Sellers
A broad range of services and management of most aspects of
the home sale
A limited set of services as requested by the
seller
The agent listed the home on the MLS and performed few if
any additional services
Reputation of agent 31% 32% 25% 24%
Agent is honest and trustworthy 21 22 12 19
Agent is friend or family member 14 14 16 16
Agent’s knowledge of the neighborhood 14 12 24 15
Agent has caring personality/good listener 5 5 1 6
Agent’s association with a particular firm 4 4 5 3
Agent's commission 4 4 7 5
Agent seems 100% accessible because of use of technology like tablet or smartphone
3 3 2 5
Professional designations held by agent 1 1 1 1
Other 5 4 7 6
EXHIBIT 7–7 WHAT SELLERS MOST WANT FROM REAL ESTATE AGENTS, BY LEVEL OF SERVICE PROVIDED BY THE AGENT (Percentage Distribution)
LEVEL OF SERVICE SOUGHT FROM THE AGENT BY THE SELLER
All Sellers
A broad range of services and management of most aspects of
the home sale
A limited set of services as requested by the
seller
The agent listed the home on the MLS and performed few if
any additional services
Help seller market home to potential buyers 23% 23% 17% 25%
Help sell the home within specific timeframe 20 21 21 14
Help price home competitively 19 19 16 21
Help find a buyer for home 14 12 21 24
Help seller find ways to fix up home to sell it for more
14 15 11 11
Help with negotiation and dealing with buyers 4 4 7 1
Help with paperwork/inspections/ preparing for settlement
4 4 5 1
Help seller see homes available to purchase 1 1 1 1
Help create and post videos to provide tour of my home
1 1 * 1
Other 1 1 * 1
* Less than 1 percent
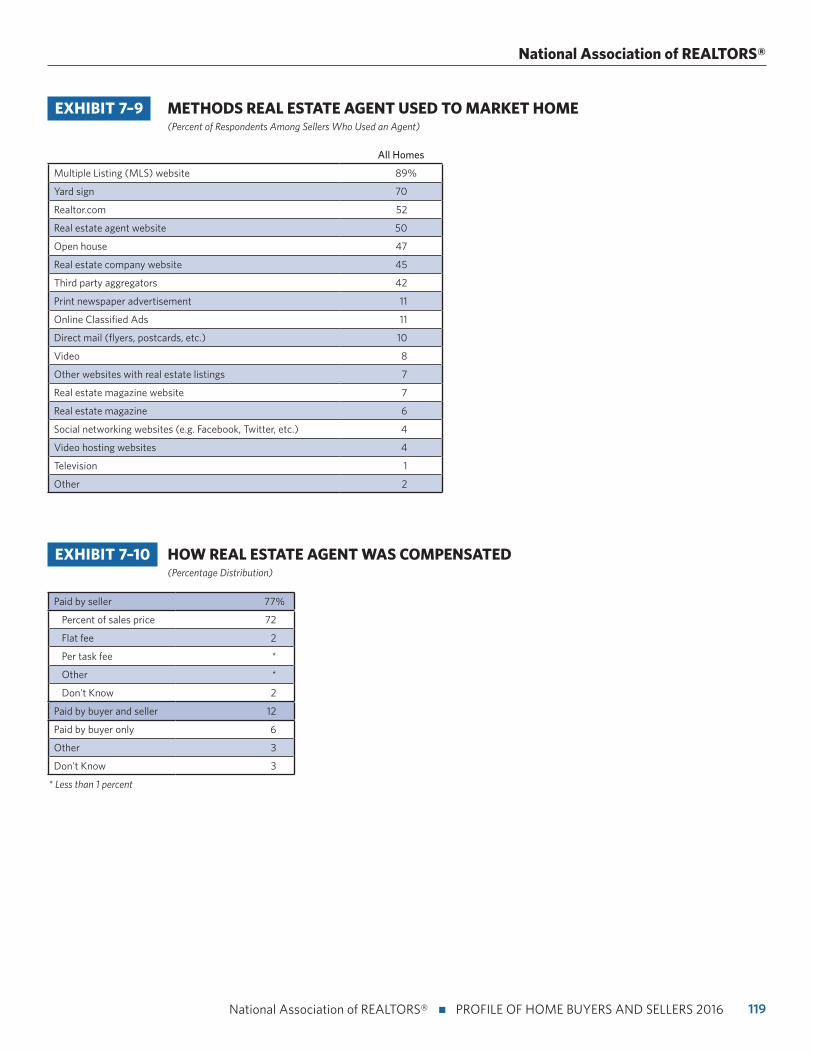
119 National Association of REALTORS® n PROFILE OF HOME BUYERS AND SELLERS 2016
National Association of REALTORS®
EXHIBIT 7–9 METHODS REAL ESTATE AGENT USED TO MARKET HOME (Percent of Respondents Among Sellers Who Used an Agent)
All Homes
Multiple Listing (MLS) website 89%
Yard sign 70
Realtor.com 52
Real estate agent website 50
Open house 47
Real estate company website 45
Third party aggregators 42
Print newspaper advertisement 11
Online Classified Ads 11
Direct mail (flyers, postcards, etc.) 10
Video 8
Other websites with real estate listings 7
Real estate magazine website 7
Real estate magazine 6
Social networking websites (e.g. Facebook, Twitter, etc.) 4
Video hosting websites 4
Television 1
Other 2
EXHIBIT 7–10 HOW REAL ESTATE AGENT WAS COMPENSATED (Percentage Distribution)
Paid by seller 77%
Percent of sales price 72
Flat fee 2
Per task fee *
Other *
Don't Know 2
Paid by buyer and seller 12
Paid by buyer only 6
Other 3
Don't Know 3
* Less than 1 percent
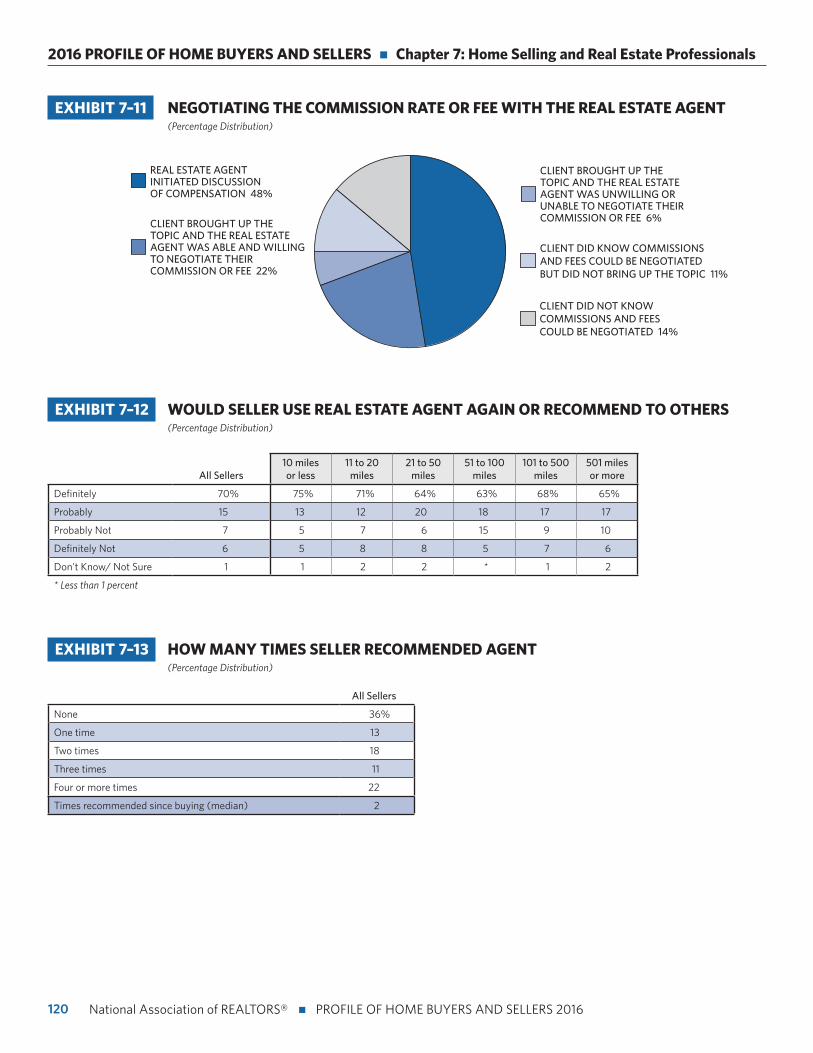
120
2016 PROFILE OF HOME BUYERS AND SELLERS n Chapter 7: Home Selling and Real Estate Professionals
National Association of REALTORS® n PROFILE OF HOME BUYERS AND SELLERS 2016
EXHIBIT 7–12 WOULD SELLER USE REAL ESTATE AGENT AGAIN OR RECOMMEND TO OTHERS (Percentage Distribution)
All Sellers10 miles or less
11 to 20 miles
21 to 50 miles
51 to 100 miles
101 to 500 miles
501 miles or more
Definitely 70% 75% 71% 64% 63% 68% 65%
Probably 15 13 12 20 18 17 17
Probably Not 7 5 7 6 15 9 10
Definitely Not 6 5 8 8 5 7 6
Don't Know/ Not Sure 1 1 2 2 * 1 2
* Less than 1 percent
EXHIBIT 7–13 HOW MANY TIMES SELLER RECOMMENDED AGENT (Percentage Distribution)
All Sellers
None 36%
One time 13
Two times 18
Three times 11
Four or more times 22
Times recommended since buying (median) 2
EXHIBIT 7–11 NEGOTIATING THE COMMISSION RATE OR FEE WITH THE REAL ESTATE AGENT (Percentage Distribution)
CLIENT DID NOT KNOW COMMISSIONS AND FEES COULD BE NEGOTIATED 14%
CLIENT DID KNOW COMMISSIONS AND FEES COULD BE NEGOTIATED BUT DID NOT BRING UP THE TOPIC 11%
CLIENT BROUGHT UP THE TOPIC AND THE REAL ESTATE AGENT WAS UNWILLING OR UNABLE TO NEGOTIATE THEIR COMMISSION OR FEE 6%
REAL ESTATE AGENT INITIATED DISCUSSION OF COMPENSATION 48%
CLIENT BROUGHT UP THE TOPIC AND THE REAL ESTATE AGENT WAS ABLE AND WILLING TO NEGOTIATE THEIR COMMISSION OR FEE 22%
121 National Association of REALTORS® n PROFILE OF HOME BUYERS AND SELLERS 2016
CHAPTER 8:
For-Sale-By-Owner (FSBO) Sellers
To celebrate NAR’s 35th anniversary release of the Profile of Home Buyers and Sellers, we take a look back to 1981 when NAR started collecting data on home sales by For-Sale-By-Owners (FSBOs). In 1981, FSBO home sales accounted
for 15 percent of all sales, and agent-assisted sales accounted for 85 percent. FSBO sales have declined over time and in 2016, FSBOs accounted for eight percent of total home sales. This is the lowest share since the Profile of Home Buyers and Sellers data collection began. The same share of eight percent was recorded in the 2015 report. In 2016, 50 percent of FSBO sellers knew the buyers for their homes and 50 percent did not know the buyer.
FSBO sellers that knew the buyer predominantly sold to a friend, relative, or neigh-bor. FSBOs typically sell for less than the selling price of other homes. For FSBO sellers, those who know the buyer tend to have lower median household incomes compared to those who did not know the buyer.
Where FSBO sellers knew the buyer, the time on market for the home was usually a week, and sellers received 100 percent of the asking price.
122
2016 PROFILE OF HOME BUYERS AND SELLERS n Chapter 8: For-Sale-by-Owner (FSBO) Sellers
National Association of REALTORS® n PROFILE OF HOME BUYERS AND SELLERS 2016
FSBO and Agent Assisted Sales, By Location and Over Time
• Exhibits 8–1 and 8–2
Eighty-nine percent of sellers sold with the assistance of a real
estate agent, consistent with last year, and only eight percent
were FSBO sales. In 1981, FSBO sales accounted for as much
as 15 percent of sales, but have steadily decreased over time.
This year, 50 percent of FSBO sellers knew the buyers, (four
percent of all sales) and 50 percent of FSBO sellers had no
previous relationship with the buyer (four percent of all sales).
FSBO sales were highest in rural areas at 16 percent compared
to only six percent in suburbs.
Characteristics of Sellers and Homes Sold
• Exhibit 8–3 through 8–6
The median age for FSBO sellers is 59 years compared to 53
for all agent-assisted sellers. Seventy-three percent of FSBO
sellers were married couples that have a median income of
$100,600. For FSBO sellers, those who knew the buyer tend
to have lower median household incomes compared to those
who did not know the buyer.
A majority of all homes sold were detached single-family
homes at 81 percent. While FSBO homes are predominantly
detached single-family homes at 69 percent (down from 75
percent in 2015), they are also more likely to be mobile or
manufactured homes at 10 percent compared to only two
percent of agent-assisted sales. Among agent-assisted sales,
82 percent of all homes sold are detached single-family
homes, which is consistent with last year. Thirty-seven percent
of FSBO sales where the buyer knew the seller were located
in rural areas compared to only 12 percent of agent-assisted
sales. Most agent-assisted sales were located in suburban
areas at 55 percent.
FSBOs typically sell for less than the selling price of other
homes; FSBO homes sold at a median of $185,000 in 2016
(down from $210,000 in 2015), and still far lower than the
median selling price of all homes at $240,000. Agent-assisted
homes sold for a median of $245,000. FSBOs typically
received 100 percent of their asking price and 98 percent when
the seller did not know the buyer, whereas agent-assisted sales
typically received 98 percent of the asking price. Sellers who
began as a FSBO, then ended up working with an agent, also
received 98 percent of the asking price, but had to reduce their
price the most before arriving at a final listing price.
In 1981, FSBO home sales accounted for 15 percent of all sales, and agent-assisted sales accounted
for 85 percent. FSBO sales have declined over time and in 2016, FSBOs accounted for eight percent
of total home sales. This is the lowest share since the Profile of Home Buyers and Sellers
data collection began.
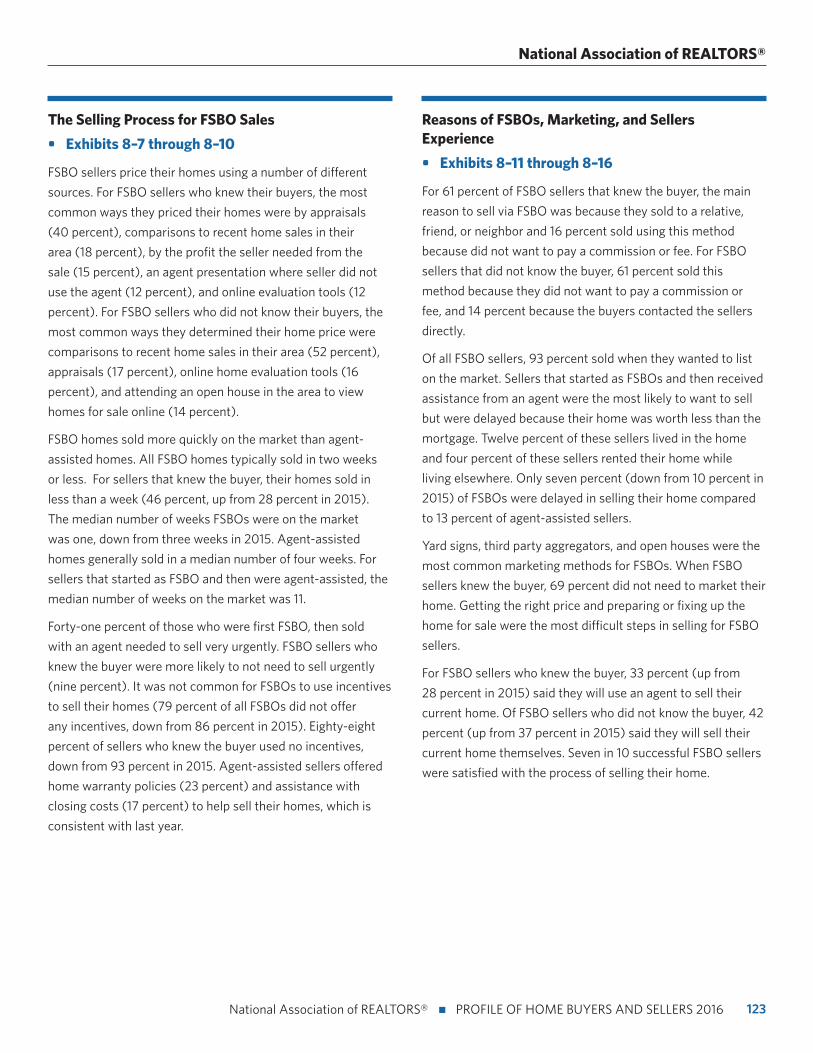
123 National Association of REALTORS® n PROFILE OF HOME BUYERS AND SELLERS 2016
National Association of REALTORS®
Reasons of FSBOs, Marketing, and Sellers Experience
• Exhibits 8–11 through 8–16
For 61 percent of FSBO sellers that knew the buyer, the main
reason to sell via FSBO was because they sold to a relative,
friend, or neighbor and 16 percent sold using this method
because did not want to pay a commission or fee. For FSBO
sellers that did not know the buyer, 61 percent sold this
method because they did not want to pay a commission or
fee, and 14 percent because the buyers contacted the sellers
directly.
Of all FSBO sellers, 93 percent sold when they wanted to list
on the market. Sellers that started as FSBOs and then received
assistance from an agent were the most likely to want to sell
but were delayed because their home was worth less than the
mortgage. Twelve percent of these sellers lived in the home
and four percent of these sellers rented their home while
living elsewhere. Only seven percent (down from 10 percent in
2015) of FSBOs were delayed in selling their home compared
to 13 percent of agent-assisted sellers.
Yard signs, third party aggregators, and open houses were the
most common marketing methods for FSBOs. When FSBO
sellers knew the buyer, 69 percent did not need to market their
home. Getting the right price and preparing or fixing up the
home for sale were the most difficult steps in selling for FSBO
sellers.
For FSBO sellers who knew the buyer, 33 percent (up from
28 percent in 2015) said they will use an agent to sell their
current home. Of FSBO sellers who did not know the buyer, 42
percent (up from 37 percent in 2015) said they will sell their
current home themselves. Seven in 10 successful FSBO sellers
were satisfied with the process of selling their home.
The Selling Process for FSBO Sales
• Exhibits 8–7 through 8–10
FSBO sellers price their homes using a number of different
sources. For FSBO sellers who knew their buyers, the most
common ways they priced their homes were by appraisals
(40 percent), comparisons to recent home sales in their
area (18 percent), by the profit the seller needed from the
sale (15 percent), an agent presentation where seller did not
use the agent (12 percent), and online evaluation tools (12
percent). For FSBO sellers who did not know their buyers, the
most common ways they determined their home price were
comparisons to recent home sales in their area (52 percent),
appraisals (17 percent), online home evaluation tools (16
percent), and attending an open house in the area to view
homes for sale online (14 percent).
FSBO homes sold more quickly on the market than agent-
assisted homes. All FSBO homes typically sold in two weeks
or less. For sellers that knew the buyer, their homes sold in
less than a week (46 percent, up from 28 percent in 2015).
The median number of weeks FSBOs were on the market
was one, down from three weeks in 2015. Agent-assisted
homes generally sold in a median number of four weeks. For
sellers that started as FSBO and then were agent-assisted, the
median number of weeks on the market was 11.
Forty-one percent of those who were first FSBO, then sold
with an agent needed to sell very urgently. FSBO sellers who
knew the buyer were more likely to not need to sell urgently
(nine percent). It was not common for FSBOs to use incentives
to sell their homes (79 percent of all FSBOs did not offer
any incentives, down from 86 percent in 2015). Eighty-eight
percent of sellers who knew the buyer used no incentives,
down from 93 percent in 2015. Agent-assisted sellers offered
home warranty policies (23 percent) and assistance with
closing costs (17 percent) to help sell their homes, which is
consistent with last year.
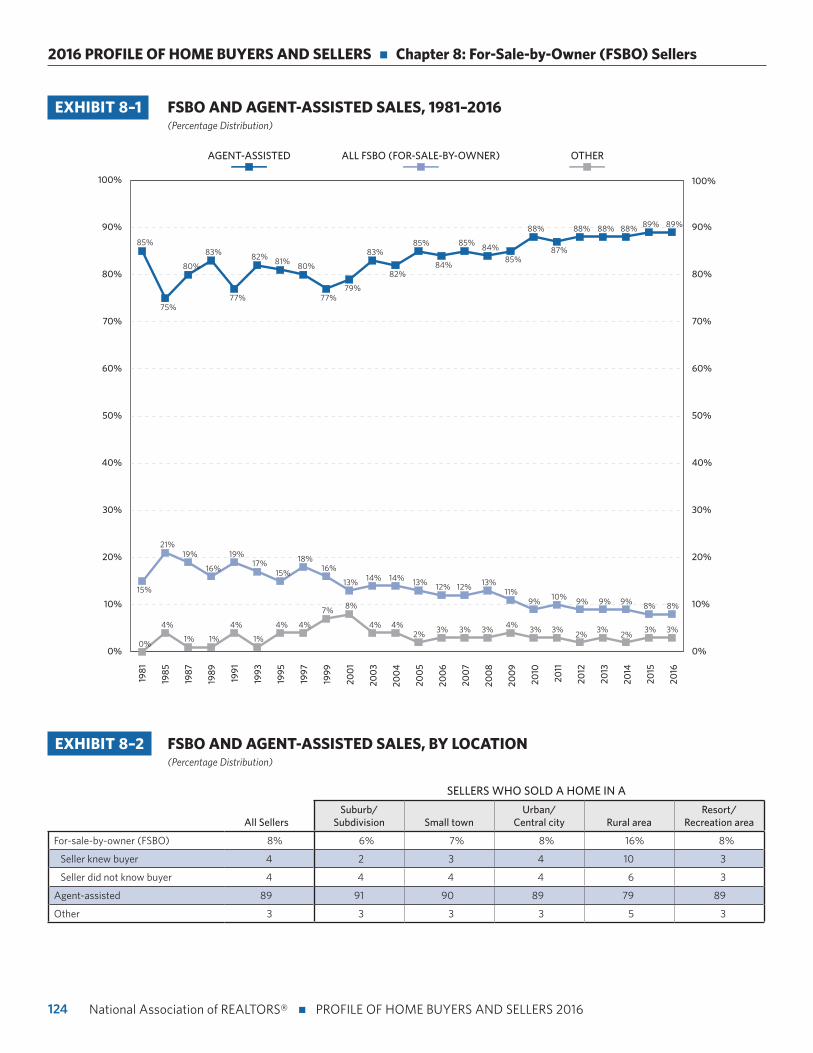
124
2016 PROFILE OF HOME BUYERS AND SELLERS n Chapter 8: For-Sale-by-Owner (FSBO) Sellers
National Association of REALTORS® n PROFILE OF HOME BUYERS AND SELLERS 2016
EXHIBIT 8–1 FSBO AND AGENT-ASSISTED SALES, 1981–2016 (Percentage Distribution)
EXHIBIT 8–2 FSBO AND AGENT-ASSISTED SALES, BY LOCATION (Percentage Distribution)
SELLERS WHO SOLD A HOME IN A
All SellersSuburb/
Subdivision Small townUrban/
Central city Rural areaResort/
Recreation area
For-sale-by-owner (FSBO) 8% 6% 7% 8% 16% 8%
Seller knew buyer 4 2 3 4 10 3
Seller did not know buyer 4 4 4 4 6 3
Agent-assisted 89 91 90 89 79 89
Other 3 3 3 3 5 3
0%
10%
20%
30%
40%
50%
60%
70%
80%
90%
100%
0%
10%
20%
30%
40%
50%
60%
70%
80%
90%
100%
OTHERALL FSBO (FOR-SALE-BY-OWNER)AGENT-ASSISTED19
81
1985
1987
1989
1991
1993
1995
1997
1999
200
1
200
3
200
4
200
5
200
6
200
7
200
8
200
9
2010
2011
2012
2013
2014
2015
2016
75%77%
83% 82%80%
81%
85% 84%
84%85%
88% 88% 89%88%
87%85% 85%
77%
80%82%
83%
79%
0%
4%
1% 1%
15%
2%3% 3%
8%8%
3%2%
9%
3%
9%10%
9% 9%
3%
11%
4%
13%
3%
12%14%
3%
12%
3%
13%
4%2%
14%
21%
8%
4%
19%
16%
7%
4%
18%
4%
13%15%
1%
17%
4%
19%
16%
89%88%
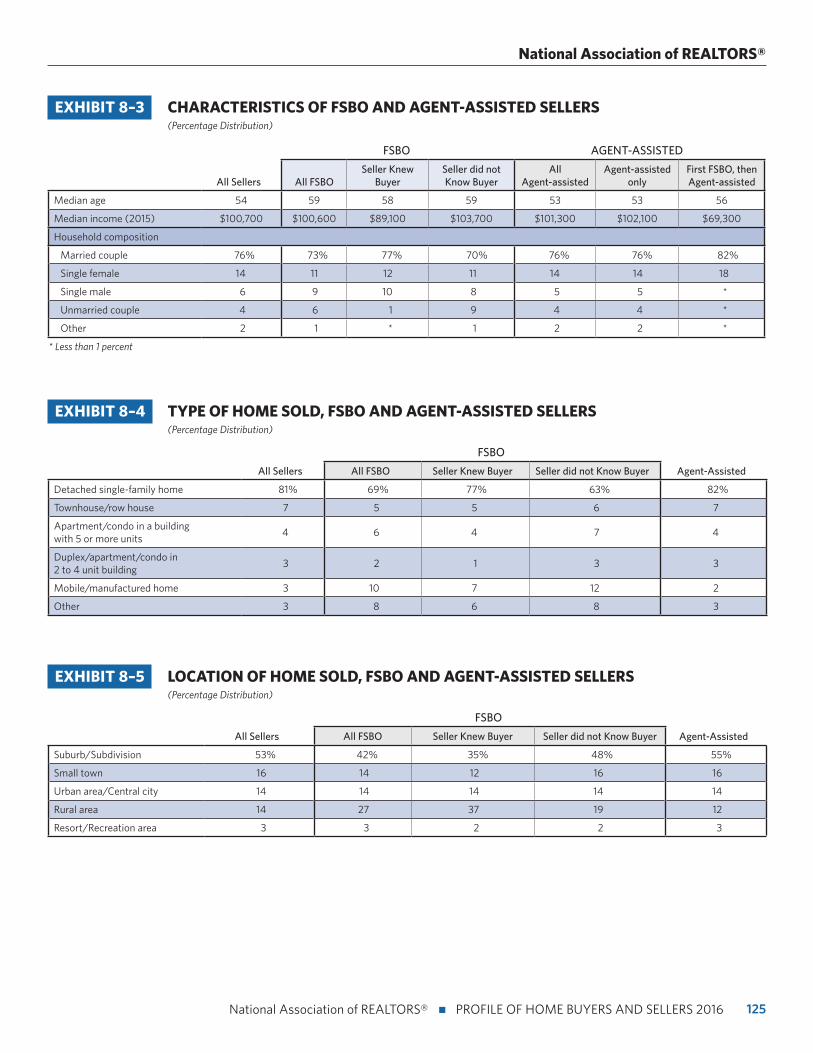
125 National Association of REALTORS® n PROFILE OF HOME BUYERS AND SELLERS 2016
National Association of REALTORS®
EXHIBIT 8–4 TYPE OF HOME SOLD, FSBO AND AGENT-ASSISTED SELLERS (Percentage Distribution)
FSBO
All Sellers All FSBO Seller Knew Buyer Seller did not Know Buyer Agent-Assisted
Detached single-family home 81% 69% 77% 63% 82%
Townhouse/row house 7 5 5 6 7
Apartment/condo in a building with 5 or more units
4 6 4 7 4
Duplex/apartment/condo in 2 to 4 unit building
3 2 1 3 3
Mobile/manufactured home 3 10 7 12 2
Other 3 8 6 8 3
EXHIBIT 8–5 LOCATION OF HOME SOLD, FSBO AND AGENT-ASSISTED SELLERS (Percentage Distribution)
FSBO
All Sellers All FSBO Seller Knew Buyer Seller did not Know Buyer Agent-Assisted
Suburb/Subdivision 53% 42% 35% 48% 55%
Small town 16 14 12 16 16
Urban area/Central city 14 14 14 14 14
Rural area 14 27 37 19 12
Resort/Recreation area 3 3 2 2 3
EXHIBIT 8–3 CHARACTERISTICS OF FSBO AND AGENT-ASSISTED SELLERS (Percentage Distribution)
FSBO AGENT-ASSISTED
All Sellers All FSBOSeller Knew
BuyerSeller did not Know Buyer
All Agent-assisted
Agent-assisted only
First FSBO, then Agent-assisted
Median age 54 59 58 59 53 53 56
Median income (2015) $100,700 $100,600 $89,100 $103,700 $101,300 $102,100 $69,300
Household composition
Married couple 76% 73% 77% 70% 76% 76% 82%
Single female 14 11 12 11 14 14 18
Single male 6 9 10 8 5 5 *
Unmarried couple 4 6 1 9 4 4 *
Other 2 1 * 1 2 2 *
* Less than 1 percent
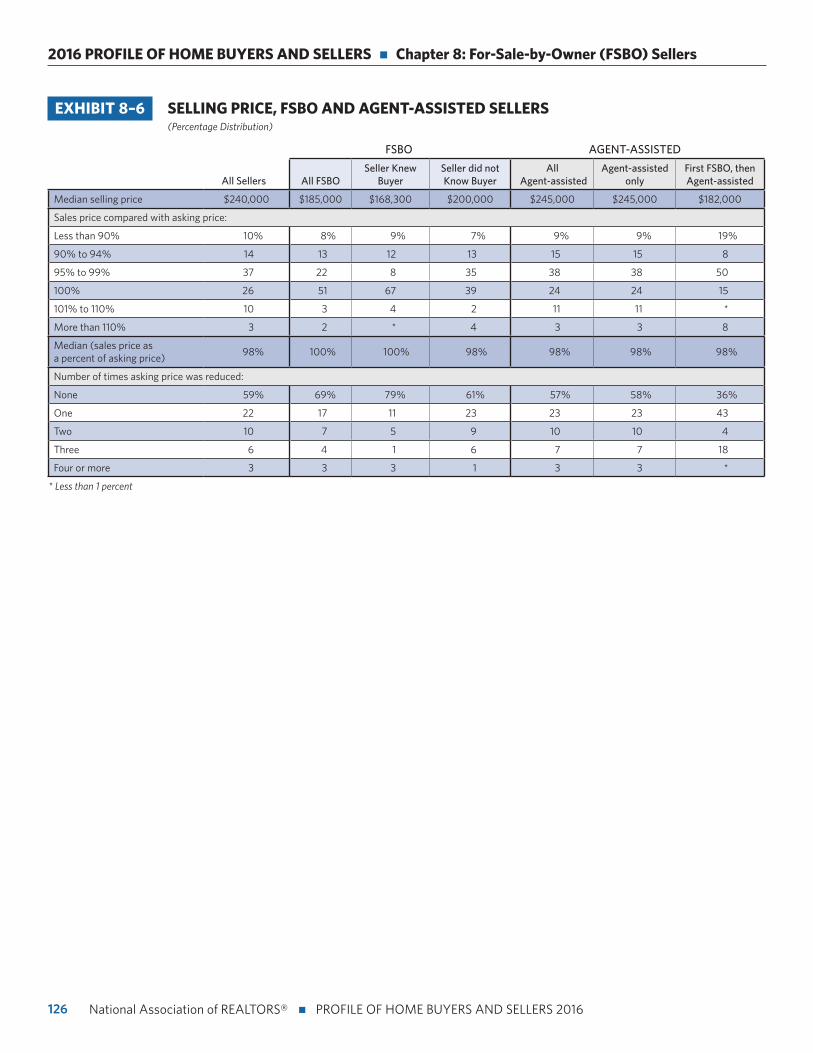
126
2016 PROFILE OF HOME BUYERS AND SELLERS n Chapter 8: For-Sale-by-Owner (FSBO) Sellers
National Association of REALTORS® n PROFILE OF HOME BUYERS AND SELLERS 2016
EXHIBIT 8–6 SELLING PRICE, FSBO AND AGENT-ASSISTED SELLERS (Percentage Distribution)
FSBO AGENT-ASSISTED
All Sellers All FSBOSeller Knew
BuyerSeller did not Know Buyer
All Agent-assisted
Agent-assisted only
First FSBO, then Agent-assisted
Median selling price $240,000 $185,000 $168,300 $200,000 $245,000 $245,000 $182,000
Sales price compared with asking price:
Less than 90% 10% 8% 9% 7% 9% 9% 19%
90% to 94% 14 13 12 13 15 15 8
95% to 99% 37 22 8 35 38 38 50
100% 26 51 67 39 24 24 15
101% to 110% 10 3 4 2 11 11 *
More than 110% 3 2 * 4 3 3 8
Median (sales price as a percent of asking price)
98% 100% 100% 98% 98% 98% 98%
Number of times asking price was reduced:
None 59% 69% 79% 61% 57% 58% 36%
One 22 17 11 23 23 23 43
Two 10 7 5 9 10 10 4
Three 6 4 1 6 7 7 18
Four or more 3 3 3 1 3 3 *
* Less than 1 percent
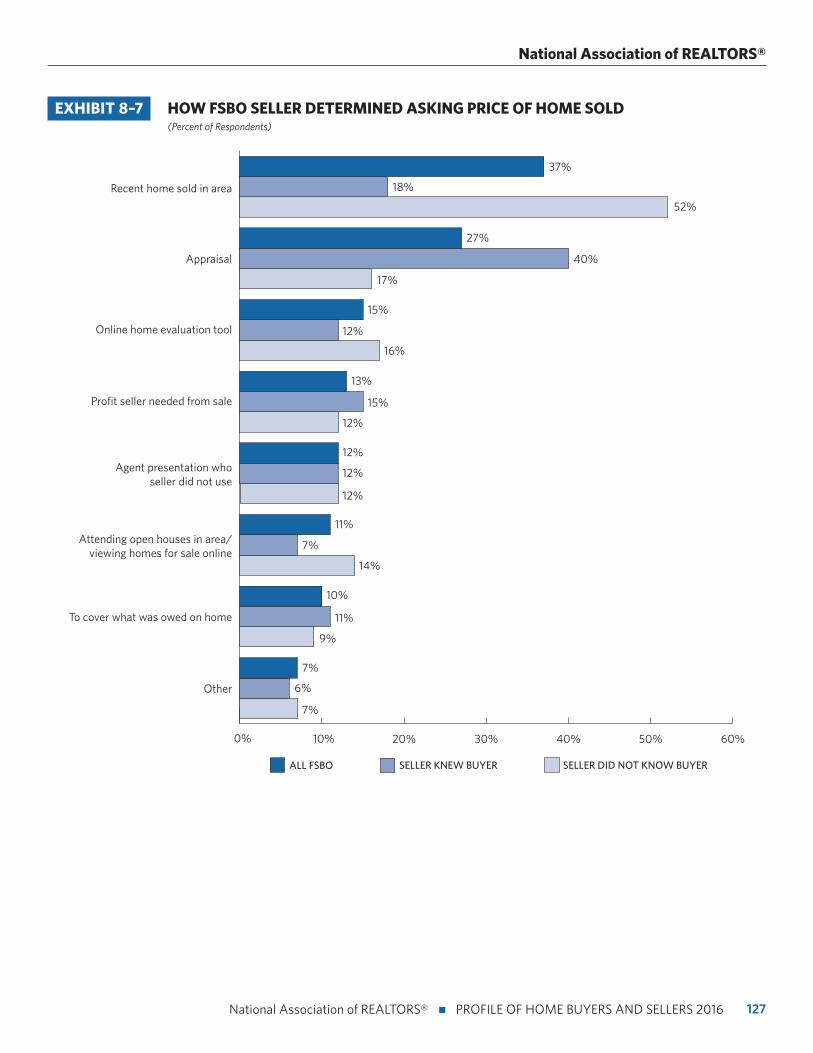
127 National Association of REALTORS® n PROFILE OF HOME BUYERS AND SELLERS 2016
National Association of REALTORS®
EXHIBIT 8–7 HOW FSBO SELLER DETERMINED ASKING PRICE OF HOME SOLD (Percent of Respondents)
0% 10% 20% 30% 40% 50% 60%
Other
To cover what was owed on home
Attending open houses in area/viewing homes for sale online
Agent presentation whoseller did not use
Profit seller needed from sale
Online home evaluation tool
Appraisal
Recent home sold in area
SELLER DID NOT KNOW BUYERSELLER KNEW BUYERALL FSBO
7%
11%
9%
7%
11%
7%
10%
14%
12%
6%
12%
12%
12%
16%
13%
15%
40%
17%
12%
52%
27%
37%
18%
15%
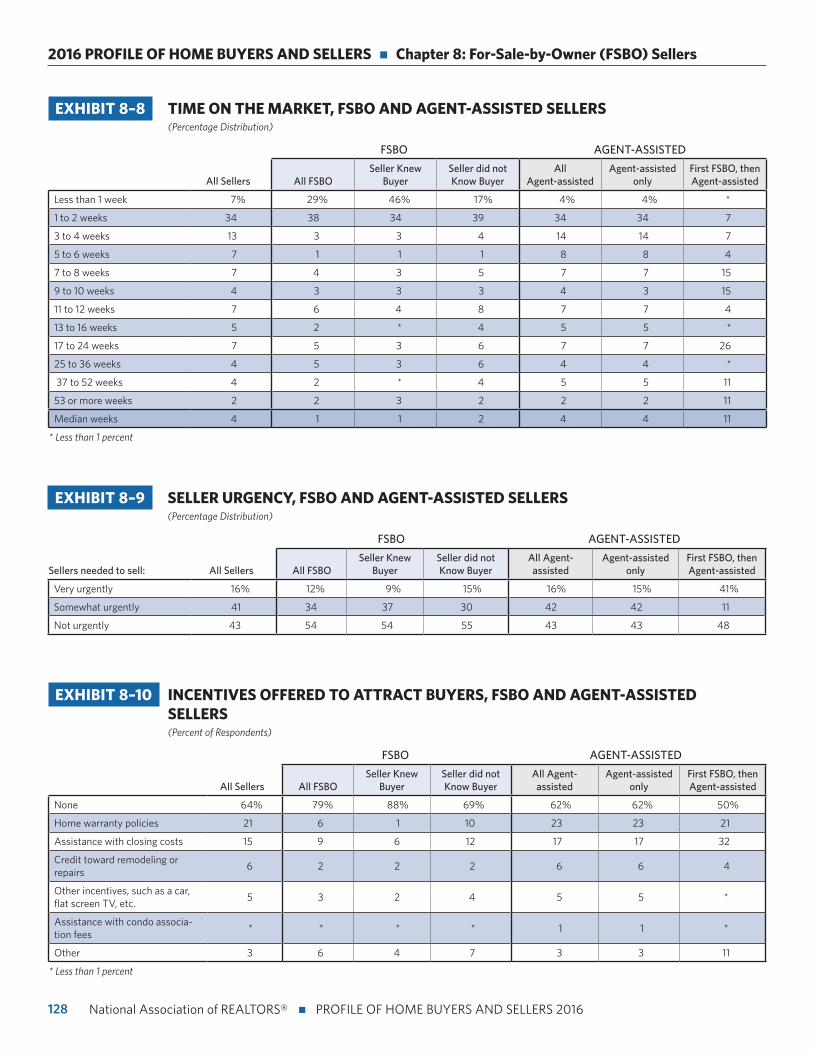
128
2016 PROFILE OF HOME BUYERS AND SELLERS n Chapter 8: For-Sale-by-Owner (FSBO) Sellers
National Association of REALTORS® n PROFILE OF HOME BUYERS AND SELLERS 2016
EXHIBIT 8–8 TIME ON THE MARKET, FSBO AND AGENT-ASSISTED SELLERS (Percentage Distribution)
FSBO AGENT-ASSISTED
All Sellers All FSBOSeller Knew
BuyerSeller did not Know Buyer
All Agent-assisted
Agent-assisted only
First FSBO, then Agent-assisted
Less than 1 week 7% 29% 46% 17% 4% 4% *
1 to 2 weeks 34 38 34 39 34 34 7
3 to 4 weeks 13 3 3 4 14 14 7
5 to 6 weeks 7 1 1 1 8 8 4
7 to 8 weeks 7 4 3 5 7 7 15
9 to 10 weeks 4 3 3 3 4 3 15
11 to 12 weeks 7 6 4 8 7 7 4
13 to 16 weeks 5 2 * 4 5 5 *
17 to 24 weeks 7 5 3 6 7 7 26
25 to 36 weeks 4 5 3 6 4 4 *
37 to 52 weeks 4 2 * 4 5 5 11
53 or more weeks 2 2 3 2 2 2 11
Median weeks 4 1 1 2 4 4 11
* Less than 1 percent
EXHIBIT 8–9 SELLER URGENCY, FSBO AND AGENT-ASSISTED SELLERS (Percentage Distribution)
FSBO AGENT-ASSISTED
Sellers needed to sell: All Sellers All FSBOSeller Knew
BuyerSeller did not Know Buyer
All Agent-assisted
Agent-assisted only
First FSBO, then Agent-assisted
Very urgently 16% 12% 9% 15% 16% 15% 41%
Somewhat urgently 41 34 37 30 42 42 11
Not urgently 43 54 54 55 43 43 48
EXHIBIT 8–10 INCENTIVES OFFERED TO ATTRACT BUYERS, FSBO AND AGENT-ASSISTED SELLERS (Percent of Respondents)
FSBO AGENT-ASSISTED
All Sellers All FSBOSeller Knew
BuyerSeller did not Know Buyer
All Agent-assisted
Agent-assisted only
First FSBO, then Agent-assisted
None 64% 79% 88% 69% 62% 62% 50%
Home warranty policies 21 6 1 10 23 23 21
Assistance with closing costs 15 9 6 12 17 17 32
Credit toward remodeling or repairs
6 2 2 2 6 6 4
Other incentives, such as a car, flat screen TV, etc.
5 3 2 4 5 5 *
Assistance with condo associa-tion fees
* * * * 1 1 *
Other 3 6 4 7 3 3 11
* Less than 1 percent
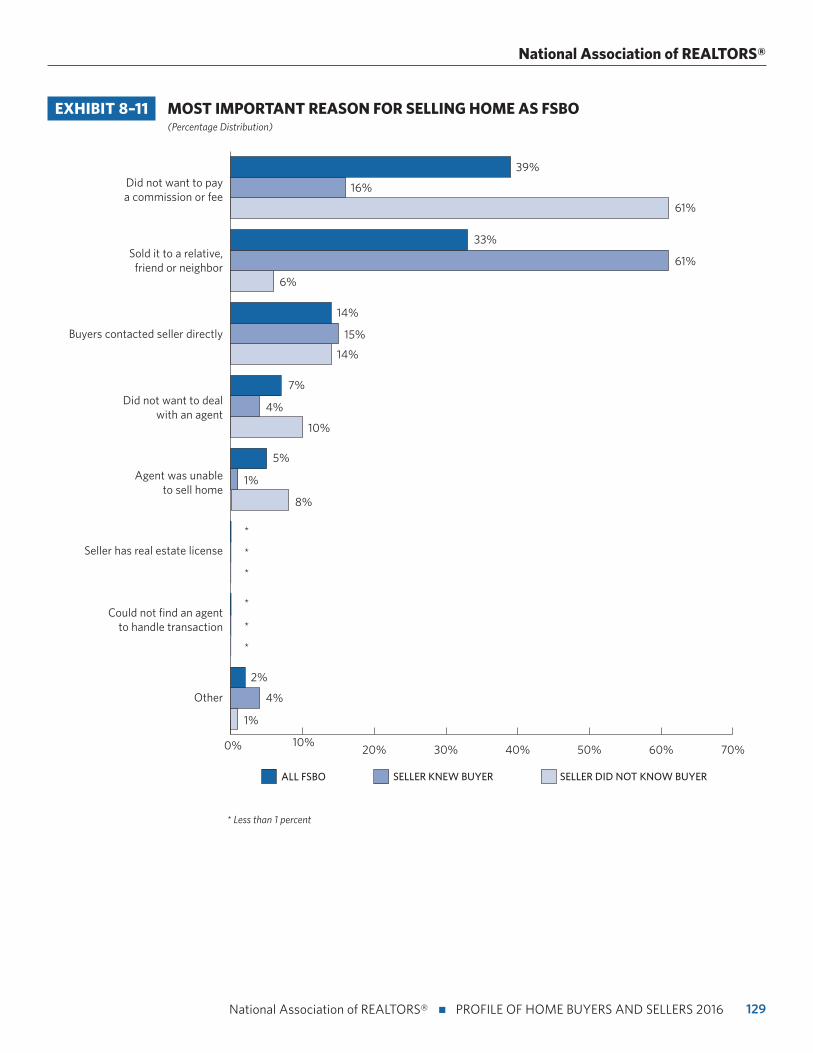
129 National Association of REALTORS® n PROFILE OF HOME BUYERS AND SELLERS 2016
National Association of REALTORS®
EXHIBIT 8–11 MOST IMPORTANT REASON FOR SELLING HOME AS FSBO (Percentage Distribution)
* Less than 1 percent
0% 10%20% 30% 40% 50% 60% 70%
Other
Could not find an agentto handle transaction
Seller has real estate license
Agent was unableto sell home
Did not want to dealwith an agent
Buyers contacted seller directly
Sold it to a relative,friend or neighbor
Did not want to paya commission or fee
SELLER DID NOT KNOW BUYERSELLER KNEW BUYERALL FSBO
1%
*
*
2%
*
*
*
*
5%
4%
10%
1%
8%
14%
7%
4%
61%
6%
15%
61%
33%
39%
16%
14%
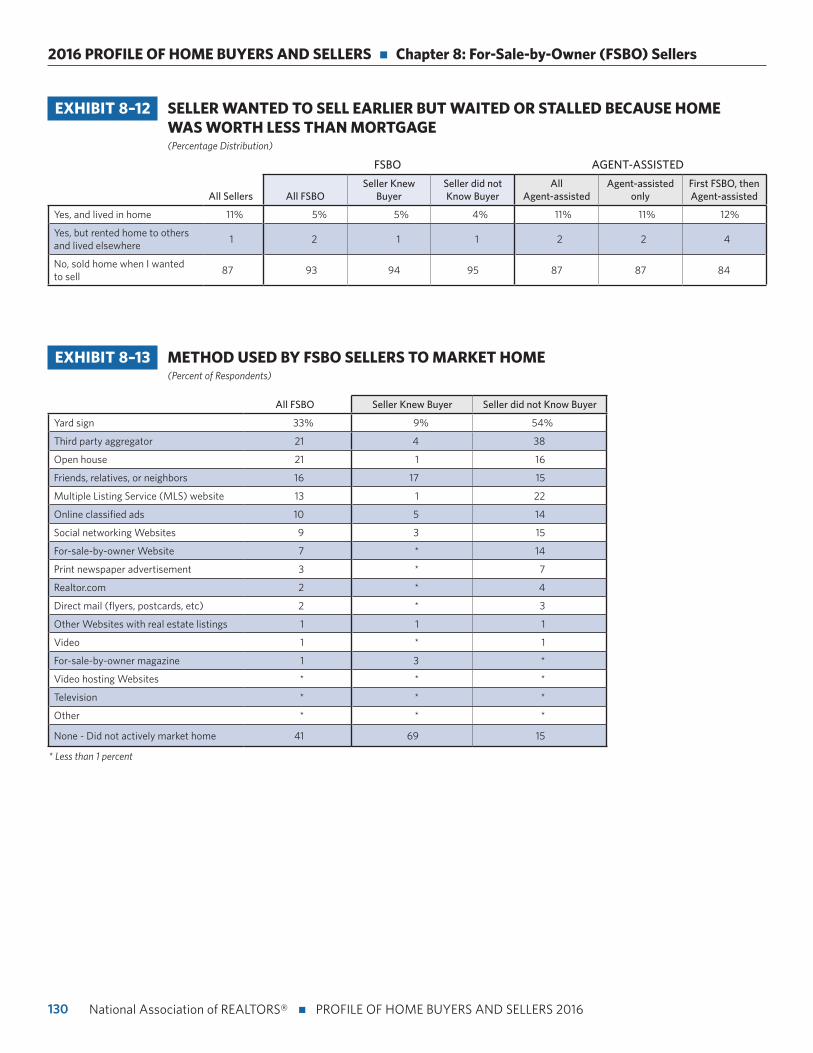
130
2016 PROFILE OF HOME BUYERS AND SELLERS n Chapter 8: For-Sale-by-Owner (FSBO) Sellers
National Association of REALTORS® n PROFILE OF HOME BUYERS AND SELLERS 2016
EXHIBIT 8–12 SELLER WANTED TO SELL EARLIER BUT WAITED OR STALLED BECAUSE HOME WAS WORTH LESS THAN MORTGAGE (Percentage Distribution)
FSBO AGENT-ASSISTED
All Sellers All FSBOSeller Knew
BuyerSeller did not Know Buyer
All Agent-assisted
Agent-assisted only
First FSBO, then Agent-assisted
Yes, and lived in home 11% 5% 5% 4% 11% 11% 12%
Yes, but rented home to others and lived elsewhere
1 2 1 1 2 2 4
No, sold home when I wanted to sell
87 93 94 95 87 87 84
EXHIBIT 8–13 METHOD USED BY FSBO SELLERS TO MARKET HOME (Percent of Respondents)
All FSBO Seller Knew Buyer Seller did not Know Buyer
Yard sign 33% 9% 54%
Third party aggregator 21 4 38
Open house 21 1 16
Friends, relatives, or neighbors 16 17 15
Multiple Listing Service (MLS) website 13 1 22
Online classified ads 10 5 14
Social networking Websites 9 3 15
For-sale-by-owner Website 7 * 14
Print newspaper advertisement 3 * 7
Realtor.com 2 * 4
Direct mail (flyers, postcards, etc) 2 * 3
Other Websites with real estate listings 1 1 1
Video 1 * 1
For-sale-by-owner magazine 1 3 *
Video hosting Websites * * *
Television * * *
Other * * *
None - Did not actively market home 41 69 15
* Less than 1 percent
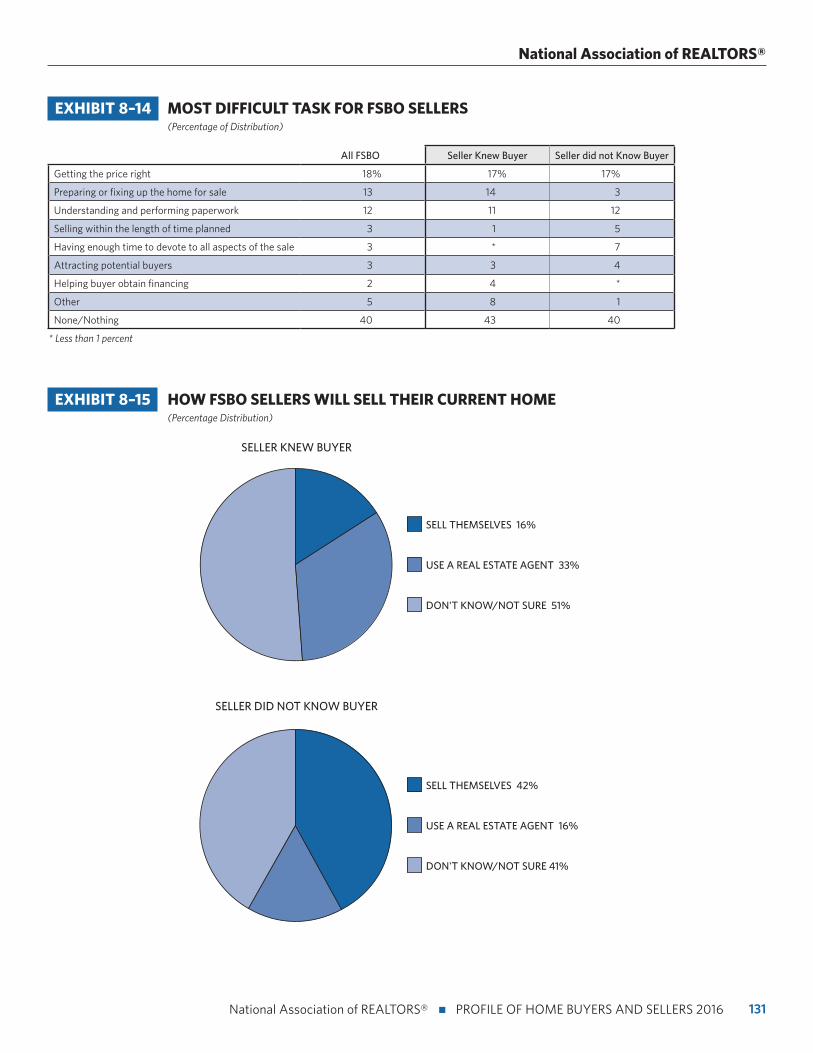
131 National Association of REALTORS® n PROFILE OF HOME BUYERS AND SELLERS 2016
National Association of REALTORS®
EXHIBIT 8–15 HOW FSBO SELLERS WILL SELL THEIR CURRENT HOME (Percentage Distribution)
SELLER KNEW BUYER
DON'T KNOW/NOT SURE 51%
USE A REAL ESTATE AGENT 33%
SELL THEMSELVES 16%
SELLER DID NOT KNOW BUYER
EXHIBIT 8–14 MOST DIFFICULT TASK FOR FSBO SELLERS (Percentage of Distribution)
All FSBO Seller Knew Buyer Seller did not Know Buyer
Getting the price right 18% 17% 17%
Preparing or fixing up the home for sale 13 14 3
Understanding and performing paperwork 12 11 12
Selling within the length of time planned 3 1 5
Having enough time to devote to all aspects of the sale 3 * 7
Attracting potential buyers 3 3 4
Helping buyer obtain financing 2 4 *
Other 5 8 1
None/Nothing 40 43 40
* Less than 1 percent
DON'T KNOW/NOT SURE 41%
USE A REAL ESTATE AGENT 16%
SELL THEMSELVES 42%
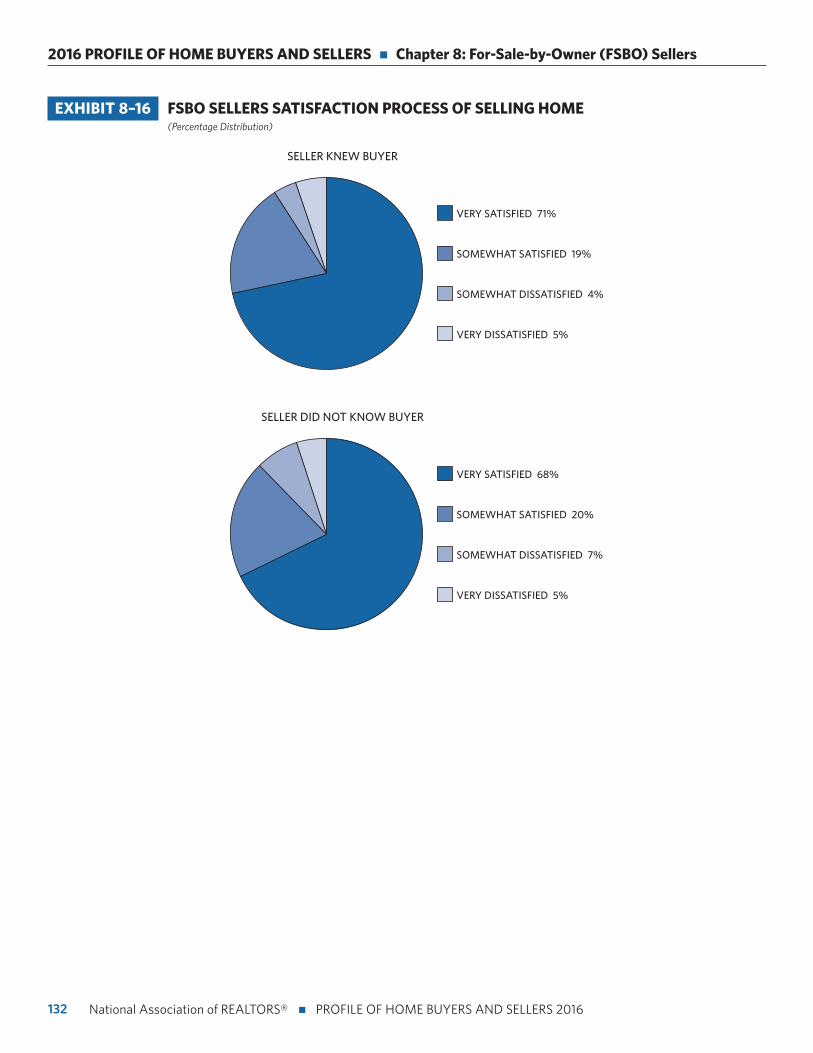
132
2016 PROFILE OF HOME BUYERS AND SELLERS n Chapter 8: For-Sale-by-Owner (FSBO) Sellers
National Association of REALTORS® n PROFILE OF HOME BUYERS AND SELLERS 2016
SELLER KNEW BUYER
VERY DISSATISFIED 5%
SOMEWHAT DISSATISFIED 4%
SOMEWHAT SATISFIED 19%
VERY SATISFIED 71%
SELLER DID NOT KNOW BUYER
VERY DISSATISFIED 5%
SOMEWHAT DISSATISFIED 7%
SOMEWHAT SATISFIED 20%
VERY SATISFIED 68%
EXHIBIT 8–16 FSBO SELLERS SATISFACTION PROCESS OF SELLING HOME (Percentage Distribution)

133
National Association of REALTORS®
National Association of REALTORS® n PROFILE OF HOME BUYERS AND SELLERS 2016
Methodology
In July 2016, NAR mailed out a 132-question survey using a
random sample weighted to be representative of sales on a
geographic basis to 93,171 recent home buyers. The recent
home buyers had to have purchased a primary residence
home between July of 2015 and June of 2016. A total of 5,465
responses were received from primary residence buyers. After
accounting for undeliverable questionnaires, the survey had an
adjusted response rate of 5.9 percent.
Respondents had the option to fill out the survey via hard
copy or online. The online survey was available in English and
Spanish.
Consumer names and addresses were obtained from Experian,
a firm that maintains an extensive database of recent home
buyers derived from county records. Information about sellers
comes from those buyers who also sold a home.
All information in this Profile is characteristic of the 12-month
period ending June 2016, with the exception of income data,
which are reported for 2015. In some sections comparisons
are also given for results obtained in previous surveys.
Not all results are directly comparable due to changes in
questionnaire design and sample size. Some results are
presented for the four U.S. Census regions: Northeast,
Midwest, South, and West. The median is the primary
statistical measure used throughout this report. Due to
rounding and omissions for space, percentage distributions
may not add to 100 percent.
From the 2016 Investment and Vacation Home Buyer Survey,
65 percent of home buyers were primary residence buyers,
which accounts for 3,738,000 homes sold in 2015. Using that
calculation, the sample at the 95 percent confidence level has
a confidence interval of plus-or-minus 1.32%.
134
2016 PROFILE OF HOME BUYERS AND SELLERS
National Association of REALTORS® n PROFILE OF HOME BUYERS AND SELLERS 2016
List of Exhibits
CHAPTER 1: CHARACTERISTICS OF HOME BUYERS
Exhibit 1–1 MEDIAN AGE OF HOME BUYERS, 1981–2016
Exhibit 1–2 AGE OF HOME BUYERS, BY REGION
Exhibit 1–3 HOUSEHOLD INCOME OF HOME BUYERS, BY REGION, 2015
Exhibit 1–4 ADULT COMPOSITION OF HOME BUYER HOUSEHOLDS, 1981–2016
Exhibit 1–5 NUMBER OF CHILDREN UNDER THE AGE OF 18 RESIDING IN HOUSEHOLD
Exhibit 1–6 HOME PURCHASED WAS A MULTI-GENERATIONAL HOME (WILL HOME ADULT SIBLINGS, ADULT CHILDREN, PARENTS, AND/OR GRANDPARENTS)
Exhibit 1–7 HOME BUYER SEXUAL ORIENTATION
Exhibit 1–8 RACE/ETHNICITY OF HOME BUYERS, BY REGION
Exhibit 1–9 RACE/ETHNICITY OF HOME BUYERS, BY ADULT COMPOSITION OF HOUSEHOLD
Exhibit 1–10 PRIMARY LANGUAGE SPOKEN IN HOME BUYER HOUSEHOLD, BY REGION
Exhibit 1–11 NATIONAL ORIGIN OF HOME BUYERS, BY REGION
Exhibit 1–12 SELF OR SPOUSE/PARTNER IS ACTIVE MILITARY OR VETERAN
Exhibit 1–13 FIRST-TIME HOME BUYERS, 1981–2016
Exhibit 1–14 FIRST-TIME HOME BUYERS, BY REGION
Exhibit 1–15 FIRST-TIME AND REPEAT HOME BUYERS BY HOUSEHOLD TYPE
Exhibit 1–16 FIRST-TIME AND REPEAT HOME BUYERS BY CHILDREN IN HOUSEHOLD
Exhibit 1–17 AGE OF FIRST-TIME AND REPEAT BUYERS
Exhibit 1–18 HOUSEHOLD INCOME OF FIRST-TIME AND REPEAT BUYERS, 2015
Exhibit 1–19 RACE/ETHNICITY OF FIRST-TIME AND REPEAT BUYERS
Exhibit 1–20 PRIMARY LANGUAGE SPOKEN IN FIRST-TIME AND REPEAT BUYER HOUSEHOLDS
Exhibit 1–21 NATIONAL ORIGIN OF FIRST-TIME AND REPEAT BUYERS
Exhibit 1–22 PRIOR LIVING ARRANGEMENT OF FIRST-TIME AND REPEAT BUYERS
Exhibit 1–23 PRIOR LIVING ARRANGEMENT, BY ADULT COMPOSITION OF HOUSEHOLD
Exhibit 1–24 PRIMARY REASON FOR PURCHASING A HOME, FIRST-TIME AND REPEAT BUYERS
Exhibit 1–25 PRIMARY REASON FOR PURCHASING A HOME, BY ADULT COMPOSITION OF HOUSEHOLD
Exhibit 1–26 PRIMARY REASON FOR THE TIMING OF HOME PURCHASE, FIRST-TIME AND REPEAT BUYERS
Exhibit 1–27 OTHER HOMES OWNED, BY AGE
135
National Association of REALTORS®
National Association of REALTORS® n PROFILE OF HOME BUYERS AND SELLERS 2016
CHAPTER 2: CHARACTERISTICS OF HOMES PURCHASED
Exhibit 2–1 NEW AND PREVIOUSLY OWNED HOMES PURCHASED, 1981–2016
Exhibit 2–2 NEW AND PREVIOUSLY OWNED HOMES PURCHASED, BY REGION
Exhibit 2–3 WHY BUYER PURCHASED A NEW AND PREVIOUSLY OWNED HOME
Exhibit 2–4 TYPE OF HOME PURCHASED, BY LOCATION
Exhibit 2–5 TYPE OF HOME PURCHASED BY FIRST-TIME AND REPEAT BUYERS, AND BUYERS OF NEW AND PREVIOUSLY OWNED HOMES
Exhibit 2–6 TYPE OF HOME PURCHASED, BY ADULT COMPOSITION OF HOUSEHOLD
Exhibit 2–7 TYPE OF HOME PURCHASED, 1981–2016
Exhibit 2–8 LOCATION OF HOME PURCHASED, BY REGION
Exhibit 2–9 LOCATION OF HOME PURCHASED BY FIRST-TIME AND REPEAT BUYERS, AND BUYERS OF NEW AND PREVIOUSLY OWNED HOMES
Exhibit 2–10 LOCATION OF HOME PURCHASED VERSUS LOCATION OF HOME SOLD
Exhibit 2–11 SENIOR-RELATED HOUSING BY TYPE OF HOME PURCHASED AND LOCATION
Exhibit 2–12 DISTANCE BETWEEN HOME PURCHASED AND PREVIOUS RESIDENCE
Exhibit 2–13 FACTORS INFLUENCING NEIGHBORHOOD CHOICE, BY LOCATION
Exhibit 2–14 FACTORS INFLUENCING NEIGHBORHOOD CHOICE, BY ADULT COMPOSITION OF HOUSEHOLD AND CHILDREN IN HOUSHOLD
Exhibit 2–15 PRICE OF HOME PURCHASED, BY REGION
Exhibit 2–16 PRICE OF HOME PURCHASED, NEW AND PREVIOUSLY OWNED HOMES
Exhibit 2–17 PRICE OF HOME PURCHASED, FIRST-TIME AND REPEAT BUYERS
Exhibit 2–18 PURCHASE PRICE COMPARED WITH ASKING PRICE, BY REGION
Exhibit 2–19 SIZE OF HOME PURCHASED, FIRST-TIME AND REPEAT BUYERS, AND BUYERS OF NEW AND PREVIOUSLY OWNED HOMES
Exhibit 2–20 SIZE OF HOME PURCHASED, BY ADULT COMPOSITION OF HOUSEHOLD
Exhibit 2–21 HOME SIZE AND PRICE PER SQUARE FOOT, BY REGION
Exhibit 2–22 NUMBER OF BEDROOMS AND BATHROOMS, BY FIRST-TIME AND REPEAT BUYERS, AND BUYERS OF NEW AND PREVIOUSLY OWNED HOMES
Exhibit 2–23 NUMBER OF BEDROOMS AND BATHROOMS, BY ADULT HOUSEHOLD COMPOSITION AND CHILDREN IN HOUSEHOLD
Exhibit 2–24 YEAR HOME BUILT, BY REGION
Exhibit 2–25 IMPORTANCE OF COMMUTING COSTS
Exhibit 2–26 IMPORTANCE OF HOME'S ENVIRONMENTALLY FRIENDLY FEATURES
Exhibit 2–27 ENVIRONMENTALLY FRIENDLY FEATURES CONSIDERED "VERY IMPORTANT", BY REGION
Exhibit 2–28 ENVIRONMENTALLY FRIENDLY FEATURES CONSIDERED "VERY IMPORTANT", BY YEAR HOME WAS BUILT
Exhibit 2–29 CHARACTERISTICS OF HOME ON WHICH BUYER COMPROMISED, BY LOCATION
List of Exhibits
136
2016 PROFILE OF HOME BUYERS AND SELLERS
National Association of REALTORS® n PROFILE OF HOME BUYERS AND SELLERS 2016
Exhibit 2–30 CHARACTERISTICS OF HOME ON WHICH BUYER COMPROMISED, FIRST-TIME AND REPEAT BUYERS, AND BUYERS OF NEW AND PREVIOUSLY OWNED HOMES
Exhibit 2–31 CHARACTERISTICS OF HOME ON WHICH BUYER COMPROMISED, BY ADULT COMPOSITION OF HOUSEHOLD
Exhibit 2–32 EXPECTED LENGTH OF TENURE IN HOME PURCHASED, FIRST-TIME AND REPEAT BUYERS, AND BUYERS OF NEW AND PREVIOUSLY OWNED HOMES
Exhibit 2–33 EXPECTED LENGTH OF TENURE IN HOME PURCHASED, BY AGE
Exhibit 2–34 FACTORS THAT COULD CAUSE BUYER TO MOVE, BY AGE
Exhibit 2–35 FACTORS THAT COULD CAUSE BUYER TO MOVE, BY ADULT COMPOSITION OF HOUSEHOLD
CHAPTER 3: THE HOME SEARCH PROCESS
Exhibit 3–1 FIRST STEP TAKEN DURING THE HOME BUYING PROCESS, FIRST-TIME AND REPEAT BUYERS
Exhibit 3–2 FIRST STEP TAKEN DURING THE HOME BUYING PROCESS, BY AGE
Exhibit 3–3 INFORMATION SOURCES USED IN HOME SEARCH, BY FIRST-TIME AND REPEAT BUYERS, AND BUYERS OF NEW AND PREVIOUSLY OWNED HOMES
Exhibit 3–4 INFORMATION SOURCES USED IN HOME SEARCH, BY AGE
Exhibit 3–5 FREQUENCY OF USE OF DIFFERENT INFORMATION SOURCES
Exhibit 3–6 USEFULNESS OF INFORMATION SOURCES
Exhibit 3–7 LENGTH OF SEARCH, BY REGION
Exhibit 3–8 LENGTH OF SEARCH FOR BUYERS WHO USED AN AGENT, BY FIRST-TIME AND REPEAT BUYERS
Exhibit 3–9 WHERE BUYER FOUND THE HOME THEY PURCHASED, 2001–2016
Exhibit 3–10 BUYER INTEREST IN PURCHASING A HOME IN FORECLOSURE, BY FIRST-TIME AND REPEAT BUYERS, AND BUYERS OF NEW AND PREVIOUSLY OWNED HOMES
Exhibit 3–11 MOST DIFFICULT STEPS OF HOME BUYING PROCESS BY FIRST-TIME AND REPEAT BUYERS AND BUYERS OF NEW AND PREVIOUSLY OWNED HOMES
Exhibit 3–12 BUYER USE OF INTERNET IN HOME SEARCH PROCESS, 1995–2016
Exhibit 3–13 ACTIONS TAKEN AS A RESULT OF INTERNET HOME SEARCH, FIRST-TIME AND REPEAT BUYERS
Exhibit 3–14 CHARACTERISTICS OF HOME SEARCHERS AND SEARCH ACTIVITY, BY USE OF INTERNET
Exhibit 3–15 INFORMATION SOURCES USED IN HOME SEARCH, BY USE OF INTERNET
Exhibit 3–16 WHERE BUYERS FOUND THE HOME THEY PURCHASED, BY USE OF INTERNET
Exhibit 3–17 METHOD OF HOME PURCHASE, BY USE OF INTERNET
Exhibit 3–18 VALUE OF WEBSITE FEATURES
Exhibit 3–20 MOBILE SEARCH BY FIRST-TIME AND REPEAT BUYERS
Exhibit 3–21 SATISFACTION IN BUYING PROCESS
List of Exhibits
137
National Association of REALTORS®
National Association of REALTORS® n PROFILE OF HOME BUYERS AND SELLERS 2016
CHAPTER 4: HOME BUYING AND REAL ESTATE PROFESSIONALS
Exhibit 4–1 METHOD OF HOME PURCHASE, 1981–2016
Exhibit 4–2 METHOD OF HOME PURCHASE, BY REGION
Exhibit 4–3 METHOD OF HOME PURCHASE, NEW AND PREVIOUSLY OWNED HOMES
Exhibit 4–4 METHOD OF HOME PURCHASE, BY ADULT COMPOSITION OF HOUSEHOLD
Exhibit 4–5 AGENT REPRESENTATION DISCLOSURE, FIRST-TIME AND REPEAT BUYERS
Exhibit 4–6 BUYER REPRESENTATIVE ARRANGEMENT WITH AGENT, FIRST-TIME AND REPEAT BUYERS
Exhibit 4–7 HOW REAL ESTATE AGENT WAS COMPENSATED
Exhibit 4–8 WHAT BUYERS WANT MOST FROM REAL ESTATE AGENTS
Exhibit 4–9 WHAT BUYERS WANT MOST FROM REAL ESTATE AGENTS, FIRST-TIME AND REPEAT BUYERS, AND BUYERS OF NEW AND PREVIOUSLY OWNED HOMES
Exhibit 4–10 WHAT BUYERS WANT MOST FROM REAL ESTATE AGENTS, BY ADULT COMPOSITION OF HOUSEHOLD
Exhibit 4–11 BENEFITS PROVIDED BY REAL ESTATE AGENT DURING HOME PURCHASE PROCESS, FIRST-TIME AND REPEAT BUYERS
Exhibit 4–12 HOW BUYER FOUND REAL ESTATE AGENT, FIRST-TIME AND REPEAT BUYERS
Exhibit 4–13 HOW BUYER FOUND REAL ESTATE AGENT, BY ADULT COMPOSITION OF HOUSEHOLD
Exhibit 4–14 HOW MANY TIMES CONTACTED AGENT BEFORE RECEIVED RESPONSE AND ORIGINAL FORM OF CONTACT
Exhibit 4–15 NUMBER OF REAL ESTATE AGENTS INTERVIEWED BY FIRST-TIME AND REPEAT BUYERS
Exhibit 4–16 MOST IMPORTANT FACTORS WHEN CHOOSING AN AGENT
Exhibit 4–17 IMPORTANCE OF REAL ESTATE AGENT SKILLS AND QUALITIES
Exhibit 4–18 AGENT SKILLS AND QUALITIES CONSIDERED 'VERY IMPORTANT' BY FIRST-TIME AND REPEAT BUYERS, AND BUYERS OF NEW AND PREVIOUSLY OWNED HOMES
Exhibit 4–19 AGENT SKILLS AND QUALITIES CONSIDERED 'VERY IMPORTANT' BY ADULT COMPOSITION OF HOUSEHOLD
Exhibit 4–20 IMPORTANCE OF AGENT COMMUNICATIONS
Exhibit 4–21 SATISFACTION WITH REAL ESTATE AGENT SKILLS AND QUALITIES
Exhibit 4–22 WOULD BUYER USE REAL ESTATE AGENT AGAIN OR RECOMMEND TO OTHERS
Exhibit 4–24 HOW MANY TIMES BUYER RECOMMENDED AGENT
List of Exhibits
138
2016 PROFILE OF HOME BUYERS AND SELLERS
National Association of REALTORS® n PROFILE OF HOME BUYERS AND SELLERS 2016
CHAPTER 5: FINANCING THE HOME PURCHASE
Exhibit 5–1 BUYERS WHO FINANCED THEIR HOME PURCHASE, BY AGE
Exhibit 5–2 BUYERS WHO FINANCED THEIR HOME PURCHASE, BY ADULT COMPOSITION OF HOUSEHOLD
Exhibit 5–3 PERCENT OF HOME FINANCED BY FIRST-TIME AND REPEAT BUYERS, AND BUYERS OF NEW AND PREVIOUSLY OWNED HOMES
Exhibit 5–4 MEDIAN PERCENT OF DOWNPAYMENT BY FIRST-TIME AND REPEAT BUYERS, 1989–2016
Exhibit 5–5 SOURCES OF DOWNPAYMENT, FIRST-TIME AND REPEAT BUYERS
Exhibit 5–6 SOURCES OF DOWNPAYMENT, BY ADULT COMPOSITION OF HOUSEHOLD
Exhibit 5–7 LENGTH OF TIME TO SAVE FOR A DOWNPAYMENT, FIRST-TIME AND REPEAT BUYERS
Exhibit 5–8 LENGTH OF TIME TO SAVE FOR A DOWNPAYMENT, BY ADULT COMPOSITION OF HOUSEHOLD
Exhibit 5–9 YEARS DEBT DELAYED HOME BUYERS FROM SAVING FOR A DOWNPAYMENT OR BUYING A HOME
Exhibit 5–10 EXPENSES THAT DELAYED SAVING FOR A DOWNPAYMENT OR SAVING FOR A HOME PURCHASE, BY FIRST-TIME AND REPEAT BUYERS
Exhibit 5–11 EXPENSES THAT DELAYED SAVING FOR A DOWNPAYMENT OR SAVING FOR A HOME PURCHASE, BY ADULT COMPOSITION OF HOUSEHOLD
Exhibit 5–12 SACRIFICES MADE TO PURCHASE HOME, BY FIRST-TIME AND REPEAT BUYERS
Exhibit 5–13 SACRIFICES MADE TO PURCHASE HOME, BY ADULT COMPOSITION OF HOUSEHOLD
Exhibit 5–14 DIFFICULTY OF MORTGAGE APPLICATION AND APPROVAL PROCESS, BY FIRST-TIME AND REPEAT BUYERS
Exhibit 5–15 DIFFICULTY OF MORTGAGE APPLICATION AND APPROVAL PROCESS, BY ADULT COMPOSITION OF HOUSEHOLD
Exhibit 5–16 BUYER MORTGAGE APPLICATION HAD BEEN REJECTED FROM MORTGAGE LENDER
Exhibit 5–17 BUYERS WHO HAVE STUDENT LOAN DEBT
Exhibit 5–18 BUYER PREVIOUSLY SOLD A DISTRESSED PROPERTY (SHORT SALE OR FORECLOSURE)
Exhibit 5–19 TYPE OF MORTGAGE, FIRST-TIME AND REPEAT BUYERS
Exhibit 5–20 TYPE OF LOAN, FIRST-TIME AND REPEAT BUYERS
Exhibit 5–21 BUYERS' VIEW OF HOMES AS A FINANCIAL INVESTMENT, FIRST-TIME AND REPEAT BUYERS, AND BUYERS OF NEW AND PREVIOUSLY OWNED HOMES
Exhibit 5–22 BUYERS' VIEW OF HOMES AS A FINANCIAL INVESTMENT, BY ADULT COMPOSITION OF HOUSEHOLD
CHAPTER 6: HOME SELLERS AND THEIR SELLING EXPERIENCE
Exhibit 6–1 AGE OF HOME SELLERS, BY REGION
Exhibit 6–2 HOUSEHOLD INCOME OF HOME SELLERS, 2015
Exhibit 6–3 ADULT COMPOSITION OF HOME SELLER HOUSEHOLDS, 2004–2016
Exhibit 6–4 NUMBER OF CHILDREN UNDER THE AGE OF 18 RESIDING IN HOME SELLER HOUSEHOLD
Exhibit 6–5 RACE/ETHNICITY OF HOME SELLERS, BY REGION
Exhibit 6–6 PRIMARY LANGUAGE SPOKEN IN HOME SELLER HOUSEHOLD, BY REGION
Exhibit 6–7 HOME SELLING SITUATION AMONG REPEAT BUYERS
List of Exhibits
139
National Association of REALTORS®
National Association of REALTORS® n PROFILE OF HOME BUYERS AND SELLERS 2016
Exhibit 6–8 FIRST-TIME OR REPEAT SELLER
Exhibit 6–9 HOMES SOLD AND FOR SALE, BY REGION
Exhibit 6–10 LOCATION OF HOME SOLD
Exhibit 6–11 PROXIMITY OF HOME SOLD TO HOME PURCHASED
Exhibit 6–12 TYPE OF HOME SOLD, BY LOCATION
Exhibit 6–13 SIZE OF HOME PURCHASED COMPARED TO HOME RECENTLY SOLD
Exhibit 6–14 SIZE OF HOME PURCHASED COMPARED TO HOME RECENTLY SOLD, BY AGE OF SELLER
Exhibit 6–15 NUMBER OF BEDROOMS AND BATHROOMS BY ADULT COMPOSITION OF HOUSEHOLD AND CHILDREN IN HOUSEHOLD
Exhibit 6–16 AGE OF HOME PURCHASED COMPARED TO HOME RECENTLY SOLD
Exhibit 6–17 PRICE OF HOME PURCHASED COMPARED TO HOME RECENTLY SOLD
Exhibit 6–18 PRICE OF HOME PURCHASED COMPARED TO HOME RECENTLY SOLD, BY AGE OF SELLER
Exhibit 6–19 PRIMARY REASON FOR SELLING PREVIOUS HOME, BY MILES MOVED
Exhibit 6–20 PRIMARY REASON FOR SELLING PREVIOUS HOME, BY FIRST-TIME AND REPEAT SELLERS
Exhibit 6–21 SELLER WANTED TO SELL EARLIER BUT WAITED OR STALLED BECAUSE HOME WAS WORTH LESS THAN MORTGAGE, BY FIRST-TIME AND REPEAT SELLERS
Exhibit 6–22 SELLER WANTED TO SELL EARLIER BUT WAITED OR STALLED BECAUSE HOME WAS WORTH LESS THAN MORTGAGE, BY TENURE IN HOME
Exhibit 6–23 TENURE IN PREVIOUS HOME
Exhibit 6–24 TENURE IN PREVIOUS HOME, BY AGE OF SELLER
Exhibit 6–25 MEDIAN SELLER TENURE IN HOME, 1985–2016
Exhibit 6–26 DISTANCE BETWEEN HOME PURCHASED AND HOME RECENTLY SOLD, BY REGION
Exhibit 6–27 DISTANCE BETWEEN HOME PURCHASED AND HOME RECENTLY SOLD, BY AGE
Exhibit 6–28 METHOD USED TO SELL HOME, BY REGION
Exhibit 6–29 METHOD USED TO SELL HOME, BY SELLER URGENCY
Exhibit 6–30 METHOD OF SALE, BY BUYER AND SELLER RELATIONSHIP
Exhibit 6–31 METHOD USED TO SELL HOME, 2001–2016
Exhibit 6–32 SALES PRICE COMPARED WITH LISTING PRICE, BY REGION
Exhibit 6–33 SALES PRICE COMPARED WITH LISTING PRICE, BY SELLER URGENCY
Exhibit 6–34 NUMBER OF WEEKS RECENTLY SOLD HOME WAS ON THE MARKET, BY REGION
Exhibit 6–35 SALES PRICE COMPARED WITH LISTING PRICE, BY NUMBER OF WEEKS HOME WAS ON THE MARKET
Exhibit 6–36 NUMBER OF TIMES ASKING PRICE WAS REDUCED, BY NUMBER OF WEEKS HOME WAS ON THE MARKET
Exhibit 6–37 INCENTIVES OFFERED TO ATTRACT BUYERS, BY REGION
Exhibit 6–38 INCENTIVES OFFERED TO ATTRACT BUYERS, BY NUMBER OF WEEKS HOME WAS ON THE MARKET
Exhibit 6–39 EQUITY EARNED IN HOME RECENTLY SOLD, BY TENURE IN HOME
Exhibit 6–40 SATISFACTION WITH THE SELLING PROCESS
List of Exhibits
140
2016 PROFILE OF HOME BUYERS AND SELLERS
National Association of REALTORS® n PROFILE OF HOME BUYERS AND SELLERS 2016
CHAPTER 7: HOME SELLING AND REAL ESTATE PROFESSIONALS
Exhibit 7–1 METHOD USED TO FIND REAL ESTATE AGENT, BY FIRST TIME OR REPEAT SELLER
Exhibit 7–2 METHOD USED TO FIND REAL ESTATE AGENT, BY MILES MOVED
Exhibit 7–3 NUMBER OF AGENTS CONTACTED BEFORE SELECTING ONE TO ASSIST WITH SALE OF HOME
Exhibit 7–4 SELLER USED THE SAME REAL ESTATE AGENT FOR THEIR HOME PURCHASE, BY MILES MOVED
Exhibit 7–5 HOME LISTED ON MULTIPLE LISTING SERVICE
Exhibit 7–6 LEVEL OF SERVICE PROVIDED BY THE REAL ESTATE AGENT, 2006–2016
Exhibit 7–7 WHAT SELLERS MOST WANT FROM REAL ESTATE AGENTS, BY LEVEL OF SERVICE PROVIDED BY THE AGENT
Exhibit 7–8 MOST IMPORTANT FACTOR IN CHOOSING A REAL ESTATE AGENT TO SELL HOME, BY LEVEL OF SERVICE PROVIDED BY THE AGENT
Exhibit 7–9 METHODS REAL ESTATE AGENT USED TO MARKET HOME
Exhibit 7–10 HOW REAL ESTATE AGENT WAS COMPENSATED
Exhibit 7–11 NEGOTIATING THE COMMISSION RATE OR FEE WITH THE REAL ESTATE AGENT
Exhibit 7–12 WOULD SELLER USE REAL ESTATE AGENT AGAIN OR RECOMMEND TO OTHERS
Exhibit 7–13 HOW MANY TIMES SELLER RECOMMENDED AGENT
CHAPTER 8: FOR-SALE-BY-OWNER (FSBO) SELLERS
Exhibit 8–1 FSBO AND AGENT-ASSISTED SALES, 1981–2016
Exhibit 8–2 FSBO AND AGENT-ASSISTED SALES, BY LOCATION
Exhibit 8–3 CHARACTERISTICS OF FSBO AND AGENT-ASSISTED SELLERS
Exhibit 8–4 TYPE OF HOME SOLD, FSBO AND AGENT-ASSISTED SELLERS
Exhibit 8–5 LOCATION OF HOME SOLD, FSBO AND AGENT-ASSISTED SELLERS
Exhibit 8–6 SELLING PRICE, FSBO AND AGENT-ASSISTED SELLERS
Exhibit 8–7 HOW FSBO SELLER DETERMINED ASKING PRICE OF HOME SOLD
Exhibit 8–8 TIME ON THE MARKET, FSBO AND AGENT-ASSISTED SELLERS
Exhibit 8–9 SELLER URGENCY, FSBO AND AGENT-ASSISTED SELLERS
Exhibit 8–10 INCENTIVES OFFERED TO ATTRACT BUYERS, FSBO AND AGENT-ASSISTED SELLERS
Exhibit 8–11 MOST IMPORTANT REASON FOR SELLING HOME AS FSBO
Exhibit 8–12 SELLER WANTED TO SELL EARLIER BUT WAITED OR STALLED BECAUSE HOME WAS WORTH LESS THAN MORTGAGE
Exhibit 8–13 METHOD USED BY FSBO SELLERS TO MARKET HOME
Exhibit 8–14 MOST DIFFICULT TASK FOR FSBO SELLERS
Exhibit 8–15 HOW FSBO SELLERS WILL SELL THEIR CURRENT HOME
Exhibit 8–16 FSBO SELLERS SATISFACTION PROCESS OF SELLING HOME
The National Association of REALTORS®, “The Voice for Real Estate,” is America’s largest trade association, representing 1.2 million members, including NAR’s institutes, societies and councils, involved in all aspects of the real estate industry. NAR membership includes brokers, salespeople, property managers, appraisers, counselors and others engaged in both residential and commercial real estate.
The term REALTOR® is a registered collective membership mark that identifies a real estate professional who is a member of the National Association of REALTORS® and subscribes to its strict Code of Ethics.
Working for America’s property owners, the National Association provides a facility for professional development, research and exchange of information among its members and to the public and government for the purpose of preserving the free enterprise system and the right to own real property.
NATIONAL ASSOCIATION OF REALTORS®RESEARCH DIVISION
The Mission of the National Association of REALTORS® Research Division is to collect and disseminate timely, accurate and comprehensive real estate data and to conduct economic analysis in order to inform and engage members, consumers, and policy-makers and the media in a professional and accessible manner.
To find out about other products from NAR’s Research Division, visit www.REALTOR.org/research-and-statistics.
NATIONAL ASSOCIATION OF REALTORS®Research Division500 New Jersey Avenue, NWWashington, DC [email protected]

500 New Jersey Avenue, NW • Washington, DC 20001-2020 800.874.6500 • www.REALTOR.org