Oculopalatal tremor explained by a model of inferior olivary hypertrophy and cerebellar plasticity...
11
Oculopalatal tremor explained by a model of inferior olivary hypertrophy and cerebellar plasticity by Aasef G. Shaikh, Simon Hong, Ke Liao, Jing Tian, David Solomon, David S. Zee, R. John Leigh, and Lance M. Optican Brain Volume 133(3):923-940 March 19, 2010 © The Author(s) 2010. Published by Oxford University Press on behalf of Brain.
-
Upload
octavia-campbell -
Category
Documents
-
view
218 -
download
0
Transcript of Oculopalatal tremor explained by a model of inferior olivary hypertrophy and cerebellar plasticity...

Oculopalatal tremor explained by a model of inferior olivary hypertrophy and cerebellar plasticity
by Aasef G. Shaikh, Simon Hong, Ke Liao, Jing Tian, David Solomon, David S. Zee, R. John Leigh, and Lance M. Optican
BrainVolume 133(3):923-940
March 19, 2010
© The Author(s) 2010. Published by Oxford University Press on behalf of Brain.

Schematic representation of the Guillain–Mollaret triangle formed by connections between the deep cerebellar nuclei and contralateral inferior olive, which pass near the red nucleus (A).
Aasef G. Shaikh et al. Brain 2010;133:923-940
© The Author(s) 2010. Published by Oxford University Press on behalf of Brain.

Three second epochs from records of binocular recordings from 15 OPT patients.
Aasef G. Shaikh et al. Brain 2010;133:923-940
© The Author(s) 2010. Published by Oxford University Press on behalf of Brain.
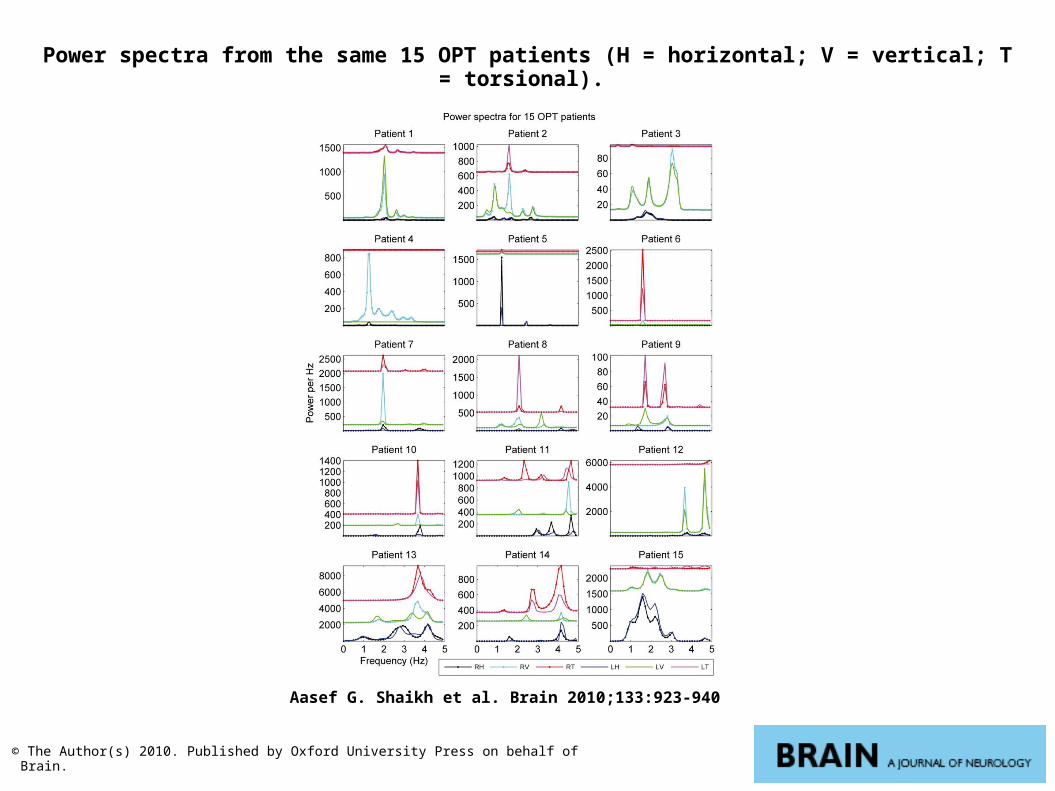
Power spectra from the same 15 OPT patients (H = horizontal; V = vertical; T = torsional).
Aasef G. Shaikh et al. Brain 2010;133:923-940
© The Author(s) 2010. Published by Oxford University Press on behalf of Brain.

Quantitative summary of the dominant frequency of OPT oscillations in each patient.
Aasef G. Shaikh et al. Brain 2010;133:923-940
© The Author(s) 2010. Published by Oxford University Press on behalf of Brain.
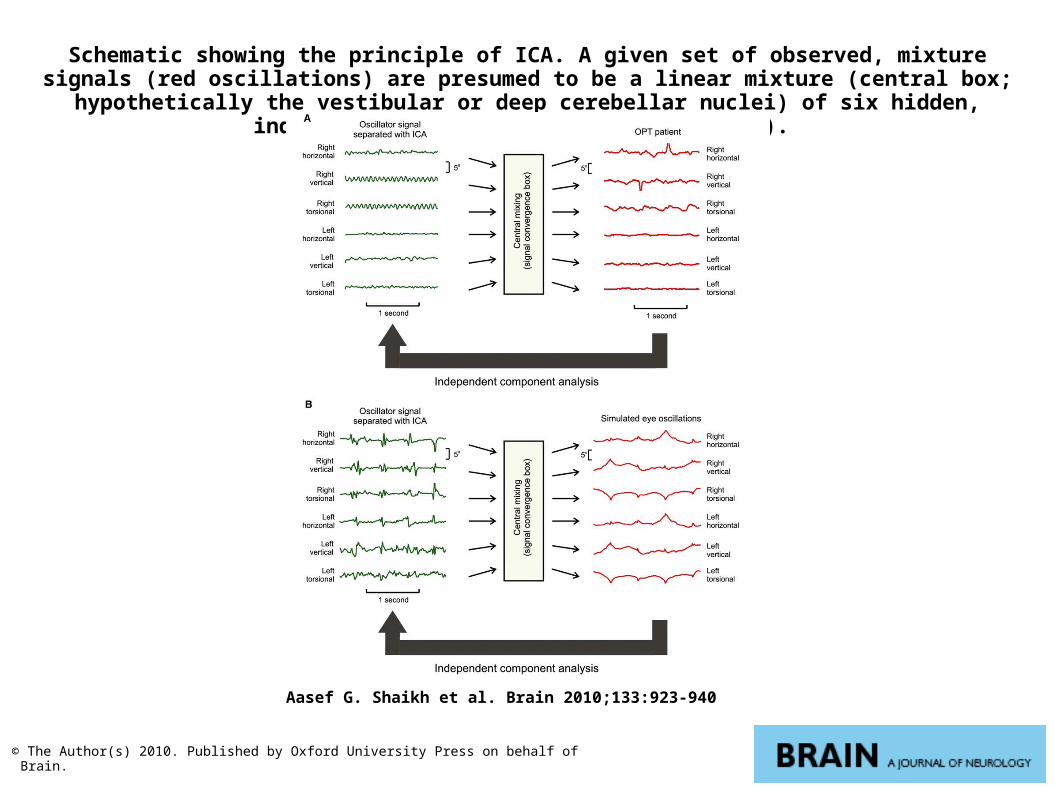
Schematic showing the principle of ICA. A given set of observed, mixture signals (red oscillations) are presumed to be a linear mixture (central box; hypothetically the vestibular or
deep cerebellar nuclei) of six hidden, independent oscillators (green waveforms).
Aasef G. Shaikh et al. Brain 2010;133:923-940
© The Author(s) 2010. Published by Oxford University Press on behalf of Brain.

An example of cycles where the residual signal (black trace), i.e. the difference of the actual signal (cyan trace) and presumed inferior olive spike (red trace) lagged (A) or led (B) the peak of
the inferior olive spike.
Aasef G. Shaikh et al. Brain 2010;133:923-940
© The Author(s) 2010. Published by Oxford University Press on behalf of Brain.

The qualitative illustration of 3D oscillations generated by 15 de novo model simulations (same format as Fig. 2; see legend for colors).
Aasef G. Shaikh et al. Brain 2010;133:923-940
© The Author(s) 2010. Published by Oxford University Press on behalf of Brain.

Power spectra from the same 15 simulations (format is the same as Fig. 3; see legend for colors).
Aasef G. Shaikh et al. Brain 2010;133:923-940
© The Author(s) 2010. Published by Oxford University Press on behalf of Brain.

The effects of progressively reducing the contribution of cerebellar learning or inferior olive coupling on OPT. Top row shows effects of reducing the modulation of the deep cerebellar
nuclei by Purkinje neurons (PC).
Aasef G. Shaikh et al. Brain 2010;133:923-940
© The Author(s) 2010. Published by Oxford University Press on behalf of Brain.
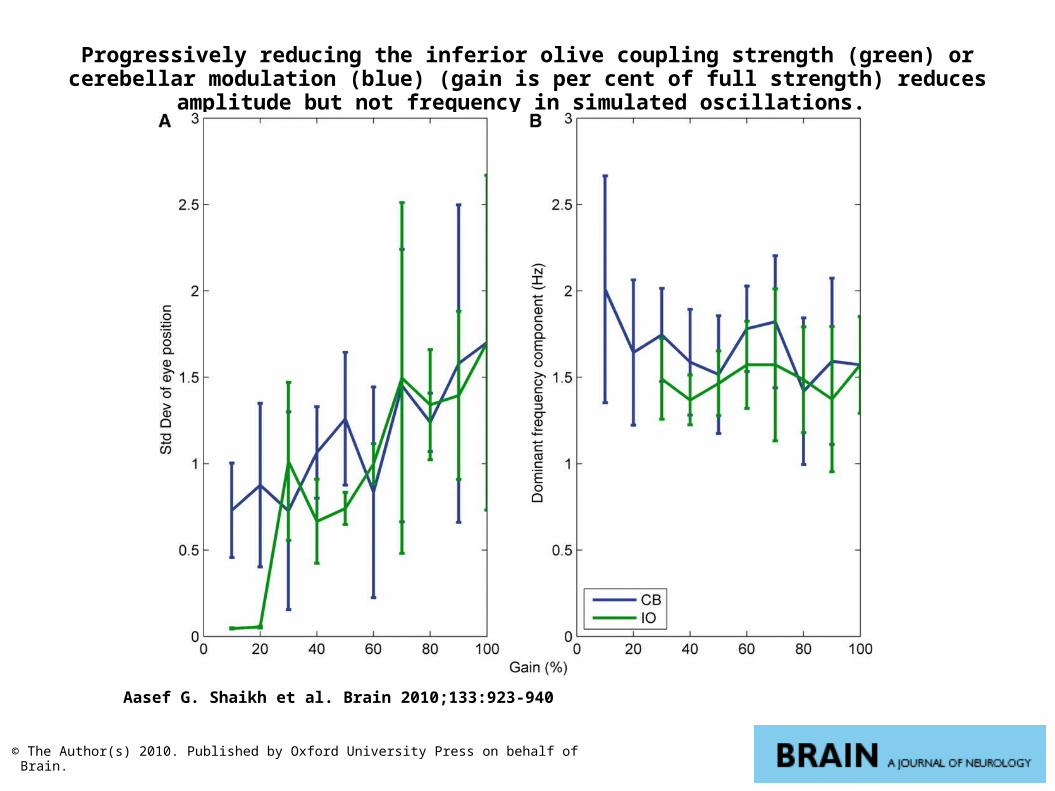
Progressively reducing the inferior olive coupling strength (green) or cerebellar modulation (blue) (gain is per cent of full strength) reduces amplitude but not frequency in simulated
oscillations.
Aasef G. Shaikh et al. Brain 2010;133:923-940
© The Author(s) 2010. Published by Oxford University Press on behalf of Brain.