Nyack College School of Education
9
Nyack College School of Education Annual Report 2020-2021 HIGHLIGHTS Programs and Enrollment: Enrollment at formal Pre-Service Performance Data: admission to the School of Education continues to Candidates have been rated well above embrace historically underrepresented groups. the minimum point of meeting standard Interests are trending higher for Initial Certification on the student teaching evaluation, and programs and for Graduate level programs and are their performances approximate those of about even for on-ground and online delivery the State or national average for the CST methods. and edTPA licensure exams. Nyack College is accredited by the Middle Licensure and Employment Statistics: Program completers demonstrated the ability to achieve licensure in NY State when they applied for it. Completers, when employment was shared, demonstrated their commitment to teaching high needs populations in public and private schools in the NY City metropolitan area, including teaching in shortage fields. They also demonstrated ability to persist in the teaching profession. Stakeholder Satisfaction: Employers expressed satisfaction with program completers' performance at higher rates than completers rated satisfaction with their own performance. Completers expressed very strong overall satisfaction with their preparation at Nyack College-- 73% Very Satisfied and 27% Satisfied. States Association of Colleges and Schools. The School of Education is nationally accredited by the Council for Accreditation of Educator Preparation for initial preparation programs and by CAEP extension of NCATE accreditation for its advanced level programs. All School of Education programs are registered with the New York State Education Department. All School of Education B.S., Mus.B., and B.S./M.S. programs are nationally accredited by the Association of Christian Schools International as programs leading to ACSI international teaching licensure. PROGRAMS AND NATIONAL RECOGNITIONS/ACCREDITATIONS Gr 1-6: Childhood Education, B.S., Initial Certification; Nationally Recognized by ACEI Gr 1-6: Childhood Education, M.S., Initial or Additional Certification; Nationally Recognized by ACEI Gr 1-6: Childhood Special Education, B.S./M.S., Initial Certification (dual cert); Nationally Recognized by ACEI and CEC Gr 1-6: Childhood Special Education, M.S., Initial or Additional Certification; Nationally Recognized by CEC PreK-Gr 12: Inclusive Education, M.S., Professional Certification, option for Bilingual Education Extension PreK-Gr 12: Music Education, B.S. Initial Certification; Rockland Campus Nationally Accredited by NASM Note: This report does not include data from programs under teach-out (Adolescence Education programs, Early Childhood Education programs, and TESOL programs) with the exception that all programs are included in the Title II licensure test pass rates; other data available by request only.
Transcript of Nyack College School of Education

Nyack College School of Education Annual Report 2020-2021
HIGHLIGHTS Programs and Enrollment: Enrollment at formal Pre-Service Performance Data: admission to the School of Education continues to Candidates have been rated well above embrace historically underrepresented groups. the minimum point of meeting standard Interests are trending higher for Initial Certification on the student teaching evaluation, and programs and for Graduate level programs and are their performances approximate those of about even for on-ground and online delivery the State or national average for the CST methods. and edTPA licensure exams.
Nyack College is accredited by the Middle
Licensure and Employment Statistics: Program completers demonstrated the ability to achieve licensure in NY State when they applied for it. Completers, when employment was shared, demonstrated their commitment to teaching high needs populations in public and private schools in the NY City metropolitan area, including teaching in shortage fields. They also demonstrated ability to persist in the teaching profession.
Stakeholder Satisfaction: Employers expressed satisfaction with program completers' performance at higher rates than completers rated satisfaction with their own performance. Completers expressed very strong overall satisfaction with their preparation at Nyack College--73% Very Satisfied and 27% Satisfied.
States Association of Colleges and Schools. The School of Education is nationally
accredited by the Council for Accreditation of Educator Preparation for initial preparation programs and by CAEP extension of NCATE
accreditation for its advanced level programs. All School of Education programs are
registered with the New York State Education Department. All School of Education B.S.,
Mus.B., and B.S./M.S. programs are nationally accredited by the Association of Christian
Schools International as programs leading to ACSI international teaching licensure.
PROGRAMS AND NATIONAL RECOGNITIONS/ACCREDITATIONS Gr 1-6: Childhood Education, B.S., Initial Certification; Nationally Recognized by ACEI Gr 1-6: Childhood Education, M.S., Initial or Additional Certification; Nationally Recognized by ACEI Gr 1-6: Childhood Special Education, B.S./M.S., Initial Certification (dual cert); Nationally Recognized by ACEI and CEC Gr 1-6: Childhood Special Education, M.S., Initial or Additional Certification; Nationally Recognized by CEC PreK-Gr 12: Inclusive Education, M.S., Professional Certification, option for Bilingual Education Extension PreK-Gr 12: Music Education, B.S. Initial Certification; Rockland Campus Nationally Accredited by NASM
Note: This report does not include data from programs under teach-out (Adolescence Education programs, Early Childhood Education programs, and TESOL programs) with the exception that all programs are included in the Title II licensure test pass rates; other data available by request only.
ENROLLMENT STATISTICS AND TRENDS Enrollment information is derived from the Title II data set and does not include non-certification students or those yet to be formally admitted. Enrolled candidates are those who have been formally admitted to the School of Education (typically Juniors, Seniors, and Graduate students). Of the 2020 Fall enrollment, 76% were from historically underrepresented race/ethnicity groups, 9% were male, and 38% of undergraduates were Pell Grant eligible. The enrollment trend showed a decline in total numbers, a shift in on-campus to online enrollment, and an increased percentage of graduate level enrollment. Initial Certification is consistently the strongest certification track regardless of program level. By program, interest continues to be highest in Childhood Education and Childhood Special Education. Enrollment patterns demonstrate a slight downward trend overall for Childhood Education, Childhood Special Education, and Inclusive Education, but enrollment has held steady for Music Education.
Data for formally admitted students
Current Fall , • 91%
By Campus By Degree Level
27 24 I 24
• 16
Rockland
■ New York City
■ Online I 111 ■ Master's
■ Bachelor's
Enrollment by Program 2016-17 2017-18 ■ 2018-19 ■ 2019-20 ■ 2020-21
18 18 19 13
11 15 1■ 13 4 2 2 ---Childhood Ch. Special Ed Music Ed
Current Fall
Male
Female
• White
• Hispanic/Latino of any race
e Black/ African American
• Two or more races
• Asian
Current Fall {Ugd)
62%'. Pell Grant Eligible
Not Pell Eligible
By Certification Type
18 111
7 8
Professional Certification
■ Add'I/Profl Certification
■ Initial
2 ---Inclusive Ed
Average Teaching Competencies Rubric Performance (Past 3 Years) ■ Childhood Education FA19 Childhood Education 17-19 ■ Childhood Special Ed FA19 Childhood Special Ed 17-19
■ Music Education FA19 Music Education 17-19 - Nyack Average FA19 • • Nyack Average 17-19 Meets Expectations (2+) 4.0 -------------------------------------------
3.0 ---~
2.0 -■ 1.0 =-
The Leamer and Leaming Content Knowledge Instructional Practice Professional Responsibilities
Average edTPA Portfolio Performance (Past 3 Years)* ■ Childhood Education 17-20 ■ Childhood Special Ed 17-20 ■ Music Education 17-20 - Nyack Average 17-20
• • Nyack Average 16-17 - - National Avg 2018 Meets Expectations (3+) 4.0 --------------------------------------
3.5 --------------------
3.0 -----
2.5
2.0 Task 1 Planning Task 2 Instruction Task3 Assessment
Content Specialty Test Pass Rates (Past 3 Years)*
I I
Multi-Subject 1-6: ELA
Multi-Subject 1-6: Math
Multi-Subject: Art-Sci
SWDCST
Music CST
::============================================================================================:::::::=============================::::: Average Content Specialty Test Performances (Past 3 Years) Music CST (Past 3 Years)*
600 554 ■ Nyack Mean 300 238 ■ 536 538 539 Nyack Mean
250 550 ■ NV State Mean
200 NV State
500 --- -------- ------ -- Passing 520 150 -- Passing 220 Multi-Subject CST 1-6: ELA Multi-Subject CST 1-6: Math Multi-Subect CST: LAS Students with Disabilities CST 100
Music CST
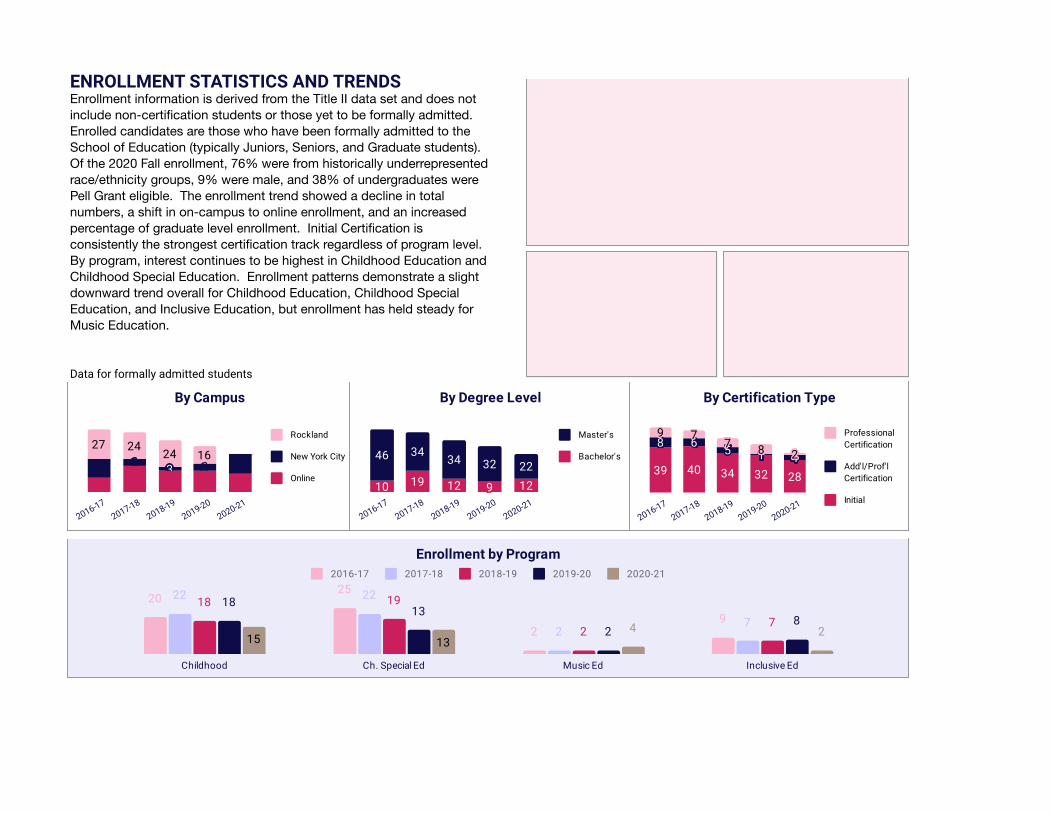
PRE-SERVICE PERFORMANCE DATA Candidates complete a number of formative and summative assessments over the course of a preparation program. The following summative assessments include program completer data from a student teaching performance assessment called the Teaching Competencies Rubric (TCR), the State licensure exam called the Content Specialty Test (CST) that varies by program, and the State's capstone clinical project for licensure called the edTPA. The average performance on the student teaching TCR was well above meeting expectations for each category. Childhood Special Education and Childhood Education majors showed improved performance on the revised TCR implemented in Fall 2019 (Music Ed scores for Fall 2019 represent a single student and have not been displayed to protect identity). The average performance on the student teaching edTPA approximated the national average for each Task in the portfolio. The CST examination pass rates were between 87% and 100% for program completers in 2017-18 to 2019-20 for each test, and the average scaled scores approximated the NY State averages for the same time period.
*Initial certification only

Debrief Survey Analyze
CAEP ANNUAL ACCREDITATION REPORT MEASURES
MEASURES 1 & 2: Impact on P-12 Learning and Development, and Indicators of Teaching Effectiveness New York State Education Department (NYSED) does not release measures of P-12 student learning/development to teacher preparation programs nor on indicators of teaching effectiveness. The School of Education has developed a Case Study to track impact on P-12 student learning/development and on teaching effectiveness through the use of multiple integrated instruments: (1) structured observation of classroom instruction using instructional items from the student teaching rubric; (2) debriefing meeting eliciting completer analysis of student learning and use of assessment via prompts similar to select edTPA and National Board Certification prompts and via interview questions for qualitative perception data, evaluated by local evaluation edTPA rubrics 10-15 and assessment items from the student teaching rubric; (3) alumni satisfaction survey seeking completer quantitative perception data on both teaching performance and program preparation. Thus far the case study has included 2 participants, which is insufficient for analysis and display. Recent institutional consolidation and pandemic factors have impacted ability to conduct the case study, but it is anticipated that sufficient data for analysis and presentation will be available by the 2024 report.

• Public School 100%
Unknown
• Christian School 75% Rural
Charter School ■ Suburban
50%
■ Urban Private School
Unknown 25%
0%
• Special Education 100%
Unknown/ Not 37 High Needs
TESOL/Bilingual 75%
■ High Needs Local Shortage • NY City Metro • NewYorkState Field 50% ,-
us Northeast Region 48.1% Not a Shortage
Other US Regions/Inf I 25% . Unknown
0%
MEASURES 3 & 7: Satisfaction of Employers and Employment Milestones, and Ability of Completers to be Hired in Education Positions for Which They Have Been Prepared
Employment Statistics Past Five Cohorts (2015-16 to 2019-20) Data for these statistics has been compiled in the Alumni Tracking Database from alumni self-reporting and from information searchable in the TEACH system for New York State licensure. Just over fifty percent of the past five graduating cohorts reported their employment: 84% of those were employed in accordance with their preparation (in field), 11% were employed in education in grade levels above or below their preparation (related field); and 5% were not employed in education (unrelated field). Nyack's School of Education program completers demonstrated their consistent commitment to teaching students in high-needs, urban settings and shortage areas, particularly in the New York City metropolitan area. Over 50% of completers labeled as employed in-field or in a related field began teaching in the NY City metropolitan area; 42% began in public schools, 17% in Christian schools, and 38% in other charter or private schools; 29% taught in high needs schools; 45% taught in an an urban setting; and 42% taught in shortage fields like special education, TESOL/bilingual, or STEM.
Employment the first year after graduation
- 84% employed in accordance with their preparation (in field) - 11% employed in education in grade levels above/below preparation (related field)

Retained to Year 2 in Same School/District Retained to Year 3 in Same School/District
60.0%
Employer Satisfaction with Completer Perfonnance
The Learner and Learning
Content Knowledge
Instructional Practice
Professional Responsibility
Impact on Student Learning
Retention/Tenure Progress
2 3
3.5
3.4
3.5 3.5
3.6
3.6
Very Dissatisfied -------Very Satisfied
4
• Retained
Unknown or Changed Schools
66.0%
Persisted to Year 3 in Any School
46.0%
• In Field (Full-Time)
e In Field (Part-Time)
Related Field (in Ed, out of prep)
Unknown
• Retained
Unknown or Changed Schools
Completer Qualifications Prompting Employer to Hire
Academic achievement (GPA, etc.) .,,r, ·. Academic background (Nyack) ....
Personality •m • •
Portfolio ~
Professional preparedness •
Licensed area(s) ••
Interviewer's recommendation
Other I
0% 25% 50% 75%
Retention with the same district/school Of the 2013-14 through 2017-18 completers employed in Education in the first year after graduation, 40% were known to have been retained in the same employment to Year 2 and 34% were known to be so to Year 3.
Persistence in the field of education, regardless of employer Persistence Rate (Yr 3 Employment Known) Of all 2013-14 through 2017-18 completers employed in
Education in the first year after graduation, regardless of retention with the same employer, 54% were known to persist 100.0%in teaching to Year 3. Of only those whose employment was known at Year 3, it represents a 100% persistence rate.
Employer Satisfaction with Program Completer Performance Data gathered from employers in 2016, 2017, and 2018 indicated a strong sense of satisfaction with program completer performance in the classroom in all categories. Employers' perception of candidates' professional preparedness, licensure area, and their degree conferral from Nyack College were the top three contributors to employers' decisions to hire. Due to the complex demands of the pandemic on educators, employers will not be contacted for survey participation until the 2021-22 academic year.

Completer Self-Satisfaction with In-Service Perfonnance Completer Satisfaction with Program Preparation
The Learner and Learning
Content Knowledge
Instructional Practice
Professional Responsibility
Impact on Student Learning
Retention/Tenure Progress
2 3 Very Dissatisfied -------
Program Completers by Year
3.5 ■ Very Dissatisfied Dissatisfied Satisfied ■ 3.5
100%
3.5 75%
3.4 50%
3.4 25%
3.3 0%
Preparation for Preparation for Preparation for Preparation for
4 the Learner and Content Instructional Professional
Very Satisfied Learning Knowledge Practice Responsibility
Program Completers by Major (Past 1 O Years)
Childhood Education
Childhood Special Education
Inclusive Ed II MusicEd-
Very Satisfied
27%
Overall Satisfaction
MEASURE 4: Satisfaction of Completers Data gathered from program completers of 2017, 2018, 2019, 2020 indicated a sense of self-satisfaction with their performance in the classroom in all categories. Program completers' satisfaction with the preparation they received at Nyack College for corresponding categories was even stronger, with 100% satisfaction levels. Alumni overall satisfaction with the teacher preparation programs had greatest representation in the Very Satisfied rating.
MEASURE 5: Graduation Rates, plus Program Retention and Completion
Program Retention and Completion Past Ten Cohorts (2010-11 to 2019-20) Graduation information is derived from the same data set as Title II data. Over the last 10 years, the programs have graduated approximately 23 completers per year who are eligible for teacher certification--primarily in Childhood and Childhood Special Education. Graduation rates have held steadily around two-thirds graduating within 150% expected time, whereas retention rates, representing more recent cohorts, have risen steadily over time.
Retention Rate*
100% 1920 to 2021
Graduation Rate**
61% Cohorts: 2014 ugd, 2016 grad
*From formal admission **150% program length

MEASURE 6: Ability of Completers to Meet Licensing and State Requirements for Certification Past Five Cohorts (2015-16 to 2019-20) Data for licensure test pass rates has been gathered from from Title II reporting and includes graduates from all initial certification programs (including those under teach-out). Pass rates had been near 90% levels for the 4 graduating cohorts, and were at or above the known New York State average institutional pass rates, prior to the State removing testing "safety nets". The most recent dip reflects primarily the expiration of the edTPA safety net. Data for initial NY certification has been gathered from the Alumni Tracking Database, which is compiled from alumni self-reporting and from information searchable in the TEACH system for New York State licensure. Nearly three-quarters of program completers achieved NY certification; the other one-quarter either did not apply for certification or needed to pass one or more licensure tests to achieve eligibility.
Licensure Test Pass Rates NY Certification
100% Unknown
100% 90% 91%89% 82% ■ Nyack College
2.6% Missing Cert Reqs
75% 65% 69% ■ NY State Average 14.3%
No Cert Application 50% 13.0%
25%
NY Cert Achieved 0%
2015-16 2016-17 2017-18 2018-19 2019-20 70.1%

Undergraduate Tuition Per Semester (12-18 er)
$ 25,000 _______________ _;$c_2_2..:...,9_1_6 __
$ 20,000 ----------S-l6;125 $14,492
$ 15,000 __ $.J1,=50=0---
$ 10,000 ----■-'--Nyack College Competitor A Competitor B Competitor C
■ 2018-19 ■ 2019-20 ■ 2020-21
Graduate Tuition Per Credit
$1,300 -----------$1 ,035 $1,140 _______ , ________ $_9.8A __
$980 --$725 $820 ------$ 660 $ 500
Nyack College Competitor A Competitor B Competitor C
■ 2018-19 ■ 2019-20 ■ 2020-21
MEASURE 8: Student Loan Default Rates and Other Consumer Information
Student Loan Default Rate The institutional student loan default rate in fiscal year 2017 was 11.4%, comparable with the national 10.4% student loan default rate.
Estimated Tuition Costs Nyack College maintains competitive pricing for private school undergraduate and graduate education in the New York City metropolitan area. Nyack’s 2020-21 tuition is about $2,400 to $10,400 less per semester for undergraduate costs than its local competitors (that’s approximately $19,400-$83,400 less per 8-semester program), and is about $200 to $275 less per credit than the competitors’ graduate tuition (that’s approximately $6,000-$8,250 less per 30-credit program). This is, of course, prior to adjustments for scholarships, grants, room/board, and fees dependent on the individual. The local competitors sampled for comparison are within a 15-mile radius of the college. New competitors will be selected to reflect the campus consolidation to Manhattan.