Nutrition country profile : The Hashemite Kingdom of · PDF fileFOOD AND NUTRITION PROFILE THE...
65
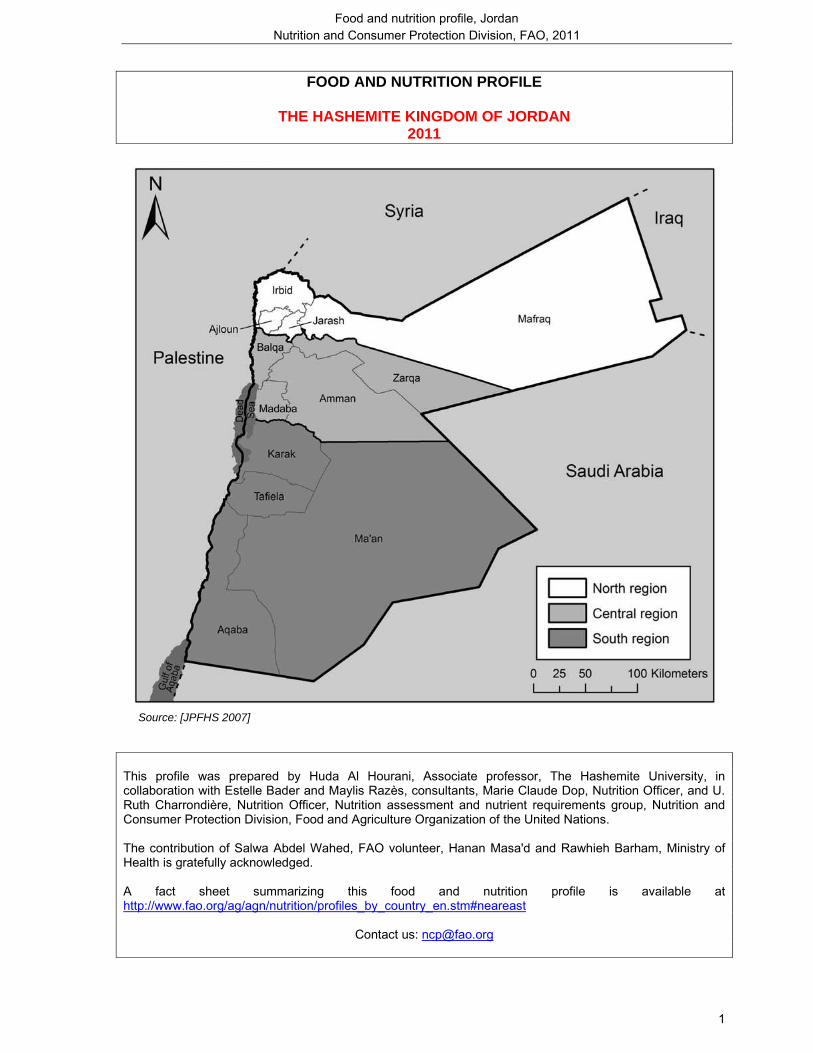
Food and nutrition profile, Jordan Nutrition and Consumer Protection Division, FAO, 2011 1 FOOD AND NUTRITION PROFILE THE HASHEMITE KINGDOM OF JORDAN 2011 Source: [JPFHS 2007] This profile was prepared by Huda Al Hourani, Associate professor, The Hashemite University, in collaboration with Estelle Bader and Maylis Razès, consultants, Marie Claude Dop, Nutrition Officer, and U. Ruth Charrondière, Nutrition Officer, Nutrition assessment and nutrient requirements group, Nutrition and Consumer Protection Division, Food and Agriculture Organization of the United Nations. The contribution of Salwa Abdel Wahed, FAO volunteer, Hanan Masa'd and Rawhieh Barham, Ministry of Health is gratefully acknowledged. A fact sheet summarizing this food and nutrition profile is available at http://www.fao.org/ag/agn/nutrition/profiles_by_country_en.stm#neareast Contact us: [email protected]
Transcript of Nutrition country profile : The Hashemite Kingdom of · PDF fileFOOD AND NUTRITION PROFILE THE...
Food and nutrition profile, Jordan Nutrition and Consumer Protection Division, FAO, 2011
1
FOOD AND NUTRITION PROFILE
THE HASHEMITE KINGDOM OF JORDAN 2011
Source: [JPFHS 2007]
This profile was prepared by Huda Al Hourani, Associate professor, The Hashemite University, in collaboration with Estelle Bader and Maylis Razès, consultants, Marie Claude Dop, Nutrition Officer, and U. Ruth Charrondière, Nutrition Officer, Nutrition assessment and nutrient requirements group, Nutrition and Consumer Protection Division, Food and Agriculture Organization of the United Nations. The contribution of Salwa Abdel Wahed, FAO volunteer, Hanan Masa'd and Rawhieh Barham, Ministry of Health is gratefully acknowledged. A fact sheet summarizing this food and nutrition profile is available at http://www.fao.org/ag/agn/nutrition/profiles_by_country_en.stm#neareast
Contact us: [email protected]
Food and nutrition profile, Jordan Nutrition and Consumer Protection Division, FAO, 2011
2
TABLE OF CONTENTS List of tables and figures .............................................................................................................................3 Acronyms ......................................................................................................................................................4 I: Food supply and consumption.................................................................................................................5
I.1 Description and analysis of food consumption ................................................................................ 5 Food consumption patterns................................................................................................................................................................................... 5 Analysis of food consumption survey results ..................................................................................................................................................... 5 Analysis of dietary diversity survey results ......................................................................................................................................................... 6
I.2 Food supply ......................................................................................................................................... 6 Supply of major food groups ................................................................................................................................................................................. 6 Dietary energy supply, distribution by macronutrient........................................................................................................................................ 7 Vegetable/animal origin of macronutrients ......................................................................................................................................................... 8 Dietary energy supply by food group and dietary diversification index ......................................................................................................... 8
I.3 Origin of food supply .......................................................................................................................... 9 Characteristics of national food production ........................................................................................................................................................ 9 Food imports and food aid..................................................................................................................................................................................... 9
I.4 Physical and economic access to food ........................................................................................... 10 II: Nutritional status and feeding practices of infants and young children ............................................ 11
II.1 Infant and young child feeding practices ....................................................................................... 11 II.2 Anthropometry.................................................................................................................................. 12
Low birth weight .................................................................................................................................................................................................... 12 Anthropometry of preschool children................................................................................................................................................................. 12
II.3 Micronutrient status ......................................................................................................................... 14 Iodine deficiency disorders (IDD) ....................................................................................................................................................................... 14 Vitamin A deficiency (VAD) ................................................................................................................................................................................. 15 Iron deficiency anemia ......................................................................................................................................................................................... 16 Other micronutrient deficiencies......................................................................................................................................................................... 17
II. 4. Main infant and young child health and mortality indicators...................................................... 18 III: Women’s nutritional status................................................................................................................... 20
III.1 Anthropometry................................................................................................................................. 20 III.2 Micronutrient status ........................................................................................................................ 20
Vitamin A deficiency (VAD) ................................................................................................................................................................................. 20 Iron deficiency anemia ......................................................................................................................................................................................... 21 Long-term measures to combat micronutrient deficiencies........................................................................................................................... 22
III. 3 Health, water and sanitation .......................................................................................................... 23 Health ...................................................................................................................................................................................................................... 23 Access to health care services ........................................................................................................................................................................... 23 Access to an improved water source and to improved sanitation ................................................................................................................ 23
III. 4 Women’s empowerment ................................................................................................................ 24 IV: Nutritional status of other groups of population ................................................................................ 26
IV.1. School-age children....................................................................................................................... 26 Anthropometry ....................................................................................................................................................................................................... 26 Micronutrient deficiencies .................................................................................................................................................................................... 26
IV.2. Adolescents.................................................................................................................................... 26 Anthropometry ....................................................................................................................................................................................................... 26 Micronutrient deficiencies .................................................................................................................................................................................... 26
IV.3. Men.................................................................................................................................................. 26 Anthropometry ....................................................................................................................................................................................................... 26 Micronutrient deficiencies .................................................................................................................................................................................... 27
V: Human and economic resources .......................................................................................................... 28 V.1. Human resources............................................................................................................................ 28
Population .............................................................................................................................................................................................................. 28 Literacy and education ......................................................................................................................................................................................... 28
V.2. Economic resources....................................................................................................................... 29 Policies and programmes aiming to improve nutrition and food security............................................. 30 Appendixes ................................................................................................................................................. 32 Appendix I: Food supply and consumption ............................................................................................. 32 Appendix II: Nutritional status and feeding practices of young children............................................... 33 Appendix III: Women’s nutritional status.................................................................................................. 50 List of references........................................................................................................................................ 59
Food and nutrition profile, Jordan Nutrition and Consumer Protection Division, FAO, 2011
3
List of tables and figures List of tables in profile: Table 1: Trends in the supply of major food groups (in g/capita/day) ..............................................................6 Table 2: Micronutrient deficiencies among children ...................................................................................... 17 Table 3: Health indicators ............................................................................................................................. 19 Table 4: Micronutrient deficiencies among women ....................................................................................... 22 Table 5: Major indicators of health, access to water and sanitation .............................................................. 24 Table 6: Human indicators ............................................................................................................................ 29 Table 7: Economic indicators........................................................................................................................ 29 List of tables in appendixes: Table A.1: Food consumption data ............................................................................................................... 32 Table A.2: Initiation and duration of breastfeeding........................................................................................ 33 Table A.3: Adequate infant and young child feeding practices...................................................................... 34 Table A.4: Consumption of complementary foods, and meal frequency by breastfeeding status and age.... 35 Table A.5: Anthropometry of preschool children ........................................................................................... 36 Table A.5: Anthropometry of preschool children (cont’d) .............................................................................. 37 Table A.5: Anthropometry of preschool children (cont’d) .............................................................................. 39 Table A.5: Anthropometry of preschool children (cont’d) .............................................................................. 40 Table A.5: Anthropometry of preschool children (cont’d) .............................................................................. 41 Table A.6: Prevalence of goitre and level of urinary iodine in school-age children........................................ 42 Table A.6: Prevalence of goitre and level of urinary iodine in school-age children (cont’d) ........................... 43 Table A.6: Prevalence of goitre and level of urinary iodine in school-age children (cont’d) ........................... 44 Table A.7: Iodization of salt at household level ............................................................................................. 44 Table A.8: Prevalence of sub-clinical vitamin A deficiency in children from 1 to 5 years ............................... 45 Table A.8: Prevalence of sub-clinical vitamin A deficiency in children from 1 to 5 years (cont’d) .................. 45 Table A.9: Percentage of children who consumed foods rich in vitamin A and foods rich in bioavailable iron in the 24 hours preceding the survey................................................................................................................ 46 Table A.10: Vitamin A supplementation of children....................................................................................... 47 Table A.11: Prevalence of anemia in preschool children .............................................................................. 47 Table A.11: Prevalence of anemia in preschool children (cont’d).................................................................. 48 Table A.11: Prevalence of anemia in preschool children (cont’d).................................................................. 49 Table A.11: Prevalence of anemia in preschool children (cont’d).................................................................. 49 Table A.12: Anthropometry of adult women.................................................................................................. 50 Table A.12: Anthropometry of adult women (cont’d) ..................................................................................... 51 Table A.12: Anthropometry of adult women (cont’d) ..................................................................................... 52 Table A.13: Prevalence of sub-clinical vitamin A deficiency in women.......................................................... 53 Table A.14: Prevalence of anemia in women of childbearing age................................................................. 53 Table A.14: Prevalence of anemia in women of childbearing age (cont’d) .................................................... 54 Table A.14: Prevalence of anemia in women of childbearing age (cont’d) .................................................... 55 Table A.15: Percentage of mothers having consumed foods rich in vitamin A and foods rich in bioavailable iron in the 24 hours preceding the survey ..................................................................................................... 56 Table A.16: Vitamin A and iron supplementation of women of childbearing age........................................... 57 Table A.16: Vitamin A and iron supplementation of women of childbearing age (cont’d) .............................. 58 List of figures � Figure 1: Supply of major food groups in comparison with neighbouring countries ................................ 7 � Figure 2: Dietary energy supply (DES), trends and distribution by macronutrient................................... 8 � Figure 3: Dietary energy supply (DES) by food group ............................................................................ 8 � Figure 4: Cereal balance sheet: ........................................................................................................... 10 � Figure 5: Main characteristics of infant and young child feeding practices ........................................... 12 � Figure 6: Trends in the prevalence of stunting among children under five years of age, according to
place of residence ................................................................................................................................ 14 � Figure 7: Distribution of causes of deaths among children under 5 years of age.................................. 18 � Figure 8: Ever-married women’s education level (highest education level attended or completed) ...... 24 � Figure 9: Population pyramid................................................................................................................ 28
Food and nutrition profile, Jordan Nutrition and Consumer Protection Division, FAO, 2011
4
Acronyms AARDO Afro-Asian Rural Development Organization BCG Bacille Calmette–Guérin BFHI Baby Friendly Hospital Initiative BMI Body mass index CED Chronic energy deficiency CFS Committee on World Food Security DAPID Department of Agricultural Policies and International Directorate DES Dietary energy supply DoS Department of Statistics DPT3 Diphtheria, Pertussis (whooping cough) and Tetanus vaccine – three doses DRI Daily Recommended Intake EMRO Eastern Mediterranean Regional Office (of the World Health Organization) FAO Food and Agriculture Organization of the United Nations FAOSTAT FAO Statistical databases FEWSNET Famine Early Warning Systems Network FIVIMS Food Insecurity and Vulnerability Information and Mapping Systems GDP Gross domestic product GIEWS Global Information and Early Warning System GoJ Government of the Hashemite Kingdom of Jordan HDI Human development index HEIS Household Expenditure and Income Survey HIV/AIDS Human immunodeficiency virus/Acquired immunodeficiency syndrome ICCIDD International Council for the Control of Iodine Deficiency Disorders IDA Iron deficiency anemia IDD Iodine deficiency disorders IDR Import dependency ratio IFAD International Fund for Agriculture Development IFPRI International Food Policy Research Institute ILO International Labour Office IYCF Infant and young child feeding JAAH Jordanian Alliance Against Hunger JPFHS Jordan Population and Family Health Survey LBW Low birth weight MICS Multiple Indicator Cluster Survey MoE Ministry of Education MoH Ministry of Health MPIC Ministry of Planning and International Cooperation NCFA National Council for Family Affairs OKH Office of the King Hussein ORT Oral rehydration therapy PPP Purchase power parity RSW Regional Surveys of the World UN United Nations UNAIDS Joint United Nations Programme on HIV/AIDS UNDP United Nations Development Programme UNESCO United Nations Educational, Scientific and Cultural Organization UNICEF United Nations Children’s Fund UNIDO United Nations Industrial Development Organization UNPD United Nations Population Division UNSTAT United Nations Statistics Division USAID United States Agency for International Development VAD Vitamin A deficiency WB World Bank WFP World Food Programme WHO World Health Organization
Food and nutrition profile, Jordan Nutrition and Consumer Protection Division, FAO, 2011
5
I: Food supply and consumption
I.1 Description and analysis of food consumption
Food consumption patterns In Jordan, the staple foods are wheat and rice. Khobez, a leavened flat bread (pita bread) is consumed daily with most meals and often used to scoop other foods. Vegetables such as tomatoes, cucumbers, lettuce, bell peppers, green beans, okra, cauliflower, eggplants, spinach and summer squash occupy an important place in the diet; they are cooked with rice or as stew or are consumed raw as a salad. Yogurt is used in some dishes. Consumption of fruit (apples, oranges, bananas, grapes, figs, watermelons, apricots and peaches) varies according to season. There are three main meals during the day. The traditional breakfast consists of fried eggs, labaneh (drained yoghurt), cheese, hummus, falafel, zaatar (thyme with sesame seeds, salt and a condiment called sumak), olive oil and some fresh vegetables such as tomatoes and cucumbers along with bread and a cup of tea. Lunch is the main meal, but due to urbanization and changes in working hours, lunches bringing all family members together become scarce (except on Fridays and holidays). It is even becoming common to skip lunch and have only a heavy meal at dinner time. A typical meal generally consists of a main dish made of rice, meat (mainly chicken, beef or lamb) and cooked vegetables accompanied by small side dishes. The most popular Jordanian main dish is mansaf – lamb cooked in dried yoghurt called jameed and served with rice. Maklobeh (rice cooked with fried eggplants or cauliflower and chicken or lamb) is also a common dish. Hummus, motabal, tabouli1 and dishes made of yogurt and salad are typical small side dishes accompanying the main dish especially at lunch and dinner. Dinner is generally similar to breakfast or it could consist of a sandwich of falafel, chawerma or beef burger with tea or soft drinks. Chawerma (pita bread filled with grilled chicken or lamb) or falafel sandwiches (pita bread sandwich filled with a mix of deep-fried chickpeas, spices, and parsley) are eaten as quick meals or light snacks. Black tea, the national drink of Jordan, is consumed mainly at breakfast or dinner and after lunch. Food consumption patterns do not much vary by governorates but they differ by place of residence. In urban areas, the diet is shifting towards a more westernized style. Many households take their meals away from home, the consumption of fast foods, ready-to-eat processed foods, rich in fat and salt, sweeteners and soft drinks is increasing. Due to the increasing number of working women, time often lacks to prepare a home cooked meal. Some dishes are considered incompatible with modern working life and are reserved for weekends and special occasions. In rural areas, the diet remains more traditional; households depend mainly on homemade foods and less on ready-to-eat foods. In these areas, meals mainly consist of cereals (bread, rice or both of them), cooked vegetables and meat or chicken. Yogurt usually accompanies lunch meals. Signs of the nutrition transition, currently ongoing in urban areas, also appear in rural areas (large consumption of sweeteners, double burden of malnutrition in preschool children, etc.). When meals are eaten with friends and relatives, men and women eat separately. In these situations, men are traditionally offered food first. When only the immediate family is present, children and women are served first (Madanat et al., 2008).
Analysis of food consumption survey results (Table A.1: Food consumption data) The National Household Expenditure and Income Survey (HEIS) conducted in 2008 provides estimates of household food acquisition which are taken as proxies of consumption (DoS, 2009). Data on quantity and value of food products acquired by households were collected in four rounds of one week each, between March 2008 and February 2009. The sample included about 13 000 households [HEIS 2008]. Results from HEIS 2008 highlight the importance of cereals and fruit/vegetables in the diet: about 500 g of cereals/day were consumed per household member, mainly bread and rice. Consumption of fruit and vegetables2 reached more than 400 g/person/day. This food group consists mainly of tomatoes, cucumbers,
1 Hummus is a dip of pureed chickpeas with tahini, i.e. sesame seed paste, garlic and lemon juice; motabal is made of grilled eggplant with tahini paste; tabouli is a salad traditionally made of bulgur, tomato, cucumber, and finely chopped parsley and mint. 2 Some fruit and vegetables (canned fruit and vegetables, lettuce, parsley mint) are not taken into account in the calculation as they are expressed in piece. Their quantity is however limited.
Food and nutrition profile, Jordan Nutrition and Consumer Protection Division, FAO, 2011
6
watermelon, banana, apple and orange. The mean daily consumption of meat (mainly poultry and lamb) was 150 g/capita/day which is high [HEIS 2008]. Consumption of fruit/vegetables, oil/fats, and fish/seafood was higher in urban areas than in rural areas while consumption of cereals was higher in rural areas. Consumption of meat was similar in both areas [HEIS 2008]. HEIS are conducted on a regular basis (approximately every 5 years). However, due to methodological issues, it is difficult to assess accurately trends in food consumption. Households spent about 40% of their expenditure on foods [HEIS 2008], a share that has been rising since 2006 (33%) [HEIS 2006], probably as a result of the increase in food prices.
Analysis of dietary diversity survey results No data on dietary diversity are currently available.
I.2 Food supply (FAO, FAOSTAT, 2011)
Supply of major food groups
Table 1: Trends in the supply of major food groups (in g/capita/day) Supply for human consumption in g/capita/day
Food groups 1965-67
1970-72
1975-77
1980-82
1985-87
1990-92
1995-97
2000-02
2005-07
Fruit/vegetables 703 372 289 324 517 477 451 419 459 Cereals 349 414 418 432 428 457 443 407 439 Milk/milk products 119 144 163 203 212 203 155 167 211 Sweeteners 88 75 95 127 119 117 99 113 132 Meat/offals 24 42 49 79 111 92 90 100 108 Starchy roots 28 21 38 46 34 42 48 48 63 Vegetable oils 24 28 27 26 28 36 43 48 50 Pulses/nuts/oilcrops 34 29 31 48 42 41 32 51 46 Other 9 12 12 14 14 13 11 15 15 Fish/shellfish 4 4 7 9 13 9 13 12 15 Eggs 9 13 14 18 17 24 21 17 13 Animal fats 1 1 1 3 4 3 3 3 2
Fruit/vegetables, cereals and milk/milk products are the major food groups in terms of supply for human consumption. A huge decrease in the per capita supply of fruit/vegetables (tomatoes, cucumber, oranges, bananas, apples, etc.) was observed in the late 1960s, probably as a result of the loss of the West Bank (1967), which cut off some 80% of the fruit-growing area and 45% of the area under vegetables. Production of fruit/vegetables increased in the late 1970s, due in particular to a remarkable development in irrigated agriculture from the mid-1970s to the mid-1980s, and currently the per capita supply is rather high (RSW, 2004; DAPID, no date). The per capita supply of cereals, which consists mainly of wheat and, to a much lesser extent of rice, has remained rather stable since the early 1980s. Within this food group, supply of rice tends to increase slightly over the period. The per capita supply of starchy roots (potatoes), albeit low, has more than doubled over the last four decades, due to various programmes implemented by the private sector and supported by the government providing access to land and water; imports have also increased. A significant increase is observed in the per capita supply of foods of animal origin. That of milk/milk products almost doubled between 1965-67 and 2005-2007 and that of meat (mainly poultry meat) showed a four-fold increase over a 20-year period from 1965-67 to 1985-87; it has remained rather stable since. This significant increase in supply can be explained by an increased local production of meat (due to barley subsidization) and by increased imports of beef and poultry. The per capita supply of fish/shellfish is still low but it has also showed a large increase over the last four decades. The per capita supply of sweeteners and vegetable oils increased considerably over the whole period. The per capita supply of olive oil (locally produced) has considerably decreased to the advantage of that of
Food and nutrition profile, Jordan Nutrition and Consumer Protection Division, FAO, 2011
7
imported soybean, sunflower and palm oil. These imported vegetable oils are widely used for cooking and are less expensive than olive oil, which accompanies salads and zaatar. Food supply estimates are rather consistent with food consumption data. The significant increase in foods of animal origin, vegetable oils and sweeteners in the supply since the 1960s reflects the nutrition transition in Jordan.
• Figure 1: Supply of major food groups in comparison with neighbouring countries
Figure 1: Supply for human consumption (2005-2007)
0
100
200
300
400
500
600
700
800
900
Cereals Fruits andvegetables
Meat and offals Fish andseafood
Milk and milkproducts
Vegetable oils Sweeteners
g/pe
r cap
ita/d
ay
Jordan Lebanon Syrian Arab Republic
Per capita supply of fruit/vegetables, rather high in Jordan, is however lower than that in neighbouring countries, especially when compared to Lebanon where the supply is particularly high. Despite a large increase in the supply of milk/milk products supported by rising demand, the per capita supply of this food group is still lower in Jordan than in Lebanon and Syrian Arab Republic (Alqaisi et al., 2009).
Dietary energy supply, distribution by macronutrient The dietary energy supply (DES) has increased quite steadily during the 40-year period considered to reach 2979 kcal/capita/day in 2005-2007, well above the population energy requirements of 2056 kcal/capita/day (FAO, 2004). The drop in the DES that occurred between 1995 and 2002 when compared to 1990-92 may be partially explained by a severe drought in 1999, when the wheat harvest met only 1% of domestic supply compared to more than 10% in 1992, a record year; increased imports were insufficient to offset this sharp drop. The share of carbohydrates in the DES has consistently decreased to the benefit of that of lipids, which are currently close to the upper limit of recommendations (30%). These changes are mainly related to the increasing supply of vegetable oils, meat and milk/milk products. The share of protein in the DES has not increased since 1965-67 and remains at the lower limit of recommendations (10%); in absolute terms however protein supply rose due to the higher supply of milk/dairy products and meat (WHO/FAO, 2003).
Food and nutrition profile, Jordan Nutrition and Consumer Protection Division, FAO, 2011
8
• Figure 2: Dietary energy supply (DES), trends and distribution by macronutrient
11%11% 11%11%11%11%11%11%10%
21%19%21%18%22% 22% 24% 27% 26%
64%63%65%67%66%69%
70%69%71%
0
500
1000
1500
2000
2500
3000
1965-67 1970-72 1975-77 1980-82 1985-87 1990-92 1995-97 2000-02 2005-07
kcal
/day
Protein Lipids Carbohydrates
Daily EnergyRequirements: 2056 kcal/per capita
Source: FAOSTATJordan
Figure 2: Trends in DES per capita and percentages from protein, lipids & carbohydrates
Vegetable/animal origin of macronutrients The contribution of foods of animal origin to the energy (12%), protein (33%) and lipid (27%) supply is currently rather high (reference period 2005-2007) and the contribution of foods of animal origin to the protein supply has almost doubled since the 1960s.
Dietary energy supply by food group and dietary diversification index
• Figure 3: Dietary energy supply (DES) by food group
Cereals46%
Sweeteners15%
Vegetable oils14%
Meat/offals6%
Milk/milk products5%
Eggs1%
Pulses/nuts/oilcrops
5%Fruit/vegetables5%
Starchy roots2% Other
1%
JordanSource: FAOSTATNote: values <1% (animal fats and fish/shellfish) are not shown.
Figure 3: Percentage of DES by food groups, in 2005-2007
The percentage of DES provided by vegetable oils and, to a lesser extent, by meat/offals, has increased. On the other hand, the share of cereals and fruit/vegetables in the DES has declined over the last 40 years. The food diversification index (share of foods other than cereals and starchy roots in the DES) has increased over the last four decades to reach 52% in 2005-2007. Dietary diversification has improved and is currently quite high. Nevertheless, it is worth noting that the contribution of vegetable oils and sweeteners in the DES (29%) is very important, the latter exceeding the upper limit of recommendations (10%) (WHO/FAO, 2003).
Food and nutrition profile, Jordan Nutrition and Consumer Protection Division, FAO, 2011
9
I.3 Origin of food supply
Characteristics of national food production Jordan can be divided into four physiographic regions starting from the West and running from North to South: the Jordan Rift Valley which is the food bowl of Jordan for fruit and vegetables (Alqaisi et al., 2009), the Highlands where agriculture is mostly rainfed, the plains, and the Badia desert region in the east, which represents about 80% of the total country area (FAO, AQUASTAT, 2008). Jordan is one of the ten most water-poor countries in the world (IFAD, 2007). Only about 4% of the total land area is arable, mostly in the northwest and central areas; about 84% of this is rainfed and the rest is irrigated (UNDP, 2010a). The major share of local agricultural production consists of fruit and vegetables (tomatoes, cucumber, citrus fruits, bananas, etc.), which is the production that receives the most support from the Government. Potatoes and olives are also produced in rather large quantities. Local production of cereals has decreased considerably since the early 1960s while that of starchy roots, animal products and fruit/vegetables has increased substantially over the same period (FAO, FAOSTAT, 2011). Smallholder agriculture still suffers from poor market linkages and limited marketing facilities (IFAD, 2007). Livestock-keeping (mainly sheep and goats) is an important activity in the rainfed, semi-desert areas (IFAD, 2007). However, production of meat is limited, though the production of poultry is active. Local production of milk is not sufficient to meet local demand (FAO, FAOSTAT, 2011). The marine fishing industry in Jordan is small and artisanal, while aquaculture production is expanding (FAO, Fisheries and Aquaculture Department, no date).
Food imports and food aid Jordan is dependent on food imports and thus particularly vulnerable to international food price shocks. The total food import bill has more than tripled between 1995 and 2008 (FAO, 2010). In 2005-2007, the major food groups imported for human consumption in terms of quantity were cereals (mainly wheat), sweeteners, milk/milk products and vegetable oils (mainly palm oil and soybean oil). The country’s dependence on imports of cereals has gone up: the import dependency ratio3 (IDR) increased from 41% in 1965-67 to reach as much as 98% in 2005-2007 for this commodity (FAO, FAOSTAT, 2011). However, Jordan has a re-export activity of food products (towards the Gulf countries in particular) that makes the interpretation of the IDR difficult. Wheat import requirements for 2010-2011 were estimated at about 1 million tonne. The year before, the Government decided to raise strategic stocks from three to six months reserve as a precaution against future increases in food prices (FAO, 2011b). Jordan’s fish demand is satisfied almost entirely by imports. The main food group exported in terms of quantity is vegetables (FAO, FAOSTAT, 2011). Food aid is mainly received for Palestinian refugees (Personal Al-Hindi WFP communication). In 2005-2007, cereal food aid (grain equivalent) represented approximately 4% of the national cereal supply for human consumption (FAO, FAOSTAT, 2011; WFP, FAIS, 2011). However, food aid, and in particular cereal food aid, has decreased considerably since 2007 as food aid delivered as programme has stopped (WFP, FAIS, 2011). In 2009, Jordan received a total food aid of 4234 t, of which 374 t of cereals (mainly rice) and 3860 t of non-cereals (mainly sugar and vegetable oil). Almost all food aid (98%) was delivered as project food aid4 in 2009 (WFP, FAIS, 2011).
3 Import dependency ratio is defined as: IDR = (quantity imported / (quantity produced + quantity imported – quantity exported)) *100. It represents the share of domestic supply which comes from imports. IDR takes into account supply of food groups (quantity) whatever its utilization and not only what is destined to human consumption. 4 Emergency food aid is destined to victims of natural or man-made disasters; Project food aid aims at supporting specific poverty-alleviation and disaster-prevention activities; Programme food aid is usually supplied as a resource transfer for balance of payments or budgetary support activities. Unlike most of the food aid provided for project or emergency purposes, it is not targeted to specific beneficiary groups. It is sold on the open market, and provided either as a grant, or as a loan.
Food and nutrition profile, Jordan Nutrition and Consumer Protection Division, FAO, 2011
10
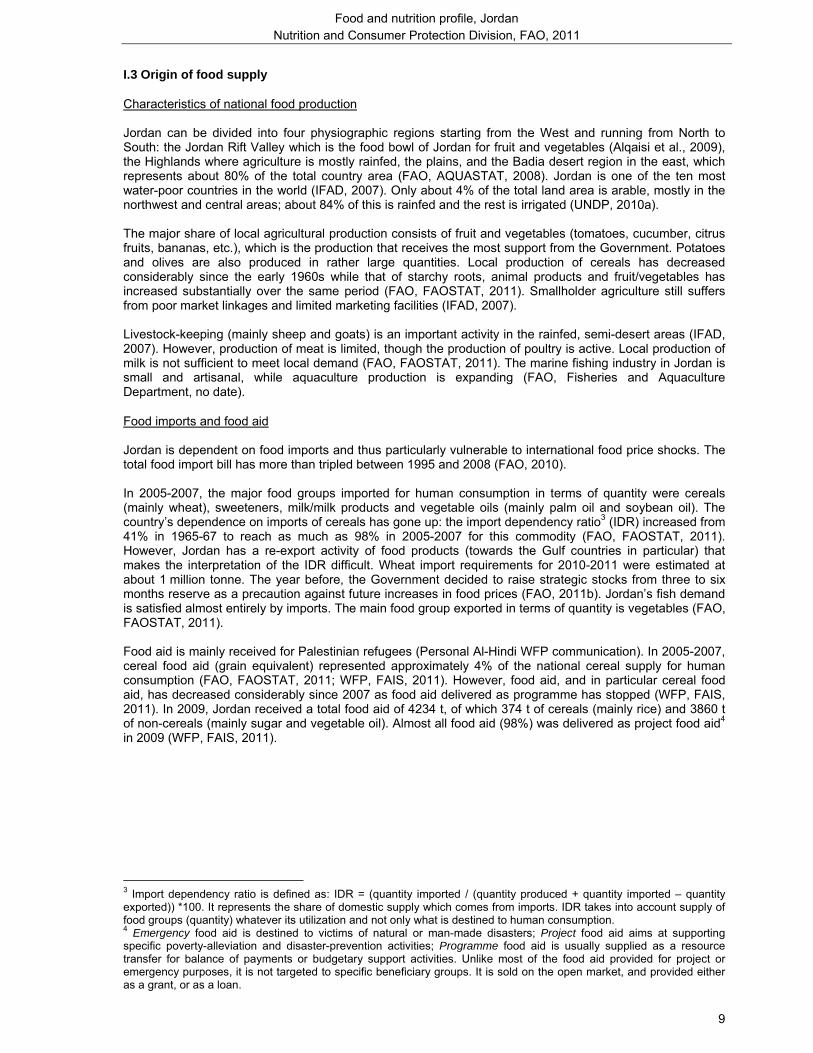
• Figure 4: Cereal balance sheet:
Figure 4: Cereal balance sheet - Jordan
0
500,000
1,000,000
1,500,000
2,000,000
2,500,000
1965-67 1970-72 1975-77 1980-82 1985-87 1990-92 1995-97 2000-02 2005-07
Ton
nes
(gra
in e
quiv
alen
t)
Production Net imports Food aid
Sources: FAO, FAOSTAT, 2011; WFP, FAIS, 2011. Note: food aid data for the period from 1965-67 to 1990-92 are not available and are thus included in imports.
I.4 Physical and economic access to food It is likely that economic access to food is a concern for a significant part of the population. Despite a decrease in the incidence of poverty between 2002 and 2006, 13% of the population was still below the national poverty line in 2006. The incidence of poverty was higher in rural areas (19%) than in urban areas (12%). The governorates of Mafraq, Karak and Tafileh showed the highest incidence of poverty while Amman, Madaba and Irbid showed the lowest (WB and DoS, 2009). In parallel, inflation has been high in the past decade (FEWSNET, 2011). The government responded to the recent hike in international food prices through increased subsidies on food and increase of food stocks, see Policies and programmes aiming to improve nutrition and food security (FEWSNET, 2011). In 2008, WFP conducted the first food security survey at the household level in poverty areas5. Based on Food Consumption Score and food access indicators (income and expenditure), the survey revealed that 8% of households living in poverty areas were food insecure and 20% were vulnerable to food insecurity. In rural areas, food insecurity affected 11% of households, twice as much as in urban areas (5%). In response to the 2008 food price increase, many households living in these poverty pockets were forced to reduce the quantity (especially fruit, meat and dairy products) and the quality of food consumed (WFP and JAAH, 2008). In conclusion, cereals (wheat in particular) and fruit/vegetables still occupy a prominent place in the Jordanian diet. The supply of food groups rich in high-value protein and essential micronutrients (milk/milk products, meat) has increased considerably, thus improving the quality and diversity of the diet. However, as a feature of the nutrition transition, the importance of sugar and vegetable oils in the diet has increased as well to reach the upper limit of recommendations. Changes in the structure of the diet towards an energy dense diet with a greater contribution of fat and reduced intakes of complex carbohydrates and dietary fibre, along with changes towards a more sedentary lifestyle, are the major factors contributing to the increasing prevalence of chronic non-communicable diseases (obesity, diabetes mellitus, cardiovascular disease, etc.) (WHO/FAO, 2003). Local production of cereals is largely insufficient to meet demand and reliance on imports for this food group, as well as that of many other food products, is very heavy. Coupled with rising food prices on global food markets, this dependency raises the question of economic sustainability, in terms of both national capacities and of access of the population to a wide range of nutritious food products.
5 Poverty pockets in Jordan are identified as administrative areas where 25% of the people fall under the poverty line (defined by the Ministry of Planning).
Food and nutrition profile, Jordan Nutrition and Consumer Protection Division, FAO, 2011
11
II: Nutritional status and feeding practices of infants and young children
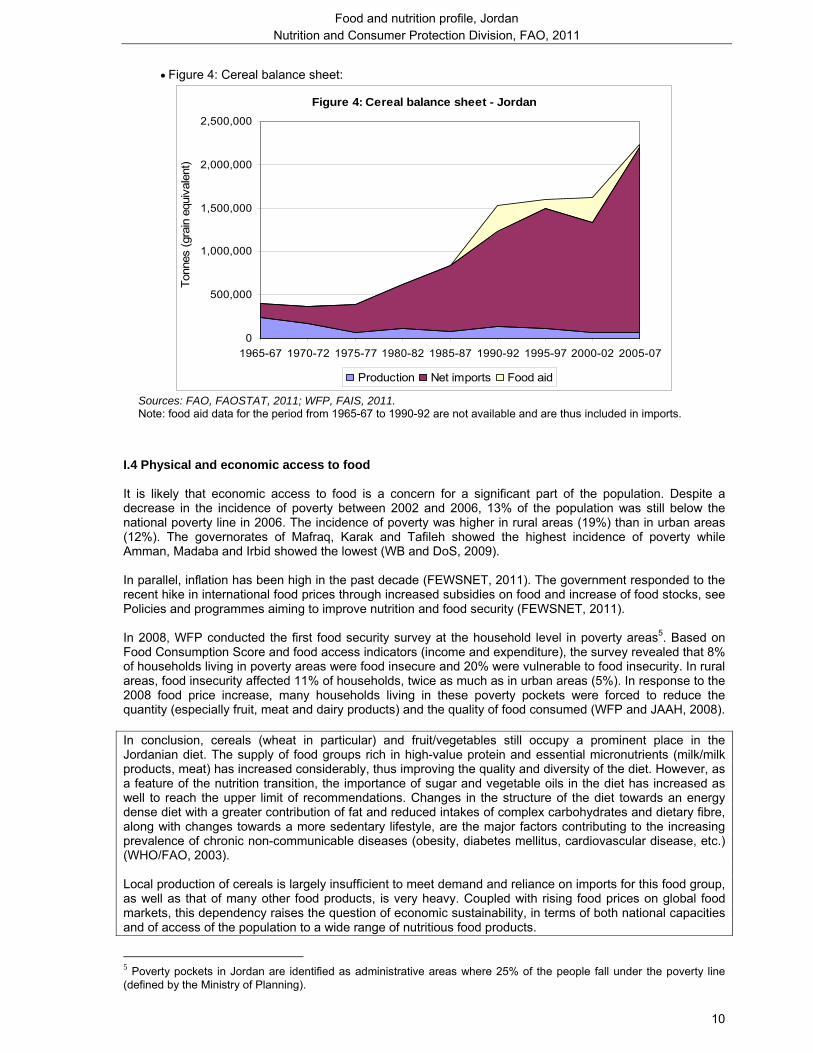
II.1 Infant and young child feeding practices (Table A.2: Initiation and duration of breastfeeding) (Table A.3: Adequate infant and young child feeding practices) Infant and young child feeding practices are documented through four nationally representative Jordan Population and Family Health Surveys [JPFHS] that were conducted in 1990, 1997, 2002, and 2007 (DoS et al.,1992; DoS and Macro Int., 1998; DoS and ORC Macro, 2003; DoS and Macro Int. Inc, 2008). In 2007, 93% of children born in the five years preceding the survey were breastfed but only 39% were put to the breast within one hour of birth (early initiation of breastfeeding) [JPFHS 2007]. The median duration of breastfeeding was 13 months which was stable over time [JPFHS 2007]. Between 1997 and 2002, the rate of exclusive breastfeeding for the first six months increased substantially (from 11% to 27%) but decreased to 22% in 2007 [JPFHS 1997, 2002 and 2007]. Breastfeeding, especially exclusive breastfeeding, has long been promoted, notably through the Baby Friendly Hospital Initiative (BFHI). Currently, there are only seven Baby Friendly Hospitals in Jordan. In 2004, the Ministry of Health established a breastfeeding unit in the Mother and Child Health Directorate to promote breastfeeding. The Directorate trained staff in most health centres and in some hospitals and produced informative material on breastfeeding and support groups for breastfeeding at centres and local communities were developed (UNICEF Press Centre, 2007). Bottle-feeding practice tends to generalize; almost half of the children aged 0-11 months are bottle-fed, a proportion which has increased considerably since 1997 (30%) [JPFHS 1997, 2002 and 2007]. The increasing proportion of economically active women is probably an important determinant of the decline in exclusive breastfeeding practice and the spread of bottle-feeding6. Other possible determinants of the observed trends include lack of awareness on the importance of breastfeeding due to inadequate guidance by health professionals and limited outreach of awareness campaigns. On the other hand, the International Code of Marketing of Breastmilk Substitutes is not well endorsed (UNDP, 2010a). More efforts are still needed to promote adequate young child feeding practices and to implement BFHI not only through hospitals, but also through Mother and Child Health Centres, which are widely disseminated on the territory, even in desert areas (MoH, 2009).
6 The government passed a law in 1995 to extend maternity leave from 8 weeks to 12 weeks. During the International Labour Organization (ILO) meeting, held in Geneva in June 2000, Jordan endorsed the convention on maternity protection to give mothers the right to have maternity leave for not less then fourteen weeks and to have nursing breaks when returning to work. However, its endorsement was not translated into action yet.
Food and nutrition profile, Jordan Nutrition and Consumer Protection Division, FAO, 2011
12
• Figure 5: Main characteristics of infant and young child feeding practices
Figure 5: Main characteristics of infant and young child feeding practices - level and trends
0 10 20 30 40 50 60 70 80
Percentage of childrenbreastfed within 1 hour of birth
Exclusive breastfeeding rate(under 6 months)
Timely complementary feedingrate (6-9 months)
Bottle-feeding rate (0-11months)
Continued breastfeeding rate atone year (12-15 months)
Continued breastfeeding rate attwo years (20-23 months)
% of children
2002 2007
Sources: [JPFHS 2002; JPFHS 2007] (Table A.4: Consumption of complementary foods, and meal frequency by breastfeeding status and age) Two thirds of children aged 6-9 months are given complementary food in addition to breastmilk [JPFHS 2007]. Complementary feeding of children 6-23 months is diversified but for many children, the frequency of meals is insufficient respectively to WHO recommendations (see table A.3) [JPFHS 2007]. Complementary feeding is diversified. It consists mainly of rice, accompanied by cooked vegetables, dairy products (pudding, yoghurt, labneh), starchy roots and vegetables (potatoes, carrots, peas), pulses (lentils or cooked chickpeas (hummus)) and meat (lamb and beef)/fish/eggs [JPFHS 2007, see table A.4]. Generally, children start eating from the family pot at age 10-12 months. No quantitative data on dietary intake of these food groups are available for young children. In the wealthiest households children may be given iron fortified cereals as complementary foods. Fruit juices and tea are also frequently given.
II.2 Anthropometry
Low birth weight (less than 2 500g) Almost all new-borns are weighed at birth (99% in 2007). The prevalence of low birth weight was 11% in 2007, a prevalence which had remained stable over time [JPFHS 1997, 2002 and 2007]. Prematurity is probably the main determinant of the relative high prevalence of low birth weight.
Anthropometry of preschool children (Table A.5: Anthropometry of preschool children) Four Jordan Population and Family Health Surveys (JPFHS), conducted in 1990, 1997, 2002, and 2009 (DoS and ICF Macro, 2010), document anthropometry of children under five years of age (0-4.99 years). The Micronutrient Survey 2010 also provides anthropometric data but the age-group is different (1-4.99 years) (MoH et al., 2011). In 2010, the prevalence of stunting among children aged 1-4.99 years was 11%, that of wasting was 4%, and that of underweight was 3%. About 10% of these children were overweight and 2% were obese (defined with BMI-for-age).
Food and nutrition profile, Jordan Nutrition and Consumer Protection Division, FAO, 2011
13
Since the sample sizes for disaggregated estimates are not available in the 2010 survey and since the age-group is not standard, results from the 2009 survey are examined in more detail. In 2009, the prevalence of stunting was 8% among children aged 0-4.99 years, which is low according to WHO classification. It was higher in rural areas (12%) than in urban areas (7%). At regional level, it was almost double in the South (13%) than in the Centre (7%) (9% in the North), which may be due to lower socioeconomic status overall in the South (JPFHS 2009; Abu Baker and Daradkeh, 2010). Large disparities were also observed by governorate: the prevalence of stunting ranged from 6% in Amman and Zarqa to 14% in Karak (where the incidence of poverty is high) and Ma’an7 [JPFHS 2009] (WB and DoS, 2009). The prevalence decreased with increasing mother’s education level [JPFHS 2009]. The prevalence of stunting decreased considerably between 1990 (21%) and 1997 (11%) and slowed down to reach 8% in 2009. Over the whole period (1990-2009), the prevalence decreased 10 percentage points in urban areas and 17 percentage points in rural areas (see Figure 6) [JPFHS 1990, 1997, 2002, 2009]. This improvement might be put in relation with the overall development of the country (access to health services, to safe water and sanitation, etc.), the increased number of Maternal and Child Health centres and higher women’s education level. The prevalence of wasting and that of underweight were similar (2%) to what is observed in the reference population [JPFHS 2009]. In parallel, the prevalence of overweight almost doubled between 1997 (4%) and 2009 (7%) [JPFHS 1997, 2002, 2009]. The prevalence reported in the JPFHS 1990 (9%) is not consistent with the overall trend. Increasing prevalence of overweight in young children may be related to inadequate infant and young child feeding practices and to the nutrition transition: decline of exclusive breastfeeding until 6 months of age, common bottle-feeding, and widespread consumption of complementary foods made with oil, fat, butter, sugar, etc. are probably major contributing factors (together with reduced physical activity levels). In 2009, the prevalence of overweight was higher among boys than among girls (8% and 5% respectively). No differences were observed between urban and rural areas. The prevalence was higher in the South (10%) than in the North and Central regions (6%). The high prevalence of both stunting and overweight is particularly marked in the South region [JPFHS 2009]. Even if the prevalence of overweight among children under five years of age has been increasing, it remains considerably lower in Jordan than in some neighbouring countries (17% in Lebanon in 2004, 19% in Syria in 2006) (WHO Global database on child growth and malnutrition, 2011).
7 Prevalence to be interpreted with caution due to the small sample size in this governorate.
Food and nutrition profile, Jordan Nutrition and Consumer Protection Division, FAO, 2011
14
• Figure 6: Trends in the prevalence of stunting among children under five years of age, according to place of residence
Figure 6: Trends in the prevalence of stunting among children under five years of age (urban/rural areas)
0
5
10
15
20
25
30
35
1990 1997 2002 2009
% o
f chi
ldre
n un
der 5
yea
rs o
f age
urban rural
Sources: JPFHS 1990; JPFHS 1997; JPFHS 2002; JPFHS 2009
II.3 Micronutrient status
Iodine deficiency disorders (IDD)
Prevalence of goitre and urinary iodine level among school-age children (Table A.6: Prevalence of goitre and level of urinary iodine in school-age children)
Three national surveys document IDD in Jordan: - Study of iodine deficiency in Jordan conducted in 1993 (MoH et al., 1993) - Assessment of iodine deficiency status among Jordanian children after introduction of iodized salt conducted in 2000 (MoH et al., 2000). - National survey to assess iodine deficiency disorders among school children in Jordan conducted in 2010 (MoH and WHO, 2010a). All these surveys include school-age children 8-10 years. Considerable progress has been done to eliminate IDD: results from the 1993 baseline survey showed that the prevalence of goitre among school-age children was 38%, pointing out a severe public health problem (MoH et al., 1993). These results triggered the implementation of an IDD control programme, which started effectively in 1995 (ICCIDD, no date). The impact assessment of the IDD control programme performed in 2000 showed a slight decrease in the prevalence of goitre (34%) (MoH et al., 2000; WHO Database on iodine deficiency, 2011). In 2010, this prevalence was below the threshold of 5% (MoH and WHO, 2010a). However, IDD persist as a mild public health problem in the governorates of Amman, Balqa, Jarash, and Ma’an (MoH and WHO, 2010a). It takes a long time for the prevalence of goitre to decrease after effective iodized salt consumption and median urinary iodine is the most sensitive indicator in determining impact (see next paragraph “Iodization of salt at household level”). Median urinary iodine, which was only 40 µg/L (indicative of moderate iodine deficiency) in 1993, increased to reach 154 µg/L in 2000 (optimal iodine intake), showing the positive impact of the IDD control programme (MoH et al., 1993; MoH et al., 2000; WHO Database on iodine deficiency, 2011). In 2000, a quarter of children still had insufficient iodine intake while 7% of children had an excessive intake with risk of adverse health consequences (MoH et al., 2000; WHO Database on iodine deficiency, 2011). In 2010, median
Food and nutrition profile, Jordan Nutrition and Consumer Protection Division, FAO, 2011
15
urinary iodine was estimated at 203 µg/L (MoH and WHO, 2010a); this level may pose a risk of more than adequate intake in the overall population. Salt iodine level should be carefully monitored to ensure compliance with international standards and avoid excessive iodine intake. The recommendations from the 2010 IDD survey were:
- to comply with WHO recommendations regarding iodine content of salt (15-40 ppm instead of 40-60 ppm)
- to conduct another study on IDD in the whole population, including women of childbearing age (MoH and WHO, 2010a).
Iodization of salt at household level (Table A.7: Iodization of salt at household level) Consumption of adequately iodized salt is widespread: 96% of households used adequately iodized salt (≥15 ppm) in 2010, a proportion that increased by 10 percentage points since 2000. Disparities by governorate were small, except in Mafraq where only 87% of households used adequately iodized salt (MoH and WHO, 2010a).
Vitamin A deficiency (VAD)
Prevalence of clinical and sub-clinical vitamin A deficiency in preschool children (Table A.8: Prevalence of sub-clinical vitamin A deficiency in children from 1 to 5 years) Two national surveys document sub-clinical VAD among preschool children: the National baseline survey on iron deficiency anemia and vitamin A deficiency carried out in 2002 and the Micronutrient survey carried out in 2010 (MoH et al., 2002; MoH et al., 2011). Both surveys include children aged 12-59 months. The prevalence of sub-clinical VAD among preschool children increased from 15% in 2002 to 18% in 2010, due to an increase in urban areas (from 15% to 19%), while the prevalence decreased in rural areas (MoH et al., 2002; MoH et al., 2011). VAD persists as a moderate public health problem in Jordan: in 2010, the prevalence of low serum retinol (<20 µg/dL) was of 18% among preschool children. Boys were more affected than girls (21% and 16% respectively), as were children living in urban areas (19%) when compared to those living in rural areas (14%). In the North, where the prevalence reached 21%, VAD was a severe public health problem. In the South, the small sample size did not allow for an accurate assessment of the level of this deficiency (MoH et al., 2011). However, given the results of the 2002 survey, VAD is probably also widespread in this region (MoH et al., 2002). A regional survey conducted in 2004 among Bedouin preschool children (5-66 months) living in small villages of North Badia showed that VAD was a severe public health problem among this population-group: a quarter of these preschool children has low level of serum retinol (<20 µg/dL) (Khatib and Elmadfa, 2009). Bedouin have lost their traditions as livestock-keepers. This fact, combined with increasing urbanization in the areas where they live, higher prices and living costs, high price of imported food commodities (such as powdered milk) has resulted in a decrease in consumption of milk/milk products, meat and fresh fruit and vegetables, leading to inadequate micronutrient intake (Khatib and Elmadfa, 2009).
Consumption of vitamin A-rich foods among preschool children (Table A.9: Percentage of children who consumed foods rich in vitamin A and foods rich in bioavailable iron in the 24 hours preceding the survey) According to the JPFHS 2007, 84% of children aged 6-35 months had consumed vitamin A-rich foods
8
in the 24-hour preceding the survey. This proportion increased markedly with age and was higher in urban areas and in the Central region [JPFHS 2007], see table A.9. It should be noted that milk/dairy products (a food group rich in vitamin A that is widely consumed by young children) was not taken into account. In view of the relative high prevalence of VAD among young children, it is likely that the consumption of vitamin A-rich foods, although widespread, is quantitatively low especially meat and eggs, which contain high amounts of preformed vitamin A. Diarrhoeal diseases may also contribute.
8 Includes meat, fish, poultry, eggs, carrots, red sweet potatoes, pumpkin, apricot, palm nuts, yellow melon, and green leafy vegetables.
Food and nutrition profile, Jordan Nutrition and Consumer Protection Division, FAO, 2011
16
Vitamin A supplementation of preschool children (Table A.10: Vitamin A supplementation of children) The Jordanian National Action Plan for Children (2004-2013) aims to reduce vitamin A deficiency among children under five from 15% to 5% (WHO/EMRO, 2006a) through the expansion of the vitamin A supplementation programme: high dose of vitamin A are provided to young children together with measles vaccination and then every 6 months. The coverage of vitamin A supplementation in children is very low: in 2007, only 9% of children aged 6-59 months received vitamin A supplement in the six months preceding the survey. The coverage was extremely low in the North (5%) where VAD is a severe public health problem according to the results of the 2010 micronutrient survey [JPFHS 2007; MoH et al., 2011].
Iron deficiency anemia
Prevalence of anemia in preschool children (Table A.11: Prevalence of anemia in preschool children) Four national surveys document the prevalence of anemia in preschool children: - the National baseline survey on iron deficiency anemia and vitamin A deficiency conducted in 2002 (MoH et al., 2002) - JPFHS 2002 (DoS and ORC Macro, 2003) - JPFHS 2009 (DoS and ICF Macro, 2010) - Micronutrient survey 2010 (MoH et al., 2011). The 2010 and 2002 surveys include children aged 12-59 months while the JPFHS 2002 and 2009 ones include children aged 6-59 months. In 2010, iron deficiency (defined as low serum ferritin, which reflects depleted iron stores) affected 14% of children aged 12-59 months. The prevalence of anemia in preschool children was 17%; this prevalence indicates a mild public health problem. The prevalence of anemia was higher in rural areas (23%) than in urban areas (16%). Disparities by region cannot be assessed accurately due to the small sample size in the South. Only 5% of children suffered from iron deficiency anemia9, indicating that other causes (in addition to iron deficiency) are responsible for anemia in preschool children (MoH et al., 2011). It is therefore necessary to further explore other causes of anemia in order to implement an array of appropriate interventions (food-based approaches but also control of parasitic infections, etc.). Due to differences in age-groups, trends are difficult to estimate accurately. When comparing data from the 2010 micronutrient survey with those of the 2002 baseline survey (children aged 12-59 months), the prevalence of anemia decreased slightly from 20% in 2002 to 17% in 2010. However, when comparing these set of data with JPFHS 2002 and 2009, there is a large difference in prevalence, even when taking into account the difference in age-group. According to JPFHS 2002 and 2009, the prevalence of anemia among children aged 6-59 months was about 33-34% and remained stable between these two surveys. Methodological issues may explain these inconsistencies.
Consumption of foods rich in bioavailable iron among preschool children (Table A.9: Percentage of children who consumed foods rich in vitamin A and foods rich in bioavailable iron in the 24 hours preceding the survey) Consumption of foods rich in bioavailable iron among preschool children is rather widespread: about three-quarters (72%) of children aged 6-35 months had consumed this kind of foods10 in the 24 hours preceding the survey. The proportion of children who had consumed this kind of foods was lower in rural areas, in the South, and among younger children [JPFHS 2007], see table A.9. It is likely that the consumption of foods rich in bioavailable iron, albeit widespread, may be low quantitatively. Other food sources of iron are foods of vegetable origin, which contain iron with lower bioavailability (nonheme iron) (Alkurd et al., 2010). In addition, the diet contains many antinutritional factors (phytates present in cereals; calcium; phenolic compounds present in tea) which hamper proper absorption of iron. For example young children drink tea during the meal which inhibits iron absorption. These factors,
9 Anemia was defined as Hb < 11.0 g/dL; iron deficiency was defined as serum ferritin < 12.0 µg/L; iron deficiency anemia was defined as Hb < 11.0 g/dL and serum ferritin < 12.0 µg/L. 10 Includes meat, fish, poultry, and eggs.
Food and nutrition profile, Jordan Nutrition and Consumer Protection Division, FAO, 2011
17
as well as inadequate infant breastfeeding practices, may explain the high prevalence of iron deficiency among preschool children. In the population, dietary intakes of iron were derived from the National Household Expenditure and Income Survey conducted from July 2006 to January 2007. This survey provides estimates of household food acquisition which are taken as proxies of consumption. It included almost 13000 households (DoS, 2008; Alkurd et al., 2010). The iron daily intake among the population was estimated at 21 mg/day/capita. When compared to the highest Dietary Reference Intakes (DRI) of iron (18 mg/day), 10 governorates had higher consumption than this DRI and only two governorates (Tafileh and Aqaba) were lower than this DRI but still close (DoS, 2008). An increase in iron intake has been observed since 1992 (18 mg/capita/day), probably as a result of the increase in the meat/fish supply and/or wheat flour fortification programme launched in 2002 (Alkurd et al., 2010). More efforts are needed to improve the food-based approach to combat iron deficiency.
Iron supplementation of preschool children No information on iron supplementation of preschool children is available.
Other micronutrient deficiencies Dietary intakes of zinc and selenium in the population were derived from the National Household Expenditure and Income Survey conducted from July 2006 to January 2007. Selenium intake was well above the highest Dietary Reference Intakes (DRI) of selenium. The estimated zinc intakes of all of the governorates and the Kingdom (9 mg/day) were below the highest DRI of zinc (Alkurd et al., 2010). Vitamin D deficiency is widespread. The 2010 national micronutrient survey showed that 20% of children aged 12-59 months and as much as 60% of women 15-49 years had vitamin D deficiency, as measured by concentration of serum 25-hydroxy-vitamin D3 lower than the cut-off of 11 ng/mL for children and lower than 12 ng/mL for women (MoH et al., 2011).
Table 2: Micronutrient deficiencies among children
Indicator Estimate Reference period Source Trends
Iodine deficiency
Prevalence of goitre in school-age children (8-10 years) 4.9% 2010 MoH et al.
decreasing since 1993
Percentage of households consuming adequately iodized salt 96% 2010 MoH and
WHO increase
since 2000
Percentage of children with excessive iodine intake 7% 2000 MoH and WHO
Vitamin A deficiency Prevalence of clinical vitamin A deficiency among children (12-59 months) n.a. - - -
Prevalence of sub-clinical vitamin A deficiency among children (12-59 months) 18% 2010 MoH et
al. increase
since 2002 Percentage of children (6-35 months) who consumed vitamin A-rich foods in the 24 hours preceding the survey 84% 2007 JPFHS n.a.
Percentage of children (6-59 months) who received vitamin A supplement in the 6 months preceding the survey
9% 2007 JPFHS n.a.
Iron deficiency
Prevalence of anemia in children (6-59 months) 34% 2009 JPFHS stable since 2002
Percentage of children (6-35 months) who consumed foods rich in bioavailable iron in the 24 hours preceding the survey
72% 2007 JPFHS n.a.
n.a.: not available
Food and nutrition profile, Jordan Nutrition and Consumer Protection Division, FAO, 2011
18
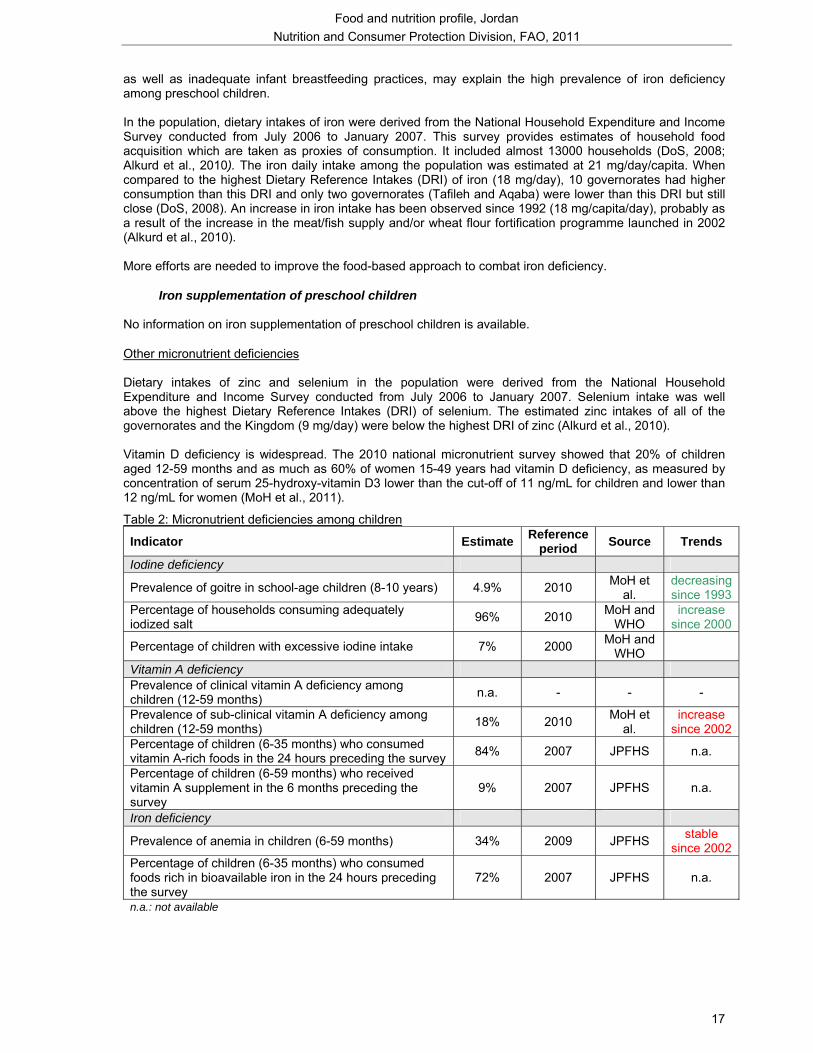
II. 4. Main infant and young child health and mortality indicators Major achievements have been attained in relation to child health in Jordan. A remarkable reduction is observed in infant and child mortality rates: the infant mortality rate declined from 32‰ in 1990 to 22‰ in 2009 while the under-five mortality rate declined from 39‰ to 25‰ over the same period (UNICEF, 2011). Despite this significant decrease, current rates remain higher than those observed in Lebanon and in the Syrian Arab Republic (UNICEF, 2011). Prematurity is a major cause of deaths among under-five Jordanian children (WHO, 2010a). Despite long-standing efforts to control diarrhoeal diseases and a vastly extended access to improved water and sanitation, diarrhoea remains rather widespread among children under five [JPFHS 2007]. Contributing factors may be the recently declining sufficiency and reliability of water supplies, the increasing number of rural people using unsafe sources of water, as well as a low exclusive breastfeeding rate (under 6 months) and widespread consumption of breastmilk substitutes (UNICEF and NCFA, 2007). Most children are given oral rehydration therapy or increased fluids during an episode of diarrhoea [JPFHS 2007]. Acute respiratory infections are not frequent among young children [JPFHS 2007]. Malaria is not a problem in Jordan. The Expanded Programme on Immunisation was launched in 1979. Before 2002, children in Jordan did not always receive the BCG vaccine; it was only included as part of the national vaccination program following the 2002 JPFHS survey. In 2002, 28% of children aged 12-23 months were fully immunized (including BCG); in 2007, they were 87% [JPFHS 2007].
• Figure 7: Distribution of causes of deaths among children under 5 years of age
Figure 7: Causes of deaths among underfive children
Congenital abnormalities
19%
Prematurity35%
Other diseases
18%
Pneumonia11%
Birth asphyxia6%
Neonatal sepsis
2%Diarrhoea
4%Injuries
5%
Source: WHO, 2010a (reference period 2008)
Food and nutrition profile, Jordan Nutrition and Consumer Protection Division, FAO, 2011
19
Table 3: Health indicators for children
Indicator Estimate Reference period Source Trends
Mortality
Infant mortality rate (under 1 year of age) 22‰ 2009 UNICEF Decrease since 1990
Under-five mortality rate 25‰ 2009 UNICEF Decrease since 1990
Morbidity Percentage of under-fives with diarrhoea in the last 2 weeks 16% 2007 JPFHS _3
Percentage of under-fives with diarrhoea in the last 2 weeks who received oral rehydration therapy (ORT)1
57% 2007 JPFHS Decrease since 1997
Percentage of under-fives with acute respiratory infection in the last 2 weeks 5% 2007 JPFHS _3
Percentage of under-fives sleeping under an insecticide treated bednet - - - -
Immunization Percentage of children from 12 to 23 months with DPT3 immunization 97% 2007 JPFHS Stable since
2002 Percentage of children from 12 to 23 months with immunization against measles 94% 2007 JPFHS Stable since
2002 Percentage of children from 12 to 23 months with all basic vaccinations2 87% 2007 JPFHS Increase since
2002 1 ORT includes solution prepared from oral rehydration salt (ORS) packets, recommended home fluids (RHF), or increased fluids. 2 BCG, measles, and three doses each DPT and polio vaccine (excluding polio vaccine given at birth). 3 Prevalences of diarrhoea and acute respiratory infection can be influenced by seasonality, trends are not relevant. The overall development of the country has brought about positive changes in the nutrition status of young children. Acute malnutrition is no longer a concern and chronic malnutrition has regressed considerably. Iodine deficiency disorders have been eliminated. Salt iodine level should be carefully monitored to avoid the risk of excessive iodine intake. However, the country’s global transition also brings about changes that are likely to have a significant negative impact on the nutritional status of young children. The decline in exclusive breastfeeding, the increase in bottle-feeding practice, a diet rich in fat and sugar are responsible for the emergence of overweight in the country, along with a decreasing level of physical activity and sedentary lifestyle. Inadequate young child feeding practices and a high prevalence of diarrhoea are also responsible for the persistence of vitamin A and iron deficiencies, although the latter is also related to other factors than inadequate intake of iron. Nutrition education, awareness, and long-term food-based approachs should be strengthened to tackle the double burden of malnutrition the country is facing.
Food and nutrition profile, Jordan Nutrition and Consumer Protection Division, FAO, 2011
20
III: Women’s nutritional status
III.1 Anthropometry (Table A.12: Anthropometry of adult women) The nationally representative Jordan Population and Family Health Surveys conducted in 2002, 2007 and 2009 document anthropometry of adult women [JPFHS 2002, 2007, 2009]. Undernutrition is not a significant problem among Jordanian women: the prevalence of chronic energy deficiency (CED) was estimated at only 4% in 2009; it did not vary according to place of residence but young women were more affected. By governorate, the highest prevalence was observed in Balqa (6%) [JPFHS 2009]. The prevalence of CED was stable over the period 2002-2009 [JPFHS 2002, 2007, 2009]. In contrast, the prevalence of overweight and obesity was alarming: 28% of women were overweight and 29% were obese in 2009. In the governorates of Mafraq, Karak, Tafiela and Aqaba, more than 60% of women were overweight or obese. The prevalence of obesity was slightly higher in rural areas (31%) than in urban areas (28%). The prevalence of obesity increased markedly with age from 10% among women aged 15-19 to 41% among those aged 40-49 [JPFHS 2009]. The prevalence of overweight was stable but that of obesity showed an upward trend, especially in rural areas where it increased from 26% in 2002 to 31% in 2009 [JPFHS 2002, 2007, 2009]. Jordan is moving through the nutrition transition at a rapid pace. The increasing availability of energy-dense and fat-rich foods, along with the decreasing level of physical activity are among the major determinants of the very high prevalence of overweight and obesity. Given the growing number of working women, there is also an increasing demand for ready-to-eat processed foods. It should also be noted that overweight is desired for women, but these cultural standards are changing as more and more women in urban areas are striving to be thiner, probably due to the exposure to western media (Madanat et al., 2008). That may explain that the prevalence of obesity was slightly higher in rural areas than in urban areas. Unfortunately, overweight and obesity have not yet been identified as a priority for public health in Jordan and therefore no programme is in place aimed at controlling this problem and its consequences (Madanat et al., 2008).
III.2 Micronutrient status
Vitamin A deficiency (VAD)
Prevalence of clinical and sub-clinical vitamin A deficiency among women (Table A.13: Prevalence of sub-clinical vitamin A deficiency in mothers during their last pregnancy and during lactation) Sub-clinical VAD (serum retinol <20 µg/dL) affected about 5% of non-pregnant women in 2010. Young women and women living in rural areas were more affected than their respective counterparts, see table A.13. The prevalence of sub-clinical VAD was much lower in South region than in Central and North regions, but this is to interpret with caution due to the small sample size in the South when compared to other regions (MoH et al., 2011).
Consumption of vitamin A-rich foods among mothers (Table A.15: Percentage of mothers having consumed foods rich in vitamin A and foods rich in bioavailable iron in the 24 hours preceding the survey) Consumption of vitamin A-rich foods is widespread among mothers: nearly all mothers of young children (93%) had consumed vitamin A-rich foods11 in the previous 24 hours [JPFHS 2007], see table A.15. No
11 Includes meat, fish, poultry, eggs, carrots, red sweet potatoes, pumpkin, apricot, palm nuts, yellow melon, and green leafy vegetables.
Food and nutrition profile, Jordan Nutrition and Consumer Protection Division, FAO, 2011
21
marked differences were observed according to the place of residence. Mothers living in the North and Centre were more likely to consume this kind of food than those living in the South [JPFHS 2007].
Vitamin A supplementation of mothers (Table A.16: Vitamin A and iron supplementation of women of childbearing age) There is no vitamin A supplementation programme targeting mothers.
Iron deficiency anemia
Prevalence of anemia in women (Table A.14: Prevalence of anemia in women of childbearing age) Micronutrient survey 2010, JPFHS 2009 and 2002 document the prevalence of anemia in women, see table A.14. Iron deficiency is widespread among women: more than a third (35%) of non-pregnant women suffered from this deficiency in 2010. Anemia still persists as a moderate public health problem since the prevalence among non-pregnant women reached 31%; iron deficiency anemia12 affected one woman out of five. Iron deficiency is thus a major determinant of anemia in women. Iron deficiency anemia was more prevalent in rural areas and in the South region (MoH et al., 2011). Both JPFHS 2009 and 2002, which included all women, showed a prevalence of anemia of about 25% [JPFHS 2002; JPFHS 2009]. The 2010 micronutrient survey showed that 11% of women aged 15-49 had a vitamin B12 deficiency and 14% had a folate deficiency (MoH et al., 2011). These nutritional deficiencies are also responsible for anemia.
Consumption of foods rich in bioavailable iron among mothers (Table A.15: Percentage of mothers having consumed foods rich in vitamin A and foods rich in bioavailable iron in the 24 hours preceding the survey) Consumption of foods rich in bioavailable iron among mothers is widespread: 84% of them had consumed this type of food13 in the previous 24 hours [JPFHS 2007], see table A.15. Mothers living in urban areas and those living in the Central and North regions were more likely to consume this kind of foods [JPFHS 2007]. However, it is likely that only small quantities of this kind of foods are consumed. Most food sources of iron are foods of vegetable origin, which contain nonheme iron which is less bioavailable (Alkurd et al., 2010). Antinutritional factors present in the diet and frequent consumption of tea with meals may also explain the high prevalence of iron deficiency anemia in women.
Iron supplementation of pregnant women (Table A.16: Vitamin A and iron supplementation of women of childbearing age) The iron supplementation programme for pregnant women started in 1980 in which iron and folic acid capsules are given to pregnant women visiting the Maternal and Child Health Centers (Madanat et al., 2008). The coverage increased from 2002 (71%) to 2007 (79%) to reach 81% in 2009 [JPFHS 2002, 2007, 2009], but is lower in rural areas [JPFHS, 2009].
12 Anemia is defined as hemoglobin <12.0 g/dL; iron deficiency is defined as serum ferritin < 15.0 µg/L; iron deficiency anemia is defined as hemoglobin < 12.0 g/dL and serum ferritin < 15.0 µg/L. 13 Include meat, fish, poultry, and eggs.
Food and nutrition profile, Jordan Nutrition and Consumer Protection Division, FAO, 2011
22
Table 4: Micronutrient deficiencies among women
Indicator Estimate Reference period Source Trends
Vitamin A deficiency Prevalence of adjusted night blindness in mothers n.a. - - -
Prevalence of sub-clinical vitamin A deficiency in non pregnant women 5% 2010 MoH et al. n.a.
Percentage of mothers having consumed vitamin A-rich foods in the 24 hours preceding the survey
93% 2007 JPFHS n.a.
Coverage of vitamin A supplementation in mothers n.a. - - -
Iron deficiency Prevalence of anemia in non pregnant women 31% 2010 MoH et al. n.a. Percentage of mothers having consumed foods rich in bioavailable iron in the 24 hours preceding the survey
84% 2007 JPFHS n.a.
Coverage of iron supplementation in pregnant women 81% 2009 JPFHS Increase
since 2002 n.a.: not available
Long-term measures to combat micronutrient deficiencies Vitamin A, iron and zinc deficiencies are identified as public health problems in Jordan. In April 2002, Jordan began a wheat flour fortification programme that included iron and folic acid. In March 2006, the fortification requirements were expanded to include vitamin A, zinc, thiamin, riboflavin, niacin, vitamin B6, and cobalamin in addition to iron and folic acid, and at the end of 2010 vitamin D3 was added to the flour. The flour that is fortified is the Mowahad wheat flour, which is used to make bread; this is the only subsidized flour and constitutes 93% of wheat flour production in Jordan. Flour fortification is mandatory and compulsory by the laws. Fortified biscuits provided to school-children through the School Feeding Programme are made from the same fortified flour (WHO, 2010b). Flour fortification in iron and folic acid probably contributed to reduce iron deficiency in women of childbearing age since iron deficiency contributes significantly to the high prevalence of anemia in this population group. Among preschool children however, factors other than iron deficiency contribute significantly to the high prevalence of anemia (e.g. high prevalence of diarrhoea). It is therefore important to develop alternative approaches (control of infection diseases, changes in consumption patterns of certain foods, etc.) to reduce the prevalence of anemia in this age group. Since micronutrient deficiencies are widespread, supplementation and fortification should be accompanied with long-term food-based approaches aiming to promote the consumption of iron-rich foods and encourage dietary habits that may enhance iron absorption. In 1999, Jordan’s Ministry of Education (MoE) initiated a “school snack service” (mid-morning snack) through the School Feeding Programme. The “school snack service” targeted primary school-children in the first three elementary grades from seven disadvantaged semi rural districts. Initially, biscuit, fresh cow’s milk and a piece of fruit were provided to school-children aged 6-8 years. Progressively this programme extended to include children from kindergarten to 10 years of age and biscuits fortified with vitamin A, vitamins B, folate, niacin, iron and zinc were distributed. Since 2008, milk is no more distributed due to transportation problems. The programme expanded and targeted more than 500,000 children in 2009. It aims to improve the feeding and health status of children in public schools in the less privileged areas, develop and fix life-long positive attitudes and nutritious food habits and reduce dropouts. The MoE plans to continue expanding its reach to cover the entire kingdom (UNDP, 2010a).
Food and nutrition profile, Jordan Nutrition and Consumer Protection Division, FAO, 2011
23
III. 3 Health, water and sanitation
Health Due to the country’s stability and to a range of effective development plans and projects that have included health as a major component, health conditions in Jordan are among the best in the Middle East [JPFHS 2007]. Maternal deaths are declining: the (declared) maternal mortality ratio of 19 deaths per 100 000 live births reported for 2007-2008 showed a remarkable reduction of 54% since 1995-1996 (DoS, 2010), as a result of large investments made in the maternity area over the past decades (DoS, 2010). Adjusted maternal mortality ratio, estimated at 59 per 100 000 live births in 2008, decreased by 48% since 1990 (UNICEF, 2011; UNICEF, Statistics by area – Maternal Health, 2011). However, as observed for children mortality rates, adjusted maternal mortality ratio remains higher than the one observed in Lebanon and in Syrian Arab Republic and despite considerable progress over the past two decades, Jordan is not yet on track to achieve its 2015 target of 28 deaths per 100 000 live births (UNICEF, 2011; WB, 2011). Total fertility rate has declined from 6.6 children per woman in the early 1980s to 3.7 in 2002. It has remained almost unchanged between 2002 and 2009 [JPFHS 2009]. More than 90% of pregnant women had at least four antenatal care visits and almost all births are delivered with the assistance of a health professional [JPFHS 2007]. Prevalence of HIV/AIDS in adults remains very low (less than 0.2% in 2007) (UNAIDS, 2010).
Access to health care services Jordan’s health sector performs well in terms of access and health outcomes. Services are delivered through an extensive network of public and private facilities, and overall capacity in terms of human and material resources is high (WHO/EMRO, 2006b). Many women are concerned that there might not be a female provider at the health facility. Transport, distance to health facility and cost are some other common problems faced in accessing health care [JPFHS 2007]. The Government provides free health insurance for all young children and for people living in disadvantaged areas (WHO/EMRO, 2006a). The epidemiological transition, marked by the progressive increase of non-communicable diseases, is one of the challenges the Jordanian health system has to face (WHO/EMRO, 2006b).
Access to an improved water source and to improved sanitation In 2008, almost all Jordanians had access to an improved water source (96%) but some disparities persist between urban and rural areas, where access has not improved over the last decade (UNICEF, 2011; WHO/UNICEF, 2010). Due to scarce water resources, Jordan has been implementing a rationing programme since 1988 and water is only provided intermittently with supply frequency of once or twice a week (WHO/EMRO, 2003; Taha and Bataineh, 2002). Ninety-eight percent of the population had access to improved sanitation, with no difference between urban and rural areas (UNICEF, 2011).
Food and nutrition profile, Jordan Nutrition and Consumer Protection Division, FAO, 2011
24
Table 5: Major indicators of health, access to water and sanitation
Indicator Estimate Reference period Source Trends
Health and care Maternal mortality ratio:
declared 19 per 100 000 live births 2007-2008 DoS Decrease since 1995-
96
adjusted 59 per 100 000 live births 2008 UNICEF Decrease since 1990
Total fertility rate 3.8 children per woman 2009 JPFHS
Decrease between 1980s and early 2000,
then stable Prevalence of HIV/AIDS among women age 15-49 n.a. - - -
Percentage of mothers who had four or more antenatal care visits 94% 2007 JPFHS Increase compared to
2002 Health personnel: number of physicians
245 per 100 000 people 2009 WHO Increase since 2004
Percentage of births attended by skilled health personnel 99% 2007 JPFHS Stable compared to
2002 Water and sanitation Percentage of the population with access to an improved water source:
urban areas 98% 2008 UNICEF Stable since 1990 rural areas 91% 2008 UNICEF Stable since 1990
Percentage of the population with access to an improved sanitation: urban areas 98% 2008 UNICEF Stable since 1990 rural areas 97% 2008 UNICEF Increase since 1995
n.a.: not available
III. 4 Women’s empowerment Broad-based access to education has received greater emphasis over the past decades, which translates into high women’s education level: almost three-quarter of ever-married women have secondary and higher education [JPFHS, 2009]. However, these achievements fail to translate into women’s economic empowerment. Women’s participation in the formal sector labour force remains low, equal access to resources and control over them (loan, borrowing, etc.) is still challenging. The lack of economic empowerment is mirrored by lack of empowerment within the household. The gender gap in human development is still wide (MPIC et al., 2004; MPIC, 2010).
• Figure 8: Ever-married women’s education level (highest education level attended or completed)
Figure 8: Women's education levels
Secondary or higher
74%
Primary23%
No education
3%
Source : JPFHS 2009

Food and nutrition profile, Jordan Nutrition and Consumer Protection Division, FAO, 2011
25
Among women, the major nutritional problems are the alarming prevalence of overweight and obesity and the high prevalence of anemia. The fortification of wheat flour is one of the long-term approachs developed to combat micronutrient deficiencies in the population. However, food-based approaches need to be developed further. Significant efforts have been made in maternal and child health, environmental hygiene, and women’s empowerment, all these factors contributing to the improvement of the nutritional status of the population.
Food and nutrition profile, Jordan Nutrition and Consumer Protection Division, FAO, 2011
26
IV: Nutritional status of other groups of population
IV.1. School-age children
Anthropometry In underprivileged areas of Jordan, stunting remains prevalent among school-age children (15% of children aged 5.5-10 years were stunted in 2002; Khatib and Hijazi, 2009). Local surveys also indicate a high prevalence of overweight and obesity among school-age children: in the governorate of Irbid (north-west of Jordan), 19% of children aged 6-12 years were overweight and 6% were obese in 200614 (Khader et al., 2007).
Micronutrient deficiencies Through the School Feeding programme implemented by the MoE (see Long-term measures to combat micronutrient deficiencies), each child also received, in addition to a snack, a vitamin A oil capsule. The baseline assessment indicated that the prevalence of sub-clinical vitamin A deficiency among these children aged 5.5-11 years was 22% (although the frequency of consumption of vitamin A rich foods was rather high) and the prevalence of anemia15 was 19%. After the programme, the prevalence of VAD was halved (11%) and that of anemia was of 15% (Khatib, 2002). Since 2000, the MoH provides vitamin A supplements to school children (6-11 years) in high risk areas (UNICEF and NCFA, 2007).
IV.2. Adolescents
Anthropometry Adolescents are also affected by overweight and obesity: a local survey conducted among pupils aged 13–16 years of the governorate of Irbid in 2007 indicated that 16% were overweight and 9% were obese. Only 4% were underweight16. The prevalence of overweight was higher among girls while that of obesity was higher among boys. Pupils living in urban areas were more likely to be obese probably due to a higher consumption of fast-food in these areas (Abu Baker and Daradkeh, 2010). Overweight and obesity among school-age children and adolescents is an emerging public health problem against which prevention programmes should be implemented.
Micronutrient deficiencies Micronutrient deficiencies among adolescents are not documented.
IV.3. Men
Anthropometry Men are also affected by overweight and obesity. A prevalence of obesity (BMI ≥ 30 kg/m2) of 33% was reported among men living in semi-urban communities in different regions of the country in the late 1990s (Ajlouni et al., 1998). In a town of northern Jordan (Sarih), 40% of men aged 25 years and above were overweight and 35% were obese17 in 2004 (Khader et al., 2008). There had been a significant increase (10 percentage points) in the prevalence of obesity between the two surveys that were conducted 10 years apart in the same population (1994 and 2004) (Khader et al., 2008). In all surveys, the prevalence of obesity was lower in men than in women (Ajlouni et al., 1998; Khader et al., 2008). 14 Based on international cut-off points for BMI for overweight and obesity between 2 and 18 years, as defined by Cole et al., 2000. 15 Subclinical vitamin A deficiency was defined as serum retinol concentration <0.70μmol/L; anemia was defined as hemoglobin concentration < 11.0 g/dL 16 Underweight: BMI < 5th percentile; overweight: 85th ≤ BMI < 95th percentile; obesity: BMI ≥ 95th percentile 17 A BMI between 25 and 29.9 kg/m2 was defined as overweight and a BMI 30 kg/m2 or greater was defined as obesity.

Food and nutrition profile, Jordan Nutrition and Consumer Protection Division, FAO, 2011
27
Micronutrient deficiencies Vitamin D deficiency is not widespread among adult men (5%) (Batieha et al., 2011). Dress style in women may be a contributing factor to the high prevalence of vitamin D deficiency among women when compared to men (Batieha et al., 2011).
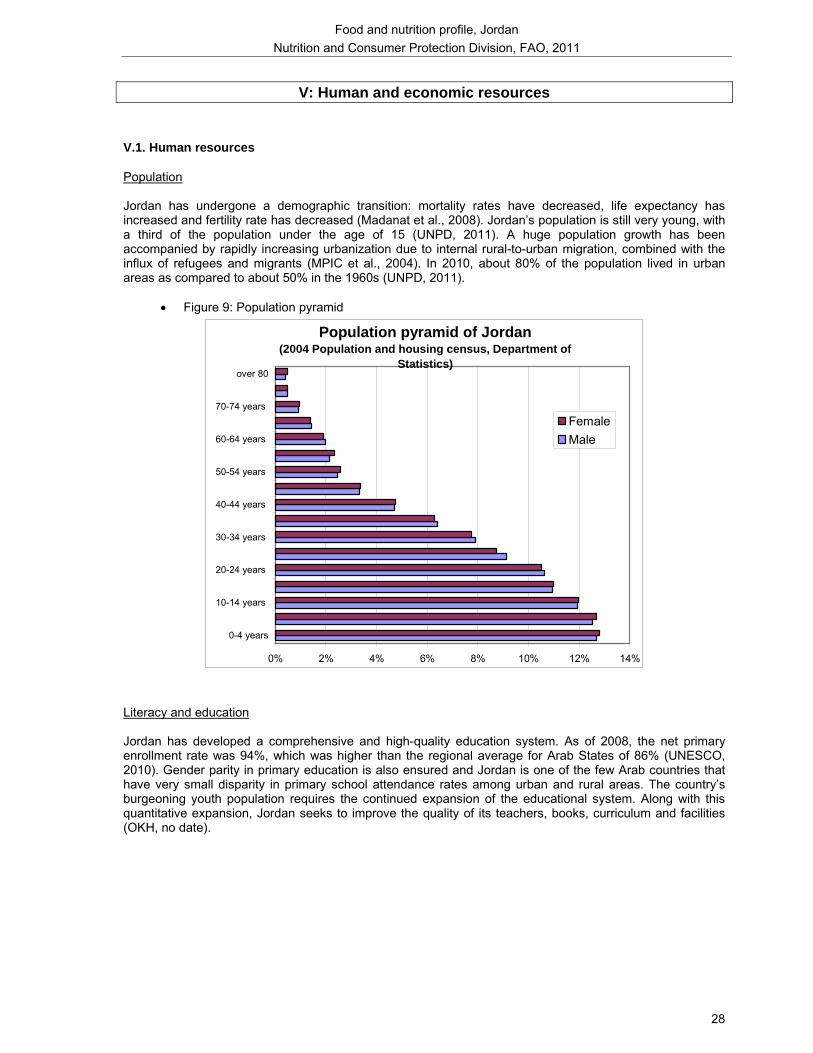
Food and nutrition profile, Jordan Nutrition and Consumer Protection Division, FAO, 2011
28
V: Human and economic resources
V.1. Human resources
Population Jordan has undergone a demographic transition: mortality rates have decreased, life expectancy has increased and fertility rate has decreased (Madanat et al., 2008). Jordan’s population is still very young, with a third of the population under the age of 15 (UNPD, 2011). A huge population growth has been accompanied by rapidly increasing urbanization due to internal rural-to-urban migration, combined with the influx of refugees and migrants (MPIC et al., 2004). In 2010, about 80% of the population lived in urban areas as compared to about 50% in the 1960s (UNPD, 2011).
• Figure 9: Population pyramid
Population pyramid of Jordan (2004 Population and housing census, Department of
Statistics)
0% 2% 4% 6% 8% 10% 12% 14%
0-4 years
10-14 years
20-24 years
30-34 years
40-44 years
50-54 years
60-64 years
70-74 years
over 80
FemaleMale
Literacy and education Jordan has developed a comprehensive and high-quality education system. As of 2008, the net primary enrollment rate was 94%, which was higher than the regional average for Arab States of 86% (UNESCO, 2010). Gender parity in primary education is also ensured and Jordan is one of the few Arab countries that have very small disparity in primary school attendance rates among urban and rural areas. The country’s burgeoning youth population requires the continued expansion of the educational system. Along with this quantitative expansion, Jordan seeks to improve the quality of its teachers, books, curriculum and facilities (OKH, no date).
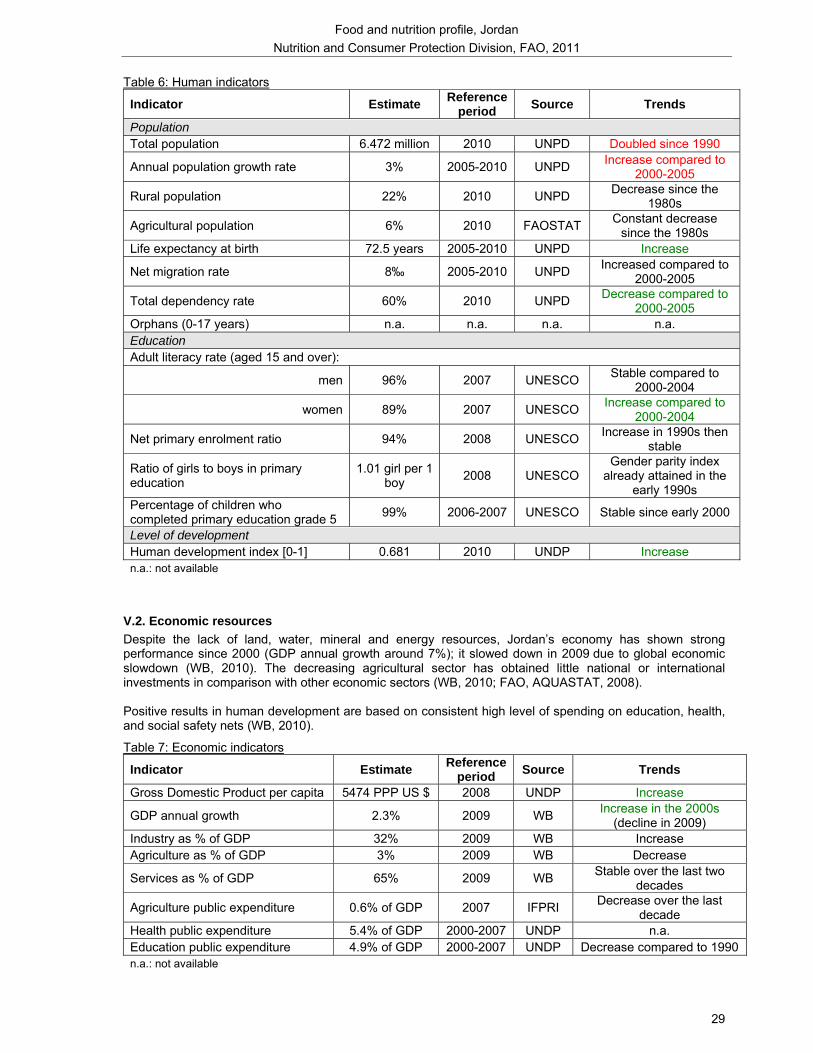
Food and nutrition profile, Jordan Nutrition and Consumer Protection Division, FAO, 2011
29
Table 6: Human indicators
Indicator Estimate Reference period Source Trends
Population Total population 6.472 million 2010 UNPD Doubled since 1990
Annual population growth rate 3% 2005-2010 UNPD Increase compared to 2000-2005
Rural population 22% 2010 UNPD Decrease since the 1980s
Agricultural population 6% 2010 FAOSTAT Constant decrease since the 1980s
Life expectancy at birth 72.5 years 2005-2010 UNPD Increase
Net migration rate 8‰ 2005-2010 UNPD Increased compared to 2000-2005
Total dependency rate 60% 2010 UNPD Decrease compared to 2000-2005
Orphans (0-17 years) n.a. n.a. n.a. n.a. Education Adult literacy rate (aged 15 and over):
men 96% 2007 UNESCO Stable compared to 2000-2004
women 89% 2007 UNESCO Increase compared to 2000-2004
Net primary enrolment ratio 94% 2008 UNESCO Increase in 1990s then stable
Ratio of girls to boys in primary education
1.01 girl per 1 boy 2008 UNESCO
Gender parity index already attained in the
early 1990s Percentage of children who completed primary education grade 5 99% 2006-2007 UNESCO Stable since early 2000
Level of development Human development index [0-1] 0.681 2010 UNDP Increase n.a.: not available
V.2. Economic resources Despite the lack of land, water, mineral and energy resources, Jordan’s economy has shown strong performance since 2000 (GDP annual growth around 7%); it slowed down in 2009 due to global economic slowdown (WB, 2010). The decreasing agricultural sector has obtained little national or international investments in comparison with other economic sectors (WB, 2010; FAO, AQUASTAT, 2008). Positive results in human development are based on consistent high level of spending on education, health, and social safety nets (WB, 2010).
Table 7: Economic indicators
Indicator Estimate Reference period Source Trends
Gross Domestic Product per capita 5474 PPP US $ 2008 UNDP Increase
GDP annual growth 2.3% 2009 WB Increase in the 2000s (decline in 2009)
Industry as % of GDP 32% 2009 WB Increase Agriculture as % of GDP 3% 2009 WB Decrease
Services as % of GDP 65% 2009 WB Stable over the last two decades
Agriculture public expenditure 0.6% of GDP 2007 IFPRI Decrease over the last decade
Health public expenditure 5.4% of GDP 2000-2007 UNDP n.a. Education public expenditure 4.9% of GDP 2000-2007 UNDP Decrease compared to 1990 n.a.: not available
Food and nutrition profile, Jordan Nutrition and Consumer Protection Division, FAO, 2011
30
Policies and programmes aiming to improve nutrition and food security
The Government of Jordan has approached food security through three sectoral entry points: social protection initiatives (e.g. distribution of cash), short-term responses to economic events (e.g. removal of taxes and tariffs on essential commodities, subsidization of some food items) and long-term poverty alleviation interventions (AARDO, 2010). A Special Programme for Food Security was formulated in 2004 in collaboration with FAO. This Programme was expanded and became the National Programme for Food Security (NPFS), which was approved in 2005. The main objective of this programme is to improve food security of poor rural households, mainly through a sustainable increase in productivity of small farmers and a reduction in year-to-year variability in production. The programme also aims at promoting income-generating activities, maximizing the degree of self-reliance of rural women and increasing net incomes through activating the role of rural families. The programme includes 21 projects to be implemented by the various technical departments of the Ministry of Agriculture, such as the development of field crop production, horticulture and small livestock at household level. On the 21 projects planned, about half have already been implemented. In 2011, about 18,000 families of farmers in all regions of the country should benefit from these projects. A mid-term review is underway that will assess the performance of the programme and provide the basis for defining future directions (Personal communication F. Hadhri, FAO; AARDO, 2010; MoH and WHO, 2010b). In 2010, a Joint UN Programme on Food and Nutrition Security in Jordan towards poverty alleviation was implemented for a 3-year period (UNDP/GoJ, 2010). This Programme includes 4 outcomes: national food security response is enhanced and coordinated; small-holder farmer sustainable food production is increased; nutrition interventions and safety nets are strengthened and made more accessible; and sustainable livelihoods and food security of the poor are enhanced. Various ministries (Ministries of Planning, Agriculture, Education, Health) and organisms are responsible for its implementation (UNDP/GoJ, 2010). In the framework of this Programme, the Jordanian Government intends to design a National Food Security Strategy and a Plan of Action with funding from UNDP. The Government established a High Committee on Food Security in December 2010, chaired by the Ministry of Agriculture with representatives from relevant food security stakeholders, to monitor and oversee the food security strategy and programmes in the country (Personal communication F.Hadhri, FAO). Since 1980s, the Government has developed a strong social safety net strategy. Initially, it took the form of generalized untargeted subsidies of many foodstuffs. These subsidies have been sequentially removed. They were replaced with food coupons made available to Jordanians households to buy sugar, rice and powdered milk. Food coupons were replaced by cash transfers that were eliminated in 1999 (Shaban et al., 2001). Currently, subsidized foods include wheat flour, rice and sugar. Wheat flour, which is used to make bread, is subsidized up to 50% by the government; as a result, although prices on international markets have been increasing recently, the price of bread remained stable for the consumer in Jordan. Sugar and rice are subsidized indirectly through a reduction of taxes on the food imported. Regarding nutrition interventions, in 2010, MoH and WHO proposed multi-sectoral food and nutrition policies (MoH and WHO, 2010b):
- incorporating healthy nutrition objectives into the National Health Development Plan - improving food security by (i) promoting the availability of the main food commodities from domestic
resources, (ii) diversifying food exports according to the food security needs of the country, and monitoring and regulating the quality and quantity of food imports, as necessary, (iii) addressing inequalities and improving nutrition of poor and marginalised populations.
- strengthening food safety and consumer protection - promoting infant and childhood nutrition and preventing micronutrient deficiencies by (i) reducing the
prevalence of VAD among children (promotion of the consumption of vitamin A-rich foods, vitamin A supplementation programmes, communication strategy, etc.); (ii) reducing the prevalence of anemia among the population (promotion of the consumption of iron-rich foods, supplementation programmes to pregnant women and to all children under five, especially for those under two years of age, surveillance and control programmes for diseases like schistosomiasis and parasitic infections, expansion of the current flour fortification programme to include all types of flour); (iii) eliminating IDD; (iv) reducing chronic malnutrition among the under-five years and young school children in rural and under-privileged areas (promotion of exclusive breastfeeding and complementary feeding practices, strengthen the assessment of growth and development programmes for under-five years and young school children; strengthening Maternal and Child Health services and promote the implementation of the Integrated Management of Childhood Illness programme).

Food and nutrition profile, Jordan Nutrition and Consumer Protection Division, FAO, 2011
31
- improving the nutritional status of the disadvantaged, socio-economically deprived and nutritionally vulnerable groups (through awareness and education, capacity building, monitoring and evaluation)
- preventing diet related non-communicable diseases (strengthen efforts to control major risk factors for NCDs by public health action, health promotion and disease prevention measures)
Some nutrition objectives are also included in the Joint UN Programme; these objectives aim to enhance micronutrient supplementation and flour fortification, increase the rate of exclusive breastfeeding from 22% to 25% in three years, promote adequate complementary feeding practices, strengthen the School Feeding Programme, etc. (UNDP/GoJ, 2010).
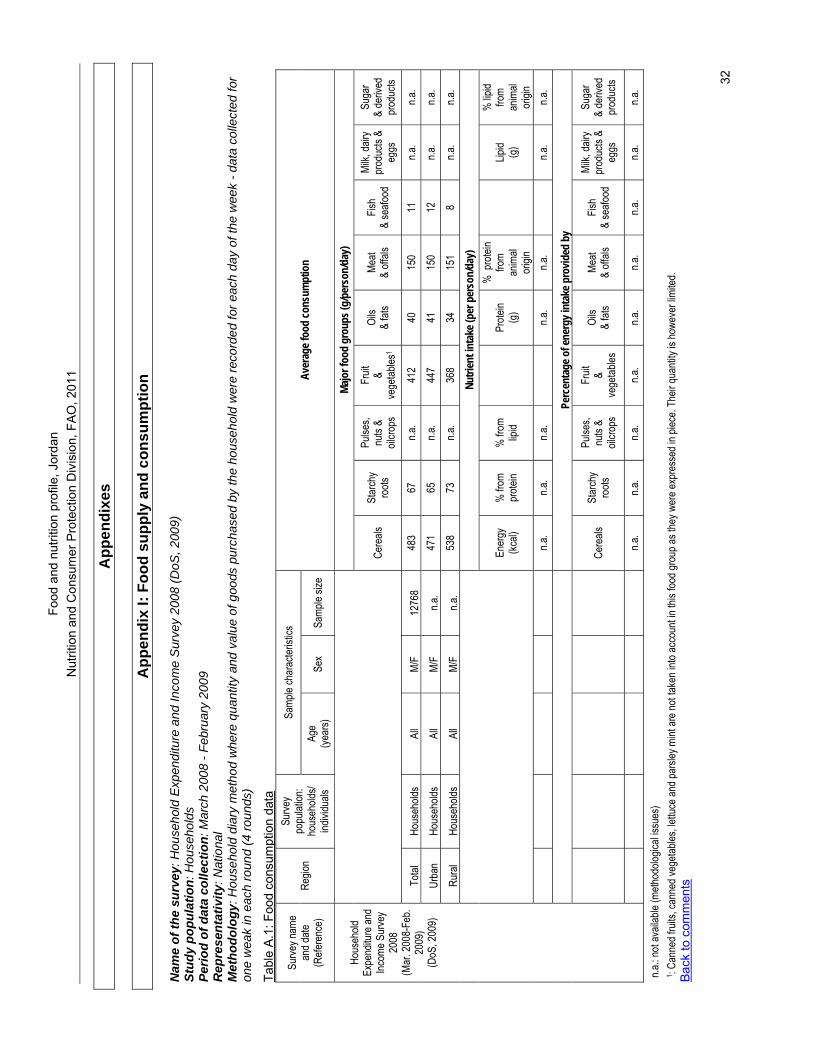
Food
and
nut
ritio
n pr
ofile
, Jor
dan
N
utrit
ion
and
Con
sum
er P
rote
ctio
n D
ivis
ion,
FAO
, 201
1
32
App
endi
xes
A
ppen
dix
I: Fo
od s
uppl
y an
d co
nsum
ptio
n N
ame
of th
e su
rvey
: Hou
seho
ld E
xpen
ditu
re a
nd In
com
e S
urve
y 20
08 (D
oS, 2
009)
St
udy
popu
latio
n: H
ouse
hold
s Pe
riod
of d
ata
colle
ctio
n: M
arch
200
8 - F
ebru
ary
2009
R
epre
sent
ativ
ity: N
atio
nal
Met
hodo
logy
: Hou
seho
ld d
iary
met
hod
whe
re q
uant
ity a
nd v
alue
of g
oods
pur
chas
ed b
y th
e ho
useh
old
wer
e re
cord
ed fo
r eac
h da
y of
the
wee
k - d
ata
colle
cted
for
one
wea
k in
eac
h ro
und
(4 ro
unds
)
Tabl
e A
.1: F
ood
cons
umpt
ion
data
Sa
mple
char
acter
istics
Su
rvey n
ame
and d
ate
(Refe
renc
e)
Regio
n Su
rvey
popu
lation
: ho
useh
olds/
indivi
duals
Ag
e (ye
ars)
Sex
Samp
le siz
e Av
erag
e foo
d co
nsum
ptio
n
Ma
jor f
ood
grou
ps (g
/per
son/
day)
Ce
reals
St
arch
y ro
ots
Pulse
s, nu
ts &
oilcro
ps
Fruit
&
vege
tables
1 Oi
ls
& fat
s Me
at &
offals
Fis
h &
seafo
od
Milk,
dairy
pr
oduc
ts &
eggs
Suga
r &
deriv
ed
prod
ucts
Total
Ho
useh
olds
All
M/F
1276
8 48
3 67
n.a
. 41
2 40
15
0 11
n.a
. n.a
.
Urba
n Ho
useh
olds
All
M/F
n.a.
471
65
n.a.
447
41
150
12
n.a.
n.a.
Rura
l Ho
useh
olds
All
M/F
n.a.
538
73
n.a.
368
34
151
8 n.a
. n.a
.
Nutri
ent i
ntak
e (pe
r per
son/
day)
En
ergy
(kc
al)
% fr
om
prote
in %
from
lip
id
Prote
in (g
)
% p
rotei
n fro
m an
imal
origi
n
Lipid
(g)
% lip
id fro
m an
imal
origi
n
n.a
. n.a
. n.a
.
n.a.
n.a.
n.a
. n.a
.
Perc
enta
ge o
f ene
rgy i
ntak
e pro
vided
by
Ce
reals
St
arch
y ro
ots
Pulse
s, nu
ts &
oilcro
ps
Fruit
&
vege
tables
Oi
ls
& fat
s Me
at &
offals
Fis
h &
seafo
od
Milk,
dairy
pr
oduc
ts &
eggs
Suga
r &
deriv
ed
prod
ucts
Ho
useh
old
Expe
nditu
re an
d Inc
ome S
urve
y 20
08
(Mar
. 200
8-Fe
b. 20
09)
(DoS
, 200
9)
n.a
. n.a
. n.a
. n.a
. n.a
. n.a
. n.a
. n.a
. n.a
.
n.a.: n
ot av
ailab
le (m
ethod
ologic
al iss
ues)
1 :
Cann
ed fr
uits,
cann
ed ve
getab
les, le
ttuce
and p
arsle
y mint
are n
ot tak
en in
to ac
coun
t in th
is foo
d gro
up as
they
wer
e exp
ress
ed in
piec
e. Th
eir qu
antity
is ho
weve
r limi
ted.
Bac
k to
com
men
ts
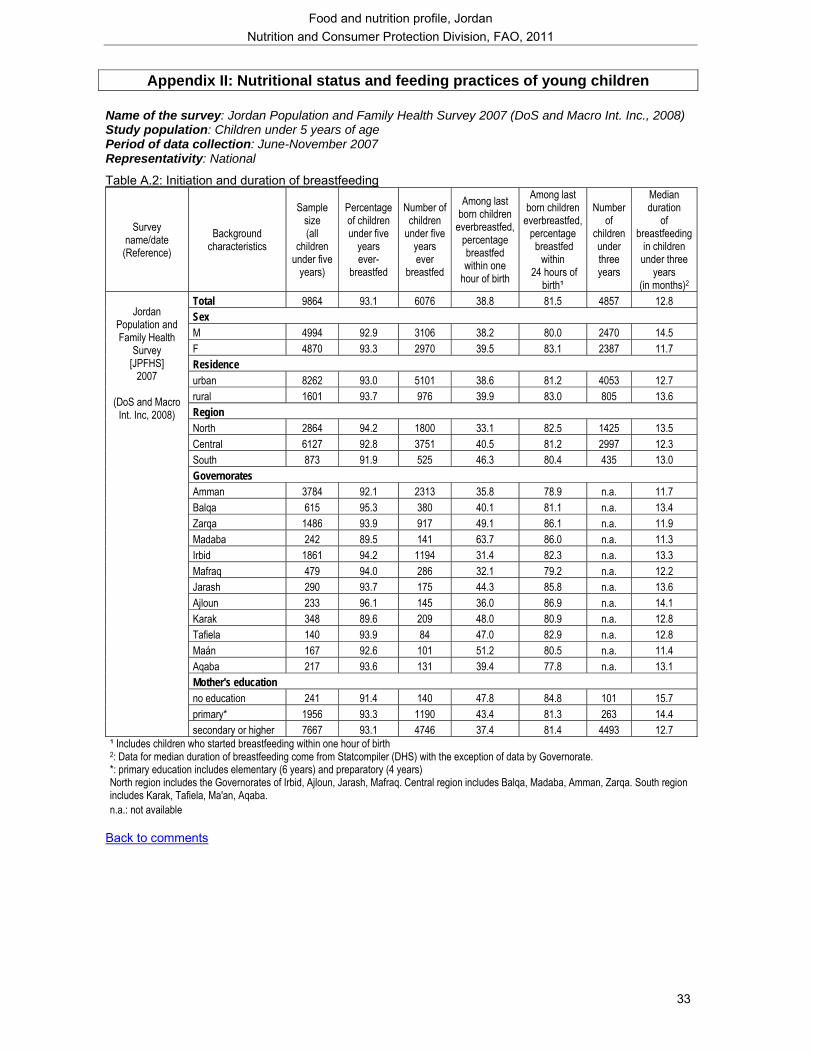
Food and nutrition profile, Jordan Nutrition and Consumer Protection Division, FAO, 2011
33
Appendix II: Nutritional status and feeding practices of young children
Name of the survey: Jordan Population and Family Health Survey 2007 (DoS and Macro Int. Inc., 2008) Study population: Children under 5 years of age Period of data collection: June-November 2007 Representativity: National
Table A.2: Initiation and duration of breastfeeding
Survey name/date (Reference)
Background characteristics
Sample size (all
children under five
years)
Percentage of children under five
years ever-
breastfed
Number of children
under five years ever
breastfed
Among last born children
everbreastfed, percentage breastfed within one
hour of birth
Among last born children
everbreastfed, percentage breastfed
within 24 hours of
birth¹
Number of
children under three years
Median duration
of breastfeeding
in children under three
years (in months)2
Total 9864 93.1 6076 38.8 81.5 4857 12.8 Sex M 4994 92.9 3106 38.2 80.0 2470 14.5 F 4870 93.3 2970 39.5 83.1 2387 11.7 Residence urban 8262 93.0 5101 38.6 81.2 4053 12.7 rural 1601 93.7 976 39.9 83.0 805 13.6 Region North 2864 94.2 1800 33.1 82.5 1425 13.5 Central 6127 92.8 3751 40.5 81.2 2997 12.3 South 873 91.9 525 46.3 80.4 435 13.0 Governorates Amman 3784 92.1 2313 35.8 78.9 n.a. 11.7 Balqa 615 95.3 380 40.1 81.1 n.a. 13.4 Zarqa 1486 93.9 917 49.1 86.1 n.a. 11.9 Madaba 242 89.5 141 63.7 86.0 n.a. 11.3 Irbid 1861 94.2 1194 31.4 82.3 n.a. 13.3 Mafraq 479 94.0 286 32.1 79.2 n.a. 12.2 Jarash 290 93.7 175 44.3 85.8 n.a. 13.6 Ajloun 233 96.1 145 36.0 86.9 n.a. 14.1 Karak 348 89.6 209 48.0 80.9 n.a. 12.8 Tafiela 140 93.9 84 47.0 82.9 n.a. 12.8 Maán 167 92.6 101 51.2 80.5 n.a. 11.4 Aqaba 217 93.6 131 39.4 77.8 n.a. 13.1 Mother's education no education 241 91.4 140 47.8 84.8 101 15.7 primary* 1956 93.3 1190 43.4 81.3 263 14.4
Jordan
Population and Family Health
Survey [JPFHS]
2007
(DoS and Macro Int. Inc, 2008)
secondary or higher 7667 93.1 4746 37.4 81.4 4493 12.7 ¹ Includes children who started breastfeeding within one hour of birth 2: Data for median duration of breastfeeding come from Statcompiler (DHS) with the exception of data by Governorate. *: primary education includes elementary (6 years) and preparatory (4 years) North region includes the Governorates of Irbid, Ajloun, Jarash, Mafraq. Central region includes Balqa, Madaba, Amman, Zarqa. South region includes Karak, Tafiela, Ma'an, Aqaba. n.a.: not available
Back to comments
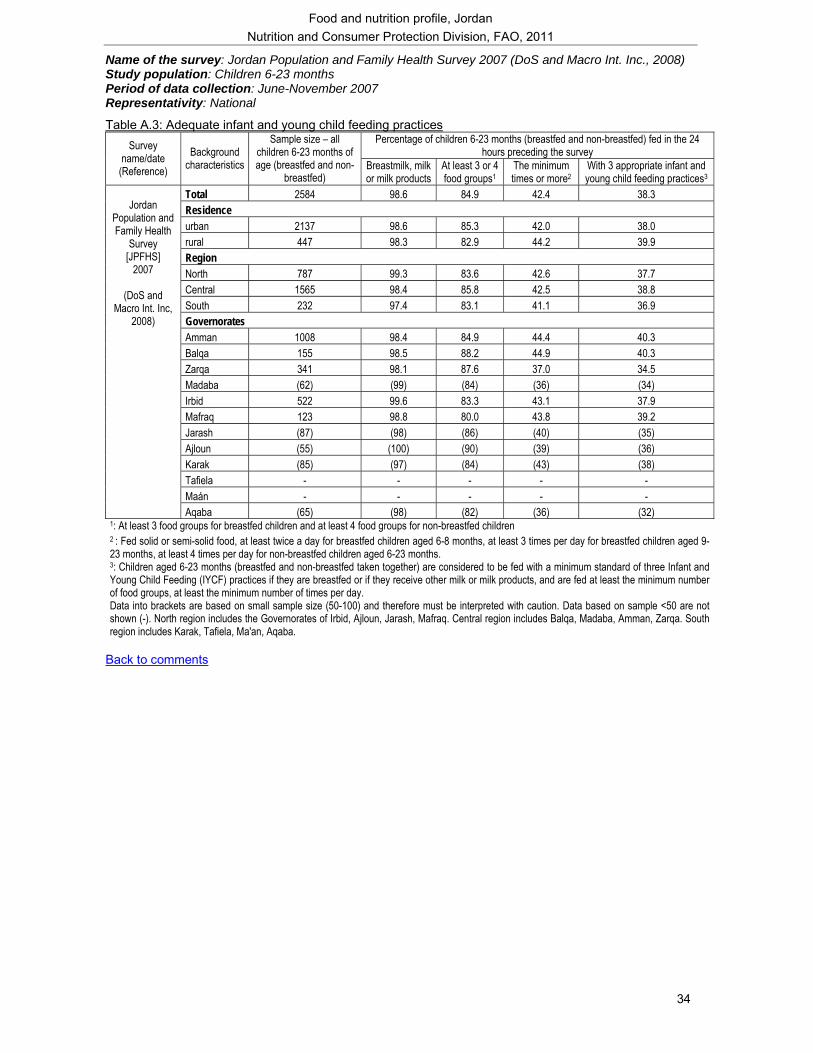
Food and nutrition profile, Jordan Nutrition and Consumer Protection Division, FAO, 2011
34
Name of the survey: Jordan Population and Family Health Survey 2007 (DoS and Macro Int. Inc., 2008) Study population: Children 6-23 months Period of data collection: June-November 2007 Representativity: National
Table A.3: Adequate infant and young child feeding practices Percentage of children 6-23 months (breastfed and non-breastfed) fed in the 24
hours preceding the survey Survey name/date
(Reference) Background
characteristics
Sample size – all children 6-23 months of age (breastfed and non-
breastfed) Breastmilk, milk or milk products
At least 3 or 4 food groups1
The minimum times or more2
With 3 appropriate infant and young child feeding practices3
Total 2584 98.6 84.9 42.4 38.3 Residence urban 2137 98.6 85.3 42.0 38.0 rural 447 98.3 82.9 44.2 39.9 Region North 787 99.3 83.6 42.6 37.7 Central 1565 98.4 85.8 42.5 38.8 South 232 97.4 83.1 41.1 36.9 Governorates Amman 1008 98.4 84.9 44.4 40.3 Balqa 155 98.5 88.2 44.9 40.3 Zarqa 341 98.1 87.6 37.0 34.5 Madaba (62) (99) (84) (36) (34) Irbid 522 99.6 83.3 43.1 37.9 Mafraq 123 98.8 80.0 43.8 39.2 Jarash (87) (98) (86) (40) (35) Ajloun (55) (100) (90) (39) (36) Karak (85) (97) (84) (43) (38) Tafiela - - - - - Maán - - - - -
Jordan
Population and Family Health
Survey [JPFHS]
2007
(DoS and Macro Int. Inc,
2008)
Aqaba (65) (98) (82) (36) (32) 1: At least 3 food groups for breastfed children and at least 4 food groups for non-breastfed children 2 : Fed solid or semi-solid food, at least twice a day for breastfed children aged 6-8 months, at least 3 times per day for breastfed children aged 9-23 months, at least 4 times per day for non-breastfed children aged 6-23 months. 3: Children aged 6-23 months (breastfed and non-breastfed taken together) are considered to be fed with a minimum standard of three Infant and Young Child Feeding (IYCF) practices if they are breastfed or if they receive other milk or milk products, and are fed at least the minimum number of food groups, at least the minimum number of times per day. Data into brackets are based on small sample size (50-100) and therefore must be interpreted with caution. Data based on sample <50 are not shown (-). North region includes the Governorates of Irbid, Ajloun, Jarash, Mafraq. Central region includes Balqa, Madaba, Amman, Zarqa. South region includes Karak, Tafiela, Ma'an, Aqaba.
Back to comments
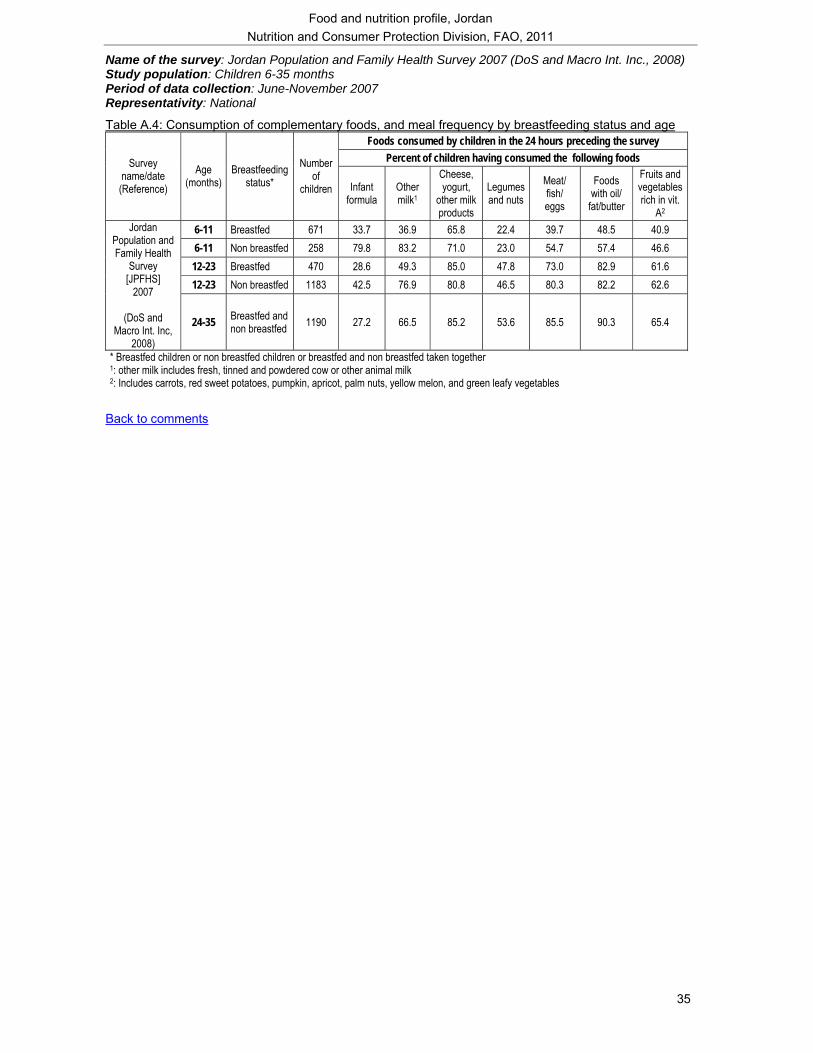
Food and nutrition profile, Jordan Nutrition and Consumer Protection Division, FAO, 2011
35
Name of the survey: Jordan Population and Family Health Survey 2007 (DoS and Macro Int. Inc., 2008) Study population: Children 6-35 months Period of data collection: June-November 2007 Representativity: National
Table A.4: Consumption of complementary foods, and meal frequency by breastfeeding status and age Foods consumed by children in the 24 hours preceding the survey
Percent of children having consumed the following foods Survey name/date (Reference)
Age (months)
Breastfeeding status*
Number of
children Infant formula
Other milk1
Cheese, yogurt,
other milk products
Legumes and nuts
Meat/ fish/ eggs
Foods with oil/
fat/butter
Fruits and vegetables rich in vit.
A2 6-11 Breastfed 671 33.7 36.9 65.8 22.4 39.7 48.5 40.9 6-11 Non breastfed 258 79.8 83.2 71.0 23.0 54.7 57.4 46.6 12-23 Breastfed 470 28.6 49.3 85.0 47.8 73.0 82.9 61.6 12-23 Non breastfed 1183 42.5 76.9 80.8 46.5 80.3 82.2 62.6
Jordan Population and Family Health
Survey [JPFHS]
2007
(DoS and Macro Int. Inc,
2008)
24-35 Breastfed and non breastfed 1190 27.2 66.5 85.2 53.6 85.5 90.3 65.4
* Breastfed children or non breastfed children or breastfed and non breastfed taken together 1: other milk includes fresh, tinned and powdered cow or other animal milk 2: Includes carrots, red sweet potatoes, pumpkin, apricot, palm nuts, yellow melon, and green leafy vegetables
Back to comments
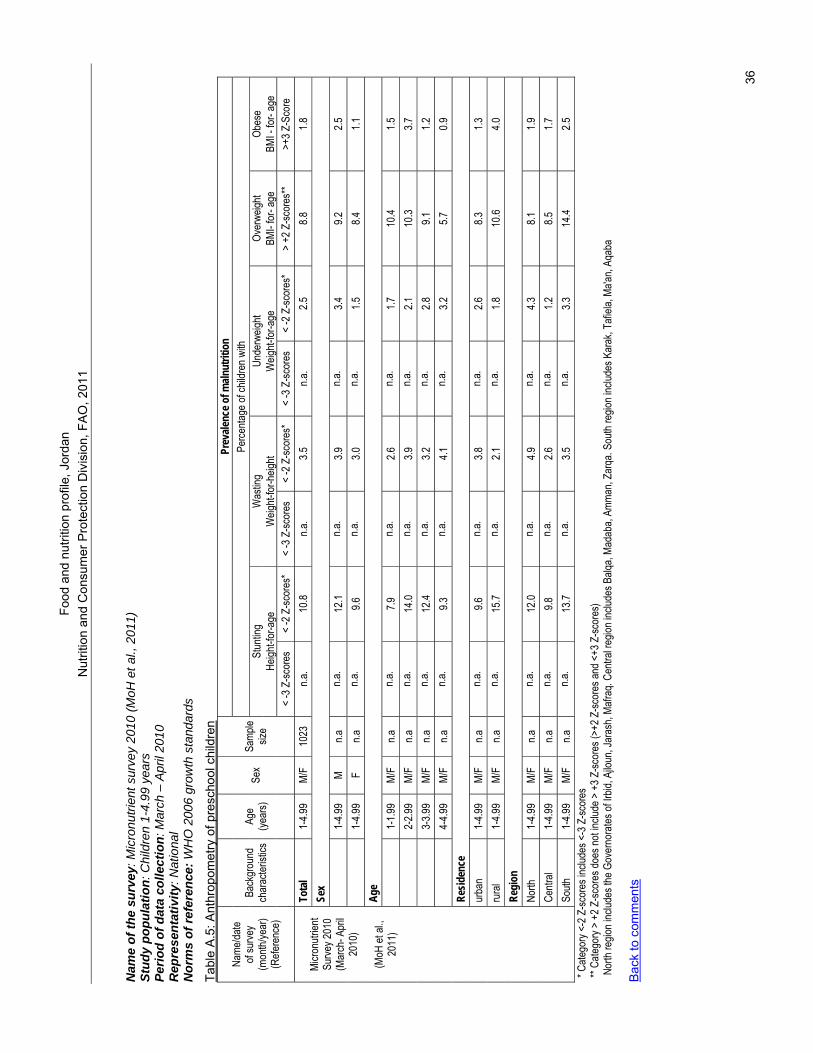
Food
and
nut
ritio
n pr
ofile
, Jor
dan
N
utrit
ion
and
Con
sum
er P
rote
ctio
n D
ivis
ion,
FAO
, 201
1
36
Nam
e of
the
surv
ey: M
icro
nutri
ent s
urve
y 20
10 (M
oH e
t al.,
201
1)
Stud
y po
pula
tion:
Chi
ldre
n 1-
4.99
yea
rs
Perio
d of
dat
a co
llect
ion:
Mar
ch –
Apr
il 20
10
Rep
rese
ntat
ivity
: Nat
iona
l N
orm
s of
refe
renc
e: W
HO
200
6 gr
owth
sta
ndar
ds
Tabl
e A
.5: A
nthr
opom
etry
of p
resc
hool
chi
ldre
n
Prev
alenc
e of m
alnut
ritio
n Pe
rcenta
ge of
child
ren w
ith
Stun
ting
Was
ting
Unde
rweig
ht Ov
erwe
ight
Obes
e He
ight-f
or-a
ge
Weig
ht-for
-heig
ht W
eight-
for-a
ge
BMI-
for- a
ge
BMI -
for-
age
Name
/date
of su
rvey
(mon
th/ye
ar)
(Refe
renc
e)
Back
grou
nd
char
acter
istics
Ag
e (ye
ars)
Sex
Samp
le siz
e
< -3
Z-sc
ores
<
-2 Z
-scor
es*
< -3
Z-sc
ores
<
-2 Z
-scor
es*
< -3
Z-sc
ores
<
-2 Z
-scor
es*
> +2
Z-sc
ores
** >+
3 Z-S
core
To
tal
1-4.9
9 M/
F 10
23
n.a.
10.8
n.a.
3.5
n.a.
2.5
8.8
1.8
Sex
1-
4.99
M n.a
n.a
. 12
.1 n.a
. 3.9
n.a
. 3.4
9.2
2.5
1-4.9
9 F
n.a
n.a.
9.6
n.a.
3.0
n.a.
1.5
8.4
1.1
Age
1-
1.99
M/F
n.a
n.a.
7.9
n.a.
2.6
n.a.
1.7
10.4
1.5
2-
2.99
M/F
n.a
n.a.
14.0
n.a.
3.9
n.a.
2.1
10.3
3.7
3-
3.99
M/F
n.a
n.a.
12.4
n.a.
3.2
n.a.
2.8
9.1
1.2
4-
4.99
M/F
n.a
n.a.
9.3
n.a.
4.1
n.a.
3.2
5.7
0.9
Resid
ence
ur
ban
1-4.9
9 M/
F n.a
n.a
. 9.6
n.a
. 3.8
n.a
. 2.6
8.3
1.3
ru
ral
1-4.9
9 M/
F n.a
n.a
. 15
.7 n.a
. 2.1
n.a
. 1.8
10
.6 4.0
Re
gion
No
rth
1-4.9
9 M/
F n.a
n.a
. 12
.0 n.a
. 4.9
n.a
. 4.3
8.1
1.9
Ce
ntral
1-4.9
9 M/
F n.a
n.a
. 9.8
n.a
. 2.6
n.a
. 1.2
8.5
1.7
Mi
cronu
trient
Surve
y 201
0 (M
arch
- Apr
il 20
10)
(M
oH et
al.,
2011
)
South
1-
4.99
M/F
n.a
n.a.
13.7
n.a.
3.5
n.a.
3.3
14.4
2.5
* Cate
gory
<-2 Z
-scor
es in
clude
s <-3
Z-sc
ores
** Ca
tegor
y > +
2 Z-sc
ores
does
not in
clude
> +
3 Z-sc
ores
(>+2
Z-sc
ores
and <
+3 Z
-scor
es)
Nor
th re
gion i
nclud
es th
e Gov
erno
rates
of Ir
bid, A
jloun
, Jar
ash,
Mafra
q. Ce
ntral
regio
n inc
ludes
Balq
a, Ma
daba
, Amm
an, Z
arqa
. Sou
th re
gion i
nclud
es K
arak
, Tafi
ela, M
a'an,
Aqab
a B
ack
to c
omm
ents
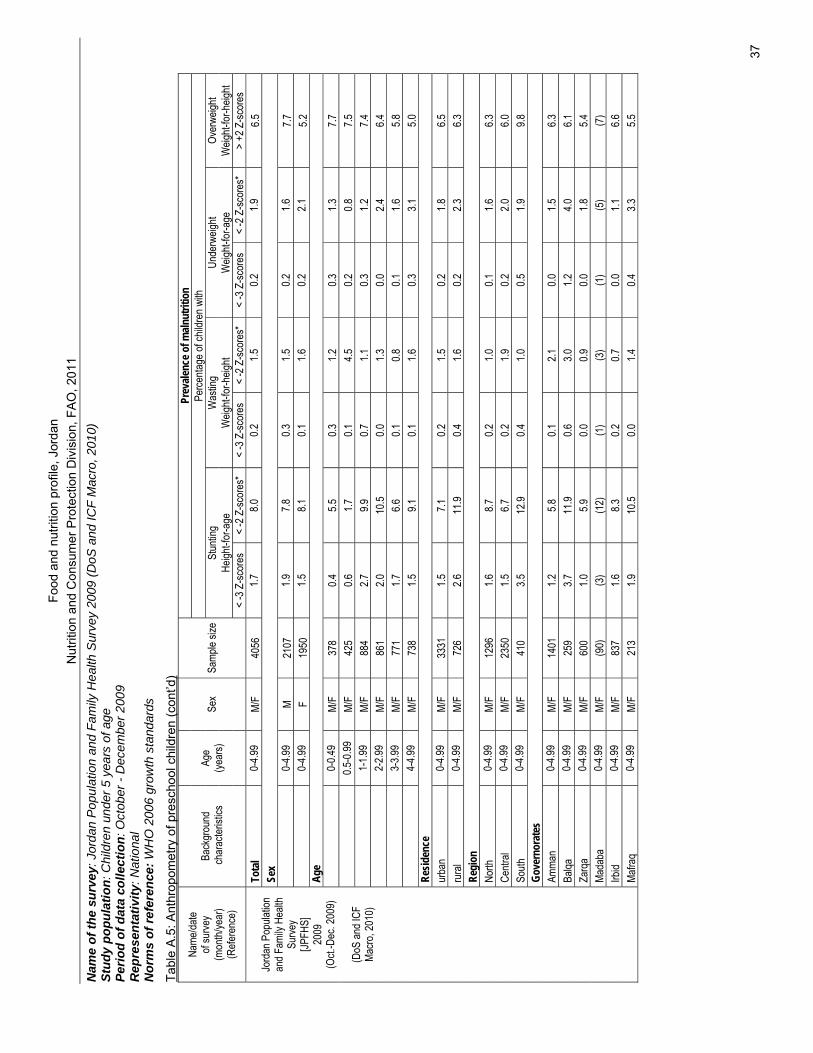
Food
and
nut
ritio
n pr
ofile
, Jor
dan
N
utrit
ion
and
Con
sum
er P
rote
ctio
n D
ivis
ion,
FA
O, 2
011
37
Nam
e of
the
surv
ey: J
orda
n P
opul
atio
n an
d Fa
mily
Hea
lth S
urve
y 20
09 (D
oS a
nd IC
F M
acro
, 201
0)
Stud
y po
pula
tion:
Chi
ldre
n un
der 5
yea
rs o
f age
Pe
riod
of d
ata
colle
ctio
n: O
ctob
er -
Dec
embe
r 200
9 R
epre
sent
ativ
ity: N
atio
nal
Nor
ms
of re
fere
nce:
WH
O 2
006
grow
th s
tand
ards
Tabl
e A
.5: A
nthr
opom
etry
of p
resc
hool
chi
ldre
n (c
ont’d
) Pr
evale
nce o
f maln
utrit
ion
Perce
ntage
of ch
ildre
n with
St
untin
g W
astin
g Un
derw
eight
Over
weigh
t He
ight-f
or-a
ge
Weig
ht-for
-heig
ht W
eight-
for-a
ge
Weig
ht-for
-heig
ht
Name
/date
of su
rvey
(mon
th/ye
ar)
(Refe
renc
e)
Back
grou
nd
char
acter
istics
Ag
e (ye
ars)
Sex
Samp
le siz
e
< -3
Z-sc
ores
<
-2 Z
-scor
es*
< -3
Z-sc
ores
<
-2 Z
-scor
es*
< -3
Z-sc
ores
<
-2 Z
-scor
es*
> +2
Z-sc
ores
To
tal
0-4.9
9 M/
F 40
56
1.7
8.0
0.2
1.5
0.2
1.9
6.5
Sex
0-
4.99
M 21
07
1.9
7.8
0.3
1.5
0.2
1.6
7.7
0-
4.99
F 19
50
1.5
8.1
0.1
1.6
0.2
2.1
5.2
Age
0-
0.49
M/F
378
0.4
5.5
0.3
1.2
0.3
1.3
7.7
0.5
-0.99
M/
F 42
5 0.6
1.7
0.1
4.5
0.2
0.8
7.5
1-1.9
9 M/
F 88
4 2.7
9.9
0.7
1.1
0.3
1.2
7.4
2-2.9
9 M/
F 86
1 2.0
10
.5 0.0
1.3
0.0
2.4
6.4
3-3.9
9 M/
F 77
1 1.7
6.6
0.1
0.8
0.1
1.6
5.8
4-4.9
9 M/
F 73
8 1.5
9.1
0.1
1.6
0.3
3.1
5.0
Re
siden
ce
urba
n 0-
4.99
M/F
3331
1.5
7.1
0.2
1.5
0.2
1.8
6.5
ru
ral
0-4.9
9 M/
F 72
6 2.6
11
.9 0.4
1.6
0.2
2.3
6.3
Re
gion
No
rth
0-4.9
9 M/
F 12
96
1.6
8.7
0.2
1.0
0.1
1.6
6.3
Centr
al 0-
4.99
M/F
2350
1.5
6.7
0.2
1.9
0.2
2.0
6.0
So
uth
0-4.9
9 M/
F 41
0 3.5
12
.9 0.4
1.0
0.5
1.9
9.8
Go
vern
orat
es
Amma
n 0-
4.99
M/F
1401
1.2
5.8
0.1
2.1
0.0
1.5
6.3
Ba
lqa
0-4.9
9 M/
F 25
9 3.7
11
.9 0.6
3.0
1.2
4.0
6.1
Za
rqa
0-4.9
9 M/
F 60
0 1.0
5.9
0.0
0.9
0.0
1.8
5.4
Ma
daba
0-
4.99
M/F
(90)
(3
) (1
2)
(1)
(3)
(1)
(5)
(7)
Irbid
0-4.9
9 M/
F 83
7 1.6
8.3
0.2
0.7
0.0
1.1
6.6
Jo
rdan
Pop
ulatio
n an
d Fam
ily H
ealth
Su
rvey
[JPFH
S]
2009
(O
ct.-D
ec. 2
009)
(DoS
and I
CF
Macro
, 201
0)
Mafra
q 0-
4.99
M/F
213
1.9
10.5
0.0
1.4
0.4
3.3
5.5
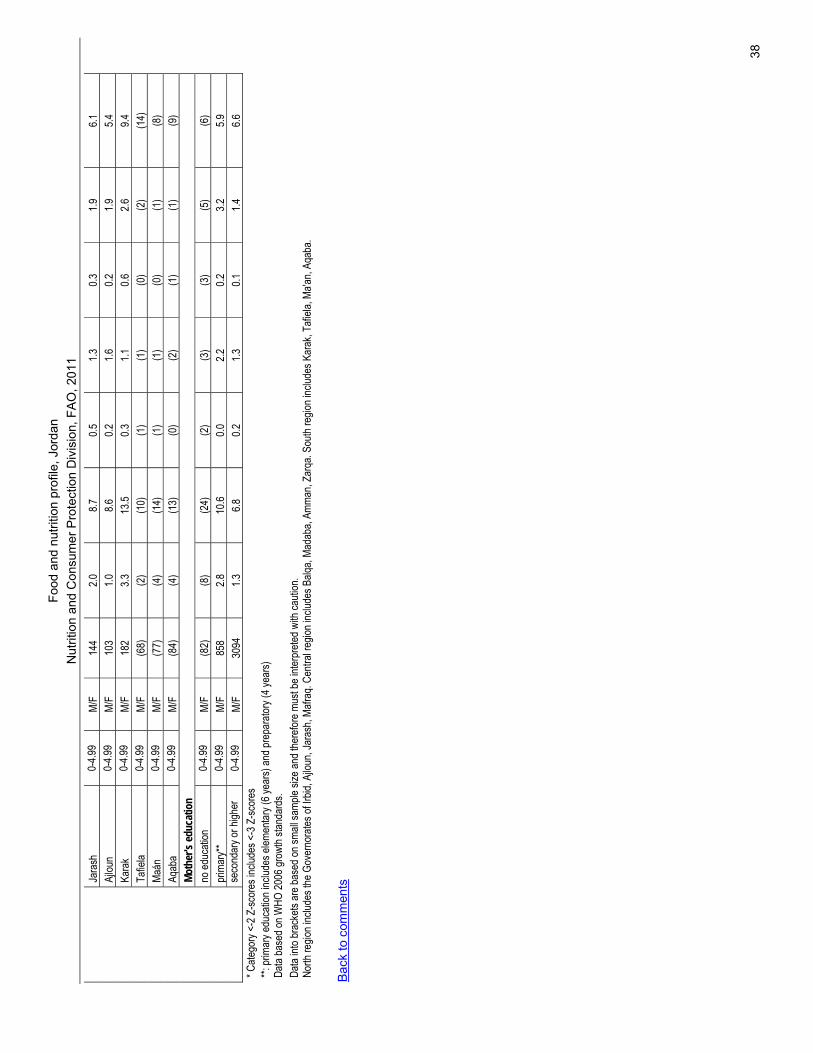
Food
and
nut
ritio
n pr
ofile
, Jor
dan
N
utrit
ion
and
Con
sum
er P
rote
ctio
n D
ivis
ion,
FA
O, 2
011
38
Jara
sh
0-4.9
9 M/
F 14
4 2.0
8.7
0.5
1.3
0.3
1.9
6.1
Aj
loun
0-4.9
9 M/
F 10
3 1.0
8.6
0.2
1.6
0.2
1.9
5.4
Ka
rak
0-4.9
9 M/
F 18
2 3.3
13
.5 0.3
1.1
0.6
2.6
9.4
Ta
fiela
0-4.9
9 M/
F (6
8)
(2)
(10)
(1
) (1
) (0
) (2
) (1
4)
Maán
0-
4.99
M/F
(77)
(4
) (1
4)
(1)
(1)
(0)
(1)
(8)
Aqab
a 0-
4.99
M/F
(84)
(4
) (1
3)
(0)
(2)
(1)
(1)
(9)
Moth
er's
educ
atio
n
no ed
ucati
on
0-4.9
9 M/
F (8
2)
(8)
(24)
(2
) (3
) (3
) (5
) (6
) pr
imar
y**
0-4.9
9 M/
F 85
8 2.8
10
.6 0.0
2.2
0.2
3.2
5.9
seco
ndar
y or h
igher
0-
4.99
M/F
3094
1.3
6.8
0.2
1.3
0.1
1.4
6.6
* C
atego
ry <-
2 Z-sc
ores
inclu
des <
-3 Z
-scor
es
**: pr
imar
y edu
catio
n inc
ludes
elem
entar
y (6 y
ears)
and p
repa
rator
y (4 y
ears)
Data
base
d on W
HO 20
06 gr
owth
stand
ards
.
Data
into b
rack
ets ar
e bas
ed on
small
samp
le siz
e and
ther
efore
mus
t be i
nterp
reted
with
cauti
on.
North
regio
n inc
ludes
the G
over
nora
tes of
Irbid
, Ajlo
un, J
aras
h, Ma
fraq.
Centr
al re
gion i
nclud
es B
alqa,
Mada
ba, A
mman
, Zar
qa. S
outh
regio
n inc
ludes
Kar
ak, T
afiela
, Ma'a
n, Aq
aba.
Bac
k to
com
men
ts
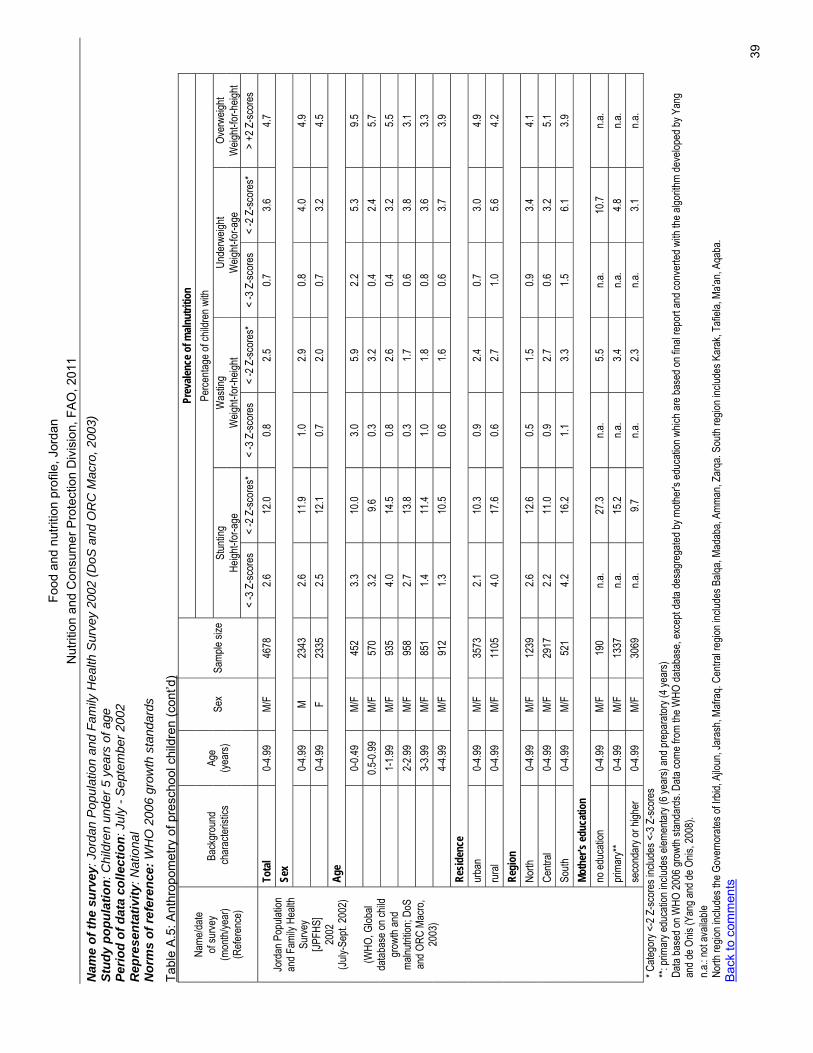
Food
and
nut
ritio
n pr
ofile
, Jor
dan
N
utrit
ion
and
Con
sum
er P
rote
ctio
n D
ivis
ion,
FA
O, 2
011
39
Nam
e of
the
surv
ey: J
orda
n P
opul
atio
n an
d Fa
mily
Hea
lth S
urve
y 20
02 (D
oS a
nd O
RC
Mac
ro, 2
003)
St
udy
popu
latio
n: C
hild
ren
unde
r 5 y
ears
of a
ge
Perio
d of
dat
a co
llect
ion:
Jul
y - S
epte
mbe
r 200
2 R
epre
sent
ativ
ity: N
atio
nal
Nor
ms
of re
fere
nce:
WH
O 2
006
grow
th s
tand
ards
Tabl
e A
.5: A
nthr
opom
etry
of p
resc
hool
chi
ldre
n (c
ont’d
) Pr
evale
nce o
f maln
utrit
ion
Perce
ntage
of ch
ildre
n with
St
untin
g W
astin
g Un
derw
eight
Over
weigh
t He
ight-f
or-a
ge
Weig
ht-for
-heig
ht W
eight-
for-a
ge
Weig
ht-for
-heig
ht
Name
/date
of su
rvey
(mon
th/ye
ar)
(Refe
renc
e)
Back
grou
nd
char
acter
istics
Ag
e (ye
ars)
Sex
Samp
le siz
e
< -3
Z-sc
ores
<
-2 Z
-scor
es*
< -3
Z-sc
ores
<
-2 Z
-scor
es*
< -3
Z-sc
ores
<
-2 Z
-scor
es*
> +2
Z-sc
ores
To
tal
0-4.9
9 M/
F 46
78
2.6
12.0
0.8
2.5
0.7
3.6
4.7
Sex
0-
4.99
M 23
43
2.6
11.9
1.0
2.9
0.8
4.0
4.9
0-
4.99
F 23
35
2.5
12.1
0.7
2.0
0.7
3.2
4.5
Age
0-
0.49
M/F
452
3.3
10.0
3.0
5.9
2.2
5.3
9.5
0.5
-0.99
M/
F 57
0 3.2
9.6
0.3
3.2
0.4
2.4
5.7
1-1.9
9 M/
F 93
5 4.0
14
.5 0.8
2.6
0.4
3.2
5.5
2-2.9
9 M/
F 95
8 2.7
13
.8 0.3
1.7
0.6
3.8
3.1
3-3.9
9 M/
F 85
1 1.4
11
.4 1.0
1.8
0.8
3.6
3.3
4-4.9
9 M/
F 91
2 1.3
10
.5 0.6
1.6
0.6
3.7
3.9
Re
siden
ce
urba
n 0-
4.99
M/F
3573
2.1
10
.3 0.9
2.4
0.7
3.0
4.9
ru
ral
0-4.9
9 M/
F 11
05
4.0
17.6
0.6
2.7
1.0
5.6
4.2
Regi
on
North
0-
4.99
M/F
1239
2.6
12
.6 0.5
1.5
0.9
3.4
4.1
Ce
ntral
0-4.9
9 M/
F 29
17
2.2
11.0
0.9
2.7
0.6
3.2
5.1
South
0-
4.99
M/F
521
4.2
16.2
1.1
3.3
1.5
6.1
3.9
Moth
er's
educ
atio
n no
educ
ation
0-
4.99
M/F
190
n.a.
27.3
n.a.
5.5
n.a.
10.7
n.a.
prim
ary*
* 0-
4.99
M/F
1337
n.a
. 15
.2 n.a
. 3.4
n.a
. 4.8
n.a
.
Jo
rdan
Pop
ulatio
n an
d Fam
ily H
ealth
Su
rvey
[JPFH
S]
2002
(Ju
ly-Se
pt. 20
02)
(W
HO, G
lobal
datab
ase o
n chil
d gr
owth
and
malnu
trition
; DoS
an
d ORC
Mac
ro,
2003
)
seco
ndar
y or h
igher
0-
4.99
M/F
3069
n.a
. 9.7
n.a
. 2.3
n.a
. 3.1
n.a
. * C
atego
ry <-
2 Z-sc
ores
inclu
des <
-3 Z
-scor
es
**: pr
imar
y edu
catio
n inc
ludes
elem
entar
y (6 y
ears)
and p
repa
rator
y (4 y
ears)
Data
base
d on W
HO 20
06 gr
owth
stand
ards
. Data
come
from
the W
HO da
tabas
e, ex
cept
data
desa
greg
ated b
y moth
er's
educ
ation
whic
h are
base
d on f
inal re
port
and c
onve
rted w
ith th
e algo
rithm
deve
loped
by Y
ang
and d
e Onis
(Yan
g and
de O
nis, 2
008)
. n.a
.: not
avail
able
No
rth re
gion i
nclud
es th
e Gov
erno
rates
of Ir
bid, A
jloun
, Jar
ash,
Mafra
q. Ce
ntral
regio
n inc
ludes
Balq
a, Ma
daba
, Amm
an, Z
arqa
. Sou
th re
gion i
nclud
es K
arak
, Tafi
ela, M
a'an,
Aqab
a.
Bac
k to
com
men
ts
Food
and
nut
ritio
n pr
ofile
, Jor
dan
N
utrit
ion
and
Con
sum
er P
rote
ctio
n D
ivis
ion,
FA
O, 2
011
40
Nam
e of
the
surv
ey: J
orda
n P
opul
atio
n an
d Fa
mily
Hea
lth S
urve
y 19
97 (D
oS a
nd M
acro
Int.,
199
8)
Stud
y po
pula
tion:
Chi
ldre
n un
der 5
yea
rs o
f age
Pe
riod
of d
ata
colle
ctio
n: J
une
- Oct
ober
199
7 R
epre
sent
ativ
ity: N
atio
nal
Nor
ms
of re
fere
nce:
WH
O 2
006
grow
th s
tand
ards
Tabl
e A
.5: A
nthr
opom
etry
of p
resc
hool
chi
ldre
n (c
ont’d
) Pr
evale
nce o
f maln
utrit
ion
Perce
ntage
of ch
ildre
n with
St
untin
g W
astin
g Un
derw
eight
Over
weigh
t He
ight-f
or-a
ge
Weig
ht-for
-heig
ht W
eight-
for-a
ge
Weig
ht-for
-heig
ht
Name
/date
of su
rvey
(mon
th/ye
ar)
(Refe
renc
e)
Back
grou
nd
char
acter
istics
Ag
e (ye
ars)
Sex
Samp
le siz
e
< -3
Z-sc
ores
<
-2 Z
-scor
es*
< -3
Z-sc
ores
<
-2 Z
-scor
es*
< -3
Z-sc
ores
<
-2 Z
-scor
es*
> +2
Z-sc
ores
To
tal
0-4.9
9 M/
F 56
51
2.6
11.1
0.6
2.4
0.8
3.8
4.4
Sex
0-
4.99
M 28
66
3.2
11.9
0.4
2.3
0.8
3.9
4.9
0-
4.99
F 27
85
2.0
10.4
0.7
2.5
0.7
3.8
3.7
Age
0-
0.49
M/F
492
3.6
8.7
1.0
5.3
1.9
6.1
10.6
0.5
-0.99
M/
F 61
2 3.5
8.9
0.7
3.2
1.3
5.4
6.2
1-1.9
9 M/
F 11
64
3.3
13.4
0.3
2.2
0.7
2.3
4.6
2-
2.99
M/F
1146
2.7
11
.6 0.3
1.7
0.6
3.3
4.2
3-3.9
9 M/
F 11
78
1.8
11.7
0.6
1.6
0.2
3.9
2.5
4-
4.99
M/F
1060
1.5
10
.0 1.0
2.6
0.8
4.1
2.3
Re
siden
ce
urba
n 0-
4.99
M/F
4595
2.1
9.2
0.6
2.4
0.6
3.1
4.4
ru
ral
0-4.9
9 M/
F 10
56
4.7
19.5
0.6
2.6
1.7
7.0
4.3
Regi
on
North
0-
4.99
M/F
1685
2.4
10
.9 0.3
1.5
0.7
3.8
4.1
Ce
ntral
0-4.9
9 M/
F 35
97
2.5
10.5
0.7
2.8
0.7
3.6
4.4
South
0-
4.99
M/F
369
4.2
18.3
0.9
2.7
1.2
5.9
5.0
Moth
er's
educ
atio
n no
educ
ation
0-
4.99
M/F
334
n.a.
26.0
n.a.
3.6
n.a.
11.6
n.a.
prim
ary*
* 0-
4.99
M/F
674
n.a.
15.2
n.a.
2.8
n.a.
6.5
n.a.
Jo
rdan
Pop
ulatio
n an
d Fam
ily H
ealth
Su
rvey
[JPFH
S]
1997
(Ju
ne-O
ct. 19
97)
(W
HO, G
lobal
datab
ase o
n chil
d gr
owth
and
malnu
trition
; DoS
an
d Mac
ro In
t., 19
98)
seco
ndar
y or h
igher
0-
4.99
M/F
4485
n.a
. 9.3
n.a
. 2.4
n.a
. 3.6
n.a
. * C
atego
ry <-
2 Z-sc
ores
inclu
des <
-3 Z
-scor
es
**: pr
imar
y edu
catio
n inc
ludes
elem
entar
y (6 y
ears)
and p
repa
rator
y (4 y
ears)
Data
base
d on W
HO 20
06 gr
owth
stand
ards
. Data
come
from
WHO
Glob
al da
tabas
e, ex
cept
data
dese
greg
ated b
y moth
er's
educ
ation
, whic
h are
base
d on f
inal re
port
and c
onve
rted w
ith th
e algo
rithm
deve
loped
by
Yang
and d
e Onis
(Yan
g and
de O
nis, 2
008)
. n.a
.: not
avail
able
No
rth re
gion i
nclud
es th
e Gov
erno
rates
of Ir
bid, A
jloun
, Jar
ash,
Mafra
q. Ce
ntral
regio
n inc
ludes
Balq
a, Ma
daba
, Amm
an, Z
arqa
. Sou
th re
gion i
nclud
es K
arak
, Tafi
ela, M
a'an,
Aqab
a.
Bac
k to
com
men
ts
Food
and
nut
ritio
n pr
ofile
, Jor
dan
N
utrit
ion
and
Con
sum
er P
rote
ctio
n D
ivis
ion,
FA
O, 2
011
41
Nam
e of
the
surv
ey: J
orda
n P
opul
atio
n an
d Fa
mily
Hea
lth S
urve
y 19
90 (D
oS e
t al..
, 199
2)
Stud
y po
pula
tion:
Chi
ldre
n un
der 5
yea
rs o
f age
Pe
riod
of d
ata
colle
ctio
n: O
ctob
er -
Dec
embe
r 199
0 R
epre
sent
ativ
ity: N
atio
nal
Nor
ms
of re
fere
nce:
WH
O 2
006
grow
th s
tand
ards
Tabl
e A
.5: A
nthr
opom
etry
of p
resc
hool
chi
ldre
n (c
ont’d
) Pr
evale
nce o
f maln
utrit
ion
Perce
ntage
of ch
ildre
n with
St
untin
g W
astin
g Un
derw
eight
Over
weigh
t He
ight-f
or-a
ge
Weig
ht-for
-heig
ht W
eight-
for-a
ge
Weig
ht-for
-heig
ht
Name
/date
of su
rvey
(mon
th/ye
ar)
(Refe
renc
e)
Back
grou
nd
char
acter
istics
Ag
e (ye
ars)
Sex
Samp
le siz
e
< -3
Z-sc
ores
<
-2 Z
-scor
es*
< -3
Z-sc
ores
<
-2 Z
-scor
es*
< -3
Z-sc
ores
<
-2 Z
-scor
es*
> +2
Z-sc
ores
To
tal
0-4.9
9 M/
F 66
01
5.7
20.5
1.3
3.8
1.0
4.8
8.6
Sex
0-
4.99
M 33
07
6.6
22.0
1.7
4.6
1.2
5.2
9.7
0-
4.99
F 32
94
4.7
18.9
1.0
3.0
0.7
4.4
7.5
Age
0-
0.49
M/F
635
1.9
8.4
4.4
9.6
1.7
6.1
9.8
0.5
-0.99
M/
F 73
5 6.2
19
.3 1.8
5.1
2.1
6.0
13
.3
1-1.9
9 M/
F 13
93
7.6
25.9
0.8
2.4
1.0
3.3
11.2
2-
2.99
M/F
1356
6.9
23
.8 0.7
2.7
0.4
4.4
7.9
3-3.9
9 M/
F 13
54
5.7
21.5
0.8
3.6
0.8
5.3
6.4
4-
4.99
M/F
1129
3.6
16
.1 1.2
3.1
0.7
5.1
5.1
Re
siden
ce
Urba
n 0-
4.99
M/F
4632
4.3
16
.9 1.3
3.5
0.8
4.0
8.9
Ru
ral
0-4.9
9 M/
F 19
69
9.0
28.8
1.5
4.6
1.3
6.7
7.9
Gove
rnor
ate
Amma
n 0-
4.99
M/F
2305
5.1
17
.3 2.0
5.6
1.0
4.5
8.5
Ba
lqa
0-4.9
9 M/
F 42
1 10
.0 27
.6 1.7
5.8
1.0
6.2
10
.1 Irb
id 0-
4.99
M/F
1827
4.9
20
.7 0.9
2.2
1.0
4.2
8.6
Za
rqa a
nd M
afraq
0-
4.99
M/F
1397
5.1
21
.9 0.6
2.1
0.9
5.2
7.2
So
uth (K
arak
, Tafi
ela, M
aán)
0-
4.99
M/F
652
8.2
23.4
1.5
4.4
1.1
5.9
10.9
Moth
er's
educ
atio
n no
educ
ation
0-
4.99
M/F
1283
n.a
. 35
.0 n.a
. 4.5
n.a
. 9.4
n.a
. pr
imar
y 0-
4.99
M/F
1423
n.a
. 29
.2 n.a
. 3.4
n.a
. 5.5
n.a
.
Jo
rdan
Pop
ulatio
n an
d Fam
ily H
ealth
Su
rvey
[JPFH
S]
1990
(O
ct-De
c. 19
90)
(W
HO, G
lobal
datab
ase o
n chil
d gr
owth
and
malnu
trition
; DoS
et
al., 1
992)
seco
ndar
y or h
igher
0-
4.99
M/F
3894
n.a
. 19
.6 n.a
. 3.6
n.a
. 4.5
n.a
. * C
atego
ry <-
2 Z-sc
ores
inclu
des <
-3 Z
-scor
es
Data
base
d on W
HO 20
06 gr
owth
stand
ards
. Data
come
from
WHO
Glob
al da
tabas
e, ex
cept
data
desa
greg
ated b
y moth
er's
educ
ation
, whic
h are
base
d on f
inal re
port
and c
onve
rted w
ith th
e algo
rithm
deve
loped
by Y
ang a
nd de
On
is (Y
ang a
nd de
Onis
, 200
8).
n.a.: n
ot av
ailab
le
Bac
k to
com
men
ts
Food and nutrition profile, Jordan Nutrition and Consumer Protection Division, FAO, 2011
42
Name of the survey: National survey to assess Iodine Deficiency Disorders (IDD) among school children in Jordan (MoH, 2010, in collaboration with WHO) Study population: Children 8-10 years Period of data collection: 2010 Representativity: National
Table A.6: Prevalence of goitre and level of urinary iodine in school-age children Prevalence of goitre Level of urinary iodine Survey
name/date (Reference)
Background characteristics
Age (years) Sex Sample
size Percentage with
goitre [Total Goitre]
Sample size
Median (µg/L)
Percentage with urinary iodine
<100µg/L Total 8-10.99 M/F 4598 4.9 4598 203 n.a Sex 8-10.99 M 1931 5.4 1931 n.a n.a 8-10.99 F 2667 4.5 2667 n.a n.a Region North 8-10.99 M/F 1500 4.3 1500 204 n.a Central 8-10.99 M/F 2351 5.6 2351 212 n.a South 8-10.99 M/F 747 3.9 747 177 n.a Governorates Amman 8-10.99 M/F 1547 6.7 1547 215 n.a Balqa 8-10.99 M/F 204 6.4 204 199 n.a Zarka 8-10.99 M/F 433 2.8 433 201 n.a Madaba 8-10.99 M/F 167 2.4 167 225 n.a Irbid 8-10.99 M/F 579 3.6 579 195 n.a Mafraq 8-10.99 M/F 470 4.0 470 225 n.a Jarash 8-10.99 M/F 285 6.7 285 189 n.a Ajloun 8-10.99 M/F 166 3.0 166 187 n.a Karak 8-10.99 M/F 293 3.1 293 185 n.a Tafiela 8-10.99 M/F (62) (2) (62) (167) n.a Maán 8-10.99 M/F 194 5.2 194 165 n.a
National survey to
asses iodine deficiency among school children in
Jordan 2010
(MoH and WHO,
2010a)
Aqaba 8-10.99 M/F 198 4.5 198 184 n.a n.a.: not available Central region includes: Amman, Balqa, Zarka and Madaba. North includes: Irbid, Mafraq, Jarash and Ajlune. South includes: Karak, Tafileh,Ma'an and Aqaba Data into brackets are based on small sample size and therefore must be interpreted with caution.
Back to comments
Food and nutrition profile, Jordan Nutrition and Consumer Protection Division, FAO, 2011
43
Name of the survey: Assessment of iodine deficiency status among Jordanian children after introduction of iodized salt (MoH et al., 2000) Study population: Children 8-10 years Period of data collection: 2000 Representativity: National
Table A.6: Prevalence of goitre and level of urinary iodine in school-age children (cont’d) Prevalence of goitre Level of urinary iodine Survey
name/date (Reference)
Background characteristics
Age (years) Sex Sample
size Percentage with
goitre [Total Goitre]
Sample size
Median (µg/L)
Percentage with urinary iodine
<100µg/L Total 8-10.99 M/F 2601 33.5 2601 154 24.5 Sex 8-10.99 M 1455 36.6 n.a n.a n.a 8-10.99 F 1146 29.7 n.a n.a n.a Region North 8-10.99 M/F 741 47.0 741 120 32.5 Central 8-10.99 M/F 1550 26.3 1550 164 21.8 South 8-10.99 M/F 310 38.1 310 188 18.2 Governorates Amman 8-10.99 M/F 832 28.4 832 167 20.6 Balqa 8-10.99 M/F 193 38.3 193 135 38.0 Zarqa 8-10.99 M/F 448 17.9 448 170 18.3 Madaba 8-10.99 M/F (77) (22) (77) 141 (14) Irbid 8-10.99 M/F 450 51.1 450 150 26.1 Mafraq 8-10.99 M/F 133 36.1 133 110 44.0 Jarash 8-10.99 M/F (86) (14) (86) (91) (60) Ajloun 8-10.99 M/F (72) (79) (72) (120) (18) Karak 8-10.99 M/F 118 48.3 118 181 20.8 Tafiela 8-10.99 M/F (59) (42) (59) (169) (12) Maán 8-10.99 M/F (68) (34) (68) (219) (14)
Assessment of
iodine deficiency status among
Jordanian children after introduction of
iodized salt 2000
(MoH et al., 2000; WHO, Database
on iodine deficiency, 2011)
Aqaba 8-10.99 M/F (65) (20) (65) (263) (24) n.a: not available Data into brackets are based on small sample size and therefore must be interpreted with caution. Central region includes: Amman, Balqa, Zarka and Madaba. North includes: Irbid, Mafraq, Jarash and Ajlune. South includes: Karak, Tafileh, Ma'an and Aqaba.
Food and nutrition profile, Jordan Nutrition and Consumer Protection Division, FAO, 2011
44
Name of the survey: Study of iodine deficiency in Jordan 1993 (MoH, WHO, UNICEF, 1993) Study population: Children 8-10 years Period of data collection: 1993 Representativity: National, but includes only 8 Governorates on 12
Table A.6: Prevalence of goitre and level of urinary iodine in school-age children (cont’d) Prevalence of goitre Level of urinary iodine Survey
name/date (Reference)
Background characteristics
Age (years) Sex Sample
size Percentage with
goitre [Total Goitre]
Sample size
Median (µg/L)
Percentage with urinary iodine
<100µg/L Total 8-10.99 M/F 2457 37.7 272 40.0 n.a. Sex 8-10.99 M 1286 36.3 148 42.8 n.a. 8-10.99 F 1171 39.2 112 38.0 n.a. Residence urban 8-10.99 M/F 1571 33.6 162 45.4 n.a. rural 8-10.99 M/F 886 44.9 [98] 30.2 n.a. Region North 8-10.99 M/F 727 48.6 [81] 25.6 n.a. Central 8-10.99 M/F 1479 30.6 152 48.7 n.a. South 8-10.99 M/F 252 48.0 _ _ n.a. Governorates Amman 8-10.99 M/F 923 33.7 101 48.4 n.a. Balqa 8-10.99 M/F 157 43.9 _ _ n.a. Zarqa 8-10.99 M/F 398 18.1 _ _ n.a. Irbid 8-10.99 M/F 626 54.6 (74) (21.6) n.a. Mafraq 8-10.99 M/F 101 10.9 _ _ n.a. Karak 8-10.99 M/F 113 22.1 _ _ n.a. Tafiela 8-10.99 M/F _ _ _ _ n.a.
Study of iodine deficiency in
Jordan 1993
(MoH et al., 1993; WHO, Database
on iodine deficiency, 2011)
Maán 8-10.99 M/F (93) 65.6 _ _ n.a. n.a: not available Data into brackets are based on small sample size (between 50 and 100) and therefore must be interpreted with caution. If sample size is <50, data are not shown. This survey includes only 8 governorates. Middle region includes Amman, Balqa and Zarka, North includes: Irbid and Mafraq, South includes Karak, Tafiela and Ma'an. Madaba (Middle region), Jarash and Ajlune (North region), and Aqaba (South region) were not included in this survey.
Back to comments Name of the survey: National survey to assess Iodine Deficiency Disorders (IDD) among school children in Jordan (MoH and WHO, 2010a) Study population: Households Period of data collection: 2010 Representativity: National
Table A.7: Iodization of salt at household level Iodine level of household salt Survey name/date
(Reference) Background
characteristics Number of households
where salt was available for testing
Inadequate (<15 ppm)
Adequate ( ≥15 ppm)
Percentage of households
tested Total 4598 3.7 96.3 100 Governorates Amman 1547 4.1 95.9 100 Balqa 204 0.0 100.0 100 Zarqa 433 1.2 98.8 100 Madaba 167 1.8 98.2 100 Irbid 579 3.8 96.2 100 Mafraq 470 12.8 87.2 100 Jarash 285 1.4 98.6 100 Ajloun 166 1.2 98.8 100 Karak 293 2.0 98.0 100 Tafileh (62) (0) (100) (100) Maán 194 3.1 96.9 100
National survey to
asses iodine deficiency among school children
in Jordan 2010
(MoH and WHO,
2010a)
Aqaba 198 0.0 100.0 100 Note: ppm = parts per million. Data into brackets are based on small sample size (between 50 and 100) and therefore must be interpreted with caution. Central region includes: Amman, Balqa, Zarka and Madaba. North includes: Irbid, Mafraq, Jarash and Ajlune. South includes: Karak, Tafileh,Ma'an and Aqaba
Back to comments
Food and nutrition profile, Jordan Nutrition and Consumer Protection Division, FAO, 2011
45
Name of the survey: Micronutrient Survey 2010 (MoH et al. 2011) Study population: Children 1-4.99 years Period of data collection: March - April 2010 Representativity: National
Table A.8: Prevalence of sub-clinical vitamin A deficiency in children from 1 to 5 years Prevalence of low level of serum retinol Survey name/date
(Reference) Background
characteristics Age
(years) Sex Sample size Percentage with serum retinol <20 µg/dL or 0.70 µmol/L
Total 1-4.99 M/F 915 18.3 Sex 1-4.99 M 472 20.8 1-4.99 F 443 15.6 Age 1-1.99 M/F 219 19.7 2-2.99 M/F 212 17.7 3-3.99 M/F 221 16.5 4-4.99 M/F 263 19.0 Residence urban 1-4.99 M/F 721 19.3 rural 1-4.99 M/F 194 14.3 Region North 1-4.99 M/F 311 20.8 Central 1-4.99 M/F 515 16.7
Micronutrient Survey
2010 (Mar. - Apr. 2010)
(MoH et al., 2011)
South 1-4.99 M/F (89) (18) Data into brackets are based on small sample size and therefore must be interpreted with caution. Central region includes: Amman, Balqa, Zarka and Madaba. North includes: Irbid, Mafraq, Jarash and Ajlune. South includes: Karak, Tafileh, Ma'an and Aqaba
Back to comments Name of the survey: National baseline survey on iron deficiency anemia and vitamin A deficiency (MoH et al., 2002) Study population: Children 1-4.99 years Period of data collection: 2002 Representativity: National
Table A.8: Prevalence of sub-clinical vitamin A deficiency in children from 1 to 5 years (cont’d) Prevalence of low level of serum retinol Survey name/date
(Reference) Background
characteristics Age
(years) Sex Sample size Percentage with serum retinol <20 µg/dL or 0.70 µmol/L
Total 1-4.99 M/F 1036 15.1 Sex 1-4.99 M 514 16.0 1-4.99 F 513 14.4 Residence urban 1-4.99 M/F 670 14.6 rural 1-4.99 M/F 358 17.0 Region North 1-4.99 M/F 310 18.3 Central 1-4.99 M/F 446 12.4 South 1-4.99 M/F 272 21.8 Governorates Amman 1-4.99 M/F 159 9.2 Balqa 1-4.99 M/F 104 25.3 Zarqa 1-4.99 M/F 139 12.7 Madaba 1-4.99 M/F - - Irbid 1-4.99 M/F 141 14.6 Mafraq 1-4.99 M/F (57) (22) Jarash 1-4.99 M/F (70) (34) Ajloun 1-4.99 M/F - - Karak 1-4.99 M/F (79) (23) Tafiela 1-4.99 M/F (57) (9) Maán 1-4.99 M/F (79) (16)
National baseline survey
on iron deficiency anemia and vitamin A
deficiency 2002
(MoH et al., 2002; WHO, Database on vitamin A
deficiency, 2011)
Aqaba 1-4.99 M/F (57) (32) Data into brackets are based on small sample size (between 50 and 100) and therefore must be interpreted with caution. If sample size is <50, data are not shown (-). Central region includes: Amman, Balqa, Zarka and Madaba. North includes: Irbid, Mafraq, Jarash and Ajlune. South includes: Karak, Tafileh,Ma'an and Aqaba
Food and nutrition profile, Jordan Nutrition and Consumer Protection Division, FAO, 2011
46
Name of the survey: Jordan Population and Family Health Survey 2007 (DoS and Macro Int. Inc, 2008) Study population: Youngest children 6-35 months Period of data collection: June-November 2007 Representativity: National
Table A.9: Percentage of children who consumed foods rich in vitamin A and foods rich in bioavailable iron in the 24 hours preceding the survey
Percentage of children who consumed Survey name/date (Reference)
Background characteristics
Age (months)
Sample size Foods rich in vitamin A1 Foods rich in bioavailable iron2
Total 6-35 3775 83.5 72.1 Sex M 6-35 1898 82.6 72.3 F 6-35 1876 84.4 71.8 Residence urban 6-35 3165 84.5 73.2 rural 6-35 610 78.4 66.3 Breastfeeding status Breastfed 6-35 1180 69.2 54.5 Non-breastfed 6-35 2594 90.0 80.0 Region North 6-35 1107 82.1 70.2 Central 6-35 2332 84.8 73.7 South 6-35 335 79.5 66.4 Governorates Amman 6-35 1459 85.3 73.4 Balqa 6-35 222 82.8 69.7 Zarqa 6-35 560 85.1 77.5 Madaba 6-35 (90) (79) (66) Irbid 6-35 738 83.0 71.0 Mafraq 6-35 172 76.7 61.4 Jarash 6-35 114 81.8 72.0 Ajloun 6-35 (84) (86) (79) Karak 6-35 128 85.6 67.6 Tafiela 6-35 (53) (79) (69) Maán 6-35 (67) (77) (67)
Jordan Population and Family Health
Survey [JPFHS]
2007 (June-Nov. 2007)
(DoS and Macro
Int. Inc, 2008)
Aqaba 6-35 (88) (73) (63) 1 List of food products taken into account: meat, fish, poultry, eggs, carrots, red sweet potatoes, pumpkin, apricot, palm nuts, yellow melon, and green leafy vegetables. 2 List of food products taken into account: meat, fish, poultry, and eggs. Data into brackets are based on small sample size and therefore must be interpreted with caution. North region includes the Governorates of Irbid, Ajloun, Jarash, Mafraq. Central region includes Balqa, Madaba, Amman, Zarqa. South region includes Karak, Tafiela, Ma'an, Aqaba.
Back to comments
Food and nutrition profile, Jordan Nutrition and Consumer Protection Division, FAO, 2011
47
Name of the survey: Jordan Population and Family Health Survey 2007 (DoS and Macro Int. Inc, 2008) Study population: Children 6-59 months of age Period of data collection: June-November 2007 Representativity: National
Table A.10: Vitamin A supplementation of children Children Survey name/date
(Reference) Background
characteristics Age (months) Sex Number of
children Percent of children who received vit. A supplements in
the 6 months preceding the survey Total 6-59 M/F 8607 8.5 Sex 6-59 M 4357 9.1 6-59 F 4250 7.9 Residence urban 6-59 M/F 7223 8.7 rural 6-59 M/F 1384 7.6 Region North 6-59 M/F 2502 5.3 Central 6-59 M/F 5348 10.1 South 6-59 M/F 758 8.3 Governorates Amman 6-59 M/F 3277 9.6 Balqa 6-59 M/F 536 6.2 Zarqa 6-59 M/F 1325 13.0 Madaba 6-59 M/F 209 10.1 Irbid 6-59 M/F 1629 5.6 Mafraq 6-59 M/F 416 4.8 Jarash 6-59 M/F 254 5.8 Ajloun 6-59 M/F 204 3.3 Karak 6-59 M/F 296 8.8 Tafiela 6-59 M/F 122 9.2 Maán 6-59 M/F 146 9.6
Jordan Population and Family Health Survey
[JPFHS] 2007
(June-Nov. 2007)
(DoS and Macro Int. Inc, 2008)
Aqaba 6-59 M/F 195 5.9 Back to comments
Name of the survey: Micronutrient Survey 2010 (MoH et al., 2011) Study population: Children 12-59 months of age Period of data collection: March-April 2010 Representativity: National Methodology: automated CBC blood counter / venous blood used
Table A.11: Prevalence of anemia in preschool children Percentage of children with
Survey name/date (Reference)
Background characteristics
Age (months) Sex Sample
size Any anemia
(Hb<11.0 g/dL)
Sample size
Iron deficiency
(serum ferritin <12.0 µg/L)
Sample size
Iron deficiency anemia (Hb<11.0 g/dL and
serum ferritin <12.0 µg/L)
Total 12-59 M/F 902 17.0 940 13.7 898 4.8 Sex 12-59 M 468 19.3 485 14.7 465 6.2 12-59 F 434 14.6 455 12.6 433 3.4 Age 12-23 M/F 214 27.6 226 19.1 213 8.9 24-35 M/F 214 21.8 220 16.7 213 6.7 36-47 M/F 212 12.1 227 9.6 211 1.5 48-59 M/F 262 8.6 267 10.0 261 2.7 Residence urban 12-59 M/F 715 15.6 739 14.3 712 4.3 rural 12-59 M/F 187 23.1 201 11.1 186 6.8 Regions North 12-59 M/F 310 18.1 323 13.7 310 6.7 Central 12-59 M/F 508 16.0 528 14.7 504 3.6
Micronutrient
survey 2010
(Mar.-Apr. 2010)
(MoH et al.,
2011)
South 12-59 M/F (84) (19) (89) (6) (84) (5) North region includes the Governorates of Irbid, Ajloun, Jarash, Mafraq. Central region includes Balqa, Madaba, Amman, Zarqa. South region includes Karak, Tafiela, Ma'an, Aqaba. Data into brackets are based on small sample size and therefore must be interpreted with caution.
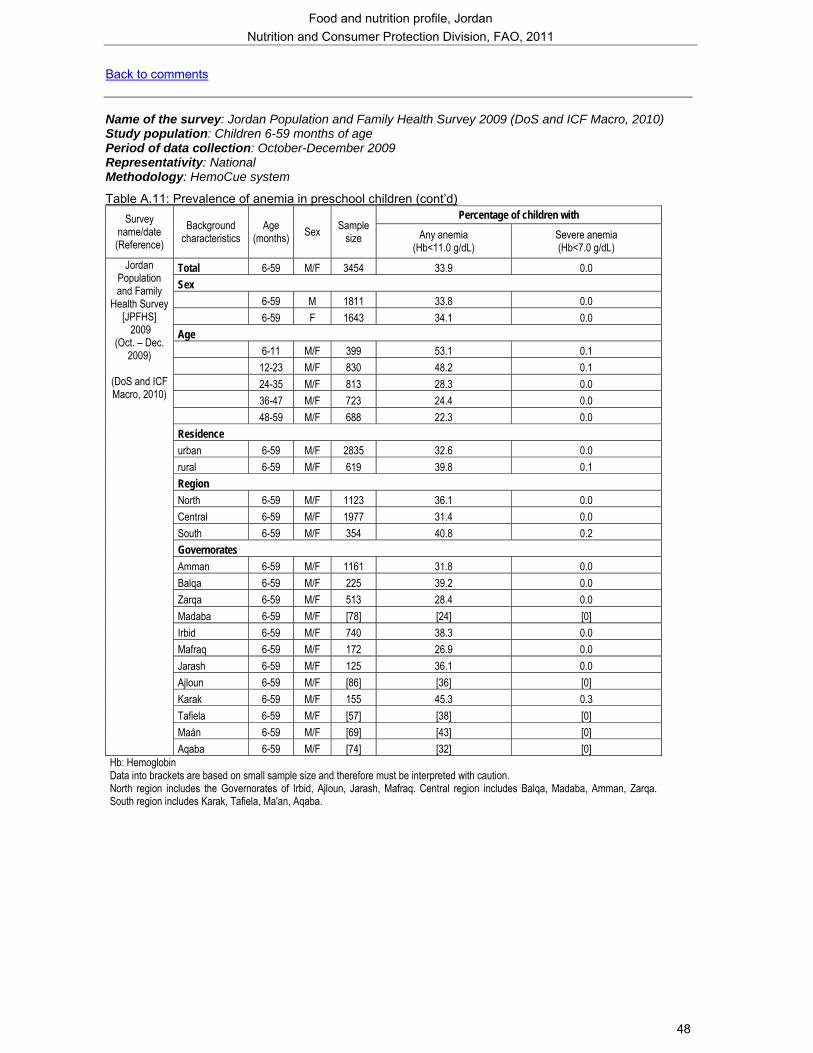
Food and nutrition profile, Jordan Nutrition and Consumer Protection Division, FAO, 2011
48
Back to comments Name of the survey: Jordan Population and Family Health Survey 2009 (DoS and ICF Macro, 2010) Study population: Children 6-59 months of age Period of data collection: October-December 2009 Representativity: National Methodology: HemoCue system
Table A.11: Prevalence of anemia in preschool children (cont’d) Percentage of children with Survey
name/date (Reference)
Background characteristics
Age (months) Sex Sample
size Any anemia (Hb<11.0 g/dL)
Severe anemia (Hb<7.0 g/dL)
Total 6-59 M/F 3454 33.9 0.0 Sex 6-59 M 1811 33.8 0.0 6-59 F 1643 34.1 0.0 Age 6-11 M/F 399 53.1 0.1 12-23 M/F 830 48.2 0.1 24-35 M/F 813 28.3 0.0 36-47 M/F 723 24.4 0.0 48-59 M/F 688 22.3 0.0 Residence urban 6-59 M/F 2835 32.6 0.0 rural 6-59 M/F 619 39.8 0.1 Region North 6-59 M/F 1123 36.1 0.0 Central 6-59 M/F 1977 31.4 0.0 South 6-59 M/F 354 40.8 0.2 Governorates Amman 6-59 M/F 1161 31.8 0.0 Balqa 6-59 M/F 225 39.2 0.0 Zarqa 6-59 M/F 513 28.4 0.0 Madaba 6-59 M/F [78] [24] [0] Irbid 6-59 M/F 740 38.3 0.0 Mafraq 6-59 M/F 172 26.9 0.0 Jarash 6-59 M/F 125 36.1 0.0 Ajloun 6-59 M/F [86] [36] [0] Karak 6-59 M/F 155 45.3 0.3 Tafiela 6-59 M/F [57] [38] [0] Maán 6-59 M/F [69] [43] [0]
Jordan Population and Family
Health Survey [JPFHS]
2009 (Oct. – Dec.
2009)
(DoS and ICF Macro, 2010)
Aqaba 6-59 M/F [74] [32] [0] Hb: Hemoglobin Data into brackets are based on small sample size and therefore must be interpreted with caution. North region includes the Governorates of Irbid, Ajloun, Jarash, Mafraq. Central region includes Balqa, Madaba, Amman, Zarqa. South region includes Karak, Tafiela, Ma'an, Aqaba.
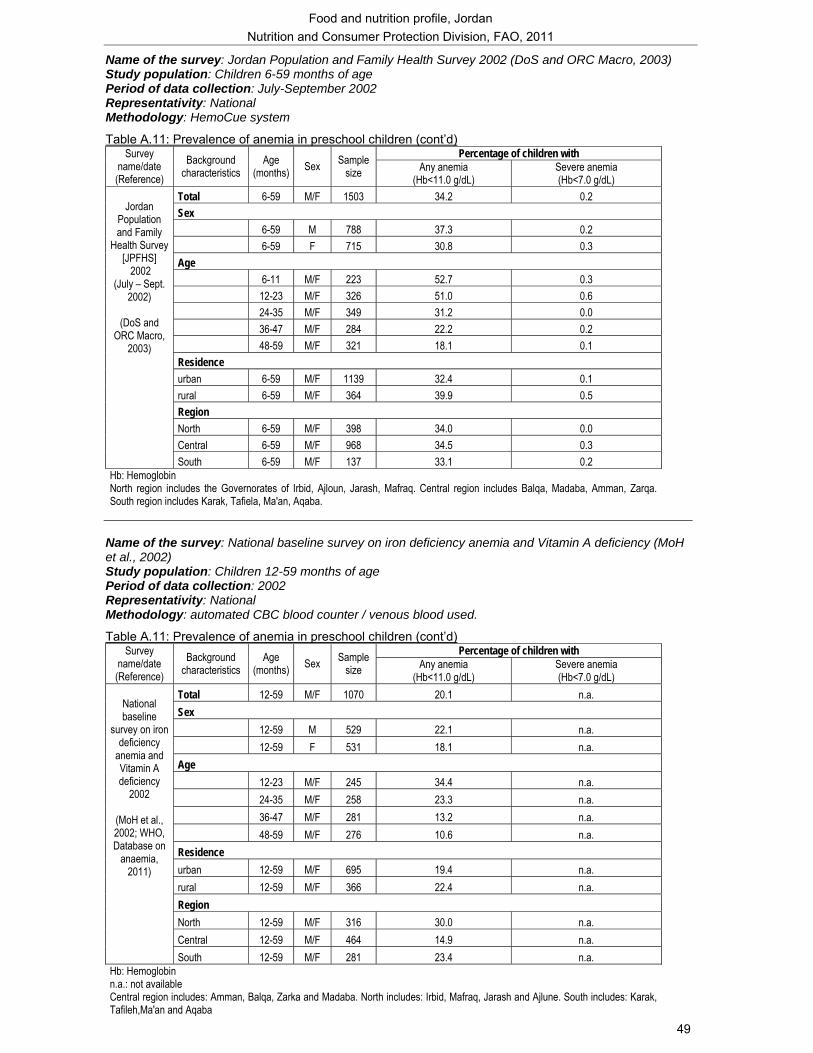
Food and nutrition profile, Jordan Nutrition and Consumer Protection Division, FAO, 2011
49
Name of the survey: Jordan Population and Family Health Survey 2002 (DoS and ORC Macro, 2003) Study population: Children 6-59 months of age Period of data collection: July-September 2002 Representativity: National Methodology: HemoCue system
Table A.11: Prevalence of anemia in preschool children (cont’d) Percentage of children with Survey
name/date (Reference)
Background characteristics
Age (months) Sex Sample
size Any anemia (Hb<11.0 g/dL)
Severe anemia (Hb<7.0 g/dL)
Total 6-59 M/F 1503 34.2 0.2 Sex 6-59 M 788 37.3 0.2 6-59 F 715 30.8 0.3 Age 6-11 M/F 223 52.7 0.3 12-23 M/F 326 51.0 0.6 24-35 M/F 349 31.2 0.0 36-47 M/F 284 22.2 0.2 48-59 M/F 321 18.1 0.1 Residence urban 6-59 M/F 1139 32.4 0.1 rural 6-59 M/F 364 39.9 0.5 Region North 6-59 M/F 398 34.0 0.0 Central 6-59 M/F 968 34.5 0.3
Jordan
Population and Family
Health Survey [JPFHS]
2002 (July – Sept.
2002)
(DoS and ORC Macro,
2003)
South 6-59 M/F 137 33.1 0.2 Hb: Hemoglobin North region includes the Governorates of Irbid, Ajloun, Jarash, Mafraq. Central region includes Balqa, Madaba, Amman, Zarqa. South region includes Karak, Tafiela, Ma'an, Aqaba.
Name of the survey: National baseline survey on iron deficiency anemia and Vitamin A deficiency (MoH et al., 2002) Study population: Children 12-59 months of age Period of data collection: 2002 Representativity: National Methodology: automated CBC blood counter / venous blood used.
Table A.11: Prevalence of anemia in preschool children (cont’d) Percentage of children with Survey
name/date (Reference)
Background characteristics
Age (months) Sex Sample
size Any anemia (Hb<11.0 g/dL)
Severe anemia (Hb<7.0 g/dL)
Total 12-59 M/F 1070 20.1 n.a. Sex 12-59 M 529 22.1 n.a. 12-59 F 531 18.1 n.a. Age 12-23 M/F 245 34.4 n.a. 24-35 M/F 258 23.3 n.a. 36-47 M/F 281 13.2 n.a. 48-59 M/F 276 10.6 n.a. Residence urban 12-59 M/F 695 19.4 n.a. rural 12-59 M/F 366 22.4 n.a. Region North 12-59 M/F 316 30.0 n.a. Central 12-59 M/F 464 14.9 n.a.
National baseline
survey on iron deficiency
anemia and Vitamin A deficiency
2002
(MoH et al., 2002; WHO, Database on
anaemia, 2011)
South 12-59 M/F 281 23.4 n.a. Hb: Hemoglobin n.a.: not available Central region includes: Amman, Balqa, Zarka and Madaba. North includes: Irbid, Mafraq, Jarash and Ajlune. South includes: Karak, Tafileh,Ma'an and Aqaba
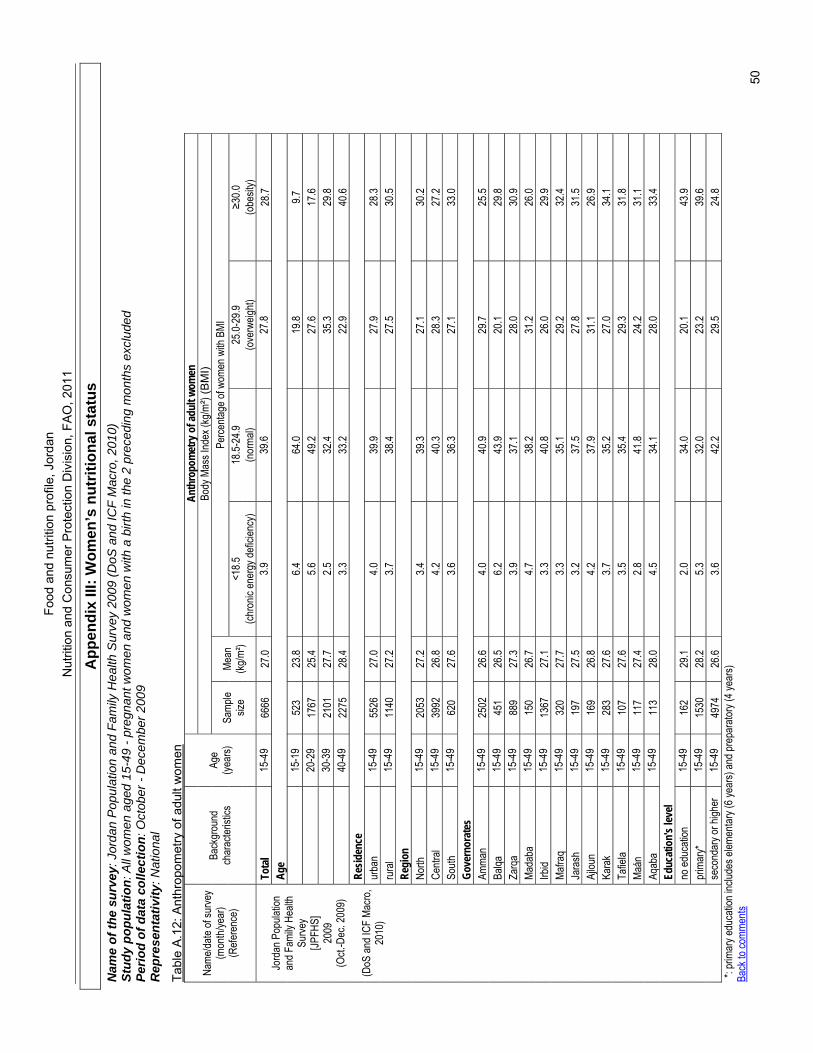
Food
and
nut
ritio
n pr
ofile
, Jor
dan
N
utrit
ion
and
Con
sum
er P
rote
ctio
n D
ivis
ion,
FAO
, 201
1
50
App
endi
x III
: Wom
en’s
nut
ritio
nal s
tatu
s N
ame
of th
e su
rvey
: Jor
dan
Pop
ulat
ion
and
Fam
ily H
ealth
Sur
vey
2009
(DoS
and
ICF
Mac
ro, 2
010)
St
udy
popu
latio
n: A
ll w
omen
age
d 15
-49
- pre
gnan
t wom
en a
nd w
omen
with
a b
irth
in th
e 2
prec
edin
g m
onth
s ex
clud
ed
Perio
d of
dat
a co
llect
ion:
Oct
ober
- D
ecem
ber 2
009
Rep
rese
ntat
ivity
: Nat
iona
l
Tabl
e A
.12:
Ant
hrop
omet
ry o
f adu
lt w
omen
An
thro
pom
etry
of a
dult
wom
en
Body
Mas
s Ind
ex (k
g/m²)
(BM
I) Pe
rcenta
ge of
wom
en w
ith B
MI
<18.5
18
.5-24
.9 25
.0-29
.9 ≥3
0.0
Name
/date
of su
rvey
(mon
th/ye
ar)
(Refe
renc
e)
Back
grou
nd
char
acter
istics
Ag
e (ye
ars)
Samp
le siz
e Me
an
(kg/m
²) (ch
ronic
ener
gy de
ficien
cy)
(nor
mal)
(ove
rweig
ht)
(obe
sity)
Tota
l 15
-49
6666
27
.0 3.9
39
.6 27
.8 28
.7 Ag
e
15
-19
523
23.8
6.4
64.0
19.8
9.7
20
-29
1767
25
.4 5.6
49
.2 27
.6 17
.6
30-3
9 21
01
27.7
2.5
32.4
35.3
29.8
40
-49
2275
28
.4 3.3
33
.2 22
.9 40
.6 Re
siden
ce
ur
ban
15-4
9 55
26
27.0
4.0
39.9
27.9
28.3
rura
l 15
-49
1140
27
.2 3.7
38
.4 27
.5 30
.5 Re
gion
North
15
-49
2053
27
.2 3.4
39
.3 27
.1 30
.2 Ce
ntral
15-4
9 39
92
26.8
4.2
40.3
28.3
27.2
South
15
-49
620
27.6
3.6
36.3
27.1
33.0
Gove
rnor
ates
Am
man
15-4
9 25
02
26.6
4.0
40.9
29.7
25.5
Balqa
15
-49
451
26.5
6.2
43.9
20.1
29.8
Zarq
a 15
-49
889
27.3
3.9
37.1
28.0
30.9
Mada
ba
15-4
9 15
0 26
.7 4.7
38
.2 31
.2 26
.0 Irb
id 15
-49
1367
27
.1 3.3
40
.8 26
.0 29
.9 Ma
fraq
15-4
9 32
0 27
.7 3.3
35
.1 29
.2 32
.4 Ja
rash
15
-49
197
27.5
3.2
37.5
27.8
31.5
Ajlou
n 15
-49
169
26.8
4.2
37.9
31.1
26.9
Kara
k 15
-49
283
27.6
3.7
35.2
27.0
34.1
Tafie
la 15
-49
107
27.6
3.5
35.4
29.3
31.8
Maán
15
-49
117
27.4
2.8
41.8
24.2
31.1
Aqab
a 15
-49
113
28.0
4.5
34.1
28.0
33.4
Educ
atio
n's le
vel
no
educ
ation
15
-49
162
29.1
2.0
34.0
20.1
43.9
prim
ary*
15
-49
1530
28
.2 5.3
32
.0 23
.2 39
.6
Jo
rdan
Pop
ulatio
n an
d Fam
ily H
ealth
Su
rvey
[JPFH
S]
2009
(O
ct.-D
ec. 2
009)
(DoS
and I
CF M
acro
, 20
10)
seco
ndar
y or h
igher
15
-49
4974
26
.6 3.6
42
.2 29
.5 24
.8 *:
prim
ary e
duca
tion i
nclud
es el
emen
tary (
6 yea
rs) an
d pre
para
tory (
4 yea
rs)
Back
to co
mmen
ts
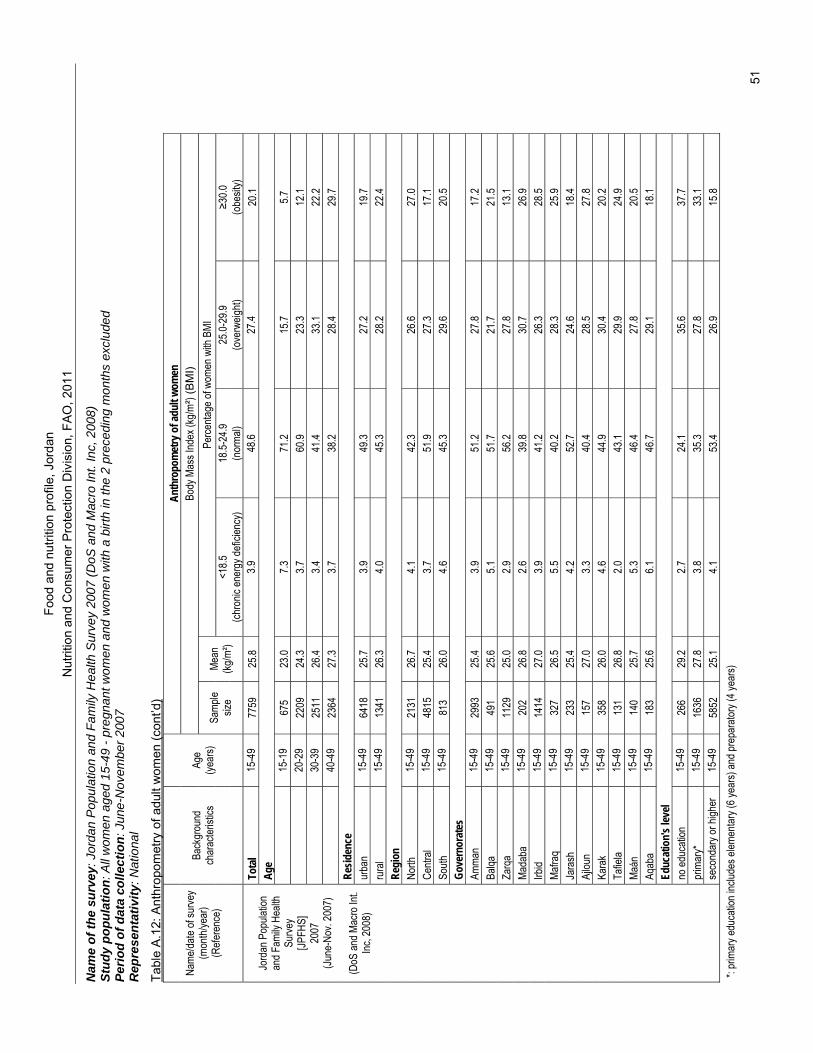
Food
and
nut
ritio
n pr
ofile
, Jor
dan
N
utrit
ion
and
Con
sum
er P
rote
ctio
n D
ivis
ion,
FAO
, 201
1
51
Nam
e of
the
surv
ey: J
orda
n P
opul
atio
n an
d Fa
mily
Hea
lth S
urve
y 20
07 (D
oS a
nd M
acro
Int.
Inc,
200
8)
Stud
y po
pula
tion:
All
wom
en a
ged
15-4
9 - p
regn
ant w
omen
and
wom
en w
ith a
birt
h in
the
2 pr
eced
ing
mon
ths
excl
uded
Pe
riod
of d
ata
colle
ctio
n: J
une-
Nov
embe
r 200
7 R
epre
sent
ativ
ity: N
atio
nal
Tabl
e A
.12:
Ant
hrop
omet
ry o
f adu
lt w
omen
(con
t’d)
Anth
ropo
met
ry o
f adu
lt wo
men
Bo
dy M
ass I
ndex
(kg/m
²) (B
MI)
Perce
ntage
of w
omen
with
BMI
<1
8.5
18.5-
24.9
25.0-
29.9
≥30.0
Name
/date
of su
rvey
(mon
th/ye
ar)
(Refe
renc
e)
Back
grou
nd
char
acter
istics
Ag
e (ye
ars)
Samp
le siz
e Me
an
(kg/m
²) (ch
ronic
ener
gy de
ficien
cy)
(nor
mal)
(ove
rweig
ht)
(obe
sity)
Tota
l 15
-49
7759
25
.8 3.9
48
.6 27
.4 20
.1 Ag
e
15
-19
675
23.0
7.3
71.2
15.7
5.7
20
-29
2209
24
.3 3.7
60
.9 23
.3 12
.1
30-3
9 25
11
26.4
3.4
41.4
33.1
22.2
40
-49
2364
27
.3 3.7
38
.2 28
.4 29
.7 Re
siden
ce
ur
ban
15-4
9 64
18
25.7
3.9
49.3
27.2
19.7
rura
l 15
-49
1341
26
.3 4.0
45
.3 28
.2 22
.4 Re
gion
North
15
-49
2131
26
.7 4.1
42
.3 26
.6 27
.0 Ce
ntral
15-4
9 48
15
25.4
3.7
51.9
27.3
17.1
South
15
-49
813
26.0
4.6
45.3
29.6
20.5
Gove
rnor
ates
Am
man
15-4
9 29
93
25.4
3.9
51.2
27.8
17.2
Balqa
15
-49
491
25.6
5.1
51.7
21.7
21.5
Zarq
a 15
-49
1129
25
.0 2.9
56
.2 27
.8 13
.1 Ma
daba
15
-49
202
26.8
2.6
39.8
30.7
26.9
Irbid
15-4
9 14
14
27.0
3.9
41.2
26.3
28.5
Mafra
q 15
-49
327
26.5
5.5
40.2
28.3
25.9
Jara
sh
15-4
9 23
3 25
.4 4.2
52
.7 24
.6 18
.4 Aj
loun
15-4
9 15
7 27
.0 3.3
40
.4 28
.5 27
.8 Ka
rak
15-4
9 35
8 26
.0 4.6
44
.9 30
.4 20
.2 Ta
fiela
15-4
9 13
1 26
.8 2.0
43
.1 29
.9 24
.9 Ma
án
15-4
9 14
0 25
.7 5.3
46
.4 27
.8 20
.5 Aq
aba
15-4
9 18
3 25
.6 6.1
46
.7 29
.1 18
.1 Ed
ucat
ion's
leve
l
no ed
ucati
on
15-4
9 26
6 29
.2 2.7
24
.1 35
.6 37
.7 pr
imar
y*
15-4
9 16
36
27.8
3.8
35.3
27.8
33.1
Jo
rdan
Pop
ulatio
n an
d Fam
ily H
ealth
Su
rvey
[JPFH
S]
2007
(Ju
ne-N
ov. 2
007)
(DoS
and M
acro
Int.
Inc, 2
008)
seco
ndar
y or h
igher
15
-49
5852
25
.1 4.1
53
.4 26
.9 15
.8 *:
prim
ary e
duca
tion i
nclud
es el
emen
tary (
6 yea
rs) an
d pre
para
tory (
4 yea
rs)
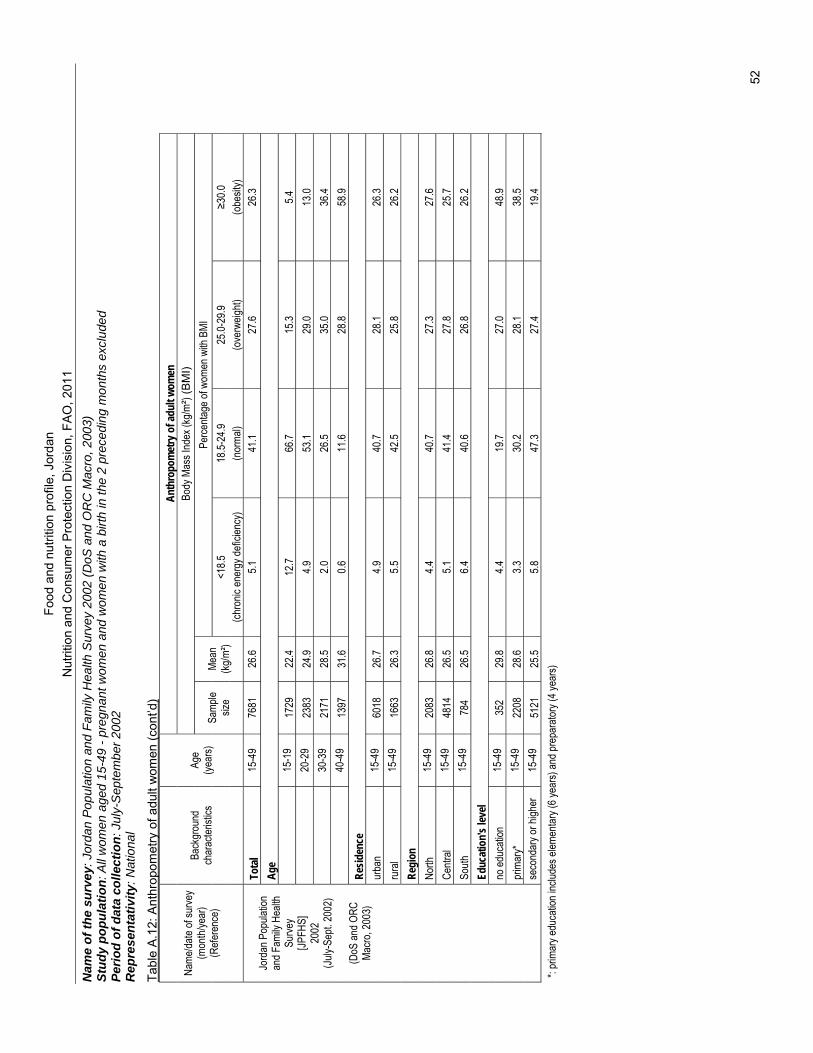
Food
and
nut
ritio
n pr
ofile
, Jor
dan
N
utrit
ion
and
Con
sum
er P
rote
ctio
n D
ivis
ion,
FAO
, 201
1
52
Nam
e of
the
surv
ey: J
orda
n P
opul
atio
n an
d Fa
mily
Hea
lth S
urve
y 20
02 (D
oS a
nd O
RC
Mac
ro, 2
003)
St
udy
popu
latio
n: A
ll w
omen
age
d 15
-49
- pre
gnan
t wom
en a
nd w
omen
with
a b
irth
in th
e 2
prec
edin
g m
onth
s ex
clud
ed
Perio
d of
dat
a co
llect
ion:
Jul
y-S
epte
mbe
r 200
2 R
epre
sent
ativ
ity: N
atio
nal
Tabl
e A
.12:
Ant
hrop
omet
ry o
f adu
lt w
omen
(con
t’d)
Anth
ropo
met
ry o
f adu
lt wo
men
Bo
dy M
ass I
ndex
(kg/m
²) (B
MI)
Perce
ntage
of w
omen
with
BMI
<1
8.5
18.5-
24.9
25.0-
29.9
≥30.0
Name
/date
of su
rvey
(mon
th/ye
ar)
(Refe
renc
e)
Back
grou
nd
char
acter
istics
Ag
e (ye
ars)
Samp
le siz
e Me
an
(kg/m
²) (ch
ronic
ener
gy de
ficien
cy)
(nor
mal)
(ove
rweig
ht)
(obe
sity)
Tota
l 15
-49
7681
26
.6 5.1
41
.1 27
.6 26
.3 Ag
e
15
-19
1729
22
.4 12
.7 66
.7 15
.3 5.4
20-2
9 23
83
24.9
4.9
53.1
29.0
13.0
30
-39
2171
28
.5 2.0
26
.5 35
.0 36
.4
40-4
9 13
97
31.6
0.6
11.6
28.8
58.9
Resid
ence
urba
n 15
-49
6018
26
.7 4.9
40
.7 28
.1 26
.3 ru
ral
15-4
9 16
63
26.3
5.5
42.5
25.8
26.2
Regi
on
No
rth
15-4
9 20
83
26.8
4.4
40.7
27.3
27.6
Centr
al 15
-49
4814
26
.5 5.1
41
.4 27
.8 25
.7 So
uth
15-4
9 78
4 26
.5 6.4
40
.6 26
.8 26
.2 Ed
ucat
ion's
leve
l
no ed
ucati
on
15-4
9 35
2 29
.8 4.4
19
.7 27
.0 48
.9 pr
imar
y*
15-4
9 22
08
28.6
3.3
30.2
28.1
38.5
Jo
rdan
Pop
ulatio
n an
d Fam
ily H
ealth
Su
rvey
[JPFH
S]
2002
(Ju
ly-Se
pt. 20
02)
(D
oS an
d ORC
Ma
cro, 2
003)
seco
ndar
y or h
igher
15
-49
5121
25
.5 5.8
47
.3 27
.4 19
.4 *:
prim
ary e
duca
tion i
nclud
es el
emen
tary (
6 yea
rs) an
d pre
para
tory (
4 yea
rs)
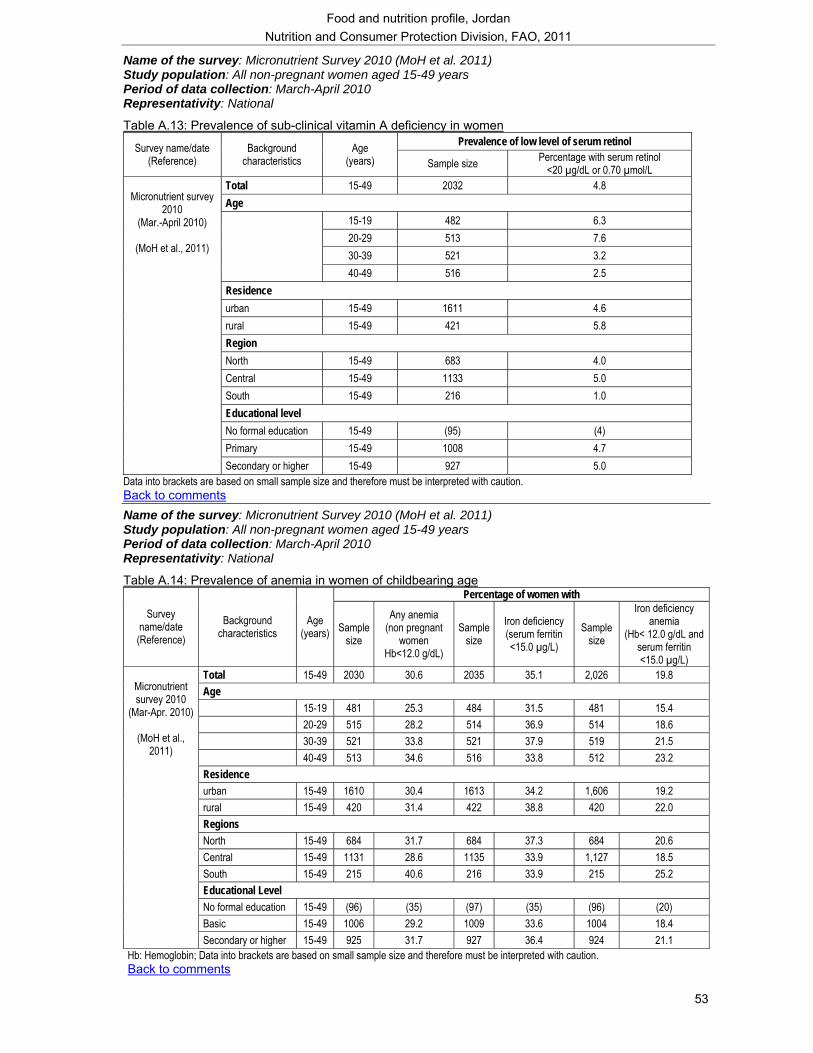
Food and nutrition profile, Jordan Nutrition and Consumer Protection Division, FAO, 2011
53
Name of the survey: Micronutrient Survey 2010 (MoH et al. 2011) Study population: All non-pregnant women aged 15-49 years Period of data collection: March-April 2010 Representativity: National
Table A.13: Prevalence of sub-clinical vitamin A deficiency in women Prevalence of low level of serum retinol Survey name/date
(Reference) Background
characteristics Age
(years) Sample size Percentage with serum retinol <20 µg/dL or 0.70 µmol/L
Total 15-49 2032 4.8 Age
15-19 482 6.3 20-29 513 7.6 30-39 521 3.2
40-49 516 2.5 Residence urban 15-49 1611 4.6 rural 15-49 421 5.8 Region North 15-49 683 4.0 Central 15-49 1133 5.0 South 15-49 216 1.0 Educational level No formal education 15-49 (95) (4) Primary 15-49 1008 4.7
Micronutrient survey
2010 (Mar.-April 2010)
(MoH et al., 2011)
Secondary or higher 15-49 927 5.0 Data into brackets are based on small sample size and therefore must be interpreted with caution. Back to comments Name of the survey: Micronutrient Survey 2010 (MoH et al. 2011) Study population: All non-pregnant women aged 15-49 years Period of data collection: March-April 2010 Representativity: National
Table A.14: Prevalence of anemia in women of childbearing age Percentage of women with
Survey name/date (Reference)
Background characteristics
Age (years) Sample
size
Any anemia (non pregnant
women Hb<12.0 g/dL)
Sample size
Iron deficiency (serum ferritin <15.0 µg/L)
Sample size
Iron deficiency anemia
(Hb< 12.0 g/dL and serum ferritin <15.0 µg/L)
Total 15-49 2030 30.6 2035 35.1 2,026 19.8 Age 15-19 481 25.3 484 31.5 481 15.4 20-29 515 28.2 514 36.9 514 18.6 30-39 521 33.8 521 37.9 519 21.5 40-49 513 34.6 516 33.8 512 23.2 Residence urban 15-49 1610 30.4 1613 34.2 1,606 19.2 rural 15-49 420 31.4 422 38.8 420 22.0 Regions North 15-49 684 31.7 684 37.3 684 20.6 Central 15-49 1131 28.6 1135 33.9 1,127 18.5 South 15-49 215 40.6 216 33.9 215 25.2 Educational Level No formal education 15-49 (96) (35) (97) (35) (96) (20) Basic 15-49 1006 29.2 1009 33.6 1004 18.4
Micronutrient survey 2010
(Mar-Apr. 2010)
(MoH et al., 2011)
Secondary or higher 15-49 925 31.7 927 36.4 924 21.1 Hb: Hemoglobin; Data into brackets are based on small sample size and therefore must be interpreted with caution. Back to comments
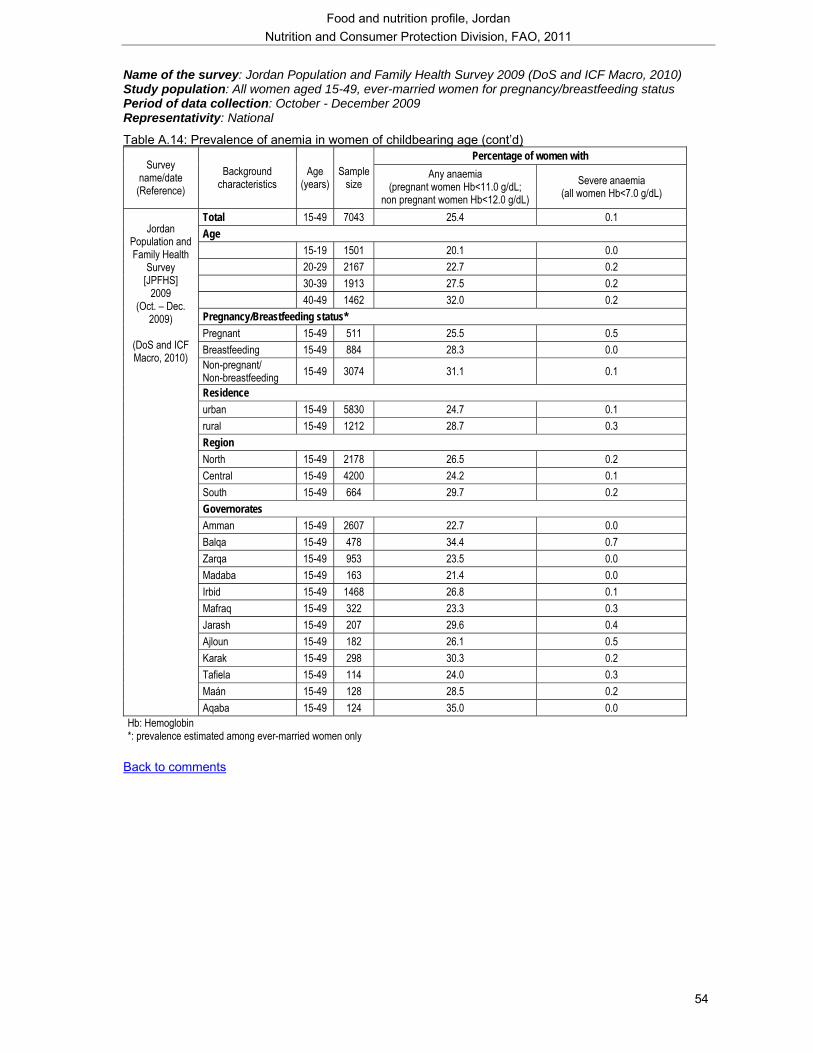
Food and nutrition profile, Jordan Nutrition and Consumer Protection Division, FAO, 2011
54
Name of the survey: Jordan Population and Family Health Survey 2009 (DoS and ICF Macro, 2010) Study population: All women aged 15-49, ever-married women for pregnancy/breastfeeding status Period of data collection: October - December 2009 Representativity: National
Table A.14: Prevalence of anemia in women of childbearing age (cont’d) Percentage of women with
Survey name/date (Reference)
Background characteristics
Age (years)
Sample size
Any anaemia (pregnant women Hb<11.0 g/dL;
non pregnant women Hb<12.0 g/dL) Severe anaemia
(all women Hb<7.0 g/dL)
Total 15-49 7043 25.4 0.1 Age 15-19 1501 20.1 0.0 20-29 2167 22.7 0.2 30-39 1913 27.5 0.2 40-49 1462 32.0 0.2 Pregnancy/Breastfeeding status* Pregnant 15-49 511 25.5 0.5 Breastfeeding 15-49 884 28.3 0.0 Non-pregnant/ Non-breastfeeding 15-49 3074 31.1 0.1
Residence urban 15-49 5830 24.7 0.1 rural 15-49 1212 28.7 0.3 Region North 15-49 2178 26.5 0.2 Central 15-49 4200 24.2 0.1 South 15-49 664 29.7 0.2 Governorates Amman 15-49 2607 22.7 0.0 Balqa 15-49 478 34.4 0.7 Zarqa 15-49 953 23.5 0.0 Madaba 15-49 163 21.4 0.0 Irbid 15-49 1468 26.8 0.1 Mafraq 15-49 322 23.3 0.3 Jarash 15-49 207 29.6 0.4 Ajloun 15-49 182 26.1 0.5 Karak 15-49 298 30.3 0.2 Tafiela 15-49 114 24.0 0.3 Maán 15-49 128 28.5 0.2
Jordan
Population and Family Health
Survey [JPFHS]
2009 (Oct. – Dec.
2009)
(DoS and ICF Macro, 2010)
Aqaba 15-49 124 35.0 0.0 Hb: Hemoglobin *: prevalence estimated among ever-married women only
Back to comments
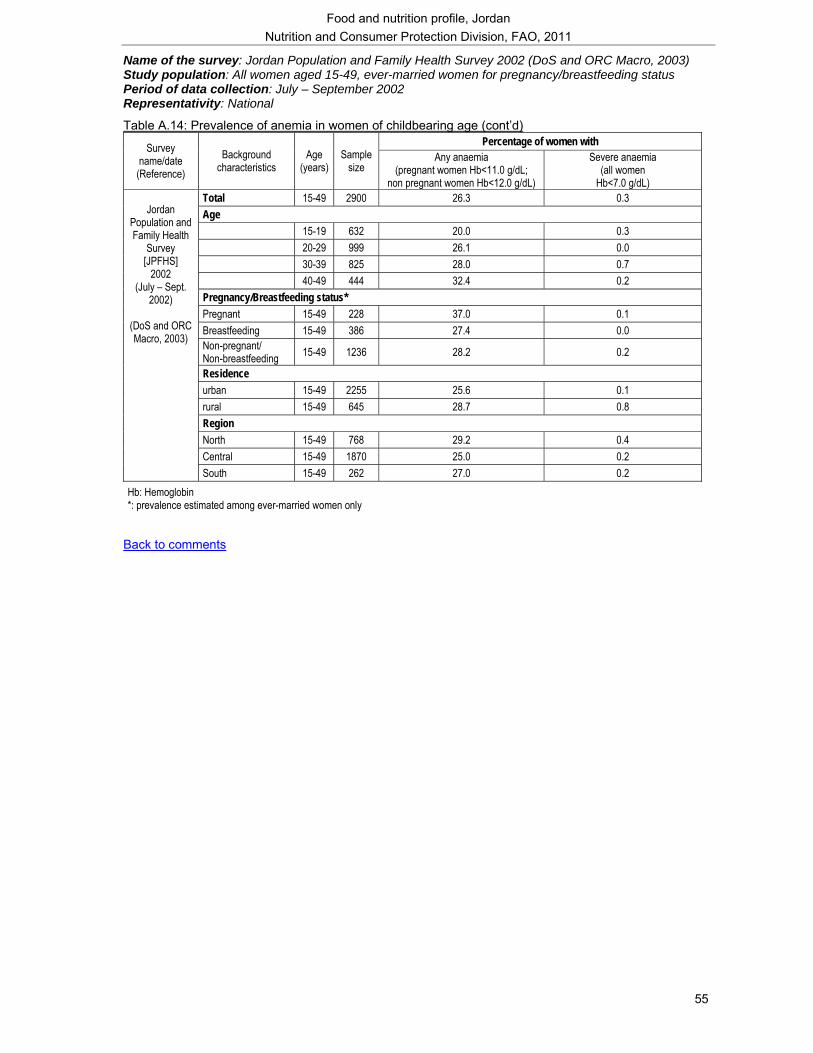
Food and nutrition profile, Jordan Nutrition and Consumer Protection Division, FAO, 2011
55
Name of the survey: Jordan Population and Family Health Survey 2002 (DoS and ORC Macro, 2003) Study population: All women aged 15-49, ever-married women for pregnancy/breastfeeding status Period of data collection: July – September 2002 Representativity: National
Table A.14: Prevalence of anemia in women of childbearing age (cont’d) Percentage of women with Survey
name/date (Reference)
Background characteristics
Age (years)
Sample size
Any anaemia (pregnant women Hb<11.0 g/dL;
non pregnant women Hb<12.0 g/dL)
Severe anaemia (all women
Hb<7.0 g/dL) Total 15-49 2900 26.3 0.3 Age 15-19 632 20.0 0.3 20-29 999 26.1 0.0 30-39 825 28.0 0.7 40-49 444 32.4 0.2 Pregnancy/Breastfeeding status* Pregnant 15-49 228 37.0 0.1 Breastfeeding 15-49 386 27.4 0.0 Non-pregnant/ Non-breastfeeding 15-49 1236 28.2 0.2
Residence urban 15-49 2255 25.6 0.1 rural 15-49 645 28.7 0.8 Region North 15-49 768 29.2 0.4 Central 15-49 1870 25.0 0.2
Jordan
Population and Family Health
Survey [JPFHS]
2002 (July – Sept.
2002)
(DoS and ORC Macro, 2003)
South 15-49 262 27.0 0.2 Hb: Hemoglobin *: prevalence estimated among ever-married women only
Back to comments
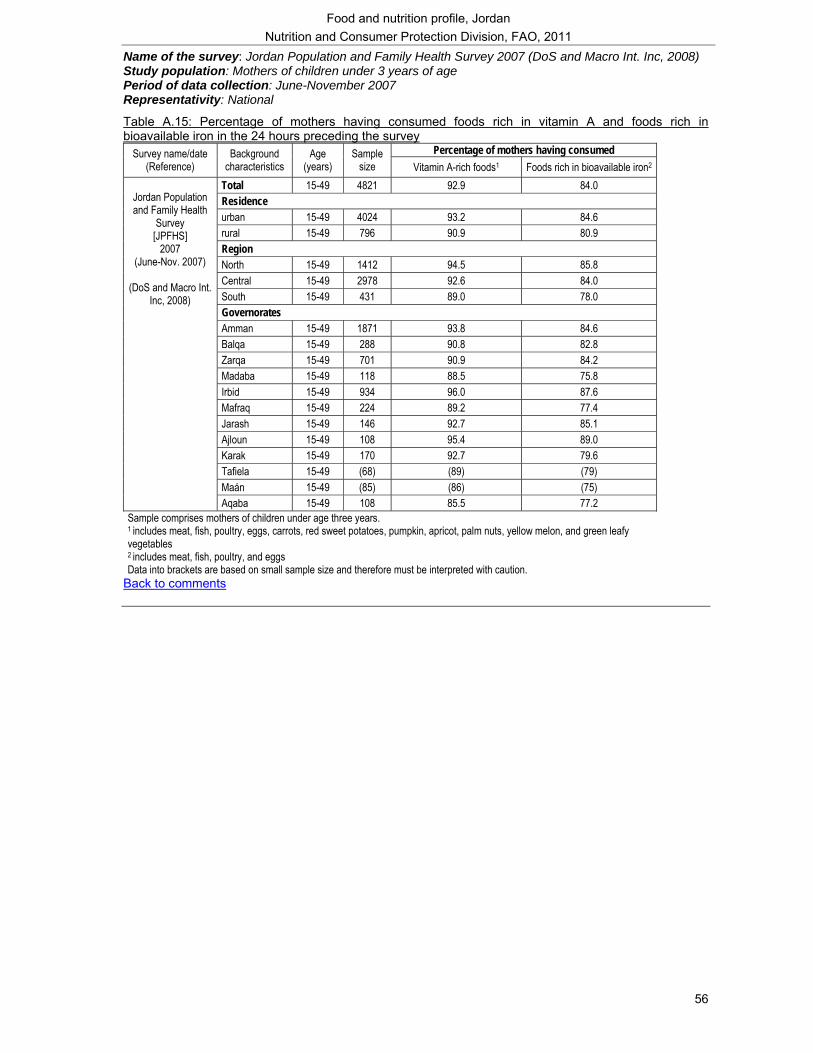
Food and nutrition profile, Jordan Nutrition and Consumer Protection Division, FAO, 2011
56
Name of the survey: Jordan Population and Family Health Survey 2007 (DoS and Macro Int. Inc, 2008) Study population: Mothers of children under 3 years of age Period of data collection: June-November 2007 Representativity: National
Table A.15: Percentage of mothers having consumed foods rich in vitamin A and foods rich in bioavailable iron in the 24 hours preceding the survey
Percentage of mothers having consumed Survey name/date (Reference)
Background characteristics
Age (years)
Sample size Vitamin A-rich foods1 Foods rich in bioavailable iron2
Total 15-49 4821 92.9 84.0 Residence urban 15-49 4024 93.2 84.6 rural 15-49 796 90.9 80.9 Region North 15-49 1412 94.5 85.8 Central 15-49 2978 92.6 84.0 South 15-49 431 89.0 78.0 Governorates Amman 15-49 1871 93.8 84.6 Balqa 15-49 288 90.8 82.8 Zarqa 15-49 701 90.9 84.2 Madaba 15-49 118 88.5 75.8 Irbid 15-49 934 96.0 87.6 Mafraq 15-49 224 89.2 77.4 Jarash 15-49 146 92.7 85.1 Ajloun 15-49 108 95.4 89.0 Karak 15-49 170 92.7 79.6 Tafiela 15-49 (68) (89) (79) Maán 15-49 (85) (86) (75)
Jordan Population and Family Health
Survey [JPFHS]
2007 (June-Nov. 2007)
(DoS and Macro Int.
Inc, 2008)
Aqaba 15-49 108 85.5 77.2 Sample comprises mothers of children under age three years. 1 includes meat, fish, poultry, eggs, carrots, red sweet potatoes, pumpkin, apricot, palm nuts, yellow melon, and green leafy vegetables 2 includes meat, fish, poultry, and eggs Data into brackets are based on small sample size and therefore must be interpreted with caution.
Back to comments
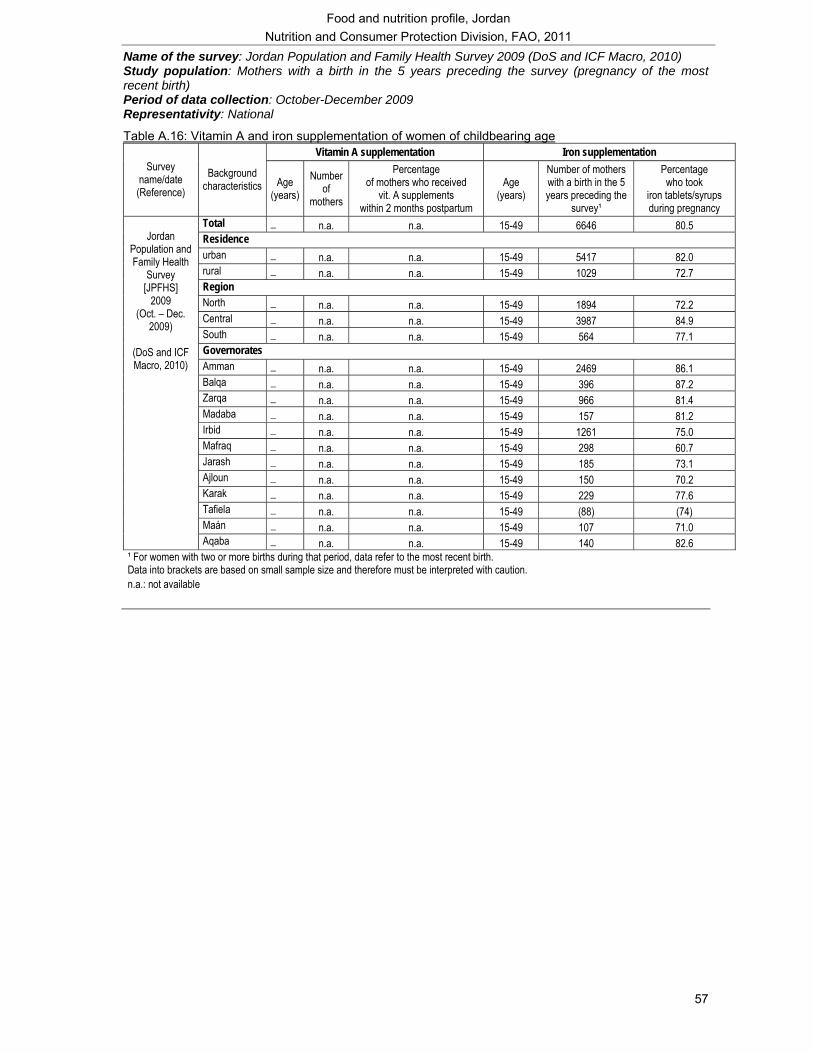
Food and nutrition profile, Jordan Nutrition and Consumer Protection Division, FAO, 2011
57
Name of the survey: Jordan Population and Family Health Survey 2009 (DoS and ICF Macro, 2010) Study population: Mothers with a birth in the 5 years preceding the survey (pregnancy of the most recent birth) Period of data collection: October-December 2009 Representativity: National
Table A.16: Vitamin A and iron supplementation of women of childbearing age Vitamin A supplementation Iron supplementation
Survey name/date (Reference)
Background characteristics Age
(years) Number
of mothers
Percentage of mothers who received
vit. A supplements within 2 months postpartum
Age (years)
Number of mothers with a birth in the 5 years preceding the
survey¹
Percentage who took
iron tablets/syrups during pregnancy
Total _ n.a. n.a. 15-49 6646 80.5 Residence urban _ n.a. n.a. 15-49 5417 82.0 rural _ n.a. n.a. 15-49 1029 72.7 Region North _ n.a. n.a. 15-49 1894 72.2 Central _ n.a. n.a. 15-49 3987 84.9 South _ n.a. n.a. 15-49 564 77.1 Governorates Amman _ n.a. n.a. 15-49 2469 86.1 Balqa _ n.a. n.a. 15-49 396 87.2 Zarqa _ n.a. n.a. 15-49 966 81.4 Madaba _ n.a. n.a. 15-49 157 81.2 Irbid _ n.a. n.a. 15-49 1261 75.0 Mafraq _ n.a. n.a. 15-49 298 60.7 Jarash _ n.a. n.a. 15-49 185 73.1 Ajloun _ n.a. n.a. 15-49 150 70.2 Karak _ n.a. n.a. 15-49 229 77.6 Tafiela _ n.a. n.a. 15-49 (88) (74) Maán _ n.a. n.a. 15-49 107 71.0
Jordan
Population and Family Health
Survey [JPFHS]
2009 (Oct. – Dec.
2009)
(DoS and ICF Macro, 2010)
Aqaba _ n.a. n.a. 15-49 140 82.6 ¹ For women with two or more births during that period, data refer to the most recent birth. Data into brackets are based on small sample size and therefore must be interpreted with caution. n.a.: not available
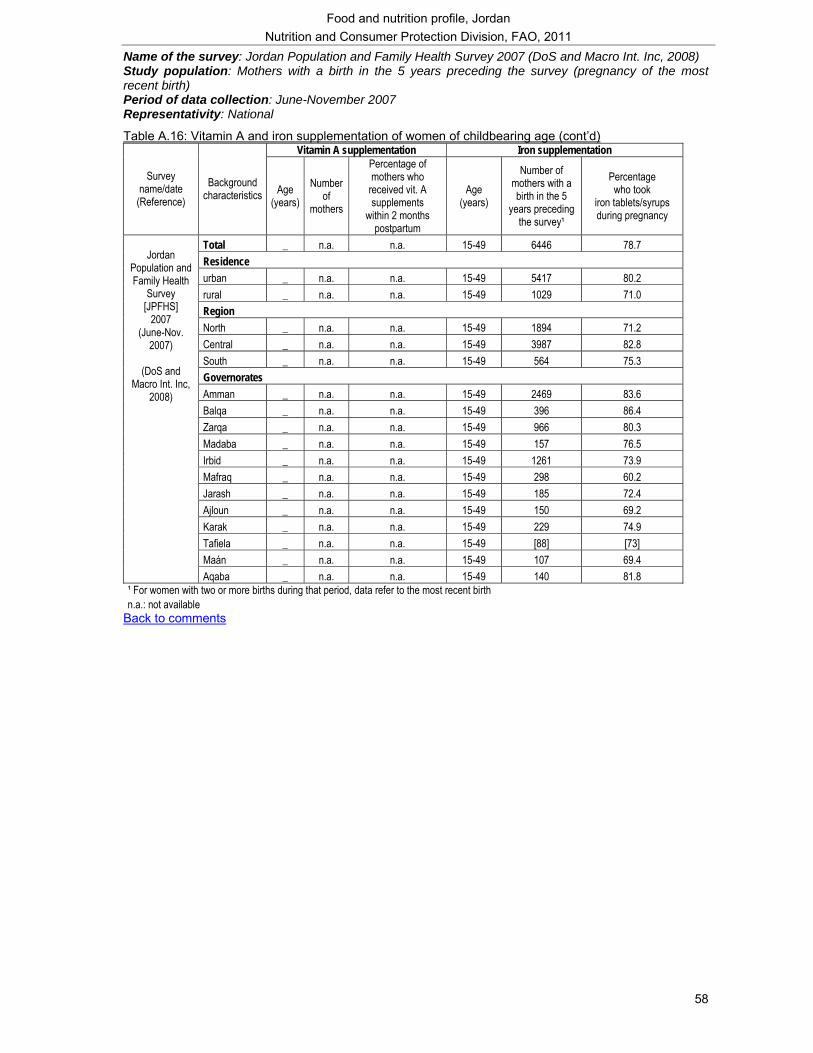
Food and nutrition profile, Jordan Nutrition and Consumer Protection Division, FAO, 2011
58
Name of the survey: Jordan Population and Family Health Survey 2007 (DoS and Macro Int. Inc, 2008) Study population: Mothers with a birth in the 5 years preceding the survey (pregnancy of the most recent birth) Period of data collection: June-November 2007 Representativity: National
Table A.16: Vitamin A and iron supplementation of women of childbearing age (cont’d) Vitamin A supplementation Iron supplementation
Survey name/date
(Reference) Background
characteristics Age (years)
Number of
mothers
Percentage of mothers who
received vit. A supplements
within 2 months postpartum
Age (years)
Number of mothers with a birth in the 5
years preceding the survey¹
Percentage who took
iron tablets/syrups during pregnancy
Total _ n.a. n.a. 15-49 6446 78.7 Residence urban _ n.a. n.a. 15-49 5417 80.2 rural _ n.a. n.a. 15-49 1029 71.0 Region North _ n.a. n.a. 15-49 1894 71.2 Central _ n.a. n.a. 15-49 3987 82.8 South _ n.a. n.a. 15-49 564 75.3 Governorates Amman _ n.a. n.a. 15-49 2469 83.6 Balqa _ n.a. n.a. 15-49 396 86.4 Zarqa _ n.a. n.a. 15-49 966 80.3 Madaba _ n.a. n.a. 15-49 157 76.5 Irbid _ n.a. n.a. 15-49 1261 73.9 Mafraq _ n.a. n.a. 15-49 298 60.2 Jarash _ n.a. n.a. 15-49 185 72.4 Ajloun _ n.a. n.a. 15-49 150 69.2 Karak _ n.a. n.a. 15-49 229 74.9 Tafiela _ n.a. n.a. 15-49 [88] [73] Maán _ n.a. n.a. 15-49 107 69.4
Jordan
Population and Family Health
Survey [JPFHS]
2007 (June-Nov.
2007)
(DoS and Macro Int. Inc,
2008)
Aqaba _ n.a. n.a. 15-49 140 81.8 ¹ For women with two or more births during that period, data refer to the most recent birth n.a.: not available
Back to comments
Food and nutrition profile, Jordan Nutrition and Consumer Protection Division, FAO, 2011
59
List of references
AARDO. 2010. Food Security – Global trends and perspective. Report of the 32nd RECA Seminar. Afro-Asian Rural Development Organization, New Delhi. (available at http://www.aardo.org/reca.pdf) Abu Baker, N.N. and Daradkeh, S.M. 2010. Prevalence of overweight and obesity among adolescents in Irbid governorate, Jordan. EMHJ, Vol. 16 No. 6, 2010. (available at http://www.emro.who.int/emhj/V16/06/16_6_2010_0657_0662.pdf) Ajlouni, K., Jaddou, H., Baticha, A. 1998. Obesity in Jordan. International Journal of Obesity (1998) 22, 624-628. (available at http://www.nature.com/ijo/journal/v22/n7/pdf/0800637a.pdf) Alkurd, R., Takruri, H., Faris, M., 2010. Estimated intakes of iron, zinc, and selenium of Jordanians as obtained from data from Jordanian households expenditures and income survey (JHEIS) 2006. Pakistan Journal of Nutrition 9 (6): 600-604. (available at: http://www.uop.edu.jo/download/Research/members/267_1502_Estimated_Intake_of_iron,_zinc_and_selenium_in_Jordan.pdf). Alqaisi, O., Ndambi, O.A. and Hemme, T. 2009. Development of milk production and the dairy industry in Jordan. Livestock Research for Rural Development 21 (7). (available at http://www.lrrd.org/lrrd21/7/alqa21107.htm) Batieha, A., Khader, Y., Jaddou, H. Hyassat D., Batieha, Z., Khateeb, M., Belbisi, A., Ajlouni, K. 2011. Vitamin D status in Jordan: Dress style and gender discrepancies. Ann Nutr Metab, 19;58(1):10-18. CFS. 2010. National initiatives for food security and nutrition. Committee on World Food Security. Country case study – CFS 36th session 11-14 and 16 October 2010. (available at http://www.fao.org/fileadmin/templates/cfs/Docs0910/CFS36Docs/CFS36_Session_Presentations/CFS36_Agenda_Item_VII_Jordan.pdf) Cole, T., J., Bellizzi, M. C., Flegal, K.M. Dietz, W.H. 2000. Establishing a standard definition for child overweight and obesity worldwide: international survey. BMJ, 320 (7244):1240–1243. (available at http://www.bmj.com/content/320/7244/1240.abridgement.pdf) DAPID. No date. Jordan – CSD Guidelines for national reporting to CSD-16. Department of Agricultural Policies and International Directorate. (available at http://www.un.org/esa/agenda21/natlinfo/countr/jordan/agriculture.pdf) DevInfo. 2010. Nutrition Profile, Jordan. (available at http://www.devinfo.org/newsletter/profiles/nutrition_profile_jordan_february_2010.pdf) DoS. 2010. The National Maternal Mortality Study 2007-2008. Global Forum on Gender Statistics and Interagency and Expert Group Meeting on Gender Statistics, Manila, Philippines, 11-14 October 2010. Gender Statistics Division, Department of Statistics, Jordan. DoS. 2009. Household Expenditure and Income Survey 2008. Department of Statistics, Amman. DoS. 2008. Household Expenditure and Income Survey 2006. Department of Statistics, Amman. DoS and ICF Macro. 2010. Jordan Population and Family Health Survey 2009. Department of Statistics, Amman and ICF Macro, Calverton, Maryland, USA. (available at http://www.measuredhs.com/pubs/pub_details.cfm?ID=1013&ctry_id=18&SrchTp=ctry&flag=sur&cn=Jordan)
Food and nutrition profile, Jordan Nutrition and Consumer Protection Division, FAO, 2011
60
DoS and Macro Int.1998. Jordan Population and Family Health Survey 1997. Department of Statistics, Amman and Macro International, Calverton, Maryland, USA. (available at http://www.measuredhs.com/pubs/pub_details.cfm?ID=138&ctry_id=18&SrchTp=ctry&flag=sur&cn=Jordan) DoS and Macro Int. Inc, 2008. Jordan Population and Family Health Survey 2007. Department of Statistics, Amman and Macro International Inc. Calverton, Maryland, USA. (available at http://www.measuredhs.com/pubs/pub_details.cfm?ID=860&ctry_id=18&SrchTp=ctry&flag=sur&cn=Jordan) DoS and ORC Macro. 2003. Jordan Population and Family Health Survey 2002. Department of Statistics, Amman and ORC Macro Calverton, Maryland, USA. (available at http://www.measuredhs.com/pubs/pub_details.cfm?ID=411&ctry_id=18&SrchTp=ctry&flag=sur&cn=Jordan) DoS, MoH and IRD Macro Int. Inc. 1992. Jordan Population and Family Health Survey 1990. Department of Statistics, Amman, Ministry of Health, Amman and IRD/Macro International Inc. Columbia, Maryland, USA. (available at http://www.measuredhs.com/pubs/pub_details.cfm?ID=73&ctry_id=18&SrchTp=ctry&flag=sur&cn=Jordan) FAO. 2011a. The State of Food Insecurity in the World 2011. Food and Agriculture Organization of the United Nations. Rome. (available at http://www.fao.org/publications/sofi/en/) FAO. 2011b. Country brief - Jordan. Policy and Programme Development Support Division, Technical Cooperation Department, Food and Agriculture Organization of the United Nations. Rome. FAO. 2010. Jordan country brief report – Agriculture growth rates, export, imports and undernourishment. Food and Agriculture Organization of the United Nations. Rome. FAO. 2004. Calculating population energy requirements and food needs. Software application. Accompanying: FAO Food and Nutrition Technical Report Series No. 1. Food and Agriculture Organization of the United Nations. Rome. FAO, FAOSTAT. 2011. Statistical databases. Food and Agriculture Organization of the United Nations. Rome. (available at http://faostat.fao.org/) Accessed in 2011. FAO, AQUASTAT. 2008. Jordan. FAOs Information System on Water and Agriculture. Food and Agriculture Organization of the United Nations. Rome. (available at http://www.fao.org/nr/water/aquastat/countries_regions/jordan/index.stm) FAO, Fisheries and Aquaculture Department. No date. Fishery and Aquaculture Country Profile – Jordan. Fisheries and Aquaculture Department. Food and Agriculture Organization of the United Nations. Rome. (available at http://www.fao.org/fishery/countrysector/FI-CP_JO/en) FAO, Statistics Division. 2011. Major food and agricultural commodities and producers. Food and Agriculture Organization of the United Nations. Rome. (available at http://www.fao.org/es/ess/top/country.html;jsessionid=4F01DD5AAE7E963652C5831210297960) Accessed in 2011.
Food and nutrition profile, Jordan Nutrition and Consumer Protection Division, FAO, 2011
61
FEWSNET. 2011. Executive brief: Food price trends in the Middle East and North Africa. Famine Early Warning Systems Network, USAID. (available at http://www.fews.net/docs/Publications/EB%20Food%20price%20trends%20in%20the%20Middle%20East%20and%20North%20Africa%202011%202%2016.pdf) ICCIDD. No date. History of IDD in Middle East and Eastern Mediterranean Region. International Council for the Control of Iodine Deficiency Disorders. (available on http://www.erc.ac.ir/idd/history.htm#jordan) IFAD. 2007. Country strategic opportunities programme. International Fund for Agriculture Development. Rome (available at http://www.ifad.org/gbdocs/eb/92/e/EB-2007-92-R-16.pdf) IFPRI. 2011. Statistics of Public Expenditure for Economic Development (SPEED). International Food Policy Research Institute, Washington, DC. (available at http://www.ifpri.org/book-39/ourwork/programs/priorities-public-investment/speed-database) Accessed in 2011. Khader, Y., Batieha, A., Ajlouni, H., El-Khateeb, M., Ajlouni, K. 2008. Obesity in Jordan: prevalence, associated factors, comorbidities, and changes in prevalence over ten years. Metabolic syndrom and related disorders. Vol. 6, No 2. (available at http://ncd.org.jo/index2.php?option=com_docman&task=doc_view&gid=134&Itemid=79) Khader, Y., Irshaidat, O., Khasawneh, M., Amarin, Z., Alomari, M., Batieha, A. 2007. Overweight and obesity among school children in Jordan: prevalence and associated factors. Matern Child Health J 10.10007/s10995-008-0362-O. Khatib, I. M. D. 2002. High prevalence of subclinical vitamin A deficiency in Jordan: a forgotten risk. Food and Nutrition Bulletin, 23, 3 (supplement) pp 228-236. Khatib, I. M. D. and Elmadfa, I. 2009. Poor nutritional health of Bedouin preschool children in Jordan: the irony of urbanization. Ann Nutr Metab 2009; 54: 301-309. Khatib, I. M. D. and Hijazi, S. S. 2009. Micronutrient deficiencies among children may be endemic in underprivileged areas in Jordan. Jordan Medical Journal 2009 Vol. 43 No. 4 pp 324-332. (abstract available at http://www.cabdirect.org/abstracts/20103096783.html#) Madanat, H.N., Troutman, K.P., Al-Madi, B. 2008. The nutrition transition in Jordan: the political, economic and food consumption contexts. Promot Educ, 2008; 15 (1): pp. 6-10. (available at http://ped.sagepub.com/content/15/1/6.full.pdf+html) MoH. 2009. Ministry of Health Annual Statistical Report. Ministry of Health, Amman. (available at: http://www.moh.gov.jo/MOH/Files/Publication/Ministry%20of%20Health%20Annual%20Statistical%20Book%202009_3.pdf) MoH and WHO. 2010a. National survey to assess iodine deficiency disorders (IDD) among school children in Jordan. Nutrition Division, Non communicable diseases Department, Ministry of Health, in collaboration with WHO. MoH and WHO. 2010b. Nutrition in Jordan: Update and Plan of Action. Ministry of Health and World Health Organization. MoH, CDC, UNICEF and GAIN. 2011 Micronutrient Survey 2010. Non communicable diseases Department/Nutrition Division, Ministry of Health in collaboration with CDC, UNICEF and GAIN. MoH, UNICEF and WHO. 2000. Assessment of iodine deficiency status among Jordanian children after introduction of iodized salt. Ministry of Health, Amman, United Nations Children's Fund and World Health Organization. (http://www.unicef.org/evaldatabase/files/JDN_00-004.pdf)
Food and nutrition profile, Jordan Nutrition and Consumer Protection Division, FAO, 2011
62
MoH, UNICEF and WHO. 1993. Study of iodine deficiency in Jordan. Ministry of Health, Amman, United Nations Children's Fund and World Health Organization. MoH, WHO, UNICEF and CDC. 2002. National baseline survey on iron deficiency anemia and vitamin A deficiency. Ministry of Health, Amman, World Health Organization, United Nations Children's Fund and Centers for Disease Control. MPIC. 2010. Second National Millennium Development Goals Report Jordan 2010 – Keeping the promise and achieving aspirations. Ministry of Planning and International Cooperation, United Nations in Jordan. (available at http://www.undp-jordan.org/uploads/publications/UN_1292424706.pdf) MPIC, UNDP Jordan and JHFHD. 2004. Jordan Human Development Report 2004 – Building sustainable livelihoods. Ministry of Planning and International Cooperation, Hashemite Kingdom of Jordan, United Nations Development, Jordan and Jordanian Hashemite Fund for Human Development/Queen Zein Al Sharaf Institute for Development, Jordan. (available at http://hdr.undp.org/en/reports/national/arabstates/jordan/name,3277,en.html) OKH. No date. Education in Jordan: A Commitment to Excellence. Office of the King Hussein. (available at http://www.kinghussein.gov.jo/resources3.html) RSW. 2004. The Middle East and North Africa 2004. Regional Surveys of the World. Europa Publications. Salman, A. Z. 2005. Economic benefits of reservoirs in the irrigated agriculture: A case study of the Jordan Valley. Water International, vol. 30, n°2, pp 220-224. Shaban, R. A., Abu-Ghaida, D., Al-Naimat, A-S. 2001. Poverty alleviation in Jordan. Orientations in Development Series 22560, June 2001. The World Bank, Middle East and North Africa Region. (available at http://www.rmportal.net/framelib/ltpr/052709/wb-jordan-poverty-alleviation-wb-2001.pdf) Singhal, A and Lanigan, J. 2007. Breastfeeding, early growth and later obesity. Obesity reviews 8 (Suppl.1): 51-54. (available at http://onlinelibrary.wiley.com/doi/10.1111/j.1467-789X.2007.00318.x/pdf) Taha, S. and Bataineh, F. 2002. Water valuation – The case of Jordan, Valuation of water for domestic use. Water Demand Management Forum. UNAIDS. 2010. HIV/AIDS health profile – Middle East Region. Joint United Nations Programme on HIV/AIDS. (available at http://www.usaid.gov/our_work/global_health/aids/Countries/me/hiv_summary_me.pdf) UNDP. 2010a. Government of the Hashemite Kingdom of Jordan – Project document (Food and Nutrition Security in Jordan towards poverty alleviation). United Nations Development Programme. (available at http://www.undp-jordan.org/uploads/projects/pd_1293615331.pdf) UNDP. 2010b. Human Development Report 2010. United Nations Development Programme. New York. USA. (availble at http://hdr.undp.org/en/reports/global/hdr2010/) UNDP/GoJ. 2010. United Nations Development Programme / Government of the Hashemite Kingdom of Jordan Project Document: Food and Nutrition Security in Jordan towards Poverty Alleviation. United Nations Development Programme / Government of the Hashemite Kingdom of Jordan. (available at http://www.undp-jordan.org/uploads/projects/pd_1293615331.pdf) UNESCO. 2010. Global Education Digest 2010 – Comparing education statistics across the world. UNESCO Institute for Statistics. Montreal. Canada. (available at http://www.uis.unesco.org/template/pdf/ged/2010/GED_2010_EN.pdf) UNICEF. 2011. The State of the World's Children 2011. United Nations Children's Fund. New York. USA. (available at http://www.unicef.org/sowc2011/index.php) UNICEF. 2005. The State of the World's Children 2005. United Nations Children's Fund. New York. USA. (available at http://www.unicef.org/publications/index_24432.html)
Food and nutrition profile, Jordan Nutrition and Consumer Protection Division, FAO, 2011
63
UNICEF. No date. The United Nation’s Children Fund, press centre. United Nation’s Children Fund. New-York, USA. (available at:http://www.unicef.org/media/media_40756.html). Accessed in 2011. UNICEF, Press Centre. 2007. News note: Queen Rania opens Baby Friendly Hospital. United Nation’s Children Fund. New-York, USA. (available at http://www.unicef.org/media/media_40756.html) UNICEF, Statistics by area - Maternal Health. 2011. Maternal Mortality Ratio 1990-2008 (UN Inter-agency estimates). United Nation’s Children Fund. New-York, USA. (available at http://www.childinfo.org/maternal_mortality_ratio.php) Accessed in 2011. UNICEF and NCFA. 2007. Children in Jordan situation analysis 2006/2007. United Nations Children’s Fund and National Council for Family Affairs, Amman. (available at http://www.unicef.org/sitan/files/SITAN_Jordan_Eng.pdf) UNIDO. No date. Agro-food sector. United Nations Industrial Development Organization. (available at http://mediterraneanexchange.unido.org/upload/1726_brief_Agro%20Food.pdf) UNPD. 2011. World Population Prospects: The 2008 Revision Population Database. United Nations Population Division. New York. USA. (available at http://esa.un.org/unpp/) Accessed in 2011. UNPD. 2011. World Urbanization Prospects: The 2007 Revision Population Database. United Nations Population Division. New York. USA. (available at http://esa.un.org/unup/index.asp?panel=1) Accessed in 2011. USAID. 2009. Developing a national supply strategy for Jordan. United States Agency for International Development. (available at http://pdf.usaid.gov/pdf_docs/PNADT038.pdf) Wardam, B. 2004. More politics then water: water rights in Jordan. Global Issue Paper, No 11, Supp. 2. Heinrich Böll Foundation. (available at http://www.boell.de/downloads/internationalepolitik/GIP11_Jordan_Batir_Wardam.pdf) WB. 2011. Reproductive health at a glance – Jordan. World Bank. Washington D.C. (available at http://siteresources.worldbank.org/INTPRH/Resources/376374-1282255445143/Jordan52511web.pdf) WB. 2010. Jordan – Country brief. World Bank. Washington D.C. (available at http://web.worldbank.org/WBSITE/EXTERNAL/COUNTRIES/MENAEXT/JORDANEXTN/0,,menuPK:315140~pagePK:141132~piPK:141107~theSitePK:315130,00.html) WB. 2011. World Development Indicators Database. World Bank. Washington D.C. (available at http://data.worldbank.org/indicator) Accessed in 2011. WB and DoS. 2009. Hashemite Kingdom of Jordan Poverty update (Volume I: Main report). Social and Economic Development Group, Middle East and North Africa Region, The World Bank and Department of Statistics, Ministry of Planning and International Cooperation, Hashemite Kingdom of Jordan. (available at http://www-wds.worldbank.org/external/default/WDSContentServer/WDSP/IB/2009/11/19/000333038_20091119234547/Rendered/PDF/479510ESW0v10P1C0disclosed011118191.pdf) WFP, 2010. Countries: Middle East- Jordan. World Food Program. Rome. (available at: http://www.wfp.org/countries/jordan)
Food and nutrition profile, Jordan Nutrition and Consumer Protection Division, FAO, 2011
64
WFP, FAIS. 2011. Food Aid Information System. World Food Programme. Rome. (available at http://www.wfp.org/fais/ ) Accessed in 2011. WFP and JAAH. 2008. Jordan Food Security Survey in the Poverty Pockets – August-September 2008. World Food Programme and The Jordanian Alliance Against Hunger. (available at http://home.wfp.org/stellent/groups/public/documents/ena/wfp204530.pdf) WHO. 2011. Database on anaemia. Vitamin and Mineral Nutrition Information System (VMNIS), World Health Organization. Geneva. Switzerland. (available at http://www.who.int/vmnis/database/anaemia/en/index.html) Accessed in 2011. WHO. 2011. Database on iodine deficiency. Vitamin and Mineral Nutrition Information System (VMNIS), World Health Organization. Geneva. Switzerland. (available at http://www.who.int/vmnis/database/iodine/en/index.html) Accessed in 2011. WHO. 2011. Database on vitamin A deficiency. Vitamin and Mineral Nutrition Information System (VMNIS), World Health Organization. Geneva. Switzerland. (available at http://www.who.int/vmnis/database/vitamina/en/index.html) Accessed in 2011. WHO. 2011. Global database on child growth and malnutrition. World Health Organization. Geneva. Switzerland. (available at http://www.who.int/nutgrowthdb/database/en/) Accessed in 2011. WHO. 2011. Global health observatory. World Health Organization. Geneva. Switzerland. (available at http://www.who.int/gho/en/) Accessed in 2011. WHO. 2011. WHOSIS Database. WHO Statistical Information System. World Health Organization. Geneva. Switzerland. (available at http://www.who.int/whosis/data/Search.jsp) Accessed in 2011. WHO. 2010a. World Health Statistics 2010. World Health Organization. Geneva. Switzerland. (available at http://www.who.int/whosis/whostat/EN_WHS10_Full.pdf) WHO. 2010b. A review of Nutrition Policies – Draft Global Nutrition Policy Review: 20 December 2010. World Health Organization. Geneva. Switzerland. (available at http://www.who.int/nutrition/EB128_18_Backgroundpaper1_A_review_of_nutritionpolicies.pdf) WHO/EMRO. 2006a. Social determinants of health - Jordan. Eastern Mediterranean Regional Office, World Health Organization, Division of Health System and Services Development (DHS), Health Policy and Planning Unit. (available at http://ajlunihm.com/wp-content/uploads/2008/06/jordan-social-determinants-for-health.pdf) WHO/EMRO. 2006b. Health System Profile, Jordan. Regional Health Systems Observatory, Eastern Mediterranean Regional Office, World Health Organization. (available at http://gis.emro.who.int/HealthSystemObservatory/PDF/Jordan/Full%20Profile.pdf) WHO/EMRO. 2003. Country Cooperation Strategy for WHO and Jordan 2003-2007. World Health Organization, Regional Office for Eastern Mediterranean. (available at http://www.who.int/countries/en/cooperation_strategy_jor_en.pdf)

Food and nutrition profile, Jordan Nutrition and Consumer Protection Division, FAO, 2011
65
WHO/FAO. 2003. Diet, nutrition and the prevention of chronic diseases. Report of a joint WHO/FAO Expert Consultation. WHO Technical Report Series 916. World Health Organization. Geneva. Switzerland. (available at http://whqlibdoc.who.int/trs/WHO_TRS_916.pdf) WHO/UNICEF. 2010. Progress on sanitation and drinking-water – 2010 update. WHO/UNICEF Joint Monitoring Programme for Water Supply and Sanitation. World Health Organization and United Nation’s Children Fund. (available at http://www.childinfo.org/files/WatSan_JMP_report_2010.pdf)