Normand Pellerin Assistant Vice President Box 8100 C.P ... · Canadian National Normand Pellerin...
49
Canadian National Normand Pellerin Assistant Vice President Environment Canadian National Box 8100 Montreal, Quebec Canada H3C 3N4 Canadien National Vice-président adjoint Environnement Canadian National C.P. 8100 Montréal (Québec) Canada H3C 3N4 April 21, 2017 Ms. Lesley Griffiths Panel Chair c/o Canadian Environmental Assessment Agency 160 Elgin Street Ottawa ON, K1A 0H3 By email Dear Ms. Griffiths: The Canadian National Railway Company (CN) is pleased to provide with our response to the Information Request Package 1 – Milton Logistics Hub Project Review Panel received on April 5, 2017, as supplemental information for your review and consideration in support of the Environmental Impact Statement (EIS) under the Canadian Environmental Assessment Act, 2012 (CEAA 2012). The enclosed document entitled CN Responses to the Canadian Environmental Assessment Agency (CEAA) Panel Information Request 1 Received – April 20, 2017 is provided in partial response to the comments and questions raised in your letter. Based on the additional information requested, Stantec, on behalf of CN has initiated supplemental field investigations which are expected to be completed in April and May 2017. Upon completion, the results will be compiled and additional assessment completed, as necessary, to provide the Panel with the additional information requested. The results of this field work are expected to be provided to the Panel in early June 2017. Please do not hesitate to contact me should you have any questions. Sincerely, Normand Pellerin Assistant Vice-President, Environment Cc: Dr. Isobel Heathcote, Review Panel Member Mr. William McMurray, Review Panel Member Mr. Darren Reynolds, CN <Original signed by>
Transcript of Normand Pellerin Assistant Vice President Box 8100 C.P ... · Canadian National Normand Pellerin...

Canadian National
Normand Pellerin
Assistant Vice President
Environment
Canadian National
Box 8100
Montreal, Quebec Canada
H3C 3N4
Canadien National
Vice-président adjoint
Environnement
Canadian National
C.P. 8100
Montréal (Québec) Canada
H3C 3N4
April 21, 2017 Ms. Lesley Griffiths Panel Chair c/o Canadian Environmental Assessment Agency 160 Elgin Street Ottawa ON, K1A 0H3 By email Dear Ms. Griffiths:
The Canadian National Railway Company (CN) is pleased to provide with our response to the Information
Request Package 1 – Milton Logistics Hub Project Review Panel received on April 5, 2017, as
supplemental information for your review and consideration in support of the Environmental Impact
Statement (EIS) under the Canadian Environmental Assessment Act, 2012 (CEAA 2012).
The enclosed document entitled CN Responses to the Canadian Environmental Assessment Agency
(CEAA) Panel Information Request 1 Received – April 20, 2017 is provided in partial response to the
comments and questions raised in your letter.
Based on the additional information requested, Stantec, on behalf of CN has initiated supplemental field
investigations which are expected to be completed in April and May 2017. Upon completion, the results
will be compiled and additional assessment completed, as necessary, to provide the Panel with the
additional information requested. The results of this field work are expected to be provided to the Panel
in early June 2017.
Please do not hesitate to contact me should you have any questions.
Sincerely,
Normand Pellerin Assistant Vice-President, Environment Cc: Dr. Isobel Heathcote, Review Panel Member Mr. William McMurray, Review Panel Member Mr. Darren Reynolds, CN
<Original signed by>

Prepared on April 21, 2017
CN Milton Logistics Hub (“Project”)
CEAR File No. 80100
CN Response to the Review Panel’s Information Request 1
Received April 5, 2017
Contents
IR1.1 HEADWATER FEATURES ..................................................................................................... 1
IR1.2 SURFACE WATER MONITORING ....................................................................................... 2
IR1.3 WESTERN CHORUS FROG ................................................................................................. 4
IR1.4 BASKING TURTLES ............................................................................................................... 6
IR1.5 BAT MATERNITY ROOSTS ................................................................................................... 7
IR1.6 EASTERN MILKSNAKE ......................................................................................................... 7
LIST OF ATTACHMENTS
ATTACHMENT 1: OVERVIEW OF HEADWATER CHANNEL DIMENSIONS AND
CHARACTERISTICS (APRIL 20, 2017)
ATTACHMENT 2: HYDROLOGY AND SURFACE WATER QUALITY BASELINE STUDY UPDATE
ATTACHMENT 3: WESTERN CHORUS FROG SURVEY PROTOCOL

Prepared on April 21, 2017
rt https://partner.stantec.com/sites/cnmiltonlogisticshub/panel irs/ir1/final ir1/cn_ir1_20170420_fnl.docx 1
IR1.1 Headwater Features
Rationale: In Section 5.1.2 of Appendix E.4 of the EIS, CN defined a headwater feature as
“typically a low- lying depression with no defined channel, often cultivated, that does not
provide direct or indirect habitat values for fish, but might convey flow seasonally or following
precipitation events”.
CN stated in Appendix E.4 (Technical Data Report Fish and Fish Habitat) that headwater feature
investigations were undertaken in July and August, 2013. The table ‘Headwater channel
dimensions and characteristics’ in Appendix D of Appendix E.4 indicated that headwater
tributaries were assessed at eight locations and the results of these investigations indicate that
flow was dry at all eight locations.
CN’s adopted methodology for mapping headwater features, Evaluation, Classification and
Management of Headwater Drainage Features: Interim Guidelines 2009 (CVC and TRCA, 2009),
indicated that field investigations for headwater drainage features should be undertaken during
three assessment periods: spring freshet/rain events, late April-May and July-August. These
guidelines also stated that fieldwork should be conducted in late spring (e.g. decline in spring
freshet of April, May, and June) under clear conditions to capture seasonal fish use. Unless the
drainage feature is dry in April, May, and June, fish should be sampled using nets, electrofishing
or minnow traps at various points along the reach to be examined.
Since CN’s sampling was conducted in July and August, it is unclear whether water would have
been present in April, May, and June. To determine the need for fish sampling, it is necessary to
conduct headwater feature investigations to determine if water is present in April, May, and June.
Information Request:
1. Provide information on whether water is normally present in the eight headwater feature
locations in April, May, and June. If water is present during those months, indicate the habitat
quality and indicate whether fish are present. If this information is not available, conduct
additional field investigations.
CN Response:
In addition to the July and August 2013 surveys noted in the Aquatics TDR (Section 4.2.2, page 14),
additional surveys were conducted in May 2013 that informed the characterization of headwater
features. Updated versions of the table and corresponding photolog provided in Appendix D of
the Aquatics TDR (EIS Appendix E.4) are provided as Attachment 1: Overview of Headwater
Channel Dimensions and Characteristics (April 20, 2017). These documents have been updated to
incorporate supplemental notes and available photographs from the May 1, 2013 site visit, as well
as more recent surveys conducted on April 18, 2017.
Ponded water was observed in images from May 2013; however, no flow was observed. In more
recent surveys conducted in April 2017, the headwater features were observed to be dry, similar
to observations from August 2013.
Prepared on April 21, 2017
rt https://partner.stantec.com/sites/cnmiltonlogisticshub/panel irs/ir1/final ir1/cn_ir1_20170420_fnl.docx 2
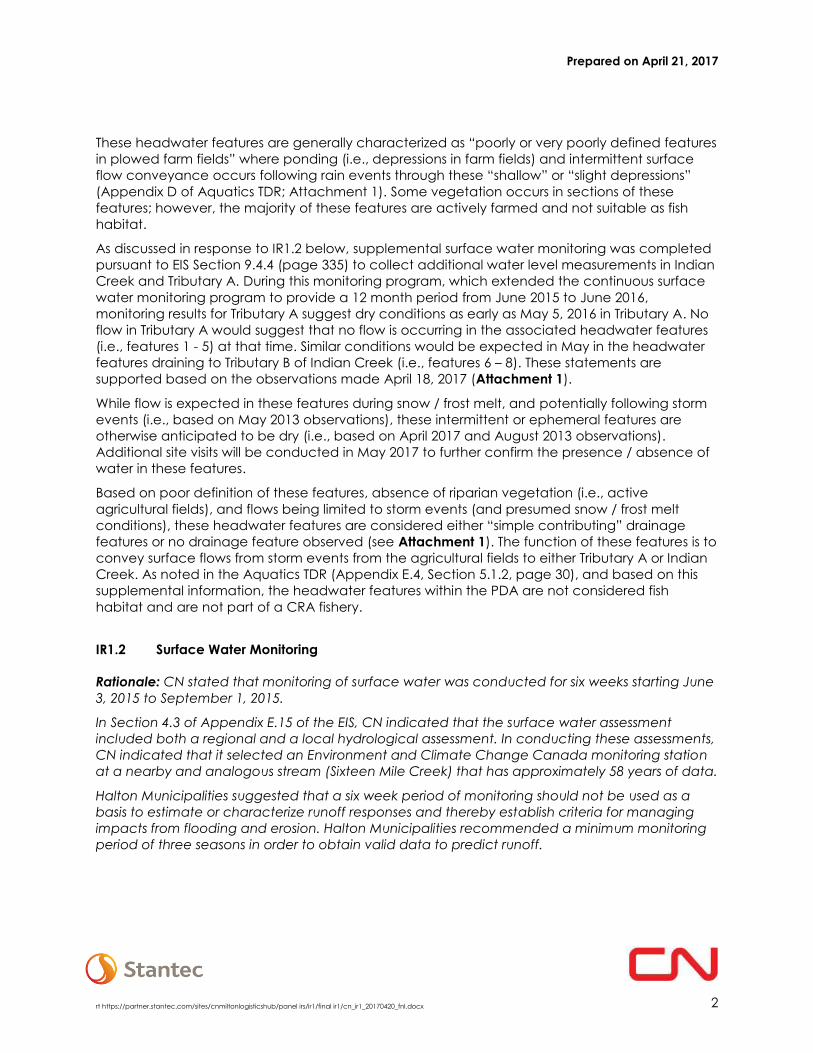
These headwater features are generally characterized as “poorly or very poorly defined features
in plowed farm fields” where ponding (i.e., depressions in farm fields) and intermittent surface
flow conveyance occurs following rain events through these “shallow” or “slight depressions”
(Appendix D of Aquatics TDR; Attachment 1). Some vegetation occurs in sections of these
features; however, the majority of these features are actively farmed and not suitable as fish
habitat.
As discussed in response to IR1.2 below, supplemental surface water monitoring was completed
pursuant to EIS Section 9.4.4 (page 335) to collect additional water level measurements in Indian
Creek and Tributary A. During this monitoring program, which extended the continuous surface
water monitoring program to provide a 12 month period from June 2015 to June 2016,
monitoring results for Tributary A suggest dry conditions as early as May 5, 2016 in Tributary A. No
flow in Tributary A would suggest that no flow is occurring in the associated headwater features
(i.e., features 1 - 5) at that time. Similar conditions would be expected in May in the headwater
features draining to Tributary B of Indian Creek (i.e., features 6 – 8). These statements are
supported based on the observations made April 18, 2017 (Attachment 1).
While flow is expected in these features during snow / frost melt, and potentially following storm
events (i.e., based on May 2013 observations), these intermittent or ephemeral features are
otherwise anticipated to be dry (i.e., based on April 2017 and August 2013 observations).
Additional site visits will be conducted in May 2017 to further confirm the presence / absence of
water in these features.
Based on poor definition of these features, absence of riparian vegetation (i.e., active
agricultural fields), and flows being limited to storm events (and presumed snow / frost melt
conditions), these headwater features are considered either “simple contributing” drainage
features or no drainage feature observed (see Attachment 1). The function of these features is to
convey surface flows from storm events from the agricultural fields to either Tributary A or Indian
Creek. As noted in the Aquatics TDR (Appendix E.4, Section 5.1.2, page 30), and based on this
supplemental information, the headwater features within the PDA are not considered fish
habitat and are not part of a CRA fishery.
IR1.2 Surface Water Monitoring
Rationale: CN stated that monitoring of surface water was conducted for six weeks starting June
3, 2015 to September 1, 2015.
In Section 4.3 of Appendix E.15 of the EIS, CN indicated that the surface water assessment
included both a regional and a local hydrological assessment. In conducting these assessments,
CN indicated that it selected an Environment and Climate Change Canada monitoring station
at a nearby and analogous stream (Sixteen Mile Creek) that has approximately 58 years of data.
Halton Municipalities suggested that a six week period of monitoring should not be used as a
basis to estimate or characterize runoff responses and thereby establish criteria for managing
impacts from flooding and erosion. Halton Municipalities recommended a minimum monitoring
period of three seasons in order to obtain valid data to predict runoff.

Prepared on April 21, 2017
rt https://partner.stantec.com/sites/cnmiltonlogisticshub/panel irs/ir1/final ir1/cn_ir1_20170420_fnl.docx 3
CN used Environment and Climate Change Canada HYDAT data from the 02HB004 hydrometric
station at Sixteen Mile Creek as a proxy to calculate flows for Indian Creek. However, the choice
of proxy stream needs to be clearly justified, in particular with regards to its similarities in size,
proximity and expected flow regime for all ungauged streams where proxy data is used.
Furthermore, flow measurements from the ungauged stream should be used to confirm the
appropriateness and accuracy of the proxy stream hydrograph. These flow measurements
should include a broad range of flow conditions over at least three seasons, and should include
freshet if possible.
The rating curves in Appendix E of Appendix E.15 are based on a limited number of flow
measurements. Few, and in some cases none, of the flow measurements were measured at high
flow as indicated by the level logger results. As a result, the rating curves cannot be accurately
assessed for high flow.
Information Request:
1. Provide flow measurements and continuous water level / calculated flow for a period of
three consecutive seasons (e.g., spring, summer and fall in a given year, including freshet if
possible) for Indian Creek and Tributary A. Flow measurements should include high flow
values (e.g. > 1.0 m3/s for Indian Creek). If this information is not available, collect it.
2. Refine the rating curves and hydrographs for monitoring stations IC2, IC3, and Trib A using
the additional flow measurements including measurements obtained at high flow levels and
measurements obtained during freshet, if possible.
3. Provide justification for the use of HYDAT station 02HB004, Sixteen Mile Creek, for estimating
flows in Indian Creek. Confirm the appropriateness of 02HB004 using measured flow
characteristics and hydrograph from Indian Creek and comparison of these to the HYDAT
station flows.
CN Response:
1. Pursuant to EIS Section 9.4.4 (page 335), supplemental follow-up studies were completed to
collect additional water level and in situ water level and stream velocity measurements in
Indian Creek and Tributary A to further supplement baseline data and confirm seasonal
conditions within surface water features. The additional flow monitoring in Tributary A
(at station TRIB A) and in Indian Creek (at stations IC2 and IC3) captured data in spring,
summer and fall of 2015, and spring 2016.
Including the information contained in the Hydrology TDR (Appendix E.15), continuous water
level data were collected for Tributary A from June 2015 to June 2016 and for Indian Creek
from June to December 2015 and March to June 2016. Additional flow measurements were
collected monthly from September 1, 2015 to December 2015, and during ice-free
conditions approximately monthly from February 2016 to June 2016. Flows in excess of
1.0 m3/s were captured in the supplemental follow-up data for Indian Creek in April 2016.
During January and February, 2016 multiple freeze-thaw and wet weather events resulted in
winter ice break up and overbank flooding. Ice flows and large floating debris caused
deflection of the stilling wells (IC2 and IC3) on Indian Creek. As a result, the IC2 and IC3
stations were temporarily removed until reinstallation in March 2016.
Prepared on April 21, 2017
rt https://partner.stantec.com/sites/cnmiltonlogisticshub/panel irs/ir1/final ir1/cn_ir1_20170420_fnl.docx 4
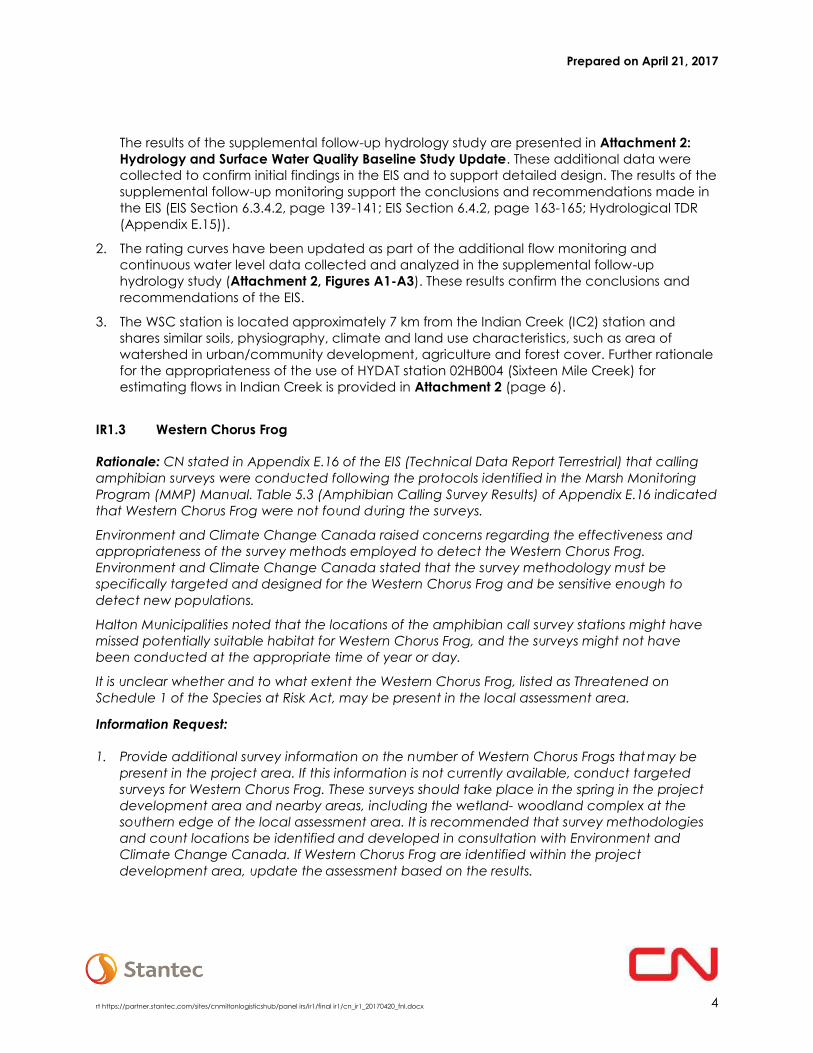
The results of the supplemental follow-up hydrology study are presented in Attachment 2:
Hydrology and Surface Water Quality Baseline Study Update. These additional data were
collected to confirm initial findings in the EIS and to support detailed design. The results of the
supplemental follow-up monitoring support the conclusions and recommendations made in
the EIS (EIS Section 6.3.4.2, page 139-141; EIS Section 6.4.2, page 163-165; Hydrological TDR
(Appendix E.15)).
2. The rating curves have been updated as part of the additional flow monitoring and
continuous water level data collected and analyzed in the supplemental follow-up
hydrology study (Attachment 2, Figures A1-A3). These results confirm the conclusions and
recommendations of the EIS.
3. The WSC station is located approximately 7 km from the Indian Creek (IC2) station and
shares similar soils, physiography, climate and land use characteristics, such as area of
watershed in urban/community development, agriculture and forest cover. Further rationale
for the appropriateness of the use of HYDAT station 02HB004 (Sixteen Mile Creek) for
estimating flows in Indian Creek is provided in Attachment 2 (page 6).
IR1.3 Western Chorus Frog
Rationale: CN stated in Appendix E.16 of the EIS (Technical Data Report Terrestrial) that calling
amphibian surveys were conducted following the protocols identified in the Marsh Monitoring
Program (MMP) Manual. Table 5.3 (Amphibian Calling Survey Results) of Appendix E.16 indicated
that Western Chorus Frog were not found during the surveys.
Environment and Climate Change Canada raised concerns regarding the effectiveness and
appropriateness of the survey methods employed to detect the Western Chorus Frog.
Environment and Climate Change Canada stated that the survey methodology must be
specifically targeted and designed for the Western Chorus Frog and be sensitive enough to
detect new populations.
Halton Municipalities noted that the locations of the amphibian call survey stations might have
missed potentially suitable habitat for Western Chorus Frog, and the surveys might not have
been conducted at the appropriate time of year or day.
It is unclear whether and to what extent the Western Chorus Frog, listed as Threatened on
Schedule 1 of the Species at Risk Act, may be present in the local assessment area.
Information Request:
1. Provide additional survey information on the number of Western Chorus Frogs that may be
present in the project area. If this information is not currently available, conduct targeted
surveys for Western Chorus Frog. These surveys should take place in the spring in the project
development area and nearby areas, including the wetland- woodland complex at the
southern edge of the local assessment area. It is recommended that survey methodologies
and count locations be identified and developed in consultation with Environment and
Climate Change Canada. If Western Chorus Frog are identified within the project
development area, update the assessment based on the results.
Prepared on April 21, 2017
rt https://partner.stantec.com/sites/cnmiltonlogisticshub/panel irs/ir1/final ir1/cn_ir1_20170420_fnl.docx 5
CN Response:
The field survey methodology used to conduct the surveys documented in the Terrestrial TDR
(Appendix E.16) was based on the protocols identified in the Marsh Monitoring Program Manual
(Bird Studies Canada 1994; Bird Studies Canada 2003), including time of year and weather
conditions. However, the amphibian surveys carried out by CN were expanded to provide a
more comprehensive survey of potential amphibians and amphibian habitat within the LAA
than would otherwise be conducted pursuant to the Marsh Monitoring Program (MMP)
protocols. Monitoring stations were located to cover each of the potential amphibian breeding
habitats observed within the LAA; in some cases, more than one station was located per habitat
and some stations were located closer together (i.e., less than 500 m) than is recommended in
the MMP protocols. Modifications to the protocols provided a more thorough characterization of
amphibian habitat and use by targeting all suitable habitats and documenting all species.
Further, any calling amphibians observed were recorded during these surveys, not just those
within 100 m of a station and not only those at pre-determined stations. In these respects, the
amphibian call count surveys conducted were more conservative than (i.e., exceeded the
recommendations of) the MMP protocols.
While targeted daytime surveys for Western Chorus Frog were not conducted, field biologists
were in the Study Area multiple times conducting other surveys during the time of year when
Western Chorus Frogs would be calling (i.e., mid-March to late-May) and documented any
incidental wildlife observations. This included 6+ hours of survey effort on April 30, 2015 and 4+
hours on May 14, 2015 to conduct amphibian egg mass surveys and bat maternity roost
assessments. There were also 5+ hours of survey effort on May 27, 2015 to conduct turtle surveys
and breeding bird surveys. Surveyors were also present on May 11 and May 12, 2015 to conduct
Ecological Land Classification. During these surveys, no Western Chorus Frogs were observed or
heard calling within the LAA.
As requested by the review panel, Stantec, on behalf of CN, has consulted with Environment
and Climate Change Canada (ECCC) regarding Western Chorus Frog survey protocols. In the
absence of established daytime survey protocols for this species, protocols were developed in
consultation with Burke Korol (ECCC) (April 5 and April 18, 2017) and Denise Fell (ECCC)
(April 7, 2017) for this Project (see Attachment 3: Chorus Frog Survey Protocol).
In accordance with these protocols, CN will conduct a minimum of three rounds of daytime
surveys for Western Chorus Frog in April and early-May of 2017 during suitable weather
conditions, following the protocol developed in consultation with ECCC. Similar to surveys
conducted during preparation of the EIS, representatives from the Mississaugas of the New
Credit First Nation (MNCFN) will accompany Stantec biologists during these additional field
surveys.
At this time, three daytime surveys for Western Chorus Frog have been completed within the
PDA and LAA for the Project. No Western Chorus Frogs were observed or heard calling. Upon
completion of the remaining surveys, the results will be provided to the review panel in the form
of a field memorandum and, if necessary (i.e., if Western Chorus Frogs are found to be present),
the assessment of potential effects of the Project on this species will be updated.
Prepared on April 21, 2017
rt https://partner.stantec.com/sites/cnmiltonlogisticshub/panel irs/ir1/final ir1/cn_ir1_20170420_fnl.docx 6
IR1.4 Basking Turtles
Rationale: CN stated in Section 4.6 of Appendix E.16 of the EIS (Technical Data Report Terrestrial)
that three surveys to scan for basking turtles were conducted between May 14 and June 16, 2015.
Two species of turtle were observed within the local assessment area and project development
area including Snapping Turtle, which is listed as Special Concern on Schedule 1 of the Species at
Risk Act.
Halton Municipalities stated that turtle basking surveys are most effective immediately after
turtles emerge from hibernation, as this provides important information on overwintering sites.
Basking turtle surveys should have been conducted in April and early May when basking activity
is highest. Halton Municipalities stated that five surveys under ideal conditions are needed in
order to provide reliable results but only three were conducted.
Due to the timing of the surveys, the number of turtles present may have been underestimated.
In order to better understand how turtles, including the Snapping Turtle and their habitat may be
affected by the project, the Panel requires additional information.
Information Request:
1. Provide additional information on the number of turtles that are present in the project area in
April and early May. If this information is not available, conduct at least five additional
basking turtle surveys in April and May. Update the assessment for turtles based on the results,
as necessary.
CN Response:
The Terrestrial TDR (Section 4.2, Table 4.1, pages 11-12) identifies that basking turtle surveys were
conducted on May 14, May 27 and June 16, 2015. In total, 8 Snapping Turtle observations were
documented (3 in the PDA and 5 in the LAA) (Terrestrial TDR (Section 5.5, Table 5.8, pages 35-36).
Results of prior field surveys suggest a small number of Snapping Turtles are present in the project
area. The number of observed turtles is not intended to be a population estimate. However, it
was assumed that the presence of these individuals in May was evidence of nearby
overwintering habitat, presumably within the agricultural pond on Tributary A (within the PDA)
and within two submerged shallow aquatic features south of the proposed terminal (outside of
the LAA).
As requested by the review panel, to further assess turtle occurrences within the LAA, to update
observations at the pond on Tributary A, and to supplement previous work, five additional turtle
surveys will be completed in April and early May of 2017 following similar protocols as described
in the Terrestrial TDR (Section 4.6, page 14-15). Similar to other surveys, representatives from
MNCFN will accompany Stantec biologists during these additional field surveys.
Upon completion of the turtle surveys, the results will be provided to the review panel in the form
of a field memorandum and the assessment will be updated as necessary.
Prepared on April 21, 2017
rt https://partner.stantec.com/sites/cnmiltonlogisticshub/panel irs/ir1/final ir1/cn_ir1_20170420_fnl.docx 7
IR1.5 Bat Maternity Roosts
Rationale: CN stated in Section 5.6 of Appendix E.16 of the EIS (Technical Data Report Terrestrial)
that a thorough search of the local assessment area was conducted to identify potential bat
maternity colony habitat. A candidate maternity roost habitat was identified for further acoustic
surveys. Subsequent acoustic surveys identified the presence of Little Brown Myotis, which is listed
as Endangered on Schedule 1 of the Species at Risk Act.
Halton Municipalities stated that maternity habitat in trees may be difficult to detect if the visual
inspections are done when the trees are in leaf. It is unclear when the search for habitat was
conducted and whether it included the entire local assessment area.
The number of potential bat maternity colony habitat sites, and subsequently the number of
bats, may have been underestimated. In order to better understand how these species and
their habitat may be affected by the project, the Panel requires additional information.
Information Request:
1. Confirm the timing of the area search conducted to identify candidate maternity roost
habitat and whether this search included the entire local assessment area. If the search did
not include the entire local assessment area, or was conducted when the trees were in leaf,
conduct additional surveys when the trees are not in leaf to identify candidate maternity
roost habitat. Update the assessment of bats based on the results, as necessary.
CN Response
The Terrestrial TDR (Section 4.7.1, page 15) identifies that two bat habitat assessment surveys to
identify potential maternity roosts were conducted within the LAA – one during leaf on
(June 6, 2014) and one during leaf off (April 30, 2016). The surveys covered any candidate
maternity roost habitat within the LAA.
Candidate bat habitat was identified following Ontario Ministry of Natural Resources and
Forestry (MNRF) protocols and acoustic surveys were conducted in June 2015, during which time
six calls (identified as Little Brown Myotis) were documented over a 1-minute period during a
one-hour survey adjacent to the woodland feature to the south of the proposed terminal.
However, the number of individual bats cannot be determined.
Based on the information gathered to date, any candidate maternity roost habitats within the
LAA have been surveyed and no additional surveys are warranted.
IR1.6 Eastern Milksnake
Rationale: CN stated in Section 4.8 of Appendix E.16 of the EIS (Technical Data Report Terrestrial)
that potential snake habitat within the local assessment area was searched using walking
transects on June 6, 2014. While no Eastern Milksnake were observed during surveys, CN noted
that they are likely present. In Section 5.7 of Appendix E.16, CN stated that no specialized snake
habitat components were observed.
Prepared on April 21, 2017
rt https://partner.stantec.com/sites/cnmiltonlogisticshub/panel irs/ir1/final ir1/cn_ir1_20170420_fnl.docx 8
Halton Municipalities and Environment and Climate Change Canada raised concerns regarding
the appropriateness of the timing of the surveys and the methodology used to observe Eastern
Milksnake and identify potential nesting sites. Environment and Climate Change Canada noted
that Eastern Milksnake are very secretive and not likely to be observed unless surveys are
conducted at appropriate times with efforts to attract snakes to locations where they may be
more easily observed such as by placing cover boards in strategic locations prior to conducting
the search.
Environment and Climate Change Canada also stated that Eastern Milksnake will hibernate in a
variety of locations that are likely to be present in the project development area, including:
mammal burrows, hollow logs, gravel or dirt banks, old wells, and old building foundations.
Due to the timing and methodology of the surveys, the presence and number of Eastern
Milksnake may have been underestimated. In order to better understand how the Eastern
Milksnake, listed as Special Concern on Schedule 1 of the Species at Risk Act, and its habitat
may be affected by the project, the Panel requires additional information.
Information Request:
1. Provide further details and rationale for the timing and methodology used by CN when
conducting area searches for specialized snake habitat features and individuals of Eastern
Milksnake.
2. Provide additional information on the number of Eastern Milksnake that may be present in
the project area. If this information is not available, conduct additional snake surveys during
the spring and fall using an appropriate methodology that addresses Environment and
Climate Change Canada’s concerns. Update the assessment for Eastern Milksnake based
on the results, as necessary.
CN Response
Eastern Milksnake is a widespread species; it has been found in every Ontario jurisdiction within
the species range (COSEWIC 2015). The Ontario population is estimated to be much greater
than 10,000 individuals (COSSARO 2016), with a low population density throughout its range
(Rowell 2012). Since submission of the EIS in 2015, COSSARO (2016) found the species was secure
in Ontario, although it has previously experienced declines in the Toronto area. Based on current
knowledge of the species (i.e., low population density), it is anticipated the LAA has the
potential to support only a small number of Eastern Milksnakes.
Eastern Milksnake presence and abundance is difficult to determine because of the secretive
nature of this species and, as a consequence, its low probability of detection (COSEWIC 2015).
Therefore, the approach taken by CN when preparing the EIS did not include conducting
exhaustive field surveys for this species. Instead, the approach taken was to investigate and
identify the presence of the particular habitat features that could support the species. The EIS
also took the protective step of assuming Eastern Milksnake would be present within the LAA,
based on the agricultural landscape within which this species is known to inhabit. In other words,
even though the species was not observed on site, and despite the lack of observed specialized
habitat features, mitigation measures for this species were proposed in the EIS and include
sensitivity education of employees for on-site wildlife encounters and implementation /
enforcement of speed limits on internal roads to reduce potential mortality
(EIS Section 6.5.3.9.2, page 213).
Prepared on April 21, 2017
rt https://partner.stantec.com/sites/cnmiltonlogisticshub/panel irs/ir1/final ir1/cn_ir1_20170420_fnl.docx 9
Refinement of these mitigation measures will occur through the development of the
Environmental Protection Plan, which will identify the components that would be covered under
a training program, such as species identification, methods of delivery (e.g., signage, manuals,
training program), and protocols if species at risk (SAR) are encountered.
Although we have already assumed the Eastern Milksnake will be present, Stantec, on behalf of
CN, has consulted with ECCC to discuss protocols for conducting further survey work in April and
May 2017 to supplement the information record available for the Panel. Such surveys will be
conducted using cover boards targeting potential hibernation areas / features, with the number
of individuals and species to be recorded through regular site visits in April and May, 2017.
Upon completion of the snake cover board surveys, the results will be provided to the review
panel in the form of a field memorandum and the assessment will be updated as necessary.

Prepared on April 21, 2017
rt https://partner.stantec.com/sites/cnmiltonlogisticshub/panel irs/ir1/final ir1/cn_ir1_20170420_fnl.docx
ATTACHMENT 1:
OVERVIEW OF HEADWATER CHANNEL
DIMENSIONS AND CHARACTERISTICS
(APRIL 20, 2017)
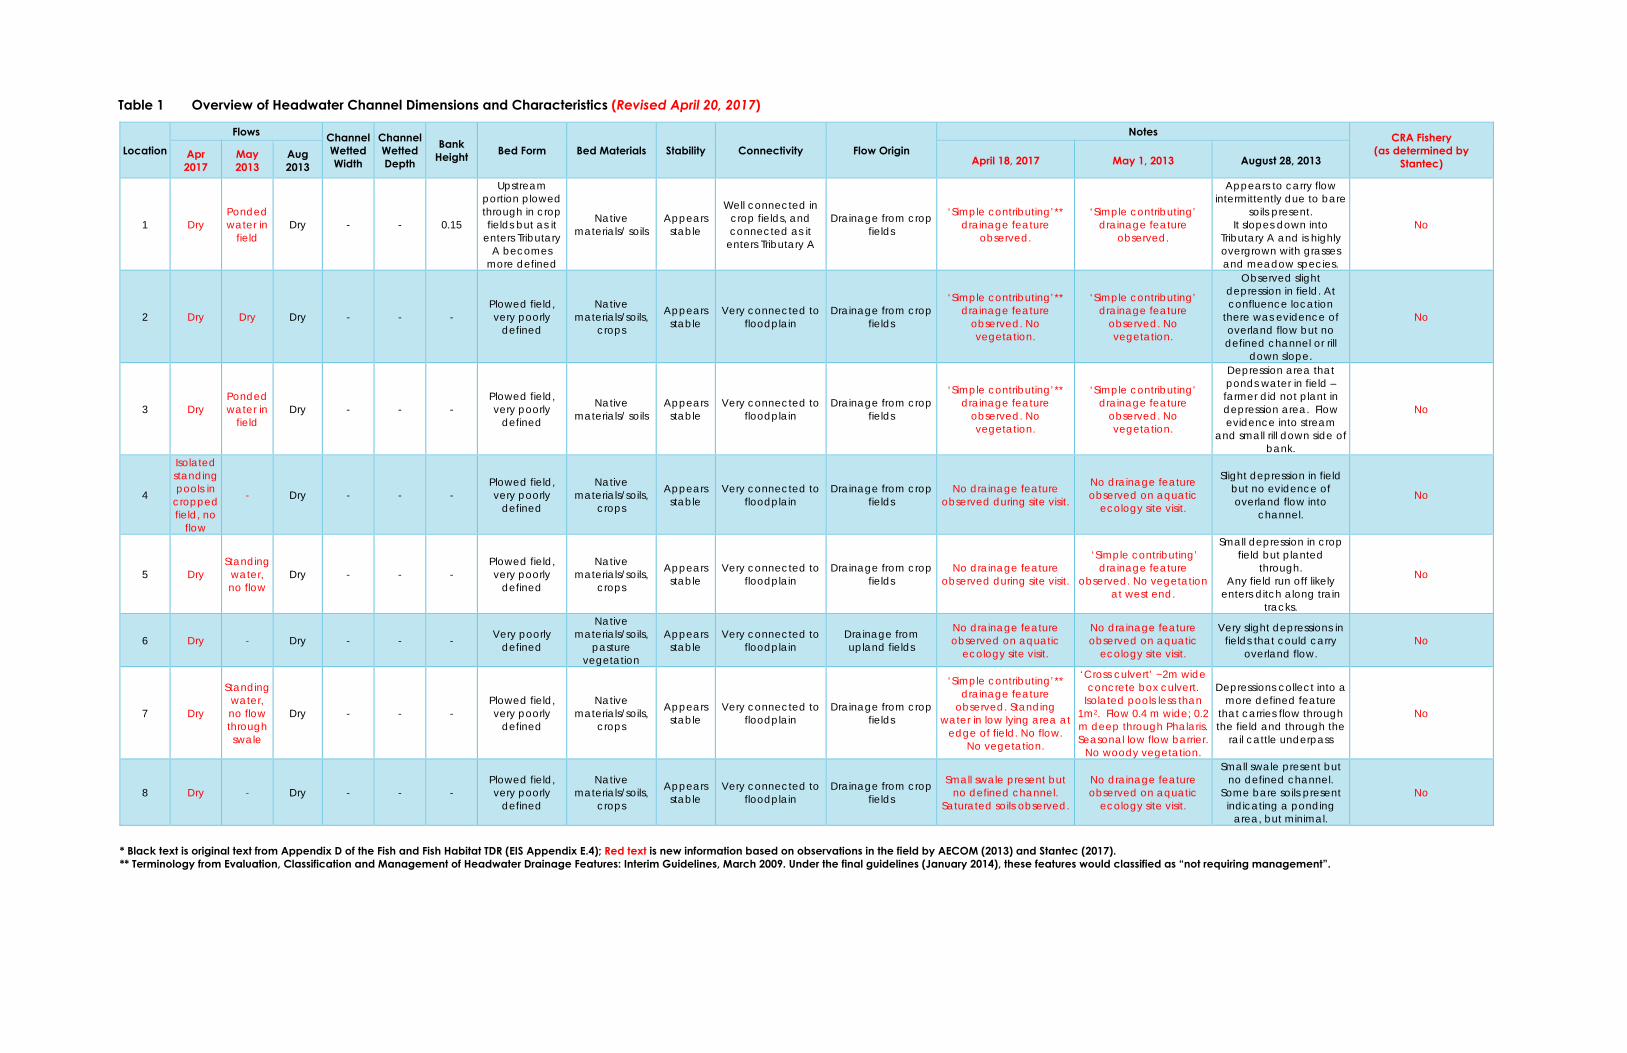
Table 1 Overview of Headwater Channel Dimensions and Characteristics (Revised April 20, 2017)
* Black text is original text from Appendix D of the Fish and Fish Habitat TDR (EIS Appendix E.4); Red text is new information based on observations in the field by AECOM (2013) and Stantec (2017). ** Terminology from Evaluation, Classification and Management of Headwater Drainage Features: Interim Guidelines, March 2009. Under the final guidelines (January 2014), these features would classified as “not requiring management”.
Location Flows Channel
Wetted Width
Channel Wetted Depth
Bank Height Bed Form Bed Materials Stability Connectivity Flow Origin
Notes CRA Fishery (as determined by
Stantec) Apr 2017
May 2013
Aug 2013 April 18, 2017 May 1, 2013 August 28, 2013
1 Dry Ponded water in
field Dry - - 0.15
Upstream portion plowed through in crop fields but as it
enters Tributary A becomes
more defined
Native materials/ soils
Appears stable
Well connected in crop fields, and connected as it
enters Tributary A
Drainage from crop fields
‘Simple contributing’** drainage feature
observed.
‘Simple contributing’ drainage feature
observed.
Appears to carry flow intermittently due to bare
soils present. It slopes down into
Tributary A and is highly overgrown with grasses and meadow species.
No
2 Dry Dry Dry - - - Plowed field, very poorly
defined
Native materials/soils,
crops
Appears stable
Very connected to floodplain
Drainage from crop fields
‘Simple contributing’** drainage feature
observed. No vegetation.
‘Simple contributing’ drainage feature
observed. No vegetation.
Observed slight depression in field. At confluence location
there was evidence of overland flow but no defined channel or rill
down slope.
No
3 Dry Ponded water in
field Dry - - -
Plowed field, very poorly
defined
Native materials/ soils
Appears stable
Very connected to floodplain
Drainage from crop fields
‘Simple contributing’** drainage feature
observed. No vegetation.
‘Simple contributing’ drainage feature
observed. No vegetation.
Depression area that ponds water in field – farmer did not plant in depression area. Flow evidence into stream
and small rill down side of bank.
No
4
Isolated standing pools in
cropped field, no
flow
- Dry - - - Plowed field, very poorly
defined
Native materials/soils,
crops
Appears stable
Very connected to floodplain
Drainage from crop fields
No drainage feature observed during site visit.
No drainage feature observed on aquatic
ecology site visit.
Slight depression in field but no evidence of overland flow into
channel.
No
5 Dry Standing
water, no flow
Dry - - - Plowed field, very poorly
defined
Native materials/soils,
crops
Appears stable
Very connected to floodplain
Drainage from crop fields
No drainage feature observed during site visit.
‘Simple contributing’ drainage feature
observed. No vegetation at west end.
Small depression in crop field but planted
through. Any field run off likely
enters ditch along train tracks.
No
6 Dry - Dry - - - Very poorly defined
Native materials/soils,
pasture vegetation
Appears stable
Very connected to floodplain
Drainage from upland fields
No drainage feature observed on aquatic
ecology site visit.
No drainage feature observed on aquatic
ecology site visit.
Very slight depressions in fields that could carry
overland flow. No
7 Dry
Standing water, no flow through swale
Dry - - - Plowed field, very poorly
defined
Native materials/soils,
crops
Appears stable
Very connected to floodplain
Drainage from crop fields
‘Simple contributing’** drainage feature
observed. Standing water in low lying area at
edge of field. No flow. No vegetation.
‘Cross culvert’ ~2m wide concrete box culvert.
Isolated pools less than 1m2. Flow 0.4 m wide; 0.2 m deep through Phalaris. Seasonal low flow barrier.
No woody vegetation.
Depressions collect into a more defined feature
that carries flow through the field and through the
rail cattle underpass
No
8 Dry - Dry - - - Plowed field, very poorly
defined
Native materials/soils,
crops
Appears stable
Very connected to floodplain
Drainage from crop fields
Small swale present but no defined channel.
Saturated soils observed.
No drainage feature observed on aquatic
ecology site visit.
Small swale present but no defined channel.
Some bare soils present indicating a ponding
area, but minimal.
No

CN – Milton Logistics HubSupplemental Site Reconnaissance Photos
May 1, 2013
Attch1b_PhotoLog-AECOM-2017-04-18.docx 1
Headwater Feature #1: ponded water from agricultural
field, channel entering Tributary A (looking northwest)
(Photo 347)
Headwater Feature #1: ponded water in agricultural field
(looking west)
(Photo 348)
Headwater Feature #1: ponded water in agricultural field
(looking west)
(Photo 370)
Headwater Feature #5: ponded water in agricultural field
(looking east)
(Photo 360)

CN – Milton Logistics HubSupplemental Site Reconnaissance Photos
May 1, 2013
Attch1b_PhotoLog-AECOM-2017-04-18.docx 2
Headwater Feature #5; ponded water in agricultural field
(looking northeast)
(Photo 361)
Headwater Feature #5: ponded water in channel between
two agricultural fields (looking northwest)
(Photo 362)
Headwater Feature #5: ponded water in agricultural field
(looking northwest)
(Photo 363)
Headwater Tributary #5: phalaris / graminoid-dominated
ditch along south side of CN mainline (looking north)
(Photo 364)
CN – Milton Logistics HubSupplemental Site Reconnaissance Photos
May 1, 2013
Attch1b_PhotoLog-AECOM-2017-04-18.docx 3
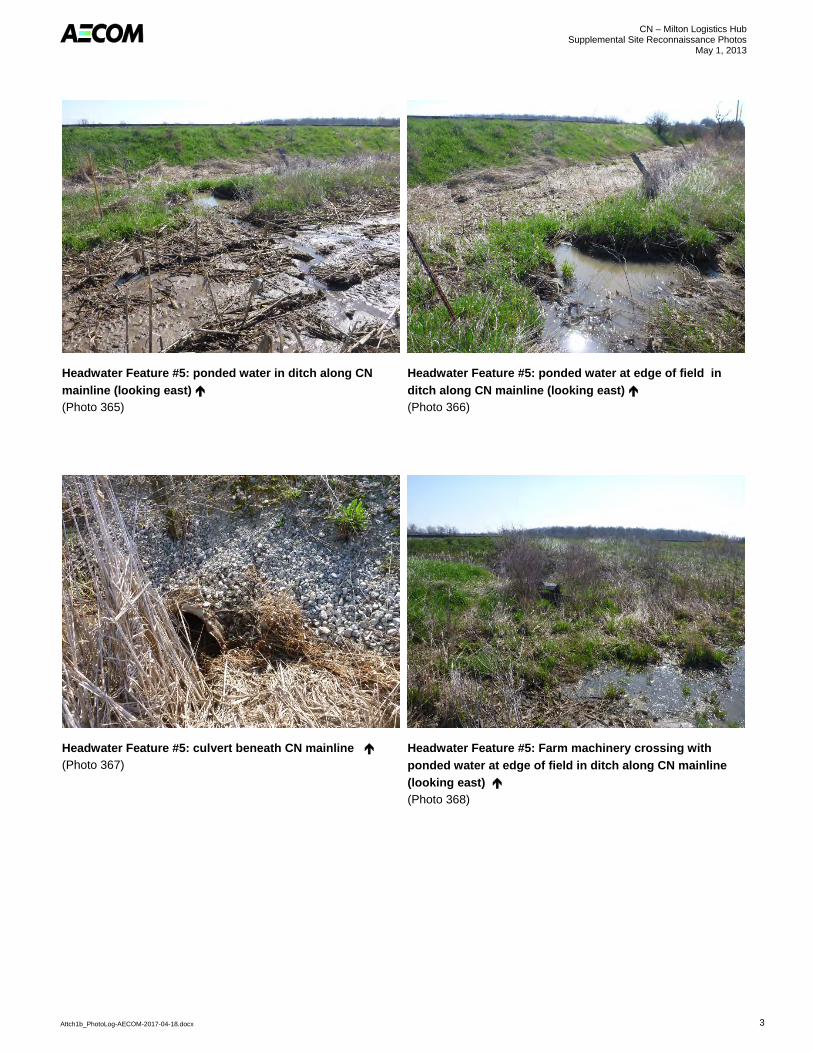
Headwater Feature #5: ponded water in ditch along CN
mainline (looking east)
(Photo 365)
Headwater Feature #5: ponded water at edge of field in
ditch along CN mainline (looking east)
(Photo 366)
Headwater Feature #5: culvert beneath CN mainline
(Photo 367) Headwater Feature #5: Farm machinery crossing with
ponded water at edge of field in ditch along CN mainline
(looking east)
(Photo 368)

CN – Milton Logistics HubSupplemental Site Reconnaissance Photos
May 1, 2013
Attch1b_PhotoLog-AECOM-2017-04-18.docx 4
Headwater Feature #5: ponded water in agricultural field
(looking southwest)
(Photo 369)
Headwater Feature #7: ponded water at edge of field
adjacent to CN mainline (looking east)
(Photo 404)
Headwater Feature #7: swale through agricultural field at
adjacent to CN mainline (looking southeast)
(Photo 405)
Headwater Feature #7: swale through agricultural field
(looking south)
(Photo 406)
CN – Milton Logistics HubSupplemental Site Reconnaissance Photos
May 1, 2013
Attch1b_PhotoLog-AECOM-2017-04-18.docx 5
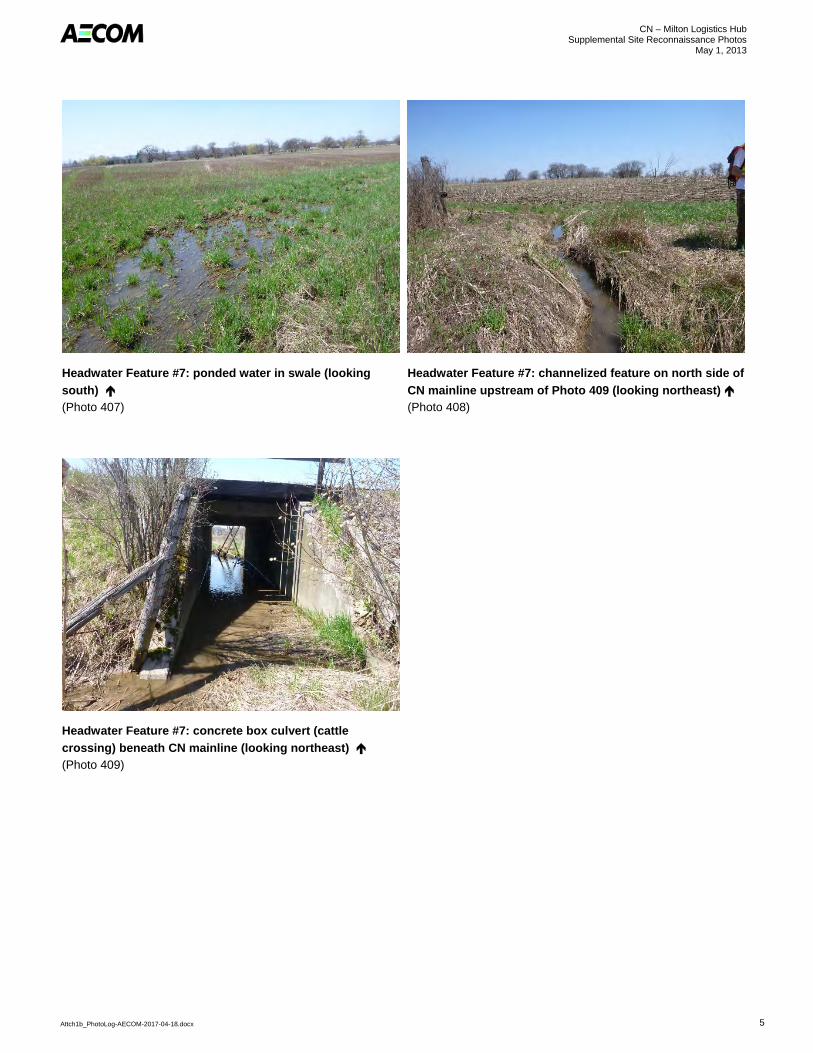
Headwater Feature #7: ponded water in swale (looking
south)
(Photo 407)
Headwater Feature #7: channelized feature on north side of
CN mainline upstream of Photo 409 (looking northeast)
(Photo 408)
Headwater Feature #7: concrete box culvert (cattle
crossing) beneath CN mainline (looking northeast)
(Photo 409)

CN – Milton Logistics Hub Supplemental Site Reconnaissance Photos
April 2017
Attch1b_Photolog-AECOM-20170421.Docx 1
Headwater Feature #2: facing upstream; April 2017 (Photo 4349)
Headwater Feature #2: facing upstream; April 2017 (Photo 4367)
Headwater Feature #3: overvi ew; April 2017 (Photo 4329)
Headwater Feature #4: overvi ew; April 2017 (Photo 4364)

CN – Milton Logistics Hub Supplemental Site Reconnaissance Photos
April 2017
Attch1b_Photolog-AECOM-20170421.Docx 2
Headwater Feature #4; facing upstream; April 2017 (Photo 4365)
Headwater Feature #5: overvi ew; April 2017 (Photo 4354)
Headwater Feature #5: alte rnate overview; April 2017 (Photo 4355)
Headwater Trib utary #6: overview; April 2017 (Photo 4324)

CN – Milton Logistics Hub Supplemental Site Reconnaissance Photos
April 2017
Attch1b_Photolog-AECOM-20170421.Docx 3
Headwater Feature #6: alte rnate overview; April 2017 (Photo 4325)
Headwater Feature #7: facing upstream; April 2017 (Photo 4322)
Headwater Feature #8: facing upstream; April 2017 (Photo 4323)
Prepared on April 21, 2017
rt https://partner.stantec.com/sites/cnmiltonlogisticshub/panel irs/ir1/final ir1/cn_ir1_20170420_fnl.docx
ATTACHMENT 2:
HYDROLOGY AND SURFACE WATER
QUALITY BASELINE STUDY UPDATE

Memo
cn \\cd1215-f01\work_group\01609\active\160960844\planning\correspondence\ceaa ea review process\phase 2 - panel\ir1\attachments\attch2_mem_sw_baseline_study_update_20170420.docx
To: France Moreau From: Andrew Sinclair / Sheldon Smith
CN Stantec Markham Office
File: 160960844 Date: April 20, 2017
Reference: CN Milton Logistics Hub - Hydrology and Surface Water Quality Baseline Study Update
(June 2015 to June 2016)
INTRODUCTION
Stantec Consulting Ltd. (Stantec) has been retained by the Canadian National Railway Company (CN) to conduct the hydrology and surface water quality baseline study and effects assessment for the Milton Logistics Hub (the Project) in the Town of Milton, within the Regional Municipality of Halton, Ontario.
In support of the Milton Logistics Hub Environmental Impact Statement (EIS) (Stantec 2015a) Stantec reported existing baseline information contained in the Milton Logistics Hub Technical Data Report - Hydrology and Surface Water Quality Baseline Study and Effects Assessment (Appendix E.15 of the EIS). The Assessment, referred to herein as the Hydrology TDR (Stantec 2015b), was submitted in December 2015 with the EIS pursuant to the Canadian Environmental Assessment Act, 2012 and the Guidelines for the Preparation of an Environmental Impact Statement – Milton Logistics Hub Project (EIS Guidelines) (CEAA 2015). The Hydrology TDR characterized surface water conditions based on existing background information and field investigations conducted between June and September 2015.
Pursuant to EIS Section 9.4.4 (page 335), supplemental follow-up studies were completed to collect additional water quality, water levels and in-situ water level and stream velocity measurements on a monthly basis from October to November 2015. This monitoring program was continued to June 2016 to further supplement baseline data and confirm seasonal conditions within surface water features. The full study period for this project was from June 2015 to June 2016.
As such, the information presented within this memo is intended to provide an update to the climate, hydrology and surface water quality data (June to September 2015) presented in the Hydrology TDR (Stantec 2015b) with additional field data collected for the period October 2015 to June 2016. This information is intended to confirm the assessment of potential environmental effects and the follow-up commitments provided in the EIS, and should be read in conjunction with the EIS and the Hydrology TDR (Stantec 2015a, 2015b).
CLIMATE
Methods
As noted in Section 4.3.1 of the Hydrology TDR, the Toronto Lester B. Pearson International Airport station (Toronto Pearson station) (station #6158733) provides comprehensive year-round monitoring with a long period of record for characterizing long-term climate conditions in the RAA and LAA. To supplement baseline conditions, additional data was obtained from the Toronto Pearson station for the period from October 2015 to June 2016.
April 20, 2017 France Moreau Page 2 of 14
Reference: CN Milton Logistics Hub - Hydrology and Surface Water Quality Baseline Study Update
(June 2015 to June 2016)
cn \\cd1215-f01\work_group\01609\active\160960844\planning\correspondence\ceaa ea review process\phase 2 - panel\ir1\attachments\attch2_mem_sw_baseline_study_update_20170420.docx
Results
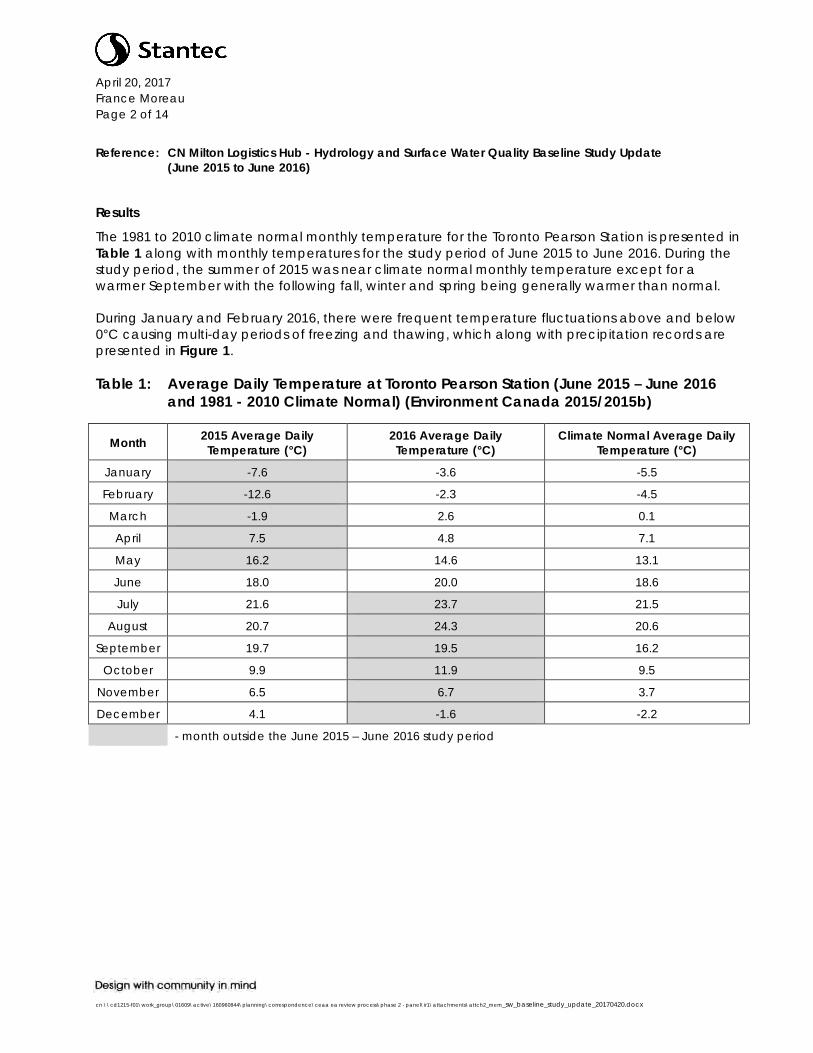
The 1981 to 2010 climate normal monthly temperature for the Toronto Pearson Station is presented in Table 1 along with monthly temperatures for the study period of June 2015 to June 2016. During the study period, the summer of 2015 was near climate normal monthly temperature except for a warmer September with the following fall, winter and spring being generally warmer than normal.
During January and February 2016, there were frequent temperature fluctuations above and below 0°C causing multi-day periods of freezing and thawing, which along with precipitation records are presented in Figure 1.
Table 1: Average Daily Temperature at Toronto Pearson Station (June 2015 – June 2016
and 1981 - 2010 Climate Normal) (Environment Canada 2015/2015b)
Month 2015 Average Daily
Temperature (°C)
2016 Average Daily
Temperature (°C)
Climate Normal Average Daily
Temperature (°C)
January -7.6 -3.6 -5.5
February -12.6 -2.3 -4.5
March -1.9 2.6 0.1
April 7.5 4.8 7.1
May 16.2 14.6 13.1
June 18.0 20.0 18.6
July 21.6 23.7 21.5
August 20.7 24.3 20.6
September 19.7 19.5 16.2
October 9.9 11.9 9.5
November 6.5 6.7 3.7
December 4.1 -1.6 -2.2
- month outside the June 2015 – June 2016 study period
April 20, 2017 France Moreau Page 3 of 14
Reference: CN Milton Logistics Hub - Hydrology and Surface Water Quality Baseline Study Update
(June 2015 to June 2016)
cn \\cd1215-f01\work_group\01609\active\160960844\planning\correspondence\ceaa ea review process\phase 2 - panel\ir1\attachments\attch2_mem_sw_baseline_study_update_20170420.docx
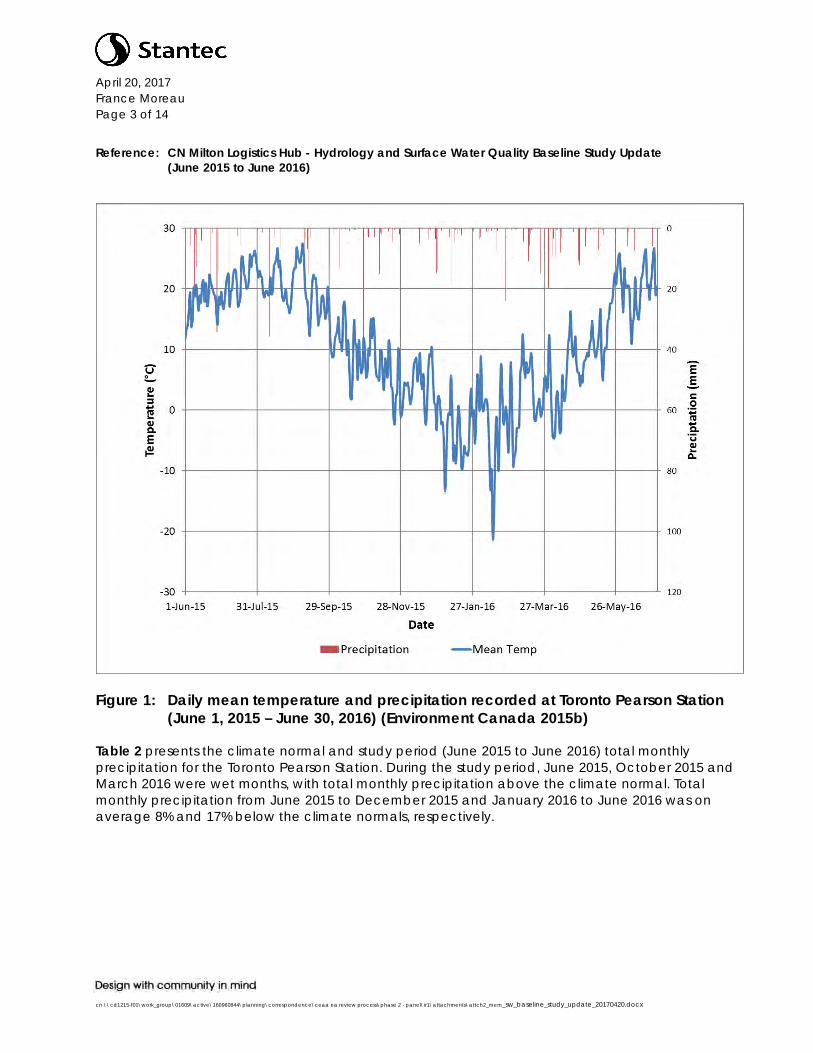
Figure 1: Daily mean temperature and precipitation recorded at Toronto Pearson Station
(June 1, 2015 – June 30, 2016) (Environment Canada 2015b)
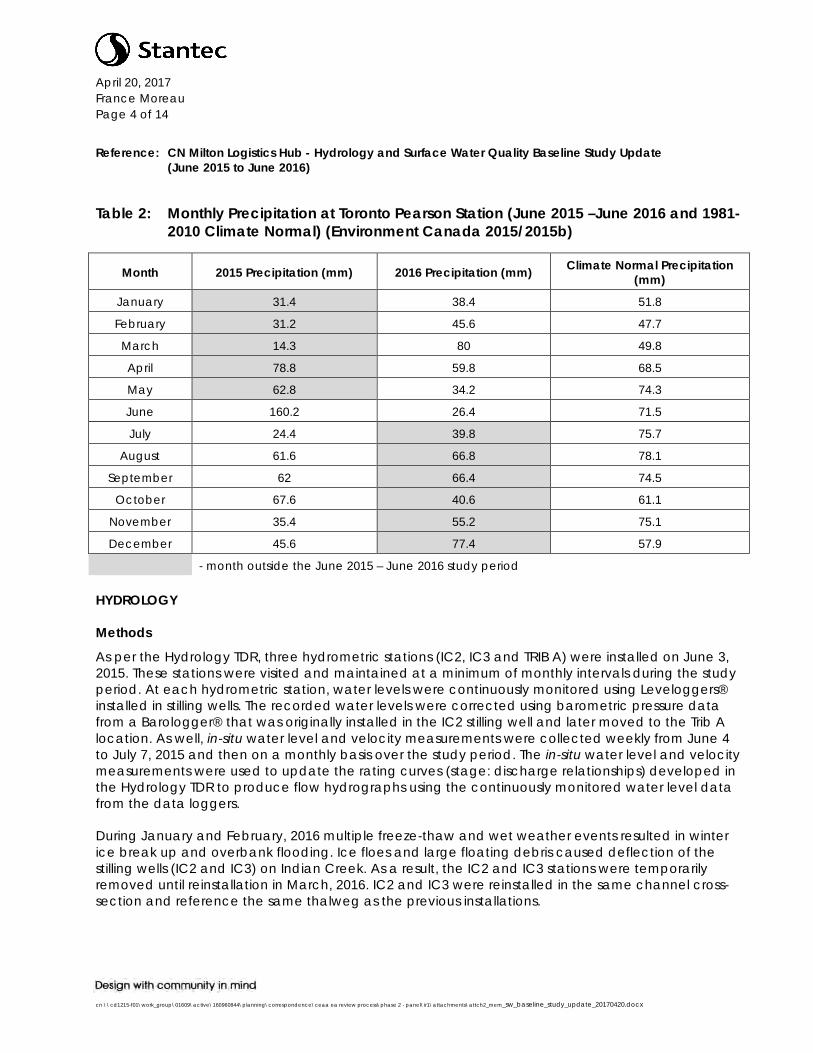
Table 2 presents the climate normal and study period (June 2015 to June 2016) total monthly precipitation for the Toronto Pearson Station. During the study period, June 2015, October 2015 and March 2016 were wet months, with total monthly precipitation above the climate normal. Total monthly precipitation from June 2015 to December 2015 and January 2016 to June 2016 was on average 8% and 17% below the climate normals, respectively.
April 20, 2017 France Moreau Page 4 of 14
Reference: CN Milton Logistics Hub - Hydrology and Surface Water Quality Baseline Study Update
(June 2015 to June 2016)
cn \\cd1215-f01\work_group\01609\active\160960844\planning\correspondence\ceaa ea review process\phase 2 - panel\ir1\attachments\attch2_mem_sw_baseline_study_update_20170420.docx
Table 2: Monthly Precipitation at Toronto Pearson Station (June 2015 –June 2016 and 1981-
2010 Climate Normal) (Environment Canada 2015/2015b)
Month 2015 Precipitation (mm) 2016 Precipitation (mm) Climate Normal Precipitation
(mm)
January 31.4 38.4 51.8
February 31.2 45.6 47.7
March 14.3 80 49.8
April 78.8 59.8 68.5
May 62.8 34.2 74.3
June 160.2 26.4 71.5
July 24.4 39.8 75.7
August 61.6 66.8 78.1
September 62 66.4 74.5
October 67.6 40.6 61.1
November 35.4 55.2 75.1
December 45.6 77.4 57.9
- month outside the June 2015 – June 2016 study period
HYDROLOGY
Methods
As per the Hydrology TDR, three hydrometric stations (IC2, IC3 and TRIB A) were installed on June 3, 2015. These stations were visited and maintained at a minimum of monthly intervals during the study period. At each hydrometric station, water levels were continuously monitored using Leveloggers® installed in stilling wells. The recorded water levels were corrected using barometric pressure data from a Barologger® that was originally installed in the IC2 stilling well and later moved to the Trib A location. As well, in-situ water level and velocity measurements were collected weekly from June 4 to July 7, 2015 and then on a monthly basis over the study period. The in-situ water level and velocity measurements were used to update the rating curves (stage: discharge relationships) developed in the Hydrology TDR to produce flow hydrographs using the continuously monitored water level data from the data loggers.
During January and February, 2016 multiple freeze-thaw and wet weather events resulted in winter ice break up and overbank flooding. Ice floes and large floating debris caused deflection of the stilling wells (IC2 and IC3) on Indian Creek. As a result, the IC2 and IC3 stations were temporarily removed until reinstallation in March, 2016. IC2 and IC3 were reinstalled in the same channel cross-section and reference the same thalweg as the previous installations.
April 20, 2017 France Moreau Page 5 of 14
Reference: CN Milton Logistics Hub - Hydrology and Surface Water Quality Baseline Study Update
(June 2015 to June 2016)
cn \\cd1215-f01\work_group\01609\active\160960844\planning\correspondence\ceaa ea review process\phase 2 - panel\ir1\attachments\attch2_mem_sw_baseline_study_update_20170420.docx
Results
The IC2 and IC3 flow rating curves developed in the Hydrology TDR were updated for each site with the field collected in-situ water level, velocity and flow data from October 2015 to December 2015 and March 2016 to June 2016, as presented in Attachment A (Figures A1 to A3).
The magnitude of the in-situ measured flows for the above monitoring period in Indian Creek (at IC2 and IC3) ranged from low flow periods to higher flows following rainfall events. The IC2 and IC3 June to September 2015 monitoring period rating curves were derived using fitted exponential functions. The revised full study period rating curve equation for IC2 and IC3 with the best fit was a 2nd order polynomial regression function fitted with a 0 m3/s intercept (Attachment A, Figures A2 and A3). The difference between the June to September 2015 and full study period rating curves were assessed by calculating the percent bias (PBIAS). The optimized PBIAS is an absolute value that approaches 0. A negative PBIAS value indicates overestimation bias while a positive PBIAS value indicates underestimation bias. The calculated June – September 2015 rating curve PBIAS results for IC2 and IC3 were -10.5 and -23.7%, respectively, indicating an increase in predicted flow rate values when compared to the June 2015 to June 2016 rating curves.
The IC2 monitoring station was installed along Indian Creek downstream of where the watercourse enters the Project Development Area (PDA) and downstream of the Tributary A discharge. The highest observed instantaneous flows during the June 2015 to June 2016 monitored period occurred on March 31, April 1 and April 7, 2016 exceeding the rating curve prediction limit of within 0.2 m of the maximum measured water depth. The IC2 2015 to 2016 fall-winter-spring data was appended to previous data and is presented in Attachment A (Figure A2).
Monitoring station IC3 was installed along Indian Creek just upstream of where the watercourse flows under Tremaine Road and leaves the PDA. The highest observed instantaneous flows during the June 2015 to June 2016 monitored period occurred on March 31, April 1 and April 7, 2016 with flows exceeding the rating curve prediction limit of within 0.2 m of the maximum measured water depth. The IC3 2015 to2016 fall-winter-spring data was appended to previous data and is presented in Attachment A (Figure A3).
Both IC2 and IC3 are located on Indian Creek and show similar flow patterns during the fall-winter-spring period with high flows associated with rainfall and snowmelt events. The winter of 2016 was marked by multiple periods of snow accumulation intervaled by melt and rainfall events (Figure 1). Review of records from Toronto Pearson Station indicate as many as seven periods from January 1 to April 11, 2016 when melting and rainfall had reduced snow-on-ground accumulations to nil. The hydrograph depicts a seasonal increase of flows in IC2 and IC3 in the spring, but due to low precipitation has not seen the same magnitude of flows observed in 2015.
The TRIB A flow rating curve was updated with the field collected in-situ water level, velocity and flow data from October 2015 to June 2016 as presented in Attachment A (Figure A1). The TRIB A June to September 2015 monitoring period rating curve was derived using a fitted exponential function. The revised full study period rating curve equation for TRIB A with the best fit was a 2nd order polynomial regression function fitted with a 0 m3/s intercept. The PBIAS difference between the June to September 2015 is -24.4% indicating an increase in predicted flow rate values at the two stations

April 20, 2017 France Moreau Page 6 of 14
Reference: CN Milton Logistics Hub - Hydrology and Surface Water Quality Baseline Study Update
(June 2015 to June 2016)
cn \\cd1215-f01\work_group\01609\active\160960844\planning\correspondence\ceaa ea review process\phase 2 - panel\ir1\attachments\attch2_mem_sw_baseline_study_update_20170420.docx
using the June 2015 to June 2016 rating curve. The magnitude of the in-situ measured flows for the October 2015 to June 2016 monitoring period at TRIB A were during relatively low flow periods (TRIB A was completely dry during monitoring visits on May 26, 2016 and June 22, 2016).
The monitoring station at Tributary A is installed downstream of the on-line agricultural pond and upstream of the discharge point into Indian Creek. Barometric data from the Toronto Pearson Station (Environment Canada 2016) was used to correct the water level readings from January 9 to March 4, 2016 when the Barologger® was not recording at IC2 due to IC2 temporary suspension. No field in-situ water depth, velocity and flow measurement were made from January 10 to March 4, 2016. Thus, only water depth rating curve derived flows are presented at the TRIB A station for this period.
Several site visits to TRIB A in February and March 2016 visually confirmed ice-free conditions from February 29 to March 30, 2016. The highest observed instantaneous flow during the June 2015 to June 2016 monitored period was on January 10, 2016 (0.36 m3/s). The lowest occurred on August 5, 2015, September 1, 2015, May 26, 2016 and June 22, 2016 when TRIB A was visually observed to have no flow. The hydrograph from the 2015 to 2016 monitored period is presented in Attachment A
(Figure A1). The hydrograph depicts a seasonal increase in flows in October, overwinter flow conditions characterized by multiple melt and wet weather precipitation events and decrease in flow in May 2016 when eventually TRIB A flows ceased.
Benchmarks
To observe if any movements have occurred to the stilling wells that contain the Leveloggers® (i.e., IC2, IC3 and TRIB A monitoring stations), a three-dimensional benchmark network was set up at each station site. The relative difference in elevation between the stilling well and corresponding benchmarks are calculated to determine if any vertical movement to the stilling well/ Leveloggers® occurred. The benchmarks are 3 feet (ft) long rebar rods that were hammered into the ground and marked with a wooden stake. The elevations of the benchmarks and stilling wells were measured using a rod and level when they were installed. The rod has solid vertical intervals of 1 cm and the rod and level approach has an accuracy of ± 1 cm. Apart from the stilling well deflection noted above resulting from January and February, 2016 ice flows and debris flow, vertical and horizontal benchmarking indicated no change to the stilling well observations.
Regional HYDAT Station Watershed Characteristics and Flow Assessment
Section 4.3.2 of the Hydrology TDR described the selection process for the Regional hydrometric station (Water Survey of Canada (WSC) station 02HB004 (East Sixteen Mile Creek Near Omagh), to characterize regional hydrologic conditions. The following is an additional assessment of the suitability of the selected Regional hydrometric station 02HB004, which is based on:
• IC2/IC3 and 02HB004 sub-watershed drainage, land use, physiography and soil characteristics comparison
• Flow characteristics comparison with the June 2015 to June 2016 observed flow data available for IC2 and IC3 on Indian Creek

April 20, 2017 France Moreau Page 7 of 14
Reference: CN Milton Logistics Hub - Hydrology and Surface Water Quality Baseline Study Update
(June 2015 to June 2016)
cn \\cd1215-f01\work_group\01609\active\160960844\planning\correspondence\ceaa ea review process\phase 2 - panel\ir1\attachments\attch2_mem_sw_baseline_study_update_20170420.docx
Table 3 presents the watershed characteristics of the IC3 and 02HB004 sub-watersheds with the general watershed characteristics and land uses generated by the Ontario Ministry of Natural Resources and Forestry (MNRF) Ontario Flow Assessment Tools, version III (OFAT). As presented in Section 5.3 of the Hydrology TDR, the watershed characteristics of the IC2 and IC3 sub-watersheds are similar enough that direct comparison of only the larger IC3 sub-watershed is sufficient for watershed characteristic comparison purposes. The physiography and soils were identified using the Chapman, L.J. and Putnam, D.F. 2007. Physiography of southern Ontario from the Ontario Geological Survey (Data 228) and Soils Ontario Geographic Information System (GIS) layers (Agriculture and Agri-Food Canada and Ontario Ministry of Natural Resources 2004), respectively.
Table 3: IC3 and 02HB004 Watershed Characteristics
Characteristics Units Indian Creek at Tremaine
Road exiting PDA
02HB004 East Sixteen Mile
Creek Near Omagh
Watershed Area km2 34.8 192.99
Station Separation km 6.1 km between stations
Mean Elevation m above sea level (asl) 202.1 233.4
Max Elevation m asl 329.4 385.6
Channel Slope m/km 7.97 2.94
Average Watershed Slope m/km 22.82 21.22
Mean Temperature °C 8.1 7.93
Annual Precipitation mm 843 837
Land Uses
Water % 0.1 0.3
Wetland/Swamp/Marsh % 2.8 5.6
Deciduous/Coniferous/ Mixed Forest
% 8.0 10.8
Hedge Rows % 1.6 1.0
Community/ Infrastructure % 12.4 15.8
Agriculture/Rural % 75.1 66.5
Physiography
Bevelled Till Plains % 81.9 43.1
Drumlins % - 0.9
Escarpments % 11.7 7.6
Limestone Plains % 0.7 6.9
Sand Plains % - 8.1
Spillways % 0.9 1.7

April 20, 2017 France Moreau Page 8 of 14
Reference: CN Milton Logistics Hub - Hydrology and Surface Water Quality Baseline Study Update
(June 2015 to June 2016)
cn \\cd1215-f01\work_group\01609\active\160960844\planning\correspondence\ceaa ea review process\phase 2 - panel\ir1\attachments\attch2_mem_sw_baseline_study_update_20170420.docx
Table 3: IC3 and 02HB004 Watershed Characteristics
Characteristics Units Indian Creek at Tremaine
Road exiting PDA
02HB004 East Sixteen Mile
Creek Near Omagh
Till Moraines % 4.8 2.5
Till Plains (Drumlinized) % - 29.2
Soils
Berrien Sandy Loam % - 3
Bottom Land % - 1
Brisbane Loam % 1 -
Brady Sandy Loam % - 1
Built Up Area % - 10
Burford Loam % - 3
Chinguacousy Clay Loam % 59 36
Escarpment % 1 0
Farmington Loam % 2 6
Font Sandy Loam % 3 1
Gilford Loam % 5 -
Grimsby Sandy Loam % - 2
Guelph Loam % 4 5
Jeddo Clay Loam % 8 8
Oneida Clay Loam % 16 10
Oneida Silt Loam % - 12
Organics – Mesisol % - 1
Tuscola Silt Loam % - 1
The IC2 (sub-watershed area of 32.3 km2) and IC3 sub-watersheds are within one order of magnitude in area value of the 02HB004 sub-watershed area (Table 3). The IC3 sub-watershed has a steeper average channel slope then the 02HB004 sub-watershed, but similar average watershed slopes. The OFAT III generated mean temperature and average precipitation values are relatively close in value for the IC3 and 02HB004 sub-watersheds. The land uses and their percentage area composition within the IC3 and 02HB004 sub-watersheds are all relatively close in value with IC3 having 10% more agricultural land use area then 02HB004.
The physiography characteristics for the IC3 and 02HB004 sub-watersheds have the dominant type being till plains with percent area compositions of 81.9 and 72.3%, respectively. The 02HB004 has approximately 8.1% of its sub-watershed as sand plains, which is not present in the IC3 sub-watershed.

April 20, 2017 France Moreau Page 9 of 14
Reference: CN Milton Logistics Hub - Hydrology and Surface Water Quality Baseline Study Update
(June 2015 to June 2016)
cn \\cd1215-f01\work_group\01609\active\160960844\planning\correspondence\ceaa ea review process\phase 2 - panel\ir1\attachments\attch2_mem_sw_baseline_study_update_20170420.docx
The dominant soil class within the IC3 and 02HB004 sub-watersheds are clay loams comprising 83 and 54%, respectively, of each sub-water area. The 02HB004 has sand and silt loam, and built up area soil types within its sub-watershed that are not present in the IC3 sub-watershed.
The 02HB004 station has a daily flow measurement data record from 1956 to 2016 available via the WSC historical hydrometric database (https://wateroffice.ec.gc.ca/search/historical_e.html). The regional extrapolation method was applied to June 3, 2015 to June 22, 2016 02HB004 observed flows to estimate daily average flows at IC2 and IC3. The area-ratio was determined using the ratio of the sub-watershed of interest drainage area to the 02HB004 drainage are, which were 0.17 and 0.18 for IC2 and IC3, respectively (Table 4). The area-ratio flows were then compared against flow measurements estimated from updated rating curves at IC2 and IC3. The estimated daily average flow values for June 3, 2015 to June 22, 2016 (without January and February 2016 flow data) were assumed to be the observed dataset for comparison to the 02HB004 area-ratio flows using R2, Nash-Sutcliffe Efficiency (NSE) and PBIAS statistical evaluation methods.
Table 4: IC2 and IC3 Flow Rating Curve Flows and 02HB004 Area-Ratio Flow Comparison
Parameter Units IC2 IC3
Area-Ratio - 0.17 0.18
Coefficient of Determination (R2) - 0.84 0.85
Percent bias (PBIAS)† % 13.8 2.1
Nash-Sutcliffe Efficiency (NSE)* - 0.83 0.76
Unit flow estimates m3/s/km2 0.0087 0.0076
† Percent bias (Good is ±15% hydrology; Source: Moriasi et al. [2007]) * Nash-Sutcliffe efficiency (Very Good is >0.75 hydrology; Source: Moriasi et al. [2007])
The statistical evaluation results comparing the predicted area-ratio flows to estimated flows derived from updated rating curves are similar in value for IC2 and IC3 (Table 4). The IC2 and IC3 R2 values are above 0.8 indicating that there is a linear relationship with less than 20% of the variation between the two datasets not accounted for. The optimal NSE value is one and NSE values for IC2 and IC3 have values representing a very good fit between the area-ratio and rating curve derived flows. The PBIAS values also indicate a very good fit between the two datasets. The area-ratio flows at IC2 and IC3 have good statistical performance results when compared to the flow rating curve flows.
The unit flow areas calculated for the IC2 and IC3 area-ration and rating curve derived average flows for June 3, 2015 to June 22, 2016 are very close in value, particularly for IC3 (Table 4).

April 20, 2017 France Moreau Page 10 of 14
Reference: CN Milton Logistics Hub - Hydrology and Surface Water Quality Baseline Study Update
(June 2015 to June 2016)
cn \\cd1215-f01\work_group\01609\active\160960844\planning\correspondence\ceaa ea review process\phase 2 - panel\ir1\attachments\attch2_mem_sw_baseline_study_update_20170420.docx
Figures A4 and A5 (Appendix A) present time-series graphs of the rating curve derived flows and area-ratio flows for IC2 and IC3, respectively. The area-ratio flows visually had good agreement with the flow rating curve flows at IC2 and IC3 with similar patterns of high and low flows. The peak flows were observed to typically occur on the same date with the ‘rising’ and ‘falling’ limbs of the peak flow event occurring at the same rate based on the daily time step. The IC2 area-ratio flows (Figure
A4, Appendix A) had higher peak flows on June 28, 2015 and March – April 2016 with lower predicted flows during a low flow condition in May – June 2016 than the IC2 flow rating curve. The IC3 area-ratio flows (Figure A5, Appendix A) had higher peak flows on June 28, 2015 and March – April 2016, with lower predicted flows during a low flow condition in November – December 2015 than the IC3 flow rating curve. There was no overall observed trend in the graphical comparison of peak flows at IC2 and IC3 between the flow rating curve and area-ratio flows. Overall the area-ratio flows are in good visual agreement with the flow rating curve derived flows at IC2 and IC3.
SURFACE WATER QUALITY
Methods
Similar to the sampling protocol described in Section 4.2.2 of the Hydrology TDR, Stantec collected water quality samples at the three hydrometric monitoring locations using autosamplers and a water quality sonde. Water quality samples were collected according to standard methods for auto-sampling by collecting 1 L samples at 15 minute intervals using individual bottles over a 2.5 to 3 hour period using an ISCO 6712 portable auto-sampler (Canadian Council of the Ministers of the Environment 2011).
In-situ and laboratory analysis water quality samples were collected on October 8, 2015, November 18, 2015, March 30, 2016 and April 28, 2016 for Tributary A, as well as stations IC2 and IC3 on Indian Creek. Additional water quality results are presented for IC2 and IC3 for May 26, 2016 and June 22, 2016. As previously mentioned, there was no flow within TRIB A during May 26, 2016 and June 22, 2016 monitoring visits and water samples were therefore not collected on these dates.
Revised minimum, mean and maximum water quality parameter concentrations were calculated and along with raw results, were compared to Provincial Water Quality Objectives (PWQOs) and Canadian Council of Ministers of the Environment (CCME) Canadian Water Quality Guidelines for the protection of Freshwater Aquatic Life (CWQG-FAL) (Ontario Ministry of the Environment 1994; Canadian Council of the Ministers of the Environment 2012).
Results
Water quality parameter concentrations were found to be generally below relevant Provincial and Federal criteria in the October 2015 to June 2016 results, as was observed in previous monitoring (Stantec 2015). Attachment B (Tables B1 to B3) presents updated field in-situ and laboratory analysis water quality results for October 8, 2015, November 18, 2015, March 30, 2016 and April 28, 2016 for Tributary A, as well as stations IC2 and IC3 on Indian Creek. Additional water quality results are presented for IC2 and IC3 for May 26, 2016 and June 22, 2016.
April 20, 2017 France Moreau Page 11 of 14
Reference: CN Milton Logistics Hub - Hydrology and Surface Water Quality Baseline Study Update
(June 2015 to June 2016)
cn \\cd1215-f01\work_group\01609\active\160960844\planning\correspondence\ceaa ea review process\phase 2 - panel\ir1\attachments\attch2_mem_sw_baseline_study_update_20170420.docx
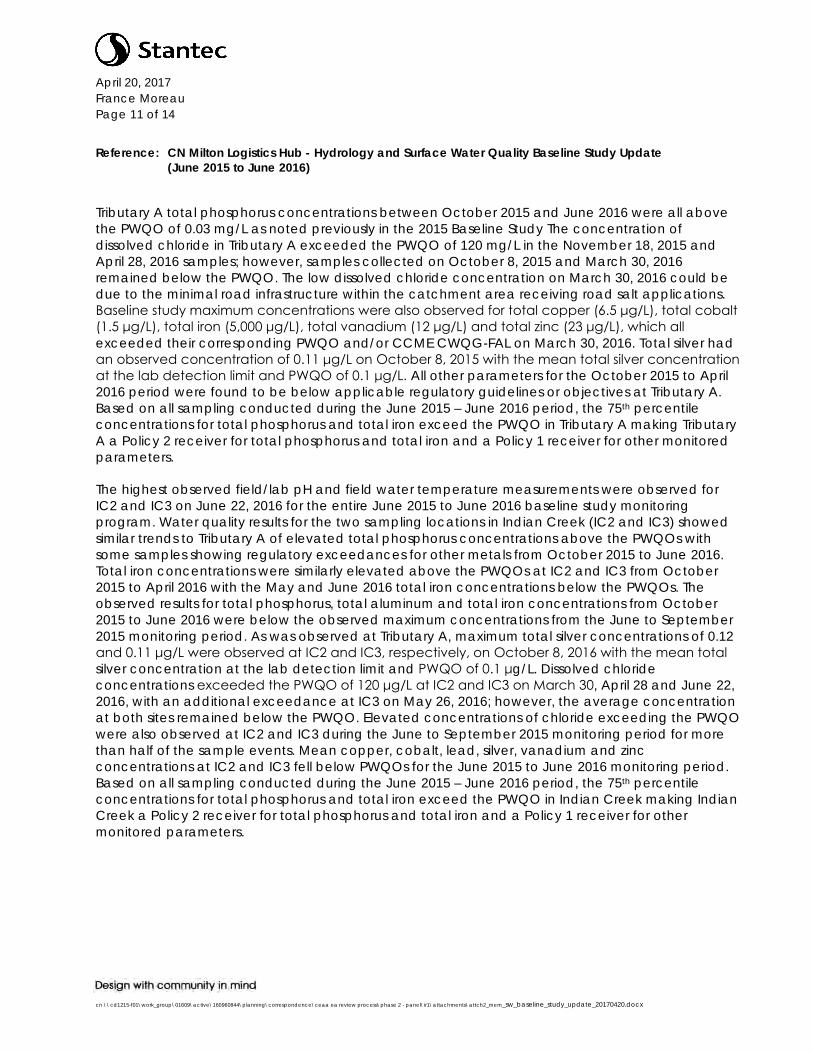
Tributary A total phosphorus concentrations between October 2015 and June 2016 were all above the PWQO of 0.03 mg/L as noted previously in the 2015 Baseline Study The concentration of dissolved chloride in Tributary A exceeded the PWQO of 120 mg/L in the November 18, 2015 and April 28, 2016 samples; however, samples collected on October 8, 2015 and March 30, 2016 remained below the PWQO. The low dissolved chloride concentration on March 30, 2016 could be due to the minimal road infrastructure within the catchment area receiving road salt applications. Baseline study maximum concentrations were also observed for total copper (6.5 μg/L), total cobalt (1.5 μg/L), total iron (5,000 μg/L), total vanadium (12 μg/L) and total zinc (23 μg/L), which all exceeded their corresponding PWQO and/or CCME CWQG-FAL on March 30, 2016. Total silver had an observed concentration of 0.11 μg/L on October 8, 2015 with the mean total silver concentration at the lab detection limit and PWQO of 0.1 μg/L. All other parameters for the October 2015 to April 2016 period were found to be below applicable regulatory guidelines or objectives at Tributary A. Based on all sampling conducted during the June 2015 – June 2016 period, the 75th percentile concentrations for total phosphorus and total iron exceed the PWQO in Tributary A making Tributary A a Policy 2 receiver for total phosphorus and total iron and a Policy 1 receiver for other monitored parameters.
The highest observed field/lab pH and field water temperature measurements were observed for IC2 and IC3 on June 22, 2016 for the entire June 2015 to June 2016 baseline study monitoring program. Water quality results for the two sampling locations in Indian Creek (IC2 and IC3) showed similar trends to Tributary A of elevated total phosphorus concentrations above the PWQOs with some samples showing regulatory exceedances for other metals from October 2015 to June 2016. Total iron concentrations were similarly elevated above the PWQOs at IC2 and IC3 from October 2015 to April 2016 with the May and June 2016 total iron concentrations below the PWQOs. The observed results for total phosphorus, total aluminum and total iron concentrations from October 2015 to June 2016 were below the observed maximum concentrations from the June to September 2015 monitoring period. As was observed at Tributary A, maximum total silver concentrations of 0.12 and 0.11 μg/L were observed at IC2 and IC3, respectively, on October 8, 2016 with the mean total silver concentration at the lab detection limit and PWQO of 0.1 μg/L. Dissolved chloride concentrations exceeded the PWQO of 120 μg/L at IC2 and IC3 on March 30, April 28 and June 22, 2016, with an additional exceedance at IC3 on May 26, 2016; however, the average concentration at both sites remained below the PWQO. Elevated concentrations of chloride exceeding the PWQO were also observed at IC2 and IC3 during the June to September 2015 monitoring period for more than half of the sample events. Mean copper, cobalt, lead, silver, vanadium and zinc concentrations at IC2 and IC3 fell below PWQOs for the June 2015 to June 2016 monitoring period. Based on all sampling conducted during the June 2015 – June 2016 period, the 75th percentile concentrations for total phosphorus and total iron exceed the PWQO in Indian Creek making Indian Creek a Policy 2 receiver for total phosphorus and total iron and a Policy 1 receiver for other monitored parameters.

April 20, 2017 France Moreau Page 12 of 14
Reference: CN Milton Logistics Hub - Hydrology and Surface Water Quality Baseline Study Update
(June 2015 to June 2016)
cn \\cd1215-f01\work_group\01609\active\160960844\planning\correspondence\ceaa ea review process\phase 2 - panel\ir1\attachments\attch2_mem_sw_baseline_study_update_20170420.docx
DISCUSSION AND SUMMARY
Hydrology results for the October 2015 to June 2016 period were collected from Tributary A (TRIB A), Indian Creek entering the PDA (IC2) and Indian Creek exiting the PDA (IC3). Continuous water level monitoring was interrupted at IC2 and IC3 due to ice rafting deflecting the stilling well installations on January 10, 2016 with re-establishment of the stilling wells on March 4, 2016. TRIB A was visually confirmed to have ice-free conditions from February 29 to March 30, 2016.
The revised rating curves for the three stations, using in-situ water level and velocity measurements, were slightly increased to the previous rating curves developed in the Hydrology TDR for TRIB A, IC2, and IC3. All three stations during the fall-winter period showed similar flow patterns of high flows with seasonal increases observed in October and November 2015 and overwinter flow conditions characterized by multiple rainfall and warm melt events. The dry spring resulted in low flows observed at all stations and no flows observed at TRIB A in May and June 2016.
Assessment of the Regional hydrometric station (02HB004) using June 2015 to June 2016 rating curve derived flows at IC2 and IC3 identified similar flow characteristics. The IC2/IC3 and 02HB004 sub-watersheds exhibited similar land use and soils types and sub-watershed percent areas indicating that 02HB004 is representative of similar hydrological conditions to Indian Creek in the PDA.
The October 2015 to June 2016 water quality results do not substantively change the observed conclusions in the Hydrology TDR (Stantec 2015b) regarding the baseline water quality in Indian Creek and Tributary A. Indian Creek and Tributary A are typical of a small rural stream in southern Ontario, with elevated total phosphorus, aluminum and iron concentrations and transient and marginal exceedances of PWQOs and CCME CWQG-FALs for some metals. The water quality observations from June 2015 to June 2016 are consistent with trends in the MOECC regional water quality data and the Conservation Halton Bronte Creek Watershed Study (2002) water quality results. As described by Conservation Halton (2002), the Indian Creek subwatershed has historically had water quality concerns and considers this section of Indian Creek to be impaired, with the main causes considered to be erosion, agricultural activities and livestock access (Conservation Halton 2002).
CONCLUSION
Based on the supplemental follow-up hydrology and surface water quality studies completed to June 2016, the results support the characterization of Indian Creek and Tributary A as described in the Hydrology TDR and EIS (Stantec 2015a).
Based on the results of the supplemental follow-up studies, no changes are required to the effects assessment for surface water, and no additional mitigation measures are required to address the potential effects of the Project.
April 20, 2017 France Moreau Page 13 of 14
Reference: CN Milton Logistics Hub - Hydrology and Surface Water Quality Baseline Study Update
(June 2015 to June 2016)
cn \\cd1215-f01\work_group\01609\active\160960844\planning\correspondence\ceaa ea review process\phase 2 - panel\ir1\attachments\attch2_mem_sw_baseline_study_update_20170420.docx
With the exception of the post-construction monitoring described in Section 9.4.4 of the EIS, no further follow-up studies are recommended for surface water hydrology and water quality.
STANTEC CONSULTING LTD.
Prepared by:
Andrew Sinclair, Ph.D., P.Eng. Environmental Engineer
Reviewed by:
Sheldon Smith, M.E.S., P.Geo. Principal, Senior Hydrologist
Attachment: A. Hydrometric Monitoring Station Figures B. Water Quality Summary Tables
References
Canadian Council of Ministers of the Environment (CCME). 2011. Protocols manual for Water Quality Sampling in Canada. PN. 1461. ISBN 978-1-896997-7-0. Pp. 175.
Canadian Environmental Assessment Agency (CEAA). 2015. Guidelines for the Preparation of an Environmental Impact Statement pursuant to the Canadian Environmental Assessment Act, 2012. Milton Logistics Hub Project. July 2015.
Conservation Halton. 2002. Bronte Creek Watershed Study. Conservation Halton. 89 pp.
Environment Canada. 2015. Canadian Climate Normals 1981-2010. Toronto Lester B Pearson International Airport Stations, Climate ID 6158733. Last accessed July 14, 2016. Available online at: http://climate.weather.gc.ca/climate_normals/index_e.html
Environment Canada. 2015b. Climate Data Online, Toronto International Airport Station. Climate ID 6158731. Last accessed July 14, 2016. Available online at: http://climate.weather.gc.ca/index_e.html
Moriasi, D.N., J.G. Arnold, M.W. Van Liew, R.L. Bingner, R.D. Harmel, and T.L. Veith. 2007. Model evaluation guidelines for systematic quantification of accuracy in watershed simulations. Transactions of the ASABE. 50: 885-900. Ontario Ministry of the Environment. 1994. Water Management Policies Guidelines Provincial Water Quality Objectives of the Ministry of Environment and Energy. Queen’s Printer for Ontario.
Stantec Consulting Ltd. (Stantec). 2015a. Milton Logistics Hub Environmental Impact Statement. Prepared for Canadian National Railway Company. December 7, 2015.
<Original signed by> <Original signed by>
<contact information removed> <contact information removed>

April 20, 2017 France Moreau Page 14 of 14
Reference: CN Milton Logistics Hub - Hydrology and Surface Water Quality Baseline Study Update
(June 2015 to June 2016)
cn \\cd1215-f01\work_group\01609\active\160960844\planning\correspondence\ceaa ea review process\phase 2 - panel\ir1\attachments\attch2_mem_sw_baseline_study_update_20170420.docx
Stantec Consulting Ltd. (Stantec). 2015b. Milton Logistics Hub Technical Data Report: Hydrology and Surface Water Quality Baseline Study and Effects Assessment (Appendix E.15). Prepared for Canadian National Railway Company. December 7, 2015.
ATTACHMENT A:
HYDROMETRIC MONITORING
STATION FIGURES
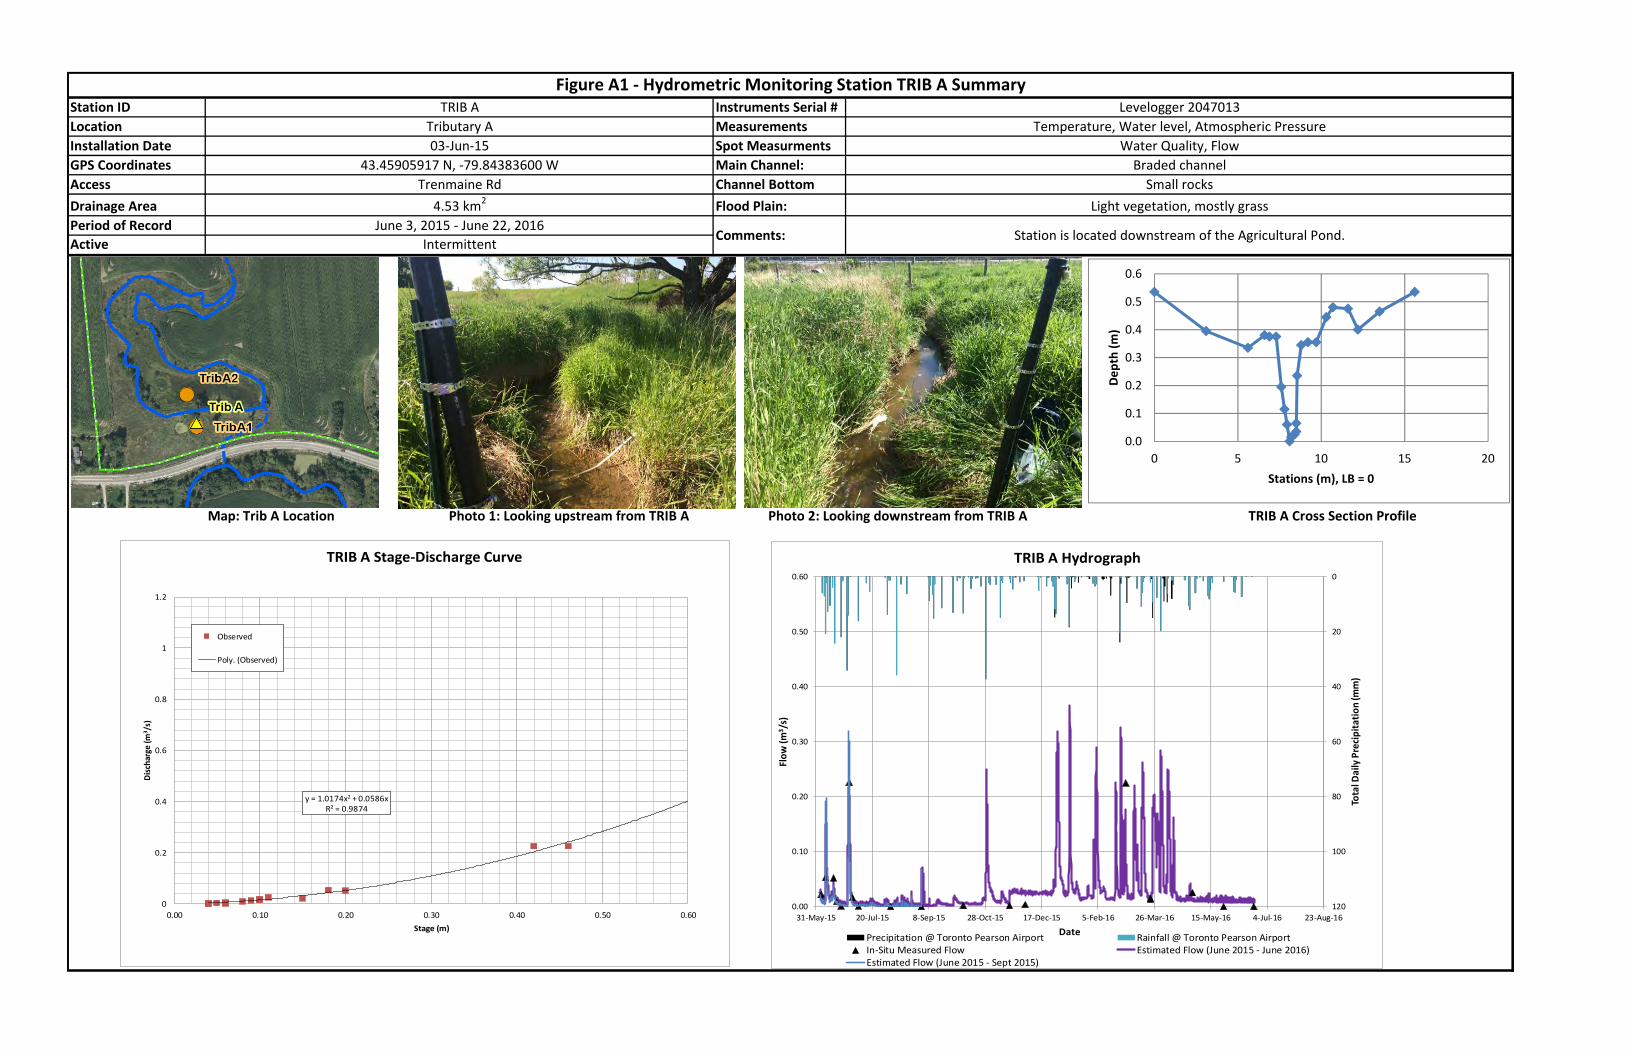
Station ID Instruments Serial # LocationInstallation DateGPS CoordinatesAccessDrainage Area Period of RecordActive
Map: Trib A Location Photo 1: Looking upstream from TRIB A Photo 2: Looking downstream from TRIB A TRIB A Cross Section Profile
Braded channel
Station is located downstream of the Agricultural Pond. June 3, 2015 - June 22, 2016
Intermittent Comments:
Flood Plain:
Levelogger 2047013Figure A1 - Hydrometric Monitoring Station TRIB A Summary
43.45905917 N, -79.84383600 WTrenmaine Rd
4.53 km2
TRIB ATributary A03-Jun-15
Small rocksLight vegetation, mostly grass
Channel Bottom
Spot MeasurmentsMeasurements
Main Channel:Water Quality, Flow
Temperature, Water level, Atmospheric Pressure
0.0
0.1
0.2
0.3
0.4
0.5
0.6
0 5 10 15 20
Dept
h (m
)
Stations (m), LB = 0
y = 1.0174x2 + 0.0586xR² = 0.9874
0
0.2
0.4
0.6
0.8
1
1.2
0.00 0.10 0.20 0.30 0.40 0.50 0.60
Disc
harg
e (m
3 /s)
Stage (m)
TRIB A Stage-Discharge Curve
Observed
Poly. (Observed)
0
20
40
60
80
100
1200.00
0.10
0.20
0.30
0.40
0.50
0.60
31-May-15 20-Jul-15 8-Sep-15 28-Oct-15 17-Dec-15 5-Feb-16 26-Mar-16 15-May-16 4-Jul-16 23-Aug-16
Tota
l Dai
ly P
recip
itatio
n (m
m)
Flow
(m3 /
s)
Date
TRIB A Hydrograph
Precipitation @ Toronto Pearson Airport Rainfall @ Toronto Pearson AirportIn-Situ Measured Flow Estimated Flow (June 2015 - June 2016)Estimated Flow (June 2015 - Sept 2015)
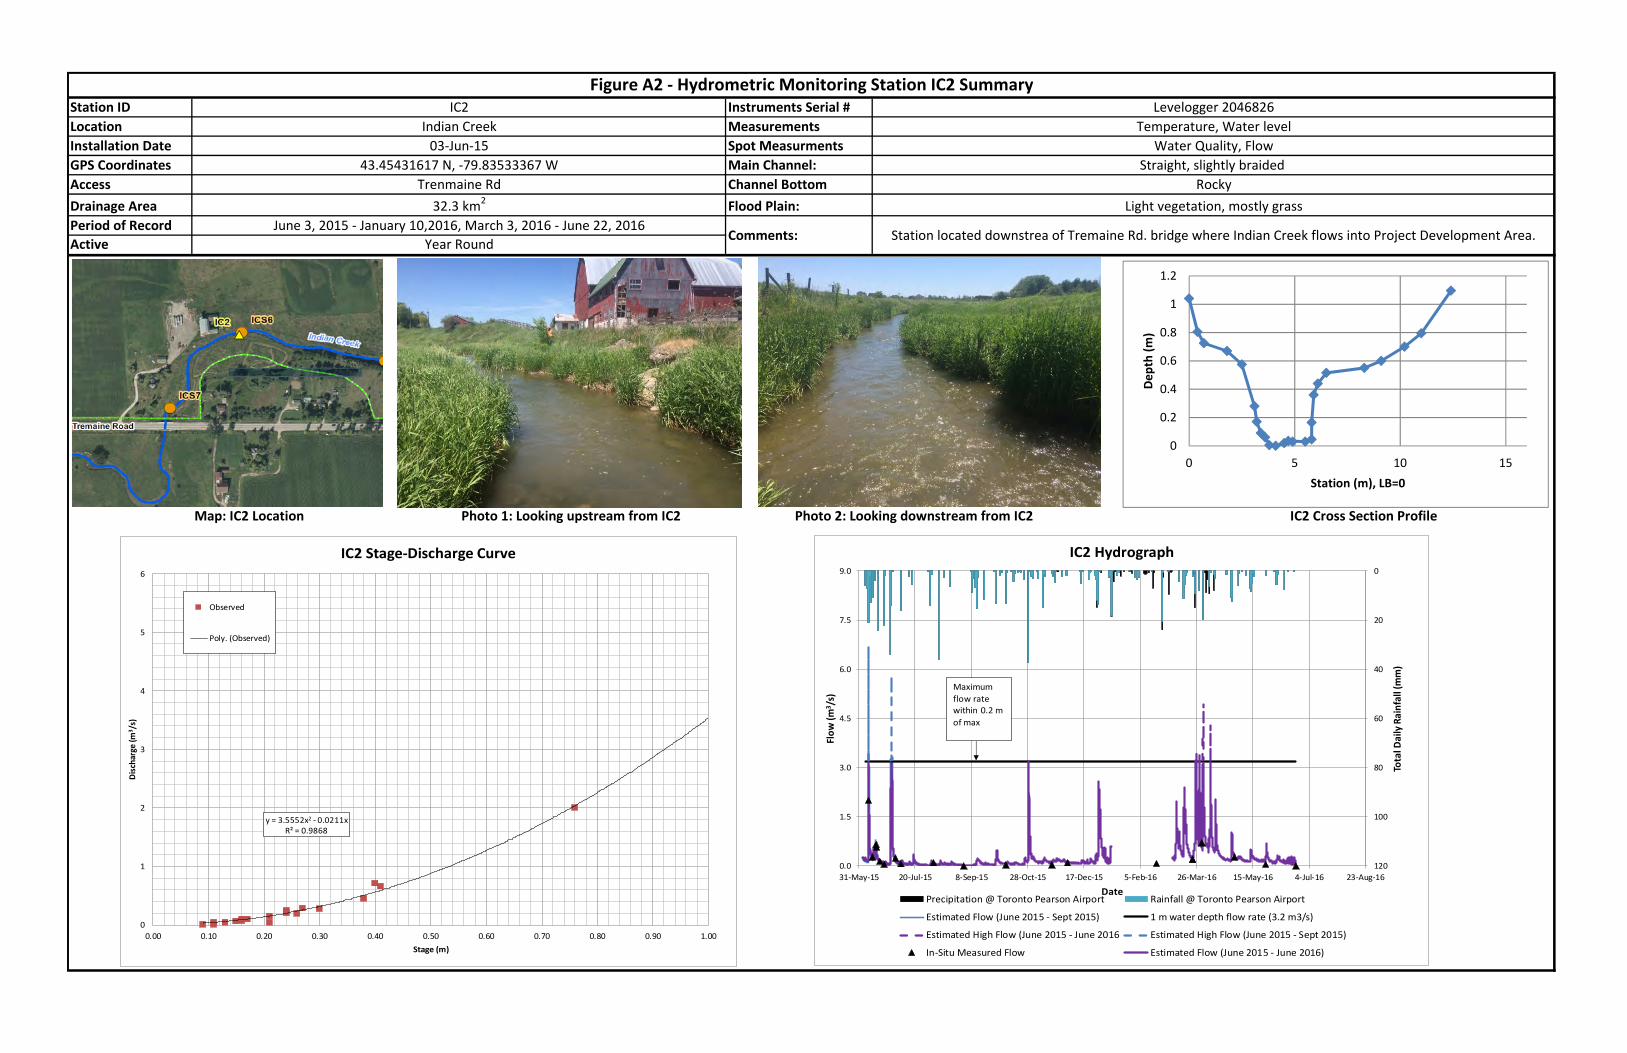
Station ID Instruments Serial # LocationInstallation DateGPS CoordinatesAccessDrainage Area Period of RecordActive
Map: IC2 Location Photo 1: Looking upstream from IC2 Photo 2: Looking downstream from IC2 IC2 Cross Section Profile
Levelogger 2046826
43.45431617 N, -79.83533367 WTrenmaine Rd
MeasurementsSpot MeasurmentsMain Channel:
Figure A2 - Hydrometric Monitoring Station IC2 Summary
32.3 km2
June 3, 2015 - January 10,2016, March 3, 2016 - June 22, 2016Year Round
Channel BottomFlood Plain:
Comments:
Light vegetation, mostly grass
Station located downstrea of Tremaine Rd. bridge where Indian Creek flows into Project Development Area.
Temperature, Water levelWater Quality, Flow
Straight, slightly braided Rocky
IC2Indian Creek
03-Jun-15
0
0.2
0.4
0.6
0.8
1
1.2
0 5 10 15
Dept
h (m
)
Station (m), LB=0
y = 3.5552x2 - 0.0211xR² = 0.9868
0
1
2
3
4
5
6
0.00 0.10 0.20 0.30 0.40 0.50 0.60 0.70 0.80 0.90 1.00
Disc
harg
e (m
3 /s)
Stage (m)
IC2 Stage-Discharge Curve
Observed
Poly. (Observed)
0
20
40
60
80
100
1200.0
1.5
3.0
4.5
6.0
7.5
9.0
31-May-15 20-Jul-15 8-Sep-15 28-Oct-15 17-Dec-15 5-Feb-16 26-Mar-16 15-May-16 4-Jul-16 23-Aug-16
Tota
l Dai
ly R
ainf
all (
mm
)
Flow
(m3 /
s)
Date
IC2 Hydrograph
Precipitation @ Toronto Pearson Airport Rainfall @ Toronto Pearson Airport
Estimated Flow (June 2015 - Sept 2015) 1 m water depth flow rate (3.2 m3/s)
Estimated High Flow (June 2015 - June 2016 Estimated High Flow (June 2015 - Sept 2015)
In-Situ Measured Flow Estimated Flow (June 2015 - June 2016)
Maximumflow rate within 0.2 m of max
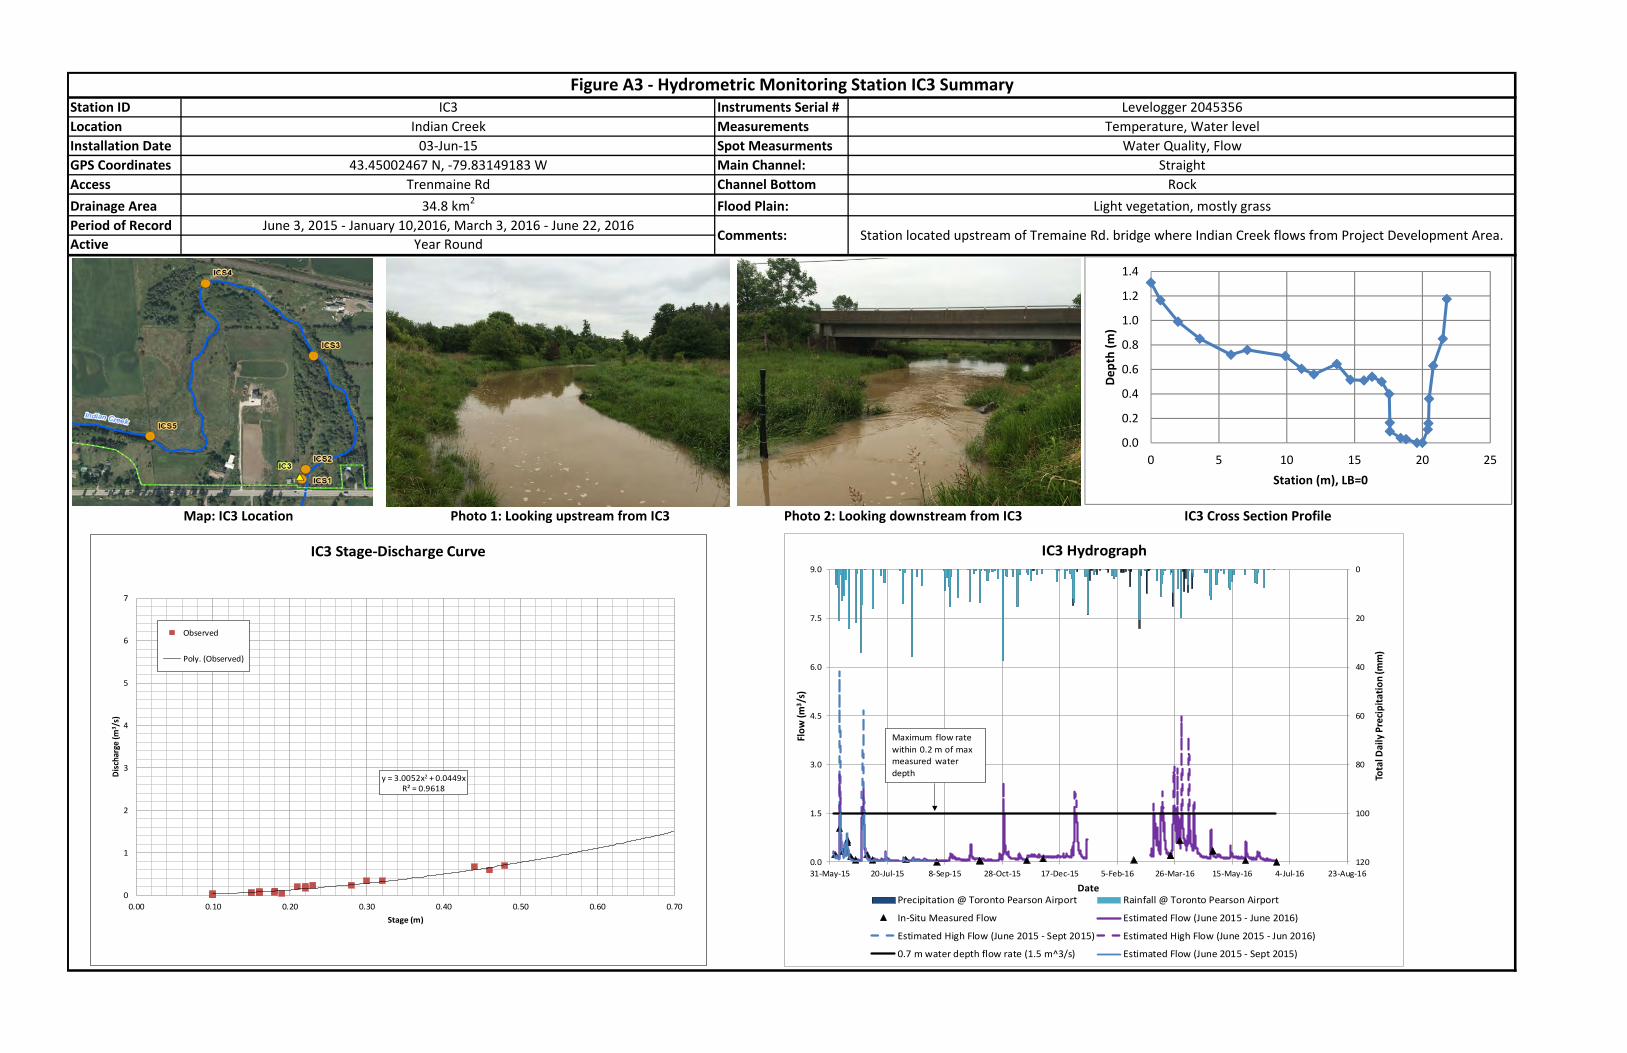
Station ID Instruments Serial # LocationInstallation DateGPS CoordinatesAccessDrainage Area Period of RecordActive
Map: IC3 Location Photo 1: Looking upstream from IC3 Photo 2: Looking downstream from IC3 IC3 Cross Section Profile
Station located upstream of Tremaine Rd. bridge where Indian Creek flows from Project Development Area.
Main Channel:Trenmaine Rd
34.8 km2
June 3, 2015 - January 10,2016, March 3, 2016 - June 22, 2016
StraightRock
Light vegetation, mostly grass
Year Round
43.45002467 N, -79.83149183 WChannel BottomFlood Plain:
Comments:
Figure A3 - Hydrometric Monitoring Station IC3 SummaryIC3
Indian Creek03-Jun-15 Spot Measurments
Levelogger 2045356Temperature, Water level
Water Quality, FlowMeasurements
0.0
0.2
0.4
0.6
0.8
1.0
1.2
1.4
0 5 10 15 20 25
Dept
h (m
)
Station (m), LB=0
y = 3.0052x2 + 0.0449xR² = 0.9618
0
1
2
3
4
5
6
7
0.00 0.10 0.20 0.30 0.40 0.50 0.60 0.70
Disc
harg
e (m
3 /s)
Stage (m)
IC3 Stage-Discharge Curve
Observed
Poly. (Observed)
0
20
40
60
80
100
1200.0
1.5
3.0
4.5
6.0
7.5
9.0
31-May-15 20-Jul-15 8-Sep-15 28-Oct-15 17-Dec-15 5-Feb-16 26-Mar-16 15-May-16 4-Jul-16 23-Aug-16
Tota
l Dai
ly P
recip
itatio
n (m
m)
Flow
(m3 /
s)
Date
IC3 Hydrograph
Precipitation @ Toronto Pearson Airport Rainfall @ Toronto Pearson Airport
In-Situ Measured Flow Estimated Flow (June 2015 - June 2016)
Estimated High Flow (June 2015 - Sept 2015) Estimated High Flow (June 2015 - Jun 2016)
0.7 m water depth flow rate (1.5 m^3/s) Estimated Flow (June 2015 - Sept 2015)
Maximum flow rate within 0.2 m of max measured water depth

0
10
20
30
40
50
60
70
80
90
1000
0.5
1
1.5
2
2.5
3
3.5
4
4.5
5
03-Jun-15 23-Jul-15 11-Sep-15 31-Oct-15 20-Dec-15 08-Feb-16 29-Mar-16 18-May-16
Daily
Ave
rage
Flo
w (m
3 /s)
Date
Figure A4IC2 - Observed & 02HB004 Area Ratio Daily Average Flows
Precipitation IC2 Flow Rating Curve 02HB004 Area-Ratio
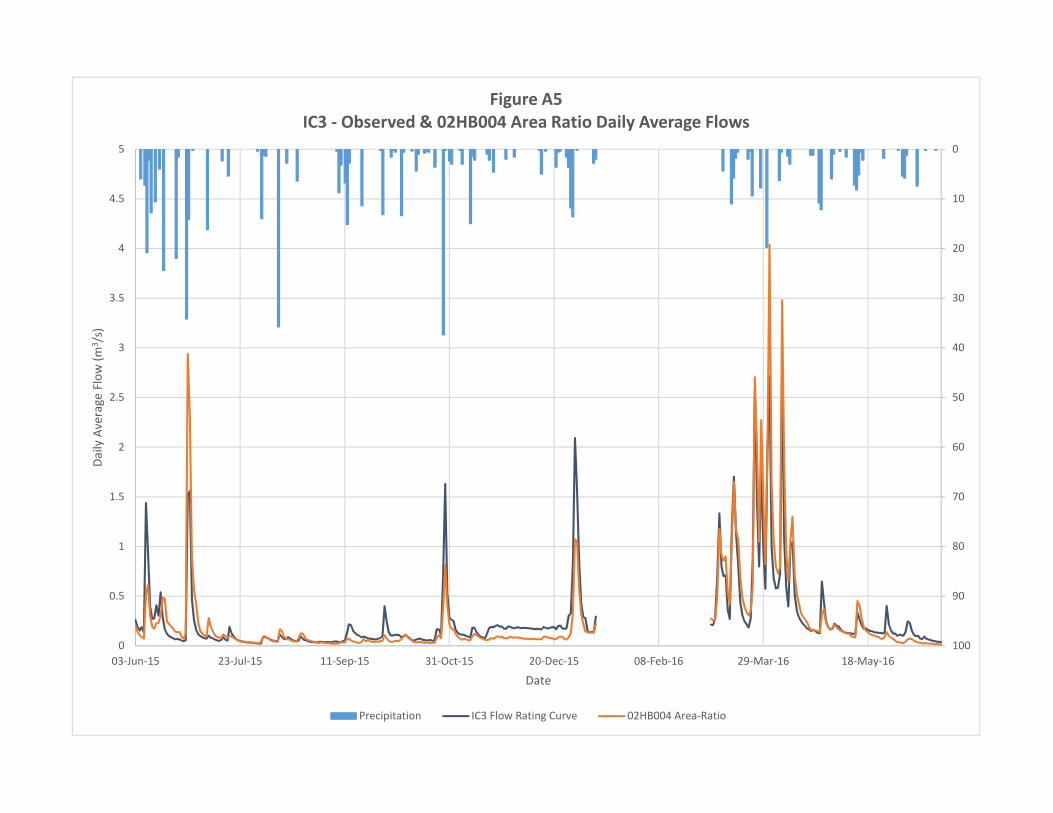
0
10
20
30
40
50
60
70
80
90
1000
0.5
1
1.5
2
2.5
3
3.5
4
4.5
5
03-Jun-15 23-Jul-15 11-Sep-15 31-Oct-15 20-Dec-15 08-Feb-16 29-Mar-16 18-May-16
Daily
Ave
rage
Flo
w (m
3 /s)
Date
Figure A5IC3 - Observed & 02HB004 Area Ratio Daily Average Flows
Precipitation IC3 Flow Rating Curve 02HB004 Area-Ratio
ATTACHMENT B:
WATER QUALITY SUMMARY TABLES
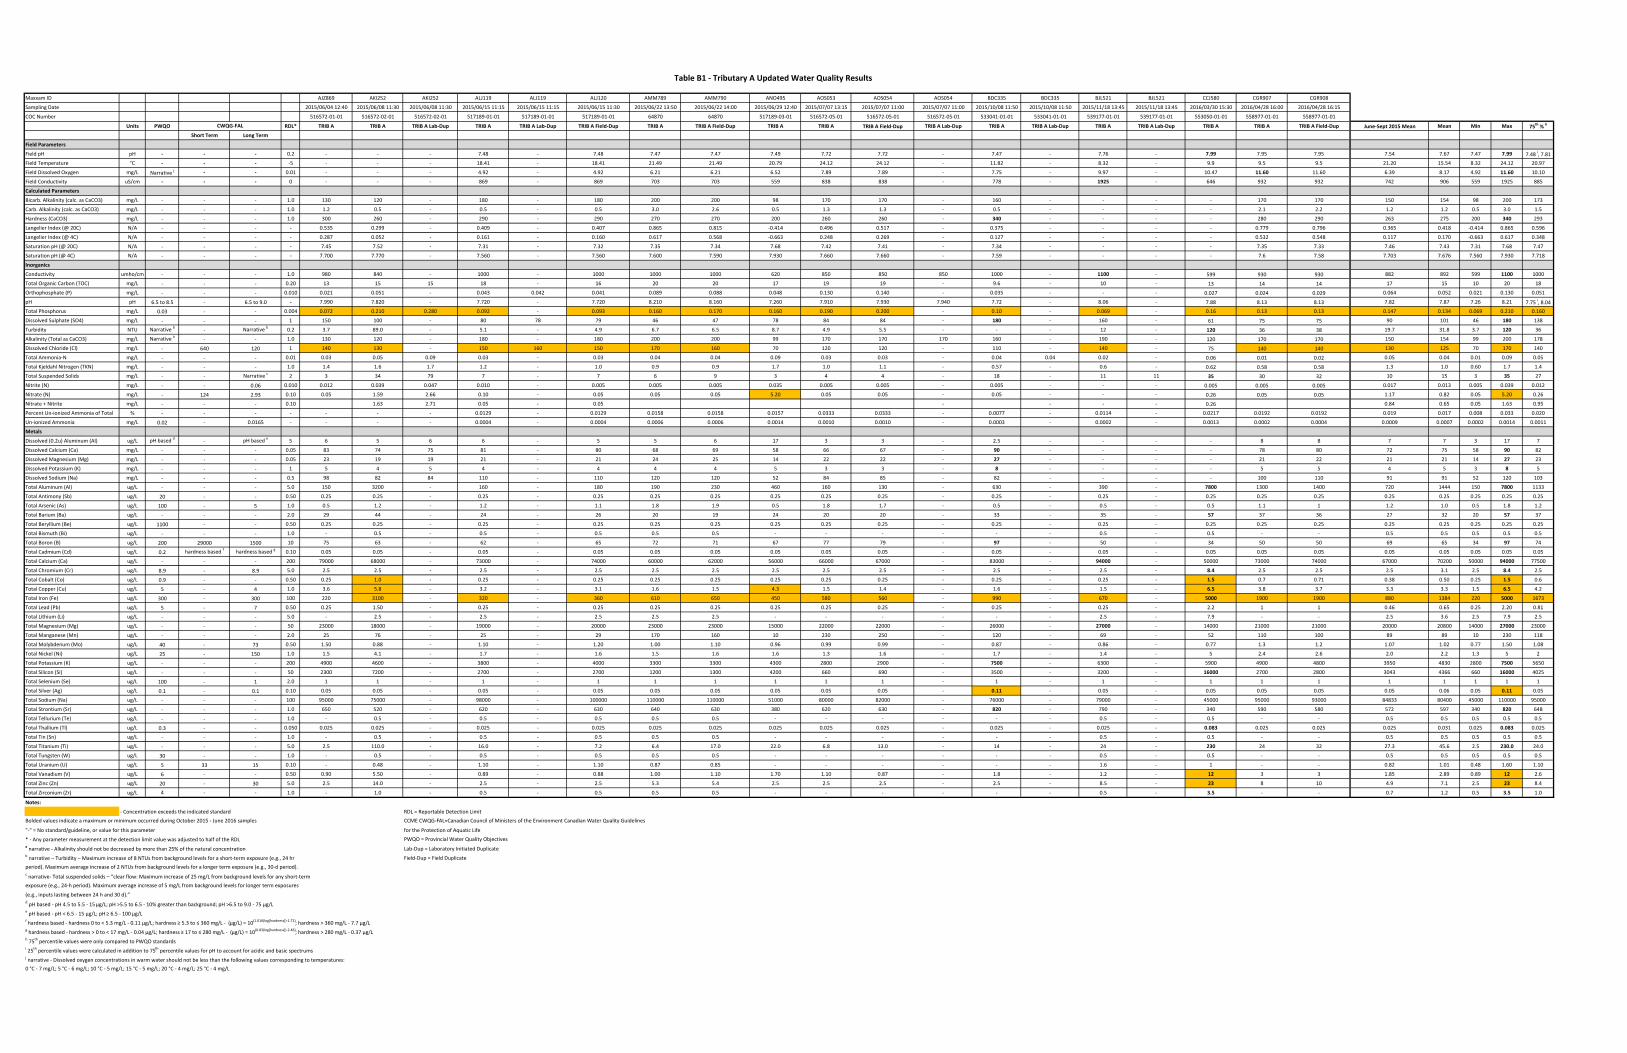
Maxxam ID AJZ869 AKI252 AKI252 ALJ119 ALJ119 ALJ120 AMM789 AMM790 ANO495 AOS053 AOS054 AOS054 BDC335 BDC335 BJL521 BJL521 CCJ580 CGR907 CGR908
Sampling Date 2015/06/04 12:40 2015/06/08 11:30 2015/06/08 11:30 2015/06/15 11:15 2015/06/15 11:15 2015/06/15 11:30 2015/06/22 13:50 2015/06/22 14:00 2015/06/29 12:40 2015/07/07 13:15 2015/07/07 11:00 2015/07/07 11:00 2015/10/08 11:50 2015/10/08 11:50 2015/11/18 13:45 2015/11/18 13:45 2016/03/30 15:30 2016/04/28 16:00 2016/04/28 16:15
COC Number 516572-01-01 516572-02-01 516572-02-01 517189-01-01 517189-01-01 517189-01-01 64870 64870 517189-03-01 516572-05-01 516572-05-01 516572-05-01 533041-01-01 533041-01-01 539177-01-01 539177-01-01 553050-01-01 558977-01-01 558977-01-01
Units PWQO RDL* TRIB A TRIB A TRIB A Lab-Dup TRIB A TRIB A Lab-Dup TRIB A Field-Dup TRIB A TRIB A Field-Dup TRIB A TRIB A TRIB A Field-Dup TRIB A Lab-Dup TRIB A TRIB A Lab-Dup TRIB A TRIB A Lab-Dup TRIB A TRIB A TRIB A Field-Dup June-Sept 2015 Mean Mean Min Max 75th % h
Short Term Long Term
Field Parameters
Field pH pH - - - 0.2 - - - 7.48 - 7.48 7.47 7.47 7.49 7.72 7.72 - 7.47 - 7.76 - 7.99 7.95 7.95 7.54 7.67 7.47 7.99 7.48 i, 7.81Field Temperature °C - - - -5 - - - 18.41 - 18.41 21.49 21.49 20.79 24.12 24.12 - 11.82 - 8.32 - 9.9 9.5 9.5 21.20 15.54 8.32 24.12 20.97
Field Dissolved Oxygen mg/L Narrative j - - 0.01 - - - 4.92 - 4.92 6.21 6.21 6.52 7.89 7.89 - 7.75 - 9.97 - 10.47 11.60 11.60 6.39 8.17 4.92 11.60 10.10
Field Conductivity uS/cm - - - 0 - - - 869 - 869 703 703 559 838 838 - 778 - 1925 - 646 932 932 742 906 559 1925 885
Calculated Parameters
Bicarb. Alkalinity (calc. as CaCO3) mg/L - - - 1.0 130 120 - 180 - 180 200 200 98 170 170 - 160 - - - - 170 170 150 154 98 200 173
Carb. Alkalinity (calc. as CaCO3) mg/L - - - 1.0 1.2 0.5 - 0.5 - 0.5 3.0 2.6 0.5 1.3 1.3 - 0.5 - - - - 2.1 2.2 1.2 1.2 0.5 3.0 1.5
Hardness (CaCO3) mg/L - - - 1.0 300 260 - 290 - 290 270 270 200 260 260 - 340 - - - - 280 290 263 275 200 340 293
Langelier Index (@ 20C) N/A - - - - 0.535 0.299 - 0.409 - 0.407 0.865 0.815 -0.414 0.496 0.517 - 0.375 - - - - 0.779 0.796 0.365 0.418 -0.414 0.865 0.596
Langelier Index (@ 4C) N/A - - - - 0.287 0.052 - 0.161 - 0.160 0.617 0.568 -0.663 0.248 0.269 - 0.127 - - - - 0.532 0.548 0.117 0.170 -0.663 0.617 0.348
Saturation pH (@ 20C) N/A - - - - 7.45 7.52 - 7.31 - 7.32 7.35 7.34 7.68 7.42 7.41 - 7.34 - - - - 7.35 7.33 7.46 7.43 7.31 7.68 7.47
Saturation pH (@ 4C) N/A - - - - 7.700 7.770 - 7.560 - 7.560 7.600 7.590 7.930 7.660 7.660 - 7.59 - - - - 7.6 7.58 7.703 7.676 7.560 7.930 7.718
Inorganics
Conductivity umho/cm - - - 1.0 980 840 - 1000 - 1000 1000 1000 620 850 850 850 1000 - 1100 - 599 930 930 882 892 599 1100 1000
Total Organic Carbon (TOC) mg/L - - - 0.20 13 15 15 18 - 16 20 20 17 19 19 - 9.6 - 10 - 13 14 14 17 15 10 20 18
Orthophosphate (P) mg/L - - - 0.010 0.021 0.051 - 0.043 0.042 0.041 0.089 0.088 0.048 0.130 0.140 - 0.035 - - - 0.027 0.024 0.029 0.064 0.052 0.021 0.130 0.051
pH pH 6.5 to 8.5 - 6.5 to 9.0 - 7.990 7.820 - 7.720 - 7.720 8.210 8.160 7.260 7.910 7.930 7.940 7.72 - 8.06 - 7.88 8.13 8.13 7.82 7.87 7.26 8.21 7.75 i, 8.04Total Phosphorus mg/L 0.03 - - 0.004 0.072 0.210 0.280 0.092 - 0.093 0.160 0.170 0.160 0.190 0.200 - 0.10 - 0.069 - 0.16 0.13 0.13 0.147 0.134 0.069 0.210 0.160
Dissolved Sulphate (SO4) mg/L - - - 1 150 100 - 80 78 79 46 47 78 84 84 - 180 - 160 - 61 75 75 90 101 46 180 138
Turbidity NTU Narrative b - Narrative b 0.2 3.7 89.0 - 5.1 - 4.9 6.7 6.5 8.7 4.9 5.5 - - - 12 - 120 36 38 19.7 31.8 3.7 120 36
Alkalinity (Total as CaCO3) mg/L Narrative a - - 1.0 130 120 - 180 - 180 200 200 99 170 170 170 160 - 190 - 120 170 170 150 154 99 200 178
Dissolved Chloride (Cl) mg/L - 640 120 1 140 130 - 150 160 150 170 160 70 120 120 - 110 - 140 - 75 140 140 130 125 70 170 140
Total Ammonia-N mg/L - - - 0.01 0.03 0.05 0.09 0.03 - 0.03 0.04 0.04 0.09 0.03 0.03 - 0.04 0.04 0.02 - 0.06 0.01 0.02 0.05 0.04 0.01 0.09 0.05
Total Kjeldahl Nitrogen (TKN) mg/L - - - 1.0 1.4 1.6 1.7 1.2 - 1.0 0.9 0.9 1.7 1.0 1.1 - 0.57 - 0.6 - 0.62 0.58 0.58 1.3 1.0 0.60 1.7 1.4
Total Suspended Solids mg/L - - Narrative c 2 3 34 79 7 - 7 6 9 3 4 4 - 18 - 11 11 35 30 32 10 15 3 35 27
Nitrite (N) mg/L - - 0.06 0.010 0.012 0.039 0.047 0.010 - 0.005 0.005 0.005 0.035 0.005 0.005 - 0.005 - - - 0.005 0.005 0.005 0.017 0.013 0.005 0.039 0.012
Nitrate (N) mg/L - 124 2.93 0.10 0.05 1.59 2.66 0.10 - 0.05 0.05 0.05 5.20 0.05 0.05 - 0.05 - - - 0.26 0.05 0.05 1.17 0.82 0.05 5.20 0.26
Nitrate + Nitrite mg/L - - - 0.10 1.63 2.71 0.05 - 0.05 - - - - 0.26 0.84 0.65 0.05 1.63 0.95
Percent Un-ionized Ammonia of Total % - - - - - - - 0.0129 - 0.0129 0.0158 0.0158 0.0157 0.0333 0.0333 - 0.0077 - 0.0114 - 0.0217 0.0192 0.0192 0.019 0.017 0.008 0.033 0.020
Un-ionized Ammonia mg/L 0.02 - 0.0165 - - - - 0.0004 - 0.0004 0.0006 0.0006 0.0014 0.0010 0.0010 - 0.0003 - 0.0002 - 0.0013 0.0002 0.0004 0.0009 0.0007 0.0002 0.0014 0.0011
Metals
Dissolved (0.2u) Aluminum (Al) ug/L pH based d - pH based e 5 6 5 6 6 - 5 5 6 17 3 3 - 2.5 - - - - 8 8 7 7 3 17 7
Dissolved Calcium (Ca) mg/L - - - 0.05 83 74 75 81 - 80 68 69 58 66 67 - 90 - - - - 78 80 72 75 58 90 82
Dissolved Magnesium (Mg) mg/L - - - 0.05 23 19 19 21 - 21 24 25 14 22 22 - 27 - - - - 21 22 21 21 14 27 23
Dissolved Potassium (K) mg/L - - - 1 5 4 5 4 - 4 4 4 5 3 3 - 8 - - - - 5 5 4 5 3 8 5
Dissolved Sodium (Na) mg/L - - - 0.5 98 82 84 110 - 110 120 120 52 84 85 - 82 - - - - 100 110 91 91 52 120 103
Total Aluminum (Al) ug/L - - - 5.0 150 3200 - 160 - 180 190 230 460 160 130 - 630 - 390 - 7800 1300 1400 720 1444 150 7800 1133
Total Antimony (Sb) ug/L 20 - - 0.50 0.25 0.25 - 0.25 - 0.25 0.25 0.25 0.25 0.25 0.25 - 0.25 - 0.25 - 0.25 0.25 0.25 0.25 0.25 0.25 0.25 0.25
Total Arsenic (As) ug/L 100 - 5 1.0 0.5 1.2 - 1.2 - 1.1 1.8 1.9 0.5 1.8 1.7 - 0.5 - 0.5 - 0.5 1.1 1 1.2 1.0 0.5 1.8 1.2
Total Barium (Ba) ug/L - - - 2.0 29 44 - 24 - 26 20 19 24 20 20 - 33 - 35 - 57 37 36 27 32 20 57 37
Total Beryllium (Be) ug/L 1100 - - 0.50 0.25 0.25 - 0.25 - 0.25 0.25 0.25 0.25 0.25 0.25 - 0.25 - 0.25 - 0.25 0.25 0.25 0.25 0.25 0.25 0.25 0.25
Total Bismuth (Bi) ug/L - - - 1.0 - 0.5 - 0.5 - 0.5 0.5 0.5 - - - - - - 0.5 - 0.5 - - 0.5 0.5 0.5 0.5 0.5
Total Boron (B) ug/L 200 29000 1500 10 75 63 - 62 - 65 72 71 67 77 79 - 97 - 50 - 34 50 50 69 65 34 97 74
Total Cadmium (Cd) ug/L 0.2 hardness based f hardness based g 0.10 0.05 0.05 - 0.05 - 0.05 0.05 0.05 0.05 0.05 0.05 - 0.05 - 0.05 - 0.05 0.05 0.05 0.05 0.05 0.05 0.05 0.05
Total Calcium (Ca) ug/L - - - 200 79000 68000 - 73000 - 74000 60000 62000 56000 66000 67000 - 83000 - 94000 - 50000 73000 74000 67000 70200 50000 94000 77500
Total Chromium (Cr) ug/L 8.9 - 8.9 5.0 2.5 2.5 - 2.5 - 2.5 2.5 2.5 2.5 2.5 2.5 - 2.5 - 2.5 - 8.4 2.5 2.5 2.5 3.1 2.5 8.4 2.5
Total Cobalt (Co) ug/L 0.9 - - 0.50 0.25 1.0 - 0.25 - 0.25 0.25 0.25 0.25 0.25 0.25 - 0.25 - 0.25 - 1.5 0.7 0.71 0.38 0.50 0.25 1.5 0.6
Total Copper (Cu) ug/L 5 - 4 1.0 3.6 5.8 - 3.2 - 3.1 1.6 1.5 4.3 1.5 1.4 - 1.6 - 1.5 - 6.5 3.8 3.7 3.3 3.3 1.5 6.5 4.2
Total Iron (Fe) ug/L 300 - 300 100 220 3100 - 320 - 360 610 650 450 580 560 - 990 - 670 - 5000 1900 1900 880 1384 220 5000 1673
Total Lead (Pb) ug/L 5 - 7 0.50 0.25 1.50 - 0.25 - 0.25 0.25 0.25 0.25 0.25 0.25 - 0.25 - 0.25 - 2.2 1 1 0.46 0.65 0.25 2.20 0.81
Total Lithium (Li) ug/L - - - 5.0 - 2.5 - 2.5 - 2.5 2.5 2.5 - - - - - - 2.5 - 7.9 - - 2.5 3.6 2.5 7.9 2.5
Total Magnesium (Mg) ug/L - - - 50 23000 18000 - 19000 - 20000 23000 23000 15000 22000 22000 - 26000 - 27000 - 14000 21000 21000 20000 20800 14000 27000 23000
Total Manganese (Mn) ug/L - - - 2.0 25 76 - 25 - 29 170 160 10 230 250 - 120 - 69 - 52 110 100 89 89 10 230 118
Total Molybdenum (Mo) ug/L 40 - 73 0.50 1.50 0.88 - 1.10 - 1.20 1.00 1.10 0.96 0.99 0.99 - 0.87 - 0.86 - 0.77 1.3 1.2 1.07 1.02 0.77 1.50 1.08
Total Nickel (Ni) ug/L 25 - 150 1.0 1.5 4.1 - 1.7 - 1.6 1.5 1.6 1.6 1.3 1.6 - 1.7 - 1.4 - 5 2.4 2.6 2.0 2.2 1.3 5 2
Total Potassium (K) ug/L - - - 200 4900 4600 - 3800 - 4000 3300 3300 4300 2800 2900 - 7500 - 6300 - 5900 4900 4800 3950 4830 2800 7500 5650
Total Silicon (Si) ug/L - - - 50 2300 7200 - 2700 - 2700 1200 1300 4200 660 690 - 3500 - 3200 - 16000 2700 2800 3043 4366 660 16000 4025
Total Selenium (Se) ug/L 100 - 1 2.0 1 1 - 1 - 1 1 1 1 1 1 - 1 - 1 - 1 1 1 1 1 1 1 1
Total Silver (Ag) ug/L 0.1 - 0.1 0.10 0.05 0.05 - 0.05 - 0.05 0.05 0.05 0.05 0.05 0.05 - 0.11 - 0.05 - 0.05 0.05 0.05 0.05 0.06 0.05 0.11 0.05
Total Sodium (Na) ug/L - - - 100 95000 75000 - 98000 - 100000 110000 110000 51000 80000 82000 - 76000 - 79000 - 45000 95000 93000 84833 80400 45000 110000 95000
Total Strontium (Sr) ug/L - - - 1.0 650 520 - 620 - 630 640 630 380 620 630 - 820 - 790 - 340 590 580 572 597 340 820 648
Total Tellurium (Te) ug/L - - - 1.0 - 0.5 - 0.5 - 0.5 0.5 0.5 - - - - - - 0.5 - 0.5 - - 0.5 0.5 0.5 0.5 0.5
Total Thallium (Tl) ug/L 0.3 - - 0.050 0.025 0.025 - 0.025 - 0.025 0.025 0.025 0.025 0.025 0.025 - 0.025 - 0.025 - 0.083 0.025 0.025 0.025 0.031 0.025 0.083 0.025
Total Tin (Sn) ug/L - - - 1.0 - 0.5 - 0.5 - 0.5 0.5 0.5 - - - - - - 0.5 - 0.5 - - 0.5 0.5 0.5 0.5 0.5
Total Titanium (Ti) ug/L - - - 5.0 2.5 110.0 - 16.0 - 7.2 6.4 17.0 22.0 6.8 13.0 - 14 - 24 - 230 24 32 27.3 45.6 2.5 230.0 24.0
Total Tungsten (W) ug/L 30 - - 1.0 - 0.5 - 0.5 - 0.5 0.5 0.5 - - - - - - 0.5 - 0.5 - - 0.5 0.5 0.5 0.5 0.5
Total Uranium (U) ug/L 5 33 15 0.10 - 0.48 - 1.10 - 1.10 0.87 0.85 - - - - - - 1.6 - 1 - - 0.82 1.01 0.48 1.60 1.10
Total Vanadium (V) ug/L 6 - - 0.50 0.90 5.50 - 0.89 - 0.88 1.00 1.10 1.70 1.10 0.87 - 1.8 - 1.2 - 12 3 3 1.85 2.89 0.89 12 2.6
Total Zinc (Zn) ug/L 20 - 30 5.0 2.5 14.0 - 2.5 - 2.5 5.3 5.4 2.5 2.5 2.5 - 2.5 - 8.5 - 23 8 10 4.9 7.1 2.5 23 8.4
Total Zirconium (Zr) ug/L 4 - - 1.0 - 1.0 - 0.5 - 0.5 0.5 0.5 - - - - - - 0.5 - 3.5 - - 0.7 1.2 0.5 3.5 1.0
Notes:
- Concentration exceeds the indicated standard RDL = Reportable Detection LimitBolded values indicate a maximum or minimum occurred during October 2015 - June 2016 samples CCME CWQG-FAL=Canadian Council of Ministers of the Environment Canadian Water Quality Guidelines
"-" = No standard/guideline, or value for this parameter for the Protection of Aquatic Life
* - Any parameter measurement at the detection limit value was adjusted to half of the RDL PWQO = Provincial Water Quality Objectivesa narrative - Alkalinity should not be decreased by more than 25% of the natural concentration Lab-Dup = Laboratory Initiated Duplicateb narrative – Turbidity – Maximum increase of 8 NTUs from background levels for a short-term exposure (e.g., 24 hr Field-Dup = Field Duplicateperiod). Maximum average increase of 2 NTUs from background levels for a longer term exposure (e.g., 30-d period).c narrative- Total suspended solids – “clear flow: Maximum increase of 25 mg/L from background levels for any short-termexposure (e.g., 24-h period). Maximum average increase of 5 mg/L from background levels for longer term exposures
(e.g., inputs lasting between 24 h and 30 d).”d pH based - pH 4.5 to 5.5 - 15 μg/L; pH >5.5 to 6.5 - 10% greater than background; pH >6.5 to 9.0 - 75 μg/Le pH based - pH < 6.5 - 15 μg/L; pH ≥ 6.5 - 100 μg/Lf hardness based - hardness 0 to < 5.3 mg/L - 0.11 μg/L; hardness ≥ 5.3 to ≤ 360 mg/L - (μg/L) = 10(1.016(log[hardness])-1.71); hardness > 360 mg/L - 7.7 μg/Lg hardness based - hardness > 0 to < 17 mg/L - 0.04 μg/L; hardness ≥ 17 to ≤ 280 mg/L - (μg/L) = 10(0.83(log[hardness])-2.46); hardness > 280 mg/L - 0.37 μg/Lh 75th percentile values were only compared to PWQO standards i 25th percentile values were calculated in addition to 75th percentile values for pH to account for acidic and basic spectrumsj narrative - Dissolved oxygen concentrations in warm water should not be less than the following values corresponding to temperatures:0 °C - 7 mg/L; 5 °C - 6 mg/L; 10 °C - 5 mg/L; 15 °C - 5 mg/L; 20 °C - 4 mg/L; 25 °C - 4 mg/L
CWQG-FAL
Table B1 - Tributary A Updated Water Quality Results

Maxxam ID AJZ867 AKI254 ALJ117 ALJ117 AMM787 ANO493 ANO493 AOS052 ATC561 ATC561 ATC563 AXF874 AXF874 BDC336 BDC338 BJL519 CCJ578 CCJ578 CGR905 CGR905 CKS024 CKS024 COV590 COV590 COV592Sampling Date 2015/06/04 12:00 2015/06/08 10:45 2015/06/15 10:45 2015/06/15 10:45 2015/06/22 13:30 2015/06/29 12:20 2015/06/29 12:20 2015/07/07 11:30 2015/08/05 12:10 2015/08/05 12:10 2015/08/05 12:20 2015/09/01 10:30 2015/09/01 10:30 2015/10/08 12:40 2015/10/08 12:50 2015/11/18 12:39 2016/03/30 14:00 2016/03/30 14:00 2016/04/28 14:30 2016/04/28 14:30 2016/05/26 14:15 2016/05/26 14:15 2016/06/22 13:00 2016/06/22 13:00 2016/06/22 13:15
COC Number 516572-01-01 516572-02-01 517189-01-01 517189-01-01 64870 517189-03-01 517189-03-01 516572-05-01 523913-01-01 523913-01-01 523913-01-01 527719-02-01 527719-02-01 533041-01-01 533041-01-01 539177-01-01 553050-01-01 553050-01-01 558977-01-01 558977-01-01 562666-01-01 562666-01-01 566321-02-01 566321-02-01 566321-02-01
Units PWQO RDL* IC 2 IC 2 IC 2 IC 2 Lab-Dup IC 2 IC 2 IC 2 Lab-Dup IC 2 IC 2 IC 2 Lab-Dup IC 2 Field-Dup IC 2 IC2 Lab-Dup IC 2 IC 2 Field-Dup IC2 IC2 IC2 Lab-Dup IC2 IC2 Lab-Dup IC2 IC2 Lab-Dup IC2 IC2 Lab-Dup IC2 Field Dup June-Sept 2015 Mean Mean Min Max 75th % h
Short Term Long TermField ParametersField pH pH - - - 0.2 - - 7.77 - 7.86 7.78 - 8.39 7.94 - 7.94 7.95 - 8.31 8.31 8.47 8.06 - 8.60 - 8.42 - 11.03 - 11.03 7.95 8.38 7.77 11.03 7.92 i, 8.43Field Temperature °C - - - -5 - - 17.86 - 21.22 18.82 - 24.43 22.25 - 22.25 24.29 - 15.18 15.18 8.01 6.90 - 8.50 - 24.20 - 28.70 - 28.70 21.48 18.36 6.90 28.70 24.22Field Dissolved Oxygen mg/L Narrative j - - 0.01 - - 5.86 - 7.49 7.81 - 6.09 7.74 - 7.74 6.40 - 14.80 14.80 13.90 14.32 - 14.88 - 13.72 - 15.30 - 15.30 6.90 10.69 5.86 15.30 14.44Field Conductivity uS/cm - - - 0 - - 685 - 888 551 - 891 841 - 841 794 - 716 716 1546 1027 - 944 - 871 - 776 - 776 775 878 551 1546 904Calculated ParametersBicarb. Alkalinity (calc. as CaCO3) mg/L - - - 1.0 170 120 190 - 200 140 - 180 130 - 130 150 - 150 150 - - - 200 - 210 - 140 - 140 160 165 120 210 193Carb. Alkalinity (calc. as CaCO3) mg/L - - - 1.0 1.6 0.5 0.5 - 4.3 0.5 - 3.0 1.3 - 1.1 1.8 - 2.1 1.7 - - - 3.1 - 4.6 - 5.5 - 5.8 1.7 2.4 0.5 5.5 3.4Hardness (CaCO3) mg/L - - - 1.0 300 210 280 - 300 210 - 280 240 - 240 260 - 260 250 - - - 300 - 280 - 240 - 230 260 263 210 300 285Langelier Index (@ 20C) N/A - - - - 0.666 0.248 0.288 - 1.100 -0.017 - 0.922 0.493 - 0.415 0.63 - 0.72 0.629 - - - 0.975 - 1.090 - 1.060 - 1.080 0.541 0.680 -0.020 1.100 0.996Langelier Index (@ 4C) N/A - - - - 0.419 0.000 0.040 - 0.854 -0.266 - 0.674 0.245 - 0.167 0.382 - 0.472 0.381 - - - 0.727 - 0.844 - 0.812 - 0.828 0.29 0.43 -0.27 0.85 0.75Saturation pH (@ 20C) N/A - - - - 7.320 7.600 7.290 - 7.260 7.500 - 7.330 7.56 - 7.55 7.49 - 7.45 7.46 - - - 7.25 - 7.27 - 7.55 - 7.55 7.42 7.41 7.25 7.60 7.51Saturation pH (@ 4C) N/A - - - - 7.570 7.850 7.540 - 7.510 7.750 - 7.580 7.8 - 7.8 7.74 - 7.69 7.71 - - - 7.49 - 7.52 - 7.79 - 7.80 7.67 7.65 7.49 7.85 7.76InorganicsConductivity umho/cm - - - 1.0 1000 660 800 - 910 620 - 870 870 - 880 840 - 740 740 880 912 - 950 940 870 - 770 - 780 821 835 620 1000 903Total Organic Carbon (TOC) mg/L - - - 0.20 7.10 0.20 12.00 - 6.90 13.00 - 6.70 8.4 8.4 9.9 8.3 - 6 6 4.8 6.6 - 5.9 - 4.8 - 7.9 - 7.8 7.8 7.0 0.2 13.0 8Orthophosphate (P) mg/L - - - 0.010 0.005 0.038 0.016 - 0.011 0.045 - 0.005 0.024 - 0.018 0.013 - 0.011 0.011 - 0.014 - 0.05 0.005 0.05 - 0.034 - 0.034 0.02 0.02 0.01 0.05 0.038pH pH 6.5 to 8.5 - 6.5 to 9.0 - 7.99 7.85 7.58 - 8.36 7.48 - 8.25 8.05 - 7.97 8.12 - 8.17 8.09 8.19 8.1 - 8.22 8.26 8.37 - 8.61 - 8.63 7.96 8.10 7.48 8.61 8.01 i, 8.24Total Phosphorus mg/L 0.03 - - 0 0.086 0.040 0.140 - 0.064 0.130 - 0.063 0.096 - 0.14 0.071 - 0.054 0.059 0.037 0.083 - 0.042 - 0.024 - 0.067 - 0.065 0.086 0.071 0.024 0.140 0.085Dissolved Sulphate (SO4) mg/L - - - 1 67 64 57 - 59 53 - 74 99 - 100 93 - 81 84 82 55 - 53 52 39 - 48 - 48 71 66 39 99 79Turbidity NTU Narrative b - Narrative b 0.2 13 130 37 - 12 14 - 14 30 - 38 6.1 - - - 7.1 33 - 7.6 - 3.3 - 2.9 - 2.7 32.0 23.9 2.9 130 30Alkalinity (Total as CaCO3) mg/L Narrative a - - 1.0 170 120 190 - 200 140 - 180 130 - 130 150 - 150 150 200 180 - 200 200 210 - 150 - 150 160 169 120 210 198Dissolved Chloride (Cl) mg/L - 640 120 1 150 93 110 - 130 71 - 120 130 - 130 130 - 91 93 100 150 - 140 140 120 - 130 - 130 117 119 71 150 130Total Ammonia-N mg/L - - - 0.01 0.05 0.01 0.05 - 0.07 0.04 - 0.04 0.05 - 0.04 0.025 - 0.02 0.02 0.02 0.02 - 0.005 - 0.03 0.03 0.04 - 0.04 0.04 0.03 0.01 0.07 0.05Total Kjeldahl Nitrogen (TKN) mg/L - - - 1.0 1.1 1.0 1.2 - 0.5 0.9 - 0.6 0.55 - 0.5 0.5 0.5 0.34 0.34 0.25 0.26 - 0.38 - 0.54 - 0.58 - 0.56 0.80 0.62 0.25 1.20 0.8Total Suspended Solids mg/L - - Narrative c 2 14 3 34 - 11 8 - 9 22 - 27 15 - 11 11 5 16 16 30 - 1 - 3 - 4 15 13 1 34 16Nitrite (N) mg/L - - 0.06 0.010 0.030 0.010 0.020 - 0.038 0.025 0.029 0.029 0.016 - 0.013 0.005 - 0.005 0.005 - 0.005 - 0.005 - 0.043 - 0.005 - 0.005 0.02 0.02 0.010 0.04 0.029Nitrate (N) mg/L - 124 2.93 0.10 2.10 0.10 1.51 - 0.96 2.41 2.49 0.87 0.05 - 0.05 0.05 - 0.1 0.11 - 1.82 - 1.25 - 0.81 - 0.05 - 0.05 1.01 0.93 0.05 2.41 1.51Nitrate + Nitrite mg/L - - - 0.10 0.10 1.52 - - - - 1.82 - - - - - - 0.81 1.15 0.10 1.82 1.67Percent Un-ionized Ammonia of Total % - - - - - - 0.020 - 0.030 0.021 - 0.118 0.039 - 0.039 0.046 - 0.053 0.053 0.045 0.016 - 0.062 - 0.124 - 0.230 - 0.239 0.046 0.067 0.016 0.230 0.076Un-ionized Ammonia mg/L 0.02 - 0.0165 - - - 0.0010 - 0.0021 0.0009 - 0.0047 0.0020 - 0.0016 0.0011 - 0.0011 0.0011 0.0009 0.0003 - 0.0003 - 0.0037 - 0.0092 - 0.0095 0.0020 0.0023 0.0003 0.0092 0.0025MetalsDissolved (0.2u) Aluminum (Al) ug/L pH based d - pH based e 5 3 8 14 - 8 6 - 8 6 - 2.5 6 2.5 2.5 - - - 6 - 6 - 8 8 7.3 6.8 2.5 14.0 8.0Dissolved Calcium (Ca) mg/L - - - 0.05 82 60 78 77 81 60 - 75 63 - 64 63 63 67 65 - - - 84 - 73 - 54 53 70 70 54 84 79Dissolved Magnesium (Mg) mg/L - - - 0.05 22 14 19 19 23 14 - 22 20 - 20 24 24 22 21 - - - 23 - 25 - 25 24 20 21 14 25 23Dissolved Potassium (K) mg/L - - - 1 4 5 4 4 4 4 - 4 5 - 5 5 4 5 5 - - - 3 - 2 - 2 2 4.4 3.9 2.0 5.0 5Dissolved Sodium (Na) mg/L - - - 0.5 110 62 71 70 90 47 - 82 87 - 87 83 82 61 60 - - - 100 - 79 - 87 86 79 80 47 110 88Total Aluminum (Al) ug/L - - - 5.0 480 7200 1400 - 410 610 - 390 740 - 1500 300 - 450 420 200 1800 1800 360 - 130 - 110 120 130 1441 1041 110 7200 708Total Antimony (Sb) ug/L 20 - - 0.50 0.25 0.25 0.25 - 0.25 0.25 - 0.25 0.25 - 0.25 0.25 - 0.25 0.25 0.25 0.25 0.25 0.25 - 0.25 - 0.25 0.25 0.25 0.25 0.25 0.25 0.25 0.25Total Arsenic (As) ug/L 100 - 5 1.0 0.5 2.3 1.3 - 1.1 0.5 - 1.1 1.6 - 1.6 1.5 - 0.5 0.5 0.5 0.5 0.5 0.5 - 0.5 - 2.3 2.3 2.2 1.24 1.05 0.50 2.30 1.5Total Barium (Ba) ug/L - - - 2.0 55 79 51 - 55 37 - 51 48 - 56 46 - 46 47 51 50 51 50 - 47 - 26 25 26 53 49 26 79 51Total Beryllium (Be) ug/L 1100 - - 0.50 0.25 0.25 0.25 - 0.25 0.25 - 0.25 0.25 - 0.25 0.25 - 0.25 0.25 0.25 0.25 0.25 0.25 - 0.25 - 0.25 0.25 0.25 0.25 0.25 0.25 0.25 0.25Total Bismuth (Bi) ug/L - - - 1.0 - 0.5 0.5 - 0.5 - - - - - - - - - - 0.5 0.5 0.5 - - - - - - - 0.50 0.50 0.50 0.5Total Boron (B) ug/L 200 29000 1500 10 60 54 57 - 71 61 - 68 71 - 73 81 - 76 76 56 34 36 52 - 60 - 57 55 59 65 61 34 81 70Total Cadmium (Cd) ug/L 0.2 hardness based f hardness based g 0.10 0.05 0.12 0.05 - 0.05 0.05 - 0.05 0.05 - 0.05 0.05 - 0.05 0.05 0.05 0.05 0.05 0.05 - 0.05 - 0.05 0.05 0.05 0.05 0.05 0.05 0.05 0.05Total Calcium (Ca) ug/L - - - 200 76000 60000 72000 - 74000 58000 - 74000 61000 - 65000 61000 - 63000 62000 82000 69000 69000 78000 - 70000 - 46000 45000 48000 67000 67429 46000 82000 74000Total Chromium (Cr) ug/L 8.9 - 8.9 5.0 2.5 9.0 2.5 - 2.5 2.5 - 2.5 2.5 - 2.5 2.5 - 2.5 2.5 2.5 2.5 2.5 2.5 - 2.5 - 2.5 2.5 2.5 3.3 3.0 2.5 9.0 2.5Total Cobalt (Co) ug/L 0.9 - - 0.50 0.25 3.40 0.64 - 0.25 0.25 - 0.25 0.25 - 0.98 0.25 - 0.25 0.25 0.25 0.25 0.25 0.25 - 0.25 - 0.25 0.25 0.25 0.69 0.50 0.25 3.4 0.3Total Copper (Cu) ug/L 5 - 4 1.0 3.5 15.0 5.1 - 2.9 4.6 - 2.7 3.2 - 4.6 2.2 - 2 16 1.8 3.1 3.2 2.5 - 2.1 - 1.9 1.8 1.7 5 4 2 15 3.4Total Iron (Fe) ug/L 300 - 300 100 590 8800 1500 - 510 620 - 480 1000 - 2000 460 - 560 590 280 1300 1400 410 - 160 - 190 190 210 1745 1204 160 8800 905Total Lead (Pb) ug/L 5 - 7 0.50 0.56 5.60 0.92 - 0.25 0.25 - 0.25 0.9 - 1.6 0.25 - 0.25 0.25 0.25 0.74 0.69 0.25 - 0.25 - 0.25 0.25 0.25 1.12 0.78 0.25 5.6 0.70Total Lithium (Li) ug/L - - - 5.0 - 11.0 2.5 - 5.8 - - - - - - - - - - 5.6 2.5 2.5 - - - - - - 6.4 5.5 2.5 11.0 5.8Total Magnesium (Mg) ug/L - - - 50 22000 16000 18000 - 22000 15000 - 22000 21000 - 21000 23000 - 21000 21000 23000 17000 17000 22000 - 24000 - 22000 22000 22000 19875 20571 15000 24000 22000Total Manganese (Mn) ug/L - - - 2.0 66 280 71 - 53 25 - 55 110 - 200 130 - 63 66 20 31 31 44 - 22 - 50 49 51 99 73 20 280 70Total Molybdenum (Mo) ug/L 40 - 73 0.50 1.5 1.1 1.1 - 1.2 1.0 - 1.6 2.1 - 2.1 1.8 - 1.7 1.5 0.92 0.78 0.75 1 - 1.30 - 1.70 1.60 1.70 1.43 1.34 0.78 2.1 1.68Total Nickel (Ni) ug/L 25 - 150 1.0 1.6 9.4 3.0 - 1.5 1.6 - 1.5 2 - 4.9 1.7 - 1.2 1.1 0.5 1.7 1.7 0.5 - 0.5 - 0.5 0.5 1.1 2.79 1.94 0.50 9.4 2Total Potassium (K) ug/L - - - 200 3900 5600 3900 - 3400 3800 - 3600 4500 - 4700 4100 - 4500 4500 3600 3500 3500 2900 - 2200 - 1700 1700 1800 4100 3657 1700 5600 4050Total Silicon (Si) ug/L - - - 50 2000 12000 5200 - 1200 4000 - 1700 2300 - 3400 990 - 1800 1700 800 4400 4600 890 - 340 - 810 840 880 3674 2745 340 12000 3575Total Selenium (Se) ug/L 100 - 1 2.0 1 1 1 - 1 1 - 1 1 - 1 1 - 1 1 1 1 1 1 - 1 - 1 1 1 1 1 1 1 1Total Silver (Ag) ug/L 0.1 - 0.1 0.10 0.05 0.05 0.05 - 0.05 0.05 - 0.05 0.05 - 0.05 0.05 - 0.12 0.11 0.05 0.05 0.05 0.05 - 0.05 - 0.05 0.05 0.05 0.05 0.06 0.05 0.12 0.05Total Sodium (Na) ug/L - - - 100 100000 56000 63000 - 81000 47000 - 79000 87000 - 86000 80000 - 58000 58000 57000 84000 85000 90000 - 74000 - 76000 75000 79000 74125 73714 47000 100000 83250Total Strontium (Sr) ug/L - - - 1.0 550 390 430 - 510 350 - 540 760 - 780 640 - 610 610 590 400 410 480 - 440 - 400 390 400 521 506 350 760 580Total Tellurium (Te) ug/L - - - 1.0 - 0.5 0.5 - 0.5 - - - - - - - - - - 0.5 0.5 0.5 - - - - - - - 0.50 0.50 0.50 0.5 0.5Total Thallium (Tl) ug/L 0.3 - - 0.050 0.025 0.093 0.025 - 0.025 0.025 - 0.025 0.025 - 0.025 0.025 - 0.025 0.025 0.025 0.025 0.025 0.025 - 0.025 - 0.025 0.025 0.025 0.03 0.03 0.03 0.1 0.025Total Tin (Sn) ug/L - - - 1.0 - 0.5 0.5 - 0.5 - - - - - - - - - - 0.5 0.5 0.5 - - - - - - - 0.50 0.50 0.50 0.5 0.5Total Titanium (Ti) ug/L - - - 5.0 11.0 150.0 21.0 - 11.0 20.0 - 20.0 17 - 28 7.1 - 12 10 10 22 23 8.7 - 5 - 3 3 3 32 23 3 150 20.0Total Tungsten (W) ug/L 30 - - 1.0 - 0.5 0.5 - 0.5 - - - - - - - - - - 0.5 0.5 0.5 - - - - - - 0.50 0.50 0.50 0.5 0.5Total Uranium (U) ug/L 5 33 15 0.10 - 0.78 1.30 - 1.20 - - - 1.2 - 1.3 - - - - 1.6 1.2 1.2 - - - - - - 1.12 1.21 0.78 1.6 1.28Total Vanadium (V) ug/L 6 - - 0.50 1.40 13.00 3.10 - 1.50 2.00 - 1.70 2.4 - 3.8 1.5 - 1.5 1.5 0.85 3 3.1 1 - 0.8 - 1.4 1.4 1.6 3.3 2.5 0.8 13.0 2.3Total Zinc (Zn) ug/L 20 - 30 5.0 6.5 69.0 8.9 - 2.5 2.5 - 2.5 16 - 9.1 2.5 - 2.5 2.5 2.5 7.2 8.3 2.5 - 2.5 - 2.5 2.5 2.5 13.8 9.3 2.5 69.0 7.0
Total Zirconium (Zr) ug/L 4 - - 1.0 - 2.4 0.5 - 0.5 - - - - - - - - 0.9 0.5 2.4 - - 0.5 0.5 1.2 - - - - 1.1 0.9 0.5 2.4 0.5
Notes:- Concentration exceeds the indicated standard
Bolded values indicate a maximum or minimum occurred during October 2015 - June 2016 samples RDL = Reportable Detection Limit"-" = No standard/guideline, or value for this parameter CCME CWQG-FAL=Canadian Council of Ministers of the Environment Canadian Water Quality Guidelines
* - Any parameter measurement at the detection limit value was adjusted to half of the RDL for the Protection of Aquatic Lifea narrative - Alkalinity should not be decreased by more than 25% of the natural concentration PWQO = Provincial Water Quality Objectivesb narrative – Turbidity – Maximum increase of 8 NTUs from background levels for a short-term exposure (e.g., 24 hr Lab-Dup = Laboratory Initiated Duplicateperiod). Maximum average increase of 2 NTUs from background levels for a longer term exposure (e.g., 30-d period). Field-Dup = Field Duplicatec narrative- Total suspended solids – “clear flow: Maximum increase of 25 mg/L from background levels for any short-termexposure (e.g., 24-h period). Maximum average increase of 5 mg/L from background levels for longer term exposures(e.g., inputs lasting between 24 h and 30 d).”d pH based - pH 4.5 to 5.5 - 15 μg/L; pH >5.5 to 6.5 - 10% greater than background; pH >6.5 to 9.0 - 75 μg/Le pH based - pH < 6.5 - 15 μg/L; pH ≥ 6.5 - 100 μg/Lf hardness based - hardness 0 to < 5.3 mg/L - 0.11 μg/L; hardness ≥ 5.3 to ≤ 360 mg/L - (μg/L) = 10(1.016(log[hardness])-1.71) ; hardness > 360 mg/L - 7.7 μg/Lg hardness based - hardness > 0 to < 17 mg/L - 0.04 μg/L; hardness ≥ 17 to ≤ 280 mg/L - (μg/L) = 10(0.83(log[hardness])-2.46) ; hardness > 280 mg/L - 0.37 μg/Lh 75th percentile values were only compared to PWQO standards i 25th percentile values were calculated in addition to 75th percentile values for pH to account for acidic and basic spectrumsj narrative - Dissolved oxygen concentrations in warm water should not be less than the following values corresponding to temperatures:0 °C - 7 mg/L; 5 °C - 6 mg/L; 10 °C - 5 mg/L; 15 °C - 5 mg/L; 20 °C - 4 mg/L; 25 °C - 4 mg/L
CWQG-FAL
Table B2 - IC2 Updated Water Quality Results
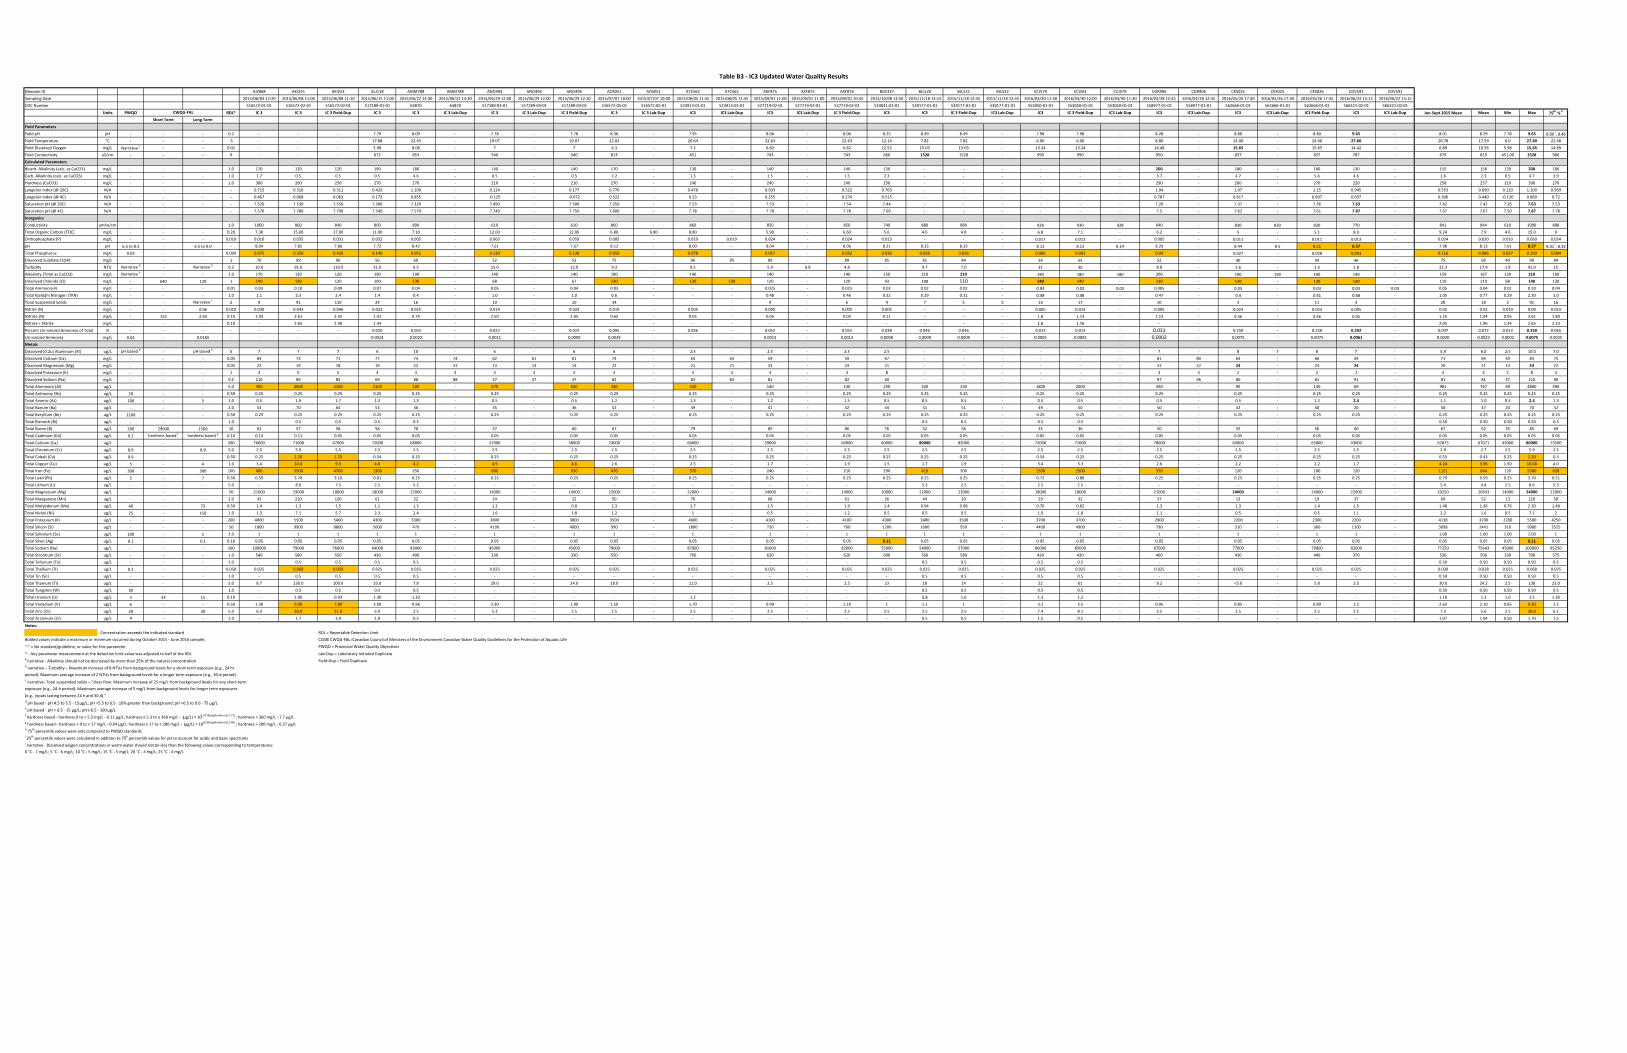
Maxxam ID AJZ868 AKI255 AKI253 ALJ118 AMM788 AMM788 ANO494 ANO494 ANO496 AOS051 AOS051 ATC562 ATC562 AXF875 AXF875 AXF876 BDC337 BJL520 BJL522 BJL522 CCJ579 CCJ581 CCJ579 CGR906 CGR906 CKS025 CKS025 CKS026 COV591 COV591Sampling Date 2015/06/04 12:20 2015/06/08 11:00 2015/06/08 11:10 2015/06/15 11:00 2015/06/22 14:30 2015/06/22 14:30 2015/06/29 12:00 2015/06/29 12:00 2015/06/29 12:10 2015/07/07 10:00 2015/07/07 10:00 2015/08/05 11:45 2015/08/05 11:45 2015/09/01 11:00 2015/09/01 11:00 2015/09/01 10:45 2015/10/08 13:50 2015/11/18 13:15 2015/11/18 12:45 2015/11/18 12:45 2016/03/30 11:30 2016/03/30 12:00 2016/03/30 11:30 2016/04/28 12:45 2016/04/28 12:45 2016/05/26 17:30 2016/05/26 17:30 2016/05/26 17:45 2016/06/22 15:15 2016/06/22 15:15COC Number 516572-01-01 516572-02-01 516572-02-01 517189-01-01 64870 64870 517189-03-01 517189-03-01 517189-03-01 516572-05-01 516572-05-01 523913-01-01 523913-01-01 527719-02-01 527719-02-01 527719-02-01 533041-01-01 539177-01-01 539177-01-01 539177-01-01 553050-01-01 553050-01-01 553050-01-01 558977-01-01 558977-01-01 562666-01-01 562666-01-01 562666-01-01 566321-02-01 566321-02-01
Units PWQO RDL* IC 3 IC 3 IC 3 Field-Dup IC 3 IC 3 IC 3 Lab-Dup IC 3 IC 3 Lab-Dup IC 3 Field-Dup IC 3 IC 3 Lab-Dup IC3 IC3 Lab-Dup IC3 IC3 Lab-Dup IC 3 Field-Dup IC3 IC3 IC 3 Field-Dup IC3 Lab-Dup IC3 IC 3 Field-Dup IC3 Lab-Dup IC3 IC3 Lab-Dup IC3 IC3 Lab-Dup IC3 Field-Dup IC3 IC3 Lab-Dup Jun-Sept 2015 Mean Mean Min Max 75th % h
Short Term Long TermField ParametersField pH pH - - - 0.2 - - - 7.79 8.09 - 7.78 - 7.78 8.36 - 7.95 - 8.06 - 8.06 8.25 8.49 8.49 - 7.98 7.98 - 8.28 - 8.80 - 8.80 9.65 - 8.01 8.29 7.78 9.65 8.00 i, 8.46Field Temperature °C - - - -5 - - - 17.88 22.45 - 19.07 - 19.07 22.02 - 20.64 - 22.63 - 22.63 12.14 7.82 7.82 - 6.00 6.00 - 8.80 - 24.00 - 24.00 27.60 - 20.78 17.59 6.0 27.60 22.48Field Dissolved Oxygen mg/L Narrative j - - 0.01 - - - 5.98 8.06 - 7 - 7 6.3 - 7.2 - 6.82 - 6.82 12.52 15.03 15.03 - 13.24 13.24 - 14.48 - 15.65 - 15.65 14.42 - 6.89 10.56 5.98 15.65 14.89Field Conductivity uS/cm - - - 0 - - - 672 853 - 540 - 540 813 - 451 - 743 - 743 660 1528 1528 - 990 990 - 950 - 837 - 837 787 - 679 819 451.00 1528 980Calculated ParametersBicarb. Alkalinity (calc. as CaCO3) mg/L - - - 1.0 170 120 120 190 180 - 140 - 140 170 - 130 - 140 - 140 150 - - - - - - 200 - 180 - 180 130 - 155 158 120 200 180Carb. Alkalinity (calc. as CaCO3) mg/L - - - 1.0 1.7 0.5 0.5 0.5 4.6 - 0.5 - 0.5 2.2 - 1.3 - 1.5 - 1.5 2.3 - - - - - - 3.7 - 4.7 - 5.6 4.6 - 1.6 2.3 0.5 4.7 3.9Hardness (CaCO3) mg/L - - - 1.0 300 260 250 270 270 - 210 - 210 270 - 240 - 240 - 240 250 - - - - - - 290 - 260 - 270 220 - 258 257 210 300 270Langelier Index (@ 20C) N/A - - - - 0.715 0.316 0.311 0.420 1.100 - 0.124 - 0.177 0.770 - 0.478 - 0.503 - 0.522 0.763 - - - - - - 1.04 - 1.07 - 1.15 0.945 - 0.553 0.690 0.120 1.100 0.969Langelier Index (@ 4C) N/A - - - - 0.467 0.068 0.063 0.172 0.855 - -0.125 - -0.072 0.522 - 0.23 - 0.255 - 0.274 0.515 - - - - - - 0.787 - 0.817 - 0.897 0.697 - 0.306 0.440 -0.130 0.860 0.72Saturation pH (@ 20C) N/A - - - - 7.320 7.530 7.550 7.300 7.320 - 7.490 - 7.500 7.350 - 7.53 - 7.53 - 7.54 7.44 - - - - - - 7.26 - 7.37 - 7.36 7.63 - 7.42 7.42 7.26 7.63 7.53Saturation pH (@ 4C) N/A - - - - 7.570 7.780 7.790 7.540 7.570 - 7.740 - 7.750 7.600 - 7.78 - 7.78 - 7.78 7.69 - - - - - - 7.5 - 7.62 - 7.61 7.87 - 7.67 7.67 7.50 7.87 7.78InorganicsConductivity umho/cm - - - 1.0 1000 860 840 800 890 - 610 - 610 860 - 860 - 850 - 850 740 880 880 - 928 930 928 940 - 830 830 830 770 - 841 844 610 1000 888Total Organic Carbon (TOC) mg/L - - - 0.20 7.30 15.00 17.00 11.00 7.10 - 12.00 - 12.00 6.80 6.80 8.80 - 5.90 - 6.60 5.6 4.6 4.8 - 6.8 7.1 - 6.2 - 5 - 5.1 8.9 - 9.24 7.9 4.6 15.0 9Orthophosphate (P) mg/L - - - 0.010 0.010 0.035 0.031 0.032 0.005 - 0.063 - 0.059 0.005 - 0.019 0.019 0.024 - 0.024 0.013 - - - 0.017 0.013 - 0.005 - 0.011 - 0.011 0.013 - 0.024 0.020 0.010 0.060 0.024pH pH 6.5 to 8.5 - 6.5 to 9.0 - 8.04 7.85 7.86 7.72 8.42 - 7.61 - 7.67 8.12 - 8.00 - 8.04 - 8.06 8.21 8.33 8.33 - 8.13 8.13 8.14 8.29 - 8.44 8.5 8.51 8.57 - 7.98 8.13 7.61 8.57 8.01 i, 8.32Total Phosphorus mg/L 0.03 - - 0.004 0.075 0.350 0.420 0.140 0.051 - 0.130 - 0.130 0.050 - 0.078 - 0.057 - 0.052 0.036 0.038 0.036 - 0.086 0.093 - 0.04 - 0.027 - 0.028 0.041 - 0.116 0.086 0.027 0.350 0.084Dissolved Sulphate (SO4) mg/L - - - 1 70 99 96 56 60 - 52 - 53 75 96 95 89 - 89 85 81 84 - 54 55 - 52 - 40 - 39 46 - 75 68 40 99 84Turbidity NTU Narrative b - Narrative b 0.2 10.0 91.0 110.0 31.0 6.5 - 15.0 - 12.0 9.3 - 9.5 - 5.9 6.8 4.8 - 9.7 7.0 - 31 30 - 8.8 - 2.6 - 2.3 1.8 - 22.3 17.9 1.8 91.0 15Alkalinity (Total as CaCO3) mg/L Narrative a - - 1.0 170 120 120 190 190 - 140 - 140 180 - 140 - 140 - 140 150 210 210 - 180 180 180 200 - 190 190 190 140 - 159 167 120 210 190Dissolved Chloride (Cl) mg/L - 640 120 1 140 130 120 100 130 - 68 - 67 130 - 130 130 120 - 120 93 100 110 - 140 140 - 130 - 120 - 120 130 - 119 119 68 140 130Total Ammonia-N mg/L - - - 0.01 0.03 0.10 0.09 0.07 0.04 - 0.05 - 0.04 0.03 - - - 0.025 - 0.025 0.02 0.02 0.02 - 0.04 0.02 0.03 0.005 - 0.03 - 0.03 0.03 0.03 0.05 0.04 0.01 0.10 0.04Total Kjeldahl Nitrogen (TKN) mg/L - - - 1.0 1.1 2.3 2.4 1.4 0.4 - 1.0 - 1.0 0.6 - - - 0.48 - 0.46 0.32 0.29 0.31 - 0.48 0.48 - 0.47 - 0.4 - 0.41 0.68 - 1.05 0.77 0.29 2.30 1.0Total Suspended Solids mg/L - - Narrative c 2 9 91 110 29 16 - 10 - 10 34 - - - 4 - 6 4 7 5 5 14 17 - 10 - 3 - 11 3 - 28 18 3 91 16Nitrite (N) mg/L - - 0.06 0.010 0.030 0.043 0.046 0.022 0.025 - 0.019 - 0.023 0.019 - 0.005 - 0.005 - 0.005 0.005 - - - 0.005 0.013 - 0.005 - 0.023 - 0.024 0.005 - 0.02 0.02 0.010 0.04 0.023Nitrate (N) mg/L - 124 2.93 0.10 1.93 2.61 2.35 1.41 0.79 - 2.50 - 2.45 0.65 - 0.05 - 0.05 - 0.05 0.11 - - - 1.8 1.74 - 1.13 - 0.46 - 0.46 0.05 - 1.25 1.04 0.05 2.61 1.80Nitrate + Nitrite mg/L - - - 0.10 - 2.65 2.40 1.44 - - - - - - - - - - - - - - - 1.8 1.76 - - - - - - - 2.05 1.96 1.44 2.65 2.23Percent Un-ionized Ammonia of Total % - - - - - - - 0.020 0.055 - 0.022 - 0.022 0.095 - 0.036 - 0.052 - 0.052 0.038 0.046 0.046 - 0.013 0.013 - 0.031 - 0.250 - 0.250 0.202 - 0.047 0.072 0.013 0.250 0.065Un-ionized Ammonia mg/L 0.02 - 0.0165 - - - - 0.0014 0.0022 - 0.0011 - 0.0009 0.0029 - - - 0.0013 - 0.0013 0.0008 0.0009 0.0009 - 0.0005 0.0003 - 0.0002 - 0.0075 - 0.0075 0.0061 - 0.0020 0.0023 0.0002 0.0075 0.0025MetalsDissolved (0.2u) Aluminum (Al) ug/L pH based d - pH based e 5 7 7 7 6 10 - 6 - 6 6 - 2.5 - 2.5 - 2.5 2.5 - - - - - - 7 - 8 7 8 7 - 5.9 6.0 2.5 10.0 7.0Dissolved Calcium (Ca) mg/L - - - 0.05 83 73 71 77 74 74 62 61 61 74 - 64 63 59 - 59 67 - - - - - - 81 80 64 - 66 49 - 71 69 49 83 75Dissolved Magnesium (Mg) mg/L - - - 0.05 22 19 18 19 22 22 14 14 14 22 - 21 21 23 - 23 21 - - - - - - 22 22 24 - 24 24 - 20 21 14 24 22Dissolved Potassium (K) mg/L - - - 1 4 5 5 4 4 4 4 4 4 4 - 4 4 4 - 4 5 - - - - - - 3 3 2 - 2 2 - 4 4 2 5 4Dissolved Sodium (Na) mg/L - - - 0.5 110 89 85 69 88 88 47 47 47 82 - 83 83 81 - 82 60 - - - - - - 97 96 80 - 81 91 - 81 81 47 110 90Total Aluminum (Al) ug/L - - - 5.0 300 4800 4200 1100 180 - 670 - 620 340 - 320 - 140 - 130 250 320 230 - 1800 2000 - 350 - 95 - 130 69 - 981 767 69 4800 590Total Antimony (Sb) ug/L 20 - - 0.50 0.25 0.25 0.25 0.25 0.25 - 0.25 - 0.25 0.25 - 0.25 - 0.25 - 0.25 0.25 0.25 0.25 - 0.25 0.25 - 0.25 - 0.25 - 0.25 0.25 - 0.25 0.25 0.25 0.25 0.25Total Arsenic (As) ug/L 100 - 5 1.0 0.5 1.9 1.7 1.2 1.3 - 0.5 - 0.5 1.2 - 1.3 - 1.2 - 1.5 0.5 0.5 0.5 - 0.5 0.5 - 0.5 - 0.5 - 1.2 2.4 - 1.1 1.0 0.5 2.4 1.3Total Barium (Ba) ug/L - - - 2.0 54 70 64 53 46 - 35 - 36 52 - 49 - 41 - 42 44 51 51 - 49 50 - 50 - 42 - 40 20 - 50 47 20 70 52Total Beryllium (Be) ug/L 1100 - - 0.50 0.25 0.25 0.25 0.25 0.25 - 0.25 - 0.25 0.25 - 0.25 - 0.25 - 0.25 0.25 0.25 0.25 - 0.25 0.25 - 0.25 - 0.25 - 0.25 0.25 - 0.25 0.25 0.25 0.25 0.25Total Bismuth (Bi) ug/L - - - 1.0 - 0.5 0.5 0.5 0.5 - - - - - - - - - - - - 0.5 0.5 - 0.5 0.5 - - - - - - - 0.50 0.50 0.50 0.50 0.5Total Boron (B) ug/L 200 29000 1500 10 62 57 58 58 70 - 57 - 60 67 - 79 - 85 - 86 76 52 56 - 35 36 - 50 - 55 - 56 60 - 67 62 35 85 69Total Cadmium (Cd) ug/L 0.2 hardness based f hardness based g 0.10 0.14 0.11 0.05 0.05 0.05 - 0.05 - 0.05 0.05 - 0.05 - 0.05 - 0.05 0.05 0.05 0.05 - 0.05 0.05 - 0.05 - 0.05 - 0.05 0.05 - 0.05 0.05 0.05 0.05 0.05Total Calcium (Ca) ug/L - - - 200 76000 71000 67000 72000 68000 - 57000 - 58000 74000 - 66000 - 59000 - 60000 60000 80000 82000 - 72000 71000 - 78000 - 63000 - 65000 43000 - 67875 67071 43000 80000 73500Total Chromium (Cr) ug/L 8.9 - 8.9 5.0 2.5 5.9 5.5 2.5 2.5 - 2.5 - 2.5 2.5 - 2.5 - 2.5 - 2.5 2.5 2.5 2.5 - 2.5 2.5 - 2.5 - 2.5 - 2.5 2.5 - 2.9 2.7 2.5 5.9 2.5Total Cobalt (Co) ug/L 0.9 - - 0.50 0.25 2.20 1.70 0.54 0.25 - 0.25 - 0.25 0.25 - 0.25 - 0.25 - 0.25 0.25 0.25 0.25 - 0.54 0.25 - 0.25 - 0.25 - 0.25 0.25 - 0.53 0.43 0.25 2.20 0.3Total Copper (Cu) ug/L 5 - 4 1.0 3.4 10.0 9.3 4.6 4.2 - 4.9 - 4.6 2.6 - 2.5 - 1.7 - 1.9 1.5 1.7 1.9 - 3.4 3.3 - 2.6 - 2.2 - 2.2 1.7 - 4.24 3.36 1.50 10.00 4.0Total Iron (Fe) ug/L 300 - 300 100 400 5500 4700 1300 250 - 680 - 630 470 - 370 - 240 - 210 290 410 300 - 1300 1500 - 370 - 120 - 180 120 - 1151 844 120 5500 628Total Lead (Pb) ug/L 5 - 7 0.50 0.59 3.70 3.10 0.81 0.25 - 0.25 - 0.25 0.25 - 0.25 - 0.25 - 0.25 0.25 0.25 0.25 - 0.72 0.88 - 0.25 - 0.25 - 0.25 0.25 - 0.79 0.59 0.25 3.70 0.51Total Lithium (Li) ug/L - - - 5.0 - 8.6 7.5 2.5 5.2 - - - - - - - - - - - - 5.3 2.5 - 2.5 2.5 - - - - - - - - 5.4 4.8 2.5 8.6 5.3Total Magnesium (Mg) ug/L - - - 50 21000 19000 18000 18000 22000 - 14000 - 14000 22000 - 22000 - 24000 - 24000 20000 22000 23000 - 18000 18000 - 21000 - 24000 - 24000 22000 - 20250 20643 14000 24000 22000Total Manganese (Mn) ug/L - - - 2.0 43 210 120 61 22 - 24 - 22 50 - 70 - 68 - 61 26 44 20 - 29 32 - 37 - 13 - 19 37 - 69 52 13 210 58Total Molybdenum (Mo) ug/L 40 - 73 0.50 1.4 1.3 1.5 1.1 1.3 - 1.2 - 0.8 2.3 - 1.7 - 1.5 - 1.9 1.4 0.94 0.98 - 0.76 0.82 - 1.3 - 1.3 - 1.4 1.5 - 1.48 1.36 0.76 2.30 1.48Total Nickel (Ni) ug/L 25 - 150 1.0 1.3 7.1 5.7 2.3 2.4 - 1.6 - 1.8 1.2 - 1 - 0.5 - 1.2 0.5 0.5 0.5 - 1.9 1.8 - 1.1 - 0.5 - 0.5 1.1 - 2.2 1.6 0.5 7.1 2Total Potassium (K) ug/L - - - 200 4000 5500 5400 4300 3300 - 3800 - 3800 3500 - 4600 - 4100 - 4100 4300 3400 3500 - 3700 3700 - 2900 - 2200 - 2300 2200 - 4138 3700 2200 5500 4250Total Silicon (Si) ug/L - - - 50 1800 9900 8800 5000 470 - 4100 - 4000 990 - 1800 - 720 - 760 1200 1600 950 - 4400 4900 - 790 - 310 - 360 1100 - 3098 2441 310 9900 3525Total Selenium (Se) ug/L 100 - 1 2.0 1 1 1 1 1 - 1 - 1 1 - 1 - 1 - 1 1 1 1 - 1 1 - 1 - 1 - 1 1 - 1.00 1.00 1.00 1.00 1Total Silver (Ag) ug/L 0.1 - 0.1 0.10 0.05 0.05 0.05 0.05 0.05 - 0.05 - 0.05 0.05 - 0.05 - 0.05 - 0.05 0.11 0.05 0.05 - 0.05 0.05 - 0.05 - 0.05 - 0.05 0.05 - 0.05 0.05 0.05 0.11 0.05Total Sodium (Na) ug/L - - - 100 100000 79000 76000 64000 83000 - 45000 - 45000 79000 - 87000 - 81000 - 82000 55000 54000 57000 - 86000 85000 - 87000 - 77000 - 79000 82000 - 77250 75643 45000 100000 85250Total Strontium (Sr) ug/L - - - 1.0 540 580 550 430 490 - 330 - 330 550 - 700 - 620 - 620 600 560 580 - 420 420 - 460 - 430 - 440 370 - 530 506 330 700 575Total Tellurium (Te) ug/L - - - 1.0 - 0.5 0.5 0.5 0.5 - - - - - - - - - - - - 0.5 0.5 - 0.5 0.5 - - - - - - - 0.50 0.50 0.50 0.50 0.5Total Thallium (Tl) ug/L 0.3 - - 0.050 0.025 0.068 0.058 0.025 0.025 - 0.025 - 0.025 0.025 - 0.025 - 0.025 - 0.025 0.025 0.025 0.025 - 0.025 0.025 - 0.025 - 0.025 - 0.025 0.025 - 0.030 0.028 0.025 0.068 0.025Total Tin (Sn) ug/L - - - 1.0 - 0.5 0.5 0.5 0.5 - - - - - - - - - - - - 0.5 0.5 - 0.5 0.5 - - - - - - - 0.50 0.50 0.50 0.50 0.5Total Titanium (Ti) ug/L - - - 5.0 8.7 130.0 100.0 33.0 7.8 - 29.0 - 24.0 18.0 - 11.0 2.5 2.5 23 18 14 - 22 61 - 9.2 - <5.0 - 5.8 2.5 - 30.0 24.2 2.5 130 23.0Total Tungsten (W) ug/L 30 - - 1.0 - 0.5 0.5 0.5 0.5 - - - - - - - - - - - - 0.5 0.5 - 0.5 0.5 - - - - - - - 0.50 0.50 0.50 0.50 0.5Total Uranium (U) ug/L 5 33 15 0.10 - 1.00 0.93 1.30 1.20 - - - - - - 1.2 - - - - - 1.5 1.6 - 1.3 1.2 - - - - - - - 1.18 1.3 1.0 1.5 1.30Total Vanadium (V) ug/L 6 - - 0.50 1.30 9.30 7.80 3.00 0.96 - 2.30 - 1.90 1.50 - 1.70 - 0.99 - 1.10 1 1.1 1 - 3.2 3.5 - 0.95 - 0.85 - 0.89 1.2 - 2.63 2.10 0.85 9.30 2.2Total Zinc (Zn) ug/L 20 - 30 5.0 6.3 30.0 31.0 6.9 2.5 - 5.3 - 2.5 2.5 - 2.5 - 2.5 - 2.5 2.5 2.5 2.5 - 7.4 8.1 - 2.5 - 2.5 - 2.5 2.5 - 7.3 5.6 2.5 30.0 6.1Total Zirconium (Zr) ug/L 4 - - 1.0 - 1.7 3.9 1.0 0.5 - - - - - - - - - - - - 0.5 0.5 - 1.5 0.5 - - - - - - - 1.07 1.04 0.50 1.70 1.5
Notes:- Concentration exceeds the indicated standard RDL = Reportable Detection Limit
Bolded values indicate a maximum or minimum occurred during October 2015 - June 2016 samples CCME CWQG-FAL=Canadian Council of Ministers of the Environment Canadian Water Quality Guidelines for the Protec on of Aqua c Life
"-" = No standard/guideline, or value for this parameter PWQO = Provincial Water Quality Objectives
* - Any parameter measurement at the detection limit value was adjusted to half of the RDL Lab-Dup = Laboratory Initiated Duplicatea narrative - Alkalinity should not be decreased by more than 25% of the natural concentration Field-Dup = Field Duplicateb narrative – Turbidity – Maximum increase of 8 NTUs from background levels for a short-term exposure (e.g., 24 hrperiod). Maximum average increase of 2 NTUs from background levels for a longer term exposure (e.g., 30-d period).c narrative- Total suspended solids – “clear flow: Maximum increase of 25 mg/L from background levels for any short-termexposure (e.g., 24-h period). Maximum average increase of 5 mg/L from background levels for longer term exposures(e.g., inputs lasting between 24 h and 30 d).”d pH based - pH 4.5 to 5.5 - 15 μg/L; pH >5.5 to 6.5 - 10% greater than background; pH >6.5 to 9.0 - 75 μg/Le pH based - pH < 6.5 - 15 μg/L; pH ≥ 6.5 - 100 μg/Lf hardness based - hardness 0 to < 5.3 mg/L - 0.11 μg/L; hardness ≥ 5.3 to ≤ 360 mg/L - (μg/L) = 10(1.016(log[hardness])-1.71) ; hardness > 360 mg/L - 7.7 μg/Lg hardness based - hardness > 0 to < 17 mg/L - 0.04 μg/L; hardness ≥ 17 to ≤ 280 mg/L - (μg/L) = 10(0.83(log[hardness])-2.46) ; hardness > 280 mg/L - 0.37 μg/Lh 75th percentile values were only compared to PWQO standards i 25th percentile values were calculated in addition to 75th percentile values for pH to account for acidic and basic spectrumsj narrative - Dissolved oxygen concentrations in warm water should not be less than the following values corresponding to temperatures:0 °C - 7 mg/L; 5 °C - 6 mg/L; 10 °C - 5 mg/L; 15 °C - 5 mg/L; 20 °C - 4 mg/L; 25 °C - 4 mg/L
CWQG-FAL
Table B3 - IC3 Updated Water Quality Results
Prepared on April 21, 2017
rt https://partner.stantec.com/sites/cnmiltonlogisticshub/panel irs/ir1/final ir1/cn_ir1_20170420_fnl.docx
ATTACHMENT 3:
WESTERN CHORUS FROG SURVEY
PROTOCOL
Memo
To: Burke Korol From: Andrew Taylor
Environment and Climate Change Canada (ECCC)
Stantec, Guelph
File: CN Milton Logistics Hub Date: April 20, 2017
Reference: Milton Logistics Hub - Western Chorus Frog Survey Protocol
In response to ECCC comments made in their letter dated March 13, 2017, CN proposed to undertake additional amphibian monitoring surveys to target wetlands and other ponded water areas to identify potential Western Chorus Frogs within the PDA and LAA. Through our phone conversation on April 5 and April 18, 2017, and further to comments received from Denise Fell (Environmental Assessment Officer, ECCC) on April 7, 2017, the following protocols will be followed in completing the daytime surveys for Western Chorus Frog at the CN Milton Logistics Hub:
• 3 separate amphibian call count surveys during the daytime (i.e., minimum weekly) in April,noting that surveys may need to occur no more than a few days apart based on weatherconditions
• surveys will target wetlands and other ponded areas (per Figure 2 of the Terrestrial TDR),including any seasonal or temporarily ponded areas or portion of features that may become dryin the summer, that occur within the PDA and LAA
• the location of survey stations will target all appropriate habitat features within the PDA andLAA, and will not be subject to the 500 m minimum established for the Marsh Monitoring Program(MMP)
• all individual Western Chorus Frogs observed calling (or visually) during the surveys will bedocumented, including those that may be exist beyond the 100 m limit established in the MMP
• surveys will be completed on warm days (i.e., where daytime temperatures exceed 7⁰C) andduring appropriate weather conditions (i.e., avoid strong winds or heavy rain)
• biologists will wander the PDA and LAA targeting previously identified amphibian call countstations (i.e., those identified in the Terrestrial TDR (EIS Appendix E.16, Figure 5)), and willsupplement these stations based on the presence of appropriate habitat features observed.
We trust that ECCC will find this protocol acceptable for the purposes of conducting Western Chorus Frog surveys for the CN Milton Logistics Hub, and will assist ECCC in establishing such protocols in the future.

April 20, 2017 Burke Korol Page 2 of 2
Reference: Milton Logistics Hub - Western Chorus Frog Survey Protocol
The foregoing is considered to be a true and accurate record of all items discussed. If any discrepancies or inconsistencies are noted, please contact the writer immediately.
STANTEC CONSULTING LTD.
Andrew Taylor Senior Ecologist
c. Denise Fell and Rob Dobos, ECCCNormand Pellerin, CNChris Powell, Stantec
<Original signed by>
<contact information removed>