NFIB ECONOMIC TRENDS · 2016-01-25 · good time to expand facilities (unchanged). Of those who...
23
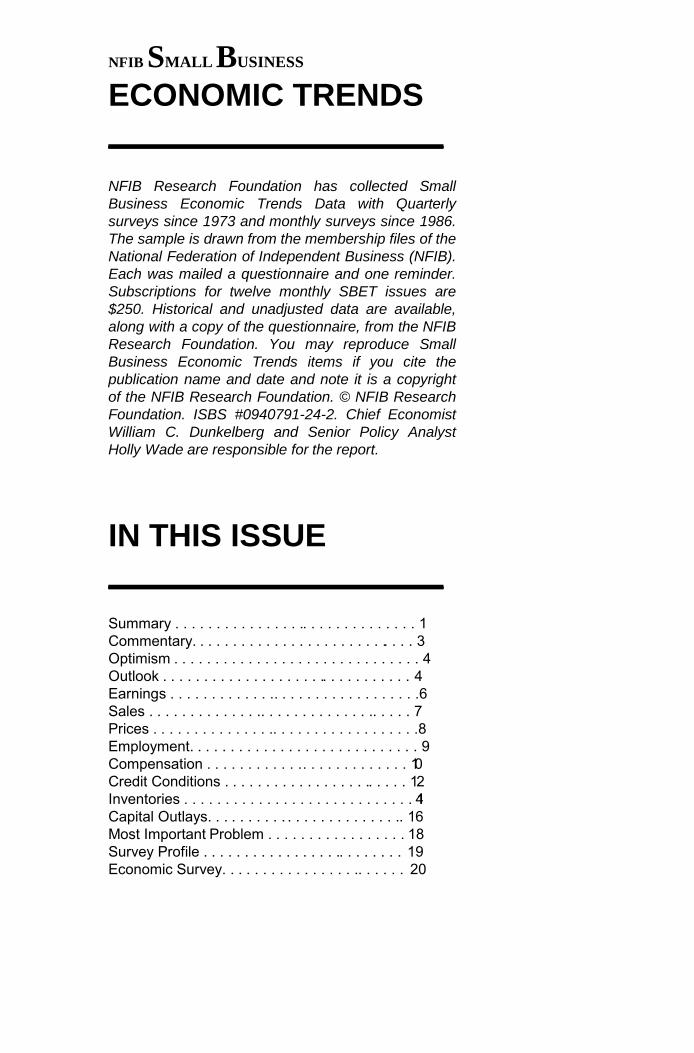
SMALL BUSINESS OPTIMISM INDEX COMPONENTS Index Component Seasonally Adjusted Level Change from Last Month Contribution to Index Change Plans to Increase Employment 8% 3 16% Plans to Make Capital Outlays 25% 1 5% Plans to Increase Inventories 3% 2 10% Expect Economy to Improve - 9% 9 48% Expect Real Sales Higher 10% - 2 - 10% Current Inventory - 1% - 1 - 5% Current Job Openings 24% 2 10% Expected Credit Conditions - 6% 1 5% Now a Good Time to Expand 8% 0 0% Earnings Trends - 20% 4 21% Total Change 19 100% (Column 1 is the current reading; column 2 is the change from the prior month; column 3 the percent of the total change accounted for by each component; * is under 1 percent and not a meaningful calculation) Based on a Survey of Small and Independent Business Owners NFIB SMALL BUSINESS ECONOMIC TRENDS NFIB SMALL BUSINESS ECONOMIC TRENDS William C. Dunkelberg Holly Wad May 2014
Transcript of NFIB ECONOMIC TRENDS · 2016-01-25 · good time to expand facilities (unchanged). Of those who...
SMALL BUSINESS OPTIMISM INDEX COMPONENTS
Index ComponentSeasonally
Adjusted LevelChange from Last Month
Contribution to Index Change
Plans to Increase Employment 8% 3 16%Plans to Make Capital Outlays 25% 1 5%Plans to Increase Inventories 3% 2 10%Expect Economy to Improve - 9% 9 48% Expect Real Sales Higher 10% - 2 - 10%Current Inventory - 1% - 1 - 5%Current Job Openings 24% 2 10%Expected Credit Conditions - 6% 1 5%Now a Good Time to Expand 8% 0 0%Earnings Trends - 20% 4 21%Total Change 19 100%(Column 1 is the current reading; column 2 is the change from the prior month; column 3 the percent of the total change accounted for by each component; * is under 1 percent and not a meaningful calculation)
1201 “F” Street NW
Suite 200W
ashington, DC
20004 nfib.com
Based on a Survey of Small and Independent Business Owners
NFIB SMALL BUSINESS
ECONOMIC TRENDS NFIB SMALL BUSINESS
ECONOMIC TRENDS NFIB S
MA
LL B
USIN
ESS
EC
ON
OM
IC TR
EN
DS
NFIB S
MA
LL B
USIN
ESS
EC
ON
OM
IC TR
EN
DS
William C. DunkelbergHolly Wade
May 2014
SBET_CVR_2012.indd 1-2SBET_CVR_2012.indd 1-2 3/30/2012 11:27:49 AM3/30/2012 11:27:49 AM
NFIB SMALL BUSINESS
ECONOMIC TRENDS _____________________
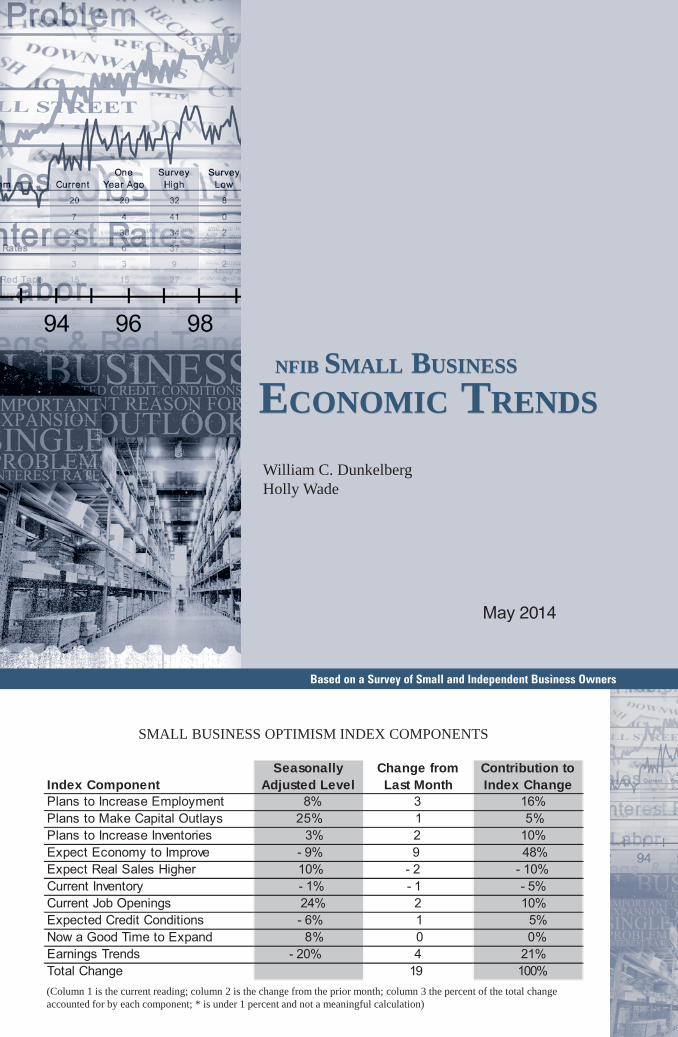
NFIB Research Foundation has collected Small Business Economic Trends Data with Quarterly surveys since 1973 and monthly surveys since 1986. The sample is drawn from the membership files of the National Federation of Independent Business (NFIB). Each was mailed a questionnaire and one reminder. Subscriptions for twelve monthly SBET issues are $250. Historical and unadjusted data are available, along with a copy of the questionnaire, from the NFIB Research Foundation. You may reproduce Small Business Economic Trends items if you cite the publication name and date and note it is a copyright of the NFIB Research Foundation. © NFIB Research Foundation. ISBS #0940791-24-2. Chief Economist William C. Dunkelberg and Senior Policy Analyst Holly Wade are responsible for the report.
IN THIS ISSUE _____________________ Summary . . . . . . . . . . . . . . . . . . . . . . . . . . . . . . 1 Commentary. . . . . . . . . . . . . . . . . . . . . . . . . . . . 3 Optimism . . . . . . . . . . . . . . . . . . . . . . . . . . . . . . 4 Outlook . . . . . . . . . . . . . . . . . . . . . . . . . . . . . . . 4 Earnings . . . . . . . . . . . . . . . . . . . . . . . . . . . . . . .6 Sales . . . . . . . . . . . . . . . . . . . . . . . . . . . . . . . . . 7 Prices . . . . . . . . . . . . . . . . . . . . . . . . . . . . . . . . .8 Employment. . . . . . . . . . . . . . . . . . . . . . . . . . . . 9 Compensation . . . . . . . . . . . . . . . . . . . . . . . . . 10 Credit Conditions . . . . . . . . . . . . . . . . . . . . . . . 12 Inventories . . . . . . . . . . . . . . . . . . . . . . . . . . . . 14 Capital Outlays. . . . . . . . . . . . . . . . . . . . . . . . . 16 Most Important Problem . . . . . . . . . . . . . . . . . 18 Survey Profile . . . . . . . . . . . . . . . . . . . . . . . . . 19 Economic Survey. . . . . . . . . . . . . . . . . . . . . . . 20
1 |
NFI
B S
mal
l Bus
ines
s Eco
nom
ic T
rend
s Q
uart
erly
Rep
ort
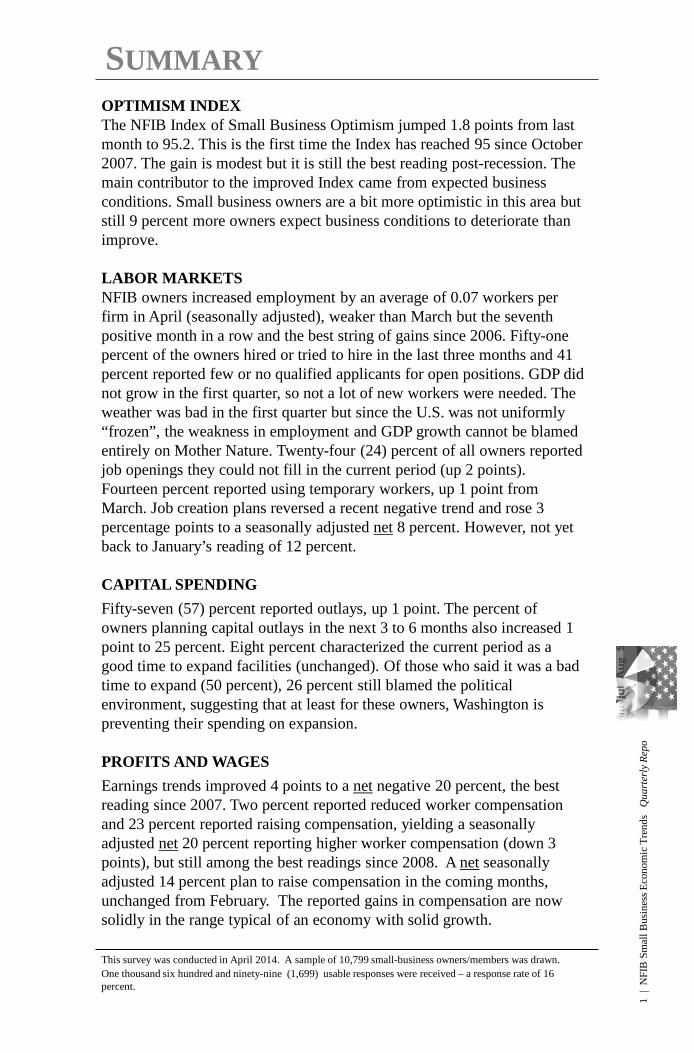
SUMMARY
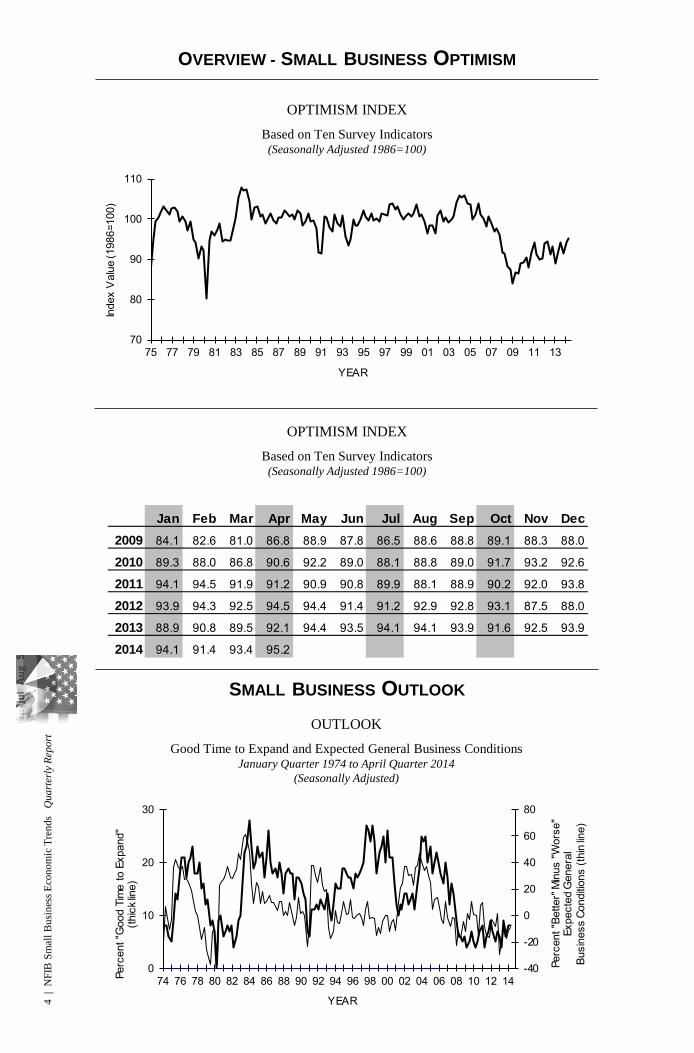
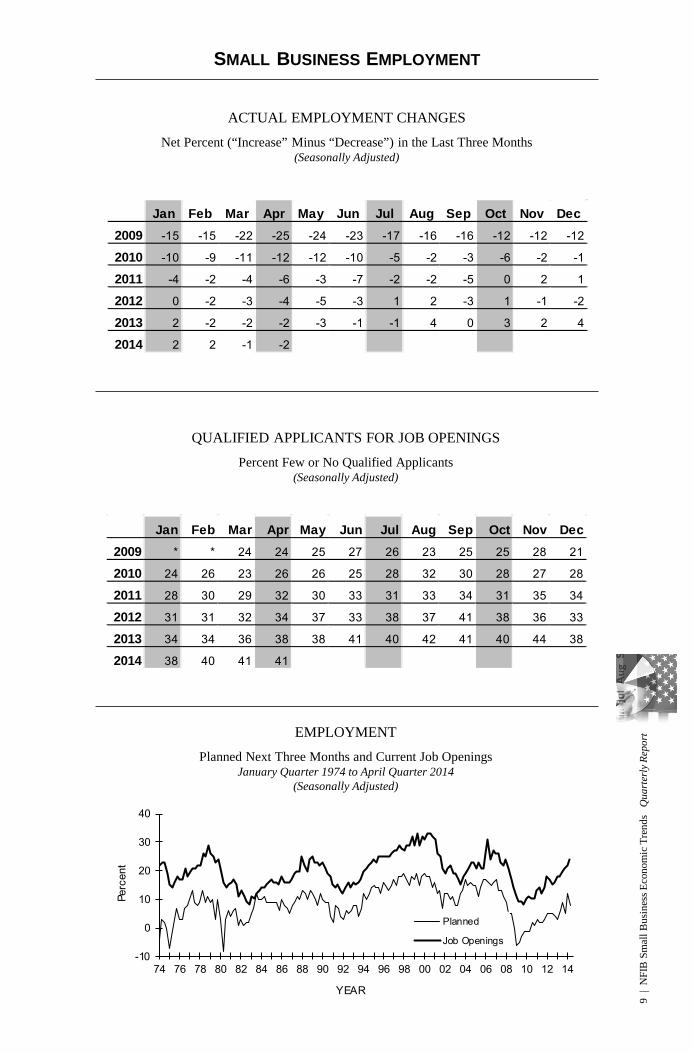
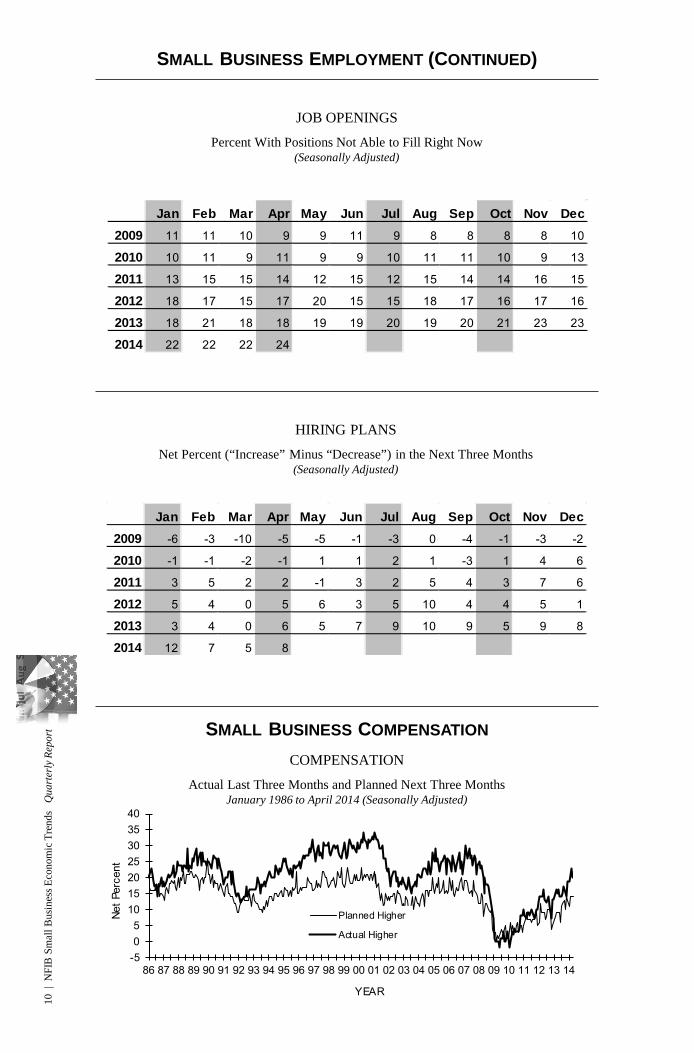
OPTIMISM INDEX The NFIB Index of Small Business Optimism jumped 1.8 points from last month to 95.2. This is the first time the Index has reached 95 since October 2007. The gain is modest but it is still the best reading post-recession. The main contributor to the improved Index came from expected business conditions. Small business owners are a bit more optimistic in this area but still 9 percent more owners expect business conditions to deteriorate than improve. LABOR MARKETS NFIB owners increased employment by an average of 0.07 workers per firm in April (seasonally adjusted), weaker than March but the seventh positive month in a row and the best string of gains since 2006. Fifty-one percent of the owners hired or tried to hire in the last three months and 41 percent reported few or no qualified applicants for open positions. GDP did not grow in the first quarter, so not a lot of new workers were needed. The weather was bad in the first quarter but since the U.S. was not uniformly “frozen”, the weakness in employment and GDP growth cannot be blamed entirely on Mother Nature. Twenty-four (24) percent of all owners reported job openings they could not fill in the current period (up 2 points). Fourteen percent reported using temporary workers, up 1 point from March. Job creation plans reversed a recent negative trend and rose 3 percentage points to a seasonally adjusted net 8 percent. However, not yet back to January’s reading of 12 percent. CAPITAL SPENDING
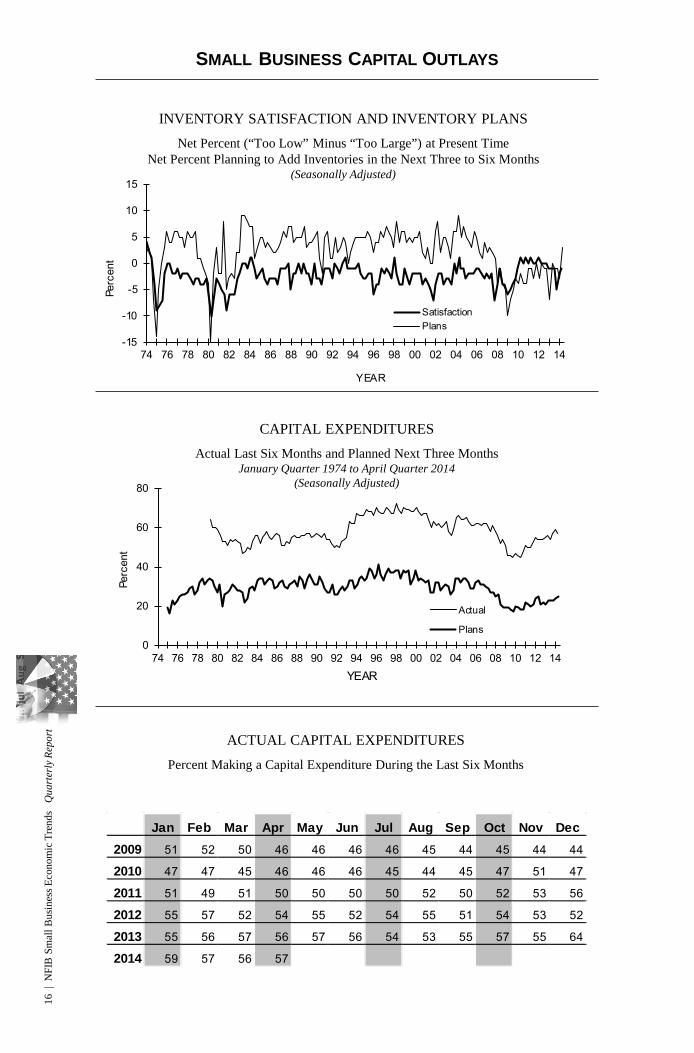
Fifty-seven (57) percent reported outlays, up 1 point. The percent of owners planning capital outlays in the next 3 to 6 months also increased 1 point to 25 percent. Eight percent characterized the current period as a good time to expand facilities (unchanged). Of those who said it was a bad time to expand (50 percent), 26 percent still blamed the political environment, suggesting that at least for these owners, Washington is preventing their spending on expansion. PROFITS AND WAGES
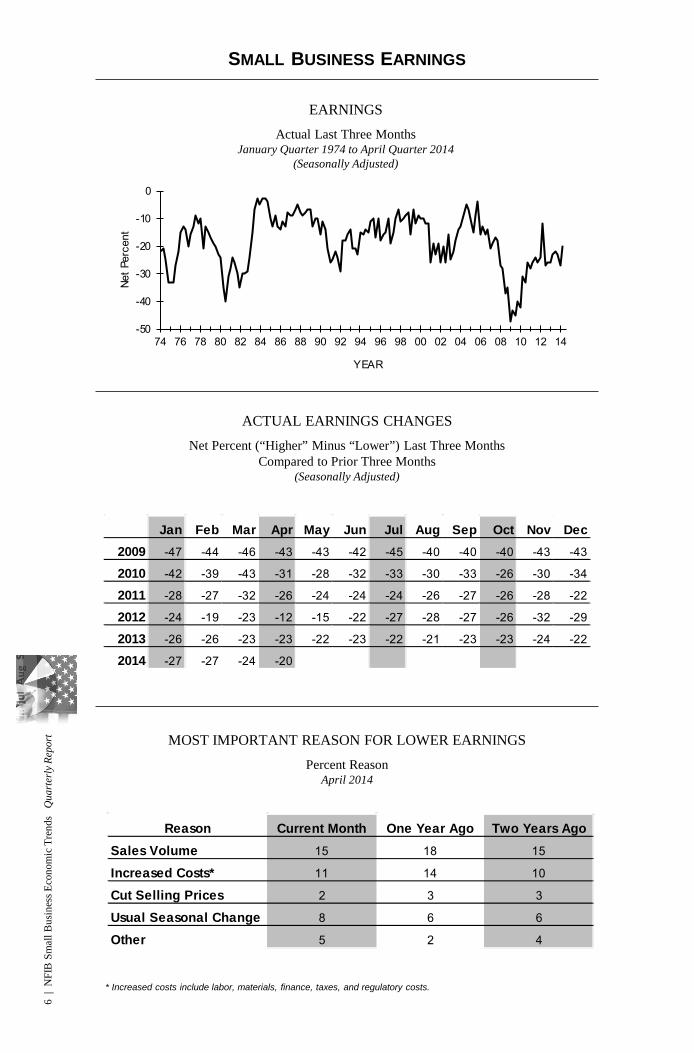
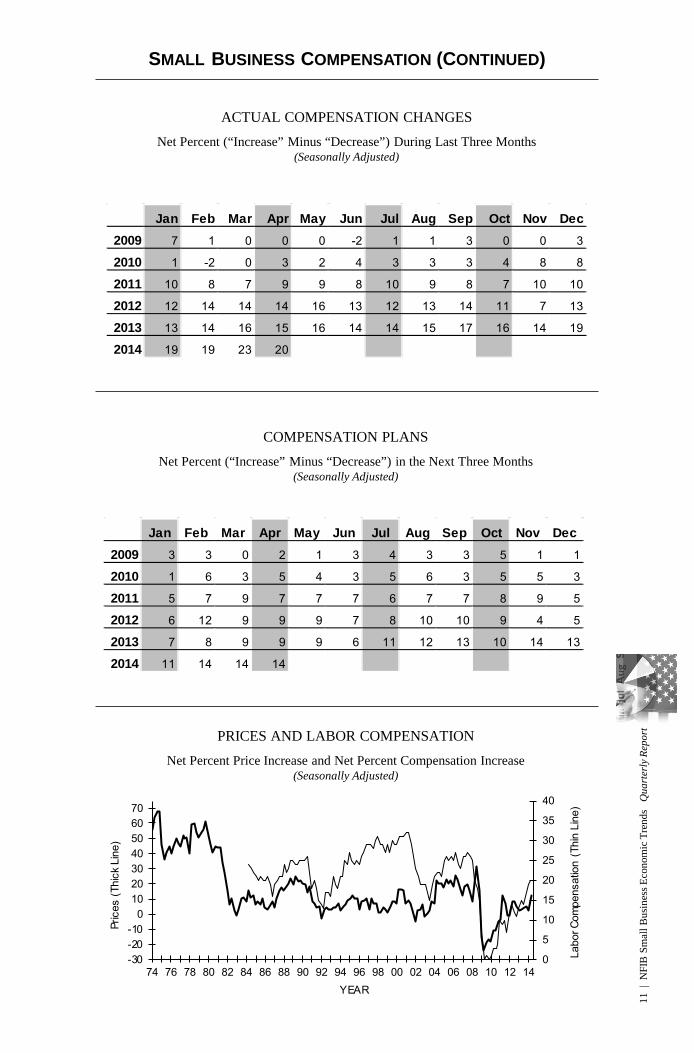
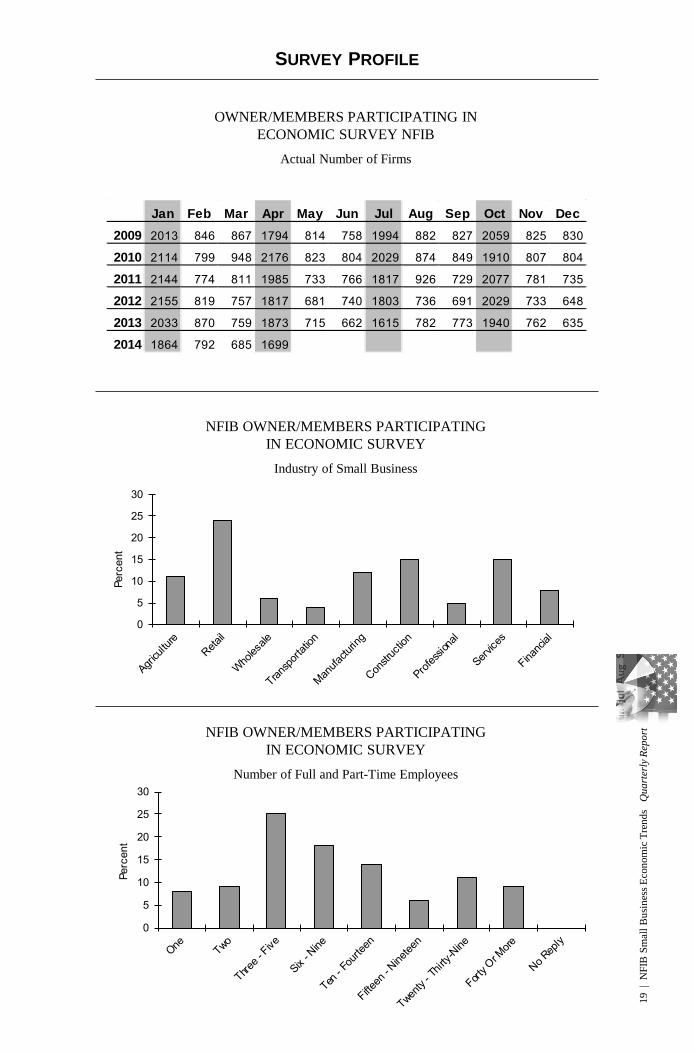
Earnings trends improved 4 points to a net negative 20 percent, the best reading since 2007. Two percent reported reduced worker compensation and 23 percent reported raising compensation, yielding a seasonally adjusted net 20 percent reporting higher worker compensation (down 3 points), but still among the best readings since 2008. A net seasonally adjusted 14 percent plan to raise compensation in the coming months, unchanged from February. The reported gains in compensation are now solidly in the range typical of an economy with solid growth. This survey was conducted in April 2014. A sample of 10,799 small-business owners/members was drawn. One thousand six hundred and ninety-nine (1,699) usable responses were received – a response rate of 16 percent.
2 |
NFI
B S
mal
l Bus
ines
s Eco
nom
ic T
rend
s Q
uart
erly
Rep
ort
INVENTORIES AND SALES
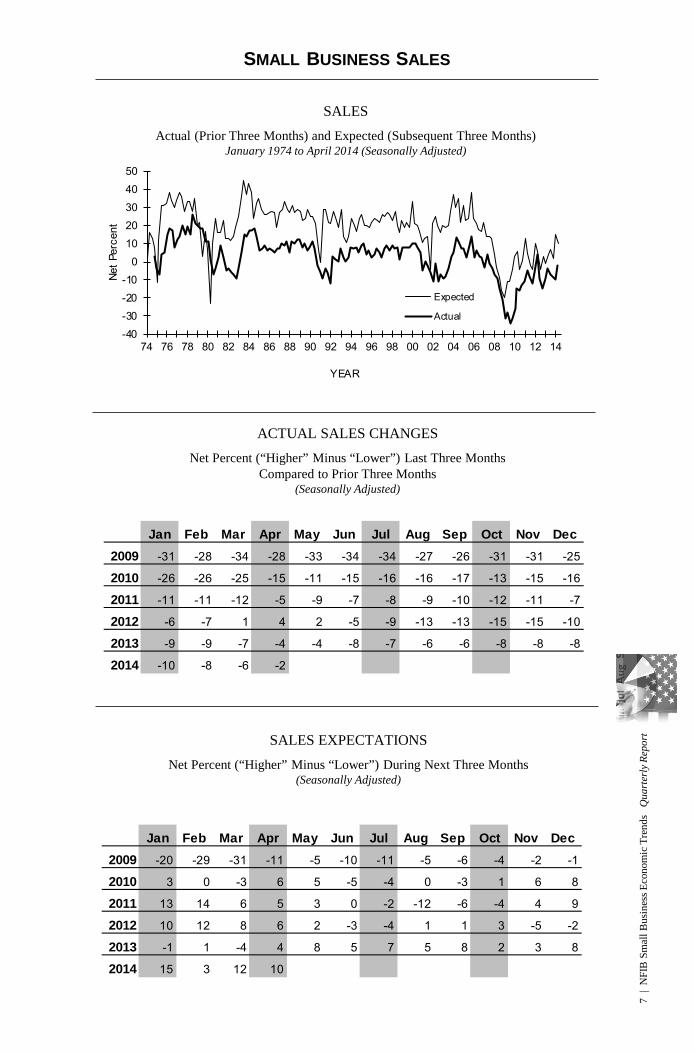
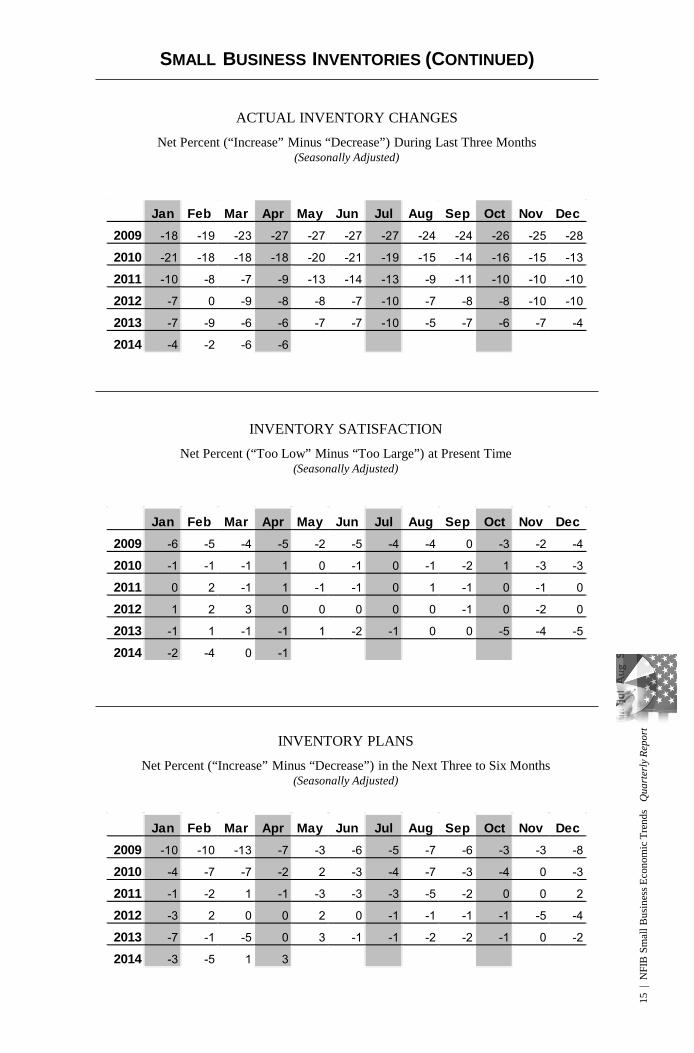
The pace of inventory reduction was steady, with a net negative 6 percent of all owners reporting growth in inventories (seasonally adjusted). Reductions are good if in response to strong sales, but not so good if it is in response to weak sales. Owners are satisfying orders with existing inventory but not ordering new stocks. The net percent of owners viewing current inventory stocks as “too low” lost a point, falling to a net negative 1 percent, historically a “lean” reading. Sales trends did improve, although remained historically weak and probably insufficient to produce a substantial reduction in inventories. The solid reading for expected real sales contributed to the need to rebuild with the net percent of owners planning to add to inventory stocks gaining 2 points to a net 3 percent, following a large 6 point gain in March. The net percent of all owners (seasonally adjusted) reporting higher nominal sales in the past 3 months compared to the prior 3 months improved 4 points to a net negative 2 percent, far better than the negative 34 percent readings in 2009). Fifteen (15) percent cite weak sales as their top business problem, high but approaching levels experienced in “normal” times. This is the best seasonally adjusted reading since early 2012 when the economy temporarily reach a more normal growth path. Expected real sales volumes posted a 2 point decline after a strong 9 point gain in March, falling to a net 10 percent of owners. While falling a bit, it is still the third highest reading since early 2012.
INFLATION
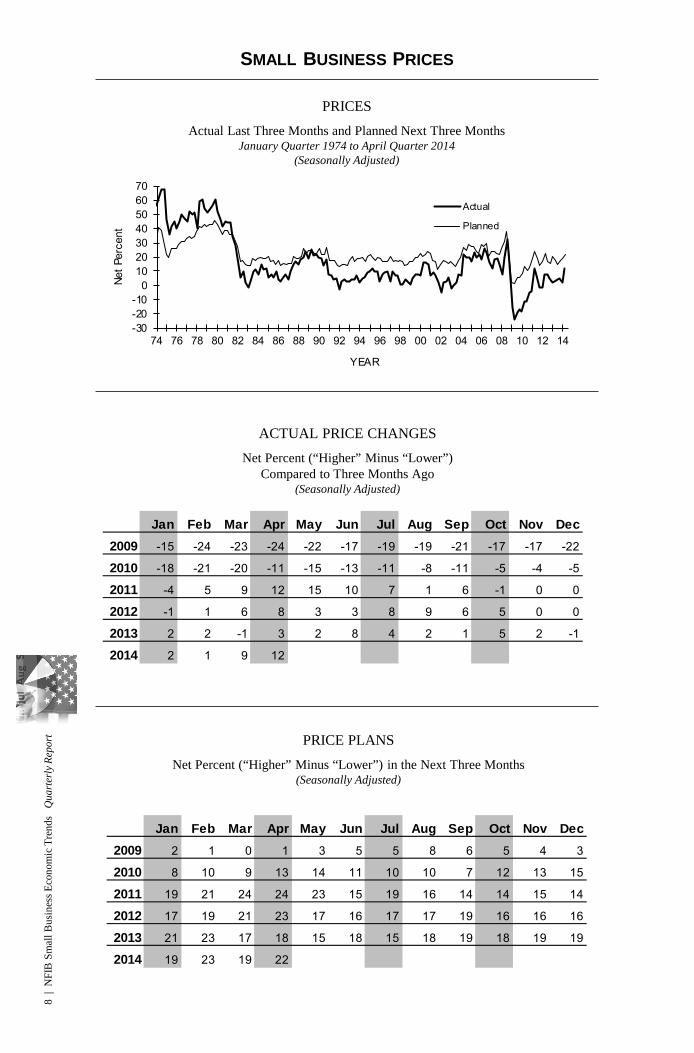
Seasonally adjusted, the net percent of owners raising selling prices was a net 12 percent, up 3 points after an 8 point rise in March. Twenty-five (25) percent plan on raising average prices in the next few months (up 2 points). Only 3 percent plan reductions (unchanged), far fewer than actually reported reductions in past prices. Seasonally adjusted, a net 22 percent plan price hikes (up 3 points). If successful, the economy will see a bit more “inflation”.
CREDIT MARKETS
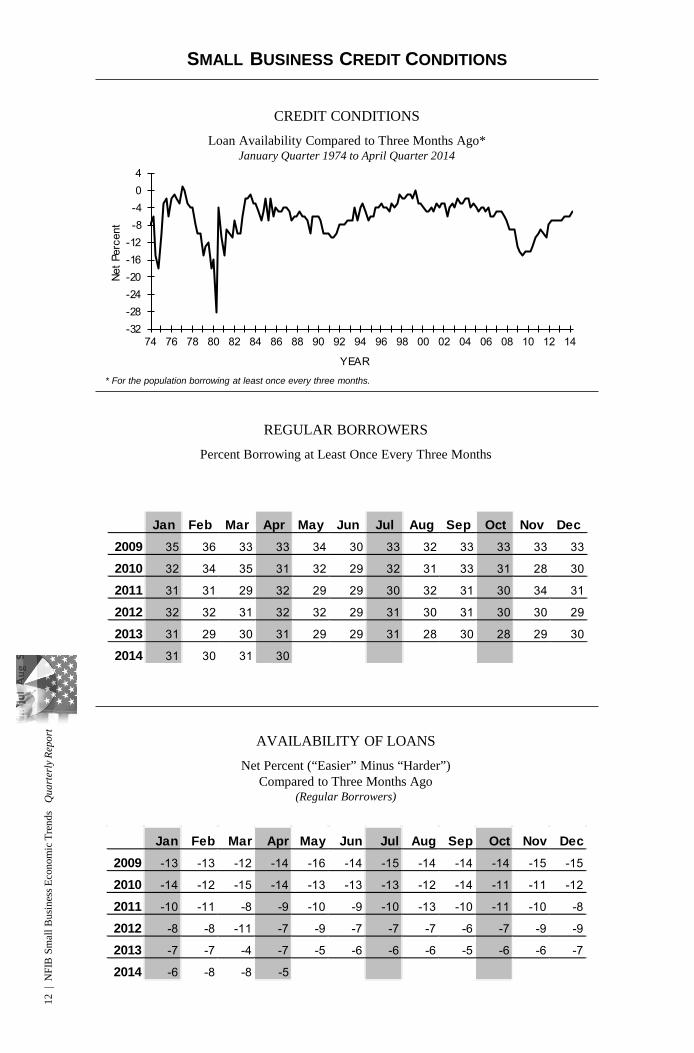
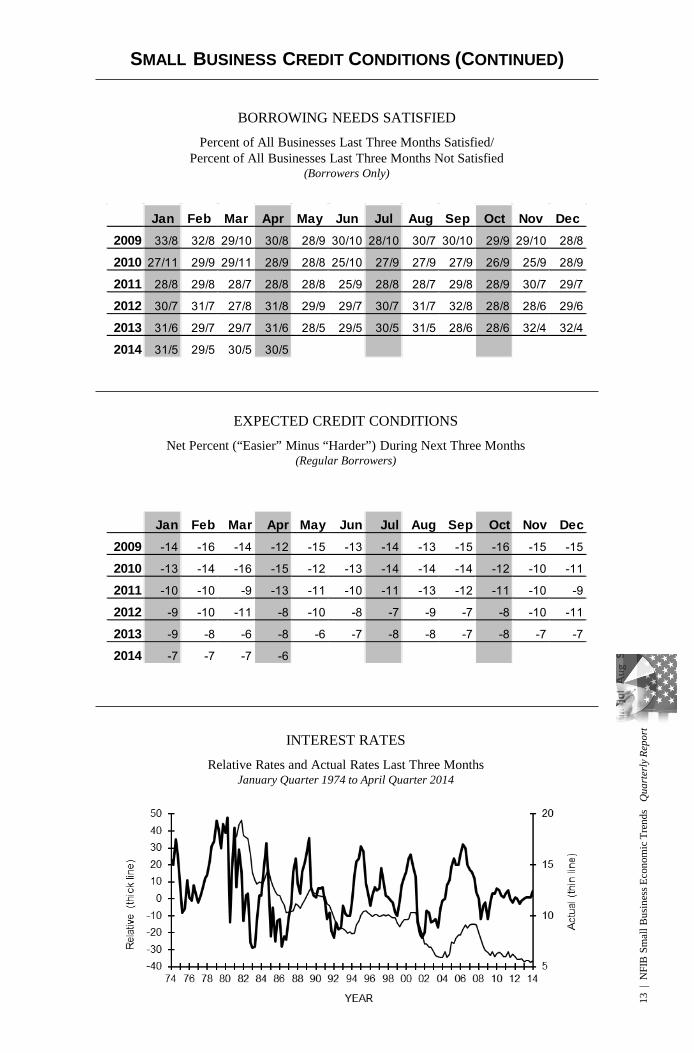
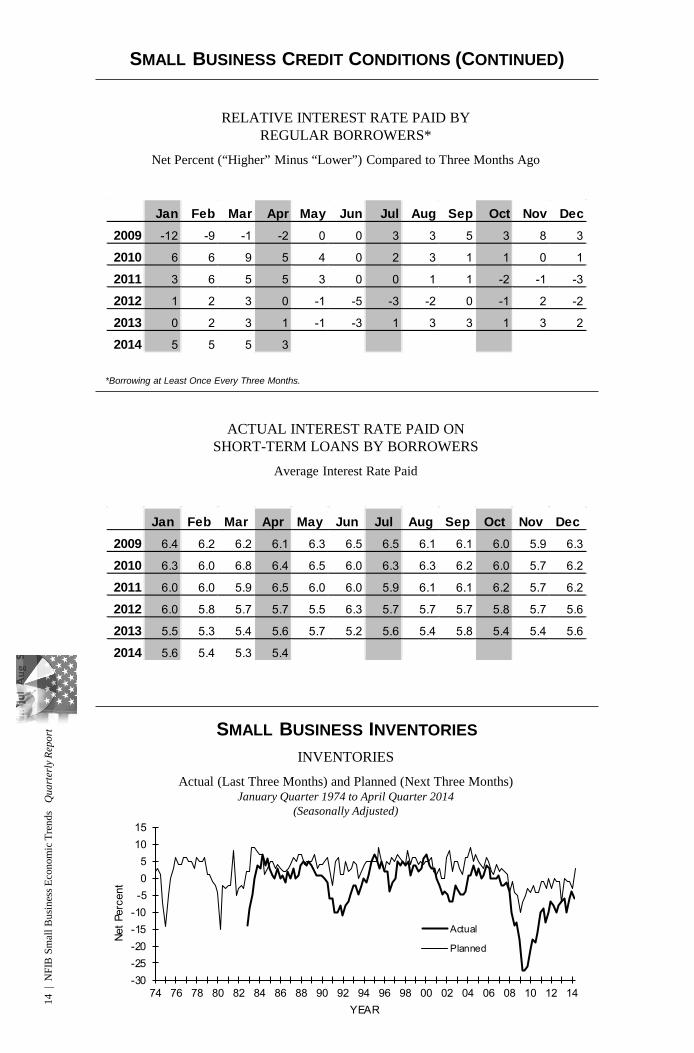
Five percent of the owners reported that all their credit needs were not met, 1 point above the record low. Thirty percent reported all credit needs met, and 53 percent explicitly said they did not want a loan. Only 1 percent reported that financing was their top business problem (the record low). Thirty (30) percent of all owners reported borrowing on a regular basis, down 1 point. A net 5 percent of regular borrowers reported loans “harder to get” compared to their last attempt, a 3 point improvement. The average rate paid on short maturity loans was up a tenth at 5.4 percent. The net percent of owners expecting credit conditions to ease in the coming months was a seasonally adjusted negative 6 percent, more owners expect that it will be “harder” to arrange financing than easier (1 point better than March). The start of “tapering” seems to have not impacted expectations much. The appointment of the new Federal Reserve Board members will have little impact on policy. Owners remain more concerned about taxes, regulations and health care costs.
SUMMARY
3 |
NFI
B S
mal
l Bus
ines
s Eco
nom
ic T
rend
s Q
uart
erly
Rep
ort
COMMENTARY With the unemployment rate falling to 6.3 percent and headed lower, the Federal Reserve will soon be able to declare victory, leaving economists to debate for years whether QE2 and QE3 really helped or hindered the recovery. The U.S still has $3 trillion in excess reserves sitting at the Federal Reserve, potentially available to support an expansion in loans. The Federal Reserve portfolio has over $4 trillion earning interest that currently accounts for about 10 percent of record-high after-tax corporate profits. Yes, the Federal Reserve is a private firm. This is just one of the major distortions created by the Federal Reserve, and it’s not the worst. Since 2009, consumers have lost trillions of dollars in interest income, a damper on consumer spending. Interest expense per share for the larger firms have fallen by more than 50 percent helping earnings per share to hit record high levels, all based on “unreal” interest rates.
The first quarter preliminary print on GDP growth was 0.1 percent, virtually no change but likely to be revised a bit lower due to the trade deficit. Consumer spending might have been a bit stronger as March data are finalized. Job growth was a lot better than expected for the first quarter, so one wonders where’s the GDP that all these workers are making? Of course, hours worked didn’t go up much, so more people working fewer hours means not so much growth in output. And 800,000 people dropped out of the labor force which accounted for much of the decline in the unemployment rate.
The President is pushing for a 39 percent increase in the minimum wage. He apparently is not listening to the CBO but to political advisors. There is no doubt that raising the minimum wage will cost jobs. The CBO estimates 500,000 will lose all their income and the chance to gain experience and move ahead. On FOX, a supporter argued that McDonalds made $5 billion and could afford to give up some, forgetting that individual franchises and company stores must stand on their own. If all the independent burger joints suddenly put a golden arch over them and we added them up to get one big profit number, that doesn’t change the economics for each firm. Arguing that this will produce more spending assumes the increased labor costs are covered by the Federal Reserve I guess, since in reality every dollar a minimum wage worker gets will come out of the pockets of customers, and owners, and those who lost their job who will have less to spend, a wash at best. Some really poor thinking.
The President most recently touted policies such as raising the minimum wage, extending unemployment benefits and passing some sort of equal pay for equal work legislation as his plan to boost the economy. He also mentioned one billion in his budget for “climate change and a Keystone delay that will surely boost the economy. This makes it quite clear that politics drives policy recommendations, not common sense. And governing through politics will not improve owner optimism. It’s going to be another nasty election. Most of the policy changes that would improve small business owners’ views of the outlook won’t happen. Growth will push ahead, boosted by population growth, depreciation driven demand for replacement and continued healing from the recession damage, but no rapid pickup in spending or hiring.
4 |
NFI
B S
mal
l Bus
ines
s Eco
nom
ic T
rend
s Q
uart
erly
Rep
ort
OVERVIEW - SMALL BUSINESS OPTIMISM
70
80
90
100
110
75 77 79 81 83 85 87 89 91 93 95 97 99 01 03 05 07 09 11 13
Inde
x V
alue
(198
6=10
0)
YEAR
OPTIMISM INDEX Based on Ten Survey Indicators
(Seasonally Adjusted 1986=100)
Jan Feb Mar Apr May Jun Jul Aug Sep Oct Nov Dec2009 84.1 82.6 81.0 86.8 88.9 87.8 86.5 88.6 88.8 89.1 88.3 88.0
2010 89.3 88.0 86.8 90.6 92.2 89.0 88.1 88.8 89.0 91.7 93.2 92.6
2011 94.1 94.5 91.9 91.2 90.9 90.8 89.9 88.1 88.9 90.2 92.0 93.8
2012 93.9 94.3 92.5 94.5 94.4 91.4 91.2 92.9 92.8 93.1 87.5 88.0
2013 88.9 90.8 89.5 92.1 94.4 93.5 94.1 94.1 93.9 91.6 92.5 93.9
2014 94.1 91.4 93.4 95.2
OPTIMISM INDEX Based on Ten Survey Indicators
(Seasonally Adjusted 1986=100)
-40
-20
0
20
40
60
80
0
10
20
30
74 76 78 80 82 84 86 88 90 92 94 96 98 00 02 04 06 08 10 12 14Perc
ent "
Goo
d Ti
me
to E
xpan
d"
(th
ick l
ine)
Perc
ent "
Bette
r" M
inus
"Wor
se"
Expe
cted
Gen
eral
Bu
sine
ss C
ondi
tions
(thi
n lin
e)
YEAR
OUTLOOK Good Time to Expand and Expected General Business Conditions
January Quarter 1974 to April Quarter 2014 (Seasonally Adjusted)
SMALL BUSINESS OUTLOOK

5 |
NFI
B S
mal
l Bus
ines
s Eco
nom
ic T
rend
s Q
uart
erly
Rep
ort
SMALL BUSINESS OUTLOOK (CONTINUED)
Jan Feb Mar Apr May Jun Jul Aug Sep Oct Nov Dec2009 6 3 1 4 5 4 5 5 9 7 8 7
2010 5 4 2 4 5 6 5 4 6 7 9 8
2011 8 7 5 4 5 4 6 5 6 7 8 10
2012 9 8 7 7 7 5 5 4 7 7 6 8
2013 6 5 4 4 8 7 9 6 8 6 9 10
2014 8 6 8 8
OUTLOOK FOR EXPANSION Percent Next Three Months “Good Time to Expand”
(Seasonally Adjusted)
MOST IMPORTANT REASON FOR EXPANSION OUTLOOK Reason Percent by Expansion Outlook
April 2014
Reason Good Time Not Good Time Uncertain Economic Conditions 5 26 17
Sales Prospects 3 3 3
Fin. & Interest Rates 1 1 1
Cost of Expansion 0 3 4
Political Climate 0 13 10
Other/Not Available 2 4 3
OUTLOOK FOR GENERAL BUSINESS CONDITIONS Net Percent (“Better” Minus “Worse”) Six Months From Now
(Seasonally Adjusted)
Jan Feb Mar Apr May Jun Jul Aug Sep Oct Nov Dec2009 -12 -21 -22 2 12 7 -3 10 8 11 3 2
2010 1 -9 -8 0 8 -6 -15 -8 -3 8 16 9
2011 10 9 -5 -8 -5 -11 -15 -26 -22 -16 -12 -8
2012 -3 -6 -8 -5 -2 -10 -8 -2 2 2 -35 -35
2013 -30 -28 -28 -15 -5 -4 -6 -2 -10 -17 -20 -11
2014 -11 -19 -18 -9
6 |
NFI
B S
mal
l Bus
ines
s Eco
nom
ic T
rend
s Q
uart
erly
Rep
ort
SMALL BUSINESS EARNINGS
EARNINGS Actual Last Three Months
January Quarter 1974 to April Quarter 2014 (Seasonally Adjusted)
ACTUAL EARNINGS CHANGES Net Percent (“Higher” Minus “Lower”) Last Three Months
Compared to Prior Three Months (Seasonally Adjusted)
MOST IMPORTANT REASON FOR LOWER EARNINGS Percent Reason
April 2014
-50
-40
-30
-20
-10
0
74 76 78 80 82 84 86 88 90 92 94 96 98 00 02 04 06 08 10 12 14
Net P
erce
nt
YEAR
Reason Current Month One Year Ago Two Years AgoSales Volume 15 18 15
Increased Costs* 11 14 10
Cut Selling Prices 2 3 3
Usual Seasonal Change 8 6 6
Other 5 2 4
Jan Feb Mar Apr May Jun Jul Aug Sep Oct Nov Dec2009 -47 -44 -46 -43 -43 -42 -45 -40 -40 -40 -43 -43
2010 -42 -39 -43 -31 -28 -32 -33 -30 -33 -26 -30 -34
2011 -28 -27 -32 -26 -24 -24 -24 -26 -27 -26 -28 -22
2012 -24 -19 -23 -12 -15 -22 -27 -28 -27 -26 -32 -29
2013 -26 -26 -23 -23 -22 -23 -22 -21 -23 -23 -24 -22
2014 -27 -27 -24 -20
* Increased costs include labor, materials, finance, taxes, and regulatory costs.
7 |
NFI
B S
mal
l Bus
ines
s Eco
nom
ic T
rend
s Q
uart
erly
Rep
ort
SMALL BUSINESS SALES
SALES EXPECTATIONS Net Percent (“Higher” Minus “Lower”) During Next Three Months
(Seasonally Adjusted)
ACTUAL SALES CHANGES Net Percent (“Higher” Minus “Lower”) Last Three Months
Compared to Prior Three Months (Seasonally Adjusted)
-40-30-20-10
01020304050
74 76 78 80 82 84 86 88 90 92 94 96 98 00 02 04 06 08 10 12 14
Expected
Actual
Net P
erce
nt
YEAR
SALES Actual (Prior Three Months) and Expected (Subsequent Three Months)
January 1974 to April 2014 (Seasonally Adjusted)
Jan Feb Mar Apr May Jun Jul Aug Sep Oct Nov Dec2009 -31 -28 -34 -28 -33 -34 -34 -27 -26 -31 -31 -25
2010 -26 -26 -25 -15 -11 -15 -16 -16 -17 -13 -15 -16
2011 -11 -11 -12 -5 -9 -7 -8 -9 -10 -12 -11 -7
2012 -6 -7 1 4 2 -5 -9 -13 -13 -15 -15 -10
2013 -9 -9 -7 -4 -4 -8 -7 -6 -6 -8 -8 -8
2014 -10 -8 -6 -2
Jan Feb Mar Apr May Jun Jul Aug Sep Oct Nov Dec2009 -20 -29 -31 -11 -5 -10 -11 -5 -6 -4 -2 -1
2010 3 0 -3 6 5 -5 -4 0 -3 1 6 8
2011 13 14 6 5 3 0 -2 -12 -6 -4 4 9
2012 10 12 8 6 2 -3 -4 1 1 3 -5 -2
2013 -1 1 -4 4 8 5 7 5 8 2 3 8
2014 15 3 12 10
8 |
NFI
B S
mal
l Bus
ines
s Eco
nom
ic T
rend
s Q
uart
erly
Rep
ort
SMALL BUSINESS PRICES
PRICE PLANS Net Percent (“Higher” Minus “Lower”) in the Next Three Months
(Seasonally Adjusted)
ACTUAL PRICE CHANGES Net Percent (“Higher” Minus “Lower”)
Compared to Three Months Ago (Seasonally Adjusted)
PRICES Actual Last Three Months and Planned Next Three Months
January Quarter 1974 to April Quarter 2014 (Seasonally Adjusted)
-30-20-10
010203040506070
74 76 78 80 82 84 86 88 90 92 94 96 98 00 02 04 06 08 10 12 14
Actual
Planned
Net P
erce
nt
YEAR
Jan Feb Mar Apr May Jun Jul Aug Sep Oct Nov Dec2009 -15 -24 -23 -24 -22 -17 -19 -19 -21 -17 -17 -22
2010 -18 -21 -20 -11 -15 -13 -11 -8 -11 -5 -4 -5
2011 -4 5 9 12 15 10 7 1 6 -1 0 0
2012 -1 1 6 8 3 3 8 9 6 5 0 0
2013 2 2 -1 3 2 8 4 2 1 5 2 -1
2014 2 1 9 12
Jan Feb Mar Apr May Jun Jul Aug Sep Oct Nov Dec2009 2 1 0 1 3 5 5 8 6 5 4 3
2010 8 10 9 13 14 11 10 10 7 12 13 15
2011 19 21 24 24 23 15 19 16 14 14 15 14
2012 17 19 21 23 17 16 17 17 19 16 16 16
2013 21 23 17 18 15 18 15 18 19 18 19 19
2014 19 23 19 22
9 |
NFI
B S
mal
l Bus
ines
s Eco
nom
ic T
rend
s Q
uart
erly
Rep
ort
SMALL BUSINESS EMPLOYMENT
Jan Feb Mar Apr May Jun Jul Aug Sep Oct Nov Dec2009 -15 -15 -22 -25 -24 -23 -17 -16 -16 -12 -12 -12
2010 -10 -9 -11 -12 -12 -10 -5 -2 -3 -6 -2 -1
2011 -4 -2 -4 -6 -3 -7 -2 -2 -5 0 2 1
2012 0 -2 -3 -4 -5 -3 1 2 -3 1 -1 -2
2013 2 -2 -2 -2 -3 -1 -1 4 0 3 2 4
2014 2 2 -1 -2
ACTUAL EMPLOYMENT CHANGES Net Percent (“Increase” Minus “Decrease”) in the Last Three Months
(Seasonally Adjusted)
Jan Feb Mar Apr May Jun Jul Aug Sep Oct Nov Dec2009 * * 24 24 25 27 26 23 25 25 28 21
2010 24 26 23 26 26 25 28 32 30 28 27 28
2011 28 30 29 32 30 33 31 33 34 31 35 34
2012 31 31 32 34 37 33 38 37 41 38 36 33
2013 34 34 36 38 38 41 40 42 41 40 44 38
2014 38 40 41 41
QUALIFIED APPLICANTS FOR JOB OPENINGS Percent Few or No Qualified Applicants
(Seasonally Adjusted)
-10
0
10
20
30
40
74 76 78 80 82 84 86 88 90 92 94 96 98 00 02 04 06 08 10 12 14
Planned
Job Openings
YEAR
Perc
ent
EMPLOYMENT Planned Next Three Months and Current Job Openings
January Quarter 1974 to April Quarter 2014 (Seasonally Adjusted)
10 |
NFI
B S
mal
l Bus
ines
s Eco
nom
ic T
rend
s Q
uart
erly
Rep
ort
SMALL BUSINESS EMPLOYMENT (CONTINUED)
Jan Feb Mar Apr May Jun Jul Aug Sep Oct Nov Dec2009 11 11 10 9 9 11 9 8 8 8 8 10
2010 10 11 9 11 9 9 10 11 11 10 9 13
2011 13 15 15 14 12 15 12 15 14 14 16 15
2012 18 17 15 17 20 15 15 18 17 16 17 16
2013 18 21 18 18 19 19 20 19 20 21 23 23
2014 22 22 22 24
JOB OPENINGS Percent With Positions Not Able to Fill Right Now
(Seasonally Adjusted)
HIRING PLANS Net Percent (“Increase” Minus “Decrease”) in the Next Three Months
(Seasonally Adjusted)
Jan Feb Mar Apr May Jun Jul Aug Sep Oct Nov Dec2009 -6 -3 -10 -5 -5 -1 -3 0 -4 -1 -3 -2
2010 -1 -1 -2 -1 1 1 2 1 -3 1 4 6
2011 3 5 2 2 -1 3 2 5 4 3 7 6
2012 5 4 0 5 6 3 5 10 4 4 5 1
2013 3 4 0 6 5 7 9 10 9 5 9 8
2014 12 7 5 8
SMALL BUSINESS COMPENSATION
COMPENSATION Actual Last Three Months and Planned Next Three Months
January 1986 to April 2014 (Seasonally Adjusted)
-505
10152025303540
86 87 88 89 90 91 92 93 94 95 96 97 98 99 00 01 02 03 04 05 06 07 08 09 10 11 12 13 14
Net P
erce
nt
YEAR
Planned Higher
Actual Higher
11 |
NFI
B S
mal
l Bus
ines
s Eco
nom
ic T
rend
s Q
uart
erly
Rep
ort
SMALL BUSINESS COMPENSATION (CONTINUED)
ACTUAL COMPENSATION CHANGES Net Percent (“Increase” Minus “Decrease”) During Last Three Months
(Seasonally Adjusted)
Jan Feb Mar Apr May Jun Jul Aug Sep Oct Nov Dec2009 7 1 0 0 0 -2 1 1 3 0 0 3
2010 1 -2 0 3 2 4 3 3 3 4 8 8
2011 10 8 7 9 9 8 10 9 8 7 10 10
2012 12 14 14 14 16 13 12 13 14 11 7 13
2013 13 14 16 15 16 14 14 15 17 16 14 19
2014 19 19 23 20
Jan Feb Mar Apr May Jun Jul Aug Sep Oct Nov Dec2009 3 3 0 2 1 3 4 3 3 5 1 1
2010 1 6 3 5 4 3 5 6 3 5 5 3
2011 5 7 9 7 7 7 6 7 7 8 9 5
2012 6 12 9 9 9 7 8 10 10 9 4 5
2013 7 8 9 9 9 6 11 12 13 10 14 13
2014 11 14 14 14
COMPENSATION PLANS Net Percent (“Increase” Minus “Decrease”) in the Next Three Months
(Seasonally Adjusted)
PRICES AND LABOR COMPENSATION Net Percent Price Increase and Net Percent Compensation Increase
(Seasonally Adjusted)
0
5
10
15
20
25
30
35
40
-30-20-10
010203040506070
74 76 78 80 82 84 86 88 90 92 94 96 98 00 02 04 06 08 10 12 14
Pric
es (T
hick
Lin
e)
Labo
r Com
pens
atio
n (T
hin
Line
)
YEAR
12 |
NFI
B S
mal
l Bus
ines
s Eco
nom
ic T
rend
s Q
uart
erly
Rep
ort
SMALL BUSINESS CREDIT CONDITIONS
CREDIT CONDITIONS Loan Availability Compared to Three Months Ago*
January Quarter 1974 to April Quarter 2014
* For the population borrowing at least once every three months.
-32-28-24-20-16-12-8-404
74 76 78 80 82 84 86 88 90 92 94 96 98 00 02 04 06 08 10 12 14
Net P
erce
nt
YEAR
REGULAR BORROWERS Percent Borrowing at Least Once Every Three Months
Jan Feb Mar Apr May Jun Jul Aug Sep Oct Nov Dec2009 35 36 33 33 34 30 33 32 33 33 33 33
2010 32 34 35 31 32 29 32 31 33 31 28 30
2011 31 31 29 32 29 29 30 32 31 30 34 31
2012 32 32 31 32 32 29 31 30 31 30 30 29
2013 31 29 30 31 29 29 31 28 30 28 29 30
2014 31 30 31 30
AVAILABILITY OF LOANS Net Percent (“Easier” Minus “Harder”)
Compared to Three Months Ago (Regular Borrowers)
Jan Feb Mar Apr May Jun Jul Aug Sep Oct Nov Dec2009 -13 -13 -12 -14 -16 -14 -15 -14 -14 -14 -15 -15
2010 -14 -12 -15 -14 -13 -13 -13 -12 -14 -11 -11 -12
2011 -10 -11 -8 -9 -10 -9 -10 -13 -10 -11 -10 -8
2012 -8 -8 -11 -7 -9 -7 -7 -7 -6 -7 -9 -9
2013 -7 -7 -4 -7 -5 -6 -6 -6 -5 -6 -6 -7
2014 -6 -8 -8 -5
13 |
NFI
B S
mal
l Bus
ines
s Eco
nom
ic T
rend
s Q
uart
erly
Rep
ort
SMALL BUSINESS CREDIT CONDITIONS (CONTINUED)
Jan Feb Mar Apr May Jun Jul Aug Sep Oct Nov Dec2009 33/8 32/8 29/10 30/8 28/9 30/10 28/10 30/7 30/10 29/9 29/10 28/8
2010 27/11 29/9 29/11 28/9 28/8 25/10 27/9 27/9 27/9 26/9 25/9 28/9
2011 28/8 29/8 28/7 28/8 28/8 25/9 28/8 28/7 29/8 28/9 30/7 29/7
2012 30/7 31/7 27/8 31/8 29/9 29/7 30/7 31/7 32/8 28/8 28/6 29/6
2013 31/6 29/7 29/7 31/6 28/5 29/5 30/5 31/5 28/6 28/6 32/4 32/4
2014 31/5 29/5 30/5 30/5
BORROWING NEEDS SATISFIED Percent of All Businesses Last Three Months Satisfied/
Percent of All Businesses Last Three Months Not Satisfied (Borrowers Only)
Jan Feb Mar Apr May Jun Jul Aug Sep Oct Nov Dec2009 -14 -16 -14 -12 -15 -13 -14 -13 -15 -16 -15 -15
2010 -13 -14 -16 -15 -12 -13 -14 -14 -14 -12 -10 -11
2011 -10 -10 -9 -13 -11 -10 -11 -13 -12 -11 -10 -9
2012 -9 -10 -11 -8 -10 -8 -7 -9 -7 -8 -10 -11
2013 -9 -8 -6 -8 -6 -7 -8 -8 -7 -8 -7 -7
2014 -7 -7 -7 -6
EXPECTED CREDIT CONDITIONS Net Percent (“Easier” Minus “Harder”) During Next Three Months
(Regular Borrowers)
INTEREST RATES Relative Rates and Actual Rates Last Three Months
January Quarter 1974 to April Quarter 2014
14 |
NFI
B S
mal
l Bus
ines
s Eco
nom
ic T
rend
s Q
uart
erly
Rep
ort
SMALL BUSINESS CREDIT CONDITIONS (CONTINUED)
Jan Feb Mar Apr May Jun Jul Aug Sep Oct Nov Dec2009 -12 -9 -1 -2 0 0 3 3 5 3 8 3
2010 6 6 9 5 4 0 2 3 1 1 0 1
2011 3 6 5 5 3 0 0 1 1 -2 -1 -3
2012 1 2 3 0 -1 -5 -3 -2 0 -1 2 -2
2013 0 2 3 1 -1 -3 1 3 3 1 3 2
2014 5 5 5 3
RELATIVE INTEREST RATE PAID BY REGULAR BORROWERS*
Net Percent (“Higher” Minus “Lower”) Compared to Three Months Ago
*Borrowing at Least Once Every Three Months.
ACTUAL INTEREST RATE PAID ON SHORT-TERM LOANS BY BORROWERS
Average Interest Rate Paid
Jan Feb Mar Apr May Jun Jul Aug Sep Oct Nov Dec2009 6.4 6.2 6.2 6.1 6.3 6.5 6.5 6.1 6.1 6.0 5.9 6.3
2010 6.3 6.0 6.8 6.4 6.5 6.0 6.3 6.3 6.2 6.0 5.7 6.2
2011 6.0 6.0 5.9 6.5 6.0 6.0 5.9 6.1 6.1 6.2 5.7 6.2
2012 6.0 5.8 5.7 5.7 5.5 6.3 5.7 5.7 5.7 5.8 5.7 5.6
2013 5.5 5.3 5.4 5.6 5.7 5.2 5.6 5.4 5.8 5.4 5.4 5.6
2014 5.6 5.4 5.3 5.4
SMALL BUSINESS INVENTORIES INVENTORIES
Actual (Last Three Months) and Planned (Next Three Months) January Quarter 1974 to April Quarter 2014
(Seasonally Adjusted)
-30-25-20-15-10-505
1015
74 76 78 80 82 84 86 88 90 92 94 96 98 00 02 04 06 08 10 12 14
Actual
Planned
Net P
erce
nt
YEAR
15 |
NFI
B S
mal
l Bus
ines
s Eco
nom
ic T
rend
s Q
uart
erly
Rep
ort
SMALL BUSINESS INVENTORIES (CONTINUED)
ACTUAL INVENTORY CHANGES Net Percent (“Increase” Minus “Decrease”) During Last Three Months
(Seasonally Adjusted)
Jan Feb Mar Apr May Jun Jul Aug Sep Oct Nov Dec2009 -18 -19 -23 -27 -27 -27 -27 -24 -24 -26 -25 -28
2010 -21 -18 -18 -18 -20 -21 -19 -15 -14 -16 -15 -13
2011 -10 -8 -7 -9 -13 -14 -13 -9 -11 -10 -10 -10
2012 -7 0 -9 -8 -8 -7 -10 -7 -8 -8 -10 -10
2013 -7 -9 -6 -6 -7 -7 -10 -5 -7 -6 -7 -4
2014 -4 -2 -6 -6
INVENTORY SATISFACTION Net Percent (“Too Low” Minus “Too Large”) at Present Time
(Seasonally Adjusted)
Jan Feb Mar Apr May Jun Jul Aug Sep Oct Nov Dec2009 -6 -5 -4 -5 -2 -5 -4 -4 0 -3 -2 -4
2010 -1 -1 -1 1 0 -1 0 -1 -2 1 -3 -3
2011 0 2 -1 1 -1 -1 0 1 -1 0 -1 0
2012 1 2 3 0 0 0 0 0 -1 0 -2 0
2013 -1 1 -1 -1 1 -2 -1 0 0 -5 -4 -5
2014 -2 -4 0 -1
INVENTORY PLANS Net Percent (“Increase” Minus “Decrease”) in the Next Three to Six Months
(Seasonally Adjusted)
Jan Feb Mar Apr May Jun Jul Aug Sep Oct Nov Dec2009 -10 -10 -13 -7 -3 -6 -5 -7 -6 -3 -3 -8
2010 -4 -7 -7 -2 2 -3 -4 -7 -3 -4 0 -3
2011 -1 -2 1 -1 -3 -3 -3 -5 -2 0 0 2
2012 -3 2 0 0 2 0 -1 -1 -1 -1 -5 -4
2013 -7 -1 -5 0 3 -1 -1 -2 -2 -1 0 -2
2014 -3 -5 1 3
16 |
NFI
B S
mal
l Bus
ines
s Eco
nom
ic T
rend
s Q
uart
erly
Rep
ort
SMALL BUSINESS CAPITAL OUTLAYS
0
20
40
60
80
74 76 78 80 82 84 86 88 90 92 94 96 98 00 02 04 06 08 10 12 14
Perc
ent
YEAR
Actual
Plans
CAPITAL EXPENDITURES Actual Last Six Months and Planned Next Three Months
January Quarter 1974 to April Quarter 2014 (Seasonally Adjusted)
ACTUAL CAPITAL EXPENDITURES Percent Making a Capital Expenditure During the Last Six Months
Jan Feb Mar Apr May Jun Jul Aug Sep Oct Nov Dec2009 51 52 50 46 46 46 46 45 44 45 44 44
2010 47 47 45 46 46 46 45 44 45 47 51 47
2011 51 49 51 50 50 50 50 52 50 52 53 56
2012 55 57 52 54 55 52 54 55 51 54 53 52
2013 55 56 57 56 57 56 54 53 55 57 55 64
2014 59 57 56 57
INVENTORY SATISFACTION AND INVENTORY PLANS Net Percent (“Too Low” Minus “Too Large”) at Present Time
Net Percent Planning to Add Inventories in the Next Three to Six Months (Seasonally Adjusted)
-15
-10
-5
0
5
10
15
74 76 78 80 82 84 86 88 90 92 94 96 98 00 02 04 06 08 10 12 14
SatisfactionPlans
Perc
ent
YEAR

17 |
NFI
B S
mal
l Bus
ines
s Eco
nom
ic T
rend
s Q
uart
erly
Rep
ort
SMALL BUSINESS CAPITAL OUTLAYS (CONTINUED)
AMOUNT OF CAPITAL EXPENDITURES MADE Percent Distribution of Per Firm Expenditures
During the Last Six Months
Amount Current One Year Ago Two Years Ago$1 to $999 4 4 3
$1,000 to $4,999 8 9 8
$5,000 to $9,999 7 6 5
$10,000 to $49,999 18 19 18
$50,000 to $99,999 7 7 7
$100,000 + 12 10 10
No Answer 1 1 3
CAPITAL EXPENDITURE PLANS Percent Planning a Capital Expenditure During Next Three to Six Months
Jan Feb Mar Apr May Jun Jul Aug Sep Oct Nov Dec2009 19 18 16 19 20 17 18 16 18 17 16 18
2010 20 20 19 19 20 19 18 16 19 18 20 21
2011 22 22 24 21 20 21 20 21 20 21 24 24
2012 24 23 22 25 24 21 21 24 21 22 19 20
2013 21 25 25 23 23 23 23 24 25 23 24 26
2014 24 25 24 25
TYPE OF CAPITAL EXPENDITURES MADE Percent Purchasing or Leasing During Last Six Months
Type Current One Year Ago Two Years AgoVehicles 23 22 22
Equipment 40 39 39
Furniture or Fixtures 14 12 13
Add. Bldgs. or Land 6 6 6
Improved Bldgs. or Land 13 14 13

18 |
NFI
B S
mal
l Bus
ines
s Eco
nom
ic T
rend
s Q
uart
erly
Rep
ort
SINGLE MOST IMPORTANT PROBLEM
SINGLE MOST IMPORTANT PROBLEM April 2014
Problem Current One
Year AgoSurvey
High Survey
Low Taxes 22 23 32 8
Inflation 5 5 41 0
Poor Sales 15 16 33 2
Fin. & Interest Rates 1 2 37 2
Cost of Labor 5 4 9 2
Govt. Reqs. & Red Tape 20 21 27 4
Comp. From Large Bus. 9 8 14 4
Quality of Labor 9 7 23 3
Cost/Avail. of Insurance 7 8 29 4
Other 7 6 31 2
SELECTED SINGLE MOST IMPORTANT PROBLEM Insurance, Big Business Competition, Inflation, and Regulation
January Quarter 1974 to April Quarter 2014
0
10
20
30
40
74 76 78 80 82 84 86 88 90 92 94 96 98 00 02 04 06 08 10 12 14
Big Business Insurance
Inflation Regulation
Perc
ent o
f Firm
s
YEAR
SELECTED SINGLE MOST IMPORTANT PROBLEM Sales, Fin. & Interest Rates, Labor Cost, Labor Quality, and Taxes
January Quarter 1974 to April Quarter 2014
0
10
20
30
40
74 76 78 80 82 84 86 88 90 92 94 96 98 00 02 04 06 08 10 12 14
Taxes Sales
Interest Rates Labor Quality
Perc
ent o
f Firm
s
YEAR
19 |
NFI
B S
mal
l Bus
ines
s Eco
nom
ic T
rend
s Q
uart
erly
Rep
ort
SURVEY PROFILE
OWNER/MEMBERS PARTICIPATING IN ECONOMIC SURVEY NFIB
Actual Number of Firms
NFIB OWNER/MEMBERS PARTICIPATING IN ECONOMIC SURVEY
Industry of Small Business
0
5
10
15
20
25
30
Perc
ent
0
5
10
15
20
25
30
Perc
ent
Jan Feb Mar Apr May Jun Jul Aug Sep Oct Nov Dec2009 2013 846 867 1794 814 758 1994 882 827 2059 825 830
2010 2114 799 948 2176 823 804 2029 874 849 1910 807 804
2011 2144 774 811 1985 733 766 1817 926 729 2077 781 735
2012 2155 819 757 1817 681 740 1803 736 691 2029 733 648
2013 2033 870 759 1873 715 662 1615 782 773 1940 762 635
2014 1864 792 685 1699
NFIB OWNER/MEMBERS PARTICIPATING IN ECONOMIC SURVEY
Number of Full and Part-Time Employees
20 |
NFI
B S
mal
l Bus
ines
s Eco
nom
ic T
rend
s Q
uart
erly
Rep
ort
NFIB RESEARCH FOUNDATION SMALL BUSINESS ECONOMIC SURVEY
SMALL BUSINESS SURVEY QUESTIONS PAGE IN REPORT
Do you think the next three months will be a good time for small business to expand substantially? Why? . . . . . . . . . . . . . . . 4
About the economy in general, do you think that six months from now general business conditions will be better than they are now, about the same, or worse? . . . . . . . . . . . . 5
Were your net earnings or “income” (after taxes) from your business during the last calendar quarter higher, lower, or about the same as they were for the quarter before?. . . . . . . . . . . . . 6
If higher or lower, what is the most important reason?. . . . . . . . . . . . 6
During the last calendar quarter, was your dollar sales volume higher, lower, or about the same as it was for the quarter before?. . . . . . . . . . . . . . . . . . . . . . . . . . . . . . . . . . . . 7
Overall, what do you expect to happen to real volume (number of units) of goods and/or services that you will sell during the next three months?. . . . . . . . . . . . . . . . . . . . . . . . . 7
How are your average selling prices compared to three months ago?. . . . . . . . . . . . . . . . . . . . . . . . . . . . . . . . . . . . 8
In the next three months, do you plan to change the average selling prices of your goods and/or services? . . . . . . . . . . . . 8
During the last three months, did the total number of employees in your firm increase, decrease, or stay about the same?. . . . . . . . . . 9
If you have filled or attempted to fill any job openings in the past three months, how many qualified applicants were there for the position(s)?. . . . . . . . . . . . . . . . . . . . . . . . . . . . 9
Do you have any job openings that you are not able to fill right now?. . . . . . . . . . . . . . . . . . . . . . . . . . . . . . . . . . . . . 10
In the next three months, do you expect to increase or decrease the total number of people working for you? . . . . . . . . . . . 10
Over the past three months, did you change the average employee compensation?. . . . . . . . . . . . . . . . . . . . . . . . . . . . . . . 11
Do you plan to change average employee compensation during the next three months?. . . . . . . . . . . . . . . . . . . . . . . . . . . 11
21 |
NFI
B S
mal
l Bus
ines
s Eco
nom
ic T
rend
s M
onth
ly R
epor
t
SMALL BUSINESS SURVEY QUESTIONS PAGE IN REPORT
Are…loans easier or harder to get than they were three months ago? . . . . . . . . . . . . . . . . . . . . . . . . . . . . . . . . . . . . . . . 12 During the last three months, was your firm able to satisfy its borrowing needs? . . . . . . . . . . . . . . . . . . . . . . . . . . . . . . . 13 Do you expect to find it easier or harder to obtain your required financing during the next three months? . . . . . . . . . . . . . 13 If you borrow money regularly (at least once every three months) as part of your business activity, how does the rate of interest payable on your most recent loan compare with that paid three months ago? . . . . . . . . . . . . . . . . . . . . . . . . . . . 14 If you borrowed within the last three months for business purposes, and the loan maturity (pay back period) was 1 year or less, what interest rate did you pay? . . . . . . . . . . . . . . . . . . 14 During the last three months, did you increase or decrease your inventories? . . . . . . . . . . . . . . . . . . . . . . . . . . . . . . . . . . . . . . . . . 15 At the present time, do you feel your inventories are too large, about right, or inadequate? . . . . . . . . . . . . . . . . . . . . . . . . . . 15 Looking ahead to the next three months to six months, do you expect, on balance, to add to your inventories, keep them about the same, or decrease them? . . . . . . . . . . . . . . . 15 During the last six months, has your firm made any capital expenditures to improve or purchase equipment, buildings, or land? . . . . . . . . . . . . . . . . . . . . . . . . . . . . . . . . . . . . . . . . . . . . . . . 16 If [your firm made any capital expenditures], what was the total cost of all these projects? . . . . . . . . . . . . . . . . . . . . . . . . 17 Looking ahead to the next three to six months, do you expect to make any capital expenditures for plant and/or physical equipment? . . . . . . . . . . . . . . . . . . . . . . . . . . . . . . 17 What is the single most important problem facing your business today? . . . . . . . . . . . . . . . . . . . . . . . . . . . . . . . . . . . . . . . . 18 Please classify your major business activity, using one of the categories of example below . . . . . . . . . . . . . . . . . . . . . . . . 19 How many employees do you have full and part-time, including yourself? . . . . . . . . . . . . . . . . . . . . . . . . . . . . . . . . . . . . . 19