NFIB ECONOMIC TRENDS - Small Business … | NFIB Small Business Economic Trends Quarterly Report...
23
SMALL BUSINESS OPTIMISM INDEX COMPONENTS Index Component Seasonally Adjusted Level Change from Last Month Contribution to Index Change Plans to Increase Employment 11% 1 * Plans to Make Capital Outlays 26% 2 * Plans to Increase Inventories 4% 3 * Expect Economy to Improve -6% 1 * Expect Real Sales Higher 10% -3 * Current Inventory -1% 4 * Current Job Openings 27% 3 * Expected Credit Conditions -4% 2 * Now a Good Time to Expand 10% 0 * Earnings Trends -16% 6 * Total Change 19 * (Column 1 is the current reading; column 2 is the change from the prior month; column 3 the percent of the total change accounted for by each component; * is under 1 percent and not a meaningful calculation) Based on a Survey of Small and Independent Business Owners NFIB SMALL BUSINESS ECONOMIC TRENDS NFIB SMALL BUSINESS ECONOMIC TRENDS William C. Dunkelberg Holly Wade April 2015
-
Upload
truongnhan -
Category
Documents
-
view
219 -
download
0
Transcript of NFIB ECONOMIC TRENDS - Small Business … | NFIB Small Business Economic Trends Quarterly Report...

SMALL BUSINESS OPTIMISM INDEX COMPONENTS
Index ComponentSeasonally
Adjusted LevelChange from Last Month
Contribution to Index Change
Plans to Increase Employment 11% 1 *Plans to Make Capital Outlays 26% 2 *Plans to Increase Inventories 4% 3 *Expect Economy to Improve -6% 1 *Expect Real Sales Higher 10% -3 *Current Inventory -1% 4 *Current Job Openings 27% 3 *Expected Credit Conditions -4% 2 *Now a Good Time to Expand 10% 0 *Earnings Trends -16% 6 *Total Change 19 *(Column 1 is the current reading; column 2 is the change from the prior month; column 3 the percent of the total change accounted for by each component; * is under 1 percent and not a meaningful calculation)
1201 “F” Street NW
Suite 200W
ashington, DC
20004 nfib.com
Based on a Survey of Small and Independent Business Owners
NFIB SMALL BUSINESS
ECONOMIC TRENDS NFIB SMALL BUSINESS
ECONOMIC TRENDS
NFIBS
MA
LL B
USIN
ESS
EC
ON
OM
IC TR
EN
DS
NFIBS
MA
LL B
USIN
ESS
EC
ON
OM
IC TR
EN
DS
William C. DunkelbergHolly Wade
SBET_CVR_2012.indd 1-2SBET_CVR_2012.indd 1-2 3/30/2012 11:27:49 AM3/30/2012 11:27:49 AM
April 2015

NFIB SMALL BUSINESS
ECONOMIC TRENDS_____________________
NFIB Research Foundation has collected SmallBusiness Economic Trends Data with Quarterlysurveys since 1973 and monthly surveys since 1986.The sample is drawn from the membership files of theNational Federation of Independent Business (NFIB).Each was mailed a questionnaire and one reminder.Subscriptions for twelve monthly SBET issues are$250. Historical and unadjusted data are available,along with a copy of the questionnaire, from the NFIBResearch Foundation. You may reproduce SmallBusiness Economic Trends items if you cite thepublication name and date and note it is a copyrightof the NFIB Research Foundation. © NFIB ResearchFoundation. ISBS #0940791-24-2. Chief EconomistWilliam C. Dunkelberg and Director, Research andPolicy Analysis Holly Wade are responsible for thereport.
IN THIS ISSUE_____________________Summary . . . . . . . . . . . . . . . . . . . . . . . . . . . . . . 1Commentary. . . . . . . . . . . . . . . . . . . . . . . . . . . . 3Optimism . . . . . . . . . . . . . . . . . . . . . . . . . . . . . . 4Outlook . . . . . . . . . . . . . . . . . . . . . . . . . . . . . . . 4Earnings . . . . . . . . . . . . . . . . . . . . . . . . . . . . . . .6Sales . . . . . . . . . . . . . . . . . . . . . . . . . . . . . . . . . 7Prices . . . . . . . . . . . . . . . . . . . . . . . . . . . . . . . . .8Employment. . . . . . . . . . . . . . . . . . . . . . . . . . . . 9Compensation . . . . . . . . . . . . . . . . . . . . . . . . . 10Credit Conditions . . . . . . . . . . . . . . . . . . . . . . . 12Inventories . . . . . . . . . . . . . . . . . . . . . . . . . . . . 14Capital Outlays. . . . . . . . . . . . . . . . . . . . . . . . . 16Most Important Problem . . . . . . . . . . . . . . . . . 18Survey Profile . . . . . . . . . . . . . . . . . . . . . . . . . 19Economic Survey. . . . . . . . . . . . . . . . . . . . . . . 20

1 |
NF
IB S
mal
l B
usin
ess
Eco
nom
ic T
rend
s Q
uart
erly
Rep
ort
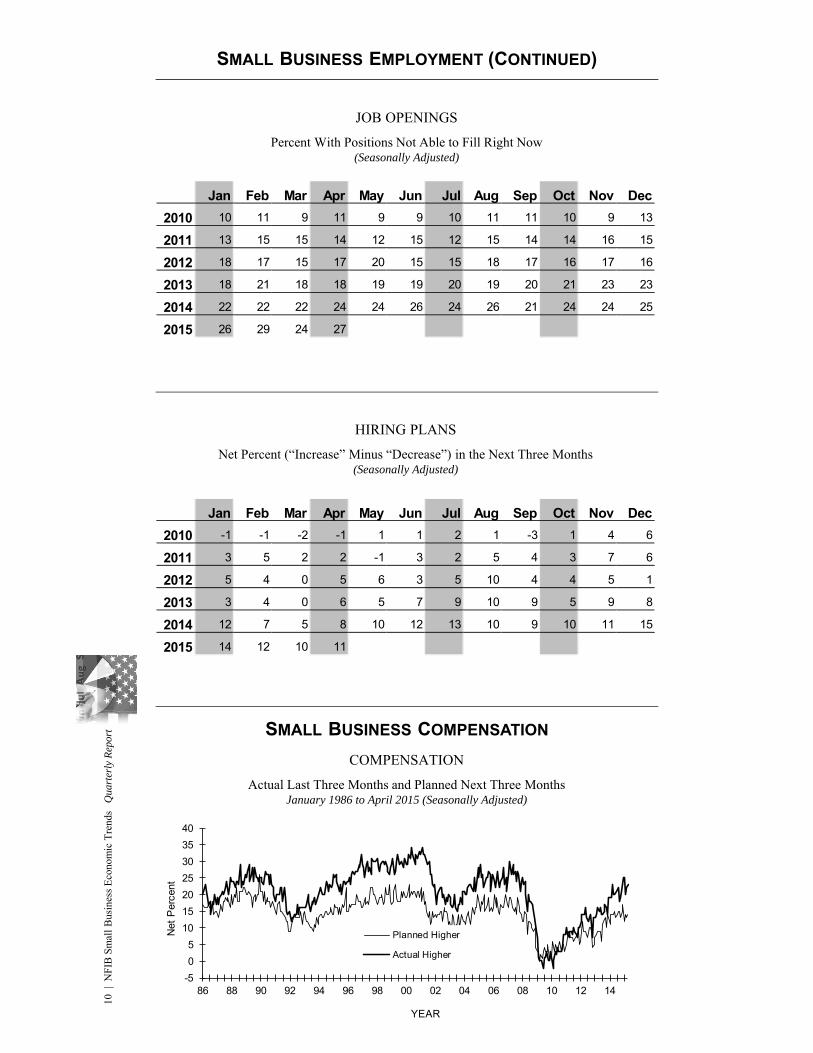
SUMMARYOPTIMISM INDEXThe Small Business Optimism Index increased 1.7 points from March to 96.9, this in spite of a quarter of virtually no economic growth. Unfortunately, the Index remained below the January reading. Nine of the 10 Index components gained or were unchanged, only real sales expectations were weaker. But this still leaves the Index below its historical average, oscillating between 95 and 98 but never breaking out except for December, when the Index just tipped past 100, only to fall again.LABOR MARKETSSmall businesses posted another decent month of job creation. Those that hired were more aggressive than those reducing employment, producing an average increase of 0.14 workers per firm, continuing a string of solid readings for 2015. Fifty-three percent reported hiring or trying to hire (up 3 points), but 44 percent reported few or no qualified applicants for the positions they were trying to fill. Thirteen percent reported using temporary workers, up 3 points. Twenty-seven percent of all owners reported job openings they could not fill in the current period, up 3 points from March. A net 11 percent plan to create new jobs, up 1 point and a solid reading.
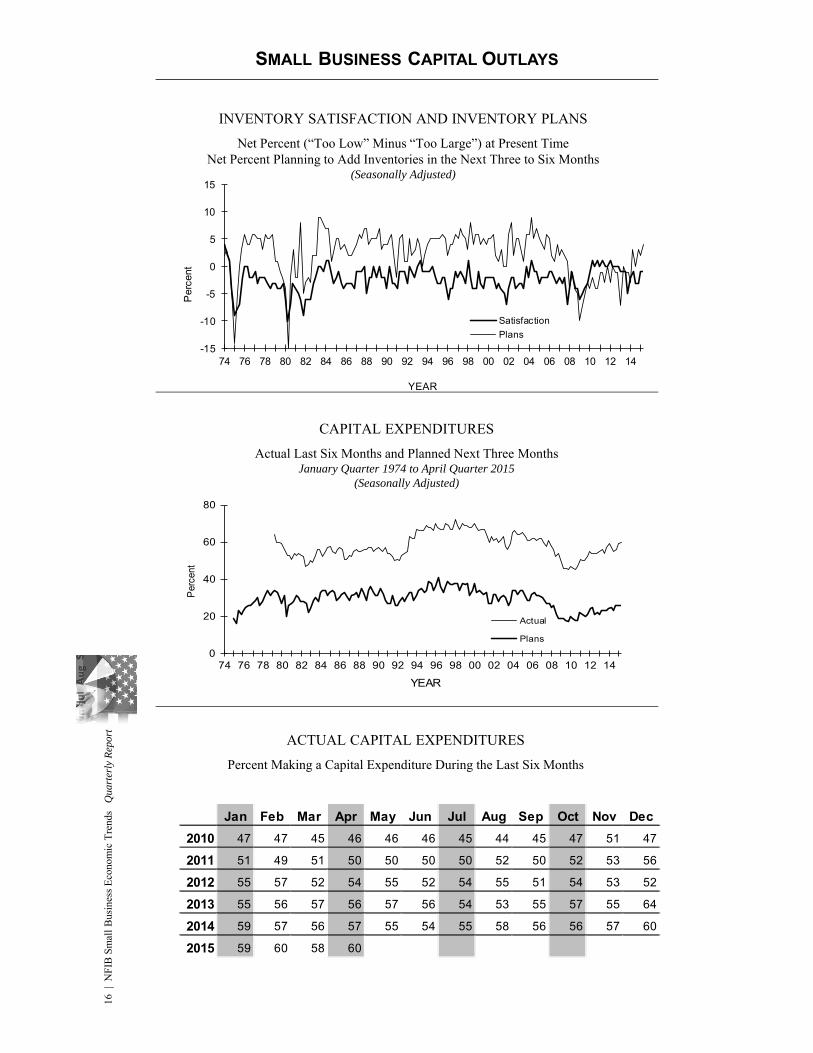
CAPITAL SPENDING
Sixty percent reported outlays, up 2 points in spite of the collapse of spending in energy and gas exploration. The percent of owners planning capital outlays in the next 3 to 6 months rose 2 points to 26 percent, not a strong reading historically but among the best in this expansion. Forty-four percent expected improved real sales volumes, 18 percent expected declines, leaving the net percent expecting higher real sales 3 points lower at a net 10 percent of all owners.
PROFITS AND WAGES
Earnings trends posted an unexpected 6 point gain, posting a reading of a net negative 16 percent. Reports of increased labor compensation rose 1 point to a net 23 percent of all owners. Labor costs continue to put pressure on the bottom line but fuel prices are down a lot. Two percent reported reduced worker compensation and 26 percent reported raising compensation. This should begin to show up in wage growth, although rising benefits offset potential increases in take-home pay.
A seasonally adjusted net 14 percent plan to raise compensation in the coming months (up 1 point). The reported gains in compensation are still in the range typical of an economy with reasonable growth, and labor market conditions are suggestive of a tightening, which will put further upward pressure on compensation along with government regulations including the healthcare law.
This survey was conducted in April 2015. A sample of 10,799 small-business owners/members was drawn.One thousand five hundred (1,500) usable responses were received – a response rate of 14 percent.

2 |
NF
IB S
mal
l B
usin
ess
Eco
nom
ic T
rend
s Q
uart
erly
Rep
ort
INVENTORIES AND SALES
The net percent of owners reporting inventory reductions rose 3 points to a net negative 1 percent (seasonally adjusted). The net percent of owners viewing current inventory stocks as “too low” improved 4 points to a net negative 1 percent. Apparently owners were meeting demand by drawing down stocks to match their mediocre expectations for improvements in sales. The net percent of owners planning to add to inventory rose 3 points to 4 percent, in sympathy with the more widespread reduction in stocks in the first quarter.
The net percent of all owners (seasonally adjusted) reporting higher nominal sales in the past 3 months compared to the prior 3 months fell 1 point to a net negative 4 percent. Although consumer spending was the only bright spot in the first quarter GDP report, it was nothing to write home about. Eleven percent cited weak sales as their top business problem, unchanged from March. Expected real sales volumes posted a 3 point decline, falling to a net 10 percent of owners expecting gains, after a 5 point decline in January and February and a 2 point decline in March. The 4 month downward trend does not bode well for economic growth in the small business sector. Overall, expectations are not showing a lot of strength.
INFLATION
Fourteen percent of the NFIB owners reported reducing their average selling prices in the past 3 months (down 1 point), and 18 percent reported price increases (down 1 point). Seasonally adjusted, the net percent of owners raising selling prices was 2 percent, a very “tame” reading and unchanged from March. Seasonally adjusted, a net 17 percent plan price hikes (up 2 points). The economy has grown too slowly to support widespread price hikes.
CREDIT MARKETS
Four percent of owners reported that all their borrowing needs were not satisfied, down 1 point and historically low. Thirty-one percent reported all credit needs met, and 53 percent explicitly said they did not want a loan. For most of the recession, record numbers of firms have been on the “credit sidelines”, seeing no good reason to borrow. Only 2 percent reported that financing was their top business problem (down 1 point) compared to 22 percent citing taxes, 23 percent citing regulations and red tape and 11 percent citing weak sales.
Thirty percent of all owners reported borrowing on a regular basis, down 2 points. The average rate paid on short maturity loans fell 70 basis points to 5.0 percent. Loan demand remained historically weak.
The net percent of owners expecting credit conditions to ease in the coming months was a negative 4 percent, a 2 point improvement. Interest rates are low, but prospects for putting borrowed money profitably to work have not improved enough to induce owners to step up their borrowing and spending.
SUMMARY
3 |
NF
IB S
mal
l B
usin
ess
Eco
nom
ic T
rend
s Q
uart
erly
Rep
ort
COMMENTARYSo 2015 got off to a slow start with GDP increasing only 0.2 percent at first “guess”. Trade data will apparently depress that further, perhaps producing a negative print, although more consumer spending may be found to keep growth above the 0 line. For a different perspective, GDP has grown 3 percent from the end of Q1 2014 to the end of Q1 2015, reflecting the volatility in growth that has occurred. Growth for the year will improve, but this was not a good start.
Job growth certainly hit a major speed bump. Weather, sure, but not in major GDP states like Texas, Florida, and California. The plunge in oil prices certainly adversely impacted job growth in the shale states. The West Coast dock strike? Maybe. But hard to figure out how many jobs might have been lost due to delays, certainly temporary losses that will be recovered when the goods flow. NFIB indicators have small business job growth fairly solid and the job openings numbers continue to signal a decline in the unemployment rate.
Financial markets remain on edge for signs of a Federal Reserve rate hike. A zero rate is looking even more absurd with 3 percent growth for the past 12 months. The Fed could argue that growth would have been worse if rates were higher, but more and more observers doubt the validity of that proposition. Low rates (and lower rates) won’t drive more spending, everyone has their “cheap loan”. Rather, it will require an improvement in economic and political prospects to induce economic agents to pick up the pace of hiring and investment spending. Meantime, investors (Gamblers? Are there any investors?) will continue to play the Fed’s waiting/guessing game. The most recent murmurs from the Fed suggest they are recognizing the distortions in asset prices that buying trillions of dollars of risk-free assets (and hoarding them) have created.
The small business growth engine appears to be accounting for more of the real growth (what little there is) as economic activity among the larger firms fades. Solid growth (over 3 percent) will require good performances from both sectors and that will be elusive this year.

4 |
NF
IB S
mal
l B
usin
ess
Eco
nom
ic T
rend
s Q
uart
erly
Rep
ort
OVERVIEW - SMALL BUSINESS OPTIMISM
OPTIMISM INDEX
Based on Ten Survey Indicators(Seasonally Adjusted 1986=100)
OPTIMISM INDEX
Based on Ten Survey Indicators(Seasonally Adjusted 1986=100)
OUTLOOK
Good Time to Expand and Expected General Business ConditionsJanuary Quarter 1974 to April Quarter 2015
(Seasonally Adjusted)
SMALL BUSINESS OUTLOOK
Jan Feb Mar Apr May Jun Jul Aug Sep Oct Nov Dec
2010 89.3 88.0 86.8 90.6 92.2 89.0 88.1 88.8 89.0 91.7 93.2 92.6
2011 94.1 94.5 91.9 91.2 90.9 90.8 89.9 88.1 88.9 90.2 92.0 93.8
2012 93.9 94.3 92.5 94.5 94.4 91.4 91.2 92.9 92.8 93.1 87.5 88.0
2013 88.9 90.8 89.5 92.1 94.4 93.5 94.1 94.1 93.9 91.6 92.5 93.9
2014 94.1 91.4 93.4 95.2 96.6 95.0 95.7 96.1 95.3 96.1 98.1 100.4
2015 97.9 98.0 95.2 96.9
70
80
90
100
110
75 77 79 81 83 85 87 89 91 93 95 97 99 01 03 05 07 09 11 13 15
Inde
x V
alue
(19
86=1
00)
YEAR
-40
-20
0
20
40
60
80
0
10
20
30
74 76 78 80 82 84 86 88 90 92 94 96 98 00 02 04 06 08 10 12 14
Per
cent
"G
ood
Tim
e to
Exp
and"
(th
ick
line)
Per
cent
"B
ette
r" M
inus
"W
orse
" E
xpec
ted
Gen
eral
B
usin
ess
Con
ditio
ns (
thin
line
)
YEAR

5 |
NF
IB S
mal
l B
usin
ess
Eco
nom
ic T
rend
s Q
uart
erly
Rep
ort
SMALL BUSINESS OUTLOOK (CONTINUED)
OUTLOOK FOR EXPANSION
Percent Next Three Months “Good Time to Expand”(Seasonally Adjusted)
MOST IMPORTANT REASON FOR EXPANSION OUTLOOK
Reason Percent by Expansion OutlookApril 2015
OUTLOOK FOR GENERAL BUSINESS CONDITIONS
Net Percent (“Better” Minus “Worse”) Six Months From Now(Seasonally Adjusted)
Reason Good Time Not Good Time Uncertain
Economic Conditions 6 24 16
Sales Prospects 5 4 4
Fin. & Interest Rates 1 1 0
Cost of Expansion 0 5 5
Political Climate 0 10 9
Other/Not Available 1 2 5
Jan Feb Mar Apr May Jun Jul Aug Sep Oct Nov Dec
2010 1 -9 -8 0 8 -6 -15 -8 -3 8 16 9
2011 10 9 -5 -8 -5 -11 -15 -26 -22 -16 -12 -8
2012 -3 -6 -8 -5 -2 -10 -8 -2 2 2 -35 -35
2013 -30 -28 -28 -15 -5 -4 -6 -2 -10 -17 -20 -11
2014 -11 -19 -18 -9 0 -10 -6 -3 -2 -3 13 12
2015 0 -1 -7 -6
Jan Feb Mar Apr May Jun Jul Aug Sep Oct Nov Dec
2010 5 4 2 4 5 6 5 4 6 7 9 8
2011 8 7 5 4 5 4 6 5 6 7 8 10
2012 9 8 7 7 7 5 5 4 7 7 6 8
2013 6 5 4 4 8 7 9 6 8 6 9 10
2014 8 6 8 8 10 7 10 9 13 11 11 16
2015 13 13 10 10

6 |
NF
IB S
mal
l B
usin
ess
Eco
nom
ic T
rend
s Q
uart
erly
Rep
ort
SMALL BUSINESS EARNINGS
EARNINGS
Actual Last Three MonthsJanuary Quarter 1974 to April Quarter 2015
(Seasonally Adjusted)
ACTUAL EARNINGS CHANGES
Net Percent (“Higher” Minus “Lower”) Last Three MonthsCompared to Prior Three Months
(Seasonally Adjusted)
MOST IMPORTANT REASON FOR LOWER EARNINGS
Percent ReasonApril 2015
* Increased costs include labor, materials, finance, taxes, and regulatory costs.
-50
-40
-30
-20
-10
0
74 76 78 80 82 84 86 88 90 92 94 96 98 00 02 04 06 08 10 12 14
Net
Per
cent
YEAR
Reason Current Month One Year Ago Two Years Ago
Sales Volume 14 15 18
Increased Costs* 10 11 14
Cut Selling Prices 4 2 3
Usual Seasonal Change 8 8 6
Other 3 5 2
Jan Feb Mar Apr May Jun Jul Aug Sep Oct Nov Dec
2010 -42 -39 -43 -31 -28 -32 -33 -30 -33 -26 -30 -34
2011 -28 -27 -32 -26 -24 -24 -24 -26 -27 -26 -28 -22
2012 -24 -19 -23 -12 -15 -22 -27 -28 -27 -26 -32 -29
2013 -26 -26 -23 -23 -22 -23 -22 -21 -23 -23 -24 -22
2014 -27 -27 -24 -20 -17 -18 -18 -17 -19 -20 -17 -15
2015 -19 -19 -22 -16

7 |
NF
IB S
mal
l B
usin
ess
Eco
nom
ic T
rend
s Q
uart
erly
Rep
ort
SMALL BUSINESS SALES
SALES EXPECTATIONS
Net Percent (“Higher” Minus “Lower”) During Next Three Months(Seasonally Adjusted)
ACTUAL SALES CHANGES
Net Percent (“Higher” Minus “Lower”) Last Three MonthsCompared to Prior Three Months
(Seasonally Adjusted)
SALES
Actual (Prior Three Months) and Expected (Subsequent Three Months)January 1974 to April 2015 (Seasonally Adjusted)
Jan Feb Mar Apr May Jun Jul Aug Sep Oct Nov Dec
2010 3 0 -3 6 5 -5 -4 0 -3 1 6 8
2011 13 14 6 5 3 0 -2 -12 -6 -4 4 9
2012 10 12 8 6 2 -3 -4 1 1 3 -5 -2
2013 -1 1 -4 4 8 5 7 5 8 2 3 8
2014 15 3 12 10 15 11 10 6 5 9 14 20
2015 16 15 13 10
-40
-30
-20
-10
0
10
20
30
40
50
74 76 78 80 82 84 86 88 90 92 94 96 98 00 02 04 06 08 10 12 14
Expected
Actual
Net P
erce
nt
YEAR
Jan Feb Mar Apr May Jun Jul Aug Sep Oct Nov Dec
2010 -26 -26 -25 -15 -11 -15 -16 -16 -17 -13 -15 -16
2011 -11 -11 -12 -5 -9 -7 -8 -9 -10 -12 -11 -7
2012 -6 -7 1 4 2 -5 -9 -13 -13 -15 -15 -10
2013 -9 -9 -7 -4 -4 -8 -7 -6 -6 -8 -8 -8
2014 -10 -8 -6 -2 -1 -2 -3 -2 -4 -3 -4 -2
2015 -3 -6 -3 -4

8 |
NF
IB S
mal
l B
usin
ess
Eco
nom
ic T
rend
s Q
uart
erly
Rep
ort
SMALL BUSINESS PRICES
PRICE PLANS
Net Percent (“Higher” Minus “Lower”) in the Next Three Months(Seasonally Adjusted)
ACTUAL PRICE CHANGES
Net Percent (“Higher” Minus “Lower”)Compared to Three Months Ago
(Seasonally Adjusted)
PRICES
Actual Last Three Months and Planned Next Three MonthsJanuary Quarter 1974 to April Quarter 2015
(Seasonally Adjusted)
Jan Feb Mar Apr May Jun Jul Aug Sep Oct Nov Dec
2010 -18 -21 -20 -11 -15 -13 -11 -8 -11 -5 -4 -5
2011 -4 5 9 12 15 10 7 1 6 -1 0 0
2012 -1 1 6 8 3 3 8 9 6 5 0 0
2013 2 2 -1 3 2 8 4 2 1 5 2 -1
2014 2 1 9 12 12 14 14 6 4 8 4 4
2015 3 0 2 2
Jan Feb Mar Apr May Jun Jul Aug Sep Oct Nov Dec
2010 8 10 9 13 14 11 10 10 7 12 13 15
2011 19 21 24 24 23 15 19 16 14 14 15 14
2012 17 19 21 23 17 16 17 17 19 16 16 16
2013 21 23 17 18 15 18 15 18 19 18 19 19
2014 19 23 19 22 21 21 22 19 16 20 19 22
2015 19 19 15 17
-30-20-10
010203040506070
74 76 78 80 82 84 86 88 90 92 94 96 98 00 02 04 06 08 10 12 14
Actual
Planned
Net
Per
cent
YEAR

9 |
NF
IB S
mal
l B
usin
ess
Eco
nom
ic T
rend
s Q
uart
erly
Rep
ort
SMALL BUSINESS EMPLOYMENT
ACTUAL EMPLOYMENT CHANGES
Net Percent (“Increase” Minus “Decrease”) in the Last Three Months(Seasonally Adjusted)
QUALIFIED APPLICANTS FOR JOB OPENINGS
Percent Few or No Qualified Applicants(Seasonally Adjusted)
EMPLOYMENT
Planned Next Three Months and Current Job OpeningsJanuary Quarter 1974 to April Quarter 2015
(Seasonally Adjusted)
Jan Feb Mar Apr May Jun Jul Aug Sep Oct Nov Dec
2010 -10 -9 -11 -12 -12 -10 -5 -2 -3 -6 -2 -1
2011 -4 -2 -4 -6 -3 -7 -2 -2 -5 0 2 1
2012 0 -2 -3 -4 -5 -3 1 2 -3 1 -1 -2
2013 2 -2 -2 -2 -3 -1 -1 4 0 3 2 4
2014 2 2 -1 -2 -1 -1 3 4 3 3 2 9
2015 5 4 -1 -2
-10
0
10
20
30
40
74 76 78 80 82 84 86 88 90 92 94 96 98 00 02 04 06 08 10 12 14
Planned
Job Openings
YEAR
Per
cent
Jan Feb Mar Apr May Jun Jul Aug Sep Oct Nov Dec
2010 24 26 23 26 26 25 28 32 30 28 27 28
2011 28 30 29 32 30 33 31 33 34 31 35 34
2012 31 31 32 34 37 33 38 37 41 38 36 33
2013 34 34 36 38 38 41 40 42 41 40 44 38
2014 38 40 41 41 46 43 42 46 42 45 45 43
2015 42 47 42 44
10 |
NF
IB S
mal
l B
usin
ess
Eco
nom
ic T
rend
s Q
uart
erly
Rep
ort
SMALL BUSINESS EMPLOYMENT (CONTINUED)
JOB OPENINGS
Percent With Positions Not Able to Fill Right Now(Seasonally Adjusted)
HIRING PLANS
Net Percent (“Increase” Minus “Decrease”) in the Next Three Months(Seasonally Adjusted)
SMALL BUSINESS COMPENSATION
COMPENSATION
Actual Last Three Months and Planned Next Three MonthsJanuary 1986 to April 2015 (Seasonally Adjusted)
-505
10152025303540
86 88 90 92 94 96 98 00 02 04 06 08 10 12 14
Net
Per
cent
YEAR
Planned Higher
Actual Higher
Jan Feb Mar Apr May Jun Jul Aug Sep Oct Nov Dec
2010 10 11 9 11 9 9 10 11 11 10 9 13
2011 13 15 15 14 12 15 12 15 14 14 16 15
2012 18 17 15 17 20 15 15 18 17 16 17 16
2013 18 21 18 18 19 19 20 19 20 21 23 23
2014 22 22 22 24 24 26 24 26 21 24 24 25
2015 26 29 24 27
Jan Feb Mar Apr May Jun Jul Aug Sep Oct Nov Dec
2010 -1 -1 -2 -1 1 1 2 1 -3 1 4 6
2011 3 5 2 2 -1 3 2 5 4 3 7 6
2012 5 4 0 5 6 3 5 10 4 4 5 1
2013 3 4 0 6 5 7 9 10 9 5 9 8
2014 12 7 5 8 10 12 13 10 9 10 11 15
2015 14 12 10 11

11 |
NF
IB S
mal
l B
usin
ess
Eco
nom
ic T
rend
s Q
uart
erly
Rep
ort
SMALL BUSINESS COMPENSATION (CONTINUED)
ACTUAL COMPENSATION CHANGES
Net Percent (“Increase” Minus “Decrease”) During Last Three Months(Seasonally Adjusted)
COMPENSATION PLANS
Net Percent (“Increase” Minus “Decrease”) in the Next Three Months(Seasonally Adjusted)
PRICES AND LABOR COMPENSATION
Net Percent Price Increase and Net Percent Compensation Increase(Seasonally Adjusted)
0
5
10
15
20
25
30
35
40
-30-20-10
010203040506070
74 76 78 80 82 84 86 88 90 92 94 96 98 00 02 04 06 08 10 12 14
Pric
es (T
hick
Lin
e)
Labo
r C
ompe
nsat
ion
(Thi
n Li
ne)
YEAR
Jan Feb Mar Apr May Jun Jul Aug Sep Oct Nov Dec
2010 1 6 3 5 4 3 5 6 3 5 5 3
2011 5 7 9 7 7 7 6 7 7 8 9 5
2012 6 12 9 9 9 7 8 10 10 9 4 5
2013 7 8 9 9 9 6 11 12 13 10 14 13
2014 11 14 14 14 15 13 14 15 15 13 15 17
2015 12 14 13 14
Jan Feb Mar Apr May Jun Jul Aug Sep Oct Nov Dec
2010 1 -2 0 3 2 4 3 3 3 4 8 8
2011 10 8 7 9 9 8 10 9 8 7 10 10
2012 12 14 14 14 16 13 12 13 14 11 7 13
2013 13 14 16 15 16 14 14 15 17 16 14 19
2014 19 19 23 20 20 21 21 22 18 19 21 25
2015 25 20 22 23

12 |
NF
IB S
mal
l B
usin
ess
Eco
nom
ic T
rend
s Q
uart
erly
Rep
ort
SMALL BUSINESS CREDIT CONDITIONS
CREDIT CONDITIONS
Loan Availability Compared to Three Months Ago*January Quarter 1974 to April Quarter 2015
* For the population borrowing at least once every three months.
REGULAR BORROWERS
Percent Borrowing at Least Once Every Three Months
AVAILABILITY OF LOANS
Net Percent (“Easier” Minus “Harder”)Compared to Three Months Ago
(Regular Borrowers)
Jan Feb Mar Apr May Jun Jul Aug Sep Oct Nov Dec
2010 32 34 35 31 32 29 32 31 33 31 28 30
2011 31 31 29 32 29 29 30 32 31 30 34 31
2012 32 32 31 32 32 29 31 30 31 30 30 29
2013 31 29 30 31 29 29 31 28 30 28 29 30
2014 31 30 31 30 31 28 30 29 31 28 33 31
2015 33 30 32 30
-32
-28
-24
-20
-16
-12
-8
-4
0
4
74 76 78 80 82 84 86 88 90 92 94 96 98 00 02 04 06 08 10 12 14
Net
Per
cent
YEAR
Jan Feb Mar Apr May Jun Jul Aug Sep Oct Nov Dec
2010 -14 -12 -15 -14 -13 -13 -13 -12 -14 -11 -11 -12
2011 -10 -11 -8 -9 -10 -9 -10 -13 -10 -11 -10 -8
2012 -8 -8 -11 -7 -9 -7 -7 -7 -6 -7 -9 -9
2013 -7 -7 -4 -7 -5 -6 -6 -6 -5 -6 -6 -7
2014 -6 -8 -8 -5 -6 -6 -5 -5 -7 -4 -5 -3
2015 -4 -3 -5 -4
13 |
NF
IB S
mal
l B
usin
ess
Eco
nom
ic T
rend
s Q
uart
erly
Rep
ort
SMALL BUSINESS CREDIT CONDITIONS (CONTINUED)
BORROWING NEEDS SATISFIED
Percent of All Businesses Last Three Months Satisfied/Percent of All Businesses Last Three Months Not Satisfied
(Borrowers Only)
EXPECTED CREDIT CONDITIONS
Net Percent (“Easier” Minus “Harder”) During Next Three Months(Regular Borrowers)
INTEREST RATES
Relative Rates and Actual Rates Last Three MonthsJanuary Quarter 1974 to April Quarter 2015
Jan Feb Mar Apr May Jun Jul Aug Sep Oct Nov Dec
2010 -13 -14 -16 -15 -12 -13 -14 -14 -14 -12 -10 -11
2011 -10 -10 -9 -13 -11 -10 -11 -13 -12 -11 -10 -9
2012 -9 -10 -11 -8 -10 -8 -7 -9 -7 -8 -10 -11
2013 -9 -8 -6 -8 -6 -7 -8 -8 -7 -8 -7 -7
2014 -7 -7 -7 -6 -7 -7 -5 -5 -7 -5 -6 -5
2015 -5 -4 -6 -4
5
10
15
20
-40-30-20-10
01020304050
74 80 86 92 98 4 10
YEAR
Rel
ative
(th
ick
line)
Act
ual (
thin
line
)
Jan Feb Mar Apr May Jun Jul Aug Sep Oct Nov Dec
2010 27/11 29/9 29/11 28/9 28/8 25/10 27/9 27/9 27/9 26/9 25/9 28/9
2011 28/8 29/8 28/7 28/8 28/8 25/9 28/8 28/7 29/8 28/9 30/7 29/7
2012 30/7 31/7 27/8 31/8 29/9 29/7 30/7 31/7 32/8 28/8 28/6 29/6
2013 31/6 29/7 29/7 31/6 28/5 29/5 30/5 31/5 28/6 28/6 32/4 32/4
2014 31/5 29/5 30/5 30/5 30/5 27/6 30/6 28/4 28/6 29/4 29/4 32/4
2015 32/4 33/3 35/5 31/4

14 |
NF
IB S
mal
l B
usin
ess
Eco
nom
ic T
rend
s Q
uart
erly
Rep
ort
SMALL BUSINESS CREDIT CONDITIONS (CONTINUED)
RELATIVE INTEREST RATE PAID BY REGULAR BORROWERS*
Net Percent (“Higher” Minus “Lower”) Compared to Three Months Ago
*Borrowing at Least Once Every Three Months.
ACTUAL INTEREST RATE PAID ON SHORT-TERM LOANS BY BORROWERS
Average Interest Rate Paid
SMALL BUSINESS INVENTORIES
INVENTORIES
Actual (Last Three Months) and Planned (Next Three Months)January Quarter 1974 to April Quarter 2015
(Seasonally Adjusted)
Jan Feb Mar Apr May Jun Jul Aug Sep Oct Nov Dec
2010 6 6 9 5 4 0 2 3 1 1 0 1
2011 3 6 5 5 3 0 0 1 1 -2 -1 -3
2012 1 2 3 0 -1 -5 -3 -2 0 -1 2 -2
2013 0 2 3 1 -1 -3 1 3 3 1 3 2
2014 5 5 5 3 1 -1 0 2 2 -1 1 -2
2015 3 2 4 2
Jan Feb Mar Apr May Jun Jul Aug Sep Oct Nov Dec
2010 6.3 6.0 6.8 6.4 6.5 6.0 6.3 6.3 6.2 6.0 5.7 6.2
2011 6.0 6.0 5.9 6.5 6.0 6.0 5.9 6.1 6.1 6.2 5.7 6.2
2012 6.0 5.8 5.7 5.7 5.5 6.3 5.7 5.7 5.7 5.8 5.7 5.6
2013 5.5 5.3 5.4 5.6 5.7 5.2 5.6 5.4 5.8 5.4 5.4 5.6
2014 5.6 5.4 5.3 5.4 5.7 5.7 5.6 5.3 5.4 5.5 5.6 5.1
2015 5.3 5.1 5.7 5.0
-30
-25-20
-15
-10
-5
0
5
1015
74 76 78 80 82 84 86 88 90 92 94 96 98 00 02 04 06 08 10 12 14
Actual
Planned
Net
Per
cent
YEAR

15 |
NF
IB S
mal
l B
usin
ess
Eco
nom
ic T
rend
s Q
uart
erly
Rep
ort
SMALL BUSINESS INVENTORIES (CONTINUED)
ACTUAL INVENTORY CHANGES
Net Percent (“Increase” Minus “Decrease”) During Last Three Months(Seasonally Adjusted)
INVENTORY SATISFACTION
Net Percent (“Too Low” Minus “Too Large”) at Present Time(Seasonally Adjusted)
INVENTORY PLANS
Net Percent (“Increase” Minus “Decrease”) in the Next Three to Six Months(Seasonally Adjusted)
Jan Feb Mar Apr May Jun Jul Aug Sep Oct Nov Dec
2010 -21 -18 -18 -18 -20 -21 -19 -15 -14 -16 -15 -13
2011 -10 -8 -7 -9 -13 -14 -13 -9 -11 -10 -10 -10
2012 -7 0 -9 -8 -8 -7 -10 -7 -8 -8 -10 -10
2013 -7 -9 -6 -6 -7 -7 -10 -5 -7 -6 -7 -4
2014 -4 -2 -6 -6 -4 -4 -3 -2 -7 -1 1 0
2015 2 2 -4 -1
Jan Feb Mar Apr May Jun Jul Aug Sep Oct Nov Dec
2010 -4 -7 -7 -2 2 -3 -4 -7 -3 -4 0 -3
2011 -1 -2 1 -1 -3 -3 -3 -5 -2 0 0 2
2012 -3 2 0 0 2 0 -1 -1 -1 -1 -5 -4
2013 -7 -1 -5 0 3 -1 -1 -2 -2 -1 0 -2
2014 -3 -5 1 3 1 -1 0 1 2 3 2 5
2015 2 4 1 4
Jan Feb Mar Apr May Jun Jul Aug Sep Oct Nov Dec
2010 -1 -1 -1 1 0 -1 0 -1 -2 1 -3 -3
2011 0 2 -1 1 -1 -1 0 1 -1 0 -1 0
2012 1 2 3 0 0 0 0 0 -1 0 -2 0
2013 -1 1 -1 -1 1 -2 -1 0 0 -5 -4 -5
2014 -2 -4 0 -1 -2 -2 -3 -2 0 -3 -3 -3
2015 -1 -2 -5 -1
16 |
NF
IB S
mal
l B
usin
ess
Eco
nom
ic T
rend
s Q
uart
erly
Rep
ort
SMALL BUSINESS CAPITAL OUTLAYS
CAPITAL EXPENDITURES
Actual Last Six Months and Planned Next Three MonthsJanuary Quarter 1974 to April Quarter 2015
(Seasonally Adjusted)
ACTUAL CAPITAL EXPENDITURES
Percent Making a Capital Expenditure During the Last Six Months
INVENTORY SATISFACTION AND INVENTORY PLANS
Net Percent (“Too Low” Minus “Too Large”) at Present TimeNet Percent Planning to Add Inventories in the Next Three to Six Months
(Seasonally Adjusted)
-15
-10
-5
0
5
10
15
74 76 78 80 82 84 86 88 90 92 94 96 98 00 02 04 06 08 10 12 14
SatisfactionPlans
Per
cent
YEAR
0
20
40
60
80
74 76 78 80 82 84 86 88 90 92 94 96 98 00 02 04 06 08 10 12 14
Perc
ent
YEAR
Actual
Plans
Jan Feb Mar Apr May Jun Jul Aug Sep Oct Nov Dec
2010 47 47 45 46 46 46 45 44 45 47 51 47
2011 51 49 51 50 50 50 50 52 50 52 53 56
2012 55 57 52 54 55 52 54 55 51 54 53 52
2013 55 56 57 56 57 56 54 53 55 57 55 64
2014 59 57 56 57 55 54 55 58 56 56 57 60
2015 59 60 58 60

17 |
NF
IB S
mal
l B
usin
ess
Eco
nom
ic T
rend
s Q
uart
erly
Rep
ort
SMALL BUSINESS CAPITAL OUTLAYS (CONTINUED)
AMOUNT OF CAPITAL EXPENDITURES MADE
Percent Distribution of Per Firm ExpendituresDuring the Last Six Months
CAPITAL EXPENDITURE PLANS
Percent Planning a Capital Expenditure During Next Three to Six Months
TYPE OF CAPITAL EXPENDITURES MADE
Percent Purchasing or Leasing During Last Six Months
Amount Current One Year Ago Two Years Ago
$1 to $999 4 4 4
$1,000 to $4,999 8 8 9
$5,000 to $9,999 5 7 6
$10,000 to $49,999 19 18 19
$50,000 to $99,999 10 7 7
$100,000 + 13 12 10
No Answer 1 1 1
Type Current One Year Ago Two Years Ago
Vehicles 25 23 22
Equipment 44 40 39
Furniture or Fixtures 12 14 12
Add. Bldgs. or Land 5 6 6
Improved Bldgs. or Land 13 13 14
Jan Feb Mar Apr May Jun Jul Aug Sep Oct Nov Dec
2010 20 20 19 19 20 19 18 16 19 18 20 21
2011 22 22 24 21 20 21 20 21 20 21 24 24
2012 24 23 22 25 24 21 21 24 21 22 19 20
2013 21 25 25 23 23 23 23 24 25 23 24 26
2014 24 25 24 25 24 22 23 27 22 26 25 29
2015 26 26 24 26

18 |
NF
IB S
mal
l B
usin
ess
Eco
nom
ic T
rend
s Q
uart
erly
Rep
ort
SINGLE MOST IMPORTANT PROBLEM
SINGLE MOST IMPORTANT PROBLEM
April 2015
SELECTED SINGLE MOST IMPORTANT PROBLEM
Insurance, Big Business Competition, Inflation, and RegulationJanuary Quarter 1974 to April Quarter 2015
SELECTED SINGLE MOST IMPORTANT PROBLEM
Sales, Fin. & Interest Rates, Labor Cost, Labor Quality, and TaxesJanuary Quarter 1974 to April Quarter 2015
Problem Current One
Year AgoSurvey
High Survey
Low
Taxes 22 23 32 8
Inflation 3 5 41 0
Poor Sales 11 16 33 2
Fin. & Interest Rates 2 2 37 2
Cost of Labor 6 4 9 2
Govt. Reqs. & Red Tape 23 21 27 4
Comp. From Large Bus. 7 8 14 4
Quality of Labor 12 7 23 3
Cost/Avail. of Insurance 8 8 29 4
Other 6 6 31 2
0
10
20
30
40
74 76 78 80 82 84 86 88 90 92 94 96 98 00 02 04 06 08 10 12 14
Big Business Insurance
Inflation Regulation
Per
cent
of F
irms
YEAR
0
10
20
30
40
74 76 78 80 82 84 86 88 90 92 94 96 98 00 02 04 06 08 10 12 14
Taxes Sales
Interest Rates Labor Quality
Per
cent
of F
irms
YEAR

19 |
NF
IB S
mal
l B
usin
ess
Eco
nom
ic T
rend
s Q
uart
erly
Rep
ort
SURVEY PROFILE
OWNER/MEMBERS PARTICIPATING IN ECONOMIC SURVEY NFIB
Actual Number of Firms
NFIB OWNER/MEMBERS PARTICIPATING IN ECONOMIC SURVEY
Industry of Small Business
NFIB OWNER/MEMBERS PARTICIPATING IN ECONOMIC SURVEY
Number of Full and Part-Time Employees
0
5
10
15
20
25
Per
cent
Jan Feb Mar Apr May Jun Jul Aug Sep Oct Nov Dec
2010 2114 799 948 2176 823 804 2029 874 849 1910 807 804
2011 2144 774 811 1985 733 766 1817 926 729 2077 781 735
2012 2155 819 757 1817 681 740 1803 736 691 2029 733 648
2013 2033 870 759 1873 715 662 1615 782 773 1940 762 635
2014 1864 792 685 1699 678 672 1645 598 608 1502 615 568
2015 1663 716 575 1500
0
5
10
15
20
25
30
Per
cent
20 |
NF
IB S
mal
l B
usin
ess
Eco
nom
ic T
rend
s Q
uart
erly
Rep
ort
NFIB RESEARCH FOUNDATION SMALLBUSINESS ECONOMIC SURVEY
SMALL BUSINESS SURVEY QUESTIONS PAGE IN REPORT
Do you think the next three months will be a good time
for small business to expand substantially? Why? . . . . . . . . . . . . . . . 4
About the economy in general, do you think that six
months from now general business conditions will be
better than they are now, about the same, or worse? . . . . . . . . . . . . 5
Were your net earnings or “income” (after taxes) from your
business during the last calendar quarter higher, lower, or
about the same as they were for the quarter before?. . . . . . . . . . . . . 6
If higher or lower, what is the most important reason?. . . . . . . . . . . . 6
During the last calendar quarter, was your dollar sales
volume higher, lower, or about the same as it was for
the quarter before?. . . . . . . . . . . . . . . . . . . . . . . . . . . . . . . . . . . . 7
Overall, what do you expect to happen to real volume
(number of units) of goods and/or services that you will
sell during the next three months?. . . . . . . . . . . . . . . . . . . . . . . . . 7
How are your average selling prices compared to
three months ago?. . . . . . . . . . . . . . . . . . . . . . . . . . . . . . . . . . . . 8
In the next three months, do you plan to change the
average selling prices of your goods and/or services? . . . . . . . . . . . . 8
During the last three months, did the total number of employees
in your firm increase, decrease, or stay about the same?. . . . . . . . . . 9
If you have filled or attempted to fill any job openings
in the past three months, how many qualified applicants
were there for the position(s)?. . . . . . . . . . . . . . . . . . . . . . . . . . . . 9
Do you have any job openings that you are not able
to fill right now?. . . . . . . . . . . . . . . . . . . . . . . . . . . . . . . . . . . . . 10
In the next three months, do you expect to increase or
decrease the total number of people working for you? . . . . . . . . . . . 10
Over the past three months, did you change the average
employee compensation?. . . . . . . . . . . . . . . . . . . . . . . . . . . . . . . 11
Do you plan to change average employee compensation
during the next three months?. . . . . . . . . . . . . . . . . . . . . . . . . . . 11

21 |
NF
IB S
mal
l B
usin
ess
Eco
nom
ic T
rend
s M
onth
ly R
epor
t
SMALL BUSINESS SURVEY QUESTIONS PAGE IN REPORT
Are…loans easier or harder to get than they werethree months ago? . . . . . . . . . . . . . . . . . . . . . . . . . . . . . . . . . . . . . . . 12
During the last three months, was your firm able tosatisfy its borrowing needs? . . . . . . . . . . . . . . . . . . . . . . . . . . . . . . . 13
Do you expect to find it easier or harder to obtain yourrequired financing during the next three months? . . . . . . . . . . . . . 13
If you borrow money regularly (at least once every threemonths) as part of your business activity, how does therate of interest payable on your most recent loan comparewith that paid three months ago? . . . . . . . . . . . . . . . . . . . . . . . . . . . 14
If you borrowed within the last three months for businesspurposes, and the loan maturity (pay back period) was 1year or less, what interest rate did you pay? . . . . . . . . . . . . . . . . . . 14
During the last three months, did you increase or decreaseyour inventories? . . . . . . . . . . . . . . . . . . . . . . . . . . . . . . . . . . . . . . . . . 15
At the present time, do you feel your inventories are toolarge, about right, or inadequate? . . . . . . . . . . . . . . . . . . . . . . . . . . 15
Looking ahead to the next three months to six months,do you expect, on balance, to add to your inventories,keep them about the same, or decrease them? . . . . . . . . . . . . . . . 15
During the last six months, has your firm made any capitalexpenditures to improve or purchase equipment, buildings,or land? . . . . . . . . . . . . . . . . . . . . . . . . . . . . . . . . . . . . . . . . . . . . . . . 16
If [your firm made any capital expenditures], what wasthe total cost of all these projects? . . . . . . . . . . . . . . . . . . . . . . . . 17
Looking ahead to the next three to six months, do youexpect to make any capital expenditures for plantand/or physical equipment? . . . . . . . . . . . . . . . . . . . . . . . . . . . . . . 17
What is the single most important problem facing yourbusiness today? . . . . . . . . . . . . . . . . . . . . . . . . . . . . . . . . . . . . . . . . 18
Please classify your major business activity, using oneof the categories of example below . . . . . . . . . . . . . . . . . . . . . . . . 19
How many employees do you have full and part-time,including yourself? . . . . . . . . . . . . . . . . . . . . . . . . . . . . . . . . . . . . . 19