Net Zero Review - GOV.UK
105
Net Zero Review: Interim report December 2020
Transcript of Net Zero Review - GOV.UK

Net Zero Review: Interim report
December 2020


Net Zero Review: Interim report
December 2020

© Crown copyright 2018
This publication is licensed under the terms of the Open Government Licence v3.0 except
where otherwise stated. To view this licence, visit nationalarchives.gov.uk/doc/open-
government-licence/version/3 or write to the Information Policy Team, The National
Archives, Kew, London TW9 4DU, or email: [email protected].
Where we have identified any third party copyright information you will need to obtain
permission from the copyright holders concerned.
This publication is available at www.gov.uk/government/publications
Any enquiries regarding this publication should be sent to us at
ISBN 978-1-911375-XX-X PUXXXX

1
Contents
Executive summary 2
Chapter 1 The net zero challenge 7
Chapter 2 The economy and net zero 19
Chapter 3 Estimating the costs of the transition 33
Chapter 4 Market failures and policy choices 45
Chapter 5 Innovation and private finance 51
Chapter 6 International competitiveness and net zero 62
Chapter 7 Households and net zero 69
Annex A Net Zero Review terms of reference 83
Annex B Market failures and climate change 85
Annex C Processing of personal data 95

2
Executive summary
Reaching net zero is essential for long term prosperity Climate change is an existential threat to humanity. Without global action to limit
greenhouse gas emissions, the climate will change catastrophically with almost
unimaginable consequences for societies across the world. In recognition of the risks
to the UK and other countries, the UK became, in 2019, the first major economy to
implement a legally binding net zero target.
The UK has made significant progress in decarbonising its economy but needs to go
much further to achieve net zero. This will be a collective effort, requiring changes
from households, businesses and government. It will require substantial investment
and significant changes to how people live their lives.
This transformation will also create opportunities for the UK economy. New
industries and jobs will emerge as existing sectors decarbonise or give way to low-
carbon equivalents. The Ten Point Plan for a Green Industrial Revolution and Energy
White Paper start to set out how the UK can make the most of these opportunities,
with new investment in sectors like offshore wind and hydrogen.1 The transition will
also have distributional and competitiveness impacts that the government will need
to consider as it designs policy.
In recognition of these challenges, the Climate Change Committee (CCC), in its
advice on the net zero target, noted that “if policies are not sufficiently funded or
their costs are seen as unfair, then they will fail” and recommended that the
Treasury undertake a review to consider:
“how the costs of achieving net zero emissions are distributed and the
benefits returned… the fiscal impacts, risks of competitiveness effects and
the impacts of decarbonisation across the whole economy”; and
“the full range of policy levers, including carbon pricing, taxes, financial
incentives, public spending, regulation and information provision.”2
The Treasury accepted this recommendation and published the terms of reference
for the Net Zero Review in November 2019. This interim report and the final report
1 ‘The Ten Point Plan for a Green Industrial Revolution’, HM Government, November 2020; ‘Energy White Paper: Powering our Net
Zero Future’, HM Government, December 2020.
2 ‘Net Zero: The UK’s contribution to stopping global warming’, Climate Change Committee, May 2019, p196.

3
that follows will sit alongside a comprehensive Net Zero Strategy next year, as well
as sectoral decarbonisation strategies. They will form part of a government-wide
effort to achieve net zero, address wider environmental issues and make the most of
growth and employment opportunities.
The interim report This interim report sets out the analysis so far and seeks feedback ahead of the final
report. This section presents a summary of the findings.
1. The combined effect of UK and global climate action on UK economic growth is likely to be relatively small. The scale, distribution and balance of new growth opportunities and challenges will depend on how the economy and policy respond to the changes required.
The transition to net zero will create new opportunities for economic growth and
job creation across the country. The demand for low-carbon goods and services will
encourage new industries to emerge, with the potential to boost investment levels
and productivity growth. Moving decisively in areas of comparative advantage could
generate export opportunities and establish the UK as global leader across the low-
carbon economy. Co-benefits from decarbonisation, such as improved air quality,
can also be economically significant. However, reaching net zero will also involve
costs and lead to significant structural change.
Overall, in the context of the rest of the world decarbonising, the net impact of the
transition on growth to 2050 is likely to be small compared to total growth over
that period, and it could be slightly positive or slightly negative. Policies like those in
the government’s Ten Point Plan have a role in ensuring the UK is able to make the
most of the potential opportunities.
Regardless of the size or direction of the impact on the economy, the transition will
lead to structural changes. Employment opportunities in green industries will
emerge, while high-carbon sectors will have to adapt or decline. Some of these
effects will be regionally concentrated. New green jobs are already appearing in
sectors such as offshore wind, with growth and opportunities centred around
regional clusters in the Humber and East Anglia. The net impact of the transition on
local labour markets will depend on the costs of decarbonising for individual firms
and the flexibility of the labour market to match vacancies with the necessary skills.
This means that, though the macroeconomic impact might be small, there could be
significant distributional implications. Government policy will need to continue to
respond to this, ensuring levelling up across the country.
Structural changes in the economy will also have implications for fiscal policy.
Revenues from taxes on the consumption of fossil fuels and from emissions-intensive
industries will decline during the transition, for example, as petrol cars are replaced
by electric vehicles. Over time the government will need to consider how to offset
these lost tax revenues – whether through adjustments to other taxes or reductions
in government spending – so that the UK can reach net zero while maintaining the
long-term health of the public finances.

4
2. The costs of the transition to net zero are uncertain and depend on policy choices.
The amount of investment required to reach net zero and the consequential impacts
on operating costs are difficult to estimate. They are affected by a range of factors,
including the precise path of the transition, changes in behaviour and the rate at
which technology costs fall and efficiency gains are made, all of which are subject to
significant uncertainty.
3. Government needs to use a mix of policy levers to address multiple market failures and support decarbonisation
In choosing the best way to support the transition, government policy should seek
to target market failures directly where possible, subject to distributional and
international competitiveness impacts. The most important market failure to address
is the negative externality associated with the emission of greenhouse gases, but
there are many others holding back the transition to net zero, including inertia and
lack of information. The market failures interact in complex ways within and across
sectors.
Carbon pricing is an important lever in addressing the negative externality problem
but should be supplemented by other policies in order to achieve an equitable
balance of contributions from households, businesses and taxpayers. The
government has announced it will introduce a domestic emissions trading scheme
covering heavy industry, power generation and aviation after the UK leaves the EU.
4. Well-designed policy can reduce costs and risk for investors, support innovation and the deployment of new technologies.
The development of technology will be important for meeting the net zero target,
keeping costs down and maximising the potential economic benefits. Much of the
finance required can come from the private sector, but the risks and uncertainties
associated with novel technologies can hold this back. A clear policy framework
setting out the government’s approach at different levels of technological
development can help address these uncertainties. Where uncertainty is at its
greatest, government may need to provide more direct support.
The government’s Ten Point Plan announced support for some of these emerging
technologies, including an extra £200 million for two new carbon capture clusters
by the mid-2020s, with another two for the 2030s and up to £500 million for
trialling the use of hydrogen for domestic heating and cooking, starting with a
Hydrogen Neighbourhood in 2023.
5. The risk of carbon leakage will increase with efforts to reduce emissions.
The transition to net zero will have implications for the competitiveness of the UK
economy. Some sectors will enjoy new export opportunities, but others could
become less competitive if other countries follow different decarbonisation paths.
These changes could lead to carbon leakage where policies achieve their goal of
lowering emissions in one jurisdiction but inadvertently increase emissions

5
elsewhere. The size of the risk depends on each sector’s costs of decarbonising, their
trade exposure and international policies.
There is little evidence to suggest that carbon leakage has been a significant factor
so far, but as the UK implements new policies to support this transition, the risk of
carbon leakage may increase. The government has a number of ways to seek to
mitigate this risk, including through its climate diplomacy and the design of policies
to support the transition.
Additionally, the UK will host the COP26 climate negotiations next year and take
over the G7 presidency. The UK is determined to use these opportunities to
encourage ambitious international climate action and reduce global emissions.
Collective action to reduce global emissions worldwide helps to reduce the risk of
carbon leakage globally. The government is also using domestic policies like the
£315 million Industrial Energy Transformation Fund to help sectors in the UK to
decarbonise.
6. Households are exposed to the transition through their consumption, labour market participation and asset holdings. Government needs to consider these patterns of exposure in designing policies for the transition.
Different types of household will have different levels of exposure to the transition.
For example, higher-income households consume more carbon in absolute terms,
but lower-income households tend to consume more carbon relative to their
income, and households in Northern Ireland tend to have larger carbon footprints
due to a higher prevalence of oil-heated housing.
Households are also exposed to the transition through the labour market, with
people in certain occupations (skilled trade, and process plant and machine workers)
more likely to work in more carbon-intensive industries. People in these occupations
are also disproportionately likely to have a lower level of education and to be lower-
income workers.
Analysis of households’ exposure to the transition does not show where the costs
will fall. This will depend on a range of factors, including the cost of decarbonising
each sector, the availability of alternative low-carbon products and the distribution
of new green jobs in the economy. However, government will need to be mindful of
these issues as they consider the best way to design policy to support the transition.
The government is already taking action with a £6.7 billion package of measures to
help the lowest paid with their energy bills and by providing support for the creation
of jobs in new green industries.
The final report The final report will be published in spring 2021. This will build on the analysis set
out in the interim report, including by looking at:
• Innovation and growth: How the government can reduce policy uncertainty
to encourage innovation, technological development and investment. It will

6
look at areas where the UK might have comparative advantage and
consider how to maximise the economic benefits.
• Competitiveness: The scope for addressing the risks of carbon leakage and
competitiveness that may arise from the transition to net zero.
• Household impacts: More detailed analysis of the implications for
households from the decarbonisation of transport, buildings and power
and options for managing any adverse impacts, as well as the trade-offs
the government may face.
• Embedding the findings: How HM Treasury could incorporate climate
considerations into spending reviews and fiscal events and how to embed
the principles of the Net Zero Review into policy making across
government.

7
Chapter 1
The net zero challenge
The UK has made significant progress towards decarbonising its economy over
the last 30 years and was one of 195 countries to sign the Paris Agreement in
2015. Consistent with this and on the advice of the Climate Change
Committee, the UK adopted a target of net zero greenhouse gas emissions by
2050.
The transition to net zero will lead to a more sustainable economy but implies
significant changes for households, businesses and government. HM
Treasury’s Net Zero Review will consider how these changes can be managed.
It will look at how to maximise the economic opportunities from the transition
to net zero, how the costs associated with the transition should be met and
how to ensure an equitable balance of costs and benefits across different
parts of society.
The Review sits alongside other work by the UK government and the devolved
administrations examining how best to decarbonise the economy and achieve
net zero.
Net zero is the “pro-growth strategy for the longer term” 1.1 In 2006, HM Treasury commissioned the Stern Review of the Economics of
Climate Change. This estimated the overall costs and risks of global warming to be
equivalent to losing between 5 and 20% of global GDP each year. Action to reduce
greenhouse gas emissions reduces this risk, with the costs of action necessary to
stabilise greenhouse gases concentrations in the atmosphere at 500 to 550 parts per
million estimated to be between 1 and 2% of global GDP. Stern concluded that
“tackling climate change is the pro-growth strategy for the longer term, and it can
be done in a way that does not cap the aspirations for growth”.1
1.2 The Climate Change Act 2008 established the independent Climate Change
Committee (CCC) to recommend emissions reduction targets for the UK (known as
carbon budgets) and to evaluate progress towards meeting them. The initial goal set
1 ‘Stern Review: The Economics of Climate Change’, HM Treasury, October 2006; the data for the cost of action was revised from
1% in the original report, to 2% in 2008.

8
in the Act was to reduce emissions by 80% compared to 1990 levels by 2050,2 in
line with advice at the time from the CCC.3
1.3 Although the UK has made significant progress in reducing greenhouse gas
emissions since 1990, global atmospheric concentrations of greenhouse gases have
continued to rise (Chart 1.A) with consequential implications for the climate. The
average temperature in the UK between 2008 and 2017 was 0.8°C higher than in
the period from 1961 to 1990. The UK is seeing wetter winters and drier summers
and has experienced several extreme weather events in recent decades. These
include significant flood events in England in the winters of 2013 to 2014 and 2015
to 2016 and the joint hottest summer on record in 2018, with temperatures
equalling the summers of 2006, 2003 and 1976. There are 240,000 homes and
properties currently in high flood risk areas, and if shoreline management plans are
not implemented, 5,000 properties could be affected by coastal erosion over the
next 20 years as sea levels rise and more wave energy reaches the coast.4
Chart 1.A: Atmospheric concentration of selected greenhouse gases
Source: European Environment Agency.
1.4 In recognition of the risks to the UK and globally, the UK was one of 195
countries to sign the Paris Agreement in 2015, committing to hold the increase in
the global average temperature to well below 2°C above pre-industrial levels and to
pursue efforts to limit the temperature increase to 1.5°C.5 It is implicit in this target
that global greenhouse gas emissions should reach net zero in the second half of
this century.6
1.5 Following the Paris Agreement, the UK, Scottish and Welsh governments
asked the CCC for advice on when it would be feasible to reach net zero greenhouse
2 Climate Change Act 2008 as enacted.
3 ‘Interim advice by the Climate Change Committee’, Climate Change Committee (CCC), October 2008.
4 ‘Climate change impacts and adaptation report’, Environment Agency, November 2018.
5 ‘Paris Agreement’, United Nations, 2015, article 2.
6 Ibid, article 4.1.
0
50
100
150
200
250
300
1750 1800 1850 1900 1950 2000
Index (1750=100)
Carbon dioxide Methane Nitrous oxide

9
gas emissions.7 In May 2019, the CCC published its recommendation that the UK
should reach net zero by 2050, with individual targets for Scotland and Wales.8
Later that year, the UK became the first major economy to implement a legally-
binding net zero target.9
1.6 The net zero target requires that by 2050 any greenhouse gas emissions
produced within the UK must be reduced as far as possible and any residual
emissions must be offset, for example by increasing natural carbon sinks such as
forests or using technology like carbon capture and storage.10
1.7 The target is focused on the flow of emissions into the atmosphere and
applies to tonnes of CO2-equivalent (tCO2e). This measure aggregates emissions of
different greenhouse gases based on their global warming potential relative to
carbon dioxide.11
1.8 The target covers emissions that take place on UK territory. It does not
include the emissions embedded in goods and services that the UK imports: under
internationally agreed frameworks for emissions accounting, established under the
1990 UN Framework Convention on Climate Change, these are the responsibility of
the country of origin. The target therefore focuses decarbonisation efforts on the
emissions over which the UK government and devolved administrations have most
influence and which they are best able to measure.
The UK has made good progress since 1990, but has a long way to go to reach net zero 1.9 Between 1990 and 2019, the UK reduced its greenhouse gas emissions by
43%, compared to just 5% for the G7 as a whole (Chart 1.B). At the same time, the
UK economy grew by almost 80%.12 The rate of reduction in the carbon intensity of
the UK economy since 2000 has also been the fastest in the G20.13
1.10 This progress so far has been led by the power sector (Chart 1.C), where
emissions have fallen by over 70% since 1990, largely through reducing the role of
coal in electricity generation and increasing the role of renewables. Industrial
emissions have also fallen significantly, by more than 50% over the same period.
This represents emissions reductions across all parts of industry, manufacturing,
construction and fossil fuel supply. In the manufacturing sector, CO2 emissions fell
by 25% between 2009 and 2017. These falls reflect a combination of reduced
energy intensity, a shift to less carbon-intensive energy sources and changes in the
structure of the manufacturing sector.
7 ‘UK climate targets: letter to the Climate Change Committee (CCC) – 15 October 2018’, Department for Business, Energy &
Industrial Strategy (BEIS), Welsh Government and Scottish Government, October 2018. Northern Ireland does not currently have
its own climate change legislation or emissions targets, but emissions from Northern Ireland are still covered by the wider UK
target.
8 ‘Net Zero: The UK’s contribution to stopping global warming’, CCC, May 2019.
9 ‘UK becomes first major economy to pass net zero emissions law’, BEIS, June 2019; Climate Change Act 2008 (2050 Target
Amendment) Order 2019.
10 Climate Change Act 2008; ‘UK becomes first major economy to pass net zero emissions law’, BEIS, June 2019.
11 ‘Annual statement of emissions for 2018’, BEIS, 2020, p.5.
12 ‘Greenhouse gas emissions: Total emissions including LULUCF’, OECD.Stat, 2020; GDP: ‘World Economic Outlook Database’
International Monetary Fund, April 2020.
13 ‘The Low Carbon Economy Index 2019’, PwC, 2019.

10
Chart 1.B: UK emissions reductions and economic growth since 1990
Source: Organisation for Economic Cooperation and Development, International Monetary Fund.
1.11 Other sectors have not decarbonised to the same extent, though there have
been some successes. Waste policy reforms and emissions savings from fluorinated
gases used in refrigeration and air conditioning equipment have driven down
emissions in those sectors.14 Elsewhere, emissions from agriculture, land use and
land use change have been broadly flat since 2008. In the transport sector,
emissions have remained relatively flat as increasingly efficient road vehicles have
been offset by increased traffic levels. Emissions from international aviation and
shipping have increased by nearly 90%, entirely due to aviation.
1.12 Emissions associated with the UK’s consumption are higher than territorial
emissions. Chart 1.D shows that there has been a gap between UK emissions
measured on a territorial basis and on a consumption basis since the mid-1980s. UK
consumption-based CO2 emissions peaked in 2007, at which point the UK’s
territorial CO2 emissions were 37% lower than the consumption-based measure.
Since 2008, both measures have declined.15
1.13 For any country, the gap between consumption and territorial emissions will
reflect the country’s trade patterns and industrial structure. For some countries the
gap will be positive, and for others it will be negative, in the same way that some
countries run a trade deficit and others a surplus. Chart 1.E shows the balance of
imported and exported emissions for a selection of large economies. Countries with
a positive balance are net exporters of emissions and those with a negative balance,
like the UK, are net importers of emissions.
14 This report will predominately, though not exclusively, refer to ‘sectors’ as the groupings used by the CCC to sub-divide the
economy. These sector groupings are more meaningful for understanding decarbonisation but are different and not comparable
to the Standard Industrial Classifications (SIC code) that routinely used in other economic analysis.
15 ‘The decoupling of economic growth from carbon emissions: UK evidence’, Office for National Statistics (ONS), October 2019.
0
20
40
60
80
100
120
140
160
180
200
1990 1995 2000 2005 2010 2015 2020
1990=100
G7 greenhouse gas emissions UK greenhouse gas emissions
G7 GDP UK GDP

11
1.14 In the UK, the services sector now represents around 79% of Gross Value
Added,16 and emissions-intensive industries around 2%.17 This means that the UK
exports relatively few emissions compared to other countries, explaining much of
the gap between territorial and consumption-based emissions. It also means that
the UK economy is relatively less exposed to the risk of losing competitiveness
internationally as the government moves to decarbonise the economy. Nevertheless,
some sectors will face a risk of losing competitiveness. This means that the UK‘s
efforts to work with international partners to secure collective international
agreement to reduce emissions globally are essential.
Chart 1.C: UK emissions by sector
Source: ‘Reducing UK emissions: 2020 Progress Report to Parliament’, CCC, May 2019; Final UK greenhouse gas emissions national statistics 1990-2018.
1.15 The effort to reach net zero will require innovation to reduce the costs of
existing net zero-consistent technologies and to ensure that any new technologies
are fully developed and commercially viable. While the innovation process needs to
happen rapidly, such a transition is possible and advances in digital technology over
the last 30 years highlight the potential for innovation over a similar time period.
1.16 Increasing awareness and understanding of how the impacts and
implications of the net zero target will affect the public is also crucial. In June 2020,
63% of the public said they were aware of net zero in some way but only 4% said
they knew a lot about it. As the measures to reach net zero will require much
greater public involvement and affect the public to a far greater extent than
16 ‘GDP output approach – low-level aggregates’, ONS, November 2020.
17 ‘Electricity Intensive Industries: Relief from the Indirect Costs of Renewable Energy Schemes’, BEIS, September 2018. This figure
refers to industries covered by EU free allowances, the UK Carbon Price Support Mechanism, as well as the Renewable Obligation,
Feed in Tariff and Contracts for Difference schemes. This differs from the official BEIS definition that covers all of manufacturing
group C SIC, including mining and quarrying.
0
50
100
150
200
250
1990 1995 2000 2005 2010 2015
MtCO2e
Power Industry
Buildings Transport (excl. IAS)
International Aviation and Shipping (IAS) Agriculture, land use and land-use change
Waste F-gases

12
previous decarbonisation activities, ensuring greater access to information will be
essential to reaching the target.18
Chart 1.D: Different measures of UK CO2 emissions
Source: Office for National Statistics (ONS).
Chart 1.E: UK imported emissions compared to other major economiesa
Source: ONS. a A positive number indicates a net exporter of emissions: consumption emissions are less than territorial emissions. A
negative number indicates a net importer of emissions: consumption emissions are greater than territorial emissions.
18 ‘BEIS Public Attitudes Tracker (June 2020, Wave 34, UK)’, BEIS, August 2020.
300
400
500
600
700
800
900
1970 1980 1990 2000 2010
MtCO2
Consumption-based emissions Territorial-based emissions
-1,500
-1,000
-500
0
500
1,000
1,500
2,000
2,500
1992 1997 2002 2007 2012 2017
MtCO2
China India Japan Russia UK USA

13
The Net Zero Review will support the transition to net zero 1.17 Alongside its recommendation that the UK adopt a net zero emissions
target, the CCC recommended that HM Treasury do further work to examine how
the costs of the transition should be funded and where the costs will fall, saying:
“If policies are not sufficiently funded or their costs are seen as
unfair, then they will fail. HM Treasury should undertake a review of
how the transition will be funded and where the costs will fall. The
review should cover the use of fiscal levers and Exchequer revenue
costs from carbon trading schemes, the impact on energy bill-payers
and motorists, and the costs to industries especially where they are
carbon-intensive and trade-exposed. It should cover costs from now
through to 2050”.19
1.18 HM Treasury accepted the CCC’s recommendation to undertake this review.
In doing so, HM Treasury intends to create additional clarity about how
governments might approach decisions in the transition and seek to ensure an
equitable balance of costs and benefits across different parts of society.
Scope of the Review 1.19 HM Treasury published the Terms of Reference for the Review in November
2019 (see Annex A). It will look at how government policy can support technological
development and deployment to maximise the potential growth opportunities from
net zero. It will analyse the distributional and competitiveness impacts of the
transition to net zero and considerations for determining the appropriate balance of
policy levers.
1.20 Some of these levers are the responsibility of the devolved administrations,
and net zero will only be achieved through a combination of reserved and devolved
policies, building on initiatives already in place across the UK. The Review considers
the role of the UK government, acknowledging the specific distributional challenges
and opportunities across the UK.
1.21 This interim document sets out initial analysis and considerations:
• Chapter 2 sets out HM Treasury’s assessment of the macroeconomic
impacts of the transition, the structural changes it entails and implications
for fiscal policy;
• Chapter 3 considers the investment and costs that will be required in order
to reach net zero;
• Chapter 4 looks at how different policy levers can best address the market
failures causing climate change and holding back the transition;
• Chapter 5 considers the role of technology and innovation in maximising
the benefits of move to net zero;
19 ‘Net Zero: The UK’s contribution to stopping global warming’, CCC, May 2019, p33.

14
• Chapter 6 sets out HM Treasury’s assessment of potential impacts on
business from the transition and the potential impacts on carbon leakage;
and
• Chapter 7 considers how these impacts could affect households.
The report sits alongside action across the government 1.22 This review is just one part of the UK government’s work on the transition to
net zero and to address wider environmental issues. This work includes the
government’s Ten Point Plan for a Green Industrial Revolution,20 the development of
ambitious sectoral strategies such as the recent Energy White Paper21 and the
publication of a comprehensive Net Zero Strategy that will set out the government’s
vision for the transition and how it intends to make the most of the growth and
employment opportunities (see Box 1.A).
1.23 In addition, the UK will host the COP2622 climate negotiations next year and
take over the G7 presidency. The UK is determined to use these opportunities to
encourage ambitious global action and achieve the transformational international
change required by the Paris Agreement.
Box 1.A: Activity across the UK government
Green recovery: The UK is looking to build back better and greener as it
recovers from the economic impact of the COVID-19 pandemic. Budget 2020
announced:
• A £100 million scheme to help households and small businesses invest
in low-carbon heating systems;
• A consultation on a Green Gas Levy to increase biomethane production
for the gas grid;
• A Green Heat Networks scheme to encourage new and existing heat
networks to adopt low-carbon heat sources, backed by £270 million
funding.
July’s Plan for Jobs included a new £2 billion Green Homes Grant for
homeowners and landlords to upgrade the energy and cost efficiency of their
homes; a £1 billion Public Sector Decarbonisation Scheme to reduce
greenhouse gas emissions from public sector buildings and £50 million for a
demonstrator project to decarbonise social housing.
20 ‘The Ten Point Plan for a Green Industrial Revolution’, HM Government, November 2020.
21 ‘Energy White Paper: Powering our Net Zero Future’, HM Government, December 2020.
22 2021 United Nations Climate Change Conference, or 26th Conference of the Parties (COP26) to the United Nations Framework
Convention on Climate Change (UNFCCC).

15
The £191 million Sustainable Innovation Fund will help businesses across the
UK drive forward cutting-edge new tech and recover from the impacts of
coronavirus.
Setting Carbon Budget 6: Analytical work is on-going across government to
set the next carbon budget. This will cover emissions between 2033 and
2037. The CCC published its advice earlier this month, and the government
will respond by the end of June 2021.
Energy: Budget 2020 included a pledge to at least double funding for energy
innovation, as well as to bring forward the phase-out date for unabated coal
generation to 2025. The government has also committed to supporting the
development of one power Carbon Capture and Storage (CCS) plant by 2030
to reduce emissions from gas-fired power stations; £1.03 billion for the CCS
Infrastructure Fund to help establish four CCS clusters by 2030; and a £240
million Net Zero Hydrogen Fund to help develop up to 5GW of low-carbon
hydrogen capacity by 2030. Finally, the Energy White Paper addresses the
transformation of the entire energy system in the context of net zero, looking
across the power generation, networks, buildings, industry, energy markets
and oil and gas sectors.
Buildings: At Spending Review 2020 (SR20), the government allocated £1.13
billion in 2021/22 to decarbonise buildings in England and support the
creation of clean heat networks. (£1 billion for building efficiency, £122
million for Heat Networks).
The government’s Ten Point Plan also sets out an ambition to install 600,000
heat pumps by 2028 and included commitments to:
• implement the Future Home Standard in the shortest possible time;
• consult on non-domestic building standards;
• strengthen energy efficiency requirements for private sector landlords;
• create a market led incentive framework to drive growth; and
• bring forward regulations to support heat pump take up in off gas grid
properties.
The government will shortly publish a Heat and Buildings Strategy, which will
set out the immediate actions to reduce emissions from buildings, and the
programme of work required to enable important strategic decisions in the
first half of the 2020s on how to achieve mass transition to low-carbon
heating.
Industry: The government is planning an Industrial Decarbonisation Strategy
for spring 2021 and a Hydrogen Strategy to provide a framework for a
hydrogen economy in the UK.

16
Infrastructure: SR20 announced £100 billion of capital expenditure next year,
supported by a new National Infrastructure Strategy and the creation of a new
infrastructure bank to catalyse private investment in projects across the UK, as
well as a comprehensive set of reforms to the way infrastructure is delivered.
Transport: The Transport Decarbonisation Plan will set out for the first time
how the government will accelerate a holistic, cross-modal shift to greener
transport and drive more sustainable behaviours. The government has already
announced significant investment in low and zero carbon transport. At SR20,
the government confirmed almost £2.4 billion for transport decarbonisation,
including £1.9 billion for electric vehicle charging infrastructure and grants for
zero and ultra-low emission vehicles, and funding for active travel, zero
emission buses and a range of R&D programmes to help decarbonise aviation,
maritime and freight.
Agriculture, land use and land use-change: The upcoming England Tree
Strategy and England Peat Strategy will set out the medium-long term
strategy for securing greater carbon and wider natural capital benefits from
woodlands and peatlands through public and private finance and non-
spending measures. Budget 2020 announced £640 million for tree planting
and peatland restoration.
Greenhouse gas removal technologies: At the Summer Economic Update the
government announced £100 million for Direct Air Capture – a type of
greenhouse gas removal (GGR) technology. The government has also
published a call for evidence on GGR technologies in December 2020 and is
commissioning the National Infrastructure Commission to undertake a new
study on GGRs, to report in summer 2021.
Green finance can support the transition across all the sectors of the economy.
The government continues to work closely with the financial services sector to
implement the actions in the Green Finance Strategy. The government has
announced plans to achieve mandatory climate-related financial disclosures
and to implement a Green Taxonomy and its intention to issue a sovereign
green bond and follow up with a series of further issuances.23
Carbon pricing: After the UK leaves the EU Emissions Trading System (ETS),
the government will introduce a domestic UK ETS covering heavy industry,
power generation and aviation, with a cap on emissions that decreases over
time. Alongside this, the Carbon Price Support, an existing tax on fossil fuels
used in electricity generation, provides a top-up to the UK ETS, incentivising
investment in lower-carbon technology in the power sector.
1.24 Finally, alongside this work to address climate change, the 25-Year
Environment Plan sets out the government’s goals for improving the wider
environment, in line with the commitment to ensure this is the first generation to
23 ‘Green Finance Strategy’, HM Treasury and BEIS, July 2019.
17
leave the environment in a better place than it found it.24 The Dasgupta Review of
the Economics of Biodiversity, an independent review commissioned by HM
Treasury, looking at the interactions between the economy and nature and the
causes and implications of biodiversity loss (Box 1.B), will also be published next
year.
Box 1.B: Nature and climate change
Alongside climate change, biodiversity is declining faster than at any time in
history. This is severely eroding the natural world’s resilience.
The two problems are inextricably linked. Loss and degradation of nature from
human activity such as deforestation and poor soil management is
contributing to greenhouse gas emissions and reducing the scope for natural
sequestration of carbon from the atmosphere. Climate change in turn is
damaging the natural world and is expected to become the biggest driver of
biodiversity loss this century.
However, the ways to address climate change and biodiversity loss are also
linked. The conservation and restoration of natural habitats such as peatlands,
forests and coastal habitats can reduce greenhouse gas emissions, sequester
carbon, build resilience in ecosystems (which protects biodiversity and
provides benefits for society) and help people adapt to the impacts of
unavoidable climate change.
Careful policy design to address both problems is required to ensure
opportunities are maximised and to manage the trade-offs. For example, an
increase in mining to extract materials required for renewable energy
infrastructure could pose a significant threat to biodiversity, reducing the
overall benefits of decarbonisation to society. The Dasgupta Review, an
independent Review of the Economics of Biodiversity commissioned by HM
Treasury, is exploring how society can sustainably engage with nature to
support economic prosperity and wellbeing. It will propose solutions that both
benefit biodiversity and contribute to climate change mitigation and
adaptation.
Stakeholder feedback 1.25 To support the ongoing work of the review, HM Treasury would welcome
feedback on the issues raised in this report. The Net Zero Review team may request
more detail where appropriate. Please send responses by 23 January 2021 to:
1.26 The Net Zero Review will not publish the responses in full or in summary
form. However, as explained in the notice below, HM Treasury may be required to
disclose this information under the Freedom of Information Act 2000.
24 ‘A Green Future: Our 25 Year Plan to Improve the Environment’, Department for Environment, Food & Rural Affairs, January
2018.

18
1.27 Annex C sets out how your response will be treated and how any personal
data you provide that identifies you or third parties will be handled.

19
Chapter 2
The economy and net zero
Global action to mitigate climate change is essential to long term prosperity.
In the UK, the transition to net zero creates new opportunities for growth and
employment. The investment and demand for low-carbon goods and services
will encourage new industries to emerge, creating jobs across the country.
Further opportunities could come from new areas of innovation and
technology and changes in energy costs. Moving decisively in areas of
comparative advantage could generate new jobs and export opportunities and
establish the UK as a global leader across the low-carbon economy. The co-
benefits from adopting low-carbon technologies, such as improved air quality,
can also be economically significant.
Reaching new zero will also involve costs and lead to major structural changes
in the economy, as existing industries may have to adjust how they operate or
face decline. These impacts will be unevenly felt across different sectors,
regions and households, and some industries may face greater challenges
when adapting.
Policies like those in the government’s Ten Point Plan for a Green Industrial
Revolution help to ensure that the UK is able to make the most of the
opportunities presented by decarbonisation.1 An understanding of potential
impacts and an awareness of the lessons from previous major transitions will
also be vital when designing effective policies to ensure an equitable balance
of costs and benefits arising from the transition.
Global action to mitigate climate change is essential to long-term prosperity. 2.1 Global action on decarbonisation is essential to avoid the effects of
unmitigated climate change and to ensure that the global economy is sustainable in
the long term.
2.2 The assessment in this chapter suggests that, within the context of global
action, the transition in the UK may have only a small effect on long-run economic
growth, although the direction of the effect could be slightly positive or slightly
negative. To some extent, the UK has already decoupled economic growth from
1 ‘The Ten Point Plan for a Green Industrial Revolution’, HM Government, November 2020.

20
growth in emissions: between 1990 and 2019, the UK reduced its greenhouse gas
emissions by 43%, while the UK economy grew by almost 80%.2
2.3 While in aggregate the effect of the transition on long-run UK economic
growth may be relatively small, there could be significant structural changes to the
economy: along with digitalisation, decarbonisation will probably be among the
most important drivers of change in the UK economy to 2050. These structural
changes will mean some sectors will expand and others will shrink.
2.4 Low-carbon sectors could benefit from new domestic and global growth
opportunities, whereas more carbon-intensive sectors may face greater constraints
as a result of decarbonisation requirements across their global supply chains and
markets. Differences in policies across countries may influence growth opportunities
and the competitive pressures domestic firms face.
A qualitative approach allows macroeconomic assessments amid uncertainty about technology and policy 2.5 This chapter includes a qualitative assessment of the macroeconomic impacts
resulting from the transition to net zero. It considers the most important channels
through which the transition could affect the economy and the likely direction of
those impacts, drawing on the existing literature. A qualitative approach allows an
assessment of the impact of a generic set of policies. It also permits a rigorous
discussion of the potential impacts where factors such as technological development
and deployment are still uncertain.
2.6 Impacts are compared to a counterfactual in which the rest of the world
decarbonises, but the UK does not. This baseline enables an assessment of the
impacts on competitiveness and productivity and an assessment of how the
transition could alter the structure of the UK economy. This report does not seek to
compare the costs and benefits of the net zero transition to the costs of unmitigated
climate change, as UK action alone would be insufficient to address the problem.
2.7 This counterfactual differs slightly from that used by the Climate Change
Committee (CCC) in estimating the costs of the transition. The CCC assumes a
hypothetical baseline of no additional climate action nor climate damage and does
not take into account climate action taken by the rest of the world. Chapter 3
returns to this issue.
2.8 Some organisations have attempted quantitative modelling of the transition
to net zero, with a variety of baselines. Different models inevitably give slightly
different results, but these estimates suggest that decarbonisation will have a
modest overall macroeconomic impact. The European Commission analysis of a net
zero-equivalent scenario (1.5˚C global warming) indicates a small impact on
European GDP out to 2050, ranging from slightly negative to slightly positive (-
0.63%, +0.68% or +1.48% depending on the model choice).3 The analysis the CCC
commissioned to accompany their 2019 net zero recommendation similarly
2 Greenhouse gas emissions: Total emissions including LULUCF, OECD.Stat, 2020; GDP: ‘World Economic Outlook Database’
International Monetary Fund, April 2020.
3 ‘In-depth analysis in support on the COM(2018) 773: A Clean Planet for all – A European strategic long term vision for a
prosperous, modern, competitive and climate neutral economy’, European Commission, 2018.

21
suggested a moderate impact on the UK’s GDP in 2050 (-0.8% or +3.4% according
to model choice).4 To put these effects into context, the CCC’s advisory group on
costs and benefits said that, should the UK maintain its normal level of growth,
decarbonisation would simply mean “UK citizens would need to wait until half way
through September 2051 to reach the level of income they would otherwise have
achieved at the end of 2050.”’5 Box 2.A sets out some of the challenges of
quantitative modelling.
Box 2.A: Quantitative modelling approaches to net zero
Quantitative models could theoretically be used to estimate macro or indirect
effects of decarbonisation on the wider economy. There are three main
categories of model that could be used, all of which have limitations.
Computable General Equilibrium (CGE) models, such as the one used by the
Department for Business, Energy & Industrial Strategy (BEIS) during Carbon
Budget 5 and in part by the European Commission, can capture the impact of
carbon-cutting initiatives on firms and households. CGE models require
assumptions about technological improvements to be imposed on the model.
The outputs of any CGE modelling would reflect – and be highly sensitive to –
these assumptions (although this is not a unique risk to CGE models).
Energy-systems models such as the one used by the CCC to estimate the costs
of the transition discussed in Chapter 3 and BEIS’s UK TIMES model fully
depict the energy system and can estimate the costs needed to reach net zero
under given constraints. These models are neutral about economic policy and
have no direct link to wider economic variables. This makes them unsuitable
for analysing the impacts of important policies such as carbon pricing.
Finally, there are macro-econometric models such as the model used by the
Office for Budget Responsibility (OBR) in producing the UK’s official economy
forecasts. These models are best considered forecasting tools to enable
forecast judgements to be applied consistently across a very wide range of
macro-economic variables. The European Commission complemented its CGE
climate modelling using such a model. This type of model could produce
dynamic outputs over a long horizon, though the OBR’s model (which is
shared and co-developed with HM Treasury) currently only covers the
immediate 5 to 6-year period needed for Budget forecasts. These models
typically have no climate-specific variables and are unable to distinguish
between low-carbon and high-carbon technology.
4 Report to the Climate Change Committee (CCC) of the Advisory Group on costs and benefits of net zero’, CCC, 2019. More recent
analysis is also mixed for example positive GDP effects see 'Economic impact of the sixth carbon budget', Cambridge Econometrics,
2020, while for more negative GDP effects see 'Macroeconomic responses consistent with the NGFS scenarios' National Institute of
Social and Economic Research workshop, 2020.
5 ‘Costs and Benefits of Net-Zero Advisory Group – Chair Report’, CCC, P. Elkins, May 2019, p. 13.

22
Climate action will affect economic growth through multiple channels 2.9 The qualitative assessment of the macroeconomic impacts of the transition
in this report considers each of the potential channels in turn, alongside evidence in
the literature on the likely direction of any impact.
Productivity 2.10 Productivity growth is essential for increasing household living standards and
firm competitiveness in the long term. A well-designed transition that stimulates
innovation and investment in low-carbon sectors with strong growth opportunities
could improve long-term productivity growth in the UK. The government’s Ten Point
Plan outlines a programme of green growth and innovation to seek to achieve this.6
2.11 In contrast, a transition that discourages carbon-intensive activity without
encouraging investment and production into low-carbon alternatives risks lower
productivity growth.
2.12 In the short run, and at an industry level, several empirical studies suggest a
link between environmental policies and negative productivity impacts, although
some also find positive productivity effects.7 The precise impact depends on the
specific policy design and conditions in the sectors to which the policy applies.
Where firms are currently not making the best use of their inputs, policy can
encourage or compel them to improve efficiency.8
2.13 In the long run, the impact on productivity of policies to address climate
change and environmental harm is less clear. The Porter Hypothesis suggests that
environmental regulation can boost investment and innovation9 because companies
that innovate quickly may also experience first-mover advantages. The hypothesis
suggests that these benefits more than offset the initial cost of regulation.10
2.14 There is sound empirical evidence to support a positive link between
environmental regulation and innovation.11 However, the limited number of studies
undertaken do not provide clear evidence that this translates into improved
productivity at the macroeconomic, firm or industry level.12
2.15 It is also worth noting that measures of productivity often only include
labour and capital as inputs, ignoring the depletion of natural resources. GDP is the
only output measured, with no accounting for the cost of damage from pollution
associated with economic activity. The evidence cited above may therefore
6 ‘The Ten Point Plan for a Green Industrial Revolution’, HM Government, November 2020.
7 ‘Environmental policies and productivity growth: a critical review of empirical findings’, T. Kozluk and V. Zipperer, Organisation for
Economic and Social Development (OECD) Journal: Economic Studies, vol. 2014/1, 2014.
8 ‘Carbon policy and economy-wide productivity: A report for the Energy Systems Catapult’, Frontier Economics, 2019.
9 ‘America’s Green Strategy’, Scientific American 264, M. Porter, 1991, p. 168; ‘Toward a New Conception of the Environment-
Competitiveness Relationship’, Journal of Economic Perspectives 9 (4): 97–118, 1995.
10 ‘Climate Change Policy, Innovation and Growth’, A. Dechezleprêtre, R. Martin and S. Bassi, LSE Grantham Institute, Jan 2016.
11 ‘Environmental policy, innovation and performance: New insights on the Porter Hypothesis’, Journal of Economics and
Management Strategy 20: 803–42, P. Lanoie, J. Lucchetti, N. Johnstone, and S. Ambec, 2011.
12 ‘Environmental policies and productivity growth: a critical review of empirical findings’, OECD Journal: Economic Studies, vol.
2014/1, T. Kozluk and V. Zipperer, 2014.

23
overestimate the productivity of carbon-intensive industries compared to low-carbon
alternatives.13
Investment 2.16 Investment is a vital component of economic growth, and significant
investment will be necessary to achieve net zero. Many of the technological
pathways to decarbonise the UK economy are currently uncertain, so the precise
amount of investment required is still unclear. The government’s Ten Point Plan
outlines the ambition to mobilise £12 billion of government investment, and
potentially up to three times as much private investment.14
2.17 Some investment will move from carbon-intensive industries to low-carbon
alternatives, but new investment is also likely to be necessary. Additional and
productive investment in low-carbon growth areas could stimulate economic output
in the near term and support productivity growth in the longer term.
2.18 If decarbonisation leads to high additional investment, then this could
reinvigorate overall investment levels in the UK and help support aggregate demand
in the economy. UK investment levels have been below G7 and OECD15 averages as
a share of GDP in recent years, as shown in Chart 2.A. Higher total investment could
increase the UK’s economic growth rate. This would increase the size of the
economy and so reduce the relative challenge of funding the required investment
for decarbonisation.
2.19 The investment in net zero could be from public or private sources. It is
possible that a substantial increase in public investment for the transition would risk
crowding out private investment or other targets for public investment. If the supply
chain of low-carbon capital goods is constrained, for example due to skill shortages,
then increases in public sector demand may simply out-bid and thus deter private
investment.
2.20 Public investment is less likely to crowd out private investment when
economic growth is below trend and counter-cyclical public investment can be
expansionary. Well-designed government investment may also crowd in private
investment where it creates new markets, reduces technology costs or reduces risk
for private investors.
2.21 In summary, the technology and investment requirements for net zero are
uncertain. The level of investment necessary for decarbonisation, and how much of
that is additional, will determine whether total UK investment is higher,16 lower17 or
13 UK Environmental Accounts, ONS, 2020; Annual business survey, ONS, 2020. 14 ‘The Ten Point Plan for a Green Industrial Revolution’, HM Government, November 2020.
15 Organisation for Economic Cooperation and Development.
16 ‘Investing in Climate, Investing in Growth: A synthesis’, OECD, 2017; ‘Summary for Policymakers. In: Global Warming of 1.5°C.
An IPCC Special Report on the impacts of global warming of 1.5°C above pre-industrial levels and related global greenhouse gas
emission pathways, in the context of strengthening the global response to the threat of climate change, sustainable development,
and efforts to eradicate poverty’, Intergovernmental Panel on Climate Change, 2018.
17 ‘When and Why Do Plants Comply? Paper Mills in the 1980s’, U.S. Environmental Protection Agency National Center for
Environmental Economics, W. Gray and R. Shadbeigan, June 2004. Gray and Shadbegian, in an econometric model of American
Paper Mills from 1979-1990, find a crowding out effect.

24
at the same level18 than it otherwise would have been. Higher economic growth due
to increased investment can reduce the relative funding challenge of
decarbonisation.
Chart 2.A: Total Gross Fixed Capital Formation
Source: World Bank, Organisation for Economic Cooperation and Development (OECD).
Changes in energy prices for businesses and households 2.22 Energy is a significant component of household consumption. It is also an
input cost for production. The scale, direction and longevity of potential price
changes will depend on the relative prices of energy produced by existing and new
technologies. This in turn depends on the potential for technology, innovation and
production at scale to lead to efficiencies in energy production and reduce the cost
of clean energy over time.
2.23 Costs of wind and solar energy have already seen significant falls, and some
forms of renewable electricity generation in the UK, such as onshore wind, are
expected to have lower estimated costs per unit than electricity derived from fossil
fuels.19 Lower long-run energy costs and greater energy efficiency could benefit both
businesses and households. One of the priorities of the Energy White Paper is
keeping energy bills affordable as the UK decarbonises, especially for the most
vulnerable households.20 Analysis by the National Infrastructure Commission further
suggests that household energy bills could be potentially lower or equal to current
levels after switching to clean energy.21
2.24 Taxes that increase the price of energy, policies that add costs to bills, or
regulations that constrain the use of the more cost-efficient but more heavily
18 ‘Environmental regulations and innovation activity in UK manufacturing industries’, Resource and Energy Economics, vol. 34,
issue 2, R. Kneller and E. Manderson, 2012. in their analysis of 25 UK manufacturing industries from 2000 to 2006, Kneller and
Manderson do not find a positive impact of environmental compliance on total R&D or total capital investment. The study also
finds evidence that more stringent environmental regulation directly lowers optimal expenditure on non-environmental innovation.
19 ‘Electricity Generation Costs 2020: Levelised Cost Estimates for Projects Commissioning in 2025, 2030, 2035, and 2040’, Table
4.17, BEIS, 2020.
20 ‘Energy White Paper: Powering our Net Zero Future.’, HM Government, December 2020.
21 ‘Technical annex: Energy and fuel bills today and in 2050’, National Infrastructure Commission, 2018.
10
15
20
25
30
35
40
1974 1984 1994 2004 2014
Share of GDP (%)
Canada France Germany Italy
Japan UK USA

25
polluting technologies could therefore weigh on economic activity and productivity.
The investment required for a widespread switch to low-carbon energy
infrastructure may also add to energy prices.
Competitiveness 2.25 Where the level of ambition of UK climate change mitigation policies exceeds
that of its trading partners, there is a risk of reduced UK competitiveness, particularly
in highly traded sectors.22 At the same time, the UK has areas of comparative
advantage in a number of green and renewable sectors. Where the UK can capitalise
on its leadership in decarbonisation, it may generate economic opportunities,
including in technologies that are not yet established, such as carbon capture and
floating offshore wind.
2.26 One would expect the UK’s opportunities to be aligned with its economic
strengths as a world-leading knowledge economy, with a global financial services
sector and advantages in renewable energies such as offshore wind engineering
services.23 The UK’s ability to take advantage of these opportunities will be partly
determined by the effective use of public policy, which can support the transition of
important sectors and create an attractive environment for investment in innovation.
Sectoral and structural impacts of the transition are likely to be significant regardless of the net impact 2.27 Regardless of the magnitude and direction of aggregate economy-wide
impacts, the transition will lead to significant changes in the structure of the
economy. This will have knock-on impacts on sectors, jobs and regions.
2.28 Some of these impacts will be locally concentrated, but precise impacts will
depend on the ease with which the existing sectors can decarbonise, the rate at
which new areas of economic activity emerge and on policies to manage the
impacts or support the transition.
2.29 It is not a given that the areas with currently high emissions will face the
largest costs to decarbonise, and many of these regions could see new jobs as a
result of policies such as those in the government’s Ten Point Plan.24 This included
£12 billion of government investment to create and support up to 250,000 highly
skilled green jobs, including an extra £200 million to create two carbon capture
clusters by the mid-2020s, with another two set to be created by 2030. This
increased the total invested to £1 billion, helping to support 50,000 jobs, potentially
in areas such as the Humber, Teesside, Merseyside, Grangemouth and Port Talbot.
Box 2.B further illustrates some of the potential economic opportunities that
decarbonisation can bring across the country.
22 ‘An Empirical Multi‐Country Analysis of the Impact of Environmental Regulations on Foreign Trade Flows’, Kyklos, vol. 50, C. Van
Beers and J. Van den Bergh, 1997.
23 The UK has an established comparative advantage in areas including offshore engineering (oil and gas), installation and
maintenance of offshore drilling platforms, manufacture of platforms, cabling and substations, and development of offshore sites.
‘Offshore Wind Energy Outlook’, International Energy Agency (IEA), 2019.
24 ‘The Ten Point Plan for a Green Industrial Revolution’, HM Government, November 2020.

26
Box 2.B: Onshore and offshore wind
Wind technology has developed rapidly over the past few decades. Since
2000, global onshore wind installations have seen a compound annual
growth rate of 21%,25 rising to nearly 30% annual growth since 201026 (Chart
2.B). Turbine prices have fallen on average by 38% since 2009.27
Offshore wind is also a rapidly developing technology of increasing
importance for electricity generation. The UK has been a global leader in the
promotion of offshore wind and has more installed capacity than any other
country.28 The UK’s share of electricity generated by offshore wind has
increased from 0.8% in 2010 to 6.2% in 2017 and is expected to reach 10%
in 2020.29 The average cost of electricity from offshore wind projects fell by
over 25% between 2010 and 2019.30
Chart 2.B: Onshore wind installed capacity and average cost of electricitya
Source: ‘Interactive Datasets, Wind Capacity’, BloombergNEF, 2020; ‘Renewable Power Generation Costs in 2019’, International Renewable Energy Agency, 2020. a The levelised cost of electricity (LCOE) is the average cost of the lifetime of the plant per MWh of electricity generated.
25 ‘Future of wind’, International Renewable Energy Agency (IRENA), 2019.
26 ‘Offshore Wind Outlook 2019’, IEA, 2019.
27 ‘Renewable Power: Sharply Falling Generation Costs’, IRENA, 2017.
28 ‘Offshore Wind Outlook 2019’, IEA, 2019.
29 ‘Offshore Wind Sector Deal Policy Paper’, BEIS, 2020.
30 ‘Renewable Power Generation Costs in 2019’, IRENA, 2020.
0.00
0.02
0.04
0.06
0.08
0.10
0.12
0.14
0.16
0
100
200
300
400
500
600
20
00
20
01
20
02
20
03
20
04
20
05
20
06
20
07
20
08
20
09
20
10
20
11
20
12
20
13
20
14
20
15
20
16
20
17
20
18
LC
OE
a(2
018 U
SD
/kW
h)
Inst
alled
cap
aci
ty (
GW
)
United Kingdom United States
China World
Levelised cost of electricity
27
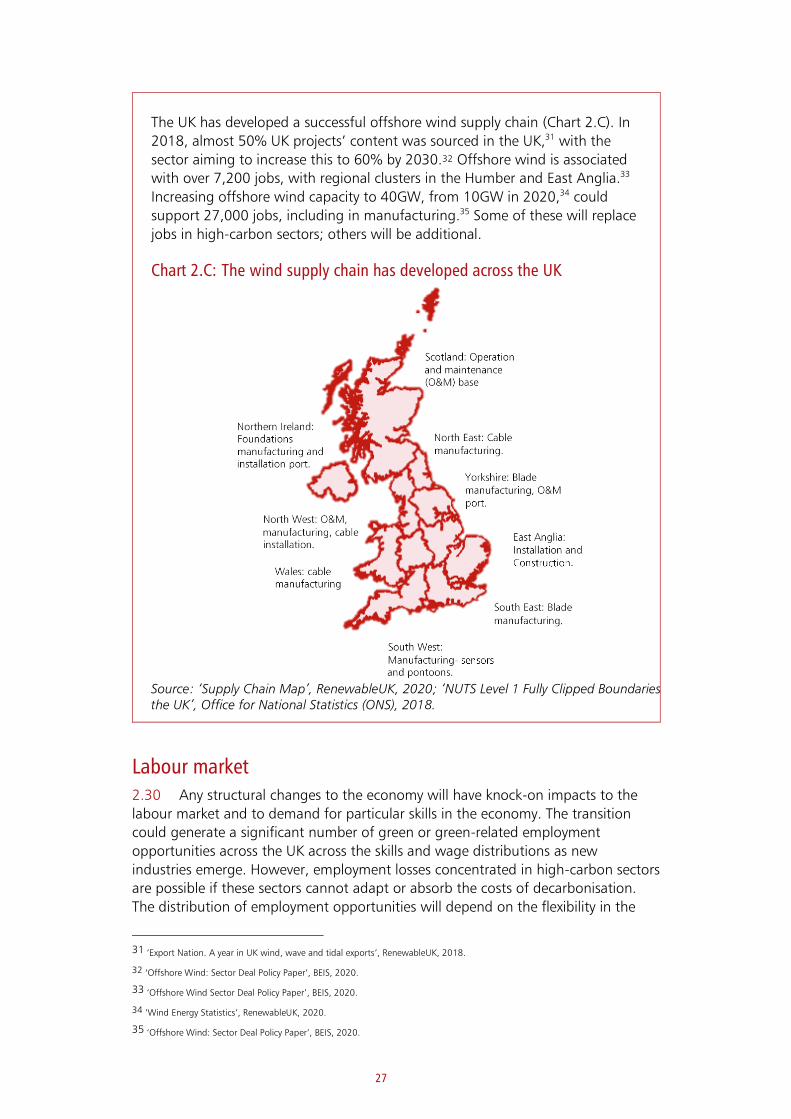
The UK has developed a successful offshore wind supply chain (Chart 2.C). In
2018, almost 50% UK projects’ content was sourced in the UK,31 with the
sector aiming to increase this to 60% by 2030.32 Offshore wind is associated
with over 7,200 jobs, with regional clusters in the Humber and East Anglia.33
Increasing offshore wind capacity to 40GW, from 10GW in 2020,34 could
support 27,000 jobs, including in manufacturing.35 Some of these will replace
jobs in high-carbon sectors; others will be additional.
Chart 2.C: The wind supply chain has developed across the UK
Source: ‘Supply Chain Map’, RenewableUK, 2020; ‘NUTS Level 1 Fully Clipped Boundaries in the UK’, Office for National Statistics (ONS), 2018.
Labour market 2.30 Any structural changes to the economy will have knock-on impacts to the
labour market and to demand for particular skills in the economy. The transition
could generate a significant number of green or green-related employment
opportunities across the UK across the skills and wage distributions as new
industries emerge. However, employment losses concentrated in high-carbon sectors
are possible if these sectors cannot adapt or absorb the costs of decarbonisation.
The distribution of employment opportunities will depend on the flexibility in the
31 ‘Export Nation. A year in UK wind, wave and tidal exports’, RenewableUK, 2018.
32 ‘Offshore Wind: Sector Deal Policy Paper’, BEIS, 2020.
33 ‘Offshore Wind Sector Deal Policy Paper’, BEIS, 2020.
34 ‘Wind Energy Statistics’, RenewableUK, 2020.
35 ‘Offshore Wind: Sector Deal Policy Paper’, BEIS, 2020.

28
labour market to match vacancies with the necessary skills, as well as government
policy choices, and will not automatically match existing distributions of skills and
labour. The potential labour market impacts are explored further in Chapter 7.
The transition also has implications for financial stability 2.31 A gradual and smooth transition can support (for example, by reducing the
volume of stranded assets) and limit systemic risks to the financial system.36 To this
end, it is important that the government takes early and decisive action, providing
clear signals on the direction of net zero policy to give certainty to investors and
allow businesses to plan and adapt effectively.
2.32 The Bank of England has identified a number of financial risks that could be
realised if there were a disorderly transition to a low-carbon economy.37 Credit risks
can arise through stranded assets (fossil fuel assets and other carbon-intensive assets
that become unusable) and losses from banks’ and non-banks’ loan exposure to
companies vulnerable to transition risks. Insurers may be at risk if decarbonisation
leads to a fall in value of the long-term assets held to support future pension
benefits.38 Market risk can arise from sharp re-pricing of fossil fuel and other
carbon-intensive assets.
2.33 The Bank also identifies operational risks, where shifting customer sentiment
may pose reputational risks, for example through increasing pressure to divert
capital flows away from carbon intensive companies towards sectors that contribute
to the transition to a low-carbon economy. If such risks were to materialise at scale
and pace, there could be significant implications for financial stability. These risks to
the financial system could amplify the costs that climate change poses to the real
economy.
2.34 The Bank of England’s proposed scenarios for modelling climate impacts on
the financial system illustrate the difference that policy timescales to address climate
change can have on financial stability.39 A scenario where there is early and decisive
action to address climate change would allow financial markets to price in the
transition in an orderly fashion and take advantage of the opportunities it provides.
In a late policy action scenario, where action to address climate change is delayed by
ten years, a deeper adjustment is likely to be required. This may lead to significant
shifts in global carbon prices, incurring risks to the financial system and the
macroeconomy.
The transition comes with co-benefits 2.35 Co-benefits are ancillary benefits that result from greenhouse gas reduction.
These include positive benefits such as improved public health outcomes (as a result
of better air quality, better diets and more active travel), warmer, more comfortable
36 ‘Too Little Too Late’, European Systemic Risk Board, 2018. The Bank of England will also use the 2021 biennial exploratory
scenario to explore the financial risks from climate change by looking at the difference in the costs between early and steady
transition, and late transition with a sudden repricing shocks of assets.
37 ‘Transition in thinking: The impact of climate change on the UK banking sector’, Bank of England, September 2018.
38 Speech by Anna Sweeney (Bank of England), Moody’s Insurance Summit Webinar, 9 September 2020.
39 ‘Discussion Paper: The 2021 biennial exploratory scenario on the financial risks from climate change’, Bank of England, 2019.

29
homes, and wellbeing improvements from improved environmental amenities and
green spaces.40
2.36 Co-benefits have generally been excluded from macroeconomic modelling.
However, they can be significant, realised in the near-term and largely benefit the
country doing the emissions abatement. For example, the World Health
Organization estimated the cost of premature deaths from air pollution in the UK as
$83 billion in 2010.41 Therefore, co-benefits should not be excluded from final
policy considerations.
The changes in the structure of the economy will also have fiscal implications 2.37 The transition to net zero and consequent structural changes in the economy
will also have implications for the UK’s public finances and fiscal sustainability. As
some sectors grow and others shrink, the mix of tax revenues will change. Chart 2.D
illustrates the cumulative relationship between employment and corporation taxes
against emissions by industry. This shows that a small number of industries are
responsible for a large share of emissions, but a much smaller share of tax. The top
three sectors by greenhouse gas emissions account for 63% of UK industrial
emissions but contribute just 14% of PAYE and Corporation Tax revenues.42
2.38 Decarbonisation will mean significant changes for these high polluting
sectors and industries, should decarbonisation lead to innovation and higher
productivity in these sectors, the government might see associated tax revenues
increasing. Alternatively if the costs of decarbonisation affect the near-term
productivity of these firms, then the government might expect to collect less revenue
from these industries. Nevertheless, these sectors’ current small share of the tax-take
suggests that the impact of the net zero transition on total tax revenues could be
limited.
2.39 Other taxes are more directly dependent on emissions. Chart 2.E shows the
current tax revenues that are wholly dependent on individuals’ and businesses’
consumption of fossil fuels or emission of greenhouse gases. These sum to
approximately £37 billion in the financial year 2019-20 or just over 4% of total
revenues. While not all these taxes were designed solely to reduce carbon in the
economy, much of this revenue is likely to be eroded during the transition to a net
zero economy.
40 ‘Multiple benefits from climate change mitigation: assessing the evidence’, Grantham research Institute on Climate Change and
the Environment, London School of Economics and Political Science (LSE), Kirk Hamilton, Milan Brahmbhatt, Jiemei Liu, November
2017.
41 ‘Economic cost of the health impact of air pollution in Europe’, World Health Organization, 2015.
42 ‘Atmospheric emissions’, Office of National Statistics (ONS), 2020; ‘Income Tax deducted from pay by industry statistics’, HM
Revenue & Customs (HMRC), Pay As You Earn (PAYE) deducted from pay by industry, 2019; Corporation Tax Statistics, HMRC,
2020.

30
Chart 2.D: Industrial greenhouse gas emissions and revenue contributions by sectora
Source: ‘Atmospheric emissions: greenhouse gases by industry and gas’, ONS, 2020; ‘PAYE tax deducted from pay, by industry’, ONS, 2019; ‘Tax receipts and NICs’, HMRC, 2020; ‘Corporation Tax liabilities’, HMRC, 2019.
Code Description Code Description D Electricity, Gas, Steam and Air
Conditioning Supply I Accommodation and Food Service
Activities
H Transportation and Storage N Administrative and Support Service Activities
C Manufacturing P Education A Agriculture, Forestry and Fishing M Professional, Scientific and Technical
Activities E Water Supply; Sewerage, Waste
Management and Remediation Activities
L Real Estate Activities
B Mining and Quarrying S Other Service Activities G Wholesale and Retail Trade; Repair of
Motor Vehicles and Motorcycles J Information and Communication
F Construction R Arts, Entertainment and Recreation Q Human Health and Social Work
Activities K Financial and Insurance Activities
O Public Administration and Defence; Compulsory Social Security
T+U Other
a Industrial emissions account for 74.1% of total GHG emissions. Revenue contributions by industry are calculated using
PAYE + CT receipts. Sector refers to ONS Section level SIC code.
2.40 Taxes included in this analysis are wholly or partially at risk. For example, it is
estimated that up to 90% of current Landfill Tax revenue could be at risk, as a
significant proportion of the revenue is derived from biodegradable waste which
releases methane and carbon dioxide.
DH
C
A
E
B
G
F
QO
I
N
P
ML S
JR
KT+U
0%
10%
20%
30%
40%
50%
60%
70%
80%
90%
100%
0% 10% 20% 30% 40% 50% 60% 70% 80% 90% 100%
Cu
mu
lati
ve P
AY
E a
nd
Co
rpo
rati
on
tax c
on
trib
uti
on
Cumulative greenhouse gas emissions

31
2.41 Other tax revenues have mostly been excluded from this analysis where the
net fiscal impact of the transition is uncertain. For example, the transition will have
an ambiguous effect on revenues from the Climate Change Levy (CCL), a levy on
business energy consumption. Consumption of electricity is expected to increase
significantly, which would tend to increase CCL revenues, but this is to some extent
offset by use of gas and solid fuels falling nearly to zero, reducing CCL revenues.
Chart 2.E therefore only includes CCL revenues from the Carbon Price Support.
Chart 2.E: Tax revenues from greenhouse gas consumptiona
Source: HMRC tax receipts and NIC contributions, 2020; PAYE deducted from pay, 2020), OBR economic and fiscal outlook, 2020. a Current revenues from EU ETS receipts are at risk due to low greenhouse gases at the end of the transition.
2.42 On the expenditure side there is a potential fiscal benefit, with the spending
on domestic decarbonisation expected to decline by 2050 as the economy
decarbonises and markets and technologies mature. Some related spending
pressures may remain, subject to decisions on how to fund capital and operating
costs, and how to manage carbon leakage. In 2019-20 the government spent £1.5
billion43 on domestic climate mitigation, with additional support of £11.4 billion
through fiscally neutral spend, such as Contracts for Difference, where policy is
funded through consumer bills. 44
43 This is the sum of all domestic climate mitigation spending from BEIS, the Department for Transport (DfT) and the Department
for Environment, Food and Rural Affairs (DEFRA) and their arms-length bodies. This excludes international or climate adaptation
spending. It also excludes spending on programmes where decarbonisation is one of multiple objectives, and it is difficult to
isolate the decarbonisation spend.
44 There are eight environmental levies that are added to energy bills, but are not included in this tax-at-risk assessment, as they are
fiscally neutral. This means they do not represent a fiscal risk because, once decarbonisation has been completed, all revenue and
spending pressures are fully offset. The removal of the levies will, however, reduce the overall size of the public sector. The ONS
treats these levies in three different ways in the public sector finances. Four environmental levies (Renewables Obligation,
0
5
10
15
20
25
30
35
40
2019-20
£ billion
Fuel duties Vehicle Excise Duties EU ETS Auction Receipts
Landfill Tax Carbon Price Floor

32
2.43 As set out above, global decarbonisation is necessary for sustainable
economies in the long run, and therefore for the health of the public finances.
Nevertheless, the UK still needs to act to maintain public finances’ sustainability as it
achieves net zero. This is to ensure that government can continue to fund other
public service priorities and respond to future economic shocks. The importance of
maintaining fiscal space to be able to respond to shocks has been underscored
during recent months by the response to the COVID-19 pandemic. This has led to a
significant rise in public debt that is both necessary and affordable and supported by
historically low borrowing costs.
2.44 The transition to net zero will coincide with a period during which the OBR
expects greater pressure on the public finances due to demographic trends.45 Given
the risks facing tax receipts over the transition period, the government will need to
make decisions over time and in light of economic conditions about whether or not
to adjust taxes in order to maintain revenue in a low-carbon economy, or to balance
any loss of tax revenue with reductions in spending. Carefully considering impacts
such as these is crucial for ensuring sustainable public finances into the future.
Contracts for Difference, Capacity Markets and the Green Gas Levy) are included within the public sector finances, but for the
Renewable Heat Incentive, only the spend aspect is included as annually managed expenditure. Three levy-obligations are not
classified within the public sector but operate in a similar manner (Feed-in tariffs, Warm Home Discount and the Energy Company
Obligation). The OBR discusses the classification of environmental levies in more detail in ‘Restated March 2019 forecast’,
November 2019, paragraphs 1.20 to 1.22.
45 ‘Fiscal Sustainability Report’, Office of Budget Responsibility (OBR), 2020.

33
Chapter 3
Estimating the costs of the transition
The transition to net zero requires new investment. Households, businesses
and taxpayers will need to insulate homes and buildings, install low-carbon
heating systems and replace internal combustion engine vehicles with low
emission alternatives. These investments will lead to changes in households’
and businesses’ ongoing costs, particularly through their energy use.
The scale of the investment and changes to ongoing costs will vary from
household to household and from business to business. The net impact will
depend on the household’s or business’s current carbon exposure and their
ability to change consumption patterns or business processes. It will also be
affected by the timing of natural investment cycles, the rate at which
technology costs fall, innovation and nationwide system-level decisions, such
as the choice of energy mix over the next decade.
As a result, any cost estimate is highly complex, speculative and should be
considered as a scenario based on assumptions rather than a projection.
Nevertheless, such estimates can provide a sense of the scale of the challenge.
To support its report on net zero last year, the Climate Change Committee
(CCC) estimated that the transition would have a net cost of £50 billion across
all economic sectors in 2050.1 They have now updated this estimate to £16
billion.2 This includes assumptions about changes to behaviour, falls in
technology costs and efficiency gains, all of which are highly uncertain. These
costs are partial and do not include the costs of policy interventions or
broader supporting investment such as skills development, nor do the CCC
cost estimates capture the wider economic effects, the fiscal impacts, the non-
financial costs to households and businesses, or all the co-benefits of
decarbonisation.
What are the costs? 3.1 The transition to net zero will require households and businesses to incur
new costs. These costs are primarily capital expenditures, but also encompass
changes to the long-term operating costs of the economy.
1 2018 prices.
2 2019 prices

34
3.2 The size of these costs is difficult to estimate. Technological development
can bring costs down, but the rate is hard to predict. Government policy can also
affect how quickly new technology is adopted, as well as adding to the total cost
directly through expenditures on administering and enforcing policies to support the
transition.
3.3 Nevertheless, some organisations have attempted to estimate the cost of
achieving net zero in order to give a sense of the scale of the challenge. The Climate
Change Committee (CCC) last year put the cost at £50 billion in 2050, considering
only the investment required and the impact on the running costs of technologies.3
Their latest publication updates this estimate to £16 billion, as a result of changes in
their modelling assumptions and lower costs forecasts for some important
technologies.4 The potential benefits from the transition, described in Chapter 2,
could offset these costs to some extent.
The nature of the costs 3.4 The transition to net zero will be capital-intensive. This new capital
equipment will have different – and in many cases lower – running costs to the
high-carbon equipment it replaces.
3.5 The capital and running costs will vary between sectors and between
households, businesses and taxpayers depending on market structures and
government policy. The impact of some costs will be small where new low-carbon
products are more attractive than the current equivalent and the cost of changing is
low. Others will prove more difficult. Table 3.A shows the types of changes in
business practices and consumption patterns, investments and ongoing running
costs that will be required over the next 30 years in different sectors of the
economy.
Factors affecting the total cost
3.6 The final size of the cost is difficult to predict. This is because many of the
details of how the transition will evolve are unknown. They will be determined by
business decisions, consumer choices, trends in innovation and government policies
over a 30-year period.
Natural investment cycles
3.7 The investments required to meet net zero will often mean replacing existing
machinery or equipment with lower-carbon equivalents. Timely policy interventions
with adequate lead times for households and businesses, can reduce the additional
outlay required, for example by allowing a gas boiler to be replaced with a low-
carbon alternative at the end of its natural life rather than having to scrap the boiler
early. This is discussed in greater detail in Chapters 2 and 5.
3 ‘Net Zero: The UK's contribution to stopping global warming’, Climate Change Committee (CCC), 2019.
4 ‘Sixth Carbon Budget – Methodology Report’, CCC, 2020.

35
Table 3.A: Examples of decarbonisation investments, costs and savings for households and businesses
Sector Share of UK 2018 emissions (%)
a
Example of decarbonisation
change
Example of capital investment
Example of operating cost
impact
Buildings 17.8 Improving home
energy efficiency Insulation Energy bill savings
Replacing oil or
gas heating
system
Heat pump or
hydrogen boiler
Cost from clean
fuel
Industry 20.8 Green cement Carbon capture
unit installation
Electricity cost of
running a CCUSb
unit
Power 13.3
Increase in green
electricity
generation
Wind farms Low cost
electricity
Agriculture, land
use and land use-
change
7.1 Woodland
creation Planting trees
Higher
management and
upkeep costs
Waste &
fluorinated gases 7.0
Improved levels of
recycling
New recycling
infrastructure
Recycling plant
running costs
Transport –
surface 23.2
Replacing internal
combustion
engine car or van
Electric car or van Fuel savings or
increases
Transport –
aviation and
shipping:
domestic (A);
international (B)
1.6 (A)
9.1 (B)
Decarbonising
aviation and
shipping fuel
Airline fleet
upgrades
Changes in fuel
costs compared to
current fossil fuels
Negative emission
technologies N/A
Capturing and
removing carbon
Direct air capture
plant
Energy cost of
running plant
Source: ‘Reducing UK emissions: 2020 Progress Report to Parliament’, CCC, May 2019; Final
UK greenhouse gas emissions national statistics 1990-2018.
a Where possible, this report uses the 2019 data. This table uses the 2018 data as international aviation and shipping
emissions for 2019 will not be available until February 2021.
b Carbon capture, usage and storage
Rate of innovation
3.8 The costs of new technologies tend to fall as they become more developed
and are deployed more widely. Technology costs could be considerably lower in the
2030s and 2040s than in current forecasts, but the speed at which they will fall is
unknown. Cost reductions can be driven by several factors including economies of

36
scale, research and development spillovers and the learning-by-doing process.5 Box
3.A discusses how solar panel costs have fallen since their invention in 1954.
Box 3.A: Innovation in solar energy has spurred global cost reductions
The cost of solar photovoltaic (PV) technology has fallen dramatically since it
was invented in 1954. The cost of solar PV modules has fallen by 20-25% on
average for each doubling of global solar PV capacity (Chart 3.A).6
Chart 3.A: Solar module cost and cumulative installed capacity
Source: Unit cost: ‘How well do experience curves predict technological progress? A method for making distributional forecasts’, F. Lafond, A.G. Bailey, J.D. Bakker, D. Rebois, R. Zadourian, P. McSharry & J.D. Farmer, March 2018; Cumulative capacity: Lanford et al. (2017) up to 2009 and International Renewable Energy Agency (IRENA) Global solar PV installed capacity and solar PV model price. Cited in Ritchie (2017) ‘Renewable Energy’.
Innovation and scientific cooperation across the world have spurred these cost
reductions.
First, the US government funded the commercial use of solar PV in 1956 in
satellites.7 Then, during the 1980s-90s, the Japanese government worked with
Japanese corporations to find commercial uses for PV and created a rooftop
subsidy scheme. This meant that by the mid-2000s Japan was producing
roughly 50% of global PV modules.8
5 ‘Wright meets Markowitz: How standard portfolio theory changes when assets are technologies following experience curves’,
Journal of Economic Dynamics and Control, Volume 101, R, Way, F. Lafond, F. Lillo, V. Panchenko and J. D. Farmer, April 2019.
6 ‘Renewable Energy’, Our World in Data, H. Ritchie and M. Roser, 2017; ‘Photovoltaics report’, Fraunhofer Institute for Solar Energy
Systems, ISE, September 2020.
7 Vanguard Satellite 1958, NASA 2017.
8 ‘How Solar Energy Became Cheap’, G.F. Nemet, 2019.
1978
2016
0
5
10
15
20
25
30
35
1 10 100 1,000 10,000 100,000 1,000,000
So
lar
PV
Mo
du
le C
ost
(2016 $
per
watt
-peak
(2016 $
/Wp
))
Cumulative installed capactiy (megawatts-peak, MWp)

37
In 2000, Germany introduced feed-in tariffs and prioritised grid access for
renewables. This led to Germany accounting for over half of global
installations of solar panels between 2004 and 2007.9
The rise in demand for PV as a result of policy in Germany transformed
Chinese production. Between 2000 and 2007, the solar PV industry in China
grew from just a few start-ups to being a world leader, with the success of a
few pioneering companies encouraging more investors to move into the
industry.10
Global installed capacity of solar PV rose from 808 MW to 570,000 MW
between 2000 and 2019. Over a third of installed capacity in 2019 was in
China,11 which also manufactured approximately two-thirds of modules that
year.12
Investment in solar PV is predicted to continue to rise, with a potential six-fold
increase over the next decade. By 2050, installed capacity is predicted to be
eighteen times higher than in 2018.13
The UK plays a role in research and development in the global solar supply
chain, leading the development of next-generation PV technologies. Nippon
Sheet Glass (NSG) and Oxford Photovoltaics (PV) are UK based companies
leading the development of new technologies.14
3.9 Forecasting falls in technology prices is difficult. Estimates can be
conservative, thereby overstating the cost of achieving net zero.15 Chart 3.B, for
example, shows the difference between the predicted cost of onshore wind projects
commissioned in a given year and actual levelised16 cost of electricity for projects in
the corresponding year.
3.10 Underestimating falls in technology prices can also be seen at the economy-
wide level. In 2008, the CCC estimated that the costs required to reduce carbon
emissions by 80% by 2050 would be the equivalent of 1 to 2% of GDP in 2050.
Technological progress in the subsequent decade meant that when the CCC gave
their advice in 2019, they estimated that it would be possible to achieve the more
9 ‘How Germany helped bring down the cost of PV’, Energy Transition, C. Morris 2016.
10 ‘Unrelated diversification in latecomer contexts: Emergence of the Chinese solar photovoltaics industry’, Environmental Innovation
and Societal Transitions, Vol 28, C. Binz and L.D. Anadon, September 2018; ‘Analysis on the development and policy of solar PV
power in China’, Renewable and Sustainable Energy Reviews, S. Zhang and Y. He, 2013.
11 ‘Renewable Capacity Statistics 2020’, International Renewable Energy Agency (IRENA), March 2020.
12 ‘Photovoltaics report’, Fraunhofer Institute for Solar Energy Systems, ISE, September 2020.
13 ‘Future of Solar Photovoltaics’, IRENA, 2019.
14 ‘The Solar Commission’, Regen, July 2019; ‘UK firm's solar power breakthrough could make world's most efficient panels by
2021’, J. Ambrose, The Guardian, 15 August 2020.
15 ‘The Role of Modelling and Scenario Development in Long-term Strategies’, Long-Term Climate Strategies, World Resources
Institute, D. Zenghelis, 2018.
16 Levelised costs is a measurement used to assess and compare alternative methods of energy production. It can be thought of as
the average total cost of building and operating the asset per unit of total electricity generated over an assumed lifetime.

38
ambitious target of net zero emissions by 2050 for the same cost.17 The latest CCC
cost estimates show the cost could be lower than 1% of GDP.
Chart 3.B: Projected onshore wind costs and average cost of past projectsa
Source: ‘DECC Electricity Generation Costs’, Department for Energy & Climate Change, 2012 and 2013; ‘BEIS Electricity Generation Costs’, Department for Business, Energy & Industrial Strategy, 2016; ‘BEIS electricity generation cost report (2020)’, BEIS, 2020; ‘Renewable Power Generation Costs in 2018’, IRENA, 2018; ‘Historic LCOE’, BNEF, 2020. a The average, or ‘levelised’, cost of the lifetime of the plant per MWh of electricity generated.
3.11 There may be limits to the falls in costs that could take place, and cost
reductions may be limited to certain technologies. The learning-by-doing effect
appears to be strongest with technologies that are built using highly repeatable
activities, usually involving the manufacture of small unit pieces. For example, about
1 billion solar PV modules have been made globally since the invention of the
product in 1954, allowing cumulative learning by doing to occur.18
3.12 The effect is less visible for technologies where this does not apply. The cost
of building nuclear power stations has not fallen in recent years as safety regulations
in the sector have tightened in response to the 2011 Fukushima nuclear disaster.19
17 ‘Net Zero: The UK's contribution to stopping global warming’, Climate Change Committee, 2019.
18 ‘Sunny Uplands: Alternative energy will no longer be alternative’, The Economist, C. Stoenescu, November 2012; BloombergNEF,
2020.
19 ‘High costs and renewables challenge the case for nuclear power’, The Financial Times, Pfeifer, 2018.
BEIS 2020 (Projections)
BEIS 2016 (Projections)
DECC 2013 (Projections)
DECC 2012 (Projections)
BNEF (Actual cost)
IRENA (Actual cost)
0
10
20
30
40
50
60
70
80
90
100
2009 2011 2013 2015 2017 2019 2021 2023 2025
Commissioning year
Levelised cost (£/MWh, 2012 prices)
BEIS 2020 (Projections) BEIS 2016 (Projections)
DECC 2013 (Projections) DECC 2012 (Projections)
BNEF (Actual cost) IRENA (Actual cost)
39
3.13 However, learning can, and does, occur for nuclear power station
construction where nations are able to invest in fleet deployment, using the same
design across multiple projects, as seen in the Republic of Korea and elsewhere.20
There remains strong interest in developing new nuclear power plants as resource-
poor countries seek to decarbonise their power systems. Therefore, while costs have
not uniformly fallen as a result of the c. 500 nuclear power stations that have been
built globally,21 there is an understanding of the potential for learning in the future.
This could be aided by international coordination and a degree of regulatory
alignment. In the UK, the developer of Hinkley Point C is reporting evidence of a
tangible learning benefit between reactors 1 and 2 with some milestones for reactor
2 being achieved with fewer man-hours of labour than were expended to reach
equivalent milestones on reactor 1.22
3.14 Nuclear project developers are also exploring ways to modularise
construction where possible to mitigate delays caused by weather and therefore
reduce overall project risk. Furthermore, pending global regulatory approval, small
modular reactors (SMRs), could have the potential to go further by using repeat
manufacture and on-site assembly techniques that accelerate learning and enable
cost reductions. The Prime Minister announced in November 2020 up to £215
million from the Advanced Nuclear Fund would be made available for investment in
this technology.
Pace of behavioural change
3.15 Changes in patterns of demand can also affect the cost of transitioning to
net zero. This is especially true of difficult-to-decarbonise sectors like aviation and
agriculture, where the abatement options needed for residual emissions will tend to
be the most expensive. The pace at which behaviour change will take place is highly
uncertain and may depend on societal changes and government policy.
Policy certainty
3.16 Certainty on policy direction is also a driver of costs for the private sector.23
Uncertainty about how government policy will evolve across the transition can push
up financing costs or deter investment entirely as the private sector awaits
government decisions. This can increase costs if decisions are delayed sub-optimally.
3.17 The beneficial effects of policy certainty can be seen through the greater fall
in the cost of wind energy, which has had a more consistent policy direction,
compared to nuclear energy. Chapter 5 discusses the role of signalling and stability
in reducing uncertainty for economic actors.
System-level decisions
3.18 The transition to net zero includes a number of system-level decisions. These
include decisions about the UK’s overall approach to decarbonisation, infrastructure
choices and the shape of the energy system. These decisions may affect the balance
between investment and ongoing running costs.
20 ‘The ETI Nuclear Cost Drivers Project: Summary Report’, Energy Technologies Institute, 2018.
21 ‘Sunny Uplands: Alternative energy will no longer be alternative’, The Economist, C. Stoenescu, November 2012; BloombergNEF,
2020.
22 ‘Building on experience - the route to unit 2 (Hinkley Point C), EDF Energy, 2020.
23 ‘Cost of Energy Review: independent report’, Professor Dieter Helm, October 2017.

40
3.19 For example, decisions about the final roles of hydrogen and electricity in the
future UK economy will affect how households and businesses heat their buildings,
fuel use in industry and long-haul transport. This will have consequential impacts on
investments required to reach net zero and operating costs. The viability of
hydrogen in turn partly depends on whether Carbon Capture, Use and Storage
(CCUS) can be deployed at scale to produce clean hydrogen on a cost-competitive
basis. Demonstrations are underway, with at least one hydrogen-CCUS cluster
expected to be operational by the mid-2020s.
3.20 Another system-level decision is the scale of negative emission technologies
in a net-zero UK. The CCC’s net zero scenario included a significant role for
greenhouse gas removals, including those yet to be developed and deployed, over
the next 30 years to balance residual emissions from some of the most difficult to
decarbonise sectors, such as industry, agriculture and aviation.24 How quickly and
cheaply negative emissions technologies develop will determine the degree to which
those emissions can be offset or more expensive sectoral abatement options will be
needed.
Cost estimates are still useful, despite the uncertainty 3.21 Despite the challenges set out above, cost estimates are still useful in
understanding the scale of costs required to achieve net zero. The CCC, and other
groups such as the Energy Systems Catapult, have produced estimates for a UK net
zero target. The European Commission has also estimated total costs for an EU-wide
net zero target in 2050. These estimates vary in their baselines, scope and
assumptions about technologies and behavioural change.
3.22 Choosing a particular baseline or counterfactual is challenging and has a
large impact on the final cost estimate. Consumer behaviour and preferences are
constantly shifting. For example, the current trend in plant-based diets will lead to
lower costs for the transition, but the degree to which this trend continues, and
whether it should be counted in the counterfactual scenario is a matter of
judgement. Given the 30-year time period, assumptions could compound to
produce large differences in cost estimates by the end of the forecast period.
3.23 Further variability comes in the scope and measurement of the greenhouse
gas emissions to be abated. UK estimates are based on international best practice
accounting standards as set out by the Intergovernmental Panel on Climate Change
(IPCC),25 but the methodology is subject to review and revision. For example, the
IPCC has recently re-classified the greenhouse gas effect of peatland degradation.26
This has increased estimated UK greenhouse gas emissions from all peatland sources
by between 17.2 and 21.7 MtCO2e in 2017. Emissions from degraded peatlands are
not currently included in the UK’s Greenhouse Gas Emissions Inventory. Once they
are, this will increase the UK’s total emissions by 3 to 4%.27
24 ‘Net Zero: The UK's contribution to stopping global warming’, CCC, 2019.
25 ‘2006 Intergovernmental Panel on Climate Change (IPCC) Guidelines for National Greenhouse Gas Inventories’, IPCC, 2006.
26 ‘2013 Supplement to the 2006 IPCC Guidelines for National Greenhouse Gas Inventories: Wetlands’, IPCC, 2014.
27 ‘Net Zero: The UK's contribution to stopping global warming’, CCC, 2019; ‘Implementation of an Emissions Inventory for UK
Peatlands’, Centre for Ecology and Hydrology – Natural Environment Research Council, C. Evans et al, December 2017.

41
The Climate Change Committee’s cost estimate 3.24 In December 2020, the CCC published its advice on the Sixth Carbon Budget.
In this analysis they provided new estimates of the cost of achieving net zero by
2050.28
3.25 In their 2019 report, the CCC advised that the annual cost in the final year of
the net zero transition would be £50 billion.29 In their Carbon Budget 6 advice,
published earlier this month, this figure has been revised down to £16 billion. The
reduction is due to lower cost forecasts for some important technologies and a
change in the scenario they have modelled; they have assumed greater behavioural
change over the next 15 years and less reliance on greenhouse gas removals in the
final years of the transition.30 Table 3.B sets out how the CCC’s estimate breaks
down across sectors.
3.26 In the CCC’s net zero scenario, buildings is the most costly sector to
decarbonise, at around £7 billion a year on average. These are mainly capital
investments, with some operating cost savings. The high cost for buildings (over
50% of the total cost for all sectors) compares with a 17.8% share of direct
emissions in 2018 (88 MtCO2e). These investments mean that buildings will have
relatively limited residual emissions of 1 MtCO2e in 2050, around 0.2% of total 2018
emissions.
3.27 Transport was the largest emitting sector in 2018, but the CCC’s net zero
scenario has a net cost saving from decarbonising the sector due to savings from
using electric vehicles relative to internal combustion engines. Savings are largely
driven by an assumption of falling battery costs, and by lower running costs
compared to petrol and diesel vehicles. Other forecasters predict less rapid declines
in costs and lower savings. Transport remains the highest emitting sector in 2050,
but most residual emissions are from aviation. Those residual emissions increase the
need for the development of negative emission technologies to remove greenhouse
gases from the atmosphere, with an average annual net cost for these removals of
£2.3 billion.
3.28 Agriculture also remains challenging to decarbonise fully in the CCC’s
scenario. It maintains a large proportion of its 2018 emissions level and will require
significant offsets according to the CCC.
28 ‘Sixth Carbon Budget – The path to Net Zero’, CCC, 2020.
29 Under the CCC’s definition, costs are estimated by summing costs and cost savings from carbon abatement measures and
comparing them to costs in an alternative scenario (a hypothetical world with no climate action or climate damages). For example,
installing energy efficiency measures (e.g. loft insulations, cavity wall insulations) in homes has an upfront cost but reduces energy
demand and emissions. There is an investment cost from installing the measures (e.g. labour costs, costs of building materials),
followed by an ongoing stream of fuel and cost savings. The total cost of the measure will be the sum of its annualised costs and
cost savings. This exercise is applied to all abatement measures in the economy to estimate total resource costs. See ‘Net Zero: The
UK's contribution to stopping global warming’, CCC, 2019, p.227.
30 ‘Sixth Carbon Budget – Methodology Report’, CCC, 2020.

42
Table 3.B: CCC estimates of UK emissions and costs of decarbonisation by sector
Sector 2050 residual
emissions as a share of 2018 UK emissions
(%)
Average annualised
net cost (£bn)
a
Average in-year
operating cost (£bn)
Average in-year
investment cost (£bn)
Peak in-year investment cost (£bn)
Peak year
Buildings 0.2 7.3 -2.7 11.7 19.0 2028
Industry 0.5 2.2 0.5 1.8 4.1 2036
Electricity
productionb
0.2 1.6 -4.8 15.5 22.6 2034
Fuel supply 0.1 1.0 -0.3 2.5 4.6 2048
Agriculture,
land use and
land use-
change
3.0 0.3 0.0 1.3 1.9 2042
Waste &
F-gases 1.9 0.6 0.0 0.3 1.2 2023
Transportc 4.7 -1.7 -21.8 11.4 14.1 2040
Negative
emission
technologies
-10.6 2.3 0.0 0.2 0.4 2040
Source: ‘The Sixth Carbon Budget – The UK's path to Net Zero’, CCC, 2020.
a Annualised costs spread the investment costs over the lifetime of an asset and include the cost of finance. Therefore,
the sum of in-year operating and investment costs do not equal the annualised net cost.
b This row contains electricity production and network costs. The majority of network costs are related to electricity,
though a small part relates to carbon capture and storage networks used in industry, greenhouse gas removals and
hydrogen production.
c CCC estimates of residual emissions and costs include international aviation and shipping. All costs in 2019 prices.
Understanding the CCC’s net cost estimate
3.29 Forecasts over a 30-year horizon are highly uncertain. For this reason, the
CCC has produced several scenarios for how the UK might reach net zero. Their
main scenario includes a number of assumptions relating to technologies used,
technological development rates, technological adoption rates and resulting
efficiencies, and behavioural change. For example, the CCC analysis assumes a 20%
reduction in beef, lamb and dairy consumption by 2030 and a reduction up to 17%
of total car miles by 2050.
3.30 On the basis of these assumptions, the CCC produced a ‘net resource costs’
estimate, which is the additional capital and operating costs required, offset by
savings from efficiencies that may be realised. For example, if a household was to
buy a new hydrogen boiler costing A, instead of a traditional boiler costing B, the
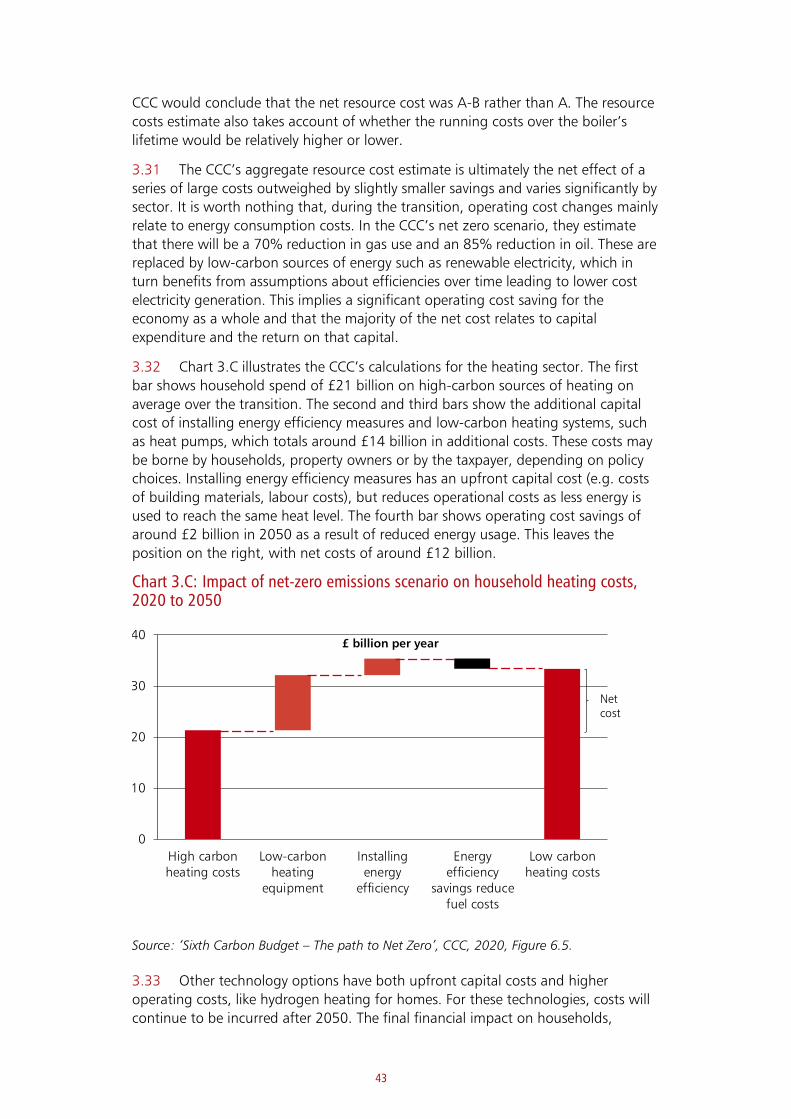
43
CCC would conclude that the net resource cost was A-B rather than A. The resource
costs estimate also takes account of whether the running costs over the boiler’s
lifetime would be relatively higher or lower.
3.31 The CCC’s aggregate resource cost estimate is ultimately the net effect of a
series of large costs outweighed by slightly smaller savings and varies significantly by
sector. It is worth nothing that, during the transition, operating cost changes mainly
relate to energy consumption costs. In the CCC’s net zero scenario, they estimate
that there will be a 70% reduction in gas use and an 85% reduction in oil. These are
replaced by low-carbon sources of energy such as renewable electricity, which in
turn benefits from assumptions about efficiencies over time leading to lower cost
electricity generation. This implies a significant operating cost saving for the
economy as a whole and that the majority of the net cost relates to capital
expenditure and the return on that capital.
3.32 Chart 3.C illustrates the CCC’s calculations for the heating sector. The first
bar shows household spend of £21 billion on high-carbon sources of heating on
average over the transition. The second and third bars show the additional capital
cost of installing energy efficiency measures and low-carbon heating systems, such
as heat pumps, which totals around £14 billion in additional costs. These costs may
be borne by households, property owners or by the taxpayer, depending on policy
choices. Installing energy efficiency measures has an upfront capital cost (e.g. costs
of building materials, labour costs), but reduces operational costs as less energy is
used to reach the same heat level. The fourth bar shows operating cost savings of
around £2 billion in 2050 as a result of reduced energy usage. This leaves the
position on the right, with net costs of around £12 billion.
Chart 3.C: Impact of net-zero emissions scenario on household heating costs, 2020 to 2050
Source: ‘Sixth Carbon Budget – The path to Net Zero’, CCC, 2020, Figure 6.5.
3.33 Other technology options have both upfront capital costs and higher
operating costs, like hydrogen heating for homes. For these technologies, costs will
continue to be incurred after 2050. The final financial impact on households,
0
10
20
30
40
High carbonheating costs
Low-carbonheating
equipment
Installingenergy
efficiency
Energyefficiency
savings reducefuel costs
Low carbonheating costs
£ billion per year
Net cost

44
businesses and taxpayers depends on government policy choices, as well as the
materialisation of costs and benefits from the rest of the transition.
Limitations of the CCC’s net cost estimate
3.34 While the CCC’s net cost estimate is a helpful guide, it remains a scenario
based on assumptions.
3.35 The CCC did not directly include all macroeconomic modelling of the wider
effects of net zero on the economy in their cost estimate31. If decarbonisation causes
the economy to grow at a slower (or faster) rate than it would have done, the
compounding effect over several decades could lead to costs (or benefits) that may
be significantly larger than the CCC’s net cost estimate in 2050.
3.36 The CCC’s net cost estimates do not include the cost of designing,
implementing and enforcing decarbonisation policies, nor the development of the
supporting skills and knowledge to create, install and use low-carbon technologies.
For example, the CCC assumes that there are no net costs associated with individuals
choosing to walk and cycle rather than to drive. However, there will be costs (and
benefits) to the individual as well as new costs to taxpayers from building new
cycling infrastructure. If new skills are not acquired, such as those required for
retrofitting buildings with energy efficiency measures, there will be supply-side
constraints that will affect growth.
31 Cambridge Econometrics provided the CCC with supporting research on the macroeconomic context of decarbonisation. See
'Economic impact of the sixth carbon budget', Cambridge Econometrics, 2020.

45
Chapter 4
Market failures and policy choices
One way to approach the problem of climate change and the transition to net
zero is by considering market failures. In this framework, climate change is
caused by market failures in the form of externalities and public goods. Those
who emit greenhouse gases do not always pay for the damage their emissions
cause, nor can they be excluded from enjoying the benefits of the climate.
Compounding the problem are market failures that hold back the adoption of
low-carbon technologies and practices, including inertia and lack of
information.
In designing policies to support decarbonisation, the government will need to
consider how best to address these market failures. Carbon pricing can be a
good way to address the negative externality and realign incentives but will
not be sufficient to achieve net zero by itself. Further measures will be needed
to address the other market failures and to manage the distributional impacts
of the transition and its effects on business competitiveness.
Decarbonisation means addressing a variety of market failures 4.1 Addressing global warming involves overcoming a series of market failures.
Perhaps the most significant of these is the negative externality driving climate
change: those who emit greenhouse gases generally do not face the full costs of
their actions, leading to increasing concentrations of greenhouse gases in the
atmosphere.1 However, the path to a net zero economy is further impeded by other
market failures that may need to be addressed to support the process of
decarbonisation.
4.2 There are three broad types of market failure:
• static price failures where market prices of goods and services do not
reflect their full cost or benefit to society. A change in prices, and a
resulting change in patterns of consumption and production, could make
society as a whole better-off. These market failures include negative
externalities, positive externalities, public goods and natural monopolies.
1 ‘The Economics of Climate Change: The Stern Review’, Nicholas Stern, Cabinet Office – HM Treasury, 2006.

46
• static non-price failures where there are appropriate price incentives, but
other constraints prevent a socially optimal outcome. This group of market
failures includes static information failures, split-incentives, inertia or
bounded rationality, property rights failures and liquidity constraints.
• dynamic failures where people make choices that appear to be
economically sensible in the short-run but leave society worse off in the
long-run. This is a particular feature of the development of new
technologies. These market failures include uncertainty and multiple
equilibria problems, relating both to coordination failures and
technological development curves.
4.3 Many sectors experience multiple market failures simultaneously. Even if a
negative externality associated with greenhouse gas emissions is addressed, other
market failures may need to be overcome to achieve net zero. For example, in the
power sector, the primary market failure is the negative externality associated with
the use of fossil fuels to generate electricity but there are also dynamic market
failures associated with the development of new technologies, and liquidity
constraints may hold back major infrastructure projects such as the construction of
new nuclear power plans. Distortions in the power sector can also affect other
sectors of the economy, potentially magnifying their impact. The Prime Minister’s
Council for Science and Technology has advised on the importance of systems
thinking in the government’s approach to decarbonisation. Annex B examines the
types of market failure in more detail and considers how they apply in different
sectors.
There are a variety of policy levers to address these various market failures 4.4 The government has a range of policy levers available to support the
transition to net zero. The main policy levers can be broken down as follows:
• Levers that change the price of emitting greenhouse gases, including
carbon pricing (through taxes or emissions trading schemes), subsidies and
regulations, which affect prices by promoting or limiting certain activities;
• Facilitative levers that change market institutions – or the rules of the game
– so that private actors are better able to decarbonise; and
• Broader public interventions, for example, through public spending or the
design of regulatory frameworks to support the transition where the
market will not.
4.5 Some of the policy levers that drive decarbonisation are reserved to the UK
government, but many are devolved to the Scottish and Welsh governments and
Northern Ireland Executive. This means that, while this report considers the role of
the UK government, some of the choices between policy levers will be for the
devolved administrations, working in collaboration with the UK government.
4.6 Some policy levers may be better suited to addressing particular types of
market failure, but the most appropriate lever will also depend on issues of
practicality and consideration of other government objectives. For example, in cases
where it is not possible to measure or target emissions directly, policies may have to
address the market failure indirectly, by targeting some proxy for emissions. Equally,

47
in cases where this is possible, it may be undesirable due to the impact certain
businesses or groups of households. This means that there may be trade-offs
between the efficiency and equity of decarbonisation policies. It may also be hard to
fully identify the wider impacts of a policy at the outset. Markets will adjust in
response to new incentives, and links between sectors may mean that policies can
sometimes introduce new distortions or perverse incentives. This further complicates
the decision-making.
Emissions pricing 4.7 Given its central role in driving climate change, addressing the negative
externality associated with greenhouse gas emissions is likely to be an important
part of any strategy to achieve net zero. One way of doing so is to attach a price to
emissions. This creates an economic incentive for households and businesses to
reduce their emissions. The government can create such a price through emissions
taxes, ETS, subsidies or even regulation.
4.8 Taxes, ETS and subsidies change the relative price of an activity but preserve
the optionality for businesses and households to change their behaviour or pay the
carbon price (or forgo the subsidy). This creates a market incentive for abatement
and can encourage innovation. The IMF suggests that an economy-wide carbon
price – implemented in the form of a carbon tax – could be more effective than
other policy levers in mobilising capital investments.2
4.9 Prohibitive regulations, in contrast to taxes, subsidies and trading schemes,
compel households and businesses to change their behaviour. This gives the private
sector less flexibility to innovate but provides more certainty that abatement will
occur and can support the development of economies of scale.
4.10 Each of these policy levers changes the cost of producing emissions, and to
some extent they can be used interchangeably to achieve the same policy objectives
(Box 4.A). However, different levers will have different distributional impacts and
implications for competitiveness. Regulations impose costs on firms and households,
but unlike taxes and subsidies, they do not result in a transfer of resources to or
from government.
4.11 The impacts of particular policies or packages of policies will depend on their
detailed design, the behavioural response of households and businesses, and the
characteristics of the market concerned, including the costs of abatement and the
availability and affordability of alternative products. For example, where a market is
competitive and trade-exposed, it is harder for firms to pass costs onto consumers,
resulting in potentially bigger impacts through wages and profits. These effects will
also evolve as technology develops and prices change over time. Chapters 6 and 7
discuss these issues in more detail.
4.12 Finally, although emissions pricing is likely to be an important component of
any policy package, it will not on its own be sufficient to achieve net zero given the
presence of other non-price market failures which can act as a barrier to private
investment.
2‘Fiscal Monitor: How to Mitigate Climate Change’, International Monetary Fund (IMF), October 2019.

48
Box 4.A: Pricing carbon emissions
Taxes, ETS, subsidies and regulations are all important policy tools to support
decarbonisation. However, they have different functions and distributional
implications.
Emissions taxes can increase the cost of greenhouse gas emissions directly or
implicitly through relative rates of indirect taxes on carbon-intensive and low-
carbon products or services. Taxes can apply to emissions, particular inputs or
outputs and can be sector-specific or more broadly applied. As well as
creating an incentive to reduce emissions, emissions taxes can spur innovation
and greener investments to reduce future tax liabilities. For example, if the tax
system allows carbon offsetting, it could help drive innovation in negative
emissions technologies.
In an emissions trading scheme (ETS) an emitter must buy a quantity of
permits equivalent to the amount of greenhouse gases they emit. The number
of permits is fixed, and the price is determined by the market for permits.
ETS and taxes are conceptually similar levers. Both provide price signals to
drive behaviour change, granting the private sector substantial flexibility on
how best to decarbonise, while raising revenue, directly or from the sale of the
permits. However, their deployment and technical specification is different.
While a tax fixes a price for emissions, an ETS fixes the quantity through a
system-wide cap. This cap on emissions can then be reduced over time to
provide confidence that the UK will mitigate its emissions to meet its net zero
target and to provide an effective, responsive price signal to drive
decarbonisation.
An alternative to increasing the price of emitting greenhouse gases is to
decrease the price of carbon abatement through a subsidy or tax relief.
Subsidies may be effective at supporting new markets to develop, helping to
manage high initial costs for producers or stimulating demand to encourage
supply chains to develop. They tend to be linked to specific actions rather than
general abatement. This may limit the incentive for firms to innovate in non-
subsidised technologies that could prove more effective. Unlike regulation or
tax, it is not possible to compel action through subsidies, as they rely on
economically rational responses and awareness of the government offer.
Additional market failures, such as inertia, may therefore affect uptake.
A subsidy is more likely to be inefficient when there is uncertainty about the
technological pathway, while a tax can encourage decarbonisation in a
technology neutral way. Subsidies may be more effective, however, where
households or firms do not have access to the money required to adopt
lower-carbon technologies or there is a risk of carbon leakage.
Regulations can ban use of certain technologies, require adoption of others or
impose standards for efficiency, packaging or the allowable level of emissions.
The feasibility depends on the complexity of the regulation, the characteristics

49
of the regulatory base, the frequency of reform and the efficiency of the
enforcement authority. The implied carbon price of a regulation is the cost of
adhering to it.
Regulations can allow government to directly drive the pace of
decarbonisation in certain sectors and set direction for innovation and
technological development by providing certainty and creating a level playing
field. This can drive large scale adoption and allow firms to generate
economies of scale. Regulations can also help ensure decarbonisation where
firms and households are not responding in the expected way to price signals.
As with subsidies, there is a risk that the government does not choose the
optimal technology and limits the scope for the private sector to innovate,
although this is less of a risk with technology neutral standards.
Indirect taxes
4.13 As well as pricing the consumption of emissions directly, the tax system,
including tariffs on imports, can be used to set additional incentives or disincentives.
For example, the Company Car Tax is designed to make it more attractive for
employers and employees to choose cars with the lowest carbon dioxide emissions.
4.14 Indirect taxes can also target activities with emissions as a by-product. For
example, Landfill Tax aims to divert waste away from landfill, one of the main
sources of emissions from waste, to more environmentally friendly alternatives. Since
2000, Local Authority waste going to landfill in England has fallen by 87%, with an
associated reduction in emissions.
Facilitative levers 4.15 Facilitative levers seek to change the structure of the market or the way
people make decisions in order to make it easier for households and firms to choose
low-carbon options. These levers can complement carbon pricing by addressing the
other market failures that hold back the process of decarbonisation. This can lower
the overall costs of the transition, change who pays and who is able to cover the
necessary costs.
• Leadership: Government leadership in decarbonisation can range from
political commitments to environmental requirements for government
procurement decisions. Such interventions can provide direction and
certainty for the private sector, supporting innovation, driving cost
reductions and creating opportunities for firms that have already adopted
low-carbon methods. It can also help nudge public attitudes towards
greener behaviours by setting greener default options in public buildings,
for example. UK leadership in multilateral fora, including through our
COP26 and G7 Presidencies, can encourage international action to reduce
emissions. Government coordination domestically and internationally can
reduce the cost to the UK of reaching net zero by spreading the cost and
risk associated with innovation, driving economies of scale and by helping
to facilitate collaboration.

50
• Awareness: Measures to improve information about low-carbon choices
can help drive consumer and producers towards alternative products.
Examples include information and educational campaigns; government
advice centres and online support services; and mandating improved
labelling to help drive consumer and producer choices towards low-carbon
alternatives. They usually come at low fiscal costs and can increase
businesses’ accountability to consumers for their emissions. However, they
can come with high compliance costs for businesses.
• Capability: New skills, technologies and ideas will be needed to reach net
zero. This may require training programmes, development of new financial
products to facilitates the investment required for net zero, and support for
innovation to help the development of green products. This latter is
discussed further in Chapter 5.
Direct public interventions 4.16 Further government intervention can be required where carbon pricing and
the facilitative levers described above cannot resolve all the market failures holding
back the transition. This is particularly likely in the case of public goods and
infrastructure or where new markets are needed for net zero. These interventions
can include:
• support for innovation and the development of new technologies;
• regulation of utilities and other sectors with risks of monopoly power;
• support for development of new markets. For example, the government is
providing support for electric vehicle charging infrastructure to help
develop a viable private market; and
• delivery of large capital investment and infrastructure. As set out in the
National Infrastructure Commission’s National Infrastructure Assessment,3
government can absorb risks by providing a proportion of the initial capital
funding, crowding in private investment.
4.17 There are various risks associated with government intervening in this way,
principally that it will misallocate resources. Actively developing new markets
through public spending or regulation runs the risk of locking in technology that
turns out to be less cost effective in the long run. However, such interventions may
be necessary to guarantee an adequate pace to meet the 2050 target. The
distributional impacts of these policies depend on the users of the infrastructure or
innovation supported and the opportunity-cost of public funds.
Adjustments to existing policies 4.18 Existing policies may not be aligned to net zero, as government must
balance multiple priorities. Small changes to existing schemes can improve incentives
for decarbonisation across the economy with lower policy costs, though potentially
at the cost of making existing schemes more complicated or compromising other
policy aims.
3 ‘National Infrastructure Assessment’, National Infrastructure Commission, July 2018.

51
Chapter 5
Innovation and private finance
The majority of the technologies needed to meet net zero already exist, but
many need further development to become cost competitive and be proven at
scale. Developing and deploying these technologies requires investment, much
of which will come from the private sector, but the uncertainties associated
with novel technologies can make it difficult to raise finance. Government can
help increase certainty and reduce the cost of capital but may also in some
cases want to provide more direct support.
Technological change will be an important factor in reaching net zero 5.1 Many of the technologies required to meet net zero already exist, but it is
not yet clear which will be the most appropriate or cost effective, or which will
provide the biggest opportunities for economic growth. Several important
technologies are not yet proven at scale or cost competitive. Further technological
developments could also create cheaper, or more efficient, technologies than those
that are currently available.
5.2 This development process needs to happen rapidly. It can take many years
for scientific discoveries to lead to the creation of a new product and even longer for
the product to reach the point where it can be widely deployed. For example, as
shown in Chart 5.A, it took over 50 years for solar photovoltaic (PV) technology to
reach mass deployment following its invention. Any new technologies will need to
be developed and deployed at a faster rate than solar PV if they are going to
contribute to the UK reaching net zero by 2050.
5.3 Such a transformation is possible. Advances in digital technology over the
last 30 years illustrate the potential for innovation over a similar period. Net zero
technology could make similarly rapid advances in the next 30 years, especially in an
environment that supports innovation and investment.
5.4 Government can play an important role in creating this environment and
helping to accelerate the net zero transition. Policy certainty can increase the viability
of private sector investment and speed up the deployment of net zero products.
Government leadership can also help address dynamic market failures in the
transition, particularly in guiding and creating new markets.
5.5 As an early mover to decarbonisation, the UK is well-positioned to leverage
innovation and generate export opportunities. Estimates suggest innovation

52
opportunities could drive £27 billion in Gross Value Added (GVA) through domestic
economic activity and £26 billion through exports by 2050.1 The largest export
opportunities could be in road transport, carbon capture usage and storage (CCUS),
smart systems and offshore wind,2 with export opportunities for the UK at different
stages of the supply chain. Box 5.A sets out in more detail some of the opportunities
for innovation. Government policy and decisions on innovation could shape where
these opportunities will occur over the next decade.
Box 5.A: Innovation opportunities
Offshore wind has developed rapidly in the last decade and the UK has
established itself as a world leader in its adoption. The large domestic market
for offshore wind in the UK provides a strong platform for the UK to increase
its share of the European and global market.
With innovation, the UK could gain first mover advantages in areas such as
operations and maintenance (O&M) services and floating platforms. Analysis
commissioned by BEIS estimates that by 2050 O&M and decommissioning
services could become a £53 billion market. Offshore wind exports could
support 21,000 jobs and £2.4 billion GVA per year,3 including exports of
specialised turbine parts to Europe worth over £0.4 billion per year.4
In recognition of these opportunities, the Prime Minister announced on 18
November 2020 the government’s aim to quadruple the capacity of offshore
wind in the UK to 40GW by 2030. The government has made available £160
million to upgrade ports and infrastructure in places like Teesside and the
Humber in order to support the industry’s growth, and advances in offshore
wind such as these could support up to 60,000 jobs in 2030.
Greenhouse gas removal technologies: The CCC estimates that 58MtCO2 per
year will need to be captured and stored in 2050 by new greenhouse gas
removal (GGR) technologies such as direct air capture and storage of CO2
(DACCS).5
DACCS requires supporting infrastructure such as carbon capture, utilisation
and storage (CCUS) which presents a potential growth and export opportunity
for the UK. Analysis commissioned by BEIS estimates that the UK could
capture £4.3 billion of GVA from exports by 2050 as the global CCUS market
expands to an estimated 6,800 MtCO2 captured annually.6
1 ‘Energy Innovation Needs Assessment: Overview Report, Department for Business Energy and Industrial Strategy (BEIS), 2019, p25.
This analysis was carried out before the UK’s net zero target was agreed and is therefore based on an 80% emissions reduction
target by 2050.
2 Ibid, p21.
3 ‘Energy Innovation Needs Assessment: Offshore Wind’, BEIS, 2019, p7.
4 Ibid, p50.
5 ‘The Sixth Carbon Budget: The UK’s path to Net Zero’, The Climate Change Committee (CCC), 2020.
6 ‘Energy Innovation Needs Assessment: Carbon capture, utilisation and storage’, BEIS, 2019.
53
As these technologies are in the early stages of development the costs are
high and the cost trajectory is unclear, but they have the potential to fall with
a supportive policy environment. The government’s £100 million GGR
innovation fund will support research and development of these technologies,
alongside the Prime Minister’s announcement on 18 November 2020 of up to
£1 billion of investment to support the establishment of CCUS in four
industrial clusters in the UK and an ambition to capture 10 Mt of CO2 a year
by 2030.
Innovation will require significant investment 5.6 Significant investment will be required to reach net zero. Estimates suggest
that in order to deploy renewables at the speed required, annual global investments
in renewable energy would need to increase from approximately $330bn in 2018 to
close to $740bn in 2030.7 In the UK, this investment has already started, with more
than £92 billion invested in clean energy since 2010.8 The UK’s world-leading
financial, legal and technical advisory services sector is well-placed to support further
investment, particularly as new technologies emerge and create further
opportunities.
5.7 The financial services sector is increasingly recognising the investment
opportunities associated with the transition to net zero. In 2020, 38% of assets
managed in the UK integrated environmental, social and government factors into
their investment selection process, up from 26% in 2019.9 In response to this
growing investor demand, the UK government announced that it will issue its first
Sovereign Green Bond in 2021, subject to market conditions, and its intention to
issue a series of such bonds to build out a green yield curve in the future. These
bonds will help finance projects that will address climate change, finance much-
needed infrastructure investment and create green jobs across the economy. UK
Sovereign Green Bonds will also provide a benchmark for the finance sector, which
will help stimulate the UK’s domestic green bond market.
5.8 Risk aversion, overvaluation of carbon-intensive activity and a failure to take
account of the environmental impacts can still hold back the flow of private finance
into net zero investments. This is in part because there is currently no consensus on
the definition of net zero-aligned investments, differing data standards and various
methods for evaluating climate-related risks. The Green Finance and Clean Growth
Strategies set out the government’s approach to overcoming these problems, and
an objective of COP26 will be to ensure that climate change is factored into every
financial decision.
5.9 When firms market and leverage finance that is said to be green, it is
important that it is clear to everyone what that means and exactly why they define it
in this way. To improve understanding of the impact of firms’ activities and
investments on the environment and support the transition to a sustainable
economy the UK is implementing a green taxonomy – a common framework for
determining which activities can be defined as environmentally sustainable. The clear
7 ‘10 Years Progress to Action’, International Renewable Energy Agency (IRENA), 2020.
8 ‘The good, the bad and the ugly in the UK’s green finance crusade’, Solar Power Portal, J. R. Martin, 2019.
9 ‘Investment management in the UK 2019-2020’, The Investment Association Annual Survey, September 2020

54
and transparent disclosure of climate change risk and the impacts of economic
activities on the environment can further help financial institutions, policy makers
and consumers to consider these factors in their decision-making. Box 5.B. explores
climate risk disclosures in more detail while the rest of this chapter considers risk
aversion.
Box 5.B: Climate risk disclosure
Accurate disclosure is crucial to ensuring that financial markets can
appropriately price risk to support informed and efficient capital allocation.
Climate change presents material financial risks and opportunities to the
financial system and real economy, making climate-related financial
disclosures particularly important for a smooth transition to a lower-carbon
economy.
The Task Force on Climate-related Financial Disclosures (TCFD) was established
by the Financial Stability Board in 2015 and published recommendations
forming a framework for disclosing the financial risks and opportunities posed
by climate change in 2017.
The UK government is highly supportive of the TCFD’s framework and, in
November 2020, announced its intention to make TCFD-aligned disclosures
mandatory in the UK across the economy by 2025, with a significant portion
of mandatory requirements in place by 2023.
Climate risk extends beyond national borders, and internationally agreed
standards are needed to achieve consistent and comparable reporting. The UK
government has also welcomed the International Financial Reporting
Standards (IFRS) Foundation Trustees’ consultation on a global approach to
sustainability reporting.
Risk and uncertainty can push up the cost of capital 5.10 Investing in new technology always carries risk, but lack of certainty about
the future path of government policy can exacerbate these risks in the context of net
zero. This in turn can push up the cost of capital, requiring higher returns in order
to justify the investment.
5.11 These risks are particularly acute at the early stages of development, where
technologies have not been proven or widely tested. As technology reaches
commercial maturity, traditional investors may feel more confident about likely
returns and the cost of capital should fall.
5.12 The UK is also affected by how other countries approach decarbonisation.
Many countries have now adopted legally binding targets or policy ambitions for net
zero emissions or carbon neutrality, including France, New Zealand and China. As
decarbonisation progresses across the world, there will be a global effort to
innovate, spreading risk more widely and reducing the cost.

55
The government can help to reduce uncertainty 5.13 Clear government policy signalling, and stability in decision-making, can help
reduce risk for investors. This can make it easier for the private sector to justify
investment in emerging technology. This section looks at technology policy and how
the government can provide signals about the timetable for reaching net zero and
wider decarbonisation policy.
Signalling technology policy under uncertainty
5.14 Chapter 4 considered the government’s role in addressing the market failures
that are driving climate change and holding back the transition to net zero. How
government approaches these policy decisions affects the returns that investors in
emerging technologies might see.
5.15 Government decisions about infrastructure and the UK’s future energy
system are particularly important for emerging technology investors. Government
can help to increase certainty for investors by sending clear and timely signals about
how and when it will take these decisions. This can help reduce the cost of capital.
5.16 Table 5.A sets out one way of thinking about the different levels of
uncertainty involved in the development of technologies for net zero:
• Level 1 describes a situation where technology has been proven to work,
market institutions are well established and the technology is usually
commercially viable, such as solar or wind energy.
• Level 2 uncertainty exists where there are a small number of known
possible pathways, such as the choice between hydrogen or electricity for
heating buildings. Hydrogen heating would require repurposing the
existing gas grid to carry hydrogen instead of natural gas and deployment
of hydrogen boilers, which are currently in only early stages of
development and yet to be proven at scale. Using electricity would mean
the rollout of heat pumps or heat networks, with a high capital cost.
• Level 3 applies to technologies whose use is more uncertain and which are
not currently commercially viable. For example, greenhouse gas removal
(GGRs) technologies that are still being developed. The degree to which
GGRs will be used in 2050 to meet net zero depends on how quickly these
technologies develop and how far costs fall.
• Level 4 describes technologies that have not yet been invented and
therefore true ambiguity exists.

56
Table 5.A: Technology and innovation uncertainty framework
Level of technological uncertainty
Level of market uncertainty
Example Implications
Level 1: Clear-enough
future
Are commercially
viable
Solar, wind,
electrification of cars
and vans.
Proven technologies
with some uncertainty
in costs
Decisions can be taken
now
Level 2: Alternative
futures
Not necessarily
commercially viable,
but successful pilots
Hydrogen v mass
electrification
Technologies unproven
at scale, or options
between alternatives
Action needed to
prove technical
feasibility and enable
cost reduction before
decisions can be taken
Level 3: Range of
futures
Not yet commercially
viable
Some greenhouse gas
removal technologies
Unproven technologies
that could affect
decarbonisation
choices in other
sectors over the next
30 years
Action needed to
support innovation
before investment
decisions can be taken
Level 4: True ambiguity Pure uncertainty of
what the market
would look like
New game-changing
technology
Unknown unknown
Certainty needed to
provide a basis on
which economic actors
may invest and
develop technology
Source: ‘Strategy Under Uncertainty’, Harvard Business Review, H. Courtney, J. Kirkland, P.
Viguerie, November-December, 1997.
5.17 As technologies develop, certainty increases and they move away from level
4 towards level 1. Chart 5.A shows how the solar panels have moved through this
process over the last 60 years.
5.18 Grouping net zero technologies in this way and using this as an organising
framework is one way for the government to explain its approach and provide
information on how it will make future decisions. If used well, approaches such as
these can help ensure signalling is consistent, transparent and timely, which in turn
can help the private sector make investment decisions. This is consistent with the

57
general approach outlined in Technology Readiness Levels frameworks, which can
be used in more specific, project-by-project innovation settings.10
Chart 5.A: Solar’s progression through uncertainty levels
Source: ‘How Solar Got Cheap’, Nemet, 2019.
Providing certainty over the timetable
5.19 Government clarity on the pace and timetable for decarbonisation can also
help businesses align their investment and planning decisions with the net zero
target. This is particularly important given the rapid pace of change required
compared to past energy transitions. However, identifying the appropriate moment
to accelerate the transition and implement new technologies requires careful
assessment and balancing of risk and opportunity.
5.20 A transition that is left too late or is not sufficiently well communicated
could see businesses continuing to invest in high-carbon technologies beyond when
would be consistent with achieving net zero. This could lead to stranded assets as
these technologies would have to be decommissioned before their natural end of
life. It could also increase costs, as low-carbon technologies have to be deployed
quickly near the end of the transition. This also increases delivery risk, as there may
not always be sufficient numbers of people with the right skills to install the
required equipment.
10 ‘Science and Technology Committee – Second Report: Technology and Innovation Centres’, House of Commons, February 2011,
Annex 1.
Solar battery first invented.
1954
US commissioned first commercial use of PV in satellites. Creation of a niche market.
1950s-1970s
Japan invested in finding commercial uses for PV technology and rooftop subsidy scheme- created niche markets.
1980s-1990s
Germany: demand for PV increased. In China: start-ups emerged in response to this demand, leading to production rises and falling costs.
2000sLevels of tech uncertainty
Level 1. Clear-enough future
Level 2. Alternate futures
Level 3. Range of Futures
Level 4. True ambiguity

58
5.21 Moving early may enable the UK to develop a first-mover advantage in
important technologies, creating export and growth opportunities. On the other
hand, deploying technology at an early stage, before there is sufficient learning-by-
doing to bring costs down, may mean missing out on some of the benefits of falling
costs and could lock in an inferior technology.
5.22 The UK uses carbon budgets to set out the profile for its transition. These set
legal limits on UK greenhouse gas emissions over 5-year periods and are set 12 years
in advance in order to provide long-term guidance to investors. Stability in
commitments has been highlighted as important for setting expectations of
investors and supporting the effectiveness of decarbonisation efforts.11 To achieve
net zero by 2050, the government will need to consider how best to provide signals,
in line with asset replacement cycles, to guide business decisions.
Stability in the regulatory and tax environment
5.23 A further way government can increase market confidence is through
transparency and stability in energy network industry regulation and setting of wider
decarbonisation policy.
5.24 Stability in economic regulation of the electricity sector is a particularly
important area given the importance of innovation in the power sector. The
government is committed to the model of independent economic regulation, which
supports the transparency and stability required to allow investment. The framework
will continue to evolve to facilitate the investment required for net zero, and the
National Infrastructure Commission’s (NIC) 2019 report on regulation of the UK’s
energy, telecoms and water industries sets out how this might happen.12 The
government published its response to the NIC’s recommendations alongside further
detail on its plans to decarbonise the UK’s infrastructure networks in the National
Infrastructure Strategy.13
5.25 How government sets medium to long term product regulation and creates
tax certainty can also increase market confidence and provide stability for businesses
to make investment decisions. Measures could include clear phase-out and phase-in
dates for technologies, with long notice periods, and a clear regulatory framework
for a market in negative emissions to support the commercialisation of these
technologies. Some commentators indicate that medium-term certainty on carbon
pricing and its trajectory, along with other tax policies further strengthen the policy
signals for the private sector, helping to guide the timing of investment.14 The final
report will explore these issues further.
The government can manage and share risk 5.26 Greater certainty over sectoral and in some cases technology policy will
provide investors with greater confidence at different stages of the innovation cycle,
from research and development to deployment. However, this may not always be
sufficient to overcome the barriers to private sector investment. In some limited
11 ‘Four decades of multiyear targets in energy policy: aspirations or credible commitments?’, Wires Energy and Environment, G.
Nemet, P. Braden, E. Cubero and B. Rimal, March 2014.
12 ‘Strategic investment and public confidence’, National Infrastructure Commission, October 2019.
13 ‘National Infrastructure Strategy’, HM Treasury, 25 November 2020.
14 ‘Innovation: Government’s Many Roles in Fostering Innovation’, Price Waterhouse Coopers, January 2010.

59
cases, the government may need to provide greater support. This will particularly be
the case for new and innovative technologies, where returns are unclear, pushing up
risk and therefore financing costs. This could make projects unviable in some cases.
Government intervention to share risks can help make the remainder of the project
viable for the private sector.
Reducing revenue and financing risk
5.27 One way the government can share risk is by guaranteeing loans. For
example, the UK Guarantees Scheme (UKGS) supports private investment in
nationally significant UK infrastructure projects. The UKGS works by offering a
government-backed guarantee to help infrastructure projects access debt finance
where they have been unable to raise finance in the financial markets. It has issued
£1.8 billion of guarantees over 7 years (10 approved guarantees), averaging around
£250 million per year since 2012 in benign market conditions.
5.28 Government can also regulate to reduce the revenue risk for the private
sector. This can be appropriate where the risk or high upfront costs associated with
some projects cannot be financed by the private sector without intervention. Such
interventions can help diversify risks and costs, both within and across generations.
Two examples of this are the Contracts for Difference (CfD) schemes and the
Regulated Asset Base (RAB) models, which create stable returns for investments
through levies on consumer energy bills, as outlined in Box 5.C. A number of other
social and environmental policies are also part-financed through electricity bills,
including the Warm Home Discount to provide support to low income households
and the Energy Company Obligation, which helps fund the installation of energy
efficiency measures, particularly focused on fuel-poor households. Chart 5.B shows
the changing make-up of a dual fuel (electricity and gas) bill.
5.29 While the implementation of social and environment policies have placed
additional costs on consumer bills, the overall domestic bill has fallen since 2013,
largely due to improved energy efficiency and lower wholesale prices, while also
ensuring security of supply. Over the long term the make-up of electricity bills is
likely to continue to change, as the transition leads to an increasing proportion of
renewables in the energy mix. These generally have higher up-front capital costs, but
lower running costs than fossil fuel-based production. The next stages of the review
will consider in more detail the implications of passing costs through energy bills;
including distributional and behavioural implications.

60
Chart 5.B: Domestic dual fuel energy bill breakdown
Source: ‘Large suppliers: Domestic dual fuel bill breakdown over time’, Ofgem, 2020.
Box 5.C: Business models for electricity decarbonisation
The UK has significantly decarbonised its electricity system, reducing emissions
by over 50% since 2010.15 Renewable electricity sources such as solar and
wind generated 37% of the UK’s electricity in 2019,16 but these are relatively
recent technologies, and volatile energy prices risked making private
investment unviable when they remained unproven. The government has used
two private finance models to overcome this.
Contracts for Difference
The Contracts for Difference (CfD) scheme has been the government’s main
mechanism for supporting low-carbon electricity generation. The scheme was
introduced to protect developers of large-scale renewable projects from
volatile market prices. Developers are paid a price agreed through a
competitive auction for the electricity they produce over a 15-year period. By
guaranteeing prices and providing revenue support for generators of
renewable projects, CfDs aim to attract more affordable private finance into
the sector. While this has not required any direct action from consumers,
consumers have paid for the transition through their energy bills. When the
agreed price exceeds the average market price, consumers pay the difference
to the generator. The scheme is designed to keep total costs down for
consumers. The Control for Low Carbon Levies (CLCL) sets the overall envelope
15 ‘Final UK greenhouse gas emissions national statistics: 1990 to 2018’, Department for Business, Energy and Industrial Strategy
(BEIS), 2020.
16 ‘UK Energy Statistics, 2019 & Q4 2019’, BEIS, 2020.
-200
0
200
400
600
800
1,000
1,200
1,400
2009 2010 2011 2012 2013 2014 2015 2016 2017 2018 2019
£
Wholesale costs Network costs
Direct costs Environmental/social policy costs
Other direct costs Operating costs
EBIT VAT

61
for each auction, and CfD contracts do not require a difference payment to be
made when electricity prices are negative for six consecutive hours or longer.
Regulated Asset Base
The Regulated Asset Base (RAB) is a widely used economic regulation model
typically applied for monopoly infrastructure assets such as water, gas and
electricity networks. A company receives a licence from an independent
economic regulator, which grants it the right to charge a regulated price to
users through their bills in exchange for provision of the infrastructure in
question. An independent regulator (such as Ofgem) sets the charge and
holds the company to account to ensure expenditure is in the interests of
consumers. The structure has facilitated significant investment from the
private sector over the last 20-30 years, lowering the cost of services and
increasing quality for customers.
Supporting private investment through these models has been successful in
securing private finance and bringing down overall costs very rapidly. The
price of offshore wind projects has fallen from £114.39/MWh in the 2015
CfD17 auction to just £39.65/MWh in last year’s auction (in 2012 prices).18
However, in some countries financing the costs through energy bills has been
highly regressive, as lower income households spend a higher proportion of
their incomes on energy.
Direct support for early stage innovation efforts
5.30 Where uncertainty is at its highest and it is not possible to accurately assess
risk, government action to reduce financing and revenue risk may still be insufficient
to secure private investment. The government may need to support innovation
directly, for example by funding research and development or by taking some of the
equity risk directly onto the government’s balance sheet. For early-stage
technologies, particularly in the research and development stage, the government
can provide capital funding to help the project get off the ground where financing
constraints may be a barrier.
5.31 This direct support can help overcome the initial risks, make the project more
commercially viable and help to crowd in private investment. The European
Investment Bank and UK Green Investment Bank acted in this role for offshore wind
projects like the Galloper wind farm. The framework outlined in Table 5.A can be
used as a tool by government to consider possible gaps in the innovation ecosystem
which may require direct support.
However, government may not always be best placed to identify potentially
successful projects. Careful governance around such schemes are required in order
to maintain credibility of decision-making.
17 ‘Breakdown Information on CfD Auctions’, Department of Energy and Climate Change (DECC), 2015.
18 ‘Contracts for Difference Allocation Round 3 results’, BEIS, 2019.

62
Chapter 6
International competitiveness and net zero
The transition to net zero will involve significant structural change in the UK
economy. Sectors will be affected in different ways, depending on the cost of
abatement and their exposure to international markets. Where trading
partners do not pursue similar policies, some activities could become less
competitive. Some businesses might choose to move to jurisdictions with less
stringent climate change mitigation policies.
Evidence of carbon leakage to date is inconclusive, but as the UK adopts more
ambitious initiatives to reduce its emissions, the risk of carbon leakage could
increase without sufficient international and domestic mitigating action. Any
action on competitiveness and carbon leakage risks needs to be balanced with
the efficiency of policy at driving climate mitigation and that policy’s
distributional implications and feasibility.
Climate policy can affect international competitiveness 6.1 The competitiveness of any sector, and the economy more broadly, depends
on a wide range of factors including: the ability of the labour market to match
people and jobs effectively; the level of skills in the workforce; accumulation of
capital; market size and openness to trade; access to finance; the quality of physical
and technological infrastructure; and the effectiveness of the regulatory, public and
legal institutions at creating a stable operating environment.
6.2 Climate change mitigation policies could also affect a sector’s
competitiveness, for example by placing additional costs on certain activities
through regulation. Even countries that have climate policies of a similar level of
overall ambition might use different approaches to suit their local circumstances.
This means that the profile of climate change mitigation policies and the
requirements on different sectors at any given time will differ between countries,
with potential implications for competitiveness.1
1 For the purposes of this review, we define competitiveness as, “the capacity and ability of a firm or sector to gain and maintain a
profitable, sustainable market share relative to rivals in domestic and international markets.” This firm or sector-specific definition
of competitiveness is useful as it recognises the dynamics of competitiveness over time and defines it in terms of outcomes and
follows ‘UK Business Competitiveness and the Role of Carbon Pricing: An assessment of the determinants of business
competitiveness and the role of carbon pricing policy in the UK’, Department for Business, Energy and Industrial Strategy (BEIS),
April 2020.

63
6.3 Nevertheless, climate policy is just one factor in determining business
competitiveness, and it is challenging to assess whether and how far
competitiveness might be affected as a result of climate policies alone. Different
countries’ economies have different structures and are constantly changing, with
new companies and sectors emerging and others declining. Production can shift
from one jurisdiction to another for a wide range of reasons. Disentangling these
effects from the impact of differences in climate policies can be difficult.
Losses in competitiveness can result in carbon leakage 6.4 Loss of competitiveness caused by climate mitigation policies can result in
carbon leakage. This occurs when policies designed to reduce emissions in a given
country affect the competitiveness of its businesses relative to international
competitors that are subject to weaker climate change mitigation policies. This can
undermine the effectiveness of mitigation policy if, for example, production moves
to a country with a more carbon intensive energy because the net effect may be
higher global emissions overall. There could also be economic costs for the country
from which production moves including a loss of employment in affected sectors.2
Channels 6.5 There are three main channels by which leakage can occur.3 The first and
second are the focus of this chapter:
• In the short run, competitiveness falls because businesses in the jurisdiction
with more ambitious emission reduction policies face higher costs. These
costs cannot be passed on entirely to consumers without a loss in demand
causing a drop in output, either because of lower sales in the domestic
market, or lower exports;
• Over the medium to long run, differences in the strength of emissions
reduction policies could influence investment decisions, resulting in a shift
in production to other jurisdictions relative to what would otherwise have
been the case;
• A reduction in demand for fossil fuels due to mitigation policies in some
countries could reduce international fossil fuel prices relative to where they
would otherwise have been without those policies. This could incentivise
businesses in other countries to increase their consumption of fossil fuels.
Establishing carbon leakage 6.6 A loss of competitiveness from climate policy only results in carbon leakage if
the following three conditions are met:
• Carbon mitigation policies, such as the carbon price or regulations, are not
similar across countries;
• Emissions shift to a region with lower-carbon mitigation obligations.
Carbon leakage occurs if emissions, along with production and
2 ‘Carbon Leakage: Theory, Evidence and Policy Design’, World Bank Group, October 2015.
3 ‘Business competitiveness in industrial sectors and the role of carbon pricing policy in the UK’, BEIS, 2020.

64
employment, decrease in the region covered by mitigation policies and
increase in the region with less stringent policy. For example, carbon
leakage has not occurred if carbon pricing reduces a sector’s output
because its goods become more expensive, but the production is not
replaced by international firms;
• Production shifts to a firm with higher emissions intensity. If production
moves to a firm with lower emissions intensity and global emissions
decrease as a result, it is not carbon leakage.
6.7 Although trade can provide a conduit for carbon leakage, it plays an
important positive economic role. Trade is central to developing and sustaining
livelihoods in the UK and across the world, including in poorer countries,
encouraging production where it is most efficient, giving consumers choice and
lower prices.
6.8 Shifts in trade patterns can be misconstrued as carbon leakage if not
properly considered in context. For example, trade flows may be affected by short-
term shocks. Under such circumstances, it is important that supply chains are as
responsive as possible, whether the shock is an unexpected spike in demand for
personal protective equipment as seen this year, or a hit to supply, for example, the
impact of a drought on domestic cereal production, reducing exports or
necessitating increased imports. Agricultural trade is particularly important for
channelling food from areas of surplus supply to food-deficit countries. These food
security benefits of trade are likely to grow as climate change generates increasingly
frequent and significant supply shocks.4
6.9 At the same time, international trade can exacerbate pressures on
insufficiently protected areas that are critically important from an environmental
perspective because of their roles as carbon sinks and biodiverse habitats. This is
particularly true for agricultural trade. Apart from increasing the level of regulatory
protection and enforcement for such sensitive areas, pressure on these areas can
also be reduced through improvements in agricultural productivity internationally
and changes in patterns of global aggregate demand, as illustrated by Box 6.A.
Box 6.A: Agriculture
Aggregate global agricultural demand and its rate of growth affect the degree
to which global production is incentivised to expand. Any such expansion is
generally achieved by a combination of an intensification of production on
existing agricultural land and bringing new land into production. Both are
associated with increased emissions and impacts on biodiversity, whether due
to increased applications of fertilisers associated with emissions of nitrous
oxide (a potent greenhouse gas) or because of deforestation or other forms of
land use change that turn important carbon sinks into sources of emissions.
4 A further point relates to the multiple uses to which agricultural land can be put, which can complicate assessments of carbon
leakage. For example, changing production patterns may see a contraction in output in one arable crop, but also the expansion in
the production of other crops. This raises a question about how those different impacts are traded-off in any assessment of
carbon leakage.

65
As a result, emissions per unit of production at the margin may be
substantially higher than the average.
This means that whether and how fast international demand for agricultural
products expands, especially if it is quicker than the rate of global agricultural
productivity growth on existing farmland, will affect the incentives for
agricultural practices (such as land use change) that disproportionately affect
the emissions intensity of agricultural production. This puts a premium on
improving the rate of agricultural productivity growth on land that is already
farmed. This can be achieved in part through technological developments and
investment in human capital, but also by ensuring that agricultural land and
credit markets function well, so that land is farmed and managed by those
best placed to make most effective use of available land. Modest changes in
consumption patterns internationally can also, in principle, yield
disproportionately beneficial results.
For example, OECD modelling considers a scenario whereby a productivity
improvement of 10% by 2030 is achieved globally across all agricultural
production.5 The benefits of such productivity improvements are partly offset
because improvements in productivity increase output and reduce prices,
stimulating increased consumption relative to the baseline. The overall result is
a net reduction in direct global agricultural emissions of 340 MtCO2e in
2030.6
The same OECD modelling also considers a scenario whereby the global
average per capita consumption internationally of ruminant products
(specifically beef, sheep meat, butter, cheese, fresh milk and milk powders)
gradually reduces so that in 2030 it is 10% lower than 2017 levels. The
scenario also assumes that the consumption of non-ruminant products
increases by the same proportion, with per capita consumption of calories left
unchanged. Under this scenario, international direct greenhouse gas emission
savings from agriculture (not counting any savings from avoided land use
change) amount to 0.9 GtCO2e per year in 2030.
The risks of carbon leakage vary by sector 6.10 Some businesses could lose competitiveness as costs associated with the
need to decarbonise in their sectors increase. Others could gain as new
opportunities emerge to sell low-carbon products in the UK and internationally. The
precise impact on businesses will be influenced by the extent to which policy is used
to mitigate competitive impacts and enhance opportunities. This means that the net
impact on UK businesses of transitioning to net zero is unclear.
5 ‘Enhancing Climate Change Mitigation through Agriculture’, Organisation for Economic Cooperation and Development (OECD),
2019.
6 Over the period 2007-2016, agriculture directly resulted in approximately 12% of global anthropogenic GHG emissions (6.2 +/-
1.4 GtCO2eq) as well as a further 9% of GHG emissions globally each year (4.9 +/- 2.5 GtCO2eq). ibid.

66
Some sectors will be less exposed 6.11 In some sectors, the transition to net zero should have limited to negligible
impacts on competitiveness, irrespective of the level of mitigation ambition overseas.
This could be because the transition imposes limited obligations on those sectors.
For example, wages make up the vast majority of costs in the business services
sector and are not affected directly by mitigation requirements.
6.12 Sectors that face high trade costs, or where additional costs for domestic
producers can be passed through to consumers, will be less vulnerable to
competitiveness effects than sectors that are subject to various trade pressures. For
example, only 3% of cement produced globally is traded, largely between close
neighbours, as its low value to weight ratio makes it uneconomic to transport large
distances.7 In most cases, mitigation costs affecting the cement industry as a whole
are likely to be passed on to consumers of construction.
6.13 Finally, sectors where international competitors face similar obligations to
reduce emissions, or where increased costs due to mitigation are either low or
temporary, could also expect little or no change in business competitiveness.
Highly traded emissions-intensive goods 6.14 As the UK moves to net zero, producers of emissions-intensive goods may
face higher mitigation costs and therefore experience a loss of competitiveness if
they are exposed to competition from foreign firms in domestic and international
markets. Examples might include the metallurgical and mineralogical sectors.
6.15 In these sectors, climate change mitigation policies could increase unit costs
of production. In the short run, this will affect UK businesses’ competitiveness
negatively if these businesses’ trading partners do not experience similar pressures.8
The size of the impact will depend on the cost of the policy to the business relative
to the size of the competitiveness advantages.
6.16 Equally, policies that have an initial negative impact on competitiveness
could spur innovation, increase productivity and create demand for low-carbon
products. Where the UK moves first, this could create opportunities for UK
businesses who are early adopters of low-carbon practices or who develop low-
carbon technologies. The companies would need to be strong enough to withstand
short-run pressures in order to see the medium to long-run benefits.
Mitigating options 6.17 There is limited evidence that climate change policies have caused significant
carbon leakage to date, or whether, and to what extent, carbon pricing is associated
with a loss of competitiveness.9 This lack of evidence may be explained by, for
example, subsidies that have mitigated any competitiveness impact that could have
arisen from full exposure to carbon pricing.
6.18 Historically, the UK’s approach to addressing carbon leakage and
competitiveness concerns has been to pay compensation to energy-intensive sectors
7 HM Treasury calculations based on UN COMTRADE and the US Geological Survey.
8 ‘Carbon leakage prospects under phase III of the EU ETS’, Vivid Economics, June 2014.
9 ‘Competitiveness impacts of carbon policies on UK energy-intensive industrial sectors to 2030’, Climate Change Committee (CCC),
April 2017.

67
for the pass-through costs of the EU Emissions Trading System (EU ETS) and Carbon
Price Support and to shield trade-exposed industries from the carbon price under
the EU ETS through free allowances. This approach has targeted sectors most at risk
of carbon leakage and limited the difference in carbon pricing levels internationally.
Some sectors, such as domestic agriculture, have not been the subject of emission
mitigation obligations to date.
6.19 The government is committed to using its role hosting the UN Climate
Change Conference and presidency of the G7 next year to catalyse ambitious global
action to tackle climate change. The government is also providing targeted support
to help key sectors transition. For example, the £315 million Industrial Energy
Transformation Fund will help energy intensive industries invest in energy efficiency
and decarbonisation measures. In addition, the £1 billion Carbon Capture and
Storage Infrastructure Fund and the £240 million Net Zero Hydrogen Fund will play
a key role in building shared infrastructure that will help key sectors to decarbonise.
Next year, the government will set out details on the revenue mechanism to
encourage private sector capital into these new technologies.
6.20 The transition to net zero will require more ambitious climate policy. Whilst
this creates a higher risk of carbon leakage, potential options for mitigating these
risks include:
• Climate diplomacy: Sharing the burden of mitigating global emissions in a
balanced way would reduce the risks of carbon leakage significantly.
Furthermore, ongoing international climate diplomacy and efforts to secure
collective action to reduce global emissions have a really important role in
addressing carbon leakage.
• Prioritisation across sectors: Frontloading climate change mitigation policies
in sectors at least risk of carbon leakage could help emission intensive
sectors to adjust gradually over the next 30 years. However, businesses
making new long-term investments would still need to take account of the
future impact of the transition. Continuing to invest in carbon-intensive
technology risks firms being left with stranded assets later in the transition.
• Prioritisation within sectors: Within emissions intensive sectors, even where
they are trade exposed, acting quickly on mitigation is most sensible where
the scope for carbon leakage is lowest relative to the potential for climate
mitigation.
• Improving productivity: Policies to boost the competitiveness of tradable
sectors in a sustainable way. If businesses improve their productivity, this
will make them more resilient to potential competitiveness impacts and
carbon leakage. More productive businesses are also likely to have lower
emissions per unit of output than less productive businesses.
• Subsidies and revenue recycling: Building on the targeted support
government has already provided, further use of subsidies (or revenue
recycling) may help mitigate the risks of carbon leakage even as domestic
policy initiatives force a process of domestic emission mitigation.
• Treatment of imports: Strong economic arguments can be made for
treating imports in ways that seek to compensate for the competitiveness
impacts of any asymmetry in domestic and internationally emissions

68
mitigation policies. There are a number of material practical issues that
would need to be carefully considered, such as measurement difficulties,
substitution and displacement effects, and the implications of international
trade rules.
6.21 Technological innovations that enable emissions mitigation at reduced cost
will also reduce the risk of carbon leakage. In addition, changes in domestic
consumption of tradable emissions-heavy products could enable climate change
mitigation without increasing the risk of carbon leakage.

69
Chapter 7
Households and net zero
Structural changes during the transition to a net zero economy will have
implications for households. They will be affected directly through the goods
and services they buy, and indirectly through the impacts on the wages they
earn and the value of the assets they hold. Higher-income households
consume more carbon in absolute terms, but lower-income households tend
to have more carbon embedded in their consumption relative to their income.
The analysis of exposures to the transition presented in this chapter does not
seek to calculate the impact of the transition on any particular group. The
transition is a dynamic process that will take place over several decades, and
its impact on individual households will ultimately depend on a range of
factors including: the development of new low-carbon sectors in the UK; the
pace of transition and policy levers chosen; the price of low-carbon
alternatives to households and businesses’ current activities; and the
dynamism of the labour and capital market. Nevertheless, the analysis does
underline the importance of managing the transition in a way that minimises
the risks of adverse impacts for certain groups.
The transition will bring costs and benefits to households across the UK over the next 30 years 7.1 The structural changes involved in the transition to net zero will have
implications for households. New investment will create new economic
opportunities, and the relative price of low-carbon goods and energy should fall.
However, there will also be costs including new investment, and relative price
increases for some higher-carbon goods. All households will be affected by these
changes, though some will be affected more than others.
7.2 The transition will be a dynamic process and one that will take place over 30
years. It is therefore very difficult to predict the impact of the transition on any
particular household. However, analysis of exposures can give a sense of the scale of
change faced by certain groups and help the government design policy to improve
the affordability of low-carbon alternatives and to support green job creation. The
Energy White Paper sets out a £6.7 billion package to save families in old inefficient
homes up to £400, and the government’s Ten Point Plan will mobilise £12 billion of

70
government investment to create and support up to 250,000 green jobs and spur
over three times as much private sector investment by 2030.1
7.3 The transition will also have intergenerational impacts, which will depend on
the precise timing of the costs and benefits of the transition. For example, energy
efficiency improvements have an upfront cost, but lead to lower ongoing running
costs. Other technology choices, such as direct air carbon capture and storage or
switches to more expensive, but clean, fuels may have a more enduring impact on
costs. Policy design and financing mechanisms, both public and private, can affect
the profile of costs and benefits, as well as their distribution across the population.
Different groups within the current population have different degrees of exposures to the coming changes 7.4 Within the current UK population, different groups will have different
degrees of exposure to the transition. Considering the impact of the transition on
these groups will be an important factor in determining how best to design policies
to support the transition. The analysis in this chapter considers these exposures. It
does not take account of the potential benefits to households from decarbonisation
discussed in Chapter 2; these also need to be considered in policy design.
7.5 Beyond taxation and public spending that directly apply to households, the
transition to net zero will affect households directly through the goods and services
they buy and indirectly through the costs on businesses discussed in the preceding
chapter. This chapter focuses on:
• Consumer prices: Carbon is emitted in the production of products that
households consume, both directly in the consumption of energy and fuel,
and indirectly through embodied carbon in the supply chain. Regulation,
taxation or abatement activity may increase the prices of these products. At
the same time, lower costs in other areas will make some goods more
affordable.
• Labour market: Individuals work at firms that emit carbon in their
production processes. To the extent that decarbonisation reduces worker
productivity, it may cause real wages and labour market opportunities in
these firms to decline over time. On the other hand, the transition will also
create new economic and employment opportunities as new sectors
emerge, as set out in Chapter 2.
7.6 A further channel through which the transition could affect households is
business profits. Where businesses become less profitable, this will pass through to
the households that own them. The transition will spur a reallocation of capital
across the economy. New, low-carbon sectors will be new sources of profit. These
profits pass through to households through dividends and through the value of
their assets. This interim report does not include analysis of this channel. These
channels are complex, and the final costs may pass through to households through
all three channels.
1 ‘The Ten Point Plan for a Green Industrial Revolution’, HM Government, November 2020; ‘Energy White Paper: Power our Net Zero
Future’, HM Government, December 2020.

71
Household carbon consumption 7.7 This section explores UK households’ exposure to increases in consumer
prices driven by decarbonisation by estimating the carbon footprints of households’
consumption in the present day. The analysis does not show the actual impact on
households: as prices change, households’ consumption patterns will also change,
and policy choices will affect how costs are passed through. The final impact will
also depend on the distribution of the benefits of decarbonisation, the cost of the
alternative low-carbon products and the extent to which costs are passed through
via consumer prices as opposed to wages or profits.
Box 7.A: Estimating households’ carbon footprint methodology
The analysis combines spending data from the Living Costs and Food (LCF)
survey2 and Department for Environment, Food & Rural Affairs (Defra)’s
Carbon Footprint data.3 The Defra Carbon Footprint data trace emissions for
goods and services through from source to final consumption goods. LCF data
on the consumption of these goods is used to allocate this carbon to
households (assuming constant CO2e per pound within each consumption
category).4 This then allows us to estimate households’ carbon footprint and
show this by income decile and other characteristics. This can begin to tell us
how different households could be affected from the costs of reducing
emissions. However, this is just an average and a variety of factors could mean
certain households are more or less exposed.5
7.8 Chart 7.A shows the estimated carbon footprint by household income decile.
On average, households in the top income decile consume around 20 tCO2e per
year, while the lowest income decile consume almost 9 tCO2e per year. Housing and
utilities make up the largest proportion of all households’ carbon footprints, but for
lower-income households this makes up more than half of their carbon footprint.
Transport carbon emissions, on the other hand, are disproportionately emitted by
higher-income households. These footprints are on an average basis, so there is
likely to be some significant variation within each group due to factors such as
housing energy efficiency, employment status and family size.
7.9 Although the highest-income households emit more than two times as
much carbon as the lowest-income households, they have incomes that are more
than eight times greater on average. This largely reflects a higher saving rate among
higher-income households, reducing their total consumption relative to their
income. It also reflects the fact that carbon intensive consumption of, for example,
energy and heating makes up a higher proportion of lower-income households’
2 ‘Living Costs and Food Survey’, Office of National Statistics (ONS), 2014/15-2016-17 - data is presented in the fiscal year 2020-21.
3 ‘UK’s Carbon Footprint’ (2016 data), Department for Environment, Food and Rural Affairs (DEFRA), 2020.
4 The analysis uses territorial emissions from the Defra Carbon Footprint data (in line with the rest of this report). The household
consumption data in the LCF does not distinguish between spending on domestic versus imported goods (or goods with part of
their supply chain imported). Therefore, total spending is used to apportion domestic emissions. This implicitly assumes that all
households are equally likely to consume domestic and imported goods. Or put another way, households’ carbon footprints are
not lower if they disproportionately consume imported products.
5 This methodology follows a similar approach taken in ‘Reducing inequality resulting from UK low-carbon policy’, Climate Policy,
Volume 20, A. Owen and J. Barrett, June 2020.

72
footprints. Overall, this means that higher-income households have more room
within their budgets to absorb the costs of decarbonisation.
Chart 7.A: Average household greenhouse gas footprint by net equivalised household income decile
Source: HM Treasury calculations, LCF data, Defra Carbon Footprint.
7.10 Charts 7.B and 7.C consider differences in carbon footprints by age, defined
by the age of the household reference person.6 At the household level, shown in
Chart 7.B, the carbon footprint peaks between the age of 40 and 65. However, this
is purely the result of household size: households in this group are the most likely to
have more members and hence have greater consumption. After adjusting for the
number of people in the household, Chart 7.C shows that older age groups have a
higher carbon footprint on a per-person basis, driven mainly by greater housing and
energy use.
7.11 Charts 7.D and 7.E look at emissions by household type. Chart 7.D shows
that single households emit the least CO2e on average, while households with more
than one adult emit the most, which is a result of the size of these households.
Pensioner households tend to emit less in transport use, relative to other family
6 The household reference person is the householder who: owns the household accommodation; or is legally responsible for the rent
of the accommodation; or; has the household accommodation as an emolument or perquisite; or, has the household
accommodation by virtue of some relationship to the owner who is not a member of the household. If there are joint
householders, the household reference person will be the one with the higher income. If the income is the same, then the eldest
householder is taken.
£0
£10,000
£20,000
£30,000
£40,000
£50,000
£60,000
£70,000
£80,000
£90,000
£100,000
0
5
10
15
20
25
An
nu
al h
ou
seh
old
in
com
e
tCO
2e
Net equivalised income decile
Electricity Other heating
Road transport Air transport
Other transport Food
Housing only Other
Average household income

73
types. As shown in Chart 7.E, on a per-person basis electricity and heating make up
a greater proportion of smaller households’ carbon footprints, reflecting the
economies of scale of living with more than one other person.
Chart 7.B: Average household greenhouse gas footprint by age
Source: HM Treasury calculations, LCF data, Defra Carbon Footprint.
Chart 7.C: Average per-person greenhouse gas footprint by age
Source: HM Treasury calculations, LCF data, Defra Carbon Footprint.
0
2
4
6
8
10
12
14
16
Age group
tCO2e
Electricity Other heating Road transport Air transport
Other transport Food Housing only Other
0
1
2
3
4
5
6
7
8
9
Age group
tCO2e
Electricity Other heating Road transport Air transport
Other transport Food Housing only Other

74
Chart 7.D: Average household greenhouse gas footprint by family type
Source: HM Treasury calculations, LCF data, Defra Carbon Footprint.
Chart 7.E: Average per-person greenhouse gas footprint by family type
Source: HM Treasury calculations, LCF data, Defra Carbon Footprint.
7.12 Chart 7.F then shows the breakdown by region. This shows a relatively
similar carbon footprint across the nations and regions, although the South East and
Northern Ireland is somewhat higher compared to households in Scotland, Wales
and other regions in England.7 In the South East, this is driven by higher than
average use of transport. In Northern Ireland, this could be due to the high
7 Note that, as elsewhere in the analysis, this uses UK wide carbon factors within each consumption category, so CO2(e) per pound
spent on electricity in Scotland is the same as in England.
0
2
4
6
8
10
12
14
16
18
Single non-pensioner
Couplewithoutchildren
Couple withchildren
Lone parent Singlepensioner
Couplepensioner
tCO2e
Electricity Other heating Road transport Air transport
Other transport Food Housing only Other
0
1
2
3
4
5
6
7
8
9
Single non-pensioner
Couplewithoutchildren
Couple withchildren
Lone parent Singlepensioner
Couplepensioner
tCO2e
Electricity Other heating Road transport Air transport
Other transport Food Housing only Other

75
proportion of homes in Northern Ireland using heating oil as their primary heating
source – 68% of homes overall and 82% in rural areas – the largest percentage of
domestic homes using heating oil in Western Europe.8
7.13 Finally, Chart 7.G shows the difference between rural and urban districts in
England. The most rural households’ carbon footprints in England are around 9%
larger than the most urban households. This could be due to rural households’
consumption of electricity and heating: 14% of households in Great Britain do not
have mains gas, or are off the grid,9 and are therefore often reliant on carbon-
intensive heating fuels such as oil. There will also be other factors at play, including
income levels and property type.
Chart 7.F: Average household greenhouse gas footprint by Government Office Region
Source: HM Treasury calculations, LCF data, DEFRA Carbon Footprint.
8 ‘Report on Fuel Poverty’, Committee for Social Development, Northern Ireland Assembly, May 2012.
9 ‘Sub national estimates of households not connected to the gas network 2015-2018’, Department for Business, Energy and
Industrial Strategy (BEIS), December 2018.
0 2 4 6 8 10 12 14 16
North East
North West and Merseyside
Yorkshire and the Humber
East Midlands
West Midlands
Eastern
London
South East
South West
Wales
Scotland
Northern Ireland
tCO2e
Electricity Other heating Road transport Air transport
Other transport Food Housing only Other

76
Chart 7.G: Average household greenhouse gas footprint by rural urban classification (England only)a
Source: HM Treasury calculations, LCF data, DEFRA Carbon Footprint, 2011 Rural Urban Classification in England.
a Local authorities are categorised as rural or urban based on the percentage of their resident population in rural areas or
‘rural-related’ hub towns. Mainly Rural: At least 80% living in rural settlements and hub towns; Largely Rural: At least
50% but less than 80% living in rural settlements and hub towns; Urban with Significant Rural: At least 26% but less
than 50% living in rural settlements and hub towns; Urban with City and Town, Urban with Minor Conurbation,
Urban with Major Conurbation: Less than 26% living in rural settlements and hub towns.
Households, emissions and the labour market 7.14 This section considers how households might be affected by the transition
through their employment and wages. The analysis shows sectors and types of jobs
that are currently associated with high-carbon emissions. As with the consumption
analysis, this should not be seen as reflecting the final impact of the transition on
those sectors, jobs or employees. This will depend on the policy levers chosen to
support the transition, how easily and cheaply these sectors can decarbonise and
their international exposure and competitiveness. And for employees, it will depend
on where and when new employment opportunities emerge in competing, low-
carbon industries.
7.15 Over the course of the transition, there will be significant changes in the UK
labour market. Some of these changes will be directly associated with the transition
to net zero, although other technology-driven changes are also likely to be
important. Changes in the labour market in one sector may be offset by new
employment opportunities elsewhere, including through the expansion of low-
carbon industries.
7.16 The International Labour Organization (ILO) expects 24 million new jobs and
6 million job losses by 2030 as a result of collective action to meet the goals of the
2015 Paris Agreement. This net job creation is primarily driven by growth in
0
2
4
6
8
10
12
14
16
Mainly Rural Largely Rural Urban withSignificant
Rural
Urban withCity andTown
Urban withMinor
Conurbation
Urban withMajor
Conurbation
tCO2e
Electricity Other heating Road transport Air transport
Other transport Food Housing only Other
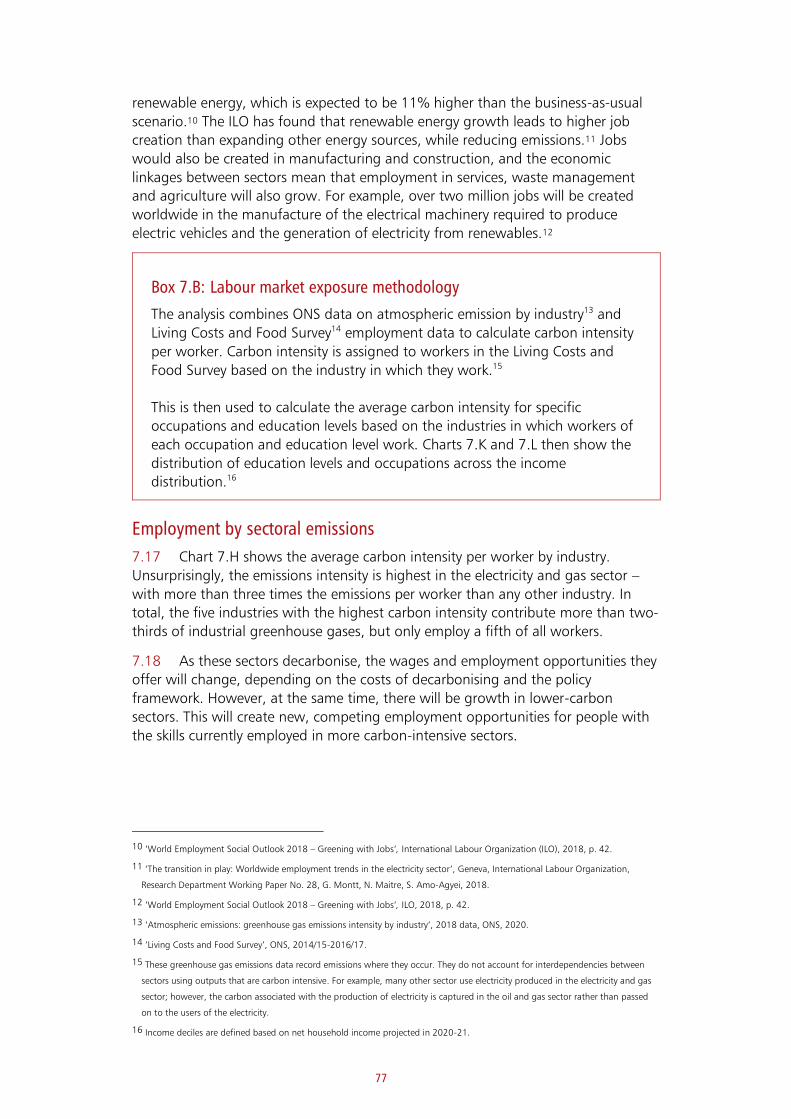
77
renewable energy, which is expected to be 11% higher than the business-as-usual
scenario.10 The ILO has found that renewable energy growth leads to higher job
creation than expanding other energy sources, while reducing emissions.11 Jobs
would also be created in manufacturing and construction, and the economic
linkages between sectors mean that employment in services, waste management
and agriculture will also grow. For example, over two million jobs will be created
worldwide in the manufacture of the electrical machinery required to produce
electric vehicles and the generation of electricity from renewables.12
Box 7.B: Labour market exposure methodology
The analysis combines ONS data on atmospheric emission by industry13 and
Living Costs and Food Survey14 employment data to calculate carbon intensity
per worker. Carbon intensity is assigned to workers in the Living Costs and
Food Survey based on the industry in which they work.15
This is then used to calculate the average carbon intensity for specific
occupations and education levels based on the industries in which workers of
each occupation and education level work. Charts 7.K and 7.L then show the
distribution of education levels and occupations across the income
distribution.16
Employment by sectoral emissions
7.17 Chart 7.H shows the average carbon intensity per worker by industry.
Unsurprisingly, the emissions intensity is highest in the electricity and gas sector –
with more than three times the emissions per worker than any other industry. In
total, the five industries with the highest carbon intensity contribute more than two-
thirds of industrial greenhouse gases, but only employ a fifth of all workers.
7.18 As these sectors decarbonise, the wages and employment opportunities they
offer will change, depending on the costs of decarbonising and the policy
framework. However, at the same time, there will be growth in lower-carbon
sectors. This will create new, competing employment opportunities for people with
the skills currently employed in more carbon-intensive sectors.
10 ‘World Employment Social Outlook 2018 – Greening with Jobs’, International Labour Organization (ILO), 2018, p. 42.
11 ‘The transition in play: Worldwide employment trends in the electricity sector’, Geneva, International Labour Organization,
Research Department Working Paper No. 28, G. Montt, N. Maitre, S. Amo-Agyei, 2018.
12 ‘World Employment Social Outlook 2018 – Greening with Jobs’, ILO, 2018, p. 42.
13 ‘Atmospheric emissions: greenhouse gas emissions intensity by industry’, 2018 data, ONS, 2020.
14 ‘Living Costs and Food Survey’, ONS, 2014/15-2016/17.
15 These greenhouse gas emissions data record emissions where they occur. They do not account for interdependencies between
sectors using outputs that are carbon intensive. For example, many other sector use electricity produced in the electricity and gas
sector; however, the carbon associated with the production of electricity is captured in the oil and gas sector rather than passed
on to the users of the electricity.
16 Income deciles are defined based on net household income projected in 2020-21.

78
Chart 7.H: Average carbon per employee by industry
Source: HM Treasury calculations, LCF household survey, ONS atmospheric emission by industry.
Employment, skill types and emissions
7.19 Many workers can perform similar jobs in a number of different industries
with very different carbon exposures. To more accurately identify which workers
might be more exposed to current carbon use in a dynamic labour market Charts 7.I
and 7.J show an average carbon intensity for people in different occupations and
skill types. This is calculated based on the sector in which workers from each
education level or occupation are currently employed. This assumes that all types of
roles within each sector are equally affected by the exposure to carbon.
7.20 Skilled trade, and process plant and machine workers tend to be employed
in the most carbon-intensive jobs, reflecting higher employment rates in the
agriculture and electric and gas sectors. Process plant and machine workers have a
higher carbon intensity due to a higher propensity to work in the transport and
0
1,000,000
2,000,000
3,000,000
4,000,000
5,000,000
6,000,000
0
50
100
150
200
250
300
350
400
450
Ele
ctri
city
, g
as,
ste
am
& a
ir c
on
dit
ion
ing
su
pp
ly
Ag
ricu
ltu
re,
fore
stry
an
d f
ish
ing
Min
ing
an
d q
uar
ryin
g
Wat
er a
nd
wast
e
Tran
spo
rt a
nd
sto
rag
e
Man
ufa
ctu
rin
g
Co
nst
ruct
ion
Ret
ail
Rea
l est
ate
Pu
blic
Ad
min
s
Ad
min
istr
ati
on
Acc
om
od
atio
n a
nd
fo
od
Oth
er s
erv
ice
wo
rk
Info
rmat
ion
an
d C
om
mu
nic
ati
on
Art
s
Hea
lth
an
d s
oci
al w
ork
Pro
fess
ion
, sc
ien
tifi
c an
d t
ech
nic
al
Ed
uca
tio
n
Fin
ance
Nu
mb
er
of
wo
rkers
Carb
on
per
wo
rker
(t)
Carbon per worker Number of workers

79
storage industry, while skilled trade workers are disproportionately likely to work in
the agriculture sector.
7.21 Similarly, people with low and middle levels of education (those with
education up to A-levels) tend to be employed in jobs with an average carbon
intensity over 20% more than highly educated employees (degree and above).
7.22 During the transition, new, lower-carbon industries and jobs will emerge.
The UK’s low-carbon industries already support over 460,000 jobs,17 from electric
vehicle manufacturing in the Midlands and the North East to the offshore wind
industry in the Humber and the Tees. As discussed in Chapter 2, increasing offshore
wind could support 60,000 jobs. Some of these jobs will replace jobs in high-carbon
sectors, and some will be additional. However, the transition will still require
employers to change their practices to reduce their carbon emissions, which may
disproportionately affect these occupations and skills levels. The £315 million
Industrial Energy Transformation Fund helps such sectors in the UK to decarbonise.
The eventual impact on households will depend on the match between the skills in
the jobs lost and the jobs created.
Chart 7.I: Average carbon per worker by occupation (based on industry of employment)
Source: HM Treasury calculations, LCF household survey, ONS atmospheric emission by industry.
17 ‘Low Carbon and Renewable Energy Economy (LCREE) Survey QMI’, ONS, October 2019
0
5
10
15
20
25
30Carbon intensity per worker (t)
Agriculture, forestry and fishing Electricity, gas, steam & air conditioning supply
Manufacturing Mining and quarrying
Transport and storage Other

80
Chart 7.J: Average carbon per worker by education (based on industry of employment)a
Source: HM Treasury calculations, LCF household survey, ONS atmospheric emission by industry. a ‘High’ education refers to degree level and above, ‘Mid’ refers to A levels or equivalent, ‘Low’ refers to GCSE and
below.
Employment, income and emissions
7.23 The final step is to explore the types of households in these employment
groups with higher carbon intensity. Chart 7.K shows occupations of employees
broken down by net household income decile (lower income households tend to
have fewer or no workers and so fewer workers make up the lower deciles). The
high-carbon intensity occupations, skilled trade, and process plant and machine
workers are skewed towards lower-income households: almost a quarter of workers
in the lowest income quintile of households work in these occupations compared to
one in ten of those from the richest quintile. Similarly, Chart 7.L shows low- and
mid-education employees are disproportionately drawn from low-income
households.
7.24 However, this does not mean the labour market adjustment would have an
overall regressive pattern. Higher-income households receive a significantly greater
share of income from earnings, whereas lower-income households receive a greater
share of income from welfare. This means that higher-income households are more
exposed to any labour market shock. The carbon-specific trends highlighted here are
not enough to outweigh this. It is also possible that the carbon intensity of the
labour market is geographically concentrated.
0
2
4
6
8
10
12
14
High Mid Low
Education level
Carbon intensity per worker (t)
Agriculture, forestry and fishingElectricricity, gas, steam & air conditioning supplyManufacturingMining and quarryingTransport and storageOther

81
Chart 7.K: Distribution of occupations of employees across income deciles
Source: HM Treasury calculations, LCF household survey, ONS atmospheric emission by industry.
Chart 7.L: Distribution of education levels of employees across income decilesa
Source: HM Treasury calculations, LCF household survey, ONS atmospheric emission by industry. a ‘High’ education refers to degree level and above, ‘Mid’ refers to A levels or equivalent, ‘Low’ refers to GCSE and
below.
0
1,000,000
2,000,000
3,000,000
4,000,000
5,000,000
0%
10%
20%
30%
40%
50%
60%
70%
80%
90%
100%
To
tal n
um
ber
of
wo
rkers
Sh
are
of
wo
rkers
Net equivalised income decile
Managerial Professional
Technical Administration
Skilled trade Caring, leisure, service
Sales Process plant and machine
Elementary occupation Number of workers (RHS)
0
1,000,000
2,000,000
3,000,000
4,000,000
5,000,000
0%
10%
20%
30%
40%
50%
60%
70%
80%
90%
100%
To
tal n
um
ber
of
wo
rkers
Sh
are
of
wo
rkers
Net equivalised income decile
High Mid Low Number of workers (RHS)

82
Managing the distributional impacts of the transition 7.25 In designing policies to support the transition, the government will need to
take account of the distributional consequences. The design of decarbonisation
policies will have implications for distributional outcomes as will decisions on
whether to mitigate the impact of the transition through other policy tools, for
example:
• a policy can explicitly target distributional impacts alongside other
objectives (e.g. progressive interest rates on loans or support for fuel poor
homes such as the £6.7 billion package set out in the Energy White Paper18
that could save families in old inefficient homes up to £400, including the
extension of the Energy Company Obligation and Warm Home Discount);
• the ongoing burden of the policy can be increased or reduced for different
groups, or some can be excluded from paying altogether (e.g. surcharges,
exemptions or targeted reliefs);
• targeted support can be provided to cover the capital and/or running costs
caused by a policy (e.g. targeted scrappage schemes coupled with low-
emission zones);
• the funds raised by a levy or tax can be redistributed to a particular group
to offset the primary impact (e.g. levies with recycling);
• the general tax and welfare system can be used to compensate those who
are affected (e.g. targeted tax cuts or higher welfare payments); and
• progressive redistribution can also be a co-product of policies with other
explicit aims (e.g. taxes on air travel).
7.26 As with the costs of emission abatement, where there is a need for public
financing, funding can be raised through general taxation or through borrowing.
They can also be raised through specific taxes or levies, with the revenue raised
earmarked to fund these policies. The trade-offs between managing these impacts,
effectiveness of policy at driving the transition, and the impact on competitiveness,
are discussed in Chapter 6.
18 ‘Energy White Paper: Powering our Net Zero Future’ CP 337, HM Government, 2020
83
Annex A
Net Zero Review terms of reference
The text below sets out the terms of reference for the Net Zero Review as published.
Although the Review was initially planned to report in autumn 2020, the COVID-19
pandemic has meant the final report has been delayed to spring 2021.
Context The UK has a proud record of global leadership in tackling climate change and
supporting clean growth.
In 2006, the UK published the first global review into the economics of climate
change. This led to the Climate Change Act 2008, which established a
comprehensive legal framework for delivering emission reductions in the UK,
including a 2050 carbon reduction target and interim carbon budgets.
Between 1990 and 2017, we reduced our emissions by 42% while growing the
economy by more than two thirds.
The UK legislated in June 2019 to reach net zero greenhouse gas emissions by 2050,
becoming the first major economy to do so.
The government also accepted the Climate Change Committee’s recommendation
that HM Treasury should undertake a review of how the transition to net zero would
be funded and where the costs would fall. This review will take this forward,
examining the key choices to transform to a green economy and achieve net zero by
2050.
In parallel, the government will continue its efforts to reduce greenhouse gas
emissions and deliver on its carbon budget commitments, while keeping costs down
for consumers, supporting the creation of good jobs and growing the economy.
Objectives To consider how the transition to net zero will be funded and assess options for
where the costs will fall. This will involve:
1 Analysing the range of choices for how households, businesses and the
taxpayer could contribute towards different elements of the transition to
net zero.
2 Identifying mechanisms to create an equitable balance of contributions.
3 Maximising opportunities for economic growth as we transition to a green
economy.
4 Evaluating the trade-offs between cost, competitiveness, effects on
consumers and impacts on the taxpayer.

84
Scope The review will consider the full range of government levers, including tax. It will not
duplicate existing or ongoing work elsewhere, such as:
• detailed policy to decarbonise specific sectors
• the costs of adapting to the impacts of climate change
• the social and global co-benefits of decarbonisation
Governance, engagement and timetable The review will be conducted by Her Majesty’s Treasury, with close engagement
across Whitehall and with the devolved administrations.
The review will consult widely, as well as draw on evidence from experts and insights
from those who will have a role in and be impacted by the transition. Further details
will be set out in due course.
The review will report to the Chancellor of the Exchequer. Her Majesty’s Treasury will
publish a report in autumn 2020 setting out principles to guide decision-making
during the transition to net zero.

85
Annex B
Market failures and climate change
Market failures: the theory This annex sets out further detail on the theory of market failures and the main
market failures in each sector.
Table 7.A: Static price failures
Market failure Description
Negative externalities Arise when the production or consumption of a good or service
imposes a cost on a third party that is uninvolved in the initial
transaction, imposing a larger cost on society as a whole than on
the private actors. Stern judged the lack of a price on emitting
greenhouse gases to be the largest market failure driving climate
change and pervasive across all sectors of the economy.1
Positive externalities Exist when production or consumption of a good or service
benefits a third party uninvolved in the initial transaction. As a
result, benefits to society as a whole are greater than benefits
experienced by private actors and the goods and services are
consequently under-produced or consumed. Positive externalities
commonly occur in innovation processes. Early adopters of green
technology generate positive externalities for others by supporting
supply chain development and bringing down costs over time.
Public goods Exist when a good or service is non-excludable and has no rival in
consumption. Once a public good is supplied, no one can be
stopped from consuming it, and its consumption by one person
does not reduce the amount available to another person.
Consequently, these goods suffer from a free-rider problem,
where those accessing the service do not have to pay for it.
Greenhouse gas removals, for example by forests that sequester
carbon from the atmosphere, are public goods since no one can
be excluded from the benefit of lower carbon in the atmosphere.
Quasi-public goods partially exhibit these features – being non-
rival or non-excludable – up to a point, often in cases where there
is a capacity limit. Some of the infrastructure required to achieve a
net zero economy can be thought of as quasi-public goods – for
example cycle lanes and pedestrian areas which can help
encourage a modal shift away from petrol and diesel vehicles.
1 ‘The Economics of Climate Change: The Stern Review, Nicholas Stern’, Cabinet Office – HM Treasury, 2006.

86
Natural monopolies Occur where there are high upfront fixed costs associated with
providing a good or service and low marginal costs. These high
costs (common in infrastructure) may mean that a market with
one producer to supply most of the market is most efficient.
However, the lack of competition that results can, if unaddressed,
result in inflated prices and poor quality of service.
In the UK, economic regulators oversee the network operators
that carry risks of natural monopoly. Many of these networks will
be important for the transition to net zero. For example, the
capacity of the electricity grid will be important for the
electrification of large parts of the economy and the gas grid will
play a central role if hydrogen is used on a large scale.
Table 7.B: Static non-price failures
Market failure Description
Information failures Occur when a lack of information means that economic actors
cannot make the decision that provides the most benefit to them.
Information failure is an issue for net zero where the choices
being asked of people may be complex and the information that
exists is hard to interpret or there are too many options. A lack of
knowledge about the benefits of making energy efficiency
improvements to buildings, in production or in personal
consumption may also hold back decarbonisation even where
there is the will to do so.
Inertia and bounded
rationality
Occur where people are satisfied with a sub-optimal outcome.
The necessary incentives and information exist but these do not
translate into change, because people are biased towards the
status quo. It can also be the case that people apply different
weights to costs and benefits in different time periods, or of
different natures – for instance cost savings versus inconvenience.
This could help explain the low rate of adoption of energy
efficiency measures in buildings, which would normally pay for
themselves without the need for government intervention.
Split incentives Occur where one party bears the cost of purchasing a good while
another party benefits, or the party that bears the cost cannot
guarantee it will reap the full benefit over time. This occurs in the
rented sector both for homes and for industry, where tenants
would experience the benefits of reduced bills from energy
efficiency measures but cannot guarantee that they will continue
to rent the property for enough time to recoup the costs of their
installation. Split incentives also occur in the shipping sector
where charterers may be deterred from investment in abatement
as they will only receive the benefits when leasing the ship –
similarly ship owners can have lower incentives to invest
themselves as they may not receive all of the savings from the
efficiency improvements.

87
Liquidity constraints Occur where people are willing to make an investment that is cost
saving but do not have access to the capital to pay for it. If they
could borrow money to fund the investment, they would do so.
This may be an issue throughout the transition due to the large
amount of new capital investment required, for both households
and businesses.
Table 7.C: Dynamic failures
Market failure Description
Uncertainty and risk
bearing
Uncertainty about the future increases risk. Combined with risk
aversion, this can lead to disproportionate increases in financing
costs for investment and sub-optimate levels of investment. This is
a particular problem for new and developing technologies which
will be crucial for the transition, or in circumstances where future
policy is unclear.
Multiple equilibria:
coordination failures
Occur where a lack of communication between actors in the
market, or an inability to coordinate action across time, leads to
an outcome that leaves everyone worse off. For example, one
possible barrier to increased uptake of electric vehicles may be
that drivers are concerned that there are not enough charging
points to be able to pursue the journeys they want to. However, it
may also only be profitable for firms to roll out sufficient charging
points when there is enough demand for them. If these actors
were able to coordinate their supply and demand, the market
would produce a better outcome.
Multiple equilibria:
technology development
curves
As new technology is deployed the costs of that technology falls.
New, low-carbon technology is often more expensive as it has not
yet been deployed at scale – whereas markets dominated by fossil
fuel dependent technologies are fully developed. As a result, low-
carbon goods and services are often initially not price competitive
and demand is lower. There may be tipping points with new
technologies: a point when the cost of the technology falls far
enough to secure a significant switch in consumer and business
demand for the new product. In the power sector, solar panels
and wind turbines were initially very costly but have fallen in price
substantially over time as they have been taken up at scale.
Market failures by sector This section considers how the market failures set out above apply to the various
sectors of the economy important to the net zero transition. The list of market
failures here is not exhaustive, and many sectors will experience multiple market
failures simultaneously.

88
Power Market failures in the power sector are particularly important as the distortions
created in this market can affect other sectors of the economy, potentially
magnifying the impact. This is particularly relevant in the case of buildings, surface
transport and industry.
The primary market failure is the negative externality associated with the use of fossil
fuels to generate electricity. In the absence of government intervention, the cost of
climate change caused by the emissions is not reflected in the cost of producing or
using the electricity. This means that the price of fossil fuel-generated electricity can
be lower than for low-carbon power sources such as nuclear and renewables. The
existing Emissions Trading System (ETS) and top-up from the Carbon Price Support
have been effective in making emissions-intensive power less competitive than some
of these alternatives but may not have completely internalised the externality. The
Climate Change Levy increases the cost of electricity usage with the aim of
encouraging efficiency improvements and reducing emissions.
Dynamic market failures such as uncertainty and multiple equilibria relating to
technological development curves exist in the renewable sector. There are a number
of existing mechanisms to overcome these, including the price signals given by the
ETS and UK government schemes to improve revenue certainty for investors, such as
Contracts for Difference. Hydrogen power and carbon capture technologies face
similar dynamic market failures.
Liquidity constraints may hold back deployment of nuclear power. Large upfront
capital investment is required, and the costs are incurred over a long timeframe,
creating a barrier to adoption.
Risks of natural monopoly appear in the electricity and gas grids and in a potential
CO2 network to support carbon capture and storage. For this reason, Ofgem
regulates the electricity and gas network companies’ revenue, investment and
performance standards.
Buildings Fossil fuel-powered heating is the primary source of emissions from buildings. The
climate cost of these emissions is not fully included in the price of heating, creating
a negative externality. Decarbonising buildings therefore requires efficiency
improvements to reduce energy use such as double glazing and loft insulation, as
well as finding new ways to heat our homes, workplaces and other buildings.
Low-carbon heating systems are currently more expensive than systems to support
fossil fuel heating.2 This should change over time as the technologies are rolled out
at scale, but this process is held back by multiple equilibria problems relating to
coordination and technological development curves, which keep costs high. As
discussed above, electricity and hydrogen grids that would power low-carbon
heating systems could also represent natural monopolies.
Split incentives may further hold back investment in energy efficiency as the tenants
who would benefit from bill savings cannot guarantee that they will rent the
2 ‘Cost of installing heating measures in domestic properties – a study providing cost data for different heating appliances’,
Department for Business, Energy and Industrial Strategy (BEIS), September 2020.

89
property for long enough or have high enough energy use to recoup the costs of
their installation. Similarly, landlords have little incentive to improve the energy
efficiency of their property if it does not increase its rentable value, since they will
not benefit from lower bill costs themselves.
Households may wish to avoid the disruption involved in installing energy efficiency
measures, and upfront costs can be high with long payback times. People may not
value the benefits, given they will only occur over a long time period, and
affordability and liquidity constraints could prevent households from making up-
front investments, even when these reduce costs overall. Finally, people may not
have access to information on the benefits they could experience from taking up
these measures.
Transport
Surface transport
Emissions from internal combustion engines represent a negative externality as their
costs is not fully captured in the relative price of the vehicles or their operating costs.
To date there has been limited progress in decarbonising road transport. This is
largely because fuel efficiency gains have been offset by increases in miles driven and
sales of larger vehicles. Shifts towards public transport and active travel, like walking
or cycling, can decrease the size of this negative externality, but the infrastructure
needed may be a quasi-public good.
The sector will rely on new markets and developing technologies for producing zero-
emission vehicles (ZEVs) to reach net zero. However, electric cars, vans and
motorcycles are not yet price competitive with internal combustion engine
alternatives, even with government subsidies, both in terms of upfront cost and
total cost of ownership. The Climate Change Committee (CCC) estimates that
upfront cost will reach parity with conventional vehicles in the second half of the
2020s.3 This assumes that battery technologies continue to scale-up production and
price reduction forecasts materialise.
There is an additional dynamic market failure whereby a lack of adequate charging
infrastructure may present a barrier to uptake of ZEVs, but the fact that enough
ZEVs are required to be in use to make charging infrastructure profitable may
prevent the infrastructure being delivered. There are other static non-price market
failures that also present a barrier to adoption of these vehicles: misinformation
about range and environmental impact of batteries; inertia; and liquidity (up-front
affordability) constraints.
There are still several different technological options in play for zero emission heavy
duty vehicles, including lorries, buses and coaches. Where these rely on common
infrastructure, such as a network of hydrogen refuelling stations, a super-fast
charging network or overhead catenaries, there are limited incentives for firms to
make changes to their fleet. At the same time, a limited HDV fleet does not provide
the necessary incentives to private actors to start building the infrastructure. Further
coordination is required across countries, given that heavy goods vehicles make long
journeys across borders. Failure to do so will result in vehicles either needing to be
3 ‘Net Zero – Technical Report’, Climate Change Committee (CCC), May 2019.

90
compatible with multiple systems, or goods having to change vehicle at borders,
adding to costs.
Rail makes up a small proportion of total emissions from surface transport. The
difference in emissions between low-carbon and fossil fuel powered trains is not
reflected in the ticket prices or in the cost to train companies of using rail
infrastructure. However, railways contribute to decarbonisation by enabling a shift
from other more polluting forms of transport. Developing new technologies such as
hydrogen trains may provide a lower-cost option for lowering rail emissions in some
parts of the network but may come with dynamic market failures around
uncertainty and multiple equilibria.
Air travel
The cost to third parties from the emissions of air travel is a negative externality in
the absence of intervention, as it not reflected in the market price. Decarbonisation
of the sector in the short term is largely reliant on fuel-efficiency improvements and
reduced demand. There are currently no truly zero-emission solutions for long-haul
flights. However, small hydrogen and electric planes are being developed, which
could be viable on short and medium-haul flights before 2050.
Given that significant technological development is required in this sector, dynamic
market failures will play a significant role. Sustainable aviation fuels present a way to
reduce emissions from aviation and production could be scaled over the next ten
years to achieve meaningful carbon savings in the decade from 2030. However,
these fuels are currently more costly than existing aviation fuels. As fuel costs make
up a significant proportion of airlines’ costs and the sector is highly competitive,
there is currently little incentive to move away from conventional fuels until there is
price parity with sustainable fuel cost. International cooperation is also necessary to
overcome potential coordination failures.
Shipping
The cost of using a vessel powered by fossil fuels does not reflect the cost to third
parties of emissions and pollution created as a by-product. A range of options exist
to reduce shipping emissions, some of which may allow shipping to get to near-zero
emissions. These include more fuel-efficient ships, logistical improvements and the
use of alternative fuels like ammonia and hydrogen.
Some fuel efficiency and logistical improvements can be price competitive mitigation
measures. This implies that static non-price market failures, like inertia, or liquidity
constraints faced by smaller ship operators are significant barriers to adoption.
Additionally, the maritime sector is highly fragmented, with a combination of ship
owners, operators and charter companies. There is an asymmetry of information
between these agents, which may result in sub-optimal outcomes.
There are also split incentives between the owners of the ships and the charter
companies that rent them. These mean that necessary net zero investments to these
vessels may not be undertaken by the charter companies, as it can be unclear
whether they will recoup their investments if the ship owner were to terminate their
contract.
Alternative low-carbon maritime fuels still require technological development to
become price competitive with existing fuel sources. However, without considerable

91
roll-out and an internalisation of the negative externality, these fuels may not
become price competitive. This is a multiple equilibrium market failure.
Industry Emissions from industry are a negative externality problem, insofar as the price set
by the current EU Emissions Trading Scheme does not fully internalise those
emissions. Non-price market failures such as liquidity constraints, information
failures and inertia will all contribute to varying degrees to holding back
decarbonisation depending on the sub-sector in question.
Where possible, switching from fossil fuel-based inputs to alternatives like hydrogen,
electric heat or biomass will mitigate the negative externality problem. There are also
a range of energy efficiency and circular economy measures – industrial symbiosis,
reuse, repair, remanufacture of products and recycling of materials – that are
currently cost saving and would reduce pollution.
Keeping options open is critical to optimizing the most efficient technological
choice. However, this creates a trade off with the long capital lifecycles typical in
industry: some industries have action point cut offs within the next five years to
achieve net zero by 2050.
Emissions from non-combustion processes, such as in the production of ammonia,
cement, iron and steel, can represent a negative externality in the absence of policy
intervention. These emissions are an unavoidable consequence of production of
what are generally raw materials with only imperfect substitutes. Instead of reducing
output, the CCC’s modelling assumes the emissions are captured at the point of
production and stored underground using a network of carbon dioxide pipes. This
new network could represent a natural monopoly, as there are large initial fixed
costs to the deployment of the infrastructure that continually fall as the network is
expanded. A competing network of pipes might not be feasible, nor economically
efficient. However, having only a single provider does create risks of monopoly
power that could result in poor quality and overpricing of services if left
unaddressed.
Fluorinated gases Fluorinated gases (F-gases) are used in a variety of equipment, including
refrigeration systems, air-conditioning units, heat pumps, medical inhalers, fire
extinguishers and in a variety of other industrial and specialist applications. F-gases
can have a global warming potential up to 23,000 times more powerful than CO2. If
left unaddressed by policy, they would incur a significant negative externality if
released to the atmosphere.
For several of these uses, alternatives to F-gases and F-gases that have a lower
intensity greenhouse gas effect are becoming available and cost effective. This
would mitigate the negative externality. There may also have been an imperfect
information failure, but the regulatory approach has been largely effective at
reducing F-gas use and developing the market in use of alternatives.
Waste When consuming a product, the price paid may not always capture the full costs of
disposing of that product after use, including any associated emissions. Charges for

92
landfill use have internalised some of these costs and indirectly increased the price of
emissions. Information failures and inertia in households and businesses may also
hold back effective sorting of waste and, consequently, carbon-efficient waste
management.
Waste collection and waste-water management can show features of a natural
monopolies in the absence of policy intervention. There are high initial fixed costs
that fall as the network is expanded and a competing service may be economically
inefficient, depending on the precise geography of the area.
Finally, informal or illegal waste disposal such as flytipping and littering create
further negative externalities, such as reduced or detrimental visual amenity and
pollution of the natural environment. Split incentives across public authorities can
also hold back carbon-efficient waste policy.
Agriculture A variety of market failures are present in this sector. Many are static, rather than
dynamic failures.
The primary source of emissions from the sector is from ruminant livestock
production. This is a significant source of methane, a greenhouse gas around 28
times more powerful than carbon dioxide.4 High or inefficient use of resources such
as fertiliser can increase emissions principally through their breakdown in soil which
releases nitrous oxide, a greenhouse gas around 298 times more powerful than
carbon dioxide.5 The use of fossil fuels in agricultural machinery and heating emits
carbon dioxide, but this is a relatively small proportion (10%) of total emissions from
the sector.6 These all represent negative externalities as the costs they impose on
others are not consistently captured in farms’ production costs.
The size of the negative externalities can potentially be mitigated through improved
farm management practices: improved resource efficiency through best practice
management, the adoption of innovative technologies and changes in patterns of
land use can mitigate these emissions. This includes adopting different feeding
practices for livestock, selective breeding, improving animal health, adopting more
fuel-efficient machinery, more efficient fertiliser applications and restoring
peatlands. These could create trade-offs with other competing policy objectives.
Many of these measures are consistent with improvements in agricultural
productivity. This can bring down resource use per unit of output, as well as the
associated emissions.
Inertia is cited regularly in the literature as a barrier to change in this sector.
However, it is difficult to distinguish between this and other non-price market
failures such as imperfect information, issues around tenure and the impacts of
government subsidies.
4 ‘Fifth assessment report’, Intergovernmental Panel on Climate Change (IPCC), September 2014.
5 ‘Fifth assessment report’, IPCC, September 2014.
6 ‘Net Zero – Technical Report’, CCC, May 2019.

93
Land use and land-use change When making decisions about land use, farmers’ and land managers’ incentives do
not reflect all the costs to third parties that can arise from different types of land
use. As discussed in the section above on agriculture, certain land use choices are
more emissions-intensive than others. The market value of land and the market
prices of goods produced on that land do not reflect the variance in emissions.
Increasing the resource efficiency or productivity of the land lessens this trade-off,
allowing other marginal land to be made available for alternative uses, while
maintaining total output.
For example, marginal agricultural land can be freed up for afforestation, peatland
restoration or flower meadows, all of which provide third party ecosystem services
such as carbon abatement and sequestration. Land prices do not reflect the positive
externalities that can come from these alternative uses of land. Aspects of
afforestation can also be considered a public good, since the benefits of carbon
sequestration don’t fall with number of people experiencing them, and no one can
be excluded from experiencing those benefits.
In addition, there are non-price market failures that prevent land managers from
making the most efficient use of their assets. For example, farming subsidy rules and
tenancy law may discourage land managers from changing land use. A transition in
land uses will require new skills and knowledge which may be an additional barrier.
Greenhouse gas removals The CCC is clear that greenhouse gas removal technologies (GGRs) are likely to have
a role in offsetting residual emissions, especially in hard to abate sectors such as air
travel. These removals can therefore be viewed as the cost of reducing the negative
externality in a given sector, or as positive externality in their own right.
The government has issued a call for evidence on GGRs, as there are a variety of
options to be considered. Beyond the measures captured in the land use section
above, the CCC identify bioenergy and carbon capture and storage (BECCS) and
wood in construction (WIC) as the most currently feasible ways to remove
greenhouse gases. However, there are non-price static market failures that must be
overcome for the market to work effectively. For example, imperfect and asymmetric
information about where the biomass being used for BECCS or WIC is from, the
sustainability impacts and the amount of carbon that is sequestered in each unit
may prevent the market from working efficiently. This risk becomes greater if
biomass is traded overseas, with a need for international transparency and
cooperation.
A CO2 Transport and Storage (T&S) network is required for BECCS, as with all CCUS
processes. This new network may present natural monopoly market failures, as there
are large initial fixed costs to the deployment of the infrastructure that continually
fall as the network is expanded. A competing network of pipes might not be
feasible, nor economically efficient. However, having only a single initial provider
does create risks of monopoly power that could result in poor quality and/or
overpricing of services, if left unaddressed.
There are also other less developed GGRs being considered in the UK such as
enhanced weathering and Biochar. Current analysis suggests direct air carbon

94
capture and storage (DACCS) is likely to have the greatest deployment potential of
these approaches in the UK by 2050. These will require further research and
development to reduce their costs, to understand their effectiveness and their trade-
offs. The knowledge gained from this research and development is a quasi-public
good as it is difficult to exclude people from accessing research findings, and
information is not depleted by use. In addition, DACCS would require an existing
CCS network, as discussed above. Finally, the high levels of uncertainty about the
viability in the early stages of development of these technologies may lead to
underinvestment by the market.

95
Annex C
Processing of personal data
This notice sets out how HM Treasury as the data controller will use your personal
data for the purposes of gathering stakeholder feedback for the Net Zero Review
Interim Report and explains your rights under the General Data Protection
Regulation (GDPR) and the Data Protection Act 2018 (DPA).
Your data (Data Subject Categories)
The personal information relates to you as either a member of the public,
parliamentarian or representative of an organisation or organisations or company or
companies.
The data we collect (Data Categories)
Information may include your name, address, email address, job title and employer,
as well as your opinions. It is possible that you will volunteer additional identifying
information about themselves or third parties.
Legal basis of processing
The processing is necessary for the performance of a task carried out in the public
interest. For the purpose of this Interim Report the task is requesting evidence or
obtaining opinion data in order to develop to develop good effective proposals and
recommendations to government.
HM Treasury may use the contact details provided to contact respondents in the
period between the Net Zero Review Interim Report publication to when the Final
Report is expected to be published in order to request clarification or further
information regarding the response provided where this is deemed necessary.
Special categories data
We do not expect that any special category data will be processed.
Legal basis for processing special category data
Where special category data is volunteered by you (the data subject), the legal basis
relied upon for processing it is: the processing is necessary for reasons of substantial
public interest for the exercise of a function of the Crown, a Minister of the Crown,
or a government department.
This function is consulting on departmental policies or proposals, or obtaining
opinion data, to develop good effective policies.
Purpose
The personal information is processed for the purpose of obtaining the opinions of
members of the public and representatives of organisations and companies, about

96
departmental policies, proposals, or generally to obtain public opinion data on an
issue of public interest.
Whom we share your responses with
Information provided in response to this Interim Report may be published or
disclosed in accordance with the access to information regimes. These are primarily
the Freedom of Information Act 2000 (FOIA), the Data Protection Act 2018 (DPA)
and the Environmental Information Regulations 2004 (EIR).
If you want the information that you provide to be treated as confidential, please be
aware that, under the FOIA, there is a statutory Code of Practice with which public
authorities must comply and which deals with, amongst other things, obligations of
confidence.
In view of this it would be helpful if you could explain to us why you regard the
information you have provided as confidential. If we receive a request for disclosure
of the information, we will take full account of your explanation, but we cannot give
an assurance that confidentiality can be maintained in all circumstances. An
automatic confidentiality disclaimer generated by your IT system will not, of itself, be
regarded as binding on HM Treasury.
Where someone submits special category personal data or personal data about third
parties, we will endeavour to delete that data before publication takes place.
Where information about respondents is not published, it may be shared with
officials within other public bodies involved in this Interim Report to assist us in
developing the policies to which it relates. Examples of these public bodies appear
at: https://www.gov.uk/government/organisations.
As the personal information is stored on our IT infrastructure, it will be accessible to
our IT contractor, NTT. NTT will only process this data for our purposes and in
fulfilment with the contractual obligations they have with us.
How long we will hold your data (Retention)
Personal information in responses to this Interim Report will generally be published
and therefore retained indefinitely as a historic record under the Public Records Act
1958.
Personal information in responses that is not published will be retained for three
calendar years after the Net Zero Review has concluded.
Your rights
You have the right to request information about how your personal data are
processed and to request a copy of that personal data.
You have the right to request that any inaccuracies in your personal data are
rectified without delay.
You have the right to request that your personal data are erased if there is no longer
a justification for them to be processed.
You have the right, in certain circumstances (for example, where accuracy is
contested), to request that the processing of your personal data is restricted.

97
You have the right to object to the processing of your personal data where it is
processed for direct marketing purposes.
You have the right to data portability, which allows your data to be copied or
transferred from one IT environment to another.
How to submit a Data Subject Access Request (DSAR)
To request access to personal data that HM Treasury holds about you, contact:
HM Treasury Data Protection Unit
G11 Orange
1 Horse Guards Road
London
SW1A 2HQ
Complaints
If you have any concerns about the use of your personal data, please contact us via
this mailbox: [email protected].
If we are unable to address your concerns to your satisfaction, you can make a
complaint to the Information Commissioner, the UK’s independent regulator for
data protection.
The Information Commissioner can be contacted at:
Information Commissioner's Office
Wycliffe House
Water Lane
Wilmslow
Cheshire
SK9 5AF
0303 123 1113
Any complaint to the Information Commissioner is without prejudice to your right to
seek redress through the courts.
Contact details
The data controller for any personal data collected as part of this Interim Report is
HM Treasury, the contact details for which are:
HM Treasury
1 Horse Guards Road
London
SW1A 2HQ
020 7270 5000
The contact details for HM Treasury’s Data Protection Officer (DPO) are:

98
The Data Protection Officer
Corporate Governance and Risk Assurance Team
Area 2/15
1 Horse Guards Road
London
SW1A 2HQ

99

100

101
HM Treasury contacts This document can be downloaded from www.gov.uk If you require this information in an alternative format or have general enquiries about HM Treasury and its work, contact: Correspondence Team HM Treasury 1 Horse Guards Road London SW1A 2HQ Tel: 020 7270 5000 Email: [email protected]