NAVAL POSTGRADUATE SCHOOL - dtic.mil · THESIS Approved for public release. Distribution is...
111
NAVAL POSTGRADUATE SCHOOL MONTEREY, CALIFORNIA THESIS Approved for public release. Distribution is unlimited. COMPARATIVE RESEARCH OF NAVY VOLUNTARY EDUCATION AT OPERATIONAL COMMANDS by Christopher B. Veenhuis March 2017 Thesis Co-Advisors: William Hatch Chad Seagren
Transcript of NAVAL POSTGRADUATE SCHOOL - dtic.mil · THESIS Approved for public release. Distribution is...

NAVAL POSTGRADUATE
SCHOOL
MONTEREY, CALIFORNIA
THESIS
Approved for public release. Distribution is unlimited.
COMPARATIVE RESEARCH OF NAVY VOLUNTARY EDUCATION AT OPERATIONAL COMMANDS
by
Christopher B. Veenhuis
March 2017
Thesis Co-Advisors: William Hatch Chad Seagren

THIS PAGE INTENTIONALLY LEFT BLANK

i
REPORT DOCUMENTATION PAGE Form Approved OMB No. 0704–0188
Public reporting burden for this collection of information is estimated to average 1 hour per response, including the time for reviewing instruction, searching existing data sources, gathering and maintaining the data needed, and completing and reviewing the collection of information. Send comments regarding this burden estimate or any other aspect of this collection of information, including suggestions for reducing this burden, to Washington headquarters Services, Directorate for Information Operations and Reports, 1215 Jefferson Davis Highway, Suite 1204, Arlington, VA 22202-4302, and to the Office of Management and Budget, Paperwork Reduction Project (0704-0188) Washington, DC 20503.
1. AGENCY USE ONLY(Leave blank)
2. REPORT DATEMarch 2017
3. REPORT TYPE AND DATES COVEREDMaster’s thesis
4. TITLE AND SUBTITLECOMPARATIVE RESEARCH OF NAVY VOLUNTARY EDUCATION AT OPERATIONAL COMMANDS
5. FUNDING NUMBERS
6. AUTHOR(S) Christopher B. Veenhuis
7. PERFORMING ORGANIZATION NAME(S) AND ADDRESS(ES)Naval Postgraduate School Monterey, CA 93943-5000
8. PERFORMINGORGANIZATION REPORT NUMBER
9. SPONSORING /MONITORING AGENCY NAME(S) ANDADDRESS(ES)
OPNAV N127 Navy Education Strategy and Policy Branch
10. SPONSORING /MONITORING AGENCY REPORT NUMBER
11. SUPPLEMENTARY NOTES The views expressed in this thesis are those of the author and do not reflect theofficial policy or position of the Department of Defense or the U.S. Government. IRB number ____N/A____.
12a. DISTRIBUTION / AVAILABILITY STATEMENT Approved for public release. Distribution is unlimited.
12b. DISTRIBUTION CODE
13. ABSTRACT (maximum 200 words)
This research analyzes the enrollment growth of the Tuition Assistance (TA) program and the continued decline in enrollment within the Navy College Program for Afloat College Education (NCPACE). NCPACE has provided higher education with alternatives to traditional methods of instruction for Sailors and Marines for over four decades. TA and NCPACE utilize two primary methods of instruction: distance learning (DL) and traditional instructor-led (IL) for their college educations.
The research shows overall NCPACE enrollments have been declining since 2000. Between fiscal year (FY) 2011 and FY2015, NCPACE experienced an overall annual percentage decrease of 8%. During the same period, TA experienced an overall annual percentage increase of 2%. The primary method of instruction has been shifting in the last decade. FY2014 was the first time NCPACE enrollees preferred DL to IL. The research shows the declining trend in IL course enrollment combined with a more tech-savvy generation joining the Navy requires serious thought to how the Navy Volunteer Education (VOLED) system will shift to the changing dynamic.
The conclusion of this research provides insights on the current and future dynamic involved with VOLED in the Navy and is contrary to the accepted perceptions of traditional educational paradigms and the types of learner the system intends to attract.
14. SUBJECT TERMSNavy, tuition assistance, TA, Navy College for Afloat College Education , NCPACE, voluntary education, VOLED, course completion, enrollment, return on investment, ROI, logistic regression, multivariate analysis, descriptive statistics, Markov, time-series, linear programming
15. NUMBER OFPAGES
111
16. PRICE CODE
17. SECURITYCLASSIFICATION OF REPORT
Unclassified
18. SECURITYCLASSIFICATION OF THIS PAGE
Unclassified
19. SECURITYCLASSIFICATION OF ABSTRACT
Unclassified
20. LIMITATIONOF ABSTRACT
UU
NSN 7540–01-280-5500 Standard Form 298 (Rev. 2–89) Prescribed by ANSI Std. 239–18

ii
THIS PAGE INTENTIONALLY LEFT BLANK

iii
Approved for public release. Distribution is unlimited.
COMPARATIVE RESEARCH OF NAVY VOLUNTARY EDUCATION AT OPERATIONAL COMMANDS
Christopher B. Veenhuis Lieutenant, United States Navy
B.A., Huston-Tillotson University, 2010
Submitted in partial fulfillment of the requirements for the degree of
MASTER OF SCIENCE IN MANAGEMENT
from the
NAVAL POSTGRADUATE SCHOOL March 2017
Approved by: William Hatch Thesis Advisor
Chad Seagren Co-Advisor
Yu-Chu Shen Academic Associate Graduate School of Business and Public Policy

iv
THIS PAGE INTENTIONALLY LEFT BLANK

v
ABSTRACT
This research analyzes the enrollment growth of the Tuition Assistance (TA)
program and the continued decline in enrollment within the Navy College Program for
Afloat College Education (NCPACE). NCPACE has provided higher education with
alternatives to traditional methods of instruction for Sailors and Marines for over four
decades. TA and NCPACE utilize two primary methods of instruction: distance learning
(DL) and traditional instructor-led (IL) for their college educations.
The research shows overall NCPACE enrollments have been declining since
2000. Between fiscal year (FY) 2011 and FY2015, NCPACE experienced an overall
annual percentage decrease of 8%. During the same period, TA experienced an overall
annual percentage increase of 2%. The primary method of instruction has been shifting in
the last decade. FY2014 was the first time NCPACE enrollees preferred DL to IL. The
research shows the declining trend in IL course enrollment combined with a more tech-
savvy generation joining the Navy requires serious thought to how the Navy Volunteer
Education (VOLED) system will shift to the changing dynamic.
The conclusion of this research provides insights on the current and future
dynamic involved with VOLED in the Navy and is contrary to the accepted perceptions
of traditional educational paradigms and the types of learner the system intends to attract.

vi
THIS PAGE INTENTIONALLY LEFT BLANK

vii
TABLE OF CONTENTS
I. INTRODUCTION..................................................................................................1 A. BACKGROUND ........................................................................................1
1. Tuition Assistance ..........................................................................2 2. Navy College Program for Afloat College Education
(NCPACE) ......................................................................................3 B. PROBLEM STATEMENT .......................................................................4 C. THESIS QUESTIONS ...............................................................................5
1. Primary Research Question: .........................................................5 2. Secondary Research Questions:....................................................5
D. ORGANIZATION .....................................................................................6
II. LITERATURE REVIEW .....................................................................................7 A. ANALYSIS: DOES THE METHOD OF INSTRUCTION
MATTER IN TA CLASSES? ...................................................................7 1. Data .................................................................................................7 2. Statistical Observations .................................................................8 3. Multivariate Models and Findings .............................................10
B. PROBLEM-BASED LEARNING AND PEDAGOGY IN THE 21ST CENTURY ......................................................................................11
C. ONLINE DISTANCE EDUCATION: TECHNOLOGICAL ADVANCES AND DIGITAL NATIVES...............................................13 1. Improved Technology ..................................................................13 2. Digital Natives and Digital Immigrants .....................................14
D. VOLED EFFECTIVENESS ...................................................................15 E. CHAPTER SUMMARY ..........................................................................16
III. DATA AND METHODOLOGY ........................................................................19 A. THESIS DESIGN .....................................................................................21 B. DESCRIPTIVE STATISTICS TABLES ...............................................25 C. PRIVACY CONSIDERATIONS ............................................................28 D. CHAPTER SUMMARY ..........................................................................29
IV. RESULTS .............................................................................................................31 A. CHAPTER SUMMARY ..........................................................................41
V. SUMMARY CONCLUSIONS AND RECOMMENDATIONS ......................43 A. SUMMARY ..............................................................................................43

viii
B. CONCLUSION AND RECOMMENDATIONS ...................................43 1. Do the Enrollment Rates for TA and NCPACE Differ by
Method of Instruction (IL or DL)? .............................................43 2. Do the Enrollment Rates for TA and NCPACE Differ
within Rank Groups? ..................................................................45 3. Do the Enrollment Rates for Method of Instruction (IL or
DL) Differ within Rank Groups? ...............................................46 4. Do the Completion Rates for TA and NCPACE Differ by
Method of Instruction (IL or DL)? .............................................47 5. How Well Do Member’s Score Based on Rank Groups,
Contracted Program (TA or NCPACE) and Method of Instruction (DL or IL)? ...............................................................48
C. FURTHER RESEARCH .........................................................................49
APPENDIX A. NAVY COLLEGE VOLED GRADING STANDARDS ....................51
APPENDIX B. FULL MODEL ENROLLMENT RATE CHI-SQUARED TEST, DIFFERENCES BETWEEN CONTRACTED PROGRAM AND METHOD OF INSTRUCTION ................................................................53
APPENDIX C. FULL MODEL ENROLLMENT RATE CHI-SQUARED TEST, DIFFERENCES BETWEEN CONTRACTED PROGRAM AND RANK GROUPS ........................................................................................59
APPENDIX D. FULL MODEL ENROLLMENT RATE CHI-SQUARED TEST, DIFFERENCES BETWEEN METHOD OF INSTRUCTION AND RANK GROUPS ........................................................................................69
APPENDIX E. FULL MODEL COMPLETION RATE CHI-SQUARED TEST, DIFFERENCES BETWEEN CONTRACTED PROGRAM AND METHOD OF INSTRUCTION ................................................................77
APPENDIX F. FULL SAMPLE GRADE PERFORMANCE, BY RANK GROUPS, CONTRACTED PROGRAM AND METHOD OF INSTRUCTION ...................................................................................................89
LIST OF REFERENCES ................................................................................................91
INITIAL DISTRIBUTION LIST ...................................................................................93

ix
LIST OF FIGURES
Undergraduate TA Courses by Fiscal Year. Source: Mehay and Figure 1.Pema (2010). ................................................................................................9
Completion Rates for DL and Traditional Courses. Source: Mehay Figure 2.and Pema (2010). .......................................................................................10
Type Duty Assignment Codes. Source: DON (2007). ...............................20 Figure 3.
Yearly Method of Instruction Enrollments for VOLED. Adapted Figure 4.from NETC (2016). ...................................................................................25
Yearly Method of Instruction Enrollments for TA. Adapted from Figure 5.NETC (2016). ............................................................................................26
Yearly Method of Instruction Enrollments for NCPACE. Adapted Figure 6.from NETC (2016). ...................................................................................26
Yearly Rank Group Enrollment for TA. Adapted from NETC Figure 7.(2016). ........................................................................................................27
Yearly Rank Group Enrollment for NCPACE. Adapted from NETC Figure 8.(2016). ........................................................................................................28

x
THIS PAGE INTENTIONALLY LEFT BLANK

xi
LIST OF TABLES
Table 1. Variables and Descriptions. Adapted from NETC (2016). .......................21
Table 2. Descriptive Statistics (VOLED Program / Method of Instruction). Adapted from NETC (2016). ....................................................................22
Table 3. Descriptive Statistics (Course Completion / GPA Scale). Adapted from NETC (2016). ...................................................................................22
Table 4. Descriptive Statistics (Individual Rank Groups). Adapted from NETC (2016). ............................................................................................23
Table 5. Variables and Statistical Tests. ..................................................................24
Table 6. NCPACE and TA Enrollment by Method of Instruction. Adapted from NETC (2016). ...................................................................................32
Table 7. Rank Group by Contracted VOLED Program. Adapted from NETC (2016). ........................................................................................................34
Table 8. Method of Instruction by Rank Group. Adapted from NETC (2016). .....36
Table 9. Completion Rate by Contracted VOLED Program. Adapted from NETC (2016). ............................................................................................38
Table 10. Completion Rate by Method of Instruction. Adapted from NETC (2016). ........................................................................................................39
Table 11. Summary of Fit and Regression Parameter Estimates. Adapted from NETC (2016). ............................................................................................40

xii
THIS PAGE INTENTIONALLY LEFT BLANK

xiii
LIST OF ACRONYMS AND ABBREVIATIONS
CBA Cost Benefit Analysis
CTC Central Texas College
DL Distance Learning
DMDC Defense Manpower Data Center
DOD Department of Defense
EAOS Expiration of Active Obligated Service
IA Individual Augmentee
IL Instructor Led
MSC Military Sealift Command
N14 Department of the Navy, Research, Modeling, and Analysis
NCES National Center for Education Statistics
NCMIS Navy College Management Information System
NCP Navy College Program
NCPACE Navy College Program for Afloat College Education
NETC Naval Education and Training Command
OPNAV N127 Navy Education Strategy and Policy Branch
OPNAV N166 Enterprise Information Management Team
OPNAV Office of the Chief of Naval Operations
OPNAVINST Office of the Chief of Naval Operations Instruction
PBL Problem Based Learning
PII Personally Identifiable Information
SECNAV Secretary of the Navy
SOF Student Opinion Form
TA Tuition Assistance
UIC Unit Identification Code
VOLED Volunteer Education

xiv
THIS PAGE INTENTIONALLY LEFT BLANK

xv
ACKNOWLEDGMENTS
I would like to acknowledge all the professors within the Manpower System
Analysis curriculum for providing an educational experience par excellence, that is
unique in traditional academia, and every member of this institution and program is truly
in service to their country. Special thanks to Professor William “Bill” Hatch and
Professor Chad Seagren, whose expertise and direction were instrumental in the
successful completion of this research.
A special shout-out to the folks at OPNAV N127 for the prompt assistance and
complete data. Thank you Mr. Jim Johnson and LTJG Boris Kun for the additional
guidance and direction, as it was the basis of my research.
We are only as strong as those who love and support us at home. Thank you to the
loves of my life, Stephanie, and our beautiful daughter, Alison.

xvi
THIS PAGE INTENTIONALLY LEFT BLANK

1
I. INTRODUCTION
This research examines the Navy Volunteer Education (VOLED) through
comparative research to evaluate utilization of the Tuition Assistance (TA) and Navy
College Program for Afloat College Education (NCPACE). This analysis is conducted at
the request of Navy Education Strategy and Policy Branch (OPNAV N127). This
introduction provides a framework for the examination. It provides the background of
VOLED, a problem statement, the research questions, and the organizational
methodology to conduct the research.
A. BACKGROUND
The VOLED program exists within the Armed Forces. Title 10 of the U.S. Code
(2007), the Armed Forces Act, is the basis for voluntary educational assistance programs
for persons enlisting for active duty and was aims to encourage enlistments and
reenlistments in the Armed Forces. The Secretary of Defense prescribes regulations for
the administration of U.S. Code, but the secretary of each military service has jurisdiction
on the establishment of education assistance programs within their respective service.
This empowers each individual Service Secretary to provide VOLED programs
comparable to those available to citizens outside the military, with one exception.
Department of Defense Directive 1322.08E appoints authority to develop and monitor
policy for VOLED within the Department of Defense (DOD) to the Under Secretary of
Defense for Personnel and Readiness. This directive also requires the amount of
monetary support available to each Service member for TA shall be uniform across the
Military Services (Department of Defense [DOD], 2005).
In 2005, the Secretary of the Navy (SECNAV) drafted guidance establishing
policy and laid the groundwork and expectations for VOLED programs within the Navy
and Marine Corps (Department of Navy [DON], 2005). Although the SECNAV
addressed recruitment and retention outlined in Title 10, the instruction also includes
promoting a culture of continuous learning, personal growth, readiness, and job
performance (Secretary of Navy [SECNAV], 2005). Diluting further the original intent of
2
Title 10 to use VOLED for enlistment and reenlistment, OPNAVINST 1560.9A adds
VOLED as an instrumental tool in the development of the 21st century Sailor (Chief of
Naval Operations [CNO], 2008). This instruction establishes many of the Navy VOLED
programs and policies, to include NCPACE and TA.
In 2011, Naval Education and Training Command conducted a major revision of
Navy VOLED programs. The goal was to provide operational commanders policies for
the administration and management of Navy VOLED. Additionally, the Navy’s College
Program created an umbrella for all VOLED programs and essentially, a Sailor’s “one-
stop shop” for all educational needs. Under this umbrella lies the eligibility, limitations
and requirements for the NCPACE and TA programs.
1. Tuition Assistance
Between 2011 and 2015, the Department of the Navy spent approximately $421
million funding 748,343 courses for Navy and Marine Corps enlisted members and
officers under the TA program (Naval Education and Training Command [NETC], 2016).
TA is the largest VOLED source of financial support provided to Sailors. TA provides
100% funding for tuition and other published fees to pursue a high school diploma or
college degree at any regionally or nationally United States Department of Education
accredited institutions.
a. Eligibility
TA is available to enlisted personnel and officers. Sailors on active duty and
Reserve enlisted personnel on active duty for more than 120 days who have completed an
education plan with a Navy education counselor are eligible for TA benefits (CNO,
2008). Naval Reserve Officers are eligible if on orders to active duty for more than two
years.
b. Cost Structure
There is a fiscal year limit of 16 semester hours, 24-quarter hours or 240 clock-
hours per Sailor. Tuition costs cannot exceed $250/semester hour, $166.67/quarter hour,
or $16.67/clock hour (CNO, 2008). Clock hours are reserved for diploma or approved
3
certificate programs only. Distance learning (DL) and traditional Instructor led (IL)
courses are both authorized.
c. Requirements
Every TA applications requires command authorization before it is processed.
Command approval requires a member to serve on-board their first permanent duty
station for at least one year, remain on active duty through the last day of class and be
waived or have passed their last Physical Fitness Assessment. Other command
requirements include a recommendation for advancement, that the member is not in a
training status, and has not received Non-Judicial Punishment in the last six months.
Service members are required to provide grades and will be required to reimburse
the TA program for any late withdrawals. Additionally, reimbursement is required for
grades of “D” or lower for undergraduate level courses and “C” or lower for graduate
level courses. Waivers are considered on a case-by-case basis for involuntary
withdrawals, first permanent duty station, or to exceed the fiscal year cap.
2. Navy College Program for Afloat College Education (NCPACE)
Between 2011 and 2015, the Department of the Navy spent approximately $44
million funding 30,561 courses for Navy and Marine Corps members under the NCPACE
program (B. Kun, personal communication, March 2, 2017). In accordance with
OPNAVINST 1560.9A, the NCPACE program was designed to provide Sailors the
ability to receive VOLED while deployed to operational ships and submarines or those
assigned to overseas locations who have unit identification codes (UIC) of type 2 or type
4, some remote locations and those assigned to other specific operations (CNO, 2008).
NCPACE covers 100% of the tuition costs.
a. Learning Options
NCPACE offers two different options, Distance learning (DL) or the traditional
Instructor-led (IL) option. What makes the NCPACE program unique is the ability to
embark faculty from Central Texas College (CTC) onboard ships to teach Sailors and
Marines. CTC has the sole ability to teach the IL option at sea. However, CTC and a

4
consortium of eight other colleges (Coastline Community College, Dallas Colleges
Online, Governors State University, Old Dominion University, Saint Leo University,
Thomas Edison State University, University of Oklahoma, and Vincennes University) run
the DL options. The consortium offers Sailors and Marines over 250 undergraduate and
graduate level courses.
b. Eligibility
Navy personnel and embarked Marines can participate in the NCPACE program.
However, embarked Marines must have sufficient time to complete the course
requirements and are only eligible to participate on a space available basis (Navy College
Program [NCP], n.d.). Active duty personnel onboard Military Sealift Command (MSC)
are also eligible to participate. The Navy has authorized waivers for personnel who are
serving as an Individual Augmentee (IA). IA Sailors must have reflecting IA status and
they must be able to complete their course while on IA. IA Sailors are limited to one
course per term (NCP, n.d.).
B. PROBLEM STATEMENT
Enrollments in traditional IL courses within the Navy VOLED system (TA/
NCPACE) have been declining since 2000. The data set provided by NETC indicates that
between fiscal year (FY) 2011 and FY2015, the IL method of instruction within both
contracted programs experienced an annual decrease in its enrollment rate of 8.6%.
During the same period, the DL method of instruction within both contracted programs
experienced an annual increase in its enrollment rate of 2.4%. NCPACE has experienced
declining enrollments within both methods of instruction and has experienced an overall
annual percentage decrease of 8% between FY2011 and FY2015. This changing dynamic
is an area of concern for those tasked with managing the various VOLED programs in the
Navy, specifically those who administer policy for the NCPACE program.
NCPACE has a consortium of nine total colleges or universities that participate in
either DL or IL for Navy members. Active duty member can use TA assistance for any
higher education institution. When NCPACE was founded by CTC in the 1960s,
correspondence courses where the standard. As time and technology, progressed, other

5
forms of media were implemented (floppy disc, VHS instruction, DVD, CD-ROM, fax,
email, Internet, fax, etc.). However, many of those technologies have become obsolete or
inefficient and the advent and speed of the Internet and social-media have become
mainstays in our day-to-day world.
In the past, Internet connectivity for Sailors in remote locations or onboard ocean-
going vessels was poor or non-existent. However, in recent years, the ability to connect
with those back home has greatly improved. This improvement in shipboard technology
has allowed Navy members to access online education resources in a way that was
difficult or impossible ten years ago. Couple this with the expansion of colleges and
universities offering online education as a distance learning option and one can see that
older VOLED programs using outdated technology may begin to suffer from underuse.
Additionally, students may prefer to attend specific education institutions for a
variety of reasons. Where NCPACE has limited academic institutions to choose from, TA
affords students the luxury of choosing from a plethora of other options. This
observational research intends to explain why the expansion of distance learning options
at colleges and universities may be outpacing NCPACE enrollment. Included in this
research will be a comparison and contrast of student performance within the TA and
NCPACE programs for both DL and IL.
C. THESIS QUESTIONS
1. Primary Research Question:
a. Has the expansion of various modalities associated with Navy distance learning programs contributed to a decline in NCPACE enrollment?
2. Secondary Research Questions:
a. Do the enrollment rates for the TA and NCPACE programs differ within each method of instruction (DL or IL)?
b. Do the enrollment rates within TA and NCPACE programs differ within rank groups?
c. Do the enrollment rates for method of instruction (DL or IL) differ within rank groups?
6
d. Do the completion rates for TA and NCPACE programs differ within each method of instruction (DL or IL)?
e. How well do member’s score based on rank groups, contracted program (TA or NCPACE) and method of instruction (DL or IL)?
D. ORGANIZATION
Chapter II is the Literature Review and is a synopsis of relevant research
associated with VOLED programs and pedagogical and technological changes in distance
education. The primary focus of research is on the appropriate background and history of
both programs with a secondary focus on human capital and distance education. It also
reviews the reasons why the civilian institutions, Department of Defense and the Navy
promote and justify expenditure on VOLED. The chapter concludes with a critical
assessment. This chapter contains three sections.
Chapter III will consist of description of variables generated from Naval
Education and Training Command (NETC) data received from the Enterprise Information
Management Team at OPNAV N166. The chapter will present research methodology,
acknowledges risks to validity, provides predictions, and describes variable descriptions
utilized for data analysis. Descriptive statistic tables offer preliminary trend analysis and
provide the initial concerns with an apparent downward trend in NCPACE enrollment
rates.
Chapters IV and V present the data results, summary conclusion and
recommendations and further research.

7
II. LITERATURE REVIEW
A. ANALYSIS: DOES THE METHOD OF INSTRUCTION MATTER IN TA CLASSES?
A report was prepared and funded by the Department of the Navy, Director of
Research, Modeling and Analysis (N14) to evaluate the Tuition Assistance program.
Stephen Mehay and Elda Pema conducted the analysis and report, Analysis of the Tuition
Assistance Program: Does the Method of Instruction Matter in TA Classes. The
intentions of the report were to determine the impact of traditional classroom education
and distance learning on participation, retention and promotion for Navy members who
utilized the TA program. The report outlined two areas of interest: observational data
associated with distance education for the TA program and multivariate statistical models
used to determine retention and promotion.
1. Data
The data associated with the Mehay and Pema distance education report was
gathered by Navy College Management Information System (NCMIS) databases via
NETC. The information included 1,960,592 funded TA course enrollments for active duty
personnel between FY95–FY08. For the purposes of their study, the sample was restricted
to undergraduate courses, leaving 1,641,740 valid enrollments (Mehay & Pema, 2010, p.
12).
In order to develop retention and promotion models, Mehay and Pema used new
recruit data generated from the Defense Manpower Data Center (DMDC) for the periods
FY94 through FY07. The purpose of this data was to determine recruit demographics and
reasons for separation. They also used data from NETC that included every TA funded
course between FY95 through FY08. The NETC data included course name, method of
delivery, course status, grades, student demographics, and completion status (Mehay &
Pema, 2010, p. 39). Both sets of data used for developing models associated with
retention and promotion were restricted in several ways. The restrictions focused on
enlisted service members with four-year terms, undergraduate course work for first term
8
Sailors, and those Sailors that completed at least 36 months of service (Mehay & Pema,
2010, p. 39).
The statistical models for determine learning outcomes used the same data set from
NETC that was used for the original observational models. The first statistical focus was on
student learning outcomes. During the period FY95–FY08, 233,459 Sailors averaged seven
TA sponsored courses during the period (Mehay & Pema, 2010, p. 47). The second
statistical focus analyzed TA participation, but the sample was restricted to first term
enlisted Sailors with four-year contracts. Of this, 255,749 Sailors from the original NETC
data set met this condition. The other statistical retention and promotion models used the
same data (Mehay & Pema, 2010, p. 50).
2. Statistical Observations
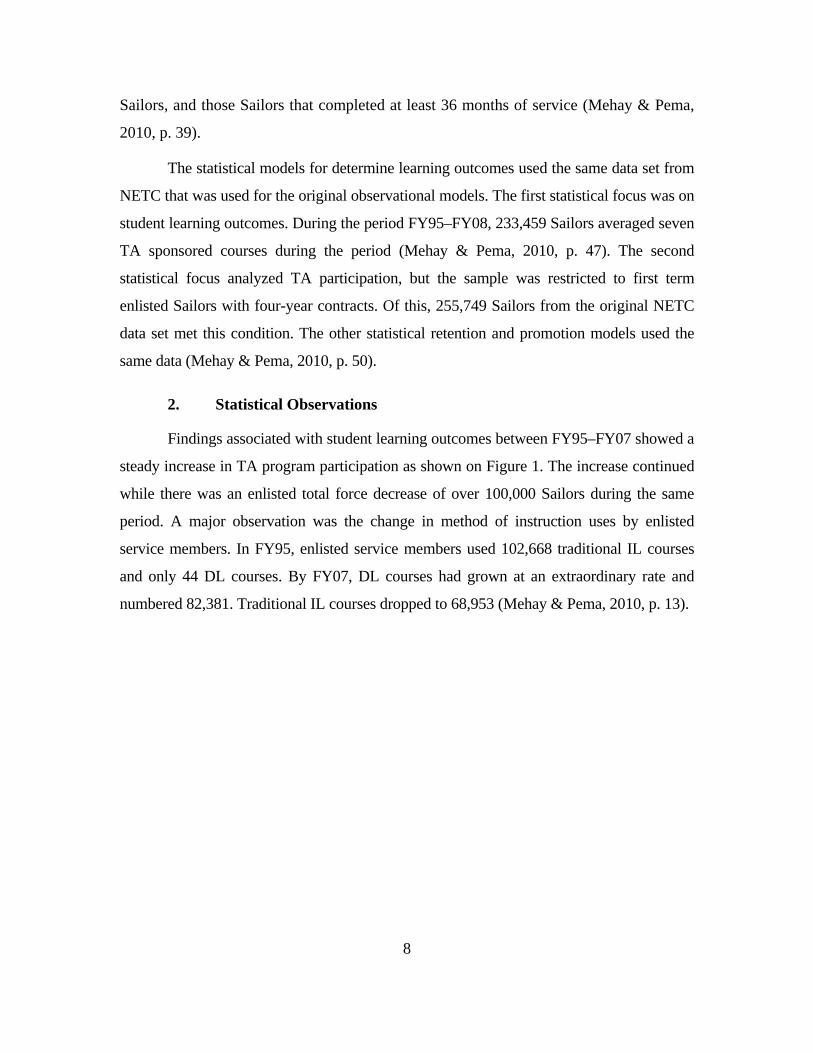
Findings associated with student learning outcomes between FY95–FY07 showed a
steady increase in TA program participation as shown on Figure 1. The increase continued
while there was an enlisted total force decrease of over 100,000 Sailors during the same
period. A major observation was the change in method of instruction uses by enlisted
service members. In FY95, enlisted service members used 102,668 traditional IL courses
and only 44 DL courses. By FY07, DL courses had grown at an extraordinary rate and
numbered 82,381. Traditional IL courses dropped to 68,953 (Mehay & Pema, 2010, p. 13).

9
Undergraduate TA Courses by Fiscal Year. Figure 1. Source: Mehay and Pema (2010).
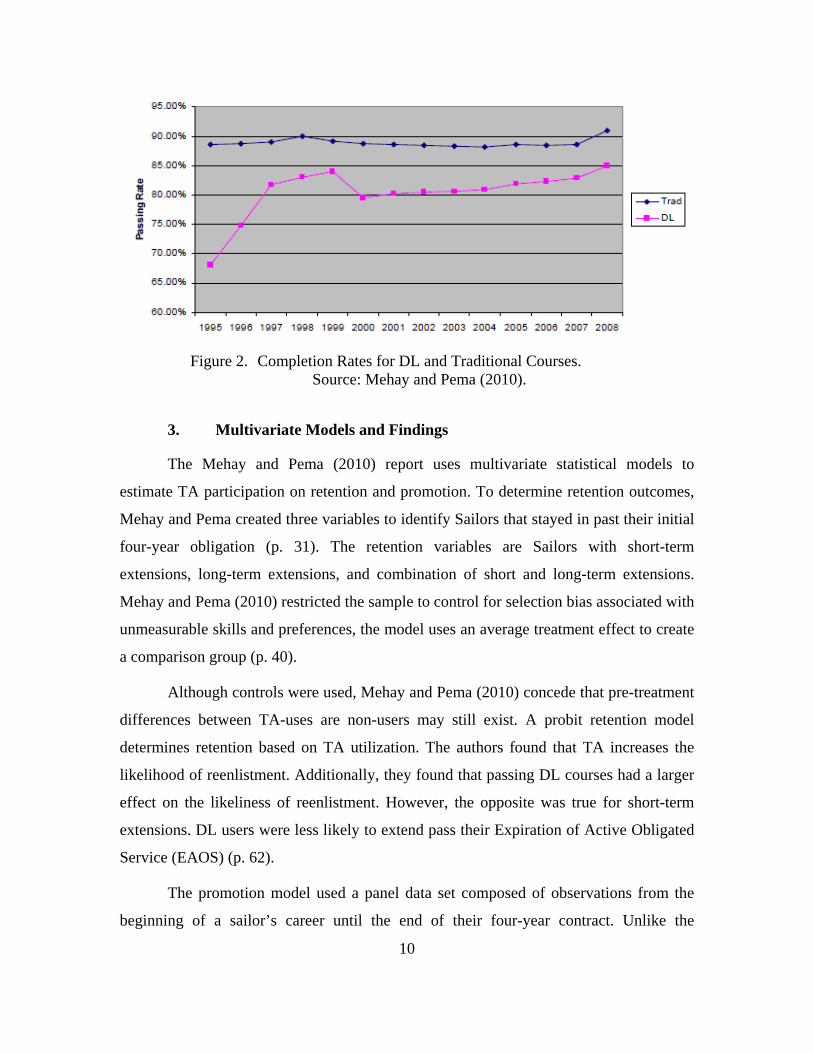
Although DLs had a major increase over the 13-year period in this report,
completion rates using DL and IL told a slightly different story. Traditional IL courses
showed steadily higher completion rate over the observed period, while DL has been
consistently lower than IL. However, the reduction in the completion gap between DL
and IL may be the result of improvements in the delivery of DL coupled with greater
accessibility to computers and Internet for Sailors. Evidence of this phenomenon provide
in Figure 2.
10
Completion Rates for DL and Traditional Courses. Figure 2. Source: Mehay and Pema (2010).
3. Multivariate Models and Findings
The Mehay and Pema (2010) report uses multivariate statistical models to
estimate TA participation on retention and promotion. To determine retention outcomes,
Mehay and Pema created three variables to identify Sailors that stayed in past their initial
four-year obligation (p. 31). The retention variables are Sailors with short-term
extensions, long-term extensions, and combination of short and long-term extensions.
Mehay and Pema (2010) restricted the sample to control for selection bias associated with
unmeasurable skills and preferences, the model uses an average treatment effect to create
a comparison group (p. 40).
Although controls were used, Mehay and Pema (2010) concede that pre-treatment
differences between TA-uses are non-users may still exist. A probit retention model
determines retention based on TA utilization. The authors found that TA increases the
likelihood of reenlistment. Additionally, they found that passing DL courses had a larger
effect on the likeliness of reenlistment. However, the opposite was true for short-term
extensions. DL users were less likely to extend pass their Expiration of Active Obligated
Service (EAOS) (p. 62).
The promotion model used a panel data set composed of observations from the
beginning of a sailor’s career until the end of their four-year contract. Unlike the

11
reenlistments and extensions used for the retention, promotion outcomes do not occur at
fixed points and using panel data allows for control of unobserved heterogeneity.
Differencing out the fixed effects over time removed the self-selection bias.
Although TA users were more likely to promote to E-5 during their first four
years of service, it was limited to those who enrolled and passed courses using the DL
course of instruction. The report found the promotion effect was statistically insignificant
when users enrolled and passed traditional IL courses of instruction.
B. PROBLEM-BASED LEARNING AND PEDAGOGY IN THE 21ST CENTURY
In a world constantly changing, learners are in the driver’s seat. The ability to
search for answers is a click away. This has had a significant impact on how individuals
are learning and the challenges teachers are having with keeping up in this digital
environment. Online distance education is outpacing the traditional teacher-centered
pedagogy (Barber & King, 2016, p. 236). In fall 2014, one in four (28.5%) students
enrolled in at least one distance education course (National Center for Education
Statistics [NCES], n.d.). Of those 5,750,417 students, over half enrolled exclusively in
distance education courses (NCES, n.d.).
Academic institutions are in a period of flux. The rising costs of the traditional
classroom environment and the pressures to keep those classrooms full is causing
educational institutions to develop new technologies and methods of teaching. Couple
this with the fact that 90% of academic institutions offer some form of online distance
education Barber & King, 2016, p. 235) . The additional cost to maintain a quality online
program has these institutions identifying new strategies moving forward. Online
education is becoming an essential part of the long-term strategy of many institutions
(Barber & King, 2016, p. 236). A better understanding of the driver behind these changes
leads back to the student.
The 21st century student requires a 21st century learning environment, institutions,
and teachers. Rising tuition cost in traditional brick and mortar institutions and the
constantly updating knowledge base has students looking for learning alternatives. Online
12
distance education as shifted the traditional top-down teaching approach that has
dominated brick and mortar institutions. Students are taking ownership of their learning.
There has been a significant shift to a student-centered learning approach (Barber &
King, 2016, p. 236). Many institutions and experts in educational learning have pushed to
redefine the priorities of the 21st century learner. At the top of the list are creativity, self-
motivation, innovation, problem-solving and collaboration skills (Barber & King, 2016,
p. 236). Students are not just looking for expertise in a specific field of study. They are
looking for skills that will prepare them for the workforce. They are looking for the
competencies required to be successful in their future employment.
A major concern for students is that the careers they are interested in when they
start college might not exist when they finish a four-year degree. Conversely, having
these competencies might prepare them for the new careers created during their time in
college. Barber and King (2016) conducted a multi-phase qualitative study looking at
Problem Based Learning (PBL). Characteristics of PBL focus around real world
situations, group work to identify problem gaps and solutions, and an environment where
educators facilitate the education process and students gather new information through
self-directed learning (Barber & King, 2016, p. 236). Barber and King (2016) found PBL
pedagogy helps student develop greater self-responsibility in the learning process and this
in turn made the learner more creative. If the goal or moral obligation of educational
institutions is to prepare students for the real world, then investing in teacher
development and digital pedagogy maybe the link between rising institutional education
costs and demands of the 21st century learner.
PBL pedagogy and the 21st century learner clearly align. Data supports the rapid
rise in student enrollment of online education and distance education courses. The self-
directed learning approach and the immediate access to new information that is available
to the learner may be outpacing the traditional top-down brick and mortar institutions. As
demand for PBL increases, these institutions and their faculty will have to adapt to the
21st century learner.

13
C. ONLINE DISTANCE EDUCATION: TECHNOLOGICAL ADVANCES AND DIGITAL NATIVES
1. Improved Technology
The impact of technology on education cannot be overstated. A breakdown of
Moore’s Law indicates an exponential growth of transistors on integrated circuits to
double every 12–24 months (Borsuk et al., 2003, p. 1). The impact of smaller processors
has made computers, machines and overall computing power faster and smaller. These
efficiencies are in every facet of the developed world. Military weapon systems, design,
and integrated communication methods are improving every day. The improved
communication systems onboard naval vessels allow Sailors the opportunity to
communicate with friends, relatives, and professors when they are on the other side of the
world.
A major issue with distance education is in the name itself, distance. The other
issue is time. The limitations of time and distance were hindrances to completing distance
education at sea. Improved technology has severely reduced or removed the limits of time
and space in distance education (Renes, 2011, p. 204). Multiple sources state that online
courses are here to stay and continue to outpace the growth of traditional classroom
instruction (Renes, 2011, pp. 203–204).
The opportunities for non-traditional students who would otherwise have
difficulty pursuing education at traditional institutions has increased. Non-traditional
students who benefit from the technological advances in distance learning include;
forward deployed service-members, those with physical disabilities, working students,
self-directed learners, and many others (Renes, 2011, p. 204).
Educational institutions are listening. The majority of two-year and four-year
postsecondary institutions offer distance education courses (Renes, 2011, p. 205).
Postsecondary institutions are not just listening to the students. In many cases, their
traditional brick and mortar institution are experiencing lower numbers of enrollments
(Renes, 2011, p. 206). Improved technology has improved institutional online educational
delivery methods. Local brick and mortar programs experiencing difficulties filling

14
classrooms are benefiting from the ability to tap into a national and international market.
This is especially effects land-grant institutions who can educate the citizens within their
state by supplementing programs with enrollments from distance education courses
(Renes, 2011, p. 206).
There is no doubt technology has improved distance online education. Hundreds
of studies have compared online education to face-to-face courses and there is no
evidence that increased technology has taken away from instruction (Barakat et al., 2016,
p. 562). However, this form of learning is not without disadvantages or challenges. There
is an assumption that faculty and students adhere to a code of ethics (Barakat et al., 2016,
p. 563). To prevent ethical violations, national and regional accreditation for online
distance education exist to mitigate the possibility of compromised quality education
(Barakat et al., 2016, p. 563).
Another major concern with distance education is attrition. Factors that possibly
contribute to higher online attrition are the student’s lack of self-direction, perceived ease
of the course by the student, and unfamiliarity with the method of instruction for both the
faculty and student. One other possible consideration for higher attrition was the lack of
social cues. The emotions, facial expressions, and body language that creates
interpersonal relationships gained through face-to-face communication are lost in the
dark and less personal world of online education (Barakat et al., 2016, p. 563). As the
exponential growth in technology continues, so do the improvements in increasing the
interpersonal communication of online education.
2. Digital Natives and Digital Immigrants
Not only are technological improvements are shaping education, but the way
younger generations are learning is also affecting education. Students in the younger
generation have grown-up in a digital world. They are as skilled with a digital device as
they are with pen and paper. Digital natives are individuals born after creation of
microcomputers (Brown et al., 2016, p. 614; Hope, 2016, p. 824). With the exception of
some very young Generation-Y educators, most educators are digital immigrants who are
oblivious to language and culture of the younger generations (Brown et al., 2016, p. 616).

15
This difference in learning and teaching is becoming more apparent and requires
attention.
Before the digital explosion, earlier generations found themselves at the library
using card catalogs to find dated texts on the subjects they were studying. Many of those
individuals are now teaching the younger generations and there is disconnect between the
teacher and the students. Many education researchers believe the methodology of the pre-
digital era educators requires revision to support the younger learners (Brown et al., 2016,
p. 616). Digital immigrants are teaching “legacy” information to the digital natives.
Legacy information still holds value, but this type of information is at best, base-line
knowledge from the past (Brown et al., 2016, p. 616). Where it took significant time at a
library weeding through texts to find this base-line knowledge, the digital native can
access multiple texts on the basics of their research from their smart phone while drinking
coffee and lying in a hammock on scenic overlook. The digital native seeks “future
content.”
For those of us with children, we hear the “why” all the time. Digital natives want
to understand the basics, but find the information boring if not coupled with future
content. Digital natives want to learn about the newest information, as well as how this
information effects human culture and politics (Brown et al., 2016, p. 616). Digital
natives want learning to be fun and interactive. Not only do they want to think “outside
the box,” many students want to be physically outside the box (Hope, 2016, p. 827). They
have access to multiple technologies to improve their education experience and do not
feel the need to learn in the traditional environment. Younger generations think and learn
differently and some theorize the brain of the younger generations who have access to
digital technology are physically transforming (Brown et al., 2016, p. 616).
D. VOLED EFFECTIVENESS
The most comprehensive study on VOLED effectiveness focused on TA,
NCPACE and the impact of VOLED usage on promotion and retention. Garcia and Joy
(1998) completed a study that addressed the overall effectiveness of Navy VOLED.
Using TA data for active-duty enlisted members who joined in FY1992 and served for at

16
least five years (N = 24,756) and NCPACE data from July 1995-May 1996 (N = 11,101),
Garcia and Joy were able to show the impact of VOLED on promotion and retention. The
impact of VOLED on promotion and retention was significant (Garcia, 1998, p. 1).
Garcia and Joy (1998) indicate a 12% increase in promotion to E-5 within the first
five years of service when an enlistee has 15 college credits when compared to enlistees
with no college. They also found a 35% increase to promotion to E-5 within the first five
years of service when an enlistee has 60 college credits when compared to enlistees with
no college (Garcia & Joy, 1998, p. 2). To eliminate individual motivation bias, the model
isolated the effect of the promotion directly to VOLED (Garcia & Joy, 1998, p. 57).
The impact retention indicates a 6% increase in reenlistments when an enlistee
has 15 college credits when compared to enlistees with no college (Garcia & Joy, 1998 p.
2). They also found a 24% increase in reenlistments when an enlistee has 60 college
credits when compared to enlistees with no college (Garcia & Joy, 1998 p. 2).
Garcia and Joy (1998) found that all elements of VOLED were cost effective.
Based on a the costs associated with replacing an enlisted service member, the study
found that for every dollar spent on TA and instructor NCPACE, the Navy received two
dollars in improved retention (Garcia & Joy, 1998, p. 3). In 1998, technology based
PACE courses were the most expensive and the return on one dollar invested was lightly
over one dollar in improved retention. A key factor from the Garcia and Joy (1998) report
was the enrollment rate in NCPACE courses in 1997 was 20,200 (p.13). In 2015, the
number of enrollments was 9,969 (NETC, 2016).
E. CHAPTER SUMMARY
Based on previous studies, a marked increase in TA participation occurred
between 1996 and 2008. This increase occurred even when the U.S. Navy experienced a
drawdown in personnel. During this same period, TA experienced a dramatic shift in the
method of instruction used by service members. In 1997, a split between traditional
learning methods and distance learning methods began to emerge with distance learning
methods becoming the predominate method of choice.

17
While the Navy VOLED system experienced changes in the method of
instruction, the civilian institutions have added online distance education as a part of their
long-term strategies. The rising costs of traditional brick and mortar institutions and a
change in student learning approaches both groups reevaluating their relationship with
one another. The speed and access to information in the 21st century has students looking
for a more problem-based pedagogy focusing on old methods that relate to current and
relevant topics. If distance learning participation in the Navy is an indicator for the
civilian marker, then civilian institutions may want to consider aligning with the needs of
the students.
Couple the obvious increasing trend in online distance learning programs within
the Navy and same occurrence at civilian institutions with advances in technology and
this phenomenon begins to look like more like business as usual. The digital natives from
Generation Z and Generation Y are the majority population entering college. These
students grew up or are growing up in an era where access to information is at their
fingertips. The learner center approach and possible re-wiring of neural networks of the
younger generation may be changing the educational institution demand signal. The costs
associated with traditional brick and mortar institutions for both the institution and the
learner may begin to look less appealing.

18
THIS PAGE INTENTIONALLY LEFT BLANK
19
III. DATA AND METHODOLOGY
This chapter presents the examination method data variables used in this research.
This research uses data retrieved by NETC and provided by the Navy Education Strategy
and Policy Branch (N127). The data contains files on all TA and NCPACE students in IL
and DL programs for FY2011–FY2014. This research uses archival data to perform a
descriptive nonexperimental design to document the effectiveness of Navy VOLED
programs. The data consists of 748,344 funded TA course enrollment observations and
57,897 funded NCPACE course enrollment observations. The sample was restricted for
the purposes of this research to undergraduate and graduate courses for enlisted Navy
personnel attached to Type 2 and Type 4 commands, leaving 142,897 completed and
valid TA course enrollments and 49,945 valid NCPACE course enrollments. A Type 2
command is a commissioned deployable unit stationed within the United States and a
Type 4 command is a commissioned deployable unit stationed overseas or an overseas
land-based unit that requires members to deploy greater than 150 days per year as shown
in Figure 3 (DON, 2007). N127 requested research to focus on Type 2 and Type 4
commands. This was done to make a comparison of operational units who enrollees had
the option of method of instruction within TA or NCPACE.

20
Type Duty Assignment Codes. Source: DON (2007). Figure 3.
All relevant data gathered from NETC was via an institutional one-time transfer
to the Naval Postgraduate School. The analysis uses Microsoft Excel, JMP, IBM SPSS
statistical packages. The data file was in standard XLS format, no transposition errors
were present and the data fields converted to variable names. Additional variables
Type 1 Shore Duty (a) Duty performed in United States (U.S.) (including Hawaii and Anchorage, Alaska) land-based activities where members are not required to be absent from the corporate limits of their duty station in excess of 150 days per year. (b) Long term schooling of 18 or more months.
Type 2 Sea Duty (a) Duty performed in commissioned vessels and deployable squadrons homeported in the U.S. (including Hawaii and Alaska). (b) U.S. land-based activities and embarked staffs, which require members to operate away from their duty station in excess of 150 days per year.
Type 3 Overseas Remote Land-based Sea Duty
Duty performed in a land-based activity, which does not require members to be absent more than 150 days per year, but is credited as sea duty for rotational purposes only due to the relative undesirability of the geographic area.
Type 4 Overseas Sea Duty (a) Duty performed in commissioned vessels and deployable squadrons homeported overseas. (b) Overseas land-based activities and embarkedstaffs, which require members to operate away from their duty station in excess of 150 days per year.
Type 5 Overseas Shore Duty Duty performed in overseas land-based activities, which are credited as shore duty for rotational purposes. Members are not required to be absent from corporate limits of their duty station in excess of 150 days per year.

21
accompanied the data. However, the only variables as part of the research examined are
shown in Table 1. Minimal data grooming was required for the “grade variable” due to
policy change requirements. The policy requirements and grading standards provided by
N127 are shown in Appendix A.
Table 1. Variables and Descriptions. Adapted from NETC (2016).
A. THESIS DESIGN
The intention of this descriptive nonexperimental design is not to explicitly find
causation. The purpose is to document the characteristics of the phenomenon associated
with Navy VOLED program enrollment from FY2011–FY2014. This design method
takes place ex-post facto without influence or intrusion of the independent variable and
allows for the naturally occurring relationships of the variables. The courses examined
are between FY2011–FY2014 within the TA and NCPACE programs and their respective
method of instruction (DL or IL). Additionally, an analysis of course completion and
rank group comparisons within contracted VOLED program and method of instruction is
accomplished. The descriptive statistics for contracted VOLED program and method of
instruction are shown in Table 2.
Variables Description
Contracted VOLED program Navy College Program for Afloat College Education or Tuition Assistance
Method of Instruction Instructor‐Led or Distance Learning
Fiscal Year October‐September 2011‐2015
Course Grades "A‐F" ("P" represents "Pass", Withdraw or Incomplete considered "F")
GPA scale "A" (4.0), "B" (3.0), "C" (2.0), "D" (1.0), "F" (0.0)
Course Completion Pass / Fail
Gender Male or Female
Age Years of Age
Age Groups <25, 26 to 30, 31 to 35, 36 to 40 or >40
Pay‐Grade E‐1 to E‐9
Pay‐Grade Groups E‐1 to E‐3 (Seaman), E‐4 to E‐6 (Petty Officer) or E‐7 to E‐9 (Chief)

22
Table 2. Descriptive Statistics (VOLED Program / Method of Instruction). Adapted from NETC (2016).
The descriptive statistics for course completion and GPA scale are shown in Table
3.
Table 3. Descriptive Statistics (Course Completion / GPA Scale). Adapted from NETC (2016).
TA = 1 / NCPACE = 0 DL = 1 / IL = 0
Mean 0.74100559 Mean 0.685421226
Standard Error 0.0009976 Standard Error 0.001057411
Median 1 Median 1
Mode 1 Mode 1
Standard Deviation 0.438083669 Standard Deviation 0.464349101
Sample Variance 0.191917301 Sample Variance 0.215620087
Kurtosis ‐0.789384673 Kurtosis ‐1.362193328
Skewness ‐1.100283379 Skewness ‐0.798636838
Range 1 Range 1
Minimum 0 Minimum 0
Maximum 1 Maximum 1
Sum 142897 Sum 132178
Count 192842 Count 192842
Pass=1 / Fail=0 GPA Scale
Mean 0.857671047 Mean 2.87012684
Standard Error 0.000795623 Standard Error 0.003002731
Median 1 Median 3
Mode 1 Mode 4
Standard Deviation 0.349388116 Standard Deviation 1.318612841
Sample Variance 0.122072055 Sample Variance 1.738739826
Kurtosis 2.19201347 Kurtosis 0.085103423
Skewness ‐2.047435161 Skewness ‐1.106010995
Range 1 Range 4
Minimum 0 Minimum 0
Maximum 1 Maximum 4
Sum 165395 Sum 553481
Count 192842 Count 192842

23
The descriptive statistics for each individual Rank Group (Seaman/Petty Officer/
Chief) are shown in Table 4.
Table 4. Descriptive Statistics (Individual Rank Groups). Adapted from NETC (2016).
Seaman Petty Officer
Mean 0.131174744 Mean 0.736437083
Standard Error 0.000768762 Standard Error 0.001003253
Median 0 Median 1
Mode 0 Mode 1
Standard Deviation 0.337592242 Standard Deviation 0.440566127
Sample Variance 0.113968522 Sample Variance 0.194098512
Kurtosis 2.774501205 Kurtosis ‐0.847941151
Skewness 2.185056619 Skewness ‐1.07334414
Range 1 Range 1
Minimum 0 Minimum 0
Maximum 1 Maximum 1
Sum 25296 Sum 142016
Count 192842 Count 192842
Chief
Mean 0.132388173
Standard Error 0.00077177
Median 0
Mode 0
Standard Deviation 0.338913175
Sample Variance 0.11486214
Kurtosis 2.706235304
Skewness 2.169379459
Range 1
Minimum 0
Maximum 1
Sum 25530
Count 192842
The primary research question guiding this thesis is the following: Has the
expansion of various modalities associated with Navy distance learning programs

24
contributed to a decline in NCPACE enrollment? An analysis of other contracted
programs (TA) and instructional methods may provide insight on the effectiveness of
distance learning versus traditional instructor-led education. An evaluation of the results
will allow program managers to investigate possible areas of improvement within the
Navy’s VOLED programs. The secondary thesis questions, variables and statistical tests
are shown in Table 5.
Table 5. Variables and Statistical Tests.
Secondary Research Question Variables Threats to Validity Statistical Test Hypothesis
1. Do the enrollment rates for the TA and NCPACE programs differ within each method of instruction (DL or IL)?
VOLED program (TA or NCPACE), enrollment rate, and method of instruction (DL or IL). These variables will indicate total enrollment rate.
*Subject Characteristics (socioeconomics) *Extraneous Variable *Maturation *Interaction (institutional delivery) *Location
*Contingency Tables *Descriptive Statistics *Chi Square *Ad hoc
Null
2. Do the enrollment rates within TA and NCPACE programs differ within rank groups?
VOLED program, rank groups (E-1 to E-3), (E-4 to E-5) and (E-7 to E-9) and enrollment rate. These variables will indicate enrollment rates between enlisted rank groups
*Subject Characteristics (socioeconomics) *Extraneous Variable *Maturation *Interaction (institutional delivery) *Location
*Contingency Tables *Descriptive Statistics *Chi Square *Ad hoc
Null
3. Do the enrollment rates for method of instruction (DL or IL) differ within rank groups?
Rank groups (E-1 to E-3), (E-4 to E-5) and (E-7 to E-9), method of instruction and enrollment rate. These variables will indicate enrollment rates between enlisted rank groups based on method of instruction.
*Subject Characteristics (socioeconomics) *Extraneous Variable *Maturation *Interaction (institutional delivery) *Location
*Contingency Tables *Descriptive Statistics *Chi Square *Ad hoc
Null
4. Do the completion rates for TA and NCPACE programs differ within each method of instruction (DL or IL)?
VOLED program, completion rate (Pass or Fail), and method of instruction (DL or IL). These variables will indicate total completion rate.
*Subject Characteristics (socioeconomics) *Extraneous Variable *Maturation *Interaction (institutional delivery) *Location
*Contingency Tables *Descriptive Statistics *Chi Square *Ad hoc
Null
5. How well do member’s score based on rank groups, contracted program (TA or NCPACE) and method of instruction (DL or IL)?
VOLED program, rank groups (E-1 to E-3), (E-4 to E-5) and (E-7 to E-9) and course grades (A to F). These variables will indicate academic performance between various rank groups.
*Subject Characteristics (socioeconomics) *Extraneous Variable *Maturation *Interaction (institutional delivery) *Location
*Contingency Tables *t-test *OLS Regression *Pearson's Correlation
Null

25
B. DESCRIPTIVE STATISTICS TABLES
This section provides an initial look at the trends associated with Navy VOLED
program between FY2011–FY2015. The method of instruction (DL/IL) to both of the
Navy VOLED programs analyzed in this research (TA/NCPACE) are shown in Figure 4.
The trend has been a steady increase in DL and steady decline in IL enrollments during
this period.
Yearly Method of Instruction Enrollments for VOLED. Figure 4. Adapted from NETC (2016).
The method of instruction (DL/IL) and the Tuition Assistance (TA) program are
compared in Figure 5. A gradual declining trend in IL enrollments within the TA
program is apparent during this period, but there has been steady increasing trend in DL
enrollments within the same period.

26
Yearly Method of Instruction Enrollments for TA. Figure 5. Adapted from NETC (2016).
A comparison of method of instruction (DL/IL) and the Navy College Program
for Afloat College Education (NCPACE) program are shown in Figure 6. A gradual
declining trend in DL enrollments within the TA program is apparent during this period,
but there has been sharp decreasing trend in IL enrollments within the same period.
Yearly Method of Instruction Enrollments for NCPACE. Figure 6. Adapted from NETC (2016).

27
A comparison of enrollments by rank groups within the TA program. Seaman (E-
1 to E-3), Petty Officer (E-4 to E-6) and Chief Petty Officer (E-7 to E-9) differentiate the
three rank groups are shown in Figure 7. The most noticeable aspect of this data is the
amount of enrollments that fall within the ranks E-4 to E-6. This rank group is more than
twice as large as the other two rank groups combined. The trend associated with the Petty
Officer rank group is of a steady yearly increase. The trend associate with the Chief Petty
Officer rank group has remained relatively constant over the same period. There has been
a gradual declining trend associated within the Seaman rank group.
Yearly Rank Group Enrollment for TA. Figure 7. Adapted from NETC (2016).
A comparison of enrollments by rank groups within the NCPACE program are
shown in Figure 8. Seaman (E-1 to E-3), Petty Officer (E-4 to E-6) and Chief Petty
Officer (E-7 to E-9) differentiate the three rank groups. The same noticeable trend within
ranks E-4 to E-6 regarding overall enrollment size exists. However, the trend associated

28
with the Petty Officer rank group is of a moderate yearly decrease in enrollments. This
decrease mirrors the similar trend in the Seaman rank group and represents the significant
decline in overall NCPACE enrollments. The trend associate with the Chief Petty Officer
rank group has remained relatively constant over the same period, although small in
comparison (approx. 5%-7% of total enrollments).
Yearly Rank Group Enrollment for NCPACE. Figure 8. Adapted from NETC (2016).
C. PRIVACY CONSIDERATIONS
To safeguard human subject privacy, all necessary Personally Identifiable
Information (PII) data fields were omitted IAW the Privacy Act of 1974 prior to receipt
of data from NETC. PII is any information that aids to distinguish or trace an individual’s
identity. All DOD personnel and institutions are responsible for the safeguarding of PII.

29
D. CHAPTER SUMMARY
This chapter summarizes data, presents research methodology, acknowledges
risks to validity, provides predictions, and describes variable descriptions utilized for data
analysis. Descriptive statistic tables provide preliminary trend analysis and these tables
provide the initial concerns with an apparent downward trend in NCPACE enrollment
rates. This actual data tends to support the foregone conclusion made by many
policymakers and is the reason the research was requested. The following chapters
present the data results, summary conclusion and recommendations for this research.

30
THIS PAGE INTENTIONALLY LEFT BLANK

31
IV. RESULTS
The objective of this analysis is to develop a body of knowledge through a
comparison of enrollments within TA and NCPACE and the method of instruction (DL/
IL) at type 2 and type 4 commands. A restatement of the secondary research questions
and the associated null hypothesis accompanies the results. The analytical comparisons,
hypothesis determination and differences existing between VOLED programs identified:
A. Do the enrollment rates for the TA and NCPACE programs differ within
each method of instruction (DL or IL)? Null Hypothesis: There are no differences in
enrollment rates between method of instruction (DL or IL) and Navy VOLED program
(TA or NCPACE). The raw data associated with Appendix B further examined each
fiscal year and a consolidation of the entire period. For the purposes of the results
analysis, the total period (FY11-FY15) is the primary focus of discussion, unless specific
phenomena across time-periods warrants discussion.
We use the full sample (N) of 192,842 observations. Of those enrolled in
NCPACE, 46.8% used the DL option. In contrast, of those enrolled in TA, 76.1% used
the DL option. Of those enrolled in NCPACE, 53.2% used the IL option. In contrast, of
those enrolled in TA, 23.9% used the IL option. The results of the Pearson’s Chi-Square
test indicates a p-value of less than .001, which provides very strong evidence to reject
the null hypothesis. Results shown in Table 6.

32
Table 6. NCPACE and TA Enrollment by Method of Instruction. Adapted from NETC (2016).

33
B. Do the enrollment rates within TA and NCPACE programs differ within
rank groups? Null Hypothesis: There is no difference in enrollments rates for TA and
NCPACE within rank groups. The raw data associated with Appendix C further
examined each fiscal year and a consolidation of the entire period. For the purposes of the
results analysis, the total period (FY11-FY15) is the primary focus of discussion, unless
specific phenomena across time-periods warrants discussion.
We use the full sample (N) of 192,842 observations. The results indicate that
among course enrollments in NCPACE, 23.4% were in the Seaman category (E1 to E3)
as opposed to 9.5% in TA. Among course enrollments in the Petty Officer category (E-4
to E-6), 24.7% used NCPACE. In contrast, the Petty Officer category used the TA
program, 75.3%. Finally, among course enrollments in the Chief Petty Officer category
(E-7 to E-9), 12.3% used NCPACE. In contrast, the Chief Petty Officer category used the
TA program, 87.7%. The results of the Pearson’s Chi-Square test indicates a p-value of
less than .001, which provides very strong evidence to reject the null hypothesis. Based
on the results, there is a statistically significant relationship between the variables.
Results shown in Table 7.

34
Table 7. Rank Group by Contracted VOLED Program. Adapted from NETC (2016).

35
C. Do the enrollment rates for method of instruction (DL or IL) differ within
rank groups? Null Hypothesis: There is no difference in enrollments rates for method of
instruction (DL or IL) within rank groups. The raw data associated with Appendix D
further examined each fiscal year and a consolidation of the entire period. For the
purposes of the results analysis, the total period (FY11-FY15) is the primary focus of
discussion, unless specific phenomena across time-periods warrants discussion.
We use the full sample (N) of 192,842 observations. The results indicate that
among course enrollments in the Seaman category (E-1 to E-3), 43.2% used the DL
method of instruction. In contrast, the Seaman category used the IL method of
instruction, 56.8%. Among course enrollments in the Petty Officer category (E-4 to E-6),
70.2% used the DL method of instruction. In contrast, the Petty Officer category used the
IL method of instruction, 29.8%. Finally, among course enrollments in the Chief Petty
Officer category (E-7 to E-9), 84.3% used the DL method of instruction. In contrast, the
Chief Petty Officer category used the IL method of instruction, 15.7%. The results of the
Pearson’s Chi-Square test indicates a p-value of less than .001, which provides very
strong evidence to reject the null hypothesis. Based on the results, there is a statistically
significant relationship between the variables. Results shown in Table 8.

36
Table 8. Method of Instruction by Rank Group. Adapted from NETC (2016).

37
D. Do the completion rates for TA and NCPACE programs differ within each
method of instruction (DL or IL)? Null Hypothesis: There is no difference in completion
rates for the TA and NCPACE programs or within method of instruction (DL or IL). The
raw data associated with Appendix E further examined each fiscal year and a
consolidation of the entire period. This question compares completion rate to contracted
program and completion rate to method of instruction and requires two separate
explanations. For the purposes of the results analysis, the total period (FY11-FY15) is the
primary focus of discussion, unless specific phenomena across time-periods warrants
discussion.
We use the full sample (N) of 192,842 observations. The results indicate that
among enrollments utilizing NCPACE, 80.5% completed coursework. In contrast, 19.5%
failed to complete coursework within the NCPACE program. Among enrollments
utilizing TA, 91.2% completed coursework. In contrast, 8.8% failed to complete
coursework with the TA program. The results of the Pearson’s Chi-Square test indicates a
p-value of less than .001, which provides very strong evidence to reject the null
hypothesis. Based on the results, there is a statistically significant relationship between
the variables. Results shown in Table 9.

38
Table 9. Completion Rate by Contracted VOLED Program. Adapted from NETC (2016).
The results indicate that among enrollments utilizing the DL method of
instruction, 87.4% completed coursework. In contrast, 12.6% failed to complete
coursework when using the DL method of instruction. Among enrollments utilizing IL
method of instruction TA, 90.6% completed coursework. In contrast, 9.4% failed to
complete coursework when using the IL method of instruction. Results shown in Table
10.

39
Table 10. Completion Rate by Method of Instruction. Adapted from NETC (2016).
E. Do sailor’s grades (GPA scale) vary by rank groups, contracted program
(TA or NCPACE) or method of instruction (DL or IL)? Null Hypothesis: There is no
difference in grade performance based on rank groups, contracted program (TA or

40
NCPACE) or method of instruction (DL or IL). The raw data associated with secondary
thesis question 5 is shown in Appendix F.
We construct an ordinary least squares regression model with grade score as a
function of rank, VOLED program, and method of instruction. The results are shown in
Table 11.
All independent variables are highly statistically significant. For the contracted
program, NCPACE has a coefficient of -0.33. This means that, all else equal, NCPACE
enrollments are correlated with grades that are lower by nearly 1/3 of a letter grade,
relative to TA enrollments. In addition, all else equal, taking a class via the DL method is
correlated with a grade that is 0.13 points lower, relative to IL. The positive coefficients
for both rank groups shown indicates that enrollments with higher-ranking Sailors are
correlated with higher grades relative to junior Sailors.
Results of the multiple linear regression model indicate a low adjusted R-Square
(.065). The three independent variables (rank groups, contracted program, and method of
instruction) only explain 6.5% of the variation in the dependent variable (grade
performance) However, the overall model is statistically significant. The F-statistic has
an overall p-value of 0.00 and is well below .01 for the 99% confidence levels.
Table 11. Summary of Fit and Regression Parameter Estimates. Adapted from NETC (2016).

41
A. CHAPTER SUMMARY
The model for question one provides evidence of a statistically significant
difference exists between enrollments and method of instruction (DL/IL) for both
contracted VOLED programs (TA/NCPACE). A statistically significant difference
between enrollments rates and rank groups for both contracted VOLED programs
occurred within every time-period between FY2011 and FY2015. The model for question
two provides evidence of a statistically significant difference between enrollments and
rank groups for both contracted VOLED programs (TA/NCPACE). A statistically
significant difference between enrollments rates and rank groups for both contracted
VOLED programs occurred within every time-period between FY2011 and FY2015. The
model for question three provides evidence of a statistically significant difference
between enrollments and rank groups for both methods of instruction (DL/IL). A
statistically significant difference between enrollments rates and rank groups for both
methods of instruction occurred within every time-period between FY2011 and FY2015.
The models for question four provide evidence of a statistically significant
difference exists between enrollments resulting in course completion and both contracted
VOLED programs (TA/NCPACE). The same statistically significance difference exists
between enrollments resulting in course completion and method instruction (DL/IL). A
statistically significant difference for both models occurred within every time-period
between FY2011 and FY2015.
The regression model for question five provides statistically significant evidence
of a relationship between contracted VOLED program (TA/NCPACE), method of
instruction, and rank groups on overall grade performance. Each variable on grade
performance yields a statistically significant coefficient at the 99% confidence level and
thus the model is highly reliable. However, the low R-squared indicates only a small
relationship on overall grade performance and using only these three variables to predict
performance would not be advantageous.

42
THIS PAGE INTENTIONALLY LEFT BLANK

43
V. SUMMARY CONCLUSIONS AND RECOMMENDATIONS
The purpose of this research is to evaluate if NCPACE enrollment has
experienced a decline by an expansion of various modalities and to evaluate areas of
improvement within Navy VOLED. This chapter will consist of summary conclusions, an
interpretation of findings, and recommendations for further research.
A. SUMMARY
The primary research question asked if the expansion of various modalities
associated with Navy distance learning programs contributed to a decline in NCPACE
enrollment. The short answer is yes. NCPACE has experienced a decline in overall
enrollments while other modalities have experienced an increase in overall enrollments.
However, does this make the NCPACE an ineffective or outdated program for Sailors
attached to Type 2 and Type 4 commands? Maybe.
A benefit of this research is provide observational trends within the two most
utilized VOLED programs in the Department of the Navy. These trends only provide a
snapshot of analysis over a specific period with specific variables. It is up to
policymakers to utilize current and past research to make decisions to ensure program
improvement. The following section provides the conclusions and recommendations for
each of the secondary research questions. This analysis provides the body of evidence to
make a determination on the primary research question.
B. CONCLUSION AND RECOMMENDATIONS
1. Do the Enrollment Rates for TA and NCPACE Differ by Method of Instruction (IL or DL)?
Secondary research question one focused on the differences between each method
of instruction (DL/IL) and enrollment rates for each contracted VOLED program. The
results of the Pearson’s Chi-Square test indicates a value of 14755, an adequate expected
count, one degree of freedom and a p-value of 0.00. This equates to a p-value of less than

44
.001 which provides very strong evidence to reject the null hypothesis and that the two
variables (method of instruction and contracted program) are independent.
a. Conclusion
It is clear that DL courses in the TA program indicated consistently higher
enrollments rates than IL courses. The same observation for DL courses in the NCPACE
program indicated lower overall enrollment rates than IL. However, the trend between
FY2011 and FY2015 indicated IL course enrollment consistently decreased within both
contracted VOLED program between these periods. In FY2014, DL course enrollment
overtook IL course enrollments and the increasing trend continued in FY2015.
Secondary research question one findings implied yearly and overall DL course
enrollments within the TA program promotes higher enrollment rates. The overall data
during the observed period indicates IL enrollment rates were higher than DL enrollment
rates, the yearly trend shows a clear shift to the DL method of instruction. Post FY2015
trend analysis will help to determine if DL will continue to be the primary method of
instruction choice for Sailors.
b. Recommendation
The average age of enrollments during the observation period was 29 years old.
This correlates to an average birth year between 1982 and 1986. Millennials are anyone
born after 1980. This indicates the majority of the enrollees grew up using the Internet
and had access to other forms of advancing technology. These enrollees are digital
natives and as the years advance, this technology savvy learner phenomenon will
continue. Couple this with advances in shipboard technology and communication and DL
may continue to be the primary method of instruction. Further trend analysis may confirm
this theory. This is only one metric of many needed for policy change. At some point, it
may be necessary for policymakers to weigh the costs of the IL method within Navy
contracted VOLED programs.

45
2. Do the Enrollment Rates for TA and NCPACE Differ within Rank Groups?
Secondary research question two focused on the differences between rank groups
and enrollment rates for each contracted VOLED program. The results of the Pearson’s
Chi-Square test indicates a value of 7981, an adequate expected count, two degrees of
freedom and a p-value of 0.00. This equates to a p-value of less than .001 which provides
very strong evidence to reject the null hypothesis and that the two variables (rank groups
and contracted program) are independent.
a. Conclusion
It is clear that Petty Officer (E-4 to E-6) enrollments in the TA program indicated
consistently higher enrollments rates than both Seaman (E-1 to E-3) and Chief (E-7 to E-
9) enrollments, combined. The same observation for the NCPACE program indicated a
similar result for the TA program. However, for both programs between FY2011 and
FY2015 indicates an increasing trend in Petty Officer enrollment and a decreasing trend
in Seaman enrollments. Chief enrollments have remained relatively constant for both
programs.
b. Recommendation
The increasing mid-grade enlisted enrollments and the decreasing junior-grade
enrollments may be a result of stricter policies regarding enrollment eligibility.
Additionally, the greater latitude given to operational commanders to emphasize and
approve a balance between professional career progression, warfare qualification and
volunteer education may help shift junior Sailors priorities. Sailors may be putting
VOLED off until proving themselves as naval professionals. Recommend next fleet
survey on VOLED to include service member thoughts on balancing military VOLED
with career milestones (i.e., qualifications). Because VOLED is a recruiting and retention
tool, any policies targeting specific rank groups to reduce program cost may have
unintended effects on initial and first-term reenlistment.

46
3. Do the Enrollment Rates for Method of Instruction (IL or DL) Differ within Rank Groups?
Secondary research question three focused on the differences between rank
groups and enrollment rates for each method in instruction (DL/IL). The results of the
Pearson’s Chi-Square test indicates a value of 10677, an adequate expected count, two
degrees of freedom and a p-value of 0.00. This equates to a p-value of less than .001
which provides very strong evidence to reject the null hypothesis and that the two
variables (rank groups and contracted program) are independent.
a. Conclusion
It is clear that Petty Officer (E-4 to E-6) and Chief (E-7 to E-9) rank groups have
consistently higher enrollments within the DL method of instruction. Both rank groups
showed an increasing trend in DL enrollment and an inverse relationship for IL
enrollments during the period. Total Seaman (E-1 to E-3) rank group enrollments showed
a preference for the IL method of instruction. However, similar to the other two rank
groups, the trend shifted from an IL preference to a DL preference during the observed
period. DL overtook IL preference in FY2015 for the Seaman rank group.
b. Recommendation
Enrollments are experiencing an obvious shift away from IL, in favor of DL
within every rank group. This trend could also be a result of improved shipboard
technology and communication. A counter-argument to the digital native theory shows in
this result, as more Seaman rank group preferred the IL method of instruction. Although
this was the case as a whole, the trend and eventual shift to DL during the period still
supports the digital native theory. Additionally, the option to take DL or IL is available to
for both contracted programs (TA and NCPACE). However, NCPACE supports the IL
method of instruction when service members actually deploy. The overall and consistent
decreasing enrollment trend in IL should have policymakers weighing the costs of
NCPACE IL courses. However, those identifying return-on-investment of IL courses
should be careful not to exclude other harder to quantify benefits of IL courses (i.e.,
recruitment tool).

47
4. Do the Completion Rates for TA and NCPACE Differ by Method of Instruction (IL or DL)?
Secondary research question four focused on the differences between each
method of instruction (DL/IL) and completion rates for each contracted VOLED program
(TA/NCPACE). The results of the Pearson’s Chi-Square test comparing completion rates
to method of instruction indicates a value of 403 and the results of the Pearson’s Chi-
Square test comparing completion rates to contracted VOLED program indicates a value
of 4138. Both comparisons had an adequate expected count, one degree of freedom and a
p-value of 0.00. This equates to a p-value of less than .001 for both comparisons, which
provides very strong evidence to reject both null hypothesis, and that all variables are
independent. Based on the results, there is a statistically significant relationship between
both sets of variables.
a. Conclusion
It is clear IL courses indicate consistently higher completion rates (91%) when
compared to DL courses (87%). Although the trend is steady across the period of
observation, only four percentage points separate the two methods of instruction. The
comparison of completion rates within contracted VOLED program indicates a visibly
higher completion rate for the TA program (91%) compared to the NCPACE program
(81%). The completion rate trend for both programs remained relatively consistent
between FY2011 and FY2015.
Completion rates provide an indicator for program performance. Traditional IL
courses have historically provided higher completion rates when compared to DL
methods. However, the delta between the two methods has been slowly decreasing over
time. The 81% completion rate for the NCPACE program indicates that inefficiencies
within this contracted VOLED program may exist.
b. Recommendation
The higher completion rate for the TA program could be a result of personal
course ownership and financial responsibility. The TA program requires enrollees to

48
reimburse Navy College for failing to complete courses. In contrast, failing to complete
or pass a NCPACE course does not result in reimbursement on the part of the member.
As mentioned in Chapter I, enrollees have the opportunity to choose from a
significantly greater portfolio of colleges and universities when using TA. This freedom
to choose may also provide additional buy-in when enrolling in courses. Recommend
next fleet survey on VOLED to include service member thoughts on individual
motivation factors for choosing a particular contracted VOLED program or method of
instruction. Another recommendation would be to create and require an, internal to Navy
College, end-of-course Student Opinion Form (SOF) that addresses similar data or
reasons for not completing a course.
5. How Well Do Member’s Score Based on Rank Groups, Contracted Program (TA or NCPACE) and Method of Instruction (DL or IL)?
Secondary research question five provides statistically significant evidence of a
relationship between contracted VOLED program (TA/NCPACE), method of instruction,
and rank groups on overall grade performance.
a. Conclusion
The relationship is statistically significant and indicates TA enrollees tend to
achieve higher grades compared to NCPACE. Higher performance also occurs within
higher rank groups and enrollees who choose IL over DL as their method of instruction.
As mentioned, while the relationships appear statistically significant, r, the low R-square
associated with this model would provide poor predicative power on grade performance.
b. Recommendation
In order to create a more predicative model, recommend Navy College collect
extensive demographic data on service members. Variables that may improve
performance predictability would be high school GPA, race, ASVAB scores, and regional
data. The intentions of this secondary research question was to provide a basic insight
into the variables that could correlate to grade performance. However, the primary focus
of this research was to determine if NCPACE was experiencing a decline in enrollment

49
due to various modalities and to evaluate areas of improvement within this program.
Although this predicative model may help to identify possible efficiencies on how to
improve grade performance, the larger issue at hand is to determine if NCPACE is still a
cost effective and viable option in the Navy VOLED system.
C. FURTHER RESEARCH
A key factor to VOLED program performance is controlling and measuring
current, past and future metrics to assure desired results. Desired outcomes require clearly
defined and prioritized performance indicators. The internal mechanisms that assist in
achieving the desired external outcomes are through program processes, policies, and the
resources such as funding, people and time that provide the output metric.
Based on the research results, it is apparent DL has surpasses traditional IL as the
primary method of instruction within both contracted VOLED programs. An in-depth
analysis and history of communication and technological advances onboard ship may
provide the data necessary to correlate the proliferation of DL enrollments within the
Navy VOLED system. Additionally, a similar analysis of shore-based commands will
establish a baseline of findings in order to determine if all Type Duty assignment codes
have experienced the same phenomenon.
The continued declining NCPACE enrollment rate needs addressing. To ensure
proper fiscal stewardship, recommend an in-depth Cost Benefit Analysis (CBA) of the
NCPACE program. If the program continues to underperform, at what point do the costs
of operating the program outweigh the benefits. A predictive cut-off point will allow
policymakers to consider possible alternative programs, make corrective actions to
improve NCPACE efficiency, or dissolve the program entirely.

50
THIS PAGE INTENTIONALLY LEFT BLANK

51
APPENDIX A. NAVY COLLEGE VOLED GRADING STANDARDS
FY11 FY11 FY12-14
Grades Undergrad Grad Undergrad
A Passing Passing Passing
B Passing Passing Passing
C Passing Passing Passing
D Passing Passing Passing
E Passing Passing Passing
F Failure Failure Failure
FN Failure Failure Failure
I Incomplete Incomplete Incomplete
N Failure Failure Failure
NC Failure Failure Failure
Null Pending Pending Pending
W Personal Withdrawal (failure)
Personal Withdrawal (failure)
Personal Withdrawal (failure)
WX Duty Withdrawal (failure)
Duty Withdrawal (failure)
Duty Withdrawal (failure)
FY12-14 FY15 FY15
Grades Grad Undergrad Grad
A Passing Passing Passing
B Passing Passing Passing
C Passing Fail Passing
D Fail Fail Fail
E Passing Passing Passing
F Failure Failure Failure
FN Failure Failure Failure
I Incomplete Incomplete Incomplete
N Failure Failure Failure
NC Failure Failure Failure
Null Pending Pending Pending
W Personal Withdrawal (failure)
Personal Withdrawal (failure)
Personal Withdrawal (failure)
WX Duty Withdrawal (failure)
Duty Withdrawal (failure)
Duty Withdrawal (failure)
Adapted from NETC (2016).

52
THIS PAGE INTENTIONALLY LEFT BLANK

53
APPENDIX B. FULL MODEL ENROLLMENT RATE CHI-SQUARED TEST, DIFFERENCES BETWEEN CONTRACTED
PROGRAM AND METHOD OF INSTRUCTION
Case Processing Summary
Cases
Valid Missing Total
N Percent N Percent N Percent Contracted Program * DL/IL * Fiscal Year
192842 1.0 0 .0 192842 1.0
Contracted Program * DL/IL * Fiscal Year Crosstabulation
Fiscal Year
DL/IL
Total DL IL 2011 Contracted
Program NCPACE Count 5120 7548 12668
Expected Count
8059.5 4608.5 12668.0
% within Contracted Program
40% 60% 100%
% within DL/IL
20% 52% 32%
% of Total 13% 19% 32%
TA Count 20257 6963 27220
Expected Count
17317.5 9902.5 27220.0
% within Contracted Program
74% 26% 100%
% within DL/IL
80% 48% 68%
% of Total 51% 17% 68%
Total Count 25377 14511 39888
Expected Count
25377.0 14511.0 39888.0
% within Contracted Program
64% 36% 100%
% within DL/IL
100% 100% 100%
% of Total 64% 36% 100%

54
2012 Contracted Program
NCPACE Count 5072 6201 11273
Expected Count
7397.4 3875.6 11273.0
% within Contracted Program
45% 55% 100%
% within DL/IL
20% 46% 29%
% of Total 13% 16% 29%
TA Count 20390 7139 27529
Expected Count
18064.6 9464.4 27529.0
% within Contracted Program
74% 26% 100%
% within DL/IL
80% 54% 71%
% of Total 53% 18% 71%
Total Count 25462 13340 38802
Expected Count
25462.0 13340.0 38802.0
% within Contracted Program
66% 34% 100%
% within DL/IL
100% 100% 100%
% of Total 66% 34% 100%
2013 Contracted Program
NCPACE Count 3931 5236 9167
Expected Count
6129.8 3037.2 9167.0
% within Contracted Program
43% 57% 100%
% within DL/IL
15% 41% 24%
% of Total 10% 13% 24%
TA Count 22018 7621 29639
Expected Count
19819.2 9819.8 29639.0
% within Contracted Program
74% 26% 100%
% within DL/IL
85% 59% 76%
% of Total 57% 20% 76%

55
Total Count 25949 12857 38806
Expected Count
25949.0 12857.0 38806.0
% within Contracted Program
67% 33% 100%
% within DL/IL
100% 100% 100%
% of Total 67% 33% 100%
2014 Contracted Program
NCPACE Count 4285 4142 8427
Expected Count
6026.2 2400.8 8427.0
% within Contracted Program
51% 49% 100%
% within DL/IL
16% 39% 22%
% of Total 11% 11% 22%
TA Count 22586 6563 29149
Expected Count
20844.8 8304.2 29149.0
% within Contracted Program
77% 23% 100%
% within DL/IL
84% 61% 78%
% of Total 60% 17% 78%
Total Count 26871 10705 37576
Expected Count
26871.0 10705.0 37576.0
% within Contracted Program
72% 28% 100%
% within DL/IL
100% 100% 100%
% of Total 72% 28% 100%
2015 Contracted Program
NCPACE Count 4974 3436 8410
Expected Count
6350.1 2059.9 8410.0
% within Contracted Program
59% 41% 100%
% within DL/IL
17% 37% 22%
% of Total 13% 9% 22%

56
TA Count 23545 5815 29360
Expected Count
22168.9 7191.1 29360.0
% within Contracted Program
80% 20% 100%
% within DL/IL
83% 63% 78%
% of Total 62% 15% 78%
Total Count 28519 9251 37770
Expected Count
28519.0 9251.0 37770.0
% within Contracted Program
76% 24% 100%
% within DL/IL
100% 100% 100%
% of Total 76% 24% 100%
Total Contracted Program
NCPACE Count 23382 26563 49945
Expected Count
34233.4 15711.6 49945.0
% within Contracted Program
47% 53% 100%
% within DL/IL
18% 44% 26%
% of Total 12% 14% 26%
TA Count 108796 34101 142897
Expected Count
97944.6 44952.4 142897.0
% within Contracted Program
76% 24% 100%
% within DL/IL
82% 56% 74%
% of Total 56% 18% 74%
Total Count 132178 60664 192842
Expected Count
132178.0 60664.0 192842.0
% within Contracted Program
69% 31% 100%
% within DL/IL
100% 100% 100%
% of Total 69% 31% 100%

57
Chi-Square Tests
Fiscal Year Value df
Asymp. Sig. (2-sided)
Exact Sig. (2-sided)
Exact Sig. (1-sided)
2011 Pearson Chi-Square
4318.459 1 .000
Continuity Correctionb
4316.990 1 .000
Likelihood Ratio
4249.585 1 .000
Fisher’s Exact Test
.000 .000
N of Valid Cases
39888
2012 Pearson Chi-Square
2996.897 1 .000
Continuity Correctionb
2995.608 1 .000
Likelihood Ratio
2912.908 1 .000
Fisher’s Exact Test
.000 .000
N of Valid Cases
38802
2013 Pearson Chi-Square
3116.965 1 .000
Continuity Correctionb
3115.548 1 .000
Likelihood Ratio
2979.796 1 .000
Fisher’s Exact Test
.000 .000
N of Valid Cases
38806
2014 Pearson Chi-Square
2276.569 1 .000
Continuity Correctionb
2275.261 1 .000
Likelihood Ratio
2130.894 1 .000
Fisher’s Exact Test
.000 .000
N of Valid Cases
37576
2015 Pearson Chi-Square
1566.359 1 .000
Continuity Correctionb
1565.221 1 .000
Likelihood Ratio
1452.046 1 .000

58
Fisher’s Exact Test
.000 .000
N of Valid Cases
37770
Total Pearson Chi-Square
14755.982 1 .000
Continuity Correctionb
14754.623 1 .000
Likelihood Ratio
14089.610 1 .000
Fisher’s Exact Test
.000 .000
N of Valid Cases
192842
Symmetric Measures
Fiscal Year Value Approx.
Sig. 2011 Nominal by
Nominal Phi -.329 .000
Cramer’s V
.329 .000
N of Valid Cases 39888
2012 Nominal by Nominal
Phi -.278 .000
Cramer’s V
.278 .000
N of Valid Cases 38802
2013 Nominal by Nominal
Phi -.283 .000
Cramer’s V
.283 .000
N of Valid Cases 38806
2014 Nominal by Nominal
Phi -.246 .000
Cramer’s V
.246 .000
N of Valid Cases 37576
2015 Nominal by Nominal
Phi -.204 .000
Cramer’s V
.204 .000
N of Valid Cases 37770
Total Nominal by Nominal
Phi -.277 .000
Cramer’s V
.277 .000
N of Valid Cases 192842
Adapted from NETC (2016).

59
APPENDIX C. FULL MODEL ENROLLMENT RATE CHI-SQUARED TEST, DIFFERENCES BETWEEN CONTRACTED
PROGRAM AND RANK GROUPS
Case Processing Summary
Cases
Valid Missing Total
N Percent N Percent N Percent Contracted Program * SN/PO/CPO (E-1 to E-3=Seaman, E-4 to E-6=Petty Officer, E-7 to E-9=Chief Petty Officer) * Fiscal Year
192842 100% 0 .0 192842 100%
Contracted Program * SN/PO/CPO (E-1 to E-3=Seaman, E-4 to E-6=Petty Officer, E-7 to E-9=Chief Petty Officer) * Fiscal Year Crosstabulation
Fiscal Year
SN/PO/CPO (E-1 to E-3=Seaman, E-4 to E-6=Petty
Officer, E-7 to E-9=Chief Petty Officer)
Total
Chief Petty
Officer Petty
Officer Seaman 2011 Contracted
Program NCPACE Count 737 8293 3638 12668
Expected Count
1656.9 8885.2 2125.9 12668.0
% within Contracted Program
6% 65% 29% 100%
% within SN/PO/CPO (E-1 to E-3=Seaman, E-4 to E-6=Petty Officer, E-7 to E-9=Chief Petty Officer)
14% 30% 54% 32%
% of Total 2% 21% 9% 32%
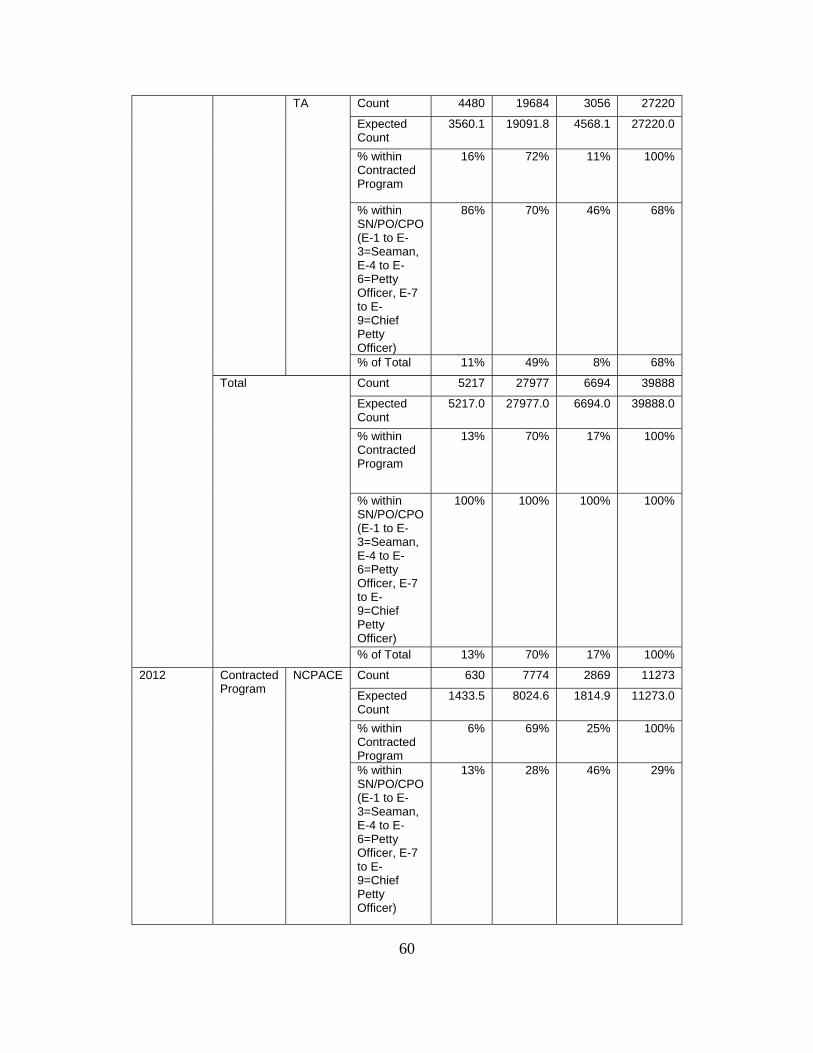
60
TA Count 4480 19684 3056 27220
Expected Count
3560.1 19091.8 4568.1 27220.0
% within Contracted Program
16% 72% 11% 100%
% within SN/PO/CPO (E-1 to E-3=Seaman, E-4 to E-6=Petty Officer, E-7 to E-9=Chief Petty Officer)
86% 70% 46% 68%
% of Total 11% 49% 8% 68%
Total Count 5217 27977 6694 39888
Expected Count
5217.0 27977.0 6694.0 39888.0
% within Contracted Program
13% 70% 17% 100%
% within SN/PO/CPO (E-1 to E-3=Seaman, E-4 to E-6=Petty Officer, E-7 to E-9=Chief Petty Officer)
100% 100% 100% 100%
% of Total 13% 70% 17% 100%
2012 Contracted Program
NCPACE Count 630 7774 2869 11273
Expected Count
1433.5 8024.6 1814.9 11273.0
% within Contracted Program
6% 69% 25% 100%
% within SN/PO/CPO (E-1 to E-3=Seaman, E-4 to E-6=Petty Officer, E-7 to E-9=Chief Petty Officer)
13% 28% 46% 29%

61
% of Total 2% 20% 7% 29%
TA Count 4304 19847 3378 27529
Expected Count
3500.5 19596.4 4432.1 27529.0
% within Contracted Program
16% 72% 12% 100%
% within SN/PO/CPO (E-1 to E-3=Seaman, E-4 to E-6=Petty Officer, E-7 to E-9=Chief Petty Officer)
87% 72% 54% 71%
% of Total 11% 51% 9% 71%
Total Count 4934 27621 6247 38802
Expected Count
4934.0 27621.0 6247.0 38802.0
% within Contracted Program
13% 71% 16% 100%
% within SN/PO/CPO (E-1 to E-3=Seaman, E-4 to E-6=Petty Officer, E-7 to E-9=Chief Petty Officer)
100% 100% 100% 100%
% of Total 13% 71% 16% 100%
2013 Contracted Program
NCPACE Count 640 6621 1906 9167
Expected Count
1221.1 6862.6 1083.3 9167.0
% within Contracted Program
7% 72% 21% 100%

62
% within SN/PO/CPO (E-1 to E-3=Seaman, E-4 to E-6=Petty Officer, E-7 to E-9=Chief Petty Officer)
12% 23% 42% 24%
% of Total 2% 17% 5% 24%
TA Count 4529 22430 2680 29639
Expected Count
3947.9 22188.4 3502.7 29639.0
% within Contracted Program
15% 76% 9% 100%
% within SN/PO/CPO (E-1 to E-3=Seaman, E-4 to E-6=Petty Officer, E-7 to E-9=Chief Petty Officer)
88% 77% 58% 76%
% of Total 12% 58% 7% 76%
Total Count 5169 29051 4586 38806
Expected Count
5169.0 29051.0 4586.0 38806.0
% within Contracted Program
13% 75% 12% 100%
% within SN/PO/CPO (E-1 to E-3=Seaman, E-4 to E-6=Petty Officer, E-7 to E-9=Chief Petty Officer)
100% 100% 100% 100%
% of Total 13% 75% 12% 100%
2014 Contracted Program
NCPACE Count 590 6290 1547 8427
Expected Count
1133.2 6456.2 837.6 8427.0
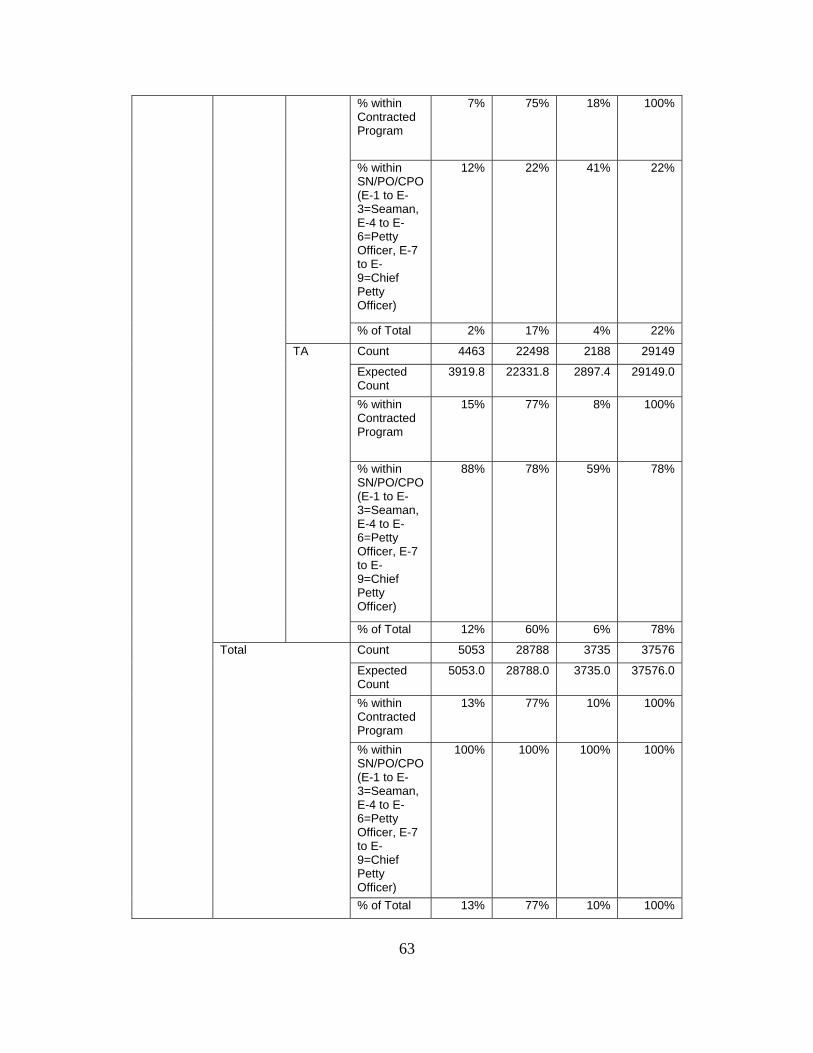
63
% within Contracted Program
7% 75% 18% 100%
% within SN/PO/CPO (E-1 to E-3=Seaman, E-4 to E-6=Petty Officer, E-7 to E-9=Chief Petty Officer)
12% 22% 41% 22%
% of Total 2% 17% 4% 22%
TA Count 4463 22498 2188 29149
Expected Count
3919.8 22331.8 2897.4 29149.0
% within Contracted Program
15% 77% 8% 100%
% within SN/PO/CPO (E-1 to E-3=Seaman, E-4 to E-6=Petty Officer, E-7 to E-9=Chief Petty Officer)
88% 78% 59% 78%
% of Total 12% 60% 6% 78%
Total Count 5053 28788 3735 37576
Expected Count
5053.0 28788.0 3735.0 37576.0
% within Contracted Program
13% 77% 10% 100%
% within SN/PO/CPO (E-1 to E-3=Seaman, E-4 to E-6=Petty Officer, E-7 to E-9=Chief Petty Officer)
100% 100% 100% 100%
% of Total 13% 77% 10% 100%

64
2015 Contracted Program
NCPACE Count 541 6149 1720 8410
Expected Count
1148.3 6363.5 898.2 8410.0
% within Contracted Program
6% 73% 20% 100%
% within SN/PO/CPO (E-1 to E-3=Seaman, E-4 to E-6=Petty Officer, E-7 to E-9=Chief Petty Officer)
10% 22% 43% 22%
% of Total 1% 16% 5% 22%
TA Count 4616 22430 2314 29360
Expected Count
4008.7 22215.5 3135.8 29360.0
% within Contracted Program
16% 76% 8% 100%
% within SN/PO/CPO (E-1 to E-3=Seaman, E-4 to E-6=Petty Officer, E-7 to E-9=Chief Petty Officer)
90% 78% 57% 78%
% of Total 12% 59% 6% 78%
Total Count 5157 28579 4034 37770
Expected Count
5157.0 28579.0 4034.0 37770.0
% within Contracted Program
14% 76% 11% 100%
% within SN/PO/CPO (E-1 to E-3=Seaman, E-4 to E-6=Petty Officer, E-7 to E-9=Chief Petty Officer)
100% 100% 100% 100%
% of Total 14% 76% 11% 100%

65
Total Contracted Program
NCPACE Count 3138 35127 11680 49945
Expected Count
6612.1 36781.4 6551.5 49945.0
% within Contracted Program
6% 70% 23% 100%
% within SN/PO/CPO (E-1 to E-3=Seaman, E-4 to E-6=Petty Officer, E-7 to E-9=Chief Petty Officer)
12% 25% 46% 26%
% of Total 2% 18% 6% 26%
TA Count 22392 106889 13616 142897
Expected Count
18917.9 105234.6 18744.5 142897.0
% within Contracted Program
16% 75% 10% 100%
% within SN/PO/CPO (E-1 to E-3=Seaman, E-4 to E-6=Petty Officer, E-7 to E-9=Chief Petty Officer)
88% 75% 54% 74%
% of Total 12% 55% 7% 74%
Total Count 25530 142016 25296 192842
Expected Count
25530.0 142016.0 25296.0 192842.0
% within Contracted Program
13% 74% 13% 100%
% within SN/PO/CPO (E-1 to E-3=Seaman, E-4 to E-6=Petty Officer, E-7 to E-9=Chief Petty Officer)
100% 100% 100% 100%
% of Total 13% 74% 13% 100%

66
Chi-Square Tests
Fiscal Year Value df
Asymp. Sig. (2-sided)
2011 Pearson Chi-Square
2382.143 2 .000
Likelihood Ratio
2375.600 2 .000
N of Valid Cases
39888
2012 Pearson Chi-Square
1508.676 2 .000
Likelihood Ratio
1546.599 2 .000
N of Valid Cases
38802
2013 Pearson Chi-Square
1191.095 2 .000
Likelihood Ratio
1146.791 2 .000
N of Valid Cases
38806
2014 Pearson Chi-Square
1115.607 2 .000
Likelihood Ratio
1063.130 2 .000
N of Valid Cases
37576
2015 Pearson Chi-Square
1389.651 2 .000
Likelihood Ratio
1325.676 2 .000
N of Valid Cases
37770
Total Pearson Chi-Square
7981.459 2 .000
Likelihood Ratio
7775.717 2 .000
N of Valid Cases
192842

67
Symmetric Measures
Fiscal Year Value Approx.
Sig. 2011 Nominal
by Nominal
Phi .244 .000
Cramer’s V
.244 .000
N of Valid Cases 39888
2012 Nominal by Nominal
Phi .197 .000
Cramer’s V
.197 .000
N of Valid Cases 38802
2013 Nominal by Nominal
Phi .175 .000
Cramer’s V
.175 .000
N of Valid Cases 38806
2014 Nominal by Nominal
Phi .172 .000
Cramer’s V
.172 .000
N of Valid Cases 37576
2015 Nominal by Nominal
Phi .192 .000
Cramer’s V
.192 .000
N of Valid Cases 37770
Total Nominal by Nominal
Phi .203 .000
Cramer’s V
.203 .000
N of Valid Cases 192842
Adapted from NETC (2016).

68
THIS PAGE INTENTIONALLY LEFT BLANK

69
APPENDIX D. FULL MODEL ENROLLMENT RATE CHI-SQUARED TEST, DIFFERENCES BETWEEN METHOD OF
INSTRUCTION AND RANK GROUPS
Case Processing Summary
Cases
Valid Missing Total
N Percent N Percent N Percent DL/IL * SN/PO/CPO (E-1 to E-3=Seaman, E-4 to E-6=Petty Officer, E-7 to E-9=Chief Petty Officer) * Fiscal Year
192842 100% 0 .0 192842 100%
DL/IL * SN/PO/CPO (E-1 to E-3=Seaman, E-4 to E-6=Petty Officer, E-7 to E-9=Chief Petty Officer) * Fiscal Year Crosstabulation
Fiscal Year
SN/PO/CPO (E-1 to E-3=Seaman, E-4 to E-6=Petty Officer, E-7 to E-
9=Chief Petty Officer)
Total
Chief Petty
Officer Petty
Officer Seaman 2011 DL/IL DL Count 4284 18505 2588 25377
Expected Count
3319.1 17799.1 4258.8 25377.0
% within DL/IL
17% 73% 10% 100%
% within SN/PO/CPO (E-1 to E-3=Seaman, E-4 to E-6=Petty Officer, E-7 to E-9=Chief Petty Officer)
82% 66% 39% 64%
% of Total 11% 46% 6% 64%
IL Count 933 9472 4106 14511
Expected Count
1897.9 10177.9 2435.2 14511.0

70
% within DL/IL
6% 65% 28% 100%
% within SN/PO/CPO (E-1 to E-3=Seaman, E-4 to E-6=Petty Officer, E-7 to E-9=Chief Petty Officer)
18% 34% 61% 36%
% of Total 2% 24% 10% 36%
Total Count 5217 27977 6694 39888
Expected Count
5217.0 27977.0 6694.0 39888.0
% within DL/IL
13% 70% 17% 100%
% within SN/PO/CPO (E-1 to E-3=Seaman, E-4 to E-6=Petty Officer, E-7 to E-9=Chief Petty Officer)
100% 100% 100% 100%
% of Total 13% 70% 17% 100%
2012 DL/IL DL Count 4094 18666 2702 25462
Expected Count
3237.7 18125.0 4099.3 25462.0
% within DL/IL
16% 73% 11% 100%
% within SN/PO/CPO (E-1 to E-3=Seaman, E-4 to E-6=Petty Officer, E-7 to E-9=Chief Petty Officer)
83% 68% 43% 66%
% of Total 11% 48% 7% 66%
IL Count 840 8955 3545 13340
Expected Count
1696.3 9496.0 2147.7 13340.0

71
% within DL/IL
6% 67% 27% 100%
% within SN/PO/CPO (E-1 to E-3=Seaman, E-4 to E-6=Petty Officer, E-7 to E-9=Chief Petty Officer)
17% 32% 57% 34%
% of Total 2% 23% 9% 34%
Total Count 4934 27621 6247 38802
Expected Count
4934.0 27621.0 6247.0 38802.0
% within DL/IL
13% 71% 16% 100%
% within SN/PO/CPO (E-1 to E-3=Seaman, E-4 to E-6=Petty Officer, E-7 to E-9=Chief Petty Officer)
100% 100% 100% 100%
% of Total 13% 71% 16% 100%
2013 DL/IL DL Count 4282 19817 1850 25949
Expected Count
3456.4 19426.0 3066.6 25949.0
% within DL/IL
17% 76% 7% 100%
% within SN/PO/CPO (E-1 to E-3=Seaman, E-4 to E-6=Petty Officer, E-7 to E-9=Chief Petty Officer)
83% 68% 40% 67%
% of Total 11% 51% 5% 67%
IL Count 887 9234 2736 12857
Expected Count
1712.6 9625.0 1519.4 12857.0

72
% within DL/IL
7% 72% 21% 100%
% within SN/PO/CPO (E-1 to E-3=Seaman, E-4 to E-6=Petty Officer, E-7 to E-9=Chief Petty Officer)
17% 32% 60% 33%
% of Total 2% 24% 7% 33%
Total Count 5169 29051 4586 38806
Expected Count
5169.0 29051.0 4586.0 38806.0
% within DL/IL
13% 75% 12% 100%
% within SN/PO/CPO (E-1 to E-3=Seaman, E-4 to E-6=Petty Officer, E-7 to E-9=Chief Petty Officer)
100% 100% 100% 100%
% of Total 13% 75% 12% 100%
2014 DL/IL DL Count 4288 20842 1741 26871
Expected Count
3613.5 20586.6 2670.9 26871.0
% within DL/IL
16% 78% 6% 100%
% within SN/PO/CPO (E-1 to E-3=Seaman, E-4 to E-6=Petty Officer, E-7 to E-9=Chief Petty Officer)
85% 72% 47% 72%
% of Total 11% 55% 5% 72%
IL Count 765 7946 1994 10705
Expected Count
1439.5 8201.4 1064.1 10705.0

73
% within DL/IL
7% 74% 19% 100%
% within SN/PO/CPO (E-1 to E-3=Seaman, E-4 to E-6=Petty Officer, E-7 to E-9=Chief Petty Officer)
15% 28% 53% 28%
% of Total 2% 21% 5% 28%
Total Count 5053 28788 3735 37576
Expected Count
5053.0 28788.0 3735.0 37576.0
% within DL/IL
13% 77% 10% 100%
% within SN/PO/CPO (E-1 to E-3=Seaman, E-4 to E-6=Petty Officer, E-7 to E-9=Chief Petty Officer)
100% 100% 100% 100%
% of Total 13% 77% 10% 100%
2015 DL/IL DL Count 4570 21911 2038 28519
Expected Count
3893.9 21579.2 3046.0 28519.0
% within DL/IL
16% 77% 7% 100%
% within SN/PO/CPO (E-1 to E-3=Seaman, E-4 to E-6=Petty Officer, E-7 to E-9=Chief Petty Officer)
89% 77% 51% 76%
% of Total 12% 58% 5% 76%
IL Count 587 6668 1996 9251
Expected Count
1263.1 6999.8 988.0 9251.0

74
% within DL/IL
6% 72% 22% 100%
% within SN/PO/CPO (E-1 to E-3=Seaman, E-4 to E-6=Petty Officer, E-7 to E-9=Chief Petty Officer)
11% 23% 49% 24%
% of Total 2% 18% 5% 24%
Total Count 5157 28579 4034 37770
Expected Count
5157.0 28579.0 4034.0 37770.0
% within DL/IL
14% 76% 11% 100%
% within SN/PO/CPO (E-1 to E-3=Seaman, E-4 to E-6=Petty Officer, E-7 to E-9=Chief Petty Officer)
100% 100% 100% 100%
% of Total 14% 76% 11% 100%
Total DL/IL DL Count 21518 99741 10919 132178
Expected Count
17498.8 97340.8 17338.4 132178.0
% within DL/IL
16% 75% 8% 100%
% within SN/PO/CPO (E-1 to E-3=Seaman, E-4 to E-6=Petty Officer, E-7 to E-9=Chief Petty Officer)
84% 70% 43% 69%
% of Total 11% 52% 6% 69%
IL Count 4012 42275 14377 60664
Expected Count
8031.2 44675.2 7957.6 60664.0

75
% within DL/IL
7% 70% 24% 100%
% within SN/PO/CPO (E-1 to E-3=Seaman, E-4 to E-6=Petty Officer, E-7 to E-9=Chief Petty Officer)
16% 30% 57% 31%
% of Total 2% 22% 7% 31%
Total Count 25530 142016 25296 192842
Expected Count
25530.0 142016.0 25296.0 192842.0
% within DL/IL
13% 74% 13% 100%
% within SN/PO/CPO (E-1 to E-3=Seaman, E-4 to E-6=Petty Officer, E-7 to E-9=Chief Petty Officer)
100% 100% 100% 100%
% of Total 13% 74% 13% 100%
Chi-Square Tests
Fiscal Year Value df
Asymp. Sig. (2-sided)
2011 Pearson Chi-Square
2649.767 2 .000
Likelihood Ratio
2651.093 2 .000
N of Valid Cases
39888
2012 Pearson Chi-Square
2091.078 2 .000
Likelihood Ratio
2088.660 2 .000
N of Valid Cases
38802
2013 Pearson Chi-Square
2075.692 2 .000
Likelihood Ratio
2039.651 2 .000

76
N of Valid Cases
38806
2014 Pearson Chi-Square
1589.620 2 .000
Likelihood Ratio
1526.220 2 .000
N of Valid Cases
37576
2015 Pearson Chi-Square
1861.935 2 .000
Likelihood Ratio
1753.901 2 .000
N of Valid Cases
37770
Total Pearson Chi-Square
10677.990 2 .000
Likelihood Ratio
10428.811 2 .000
N of Valid Cases
192842
Symmetric Measures
Fiscal Year Value Approx.
Sig. 2011 Nominal
by Nominal
Phi .258 .000
Cramer’s V
.258 .000
N of Valid Cases 39888
2012 Nominal by Nominal
Phi .232 .000
Cramer’s V
.232 .000
N of Valid Cases 38802
2013 Nominal by Nominal
Phi .231 .000
Cramer’s V
.231 .000
N of Valid Cases 38806
2014 Nominal by Nominal
Phi .206 .000
Cramer’s V
.206 .000
N of Valid Cases 37576
2015 Nominal by Nominal
Phi .222 .000
Cramer’s V
.222 .000
N of Valid Cases 37770
Total Nominal by Nominal
Phi .235 .000
Cramer’s V
.235 .000
N of Valid Cases 192842
Adapted from NETC (2016).

77
APPENDIX E. FULL MODEL COMPLETION RATE CHI-SQUARED TEST, DIFFERENCES BETWEEN CONTRACTED
PROGRAM AND METHOD OF INSTRUCTION
Case Processing Summary
Cases
Valid Missing Total
N Percent N Percent N Percent Contracted Program * Completion * Fiscal Year
192842 100% 0 0% 192842 100%
DL/IL * Completion * Fiscal Year
192842 100% 0 0% 192842 100%
Contracted Program * Completion * Fiscal Year Crosstab
Fiscal Year
Completion
Total Fail Pass 2011 Contracted
Program NCPACE Count 2588 10080 12668
Expected Count
1549.2 11118.8 12668.0
% within Contracted Program
20% 80% 100%
% within Completion
53% 29% 32%
% of Total 6% 25% 32%
TA Count 2290 24930 27220
Expected Count
3328.8 23891.2 27220.0
% within Contracted Program
8% 92% 100%
% within Completion
47% 71% 68%
% of Total 6% 63% 68%
Total Count 4878 35010 39888
Expected Count
4878.0 35010.0 39888.0
% within Contracted Program
12% 88% 100%
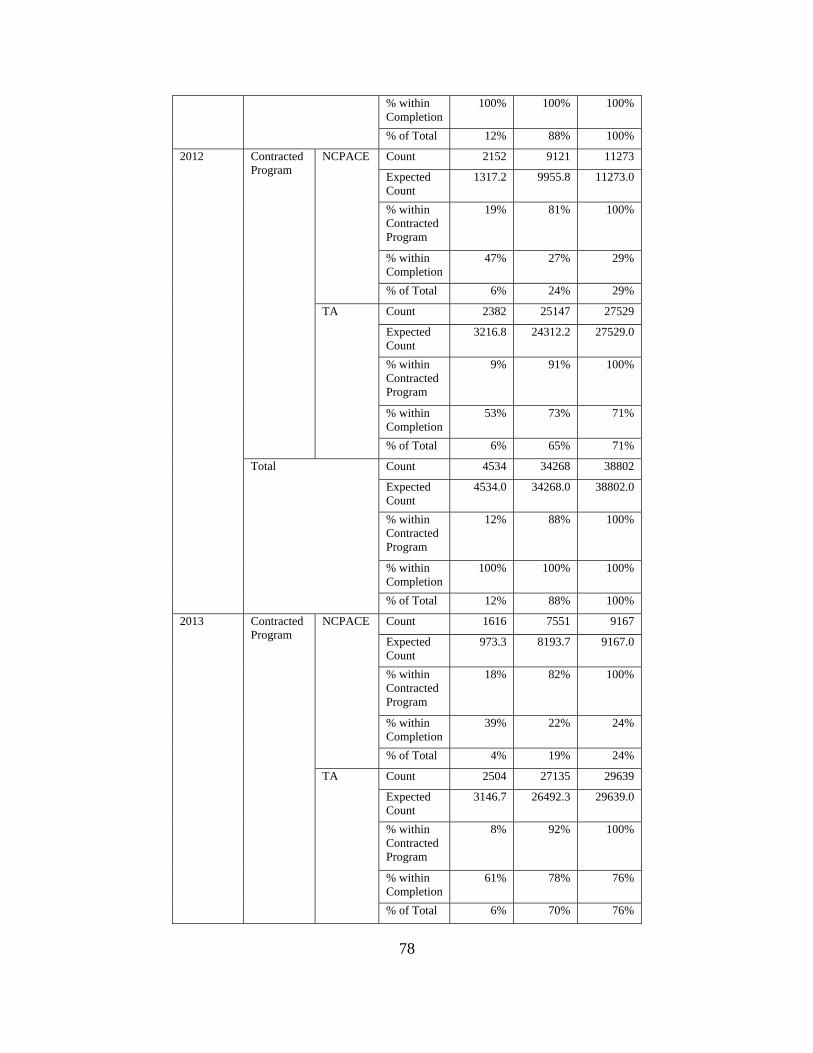
78
% within Completion
100% 100% 100%
% of Total 12% 88% 100%
2012 Contracted Program
NCPACE Count 2152 9121 11273
Expected Count
1317.2 9955.8 11273.0
% within Contracted Program
19% 81% 100%
% within Completion
47% 27% 29%
% of Total 6% 24% 29%
TA Count 2382 25147 27529
Expected Count
3216.8 24312.2 27529.0
% within Contracted Program
9% 91% 100%
% within Completion
53% 73% 71%
% of Total 6% 65% 71%
Total Count 4534 34268 38802
Expected Count
4534.0 34268.0 38802.0
% within Contracted Program
12% 88% 100%
% within Completion
100% 100% 100%
% of Total 12% 88% 100%
2013 Contracted Program
NCPACE Count 1616 7551 9167
Expected Count
973.3 8193.7 9167.0
% within Contracted Program
18% 82% 100%
% within Completion
39% 22% 24%
% of Total 4% 19% 24%
TA Count 2504 27135 29639
Expected Count
3146.7 26492.3 29639.0
% within Contracted Program
8% 92% 100%
% within Completion
61% 78% 76%
% of Total 6% 70% 76%

79
Total Count 4120 34686 38806
Expected Count
4120.0 34686.0 38806.0
% within Contracted Program
11% 89% 100%
% within Completion
100% 100% 100%
% of Total 11% 89% 100%
2014 Contracted Program
NCPACE Count 1394 7033 8427
Expected Count
875.5 7551.5 8427.0
% within Contracted Program
17% 83% 100%
% within Completion
36% 21% 22%
% of Total 4% 19% 22%
TA Count 2510 26639 29149
Expected Count
3028.5 26120.5 29149.0
% within Contracted Program
9% 91% 100%
% within Completion
64% 79% 78%
% of Total 7% 71% 78%
Total Count 3904 33672 37576
Expected Count
3904.0 33672.0 37576.0
% within Contracted Program
10% 90% 100%
% within Completion
100% 100% 100%
% of Total 10% 90% 100%
2015 Contracted Program
NCPACE Count 1989 6421 8410
Expected Count
1087.0 7323.0 8410.0
% within Contracted Program
24% 76% 100%
% within Completion
41% 20% 22%
% of Total 5% 17% 22%
TA Count 2893 26467 29360
Expected Count
3795.0 25565.0 29360.0

80
% within Contracted Program
10% 90% 100%
% within Completion
59% 80% 78%
% of Total 8% 70% 78%
Total Count 4882 32888 37770
Expected Count
4882.0 32888.0 37770.0
% within Contracted Program
13% 87% 100%
% within Completion
100% 100% 100%
% of Total 13% 87% 100%
Total Contracted Program
NCPACE Count 9739 40206 49945
Expected Count
5780.2 44164.8 49945.0
% within Contracted Program
19% 81% 100%
% within Completion
44% 24% 26%
% of Total 5% 21% 26%
TA Count 12579 130318 142897
Expected Count
16537.8 126359.2 142897.0
% within Contracted Program
9% 91% 100%
% within Completion
56% 76% 74%
% of Total 7% 68% 74%
Total Count 22318 170524 192842
Expected Count
22318.0 170524.0 192842.0
% within Contracted Program
12% 88% 100%
% within Completion
100% 100% 100%
% of Total 12% 88% 100%
Chi-Square Tests
Fiscal Year Value df
Asymp. Sig. (2-sided)
Exact Sig. (2-sided)
Exact Sig. (1-sided)
2011 Pearson Chi-Square
1162.948 1 .000
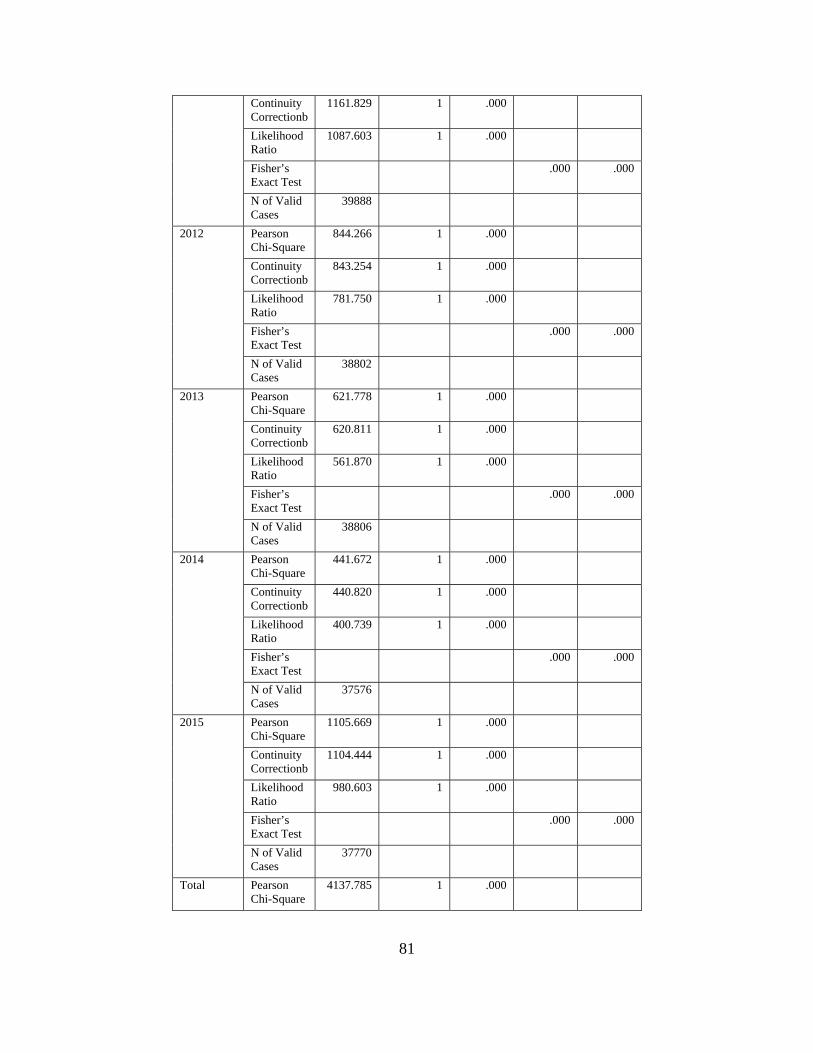
81
Continuity Correctionb
1161.829 1 .000
Likelihood Ratio
1087.603 1 .000
Fisher’s Exact Test
.000 .000
N of Valid Cases
39888
2012 Pearson Chi-Square
844.266 1 .000
Continuity Correctionb
843.254 1 .000
Likelihood Ratio
781.750 1 .000
Fisher’s Exact Test
.000 .000
N of Valid Cases
38802
2013 Pearson Chi-Square
621.778 1 .000
Continuity Correctionb
620.811 1 .000
Likelihood Ratio
561.870 1 .000
Fisher’s Exact Test
.000 .000
N of Valid Cases
38806
2014 Pearson Chi-Square
441.672 1 .000
Continuity Correctionb
440.820 1 .000
Likelihood Ratio
400.739 1 .000
Fisher’s Exact Test
.000 .000
N of Valid Cases
37576
2015 Pearson Chi-Square
1105.669 1 .000
Continuity Correctionb
1104.444 1 .000
Likelihood Ratio
980.603 1 .000
Fisher’s Exact Test
.000 .000
N of Valid Cases
37770
Total Pearson Chi-Square
4137.785 1 .000

82
Continuity Correctionb
4136.740 1 .000
Likelihood Ratio
3766.581 1 .000
Fisher’s Exact Test
.000 .000
N of Valid Cases
192842
Symmetric Measures
Fiscal Year Value Approx.
Sig. 2011 Nominal by
Nominal Phi .171 .000
Cramer’s V
.171 .000
N of Valid Cases 39888 2012 Nominal by
Nominal Phi .148 .000
Cramer’s V
.148 .000
N of Valid Cases 38802 2013 Nominal by
Nominal Phi .127 .000
Cramer’s V
.127 .000
N of Valid Cases 38806 2014 Nominal by
Nominal Phi .108 .000
Cramer’s V
.108 .000
N of Valid Cases 37576 2015 Nominal by
Nominal Phi .171 .000
Cramer’s V
.171 .000
N of Valid Cases 37770 Total Nominal by
Nominal Phi .146 .000
Cramer’s V
.146 .000
N of Valid Cases 192842
DL/IL * Completion * Fiscal Year Crosstab
Fiscal Year
Completion
Total Fail Pass 2011 DL/IL DL Count 3248 22129 25377
Expected Count
3103.4 22273.6 25377.0
% within DL/IL
13% 87% 100%
% within Completion
67% 63% 64%
% of Total 8% 55% 64%

83
IL Count 1630 12881 14511
Expected Count
1774.6 12736.4 14511.0
% within DL/IL
11% 89% 100%
% within Completion
33% 37% 36%
% of Total 4% 32% 36%
Total Count 4878 35010 39888
Expected Count
4878.0 35010.0 39888.0
% within DL/IL
12% 88% 100%
% within Completion
100% 100% 100%
% of Total 12% 88% 100%
2012 DL/IL DL Count 3387 22075 25462
Expected Count
2975.2 22486.8 25462.0
% within DL/IL
13% 87% 100%
% within Completion
75% 64% 66%
% of Total 9% 57% 66%
IL Count 1147 12193 13340
Expected Count
1558.8 11781.2 13340.0
% within DL/IL
9% 91% 100%
% within Completion
25% 36% 34%
% of Total 3% 31% 34%
Total Count 4534 34268 38802
Expected Count
4534.0 34268.0 38802.0
% within DL/IL
12% 88% 100%
% within Completion
100% 100% 100%
% of Total 12% 88% 100%
2013 DL/IL DL Count 2987 22962 25949
Expected Count
2755.0 23194.0 25949.0
% within DL/IL
12% 88% 100%
% within Completion
73% 66% 67%
% of Total 8% 59% 67%

84
IL Count 1133 11724 12857
Expected Count
1365.0 11492.0 12857.0
% within DL/IL
9% 91% 100%
% within Completion
28% 34% 33%
% of Total 3% 30% 33%
Total Count 4120 34686 38806
Expected Count
4120.0 34686.0 38806.0
% within DL/IL
11% 89% 100%
% within Completion
100% 100% 100%
% of Total 11% 89% 100%
2014 DL/IL DL Count 3049 23822 26871
Expected Count
2791.8 24079.2 26871.0
% within DL/IL
11% 89% 100%
% within Completion
78% 71% 72%
% of Total 8% 63% 72%
IL Count 855 9850 10705
Expected Count
1112.2 9592.8 10705.0
% within DL/IL
8% 92% 100%
% within Completion
22% 29% 28%
% of Total 2% 26% 28%
Total Count 3904 33672 37576
Expected Count
3904.0 33672.0 37576.0
% within DL/IL
10% 90% 100%
% within Completion
100% 100% 100%
% of Total 10% 90% 100%
2015 DL/IL DL Count 3936 24583 28519
Expected Count
3686.3 24832.7 28519.0
% within DL/IL
14% 86% 100%
% within Completion
81% 75% 76%
% of Total 10% 65% 76%

85
IL Count 946 8305 9251
Expected Count
1195.7 8055.3 9251.0
% within DL/IL
10% 90% 100%
% within Completion
19% 25% 24%
% of Total 3% 22% 24%
Total Count 4882 32888 37770
Expected Count
4882.0 32888.0 37770.0
% within DL/IL
13% 87% 100%
% within Completion
100% 100% 100%
% of Total 13% 87% 100%
Total DL/IL DL Count 16607 115571 132178
Expected Count
15297.2 116880.8 132178.0
% within DL/IL
13% 87% 100%
% within Completion
74% 68% 69%
% of Total 9% 60% 69%
IL Count 5711 54953 60664
Expected Count
7020.8 53643.2 60664.0
% within DL/IL
9% 91% 100%
% within Completion
26% 32% 31%
% of Total 3% 28% 31%
Total Count 22318 170524 192842
Expected Count
22318.0 170524.0 192842.0
% within DL/IL
12% 88% 100%
% within Completion
100% 100% 100%
% of Total 12% 88% 100%
Chi-Square Tests
Fiscal Year Value df
Asymp. Sig. (2-sided)
Exact Sig. (2-sided)
Exact Sig. (1-sided)
2011 Pearson Chi-Square
21.096 1 .000
Continuity Correctionb
20.951 1 .000

86
Likelihood Ratio
21.323 1 .000
Fisher’s Exact Test
.000 .000
N of Valid Cases
39888
2012 Pearson Chi-Square
187.699 1 .000
Continuity Correctionb
187.244 1 .000
Likelihood Ratio
196.207 1 .000
Fisher’s Exact Test
.000 .000
N of Valid Cases
38802
2013 Pearson Chi-Square
65.982 1 .000
Continuity Correctionb
65.698 1 .000
Likelihood Ratio
67.878 1 .000
Fisher’s Exact Test
.000 .000
N of Valid Cases
38806
2014 Pearson Chi-Square
92.822 1 .000
Continuity Correctionb
92.461 1 .000
Likelihood Ratio
97.278 1 .000
Fisher’s Exact Test
.000 .000
N of Valid Cases
37576
2015 Pearson Chi-Square
79.339 1 .000
Continuity Correctionb
79.021 1 .000
Likelihood Ratio
82.965 1 .000
Fisher’s Exact Test
.000 .000
N of Valid Cases
37770
Total Pearson Chi-Square
403.147 1 .000
Continuity Correctionb
402.839 1 .000

87
Likelihood Ratio
416.668 1 .000
Fisher’s Exact Test
.000 .000
N of Valid Cases
192842
Symmetric Measures
Fiscal Year Value Approx.
Sig. 2011 Nominal by
Nominal Phi .023 .000
Cramer’s V
.023 .000
N of Valid Cases 39888
2012 Nominal by Nominal
Phi .070 .000
Cramer’s V
.070 .000
N of Valid Cases 38802
2013 Nominal by Nominal
Phi .041 .000
Cramer’s V
.041 .000
N of Valid Cases 38806
2014 Nominal by Nominal
Phi .050 .000
Cramer’s V
.050 .000
N of Valid Cases 37576
2015 Nominal by Nominal
Phi .046 .000
Cramer’s V
.046 .000
N of Valid Cases 37770
Total Nominal by Nominal
Phi .046 .000
Cramer’s V
.046 .000
N of Valid Cases 192842
Adapted from NETC (2016).

88
THIS PAGE INTENTIONALLY LEFT BLANK

89
APPENDIX F. FULL SAMPLE GRADE PERFORMANCE, BY RANK GROUPS, CONTRACTED PROGRAM AND METHOD OF
INSTRUCTION
Variables Entered/Removedb
Model Variables Entered Variables Removed Method
1 Rank Groups, TA/NCPACE group (TA=1,NCPACE=0), DL/IL groups (DL=1,IL=0)
. Enter
Model Summary
Model R R Square
Adjusted R
Square Std. Error of the Estimate
1 .255 .065 .065 1.275
ANOVAb
Model Sum of Squares df
Mean Square F Sig.
1 Regression 21829.678 3 7276.559 4476.327 .000
Residual 313470.649 192838 1.626 Total 335300.327 192841
Coefficientsa
Model
Unstandardized Coefficients
Standardized Coefficients
t Sig. B Std.
Error Beta 1 (Constant) 1.934 .012 160.483 .000
TA/NCPACE group (TA=1,NCPACE=0)
.658 .007 .218 94.355 .000
DL/IL groups (DL=1,IL=0)
-.251 .007 -.089 -38.001 .000
Rank Groups .310 .006 .121 52.901 .000
Adapted from NETC (2016).

90
THIS PAGE INTENTIONALLY LEFT BLANK
91
LIST OF REFERENCES
Armed Forces Act, 10 U.S.C. §§ 2007. Retrieved from https://www.law.cornell.edu/uscode/text/10/2007
Barakat, M., & Weiss-Randall, D. N. (2016). Through the eyes of students and faculty: A conceptual framework for the development of online courses. In V. Wang (Ed.), Handbook of research on learning outcomes and opportunities in the digital age (pp. 557–584). Hershey, PA: IGI Global. doi:10.4018/978-1-4666-9577-1.ch025
Barber, W., & King, S. (2016). Teacher-student perspectives of invisible pedagogy: New directions in online problem-based learning environments. Electronic Journal of e-Learning, 14(4).
Borsuk, G. M., Coffey, T., & National Defense University. Center for Technology and National Security Policy. (2003). Moore’s law: A Department of Defense perspective. Fort McNair, Washington, DC: Center for Technology and National Security Policy, National Defense University.
Brown, S., Bird, J. L., Musgrove, A., & Powers, J. (2016). The digital journey: integrating technology into teaching and learning. In V. Wang (Ed.), Handbook of research on learning outcomes and opportunities in the digital age (pp. 611–642). Hershey, PA: IGI Global. doi:10.4018/978-1-4666-9577-1.ch027
Chief of Naval Operations. (2008, March 08). Voluntary education (VOLED) for Navy Sailors (OPNAVINST 1560.9A). Washington, DC: Author.
Department of Defense. (2005, Jan. 3). Voluntary education programs for military personnel (DOD Directive 1322.08E). Washington, DC: Author.
Department of Navy. (2005, December 1). Department of the Navy Voluntary Education (VOLED) Program (SECNAVINST 1560.4A). Washington, DC: Author.
Department of the Navy. (28 Apr. 2007). Naval military personnel manual. (MILPERSMAN 1306–102). Retrieved from http://www.public.navy.mil/bupers-npc/reference/milpersman/1000/1300Assignment/Documents/1306-102.pdf
Garcia, Federico E., Ernest H. Joy, with David L. Reese. (1998). Effectiveness of the Voluntary Education Program. Alexandria, VA: Center for Naval Analyses.
Hope, J. K. (2016). New learning for new students. In V. Wang (Ed.), Handbook of research on learning outcomes and opportunities in the digital age (pp. 819–837). Hershey, PA: IGI Global. doi:10.4018/978-1-4666-9577-1.ch036

92
Mehay, S. L., & Pema, E. (2010). Analysis of the tuition assistance program: Does the method of instruction matter in TA classes? (Report). Monterey, CA: Naval Postgraduate School.
National Center for Education Statistics (n.d.). Distance Learning. Retrieved from https://nces.ed.gov/fastfacts/display.asp?id=80
Naval Education and Training Command (2016). Tuition assistance 2002–2015. [PowerPoint slides]. Navy Education Strategy and Policy Branch, Pensacola, FL.
Navy College Program. (n.d.). NCPACE program. Retrieved from http://www.navycollege.navy.mil/information-for-commands/ncpace.htm
Nemati, H., & Thompson, M. (2011). Factors Influencing Students Intention to Take Web-Based Courses in a College Environment. In L. Tomei (Ed.), Online Courses and ICT in Education: Emerging Practices and Applications (pp. 1–11). Hershey, PA: IGI Global. doi:10.4018/978-1-60960-150-8.ch001
Renes, S.L. & Strange, A. T. (2011), Using Technology to Enhance Higher Education, Innov High Educ 36: 203. doi:10.1007/s10755-010-9167-3

93
INITIAL DISTRIBUTION LIST
1. Defense Technical Information Center Ft. Belvoir, Virginia 2. Dudley Knox Library Naval Postgraduate School Monterey, California