National Institute for Communicable Diseases (NICD) NICD National Survey Report_Dev... · NATIONAL...
56
NATIONAL INSTITUTE FOR COMMUNICABLE DISEASES Division of the National Health Laboratory Service South African Tuberculosis Drug Resistance Survey 2012–14
-
Upload
truongkhuong -
Category
Documents
-
view
232 -
download
0
Transcript of National Institute for Communicable Diseases (NICD) NICD National Survey Report_Dev... · NATIONAL...

NATIONAL INSTITUTE FOR COMMUNICABLE DISEASES
Division of the National Health Laboratory Service
South African Tuberculosis Drug Resistance Survey2012–14


1South African Tuberculosis Drug Resistance Survey 2012–14
AcknowledgmentsWe would like to thank all that contributed to the success of the 2012-14 Tuberculosis (TB) Drug Resistance Survey (DRS) in South Africa.
The DRS was a huge undertaking and would not have been possible without the collaboration of the National and Provincial Departments of Health (N/PDoH). We especially acknowledge the support of the Director-General of the Department of Health (DoH) and the entire team at the TB Cluster, as well as Provincial and District Tuberculosis Managers and their teams across all the South African provinces.
We are also grateful for the support received from the National Health Laboratory Services (NHLS) who integrated survey activities into their routine services, receiving specimens and providing the required logistics to ensure that the specimens got to the National Tuberculosis Reference Laboratory in Johannesburg.
We are also especially grateful to the healthcare workers in public sector clinics and hospitals across South Africa who screened and enrolled participants at their respective facilities. They carried out these extra survey-related tasks in addition to their already busy schedules delivering routine services.
The survey would not have been possible without the extreme hard work and sacrifice by the survey team, comprising of field staff, laboratory staff and data entry and management staff at the Centre for Tuberculosis at the National Institute for Communicable Diseases (NICD). They often went beyond the call of duty, working unsociable hours and travelling through distant and sometimes troubled areas to ensure the survey was successful.
We are also grateful to the steering committee for guiding the survey implementation and supporting tough decisions that needed to be made along the course of the survey. In addition, we are grateful for the support provided by the World Health Organization (WHO) team, especially in guiding the analysis, as well as the additional support received from the Centers for Disease Control and Prevention (CDC) Atlanta.
Finally and most importantly, we thank the over 200 000 patients who consented to participate in the survey across South Africa for their willingness to contribute to the survey by providing an extra sputum sample.
Direct financial support was received from the President’s Emergency Plan for AIDS Relief (PEPFAR) through the CDC-South Africa, under the terms of agreement 1U19GH000571. Indirect financial support through routine operational functions was also received from N/PDoH and NICD/NHLS.
2 South African Tuberculosis Drug Resistance Survey 2012–14
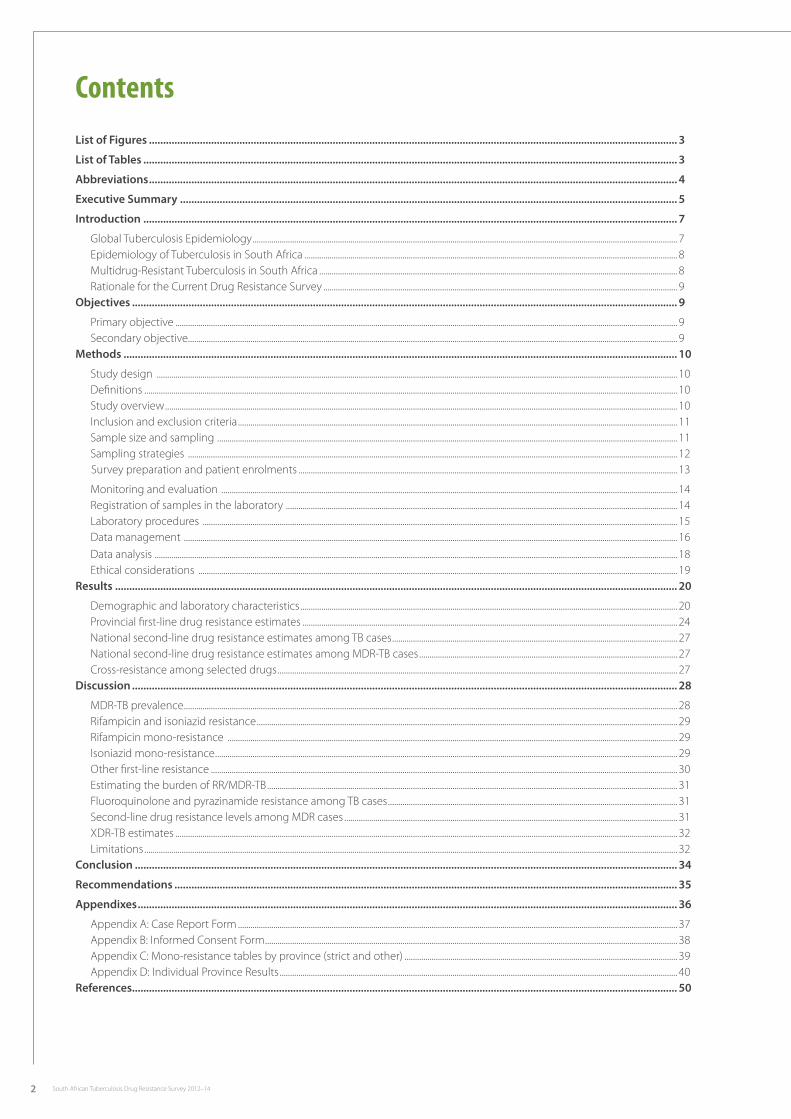
ContentsList of Figures ........................................................................................................................................................................................... 3
List of Tables ............................................................................................................................................................................................. 3
Abbreviations ........................................................................................................................................................................................... 4
Executive Summary ................................................................................................................................................................................ 5
Introduction ............................................................................................................................................................................................. 7
Global Tuberculosis Epidemiology ............................................................................................................................................................................................................ 7Epidemiology of Tuberculosis in South Africa ................................................................................................................................................................................... 8Multidrug-Resistant Tuberculosis in South Africa ............................................................................................................................................................................ 8Rationale for the Current Drug Resistance Survey .......................................................................................................................................................................... 9
Objectives ................................................................................................................................................................................................. 9
Primary objective ................................................................................................................................................................................................................................................. 9Secondary objective........................................................................................................................................................................................................................................... 9
Methods .................................................................................................................................................................................................... 10
Study design .......................................................................................................................................................................................................................................................... 10Definitions ................................................................................................................................................................................................................................................................ 10Study overview ...................................................................................................................................................................................................................................................... 10Inclusion and exclusion criteria ................................................................................................................................................................................................................... 11Sample size and sampling ............................................................................................................................................................................................................................. 11Sampling strategies ........................................................................................................................................................................................................................................... 12
Survey preparation and patient enrolments ...................................................................................................................................................................................... 13
Monitoring and evaluation ........................................................................................................................................................................................................................... 14Registration of samples in the laboratory ............................................................................................................................................................................................ 14Laboratory procedures .................................................................................................................................................................................................................................... 15Data management ............................................................................................................................................................................................................................................. 16Data analysis ........................................................................................................................................................................................................................................................... 18Ethical considerations ...................................................................................................................................................................................................................................... 19
Results ....................................................................................................................................................................................................... 20
Demographic and laboratory characteristics ..................................................................................................................................................................................... 20Provincial first-line drug resistance estimates .................................................................................................................................................................................... 24National second-line drug resistance estimates among TB cases ......................................................................................................................................... 27National second-line drug resistance estimates among MDR-TB cases ............................................................................................................................ 27Cross-resistance among selected drugs ................................................................................................................................................................................................ 27
Discussion ................................................................................................................................................................................................. 28
MDR-TB prevalence ............................................................................................................................................................................................................................................. 28Rifampicin and isoniazid resistance .......................................................................................................................................................................................................... 29Rifampicin mono-resistance ........................................................................................................................................................................................................................ 29Isoniazid mono-resistance .............................................................................................................................................................................................................................. 29Other first-line resistance ................................................................................................................................................................................................................................ 30Estimating the burden of RR/MDR-TB ..................................................................................................................................................................................................... 31Fluoroquinolone and pyrazinamide resistance among TB cases ........................................................................................................................................... 31Second-line drug resistance levels among MDR cases ................................................................................................................................................................ 31XDR-TB estimates ................................................................................................................................................................................................................................................. 32Limitations ................................................................................................................................................................................................................................................................ 32
Conclusion ................................................................................................................................................................................................ 34
Recommendations .................................................................................................................................................................................. 35
Appendixes ............................................................................................................................................................................................... 36
Appendix A: Case Report Form ................................................................................................................................................................................................................... 37Appendix B: Informed Consent Form ...................................................................................................................................................................................................... 38Appendix C: Mono-resistance tables by province (strict and other) ................................................................................................................................... 39Appendix D: Individual Province Results ............................................................................................................................................................................................... 40
References................................................................................................................................................................................................. 50
3South African Tuberculosis Drug Resistance Survey 2012–14
List of FiguresFigure 1: MDR-TB 2007 to 2012 cohort treatment outcomes in the African region and globally (adapted from WHO Global Report 2015).................................................................................................................................................................................................... 7
Figure 2: Flow diagram of sampling and enrolment process .......................................................................................................................................................... 11
Figure 3: Map of randomly selected facilities included in the SA TB DRS 2012-14............................................................................................................. 13
Figure 4: Roll-out plan for the 2012-14 SA TB DRS .................................................................................................................................................................................. 13
Figure 5: Workflow of laboratory testing ....................................................................................................................................................................................................... 15
Figure 6: Overview of data management flow for the SA TB DRS 2012-14............................................................................................................................. 17
Figure 7: Age distribution among males by province among confirmed TB cases in the survey ............................................................................ 21
Figure 8: Age distribution of females by province among confirmed TB cases in the survey .................................................................................... 22
List of TablesTable 1: Patient sampling schedule for survey, 2012-14 ..................................................................................................................................................................... 12
Table 2: WHO approved critical concentrations used for drug susceptibility testing....................................................................................................... 16
Table 3: Demographic characteristics of patients screened into the survey ......................................................................................................................... 20
Table 4: Participant enrolment cascade and previous treatment exposure .......................................................................................................................... 20
Table 5: Numbers of screened and culture-positive MTB cases detected in the survey against those required by province ................ 21
Table 6: Non-tuberculosis mycobacteria among culture-positive cases in the survey ................................................................................................... 22
Table 7: Smear positivity among culture-positive TB cases by province .................................................................................................................................. 22
Table 8: HIV co-infection among culture-confirmed TB cases by province ............................................................................................................................ 23
Table 9: National first-line drug resistance estimates among TB cases, 2012-14 survey ................................................................................................. 23
Table 10: National first-line drug resistance estimates among TB cases, 2001-2002 survey 14 .................................................................................. 24
Table 11: Provincial multi-drug resistance prevalence among TB cases .................................................................................................................................. 24
Table 12: Provincial any rifampicin resistance prevalence among TB cases ........................................................................................................................... 25
Table 13: Provincial rifampicin mono-resistance (isoniazid susceptible) prevalence among TB cases.................................................................. 25
Table 14: Ratio of MDR: Rifampicin mono-resistance estimates among TB cases by province .................................................................................. 25
Table 15: Provincial isoniazid resistance prevalence among TB cases ........................................................................................................................................ 25
Table 16: Provincial isoniazid mono-resistance (rifampicin susceptible) prevalence among TB cases.................................................................. 26
Table 17: Provincial ethambutol resistance prevalence among TB cases................................................................................................................................. 26
Table 18: Provincial streptomycin resistance prevalence among TB cases ............................................................................................................................. 26
Table 19: Provincial pyrazinamide resistance prevalence among TB cases ............................................................................................................................. 26
Table 20: National Second Line Drug Resistance among TB Cases .............................................................................................................................................. 27
Table 21: National second-line drug resistance among MDR cases ............................................................................................................................................ 27
Table 22: Cross-resistance among selected drugs (crude data) .................................................................................................................................................... 27
Table 23: Provincial MDR prevalence among TB cases in the 2012-14 and 2001-2 surveys ......................................................................................... 33
Table 24: Provincial rifampicin resistance prevalence among TB cases in the 2012-14 and 2001-2 surveys ..................................................... 33
Table 25: Provincial isoniazid mono-resistance without additional ethambutol/streptomycin resistance prevalence among TB cases in the 2012-14 and 2001-2 surveys ............................................................................................................................................................................ 33
Table C1: Provincial rifampicin mono-resistance – strict prevalence (without resistance to another first-line drug: streptomycin/ethambutol) .................................................................................................................................................................................................................................. 39
Table C2: Provincial rifampicin mono-resistance – other prevalence (with resistance to another first-line drug: streptomycin/ethambutol).................................................................................................................................................................................................................................... 39
Table C3: Provincial isoniazid mono-resistance – strict prevalence (without resistance to another first-line drug: streptomycin/ethambutol).................................................................................................................................................................................................................................... 39
Table C4: Provincial isoniazid mono-resistance – other prevalence (with resistance to another first-line drug: streptomycin/ethambutol).................................................................................................................................................................................................................................... 39
4 South African Tuberculosis Drug Resistance Survey 2012–14
Abbreviations
ART Antiretroviral therapyCC Critical concentrationCDC Centers for Disease Control and Prevention CDW Corporate Data WarehouseCRF Case Report FormCTB Centre for TuberculosisDoH Department of HealthDOTS Directly Observed Therapy Short Course DRS Drug Resistance SurveyDST Drug susceptibility testingEMA European Medicines AgencyEPTB Extra-pulmonary TuberculosisFDA United States Food and Drug AdministrationGXP Xpert MTB/RIFHBC High Burden CountryHIV Human immunodeficiency virusIMR Isoniazid mono-resistantINH IsoniazidIPT Isoniazid preventative therapyIPC Infection Prevention and ControlIUATLD International Union against Tuberculosis and Lung DiseaseLIS Laboratory Information SystemLPA Line probe assayLTBI Latent TB infection LTFU Loss to follow upMGIT Mycobacterial growth indicator tubeMTB Mycobacterium tuberculosisM&E Monitoring and evaluationMDR-TB Multidrug-resistant tuberculosismPTB Microbiologically confirmed pulmonary TBNDoH National Department of HealthNHLS National Health Laboratory ServicesNICD National Institute of Communicable DiseasesNTRL National TB Reference LaboratoryNTM Non-tuberculous mycobacteriaNTP National Tuberculosis Control ProgrammePAS Para-aminosalicylic acid PDoH Provincial Department for HealthPHC Primary healthcare PLHIV Person/People living with HIVPTB Pulmonary TBRCT Randomised control trialRHE Rifampicin+Isoniazid+EthambutolRHZE Rifampicin+Isoniazid+Pyrazinamid+EthambutolRIF RifampicinRMR Rifampicin mono-resistantRR Rifampicin-resistantRSE Robust standard errorSANAS South African National Accreditation SystemSLT Second-line testingTAT Turnaround timeTDR Totally drug-resistantTB TuberculosisWHO World Health OrganizationXDR-TB Extensively drug-resistant tuberculosisZN Ziehl-Neelsen
5South African Tuberculosis Drug Resistance Survey 2012–14
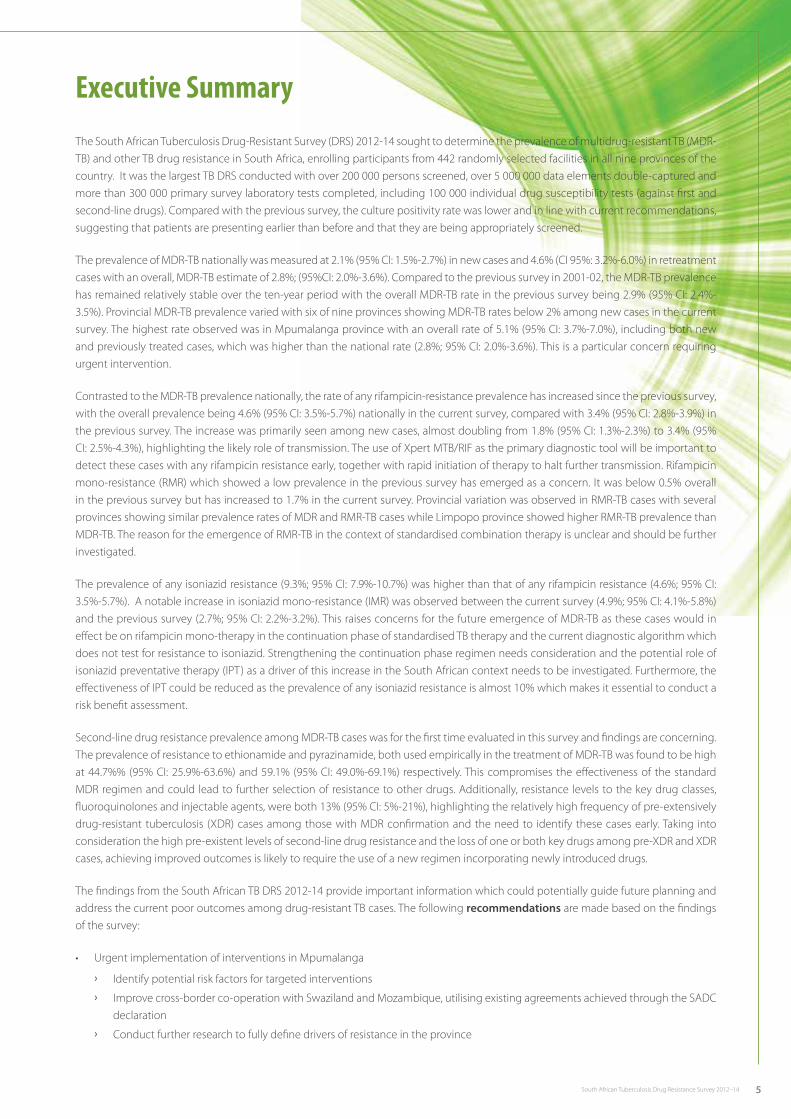
Executive SummaryThe South African Tuberculosis Drug-Resistant Survey (DRS) 2012-14 sought to determine the prevalence of multidrug-resistant TB (MDR-TB) and other TB drug resistance in South Africa, enrolling participants from 442 randomly selected facilities in all nine provinces of the country. It was the largest TB DRS conducted with over 200 000 persons screened, over 5 000 000 data elements double-captured and more than 300 000 primary survey laboratory tests completed, including 100 000 individual drug susceptibility tests (against first and second-line drugs). Compared with the previous survey, the culture positivity rate was lower and in line with current recommendations, suggesting that patients are presenting earlier than before and that they are being appropriately screened.
The prevalence of MDR-TB nationally was measured at 2.1% (95% CI: 1.5%-2.7%) in new cases and 4.6% (CI 95%: 3.2%-6.0%) in retreatment cases with an overall, MDR-TB estimate of 2.8%; (95%CI: 2.0%-3.6%). Compared to the previous survey in 2001-02, the MDR-TB prevalence has remained relatively stable over the ten-year period with the overall MDR-TB rate in the previous survey being 2.9% (95% CI: 2.4%-3.5%). Provincial MDR-TB prevalence varied with six of nine provinces showing MDR-TB rates below 2% among new cases in the current survey. The highest rate observed was in Mpumalanga province with an overall rate of 5.1% (95% CI: 3.7%-7.0%), including both new and previously treated cases, which was higher than the national rate (2.8%; 95% CI: 2.0%-3.6%). This is a particular concern requiring urgent intervention.
Contrasted to the MDR-TB prevalence nationally, the rate of any rifampicin-resistance prevalence has increased since the previous survey, with the overall prevalence being 4.6% (95% CI: 3.5%-5.7%) nationally in the current survey, compared with 3.4% (95% CI: 2.8%-3.9%) in the previous survey. The increase was primarily seen among new cases, almost doubling from 1.8% (95% CI: 1.3%-2.3%) to 3.4% (95% CI: 2.5%-4.3%), highlighting the likely role of transmission. The use of Xpert MTB/RIF as the primary diagnostic tool will be important to detect these cases with any rifampicin resistance early, together with rapid initiation of therapy to halt further transmission. Rifampicin mono-resistance (RMR) which showed a low prevalence in the previous survey has emerged as a concern. It was below 0.5% overall in the previous survey but has increased to 1.7% in the current survey. Provincial variation was observed in RMR-TB cases with several provinces showing similar prevalence rates of MDR and RMR-TB cases while Limpopo province showed higher RMR-TB prevalence than MDR-TB. The reason for the emergence of RMR-TB in the context of standardised combination therapy is unclear and should be further investigated.
The prevalence of any isoniazid resistance (9.3%; 95% CI: 7.9%-10.7%) was higher than that of any rifampicin resistance (4.6%; 95% CI: 3.5%-5.7%). A notable increase in isoniazid mono-resistance (IMR) was observed between the current survey (4.9%; 95% CI: 4.1%-5.8%) and the previous survey (2.7%; 95% CI: 2.2%-3.2%). This raises concerns for the future emergence of MDR-TB as these cases would in effect be on rifampicin mono-therapy in the continuation phase of standardised TB therapy and the current diagnostic algorithm which does not test for resistance to isoniazid. Strengthening the continuation phase regimen needs consideration and the potential role of isoniazid preventative therapy (IPT) as a driver of this increase in the South African context needs to be investigated. Furthermore, the effectiveness of IPT could be reduced as the prevalence of any isoniazid resistance is almost 10% which makes it essential to conduct a risk benefit assessment.
Second-line drug resistance prevalence among MDR-TB cases was for the first time evaluated in this survey and findings are concerning. The prevalence of resistance to ethionamide and pyrazinamide, both used empirically in the treatment of MDR-TB was found to be high at 44.7%% (95% CI: 25.9%-63.6%) and 59.1% (95% CI: 49.0%-69.1%) respectively. This compromises the effectiveness of the standard MDR regimen and could lead to further selection of resistance to other drugs. Additionally, resistance levels to the key drug classes, fluoroquinolones and injectable agents, were both 13% (95% CI: 5%-21%), highlighting the relatively high frequency of pre-extensively drug-resistant tuberculosis (XDR) cases among those with MDR confirmation and the need to identify these cases early. Taking into consideration the high pre-existent levels of second-line drug resistance and the loss of one or both key drugs among pre-XDR and XDR cases, achieving improved outcomes is likely to require the use of a new regimen incorporating newly introduced drugs.
The findings from the South African TB DRS 2012-14 provide important information which could potentially guide future planning and address the current poor outcomes among drug-resistant TB cases. The following recommendations are made based on the findings of the survey:
• UrgentimplementationofinterventionsinMpumalanga
› Identify potential risk factors for targeted interventions
› Improve cross-border co-operation with Swaziland and Mozambique, utilising existing agreements achieved through the SADC declaration
› Conduct further research to fully define drivers of resistance in the province
6 South African Tuberculosis Drug Resistance Survey 2012–14
• DevelopinterventionstocurbIMRanditssecondaryeffects
› Strengthen current first-line regimen for continuation phase by adding ethambutol with or without pyrazinamide(RHE or RHZE), or institute appropriate measures for early identification of IMR
› Assess the contribution and effectiveness of IPT in the light of increasing cases of resistance
• MonitortransmissionofRMR,researchunderlyingreasonsforRMRandinstituteappropriateinterventions
› Regularly review transmission data from surveillance system
› Review current rifampicin dosing and conduct rifampicin bioavailability studies in the four and two-drug combination with and without antiretroviral therapies (ARTs) in areas with high RMR occurrence
› Undertake close monitoring of the quality of drugs used in the standard regimen
• Conduct randomised control trials (RCTs) and reviewexisting standardof caredata to assess effectiveness of existing first andsecond-line regimens
• MonitoruseofXpertMTB/Rifassay forearlydetectionof rifampicin resistanceand improveearlydetectionofsecond-linedrugresistance
• OptimiseexistingMDRregimenandconsidershorteningMDRregimenwithtriagealgorithmforappropriatepatientselection
• Designanappropriateregimenforpre-XDR/XDRpatientsusingacombinationofnewdrugs
• Maintainandenhancetheroutinesurveillancesystemformonitoringexistingandnewdrugresistanceandreducetheproportionof diagnosed cases not started on treatment.
7South African Tuberculosis Drug Resistance Survey 2012–14
Introduction
Global Tuberculosis Epidemiology
According to the World Health Organization (WHO) in 2015, tuberculosis (TB) mortality has declined by 47% since 1990 and the number of new TB cases has been falling worldwide at an average rate of 1.5% per year since 20001. Furthermore, the millennium development goal of halting and reversing TB incidence by 2015 has been achieved globally, in all six WHO regions and in 16 of the 22 TB high-burden countries (HBCs). Despite these positive developments, TB is now the leading cause of mortality worldwide, causing 1.4 million deaths in 2014. Amongst these TB-related deaths, 400 000 were also HIV positive. While the burden of TB is declining, the absolute numbers of drug-resistant TB cases continue to rise.
Multidrug-resistant (MDR) TB is defined by resistance to both rifampicin and isoniazid, the two core drugs used in the treatment of TB. MDR-TB requires an extended duration of treatment with less-effective drugs. Globally, 3.3% of new and 20% of previously treated TB cases have MDR-TB with an estimated caseload of 480 000 (range: 360 000–600 000) new cases of MDR-TB worldwide, annually, with only 111 000 (23%) cases initiated on appropriate treatment2. There were approximately 190 000 (range: 120 000–260 000) deaths from MDR-TB in 2014. The dismal situation has led the WHO to declare MDR-TB a global crisis3.
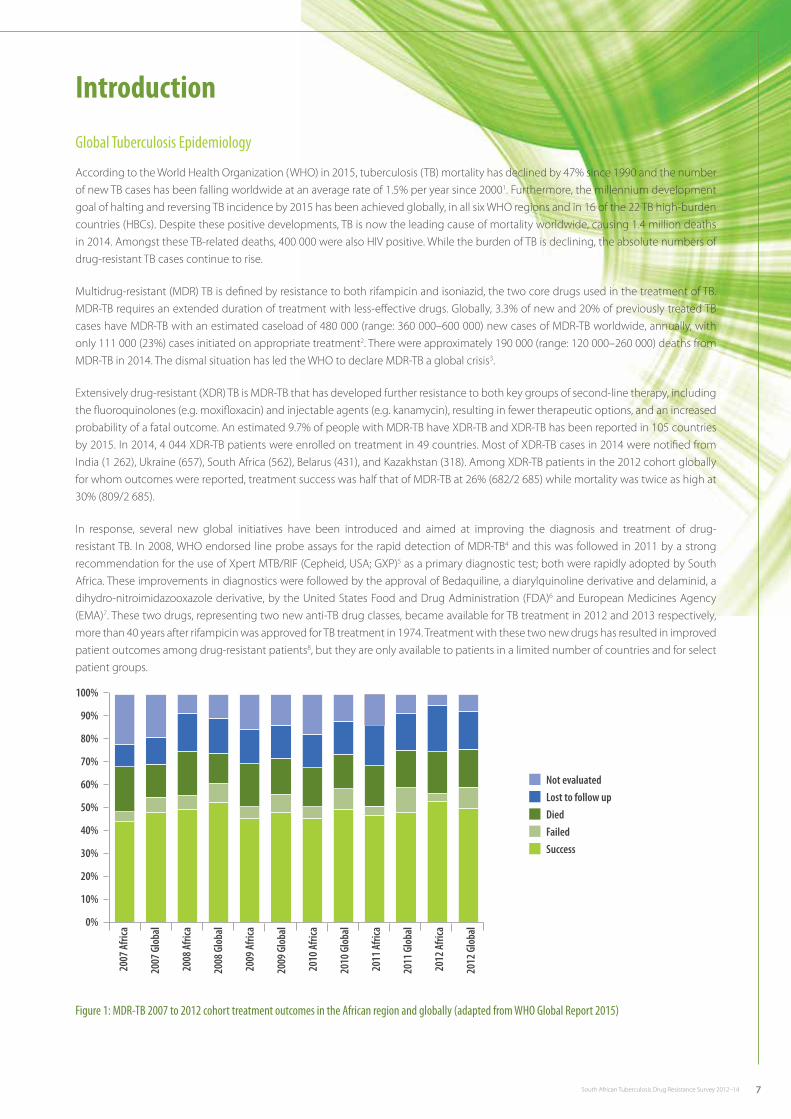
Extensively drug-resistant (XDR) TB is MDR-TB that has developed further resistance to both key groups of second-line therapy, including the fluoroquinolones (e.g. moxifloxacin) and injectable agents (e.g. kanamycin), resulting in fewer therapeutic options, and an increased probability of a fatal outcome. An estimated 9.7% of people with MDR-TB have XDR-TB and XDR-TB has been reported in 105 countries by 2015. In 2014, 4 044 XDR-TB patients were enrolled on treatment in 49 countries. Most of XDR-TB cases in 2014 were notified from India (1 262), Ukraine (657), South Africa (562), Belarus (431), and Kazakhstan (318). Among XDR-TB patients in the 2012 cohort globally for whom outcomes were reported, treatment success was half that of MDR-TB at 26% (682/2 685) while mortality was twice as high at 30% (809/2 685).
In response, several new global initiatives have been introduced and aimed at improving the diagnosis and treatment of drug-resistant TB. In 2008, WHO endorsed line probe assays for the rapid detection of MDR-TB4 and this was followed in 2011 by a strong recommendation for the use of Xpert MTB/RIF (Cepheid, USA; GXP)5 as a primary diagnostic test; both were rapidly adopted by South Africa. These improvements in diagnostics were followed by the approval of Bedaquiline, a diarylquinoline derivative and delaminid, a dihydro-nitroimidazooxazole derivative, by the United States Food and Drug Administration (FDA)6 and European Medicines Agency (EMA)7. These two drugs, representing two new anti-TB drug classes, became available for TB treatment in 2012 and 2013 respectively, more than 40 years after rifampicin was approved for TB treatment in 1974. Treatment with these two new drugs has resulted in improved patient outcomes among drug-resistant patients8, but they are only available to patients in a limited number of countries and for select patient groups.
100%
90%
80%
70%
60%
50%
40%
30%
20%
10%
0%
2007
Afri
ca
2008
Afri
ca
2009
Afri
ca
2010
Afri
ca
2011
Afri
ca
2012
Afri
ca
2007
Glo
bal
2008
Glo
bal
2009
Glo
bal
2010
Glo
bal
2011
Glo
bal
2012
Glo
bal
Not evaluated
Lost to follow up
Success
Failed
Died
Figure 1: MDR-TB 2007 to 2012 cohort treatment outcomes in the African region and globally (adapted from WHO Global Report 2015)
8 South African Tuberculosis Drug Resistance Survey 2012–14
Epidemiology of Tuberculosis in South Africa
South Africa remains one of the 22 highest TB-burdened countries globally and, has the second highest TB incidence rates in the world1. The high prevalence of HIV infection has been an important driver of TB in South Africa with TB incidence rates increasing from the early 1990s, coinciding with the increasing HIV prevalence. In response, South Africa has undertaken an aggressive programme aimed at controlling HIV and now has over 3 million people of its estimated 6.5 million HIV-infected on antiretroviral therapy (ART) 9. This has led to improvements in the overall life expectancy in South Africa from 57.1 years in 2009 to 62.2 years in 201310. This trend is possibly related to the decline in TB associated deaths, TB causes the most deaths in South Africa according to a report by Statistics South Africa, and remains a major public health threat11.
TB notification data in South Africa has shown a decline from approximately 400,000 cases in 200912 to 300,000 in 20141. This pattern was corroborated by a recent report showing a decrease in microbiologically confirmed pulmonary TB (mPTB) nationally and in South Africa’s provinces from an annual incidence (per 100 000 population) of 848 (845–850) in 2008, to 774 (771–776) by 2012 (representing a 9% decrease from 2008 to 2012)13. Furthermore an inverse relationship was observed between incidence of mPTB and ART coverage among HIV-infected individuals nationally and in the provinces.
Annual incidence (per 100 000 population) of mPTB differed between the nine provinces, exceeding 1 000 in Northern Cape (2004–12), Western Cape (2004–09), Eastern Cape (2008–12), and KwaZulu-Natal (2007–12). Between 2004 and 2012, KwaZulu-Natal had the highest annual number of new cases, with absolute numbers in 2011 representing 31% of mPTB cases in South Africa that year.
Although this data represents only mPTB cases, it is a robust indicator of TB trends, which are declining in all provinces. An important observation was the heterogeneity in incidence rates between provinces suggesting that, apart from the impact of ART on TB control, other factors may be contributing.
Multidrug-Resistant Tuberculosis in South Africa
The first national survey of TB drug resistance in South Africa was undertaken between 2001 and 200214. The study reported an MDR-TB rate in South Africa of 1.6% (1.1%-2.1%) in new cases and 6.6% (4.9%-8.2%) in retreatment cases. There was considerable variation by province, with the prevalence of resistance to rifampicin being lowest in the Western Cape at 0.9% and highest in Mpumalanga at 3.1% among new cases, and 3.9% and 16.0% respectively among retreatment cases.
Although the MDR prevalence appears to be low among primary TB cases, this needs to be interpreted in the context of a high incidence of TB in South Africa. In the WHO Global TB Report 2015, South Africa had the second highest absolute number of notified rifampicin-resistant (RR)/MDR cases globally (18 734)1, with India ranked number one (25 748) but has a population 20 times that of South Africa.
The occurrence of laboratory-confirmed XDR-TB – a more resistant form of MDR – has long been recognised in South Africa, and was managed as difficult-to-treat MDR-TB cases. It was however, the outbreak of XDR-TB with a very high mortality rate in 2005 at the Church of Scotland Hospital in Tugela Ferry, KwaZulu-Natal in which 52 patients were confirmed with XDR TB, with about half being putative primary cases, that brought XDR into focus worldwide15. This outbreak highlighted the potential for nosocomial spread of MDR/XDR-TB and the possibility of a specific clone spreading rapidly among patients with HIV/AIDS, with fatal outcomes. The lack of universal testing for drug-resistant TB may lead to undiagnosed drug-resistant cases circulating in the community, with potential for further spread. Following the outbreak in KwaZulu-Natal, WHO has expressed concern over the emergence of virulent drug-resistant strains of Mycobacterium tuberculosis (MTB) and called for measures to be strengthened and implemented to prevent the global spread of these deadly MTB strains16.
The outbreak in KwaZulu-Natal was followed six years later by a report of the emergence of “totally drug-resistant” TB in Eastern Cape, South Africa based on strains collected during the period of 2008-0917. The authors also identified an atypical Beijing strain type that was clustered in more than 80% of cases by strain typing, suggesting transmission. Although the term “totally drug-resistant” (TDR) TB is a misnomer as new drugs have been developed that offer new therapeutic options, the degree of resistance linked to clonal spread has been of great concern. This is especially true for a country like South Africa in which 18.9% of persons 15 years of age and above are infected with HIV9.
It should be noted that these outbreaks occurred in geographically confined areas. However, with increasing population mobility, the emergence of drug-resistant strains is expected to disseminate more widely. Evidence from KwaZulu-Natal suggests that the overall XDR-TB incidence has indeed increased in this region between 2007 (3.1/100 000 population) and 2011 (3.5/100 000 population)18. Furthermore, the outcome of such highly resistant TB is known to be poor, especially among HIV-positive patients, as was most clearly shown in the Tugela Ferry outbreak with a case fatality of almost 100%.
9South African Tuberculosis Drug Resistance Survey 2012–14
Routine notification data has shown that the treatment success rate is approximately 50% in MDR-TB cases and 20% in XDR-TB patients19. Furthermore, many of these unsuccessfully treated patients die. The situation has however improved with the introduction of bedaquiline for which early programme data suggests improved outcomes20.
Contrasted to the declining trend of new TB cases in South Africa, the number of drug-resistant cases diagnosed and recorded on treatment continues to rise19. The number of line probe assays (LPAs) performed was more than 100 000 at its peak in 201121 and was superseded by the Xpert MTB/RIF method with over 2 million tests performed in 2014, resulting in 218 231 TB cases having a primary test performed for rifampicin-resistant TB at baseline1. Thus the increase in case numbers is likely as a result of improved diagnostic options and intensified case finding leading to previously undiagnosed cases now being detected and treated rather than a true increase in burden.
Rationale for the Current Drug Resistance Survey
Much has changed in South Africa since the previous DRS with two recorded and published outbreaks of highly drug-resistant TB, an extensive scaling up of diagnostics, several intensive case-finding campaigns and the introduction of new drugs. The biggest change however has been the shift in policy with South Africa now home to the largest ART programme globally22. In addition the current WHO recommendation is to conduct a TB drug resistance survey every five years23.
The need to assess the current status of drug-resistant TB in South Africa was thus seen as an important priority in the face of a multiplicity of events that have occurred since the DRS of 2001–02. As heterogeneity of drug-resistant TB has been observed in the previous survey and was also evident in specific provinces and outbreaks, it was necessary to ensure the survey would be powered to provide estimates for individual provinces. Additionally, there was a need to determine not only the MDR-TB prevalence rates but also those of XDR-TB, which has emerged as a particular concern in South Africa.
Objectives
Primary Objective
• Toquantifyanddelineatetheextentofdrugresistance innewandretreatmentTBpatientsnationallyandprovincially inSouthAfrica.
Secondary Objective
• Tocomparethechangeindrugresistanceprevalencenationallyandprovinciallytothatestimatedintheprevioussurvey,conductedduring 2001-2002.
10 South African Tuberculosis Drug Resistance Survey 2012–14
Methods
Study design
The survey was a population-based cross-sectional study conducted following the WHO Guidelines for surveillance of drug resistance in tuberculosis23. A population proportionate cluster sampling design was used to determine the sample size and select study sites, aimed at providing MDR estimates for each province, as well as nationally. The clusters were randomly selected and were either individual healthcare facilities or a combination of facilities.
Patients were eligible for inclusion in the survey if they were older than 18 and presented as a presumptive TB case, according to WHO/ International Union against Tuberculosis and Lung Disease (IUATLD) definitions.
Definitions
New case
A “new case” is defined as a patient with a newly registered episode of TB who, in response to direct questioning, reports never having been treated for TB or reports having taken anti-TB drugs for less than one month; or where adequate documentation is available, for whom there is no evidence of having taken anti-TB drugs for one month or more.
Previously treated case
A “previously treated case” is defined as a patient with a newly registered episode of TB who, in response to direct questioning, reports having received one month or more of anti-TB drugs in the past; or where adequate documentation is available, there is evidence of having received one month or more of anti-TB drugs in the past.
Primary drug resistance
Patients who fulfilled the definition of being a “new case” of TB above, having no significant prior TB treatment exposure and who, based on laboratory testing, were found to have a drug-resistant MTB strain are considered to have primary drug-resistant TB.
Acquired drug resistance
Patients who fulfilled the definition of being a “previously treated case” of TB above, having received prior TB treatment for more than one month and who, based on laboratory testing, are found to have a drug- resistant MTB strain were considered to have acquired drug resistance.
MDR
Multidrug-resistant tuberculosis (MDR-TB) is defined as TB that is resistant to both isoniazid (INH) and rifampicin (RIF), two of the first-line drugs used in treating pulmonary tuberculosis.
Pre-XDR
Pre-XDR TB is defined as TB that is resistant to both isoniazid and rifampicin (RIF) and either a fluoroquinolone or second-line injectable agent but not both.
XDR
Extensively drug-resistant tuberculosis (XDR-TB) is defined as MDR-TB with additional resistance to any fluoroquinolone (FQ) and to at least one of three injectable second-line anti-tuberculosis drugs used in treatment (capreomycin [CPM], kanamycin [KM] or amikacin [AMK])
Study overview
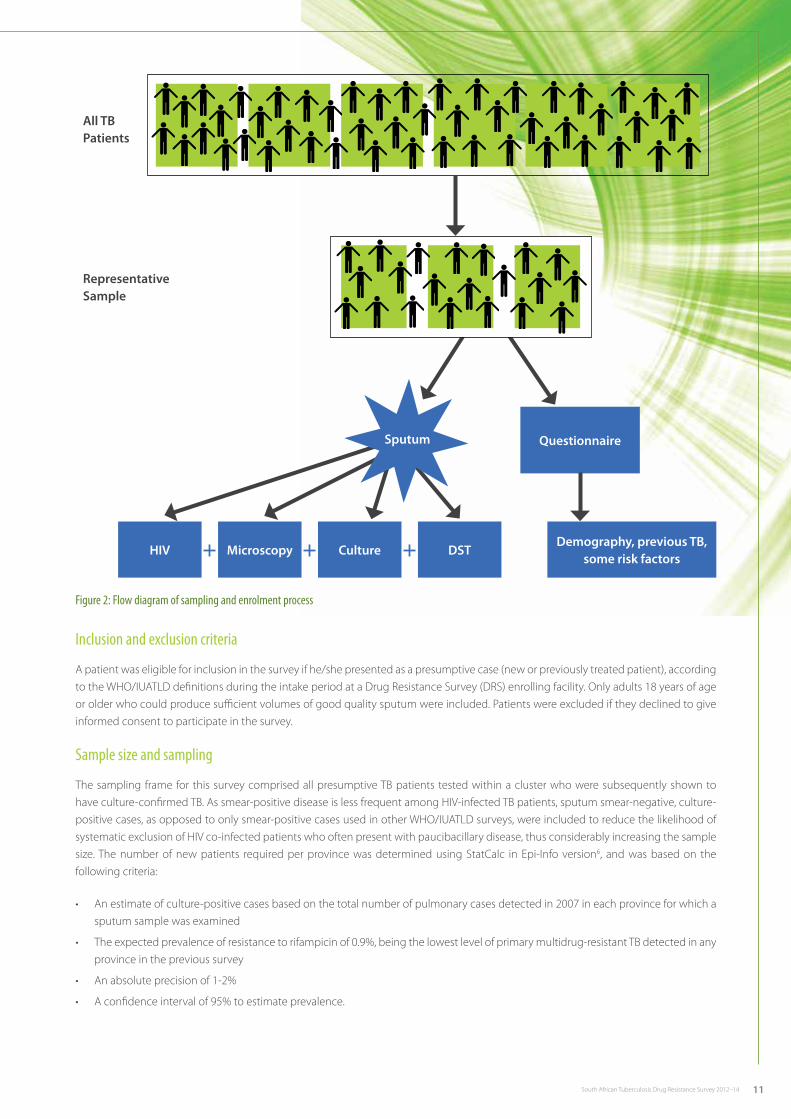
All consecutive presumptive TB cases, who provided informed consent at the selected facilities during the survey period, had a case report form (CRF) completed through direct patient interview by a healthcare worker at the health facility and in addition had a survey-specific sputum sample collected, were included. The CRF with the corresponding sample was sent to the Centre for Tuberculosis at the National Institute for Communicable Diseases in Johannesburg, where smear microscopy, liquid mycobacterial culture and HIV testing on sputum was performed. This was followed by drug susceptibility testing against a panel of first-line and second-line anti-TB drugs on Mycobacterium tuberculosis-confirmed isolates (Figure 2). Data from the CRF and the laboratory testing process were collated and analysed.
11South African Tuberculosis Drug Resistance Survey 2012–14
Questionnaire
HIV Microscopy Culture DSTDemography, previous TB,
some risk factors
Sputum
Representative Sample
All TB Patients
Figure 2: Flow diagram of sampling and enrolment process
Inclusion and exclusion criteria
A patient was eligible for inclusion in the survey if he/she presented as a presumptive case (new or previously treated patient), according to the WHO/IUATLD definitions during the intake period at a Drug Resistance Survey (DRS) enrolling facility. Only adults 18 years of age or older who could produce sufficient volumes of good quality sputum were included. Patients were excluded if they declined to give informed consent to participate in the survey.
Sample size and sampling
The sampling frame for this survey comprised all presumptive TB patients tested within a cluster who were subsequently shown to have culture-confirmed TB. As smear-positive disease is less frequent among HIV-infected TB patients, sputum smear-negative, culture-positive cases, as opposed to only smear-positive cases used in other WHO/IUATLD surveys, were included to reduce the likelihood of systematic exclusion of HIV co-infected patients who often present with paucibacillary disease, thus considerably increasing the sample size. The number of new patients required per province was determined using StatCalc in Epi-Info version6, and was based on the following criteria:
• Anestimateofculture-positivecasesbasedonthetotalnumberofpulmonarycasesdetectedin2007ineachprovinceforwhichasputum sample was examined
• Theexpectedprevalenceofresistancetorifampicinof0.9%,beingthelowestlevelofprimarymultidrug-resistantTBdetectedinanyprovince in the previous survey
• Anabsoluteprecisionof1-2%
• Aconfidenceintervalof95%toestimateprevalence.
12 South African Tuberculosis Drug Resistance Survey 2012–14
To adjust for the cluster design effect, the calculated sample size was multiplied by two. The design effect of two is the recommended default when information on variations in clusters is not available. As the proportion of suspects expected to test culture-positive varied by province (from 5-25% based on 2007 data), the required number of new patients was multiplied accordingly to obtain the number of suspects for screening. In order to accommodate the occurrence of a substantial number of previously treated cases - as experienced in a previous survey - the sample size was increased by the expected number of retreated cases in each province.
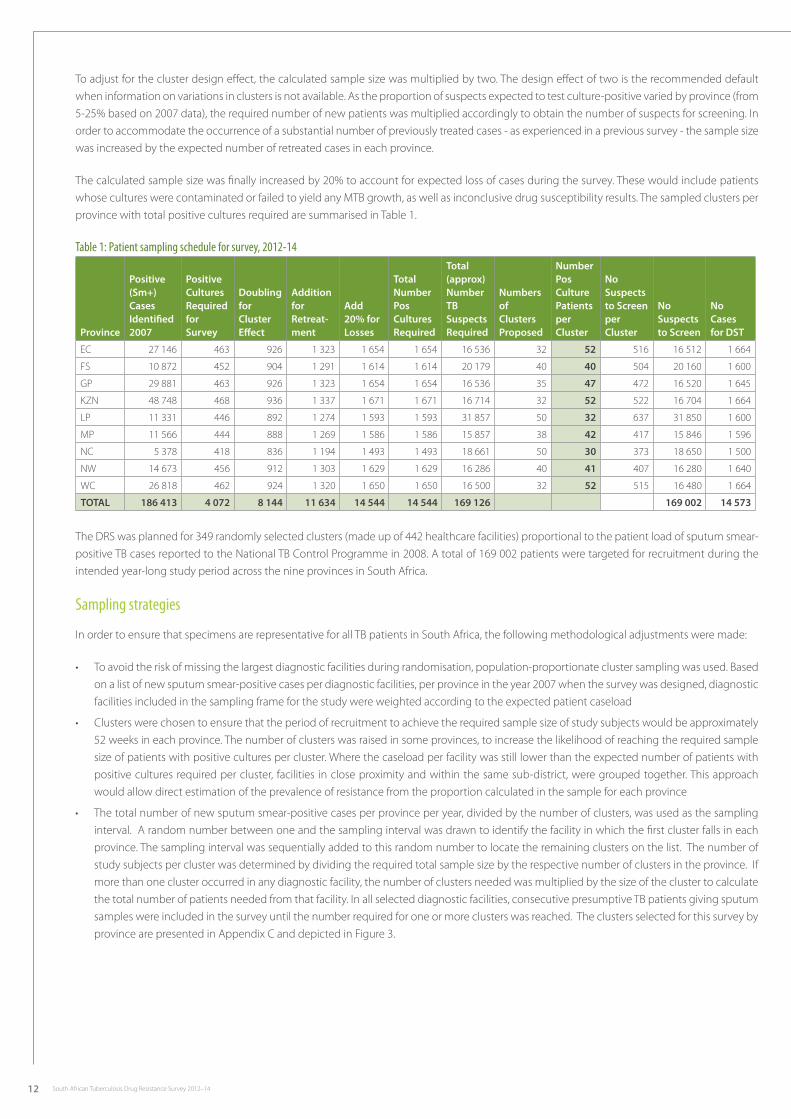
The calculated sample size was finally increased by 20% to account for expected loss of cases during the survey. These would include patients whose cultures were contaminated or failed to yield any MTB growth, as well as inconclusive drug susceptibility results. The sampled clusters per province with total positive cultures required are summarised in Table 1.
Table 1: Patient sampling schedule for survey, 2012-14
Province
Positive (Sm+) Cases Identified 2007
Positive Cultures Required for Survey
Doubling for Cluster Effect
Addition for Retreat-ment
Add 20% for Losses
Total Number Pos Cultures Required
Total (approx) Number TB Suspects Required
Numbers of Clusters Proposed
Number Pos Culture Patients per Cluster
No Suspects to Screen per Cluster
No Suspects to Screen
No Cases for DST
EC 27 146 463 926 1 323 1 654 1 654 16 536 32 52 516 16 512 1 664
FS 10 872 452 904 1 291 1 614 1 614 20 179 40 40 504 20 160 1 600
GP 29 881 463 926 1 323 1 654 1 654 16 536 35 47 472 16 520 1 645
KZN 48 748 468 936 1 337 1 671 1 671 16 714 32 52 522 16 704 1 664
LP 11 331 446 892 1 274 1 593 1 593 31 857 50 32 637 31 850 1 600
MP 11 566 444 888 1 269 1 586 1 586 15 857 38 42 417 15 846 1 596
NC 5 378 418 836 1 194 1 493 1 493 18 661 50 30 373 18 650 1 500
NW 14 673 456 912 1 303 1 629 1 629 16 286 40 41 407 16 280 1 640
WC 26 818 462 924 1 320 1 650 1 650 16 500 32 52 515 16 480 1 664
TOTAL 186 413 4 072 8 144 11 634 14 544 14 544 169 126 169 002 14 573
The DRS was planned for 349 randomly selected clusters (made up of 442 healthcare facilities) proportional to the patient load of sputum smear-positive TB cases reported to the National TB Control Programme in 2008. A total of 169 002 patients were targeted for recruitment during the intended year-long study period across the nine provinces in South Africa.
Sampling strategies
In order to ensure that specimens are representative for all TB patients in South Africa, the following methodological adjustments were made:
• Toavoidtheriskofmissingthelargestdiagnosticfacilitiesduringrandomisation,population-proportionateclustersamplingwasused.Basedon a list of new sputum smear-positive cases per diagnostic facilities, per province in the year 2007 when the survey was designed, diagnostic facilities included in the sampling frame for the study were weighted according to the expected patient caseload
• Clusterswerechosentoensurethattheperiodofrecruitmenttoachievetherequiredsamplesizeofstudysubjectswouldbeapproximately52 weeks in each province. The number of clusters was raised in some provinces, to increase the likelihood of reaching the required sample size of patients with positive cultures per cluster. Where the caseload per facility was still lower than the expected number of patients with positive cultures required per cluster, facilities in close proximity and within the same sub-district, were grouped together. This approach would allow direct estimation of the prevalence of resistance from the proportion calculated in the sample for each province
• Thetotalnumberofnewsputumsmear-positivecasesperprovinceperyear,dividedbythenumberofclusters,wasusedasthesamplinginterval. A random number between one and the sampling interval was drawn to identify the facility in which the first cluster falls in each province. The sampling interval was sequentially added to this random number to locate the remaining clusters on the list. The number of study subjects per cluster was determined by dividing the required total sample size by the respective number of clusters in the province. If more than one cluster occurred in any diagnostic facility, the number of clusters needed was multiplied by the size of the cluster to calculate the total number of patients needed from that facility. In all selected diagnostic facilities, consecutive presumptive TB patients giving sputum samples were included in the survey until the number required for one or more clusters was reached. The clusters selected for this survey by province are presented in Appendix C and depicted in Figure 3.

13South African Tuberculosis Drug Resistance Survey 2012–14
Figure 3: Map of randomly selected facilities included in the SA TB DRS 2012-14
Survey preparation and patient enrolments
Once ethical and provincial approvals were received, initial preparatory work was initiated, including sourcing survey-specific staff which included field project co-ordinators, laboratory and data capturing staff. Logistics and workflows were developed and initial piloting performed to identify and rectify any obvious challenges.
The roll-out of the survey was undertaken in a step-wise approach, initiating with one province per month. Province initiations were avoided during holiday periods. Thus the initiation of all 9 provinces took place over 12 months and the close out period followed a similar pattern. Thus the survey enrolment occurred between mid-2012 and mid-2014. A schematic presentation of the roll-out schedule is shown in Figure 4.
July-12 Aug-12 Sep-12 Oct-12 Nov-12 Feb-13 Feb-13 Mar-13 Apr-13
Gauteng Gauteng Gauteng Gauteng Gauteng Gauteng Gauteng Gauteng Gauteng
North West North West North West North West North West North West North West North West
Northern Cape
Northern Cape
Northern Cape
Northern Cape
Northern Cape
Northern Cape
Northern Cape
Limpopo Limpopo Limpopo Limpopo Limpopo Limpopo
Eastern Cape Eastern Cape Eastern Cape Eastern Cape Eastern Cape
Mpumalanga Mpumalanga Mpumalanga Mpumalanga
Western Cape
Western Cape
Western Cape
KwaZulu-Natal
KwaZul-Natal
Free State
Figure 4: Roll-out plan for the 2012-14 SA TB DRS
14 South African Tuberculosis Drug Resistance Survey 2012–14
A standardised case report form (CRF, Appendix A) was used at all survey facilities collecting demographic, clinical, enrolment criteria and risk factor information. This was accompanied by an informed consent form (Appendix B) which included a section related to HIV testing and reporting. In order to ensure that the information on the CRF was collected in a standardised manner, central training sessions were held in each province prior to initiation. During the training sessions, colleagues from participating facilities were reminded of the basic concepts of TB with specific attention paid to administering the questionnaire and collecting the extra sputum sample. The training comprised a combination of didactic presentations and role play. Training was also conducted on procedures for obtaining informed consent and clarification of issues related to the patient’s voluntary participation. As not all staff were available for central training, this was followed up with on-site training at every participating facility where further role play was also conducted to ensure that the CRF was understood and completed correctly.
The training sessions included sputum collection and packaging procedures, as well as the handling and shipment of specimens. The former is a routine practice and training was aimed at reinforcing basic principles, including infection control measures. Specific training related to packaging was provided to deal with variation introduced by the requirement of an additional survey sample. At the DRS facilities, two ‘spot’ sputum samples were collected from consenting participants. The first sample was always used as the routine specimen, following the existing diagnostic algorithm at the time, and was intended for clinical management. During the course of the survey, the routine diagnostic algorithm was changed from smear and culture-based to the use of the Xpert MTB/RIF assay as the primary diagnostic tool. The second sample was the survey-specific sample. Both samples were individually packaged and placed into one ‘maxi’ shipment bag. A common sample label was used to link both samples and was pasted on the respective sputum containers and the accompanying DRS questionnaire. The DRS bag was identifiable with clear labeling and a unique red colour scheme, while members of staff from local laboratories who received these specimens were also trained on managing the two samples, keeping the first one for local diagnostic procedures and transferring the survey specific specimens to the Centre for Tuberculosis in Sandringham, Johannesburg.
Monitoring and evaluation
In each province, a provincial field co-ordinator was appointed to conduct close monitoring of the survey activities, on a day-to-day basis. This included following up on enrolment targets, retraining staff where necessary, liaison between the facilities and local laboratories, as well as providing feedback to the provincial programme on progress with survey implementation. Due to the large scale of the survey and the utilisation of routine health care workers for enrolment at the sites, challenges arose during enrolment that required regular retraining and support visits to survey sites due competing interests with routine work, movement of staff as well as insufficient human resource capacity at the health facilities over the survey period.
A monitoring plan that outlined indicators ensuring the survey was going to plan was developed prior to implementation. The plan described survey reports that would be published, their frequency, content and intended audience. A framework of indicators for monitoring all survey processes was included in the plan. The indicators were divided into four broad categories: sample size, laboratory testing, timeliness and data quality. Indicators were reported to the survey project manager and provincial co-ordinators for corrective action. This enabled the survey team to respond to challenges with the survey as they arose.
Lower than expected enrolment rates were problematic across the provinces and an additional period of two months was allocated to all provinces to ensure balance across sites, resulting in a total enrolment period of 14 months for each province. Several meetings with the respective provinces were also held to address low enrolments. The drive to increase enrolment was fairly successful but had unforeseen consequences: although the number of enrolments increased, a large number of samples were sub-optimal for processing upon receipt at NICD.
Registration of samples in the laboratory
On arrival at the peripheral laboratory of the National Health Laboratory Service (NHLS) registration of all samples was performed on the laboratory information system in use at the respective receiving laboratories. Registration entailed the creation of a unique laboratory number for each survey sample, as well as a survey specific location code. Once registered, all samples were subsequently transported through the existing (NHLS) logistics services, following standard procedures to the Centre for Tuberculosis (CTB), NICD in Johannesburg.
The non-testable samples were either of very low volume, making them unsuitable for processing due to the complexity of the test processing procedures, or had leaked from the container during transit. This necessitated re-fresher training for health facility staff on sputum collection and packaging procedures. In addition, the leaking of specimens was investigated and it was found that leakages were most likely due to the type of closing mechanism which differed from that of the routine sample container. This was corrected midway through the survey and other measures were also introduced to optimise the routing system for the samples aimed at minimising transit times.
15South African Tuberculosis Drug Resistance Survey 2012–14
Laboratory procedures
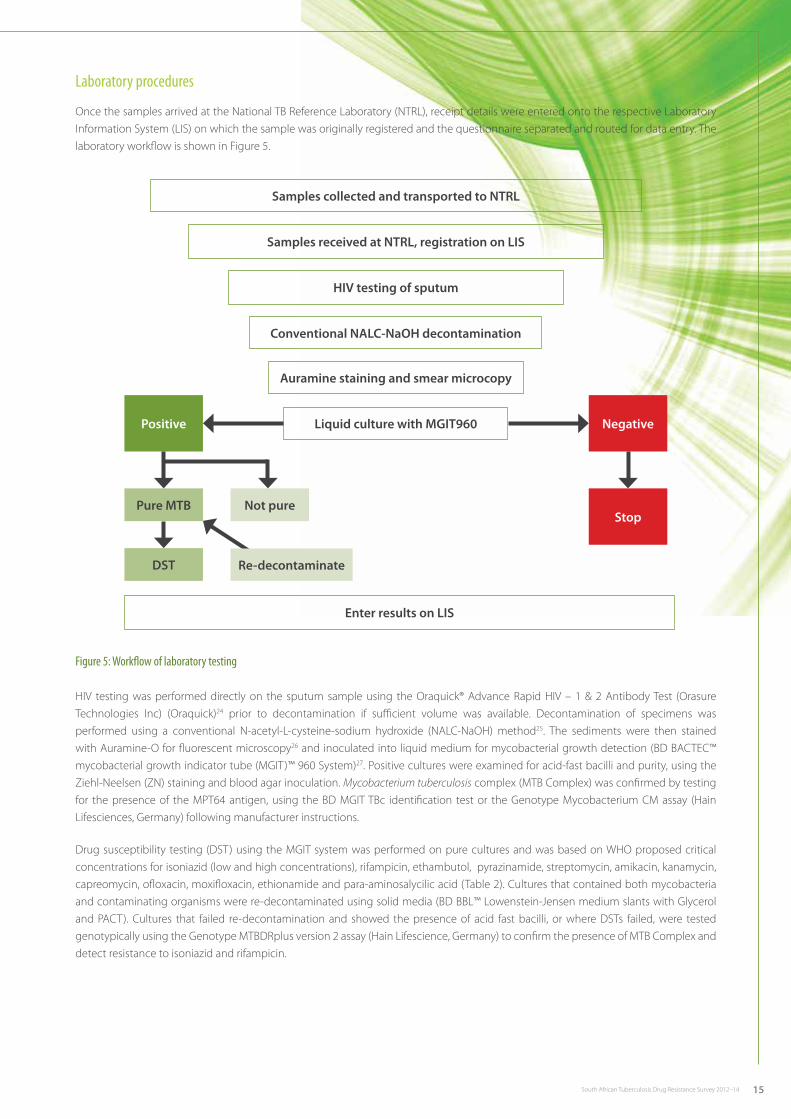
Once the samples arrived at the National TB Reference Laboratory (NTRL), receipt details were entered onto the respective Laboratory Information System (LIS) on which the sample was originally registered and the questionnaire separated and routed for data entry. The laboratory workflow is shown in Figure 5.
Figure 5: Workflow of laboratory testing
HIV testing was performed directly on the sputum sample using the Oraquick® Advance Rapid HIV – 1 & 2 Antibody Test (Orasure Technologies Inc) (Oraquick)24 prior to decontamination if sufficient volume was available. Decontamination of specimens was performed using a conventional N-acetyl-L-cysteine-sodium hydroxide (NALC-NaOH) method25. The sediments were then stained with Auramine-O for fluorescent microscopy26 and inoculated into liquid medium for mycobacterial growth detection (BD BACTEC™ mycobacterial growth indicator tube (MGIT)™ 960 System)27. Positive cultures were examined for acid-fast bacilli and purity, using the Ziehl-Neelsen (ZN) staining and blood agar inoculation. Mycobacterium tuberculosis complex (MTB Complex) was confirmed by testing for the presence of the MPT64 antigen, using the BD MGIT TBc identification test or the Genotype Mycobacterium CM assay (Hain Lifesciences, Germany) following manufacturer instructions.
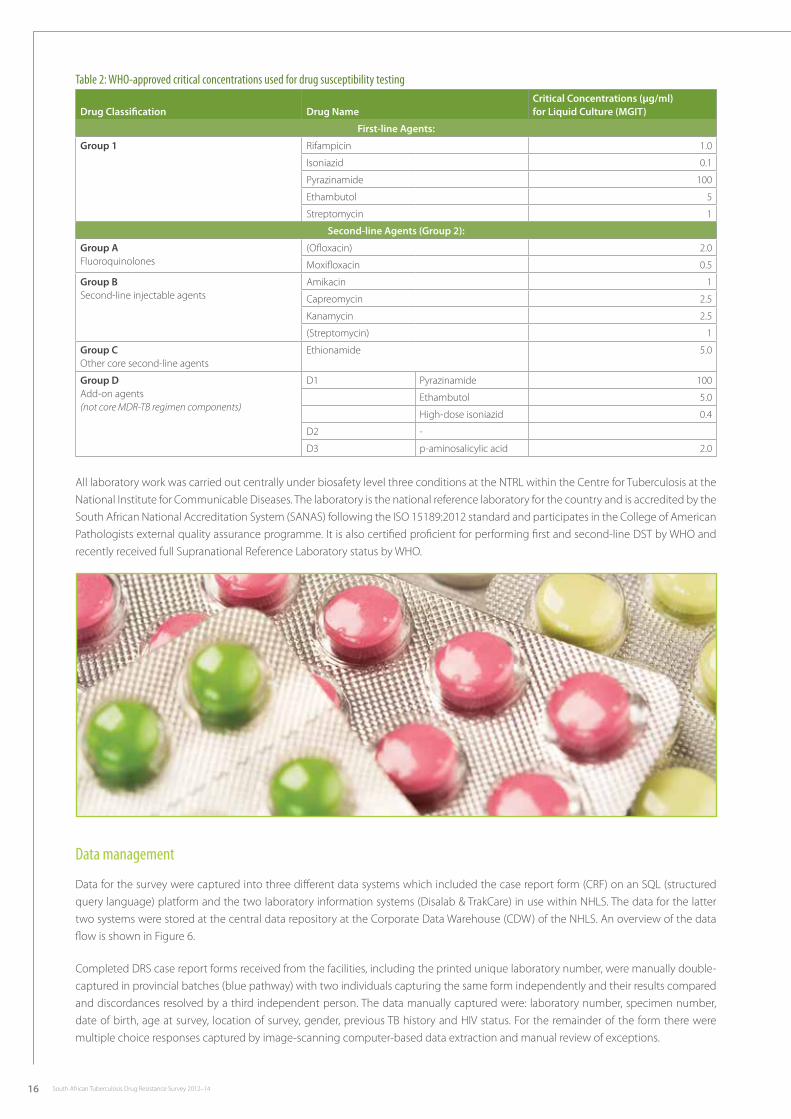
Drug susceptibility testing (DST) using the MGIT system was performed on pure cultures and was based on WHO proposed critical concentrations for isoniazid (low and high concentrations), rifampicin, ethambutol, pyrazinamide, streptomycin, amikacin, kanamycin, capreomycin, ofloxacin, moxifloxacin, ethionamide and para-aminosalycilic acid (Table 2). Cultures that contained both mycobacteria and contaminating organisms were re-decontaminated using solid media (BD BBL™ Lowenstein-Jensen medium slants with Glycerol and PACT). Cultures that failed re-decontamination and showed the presence of acid fast bacilli, or where DSTs failed, were tested genotypically using the Genotype MTBDRplus version 2 assay (Hain Lifescience, Germany) to confirm the presence of MTB Complex and detect resistance to isoniazid and rifampicin.
Samples collected and transported to NTRL
Enter results on LIS
Samples received at NTRL, registration on LIS
HIV testing of sputum
Conventional NALC-NaOH decontamination
Auramine staining and smear microcopy
Liquid culture with MGIT960 NegativePositive
Pure MTB Not pure
DST
Stop
Re-decontaminate
16 South African Tuberculosis Drug Resistance Survey 2012–14
Table 2: WHO-approved critical concentrations used for drug susceptibility testing
Drug Classification Drug NameCritical Concentrations (μg/ml) for Liquid Culture (MGIT)
First-line Agents:
Group 1 Rifampicin 1.0
Isoniazid 0.1
Pyrazinamide 100
Ethambutol 5
Streptomycin 1
Second-line Agents (Group 2):
Group A Fluoroquinolones
(Ofloxacin) 2.0
Moxifloxacin 0.5
Group B Second-line injectable agents
Amikacin 1
Capreomycin 2.5
Kanamycin 2.5
(Streptomycin) 1
Group C Other core second-line agents
Ethionamide 5.0
Group D Add-on agents (not core MDR-TB regimen components)
D1 Pyrazinamide 100
Ethambutol 5.0
High-dose isoniazid 0.4
D2 -
D3 p-aminosalicylic acid 2.0
All laboratory work was carried out centrally under biosafety level three conditions at the NTRL within the Centre for Tuberculosis at the National Institute for Communicable Diseases. The laboratory is the national reference laboratory for the country and is accredited by the South African National Accreditation System (SANAS) following the ISO 15189:2012 standard and participates in the College of American Pathologists external quality assurance programme. It is also certified proficient for performing first and second-line DST by WHO and recently received full Supranational Reference Laboratory status by WHO.
Data management
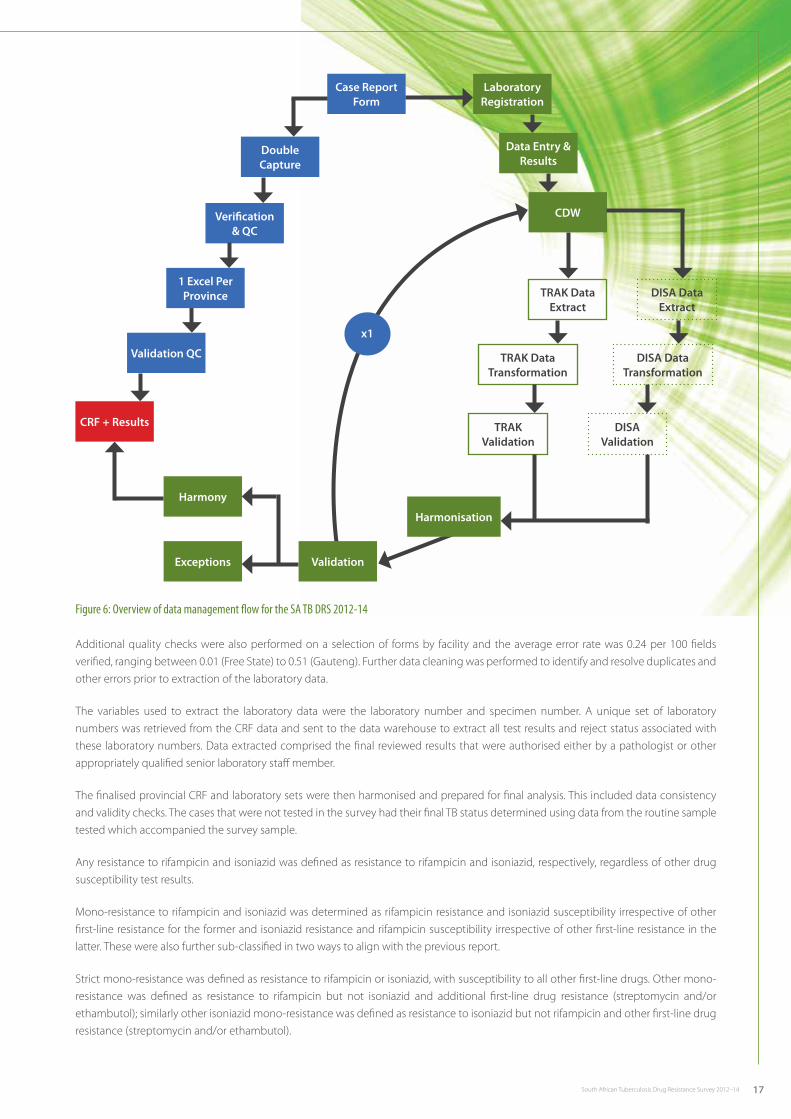
Data for the survey were captured into three different data systems which included the case report form (CRF) on an SQL (structured query language) platform and the two laboratory information systems (Disalab & TrakCare) in use within NHLS. The data for the latter two systems were stored at the central data repository at the Corporate Data Warehouse (CDW) of the NHLS. An overview of the data flow is shown in Figure 6.
Completed DRS case report forms received from the facilities, including the printed unique laboratory number, were manually double-captured in provincial batches (blue pathway) with two individuals capturing the same form independently and their results compared and discordances resolved by a third independent person. The data manually captured were: laboratory number, specimen number, date of birth, age at survey, location of survey, gender, previous TB history and HIV status. For the remainder of the form there were multiple choice responses captured by image-scanning computer-based data extraction and manual review of exceptions.
17South African Tuberculosis Drug Resistance Survey 2012–14
CRF + Results
Validation QC
1 Excel Per Province
Verification & QC
Double Capture
Case Report Form
Laboratory Registration
Data Entry & Results
CDW
TRAK Data Extract
TRAK Data Transformation
DISA Data Transformation
TRAK Validation
Harmonisation
Exceptions
Harmony
DISA Data Extract
DISA Validation
Validation
x1
Figure 6: Overview of data management flow for the SA TB DRS 2012-14
Additional quality checks were also performed on a selection of forms by facility and the average error rate was 0.24 per 100 fields verified, ranging between 0.01 (Free State) to 0.51 (Gauteng). Further data cleaning was performed to identify and resolve duplicates and other errors prior to extraction of the laboratory data.
The variables used to extract the laboratory data were the laboratory number and specimen number. A unique set of laboratory numbers was retrieved from the CRF data and sent to the data warehouse to extract all test results and reject status associated with these laboratory numbers. Data extracted comprised the final reviewed results that were authorised either by a pathologist or other appropriately qualified senior laboratory staff member.
The finalised provincial CRF and laboratory sets were then harmonised and prepared for final analysis. This included data consistency and validity checks. The cases that were not tested in the survey had their final TB status determined using data from the routine sample tested which accompanied the survey sample.
Any resistance to rifampicin and isoniazid was defined as resistance to rifampicin and isoniazid, respectively, regardless of other drug susceptibility test results.
Mono-resistance to rifampicin and isoniazid was determined as rifampicin resistance and isoniazid susceptibility irrespective of other first-line resistance for the former and isoniazid resistance and rifampicin susceptibility irrespective of other first-line resistance in the latter. These were also further sub-classified in two ways to align with the previous report.
Strict mono-resistance was defined as resistance to rifampicin or isoniazid, with susceptibility to all other first-line drugs. Other mono-resistance was defined as resistance to rifampicin but not isoniazid and additional first-line drug resistance (streptomycin and/or ethambutol); similarly other isoniazid mono-resistance was defined as resistance to isoniazid but not rifampicin and other first-line drug resistance (streptomycin and/or ethambutol).
18 South African Tuberculosis Drug Resistance Survey 2012–14
MDR status was assigned to confirmed TB cases with resistance to both rifampicin and isoniazid regardless of drug susceptibility test method used.
Second-line resistance was defined as resistance to any one of the second-line injectable therapeutic agents, while fluoroquinolone resistance was defined as resistance to ofloxacin. XDR-TB status was assigned to all TB confirmed cases that were MDR and that additionally had both second line and fluoroquinolone resistance.
Data on HIV status was obtained through self-reporting at interview and from the Oraquick testing on sputum samples. Self-reported HIV status is influenced by reporting bias especially for those reporting a HIV-negative status 28. The Oraquick test on the other hand has reduced sensitivity (93.5%; 95% CI: 87.1%-97.3%) and negative predictive value (73.9%; 95% CI: 53.4%-88.7%) when tested on sputum more than 24 hours after collection which was most often the case in this survey29. Additionally, HIV-infected individuals who are receiving HAART may produce false negative results30. Thus to determine a final HIV status the Oraquick result was used and for those cases where the test was negative and the self-report was positive, these cases were regarded as HIV positive.
Data analysis
Both descriptive and statistical analysis accounting for the complex multistage sampling strategy and clustering of patients within primary sampling units were performed. Simple descriptive statistics compared demographic and laboratory parameters between provinces including age, sex, smear, culture and HIV positivity rates. For those with missing age or sex these were extracted from the laboratory registration data for the matched routine sample if this data was available. Culture positivity rates were calculated as the proportion of culture positives with confirmed TB among the presumptive TB cases enrolled and tested by culture. The smear positivity rates were calculated among TB culture- positive cases.
Statistical analysis aimed at determining population level first-line drug resistance estimates, at a provincial level, and both first and second-line population level resistance estimates at a national level among TB cases. Additionally, national second-line estimates were calculated among the sub-group of MDR cases. The provincial estimates were determined after adjusting for the clustering effect introduced by the survey design and any potential biases that may have arisen during implementation. The provincial estimates were pooled to generate national estimates.
The data for the population level analysis was initially analysed to assess the bias potentially introduced through challenges with sampling and with missing data. The sampling risk was that not all attendees at the facilities were enrolled and among participants not all had a culture performed as some of the cultures and drug susceptibility testing were unsuccessful. Age-sex structures were assessed at each cascade of potential loss using routine laboratory surveillance data to assess representativeness. This included an assessment of those participants that were enrolled but whose sputa could not be tested, those tested but with a contaminated culture and those with failed drug susceptibility testing (DST).
Additionally, patterns of missing data in key variables were tabulated by cluster and province. These variables included: cluster, province, age, sex, previous treatment history and an assessment made on the randomness of the missing values. After performing these tasks, a consultation was held with technical support from the WHO and the US Centers for Disease Control and Prevention (CDC) and several different approaches discussed and evaluated before coming to a final determination of the most robust approach to be used to correct for any biases identified.
Multiple imputation was selected as an appropriate method and used to impute missing age, gender, previous treatment history, final culture status of those with contaminated cultures and DST results for failed susceptibility testing. Rifampicin and isoniazid were imputed individually to determine the final MDR status the same was done for ofloxacin and the class of second-line injectable agents to determine the XDR status.
Inverse probability weighting was applied post-imputation, using the variables age, gender and cluster, in order to address potential bias in enrolments. The numerator for these weights was composed of all culture-positive MTB cases detected in the DRS and all cases that were enrolled in the DRS but had untestable DRS samples yet were smear, culture or Xpert-positive for MTB through routine testing. The denominator consisted of all culture-positive MTB cases detected in the DRS.

19South African Tuberculosis Drug Resistance Survey 2012–14
The estimates were then tabulated for resistance among new and retreatment cases, as well as overall and compared to the individual level crude analysis and cluster level analysis for each province. These were then also compared during analysis using logistic regression with robust standard errors (RSE) prior to imputation, RSE with multiple imputation and RSE with multiple imputation and inverse probability weighting. The results showed consistency in the estimates with no significant difference in the methods applied. The final results presented are based on the model using both multiple imputation and inverse probability weighting as these factor in the potential bias mentioned previously.
In order to determine the national estimate for first and second-line resistance among TB cases the individual province estimates were pooled, and weighting was applied using the notification data for TB cases in each province in the year 2012, stratified by new and previously treated cases irrespective of smear result. Additionally for the national estimate of second line and XDR resistance estimates among MDR cases, the imputed provincial data for the second lines were pooled and weighted against the number of notified MDR cases on treatment by province in 2012.
Ethical considerations
Patients were invited to participate in the survey and those who volunteered were required to provide informed consent prior to enrolment. This was performed by healthcare workers at the DRS enrolling sites who had received training on completing the task.
As HIV is strongly associated with risk for TB, the need for HIV testing and reporting was considered important. Concerns however, arose that this may lead to a bias in enrolment if HIV testing was compulsory for participation. After discussions and approval from the ethics committees, it was decided to perform testing on all sputum samples for HIV with a voluntary option in the informed consent procedure on whether patients wish to receive the result or not.
In addition, and to ensure that patients were provided the best care, all patients enrolled in the survey were encouraged to have a routine HIV test performed and any participant that consented to receive the HIV test result, was referred for voluntary counseling on the advantages and implications of undergoing standard testing for HIV. The survey-specific HIV test was deemed suitable for surveillance purposes but not routine clinical management.
The survey received ethical approval from the University of Witwatersrand Research Ethics Committee on the 26/11/2010 (Ethics clearance No. M081022). Clearance was also received from the Centers for Disease Control and Prevention, Atlanta, USA. The survey was initiated after consultation and approval from the respective provinces and the National TB Control Programme.
20 South African Tuberculosis Drug Resistance Survey 2012–14
Results
Demographic and laboratory characteristics
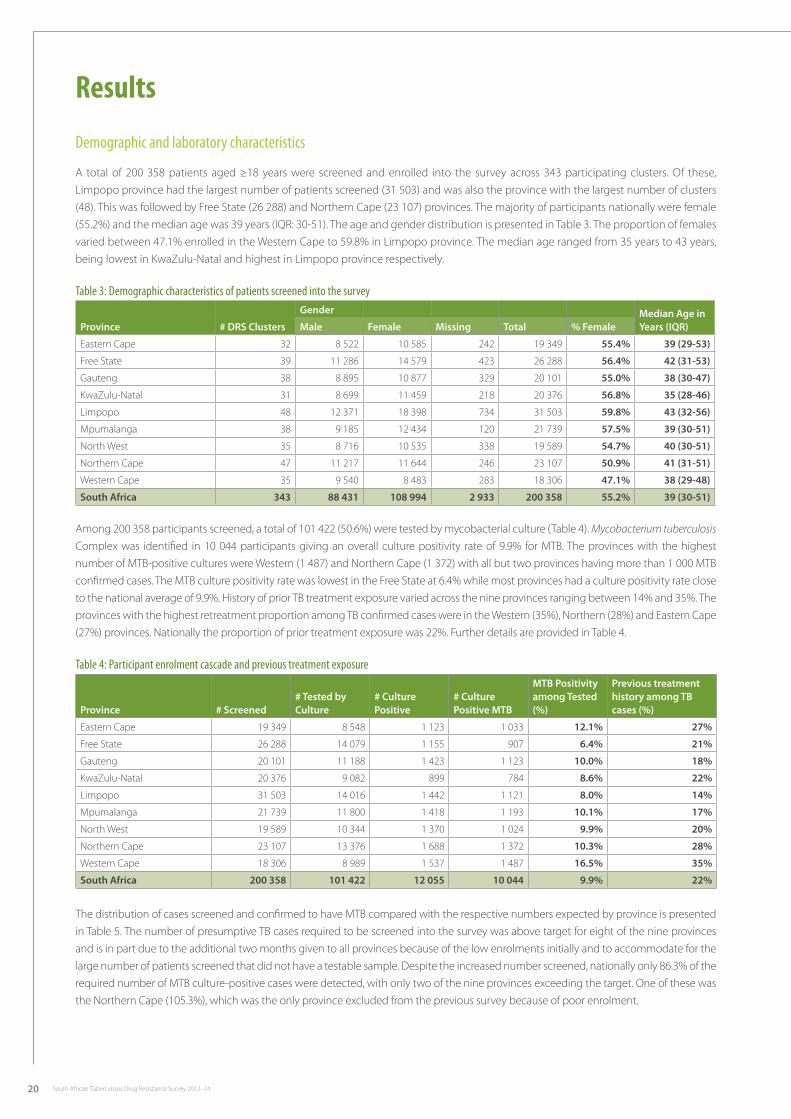
A total of 200 358 patients aged ≥18 years were screened and enrolled into the survey across 343 participating clusters. Of these, Limpopo province had the largest number of patients screened (31 503) and was also the province with the largest number of clusters (48). This was followed by Free State (26 288) and Northern Cape (23 107) provinces. The majority of participants nationally were female (55.2%) and the median age was 39 years (IQR: 30-51). The age and gender distribution is presented in Table 3. The proportion of females varied between 47.1% enrolled in the Western Cape to 59.8% in Limpopo province. The median age ranged from 35 years to 43 years, being lowest in KwaZulu-Natal and highest in Limpopo province respectively.
Table 3: Demographic characteristics of patients screened into the survey
Province # DRS Clusters
Gender Median Age in Years (IQR)Male Female Missing Total % Female
Eastern Cape 32 8 522 10 585 242 19 349 55.4% 39 (29-53)
Free State 39 11 286 14 579 423 26 288 56.4% 42 (31-53)
Gauteng 38 8 895 10 877 329 20 101 55.0% 38 (30-47)
KwaZulu-Natal 31 8 699 11 459 218 20 376 56.8% 35 (28-46)
Limpopo 48 12 371 18 398 734 31 503 59.8% 43 (32-56)
Mpumalanga 38 9 185 12 434 120 21 739 57.5% 39 (30-51)
North West 35 8 716 10 535 338 19 589 54.7% 40 (30-51)
Northern Cape 47 11 217 11 644 246 23 107 50.9% 41 (31-51)
Western Cape 35 9 540 8 483 283 18 306 47.1% 38 (29-48)
South Africa 343 88 431 108 994 2 933 200 358 55.2% 39 (30-51)
Among 200 358 participants screened, a total of 101 422 (50.6%) were tested by mycobacterial culture (Table 4). Mycobacterium tuberculosis Complex was identified in 10 044 participants giving an overall culture positivity rate of 9.9% for MTB. The provinces with the highest number of MTB-positive cultures were Western (1 487) and Northern Cape (1 372) with all but two provinces having more than 1 000 MTB confirmed cases. The MTB culture positivity rate was lowest in the Free State at 6.4% while most provinces had a culture positivity rate close to the national average of 9.9%. History of prior TB treatment exposure varied across the nine provinces ranging between 14% and 35%. The provinces with the highest retreatment proportion among TB confirmed cases were in the Western (35%), Northern (28%) and Eastern Cape (27%) provinces. Nationally the proportion of prior treatment exposure was 22%. Further details are provided in Table 4.
Table 4: Participant enrolment cascade and previous treatment exposure
Province # Screened# Tested by Culture
# Culture Positive
# Culture Positive MTB
MTB Positivity among Tested (%)
Previous treatment history among TB cases (%)
Eastern Cape 19 349 8 548 1 123 1 033 12.1% 27%
Free State 26 288 14 079 1 155 907 6.4% 21%
Gauteng 20 101 11 188 1 423 1 123 10.0% 18%
KwaZulu-Natal 20 376 9 082 899 784 8.6% 22%
Limpopo 31 503 14 016 1 442 1 121 8.0% 14%
Mpumalanga 21 739 11 800 1 418 1 193 10.1% 17%
North West 19 589 10 344 1 370 1 024 9.9% 20%
Northern Cape 23 107 13 376 1 688 1 372 10.3% 28%
Western Cape 18 306 8 989 1 537 1 487 16.5% 35%
South Africa 200 358 101 422 12 055 10 044 9.9% 22%
The distribution of cases screened and confirmed to have MTB compared with the respective numbers expected by province is presented in Table 5. The number of presumptive TB cases required to be screened into the survey was above target for eight of the nine provinces and is in part due to the additional two months given to all provinces because of the low enrolments initially and to accommodate for the large number of patients screened that did not have a testable sample. Despite the increased number screened, nationally only 86.3% of the required number of MTB culture-positive cases were detected, with only two of the nine provinces exceeding the target. One of these was the Northern Cape (105.3%), which was the only province excluded from the previous survey because of poor enrolment.
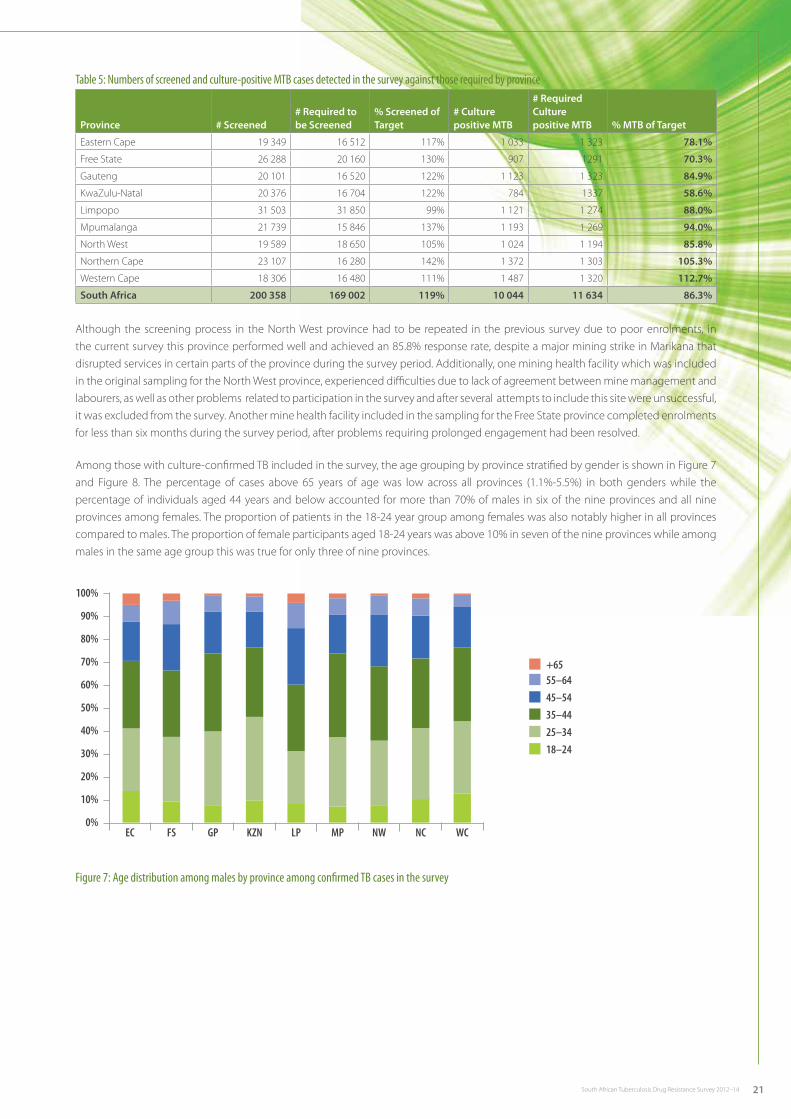
21South African Tuberculosis Drug Resistance Survey 2012–14
Table 5: Numbers of screened and culture-positive MTB cases detected in the survey against those required by province
Province # Screened# Required to be Screened
% Screened of Target
# Culture positive MTB
# Required Culture positive MTB % MTB of Target
Eastern Cape 19 349 16 512 117% 1 033 1 323 78.1%
Free State 26 288 20 160 130% 907 1291 70.3%
Gauteng 20 101 16 520 122% 1 123 1 323 84.9%
KwaZulu-Natal 20 376 16 704 122% 784 1337 58.6%
Limpopo 31 503 31 850 99% 1 121 1 274 88.0%
Mpumalanga 21 739 15 846 137% 1 193 1 269 94.0%
North West 19 589 18 650 105% 1 024 1 194 85.8%
Northern Cape 23 107 16 280 142% 1 372 1 303 105.3%
Western Cape 18 306 16 480 111% 1 487 1 320 112.7%
South Africa 200 358 169 002 119% 10 044 11 634 86.3%
Although the screening process in the North West province had to be repeated in the previous survey due to poor enrolments, in the current survey this province performed well and achieved an 85.8% response rate, despite a major mining strike in Marikana that disrupted services in certain parts of the province during the survey period. Additionally, one mining health facility which was included in the original sampling for the North West province, experienced difficulties due to lack of agreement between mine management and labourers, as well as other problems related to participation in the survey and after several attempts to include this site were unsuccessful, it was excluded from the survey. Another mine health facility included in the sampling for the Free State province completed enrolments for less than six months during the survey period, after problems requiring prolonged engagement had been resolved.
Among those with culture-confirmed TB included in the survey, the age grouping by province stratified by gender is shown in Figure 7 and Figure 8. The percentage of cases above 65 years of age was low across all provinces (1.1%-5.5%) in both genders while the percentage of individuals aged 44 years and below accounted for more than 70% of males in six of the nine provinces and all nine provinces among females. The proportion of patients in the 18-24 year group among females was also notably higher in all provinces compared to males. The proportion of female participants aged 18-24 years was above 10% in seven of the nine provinces while among males in the same age group this was true for only three of nine provinces.
100%
90%
80%
70%
60%
50%
40%
30%
20%
10%
0%EC WCNCNWMPLPKZNGPFS
55–64+65
45–54
18–24
25–34
35–44
Figure 7: Age distribution among males by province among confirmed TB cases in the survey
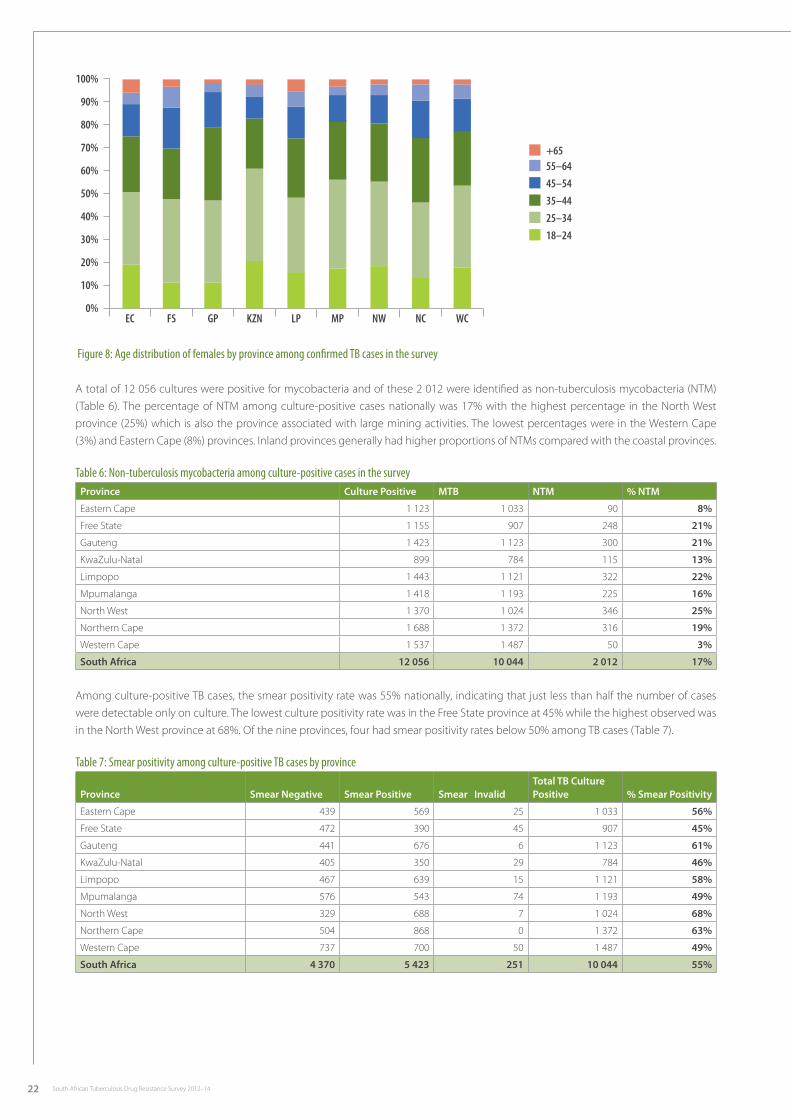
22 South African Tuberculosis Drug Resistance Survey 2012–14
100%
90%
80%
70%
60%
50%
40%
30%
20%
10%
0%EC WCNCNWMPLPKZNGPFS
55–64+65
45–54
18–24
25–34
35–44
Figure 8: Age distribution of females by province among confirmed TB cases in the survey
A total of 12 056 cultures were positive for mycobacteria and of these 2 012 were identified as non-tuberculosis mycobacteria (NTM) (Table 6). The percentage of NTM among culture-positive cases nationally was 17% with the highest percentage in the North West province (25%) which is also the province associated with large mining activities. The lowest percentages were in the Western Cape (3%) and Eastern Cape (8%) provinces. Inland provinces generally had higher proportions of NTMs compared with the coastal provinces.
Table 6: Non-tuberculosis mycobacteria among culture-positive cases in the surveyProvince Culture Positive MTB NTM % NTM
Eastern Cape 1 123 1 033 90 8%
Free State 1 155 907 248 21%
Gauteng 1 423 1 123 300 21%
KwaZulu-Natal 899 784 115 13%
Limpopo 1 443 1 121 322 22%
Mpumalanga 1 418 1 193 225 16%
North West 1 370 1 024 346 25%
Northern Cape 1 688 1 372 316 19%
Western Cape 1 537 1 487 50 3%
South Africa 12 056 10 044 2 012 17%
Among culture-positive TB cases, the smear positivity rate was 55% nationally, indicating that just less than half the number of cases were detectable only on culture. The lowest culture positivity rate was in the Free State province at 45% while the highest observed was in the North West province at 68%. Of the nine provinces, four had smear positivity rates below 50% among TB cases (Table 7).
Table 7: Smear positivity among culture-positive TB cases by province
Province Smear Negative Smear Positive Smear InvalidTotal TB Culture Positive % Smear Positivity
Eastern Cape 439 569 25 1 033 56%
Free State 472 390 45 907 45%
Gauteng 441 676 6 1 123 61%
KwaZulu-Natal 405 350 29 784 46%
Limpopo 467 639 15 1 121 58%
Mpumalanga 576 543 74 1 193 49%
North West 329 688 7 1 024 68%
Northern Cape 504 868 0 1 372 63%
Western Cape 737 700 50 1 487 49%
South Africa 4 370 5 423 251 10 044 55%
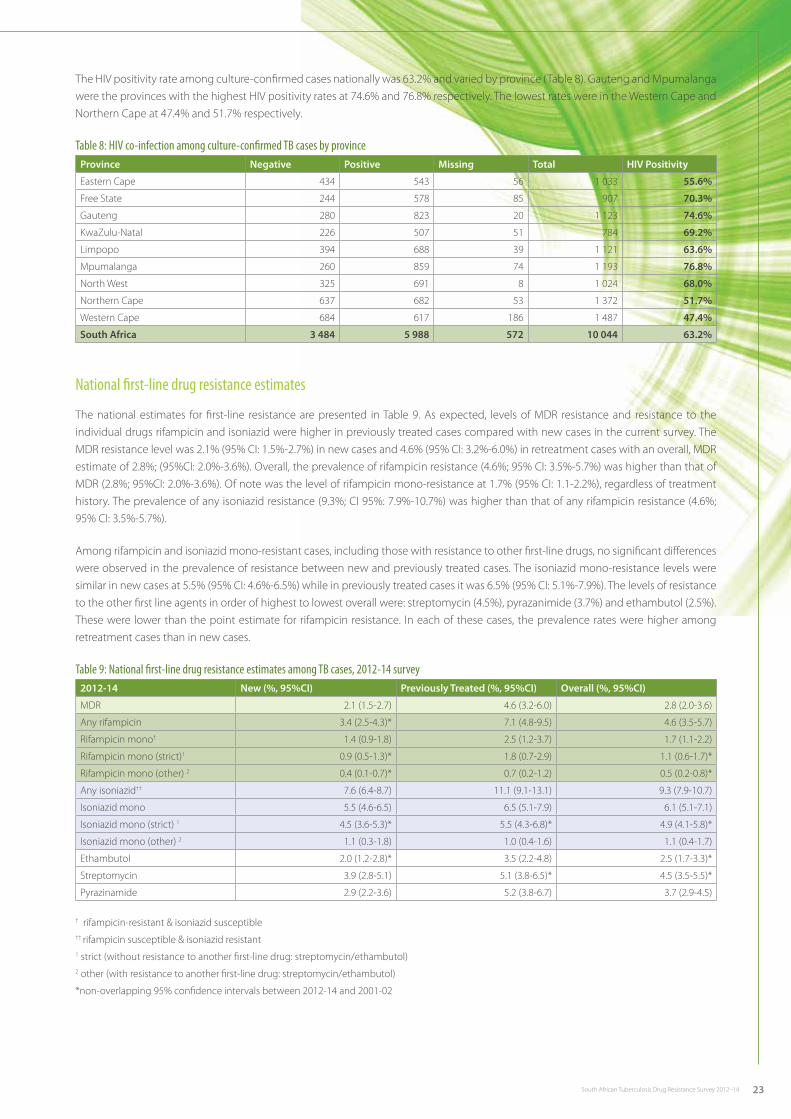
23South African Tuberculosis Drug Resistance Survey 2012–14
The HIV positivity rate among culture-confirmed cases nationally was 63.2% and varied by province (Table 8). Gauteng and Mpumalanga were the provinces with the highest HIV positivity rates at 74.6% and 76.8% respectively. The lowest rates were in the Western Cape and Northern Cape at 47.4% and 51.7% respectively.
Table 8: HIV co-infection among culture-confirmed TB cases by provinceProvince Negative Positive Missing Total HIV Positivity
Eastern Cape 434 543 56 1 033 55.6%
Free State 244 578 85 907 70.3%
Gauteng 280 823 20 1 123 74.6%
KwaZulu-Natal 226 507 51 784 69.2%
Limpopo 394 688 39 1 121 63.6%
Mpumalanga 260 859 74 1 193 76.8%
North West 325 691 8 1 024 68.0%
Northern Cape 637 682 53 1 372 51.7%
Western Cape 684 617 186 1 487 47.4%
South Africa 3 484 5 988 572 10 044 63.2%
National first-line drug resistance estimates
The national estimates for first-line resistance are presented in Table 9. As expected, levels of MDR resistance and resistance to the individual drugs rifampicin and isoniazid were higher in previously treated cases compared with new cases in the current survey. The MDR resistance level was 2.1% (95% CI: 1.5%-2.7%) in new cases and 4.6% (95% CI: 3.2%-6.0%) in retreatment cases with an overall, MDR estimate of 2.8%; (95%CI: 2.0%-3.6%). Overall, the prevalence of rifampicin resistance (4.6%; 95% CI: 3.5%-5.7%) was higher than that of MDR (2.8%; 95%CI: 2.0%-3.6%). Of note was the level of rifampicin mono-resistance at 1.7% (95% CI: 1.1-2.2%), regardless of treatment history. The prevalence of any isoniazid resistance (9.3%; CI 95%: 7.9%-10.7%) was higher than that of any rifampicin resistance (4.6%; 95% CI: 3.5%-5.7%).
Among rifampicin and isoniazid mono-resistant cases, including those with resistance to other first-line drugs, no significant differences were observed in the prevalence of resistance between new and previously treated cases. The isoniazid mono-resistance levels were similar in new cases at 5.5% (95% CI: 4.6%-6.5%) while in previously treated cases it was 6.5% (95% CI: 5.1%-7.9%). The levels of resistance to the other first line agents in order of highest to lowest overall were: streptomycin (4.5%), pyrazanimide (3.7%) and ethambutol (2.5%). These were lower than the point estimate for rifampicin resistance. In each of these cases, the prevalence rates were higher among retreatment cases than in new cases.
Table 9: National first-line drug resistance estimates among TB cases, 2012-14 survey2012-14 New (%, 95%CI) Previously Treated (%, 95%CI) Overall (%, 95%CI)
MDR 2.1 (1.5-2.7) 4.6 (3.2-6.0) 2.8 (2.0-3.6)
Any rifampicin 3.4 (2.5-4.3)* 7.1 (4.8-9.5) 4.6 (3.5-5.7)
Rifampicin mono† 1.4 (0.9-1.8) 2.5 (1.2-3.7) 1.7 (1.1-2.2)
Rifampicin mono (strict)1 0.9 (0.5-1.3)* 1.8 (0.7-2.9) 1.1 (0.6-1.7)*
Rifampicin mono (other) 2 0.4 (0.1-0.7)* 0.7 (0.2-1.2) 0.5 (0.2-0.8)*
Any isoniazid†† 7.6 (6.4-8.7) 11.1 (9.1-13.1) 9.3 (7.9-10.7)
Isoniazid mono 5.5 (4.6-6.5) 6.5 (5.1-7.9) 6.1 (5.1-7.1)
Isoniazid mono (strict) 1 4.5 (3.6-5.3)* 5.5 (4.3-6.8)* 4.9 (4.1-5.8)*
Isoniazid mono (other) 2 1.1 (0.3-1.8) 1.0 (0.4-1.6) 1.1 (0.4-1.7)
Ethambutol 2.0 (1.2-2.8)* 3.5 (2.2-4.8) 2.5 (1.7-3.3)*
Streptomycin 3.9 (2.8-5.1) 5.1 (3.8-6.5)* 4.5 (3.5-5.5)*
Pyrazinamide 2.9 (2.2-3.6) 5.2 (3.8-6.7) 3.7 (2.9-4.5)
† rifampicin-resistant & isoniazid susceptible †† rifampicin susceptible & isoniazid resistant1 strict (without resistance to another first-line drug: streptomycin/ethambutol)2 other (with resistance to another first-line drug: streptomycin/ethambutol)
*non-overlapping 95% confidence intervals between 2012-14 and 2001-02
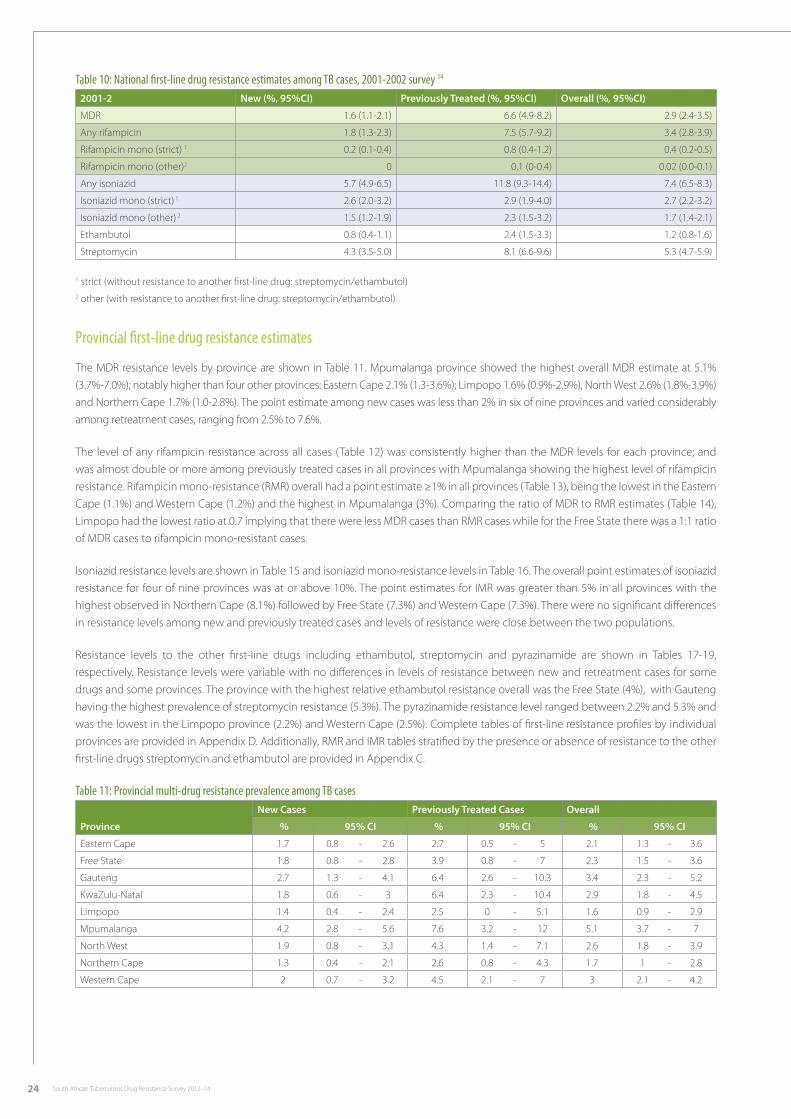
24 South African Tuberculosis Drug Resistance Survey 2012–14
Table 10: National first-line drug resistance estimates among TB cases, 2001-2002 survey 14
2001-2 New (%, 95%CI) Previously Treated (%, 95%CI) Overall (%, 95%CI)
MDR 1.6 (1.1-2.1) 6.6 (4.9-8.2) 2.9 (2.4-3.5)
Any rifampicin 1.8 (1.3-2.3) 7.5 (5.7-9.2) 3.4 (2.8-3.9)
Rifampicin mono (strict) 1 0.2 (0.1-0.4) 0.8 (0.4-1.2) 0.4 (0.2-0.5)
Rifampicin mono (other)2 0 0.1 (0-0.4) 0.02 (0.0-0.1)
Any isoniazid 5.7 (4.9-6.5) 11.8 (9.3-14.4) 7.4 (6.5-8.3)
Isoniazid mono (strict) 1 2.6 (2.0-3.2) 2.9 (1.9-4.0) 2.7 (2.2-3.2)
Isoniazid mono (other) 2 1.5 (1.2-1.9) 2.3 (1.5-3.2) 1.7 (1.4-2.1)
Ethambutol 0.8 (0.4-1.1) 2.4 (1.5-3.3) 1.2 (0.8-1.6)
Streptomycin 4.3 (3.5-5.0) 8.1 (6.6-9.6) 5.3 (4.7-5.9)
1 strict (without resistance to another first-line drug: streptomycin/ethambutol)2 other (with resistance to another first-line drug: streptomycin/ethambutol)
Provincial first-line drug resistance estimates
The MDR resistance levels by province are shown in Table 11. Mpumalanga province showed the highest overall MDR estimate at 5.1% (3.7%-7.0%); notably higher than four other provinces: Eastern Cape 2.1% (1.3-3.6%); Limpopo 1.6% (0.9%-2.9%), North West 2.6% (1.8%-3.9%) and Northern Cape 1.7% (1.0-2.8%). The point estimate among new cases was less than 2% in six of nine provinces and varied considerably among retreatment cases, ranging from 2.5% to 7.6%.
The level of any rifampicin resistance across all cases (Table 12) was consistently higher than the MDR levels for each province; and was almost double or more among previously treated cases in all provinces with Mpumalanga showing the highest level of rifampicin resistance. Rifampicin mono-resistance (RMR) overall had a point estimate ≥1% in all provinces (Table 13), being the lowest in the Eastern Cape (1.1%) and Western Cape (1.2%) and the highest in Mpumalanga (3%). Comparing the ratio of MDR to RMR estimates (Table 14), Limpopo had the lowest ratio at 0.7 implying that there were less MDR cases than RMR cases while for the Free State there was a 1:1 ratio of MDR cases to rifampicin mono-resistant cases.
Isoniazid resistance levels are shown in Table 15 and isoniazid mono-resistance levels in Table 16. The overall point estimates of isoniazid resistance for four of nine provinces was at or above 10%. The point estimates for IMR was greater than 5% in all provinces with the highest observed in Northern Cape (8.1%) followed by Free State (7.3%) and Western Cape (7.3%). There were no significant differences in resistance levels among new and previously treated cases and levels of resistance were close between the two populations.
Resistance levels to the other first-line drugs including ethambutol, streptomycin and pyrazinamide are shown in Tables 17-19, respectively. Resistance levels were variable with no differences in levels of resistance between new and retreatment cases for some drugs and some provinces. The province with the highest relative ethambutol resistance overall was the Free State (4%), with Gauteng having the highest prevalence of streptomycin resistance (5.3%). The pyrazinamide resistance level ranged between 2.2% and 5.3% and was the lowest in the Limpopo province (2.2%) and Western Cape (2.5%). Complete tables of first-line resistance profiles by individual provinces are provided in Appendix D. Additionally, RMR and IMR tables stratified by the presence or absence of resistance to the other first-line drugs streptomycin and ethambutol are provided in Appendix C.
Table 11: Provincial multi-drug resistance prevalence among TB cases
Province
New Cases Previously Treated Cases Overall
% 95% CI % 95% CI % 95% CI
Eastern Cape 1.7 0.8 - 2.6 2.7 0.5 - 5 2.1 1.3 - 3.6
Free State 1.8 0.8 - 2.8 3.9 0.8 - 7 2.3 1.5 - 3.6
Gauteng 2.7 1.3 - 4.1 6.4 2.6 - 10.3 3.4 2.3 - 5.2
KwaZulu-Natal 1.8 0.6 - 3 6.4 2.3 - 10.4 2.9 1.8 - 4.5
Limpopo 1.4 0.4 - 2.4 2.5 0 - 5.1 1.6 0.9 - 2.9
Mpumalanga 4.2 2.8 - 5.6 7.6 3.2 - 12 5.1 3.7 - 7
North West 1.9 0.8 - 3.1 4.3 1.4 - 7.1 2.6 1.8 - 3.9
Northern Cape 1.3 0.4 - 2.1 2.6 0.8 - 4.3 1.7 1 - 2.8
Western Cape 2 0.7 - 3.2 4.5 2.1 - 7 3 2.1 - 4.2
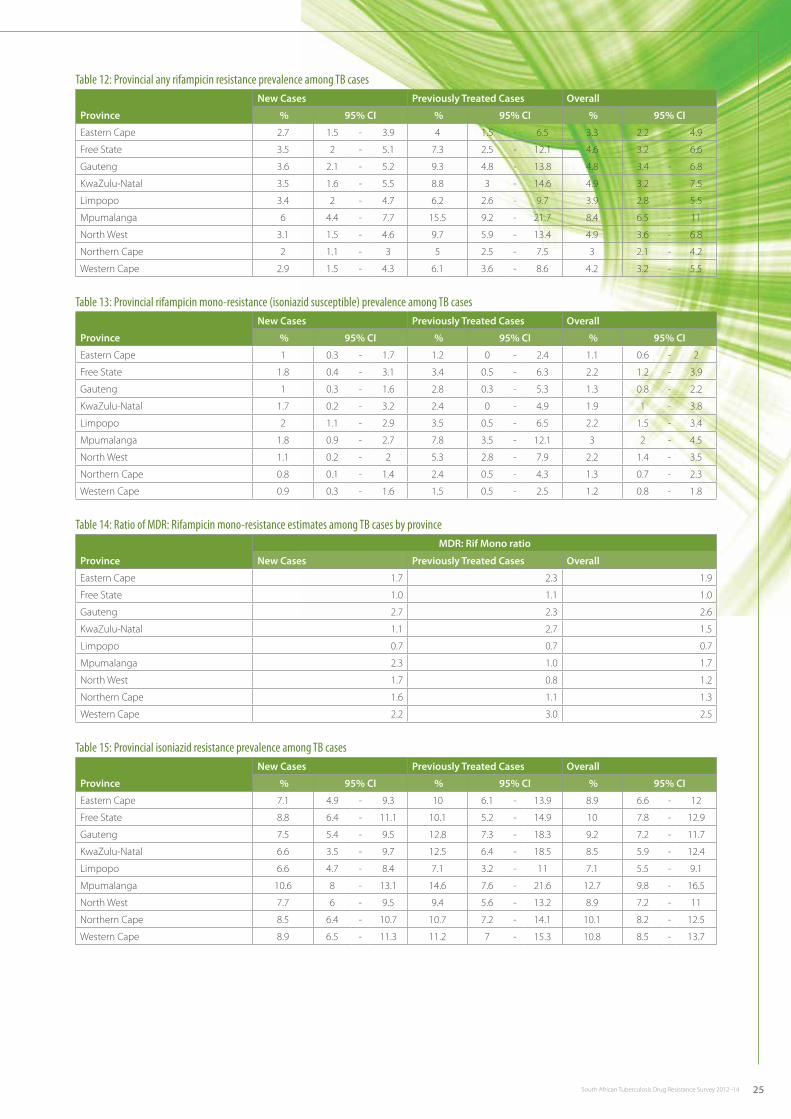
25South African Tuberculosis Drug Resistance Survey 2012–14
Table 12: Provincial any rifampicin resistance prevalence among TB cases
Province
New Cases Previously Treated Cases Overall
% 95% CI % 95% CI % 95% CI
Eastern Cape 2.7 1.5 - 3.9 4 1.5 - 6.5 3.3 2.2 - 4.9
Free State 3.5 2 - 5.1 7.3 2.5 - 12.1 4.6 3.2 - 6.6
Gauteng 3.6 2.1 - 5.2 9.3 4.8 - 13.8 4.8 3.4 - 6.8
KwaZulu-Natal 3.5 1.6 - 5.5 8.8 3 - 14.6 4.9 3.2 - 7.5
Limpopo 3.4 2 - 4.7 6.2 2.6 - 9.7 3.9 2.8 - 5.5
Mpumalanga 6 4.4 - 7.7 15.5 9.2 - 21.7 8.4 6.5 - 11
North West 3.1 1.5 - 4.6 9.7 5.9 - 13.4 4.9 3.6 - 6.8
Northern Cape 2 1.1 - 3 5 2.5 - 7.5 3 2.1 - 4.2
Western Cape 2.9 1.5 - 4.3 6.1 3.6 - 8.6 4.2 3.2 - 5.5
Table 13: Provincial rifampicin mono-resistance (isoniazid susceptible) prevalence among TB cases
Province
New Cases Previously Treated Cases Overall
% 95% CI % 95% CI % 95% CI
Eastern Cape 1 0.3 - 1.7 1.2 0 - 2.4 1.1 0.6 - 2
Free State 1.8 0.4 - 3.1 3.4 0.5 - 6.3 2.2 1.2 - 3.9
Gauteng 1 0.3 - 1.6 2.8 0.3 - 5.3 1.3 0.8 - 2.2
KwaZulu-Natal 1.7 0.2 - 3.2 2.4 0 - 4.9 1.9 1 - 3.8
Limpopo 2 1.1 - 2.9 3.5 0.5 - 6.5 2.2 1.5 - 3.4
Mpumalanga 1.8 0.9 - 2.7 7.8 3.5 - 12.1 3 2 - 4.5
North West 1.1 0.2 - 2 5.3 2.8 - 7.9 2.2 1.4 - 3.5
Northern Cape 0.8 0.1 - 1.4 2.4 0.5 - 4.3 1.3 0.7 - 2.3
Western Cape 0.9 0.3 - 1.6 1.5 0.5 - 2.5 1.2 0.8 - 1.8
Table 14: Ratio of MDR: Rifampicin mono-resistance estimates among TB cases by province
Province
MDR: Rif Mono ratio
New Cases Previously Treated Cases Overall
Eastern Cape 1.7 2.3 1.9
Free State 1.0 1.1 1.0
Gauteng 2.7 2.3 2.6
KwaZulu-Natal 1.1 2.7 1.5
Limpopo 0.7 0.7 0.7
Mpumalanga 2.3 1.0 1.7
North West 1.7 0.8 1.2
Northern Cape 1.6 1.1 1.3
Western Cape 2.2 3.0 2.5
Table 15: Provincial isoniazid resistance prevalence among TB cases
Province
New Cases Previously Treated Cases Overall
% 95% CI % 95% CI % 95% CI
Eastern Cape 7.1 4.9 - 9.3 10 6.1 - 13.9 8.9 6.6 - 12
Free State 8.8 6.4 - 11.1 10.1 5.2 - 14.9 10 7.8 - 12.9
Gauteng 7.5 5.4 - 9.5 12.8 7.3 - 18.3 9.2 7.2 - 11.7
KwaZulu-Natal 6.6 3.5 - 9.7 12.5 6.4 - 18.5 8.5 5.9 - 12.4
Limpopo 6.6 4.7 - 8.4 7.1 3.2 - 11 7.1 5.5 - 9.1
Mpumalanga 10.6 8 - 13.1 14.6 7.6 - 21.6 12.7 9.8 - 16.5
North West 7.7 6 - 9.5 9.4 5.6 - 13.2 8.9 7.2 - 11
Northern Cape 8.5 6.4 - 10.7 10.7 7.2 - 14.1 10.1 8.2 - 12.5
Western Cape 8.9 6.5 - 11.3 11.2 7 - 15.3 10.8 8.5 - 13.7
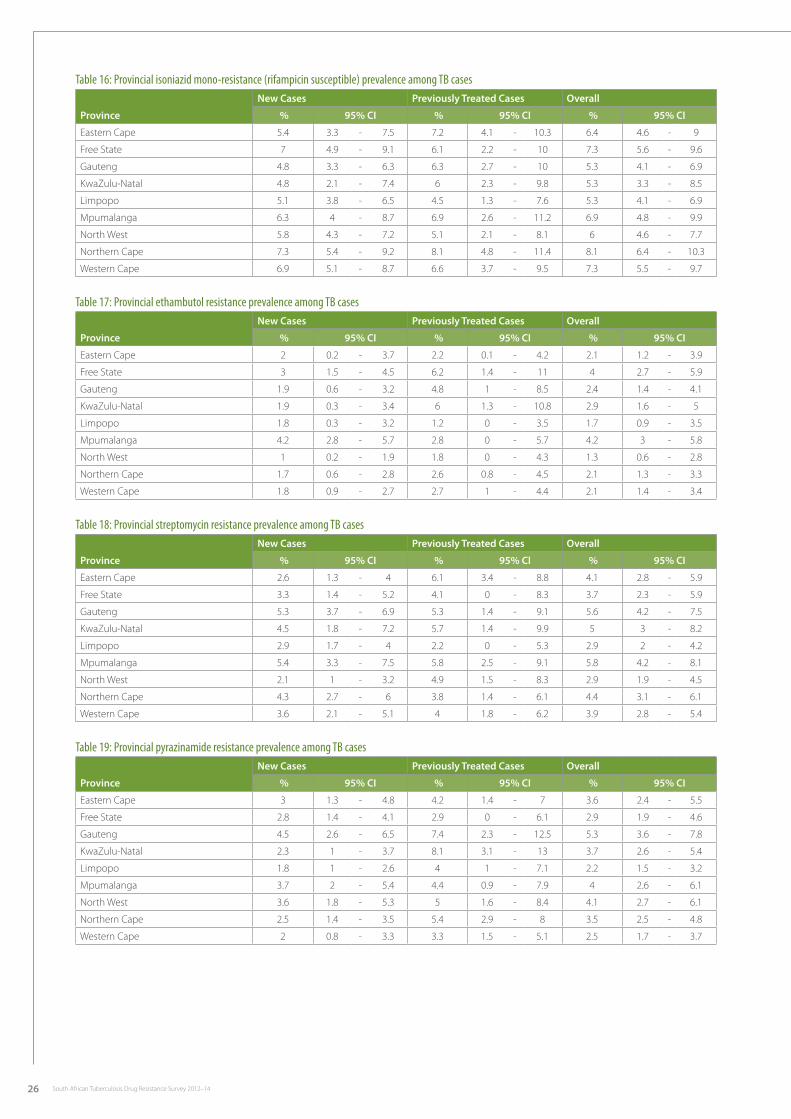
26 South African Tuberculosis Drug Resistance Survey 2012–14
Table 16: Provincial isoniazid mono-resistance (rifampicin susceptible) prevalence among TB cases
Province
New Cases Previously Treated Cases Overall
% 95% CI % 95% CI % 95% CI
Eastern Cape 5.4 3.3 - 7.5 7.2 4.1 - 10.3 6.4 4.6 - 9
Free State 7 4.9 - 9.1 6.1 2.2 - 10 7.3 5.6 - 9.6
Gauteng 4.8 3.3 - 6.3 6.3 2.7 - 10 5.3 4.1 - 6.9
KwaZulu-Natal 4.8 2.1 - 7.4 6 2.3 - 9.8 5.3 3.3 - 8.5
Limpopo 5.1 3.8 - 6.5 4.5 1.3 - 7.6 5.3 4.1 - 6.9
Mpumalanga 6.3 4 - 8.7 6.9 2.6 - 11.2 6.9 4.8 - 9.9
North West 5.8 4.3 - 7.2 5.1 2.1 - 8.1 6 4.6 - 7.7
Northern Cape 7.3 5.4 - 9.2 8.1 4.8 - 11.4 8.1 6.4 - 10.3
Western Cape 6.9 5.1 - 8.7 6.6 3.7 - 9.5 7.3 5.5 - 9.7
Table 17: Provincial ethambutol resistance prevalence among TB cases
Province
New Cases Previously Treated Cases Overall
% 95% CI % 95% CI % 95% CI
Eastern Cape 2 0.2 - 3.7 2.2 0.1 - 4.2 2.1 1.2 - 3.9
Free State 3 1.5 - 4.5 6.2 1.4 - 11 4 2.7 - 5.9
Gauteng 1.9 0.6 - 3.2 4.8 1 - 8.5 2.4 1.4 - 4.1
KwaZulu-Natal 1.9 0.3 - 3.4 6 1.3 - 10.8 2.9 1.6 - 5
Limpopo 1.8 0.3 - 3.2 1.2 0 - 3.5 1.7 0.9 - 3.5
Mpumalanga 4.2 2.8 - 5.7 2.8 0 - 5.7 4.2 3 - 5.8
North West 1 0.2 - 1.9 1.8 0 - 4.3 1.3 0.6 - 2.8
Northern Cape 1.7 0.6 - 2.8 2.6 0.8 - 4.5 2.1 1.3 - 3.3
Western Cape 1.8 0.9 - 2.7 2.7 1 - 4.4 2.1 1.4 - 3.4
Table 18: Provincial streptomycin resistance prevalence among TB cases
Province
New Cases Previously Treated Cases Overall
% 95% CI % 95% CI % 95% CI
Eastern Cape 2.6 1.3 - 4 6.1 3.4 - 8.8 4.1 2.8 - 5.9
Free State 3.3 1.4 - 5.2 4.1 0 - 8.3 3.7 2.3 - 5.9
Gauteng 5.3 3.7 - 6.9 5.3 1.4 - 9.1 5.6 4.2 - 7.5
KwaZulu-Natal 4.5 1.8 - 7.2 5.7 1.4 - 9.9 5 3 - 8.2
Limpopo 2.9 1.7 - 4 2.2 0 - 5.3 2.9 2 - 4.2
Mpumalanga 5.4 3.3 - 7.5 5.8 2.5 - 9.1 5.8 4.2 - 8.1
North West 2.1 1 - 3.2 4.9 1.5 - 8.3 2.9 1.9 - 4.5
Northern Cape 4.3 2.7 - 6 3.8 1.4 - 6.1 4.4 3.1 - 6.1
Western Cape 3.6 2.1 - 5.1 4 1.8 - 6.2 3.9 2.8 - 5.4
Table 19: Provincial pyrazinamide resistance prevalence among TB cases
Province
New Cases Previously Treated Cases Overall
% 95% CI % 95% CI % 95% CI
Eastern Cape 3 1.3 - 4.8 4.2 1.4 - 7 3.6 2.4 - 5.5
Free State 2.8 1.4 - 4.1 2.9 0 - 6.1 2.9 1.9 - 4.6
Gauteng 4.5 2.6 - 6.5 7.4 2.3 - 12.5 5.3 3.6 - 7.8
KwaZulu-Natal 2.3 1 - 3.7 8.1 3.1 - 13 3.7 2.6 - 5.4
Limpopo 1.8 1 - 2.6 4 1 - 7.1 2.2 1.5 - 3.2
Mpumalanga 3.7 2 - 5.4 4.4 0.9 - 7.9 4 2.6 - 6.1
North West 3.6 1.8 - 5.3 5 1.6 - 8.4 4.1 2.7 - 6.1
Northern Cape 2.5 1.4 - 3.5 5.4 2.9 - 8 3.5 2.5 - 4.8
Western Cape 2 0.8 - 3.3 3.3 1.5 - 5.1 2.5 1.7 - 3.7
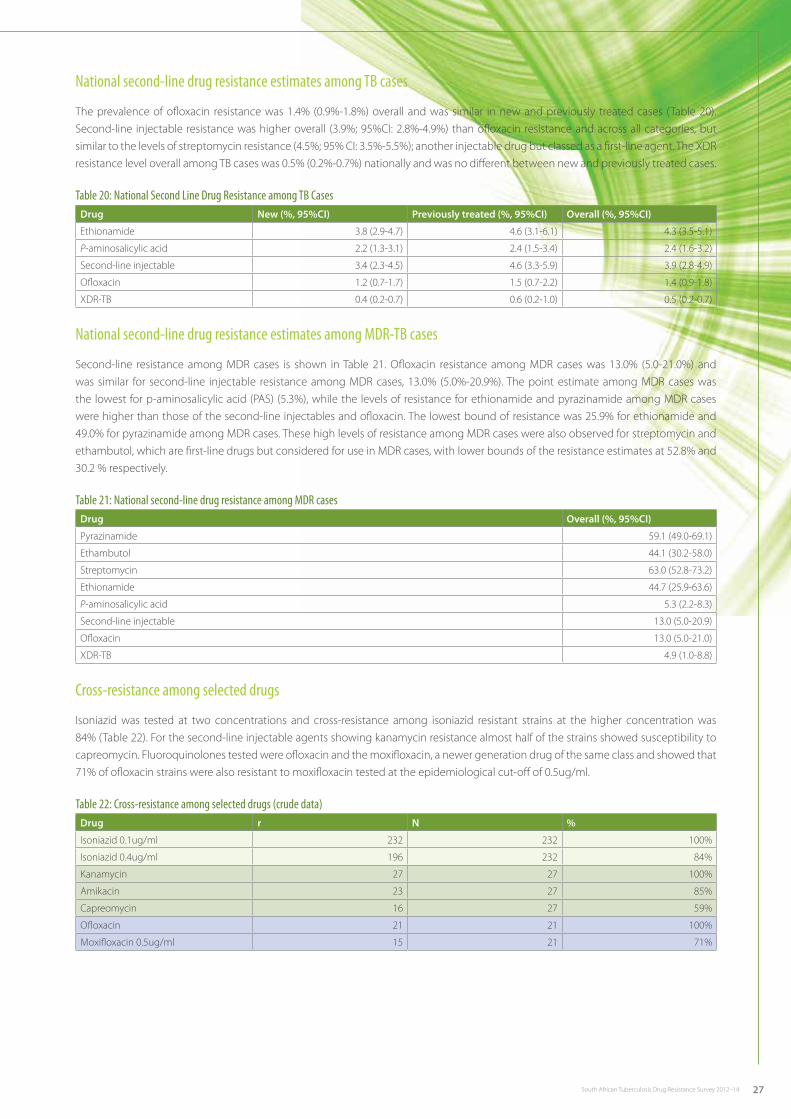
27South African Tuberculosis Drug Resistance Survey 2012–14
National second-line drug resistance estimates among TB cases
The prevalence of ofloxacin resistance was 1.4% (0.9%-1.8%) overall and was similar in new and previously treated cases (Table 20). Second-line injectable resistance was higher overall (3.9%; 95%CI: 2.8%-4.9%) than ofloxacin resistance and across all categories, but similar to the levels of streptomycin resistance (4.5%; 95% CI: 3.5%-5.5%); another injectable drug but classed as a first-line agent. The XDR resistance level overall among TB cases was 0.5% (0.2%-0.7%) nationally and was no different between new and previously treated cases.
Table 20: National Second Line Drug Resistance among TB CasesDrug New (%, 95%CI) Previously treated (%, 95%CI) Overall (%, 95%CI)
Ethionamide 3.8 (2.9-4.7) 4.6 (3.1-6.1) 4.3 (3.5-5.1)
P-aminosalicylic acid 2.2 (1.3-3.1) 2.4 (1.5-3.4) 2.4 (1.6-3.2)
Second-line injectable 3.4 (2.3-4.5) 4.6 (3.3-5.9) 3.9 (2.8-4.9)
Ofloxacin 1.2 (0.7-1.7) 1.5 (0.7-2.2) 1.4 (0.9-1.8)
XDR-TB 0.4 (0.2-0.7) 0.6 (0.2-1.0) 0.5 (0.2-0.7)
National second-line drug resistance estimates among MDR-TB cases
Second-line resistance among MDR cases is shown in Table 21. Ofloxacin resistance among MDR cases was 13.0% (5.0-21.0%) and was similar for second-line injectable resistance among MDR cases, 13.0% (5.0%-20.9%). The point estimate among MDR cases was the lowest for p-aminosalicylic acid (PAS) (5.3%), while the levels of resistance for ethionamide and pyrazinamide among MDR cases were higher than those of the second-line injectables and ofloxacin. The lowest bound of resistance was 25.9% for ethionamide and 49.0% for pyrazinamide among MDR cases. These high levels of resistance among MDR cases were also observed for streptomycin and ethambutol, which are first-line drugs but considered for use in MDR cases, with lower bounds of the resistance estimates at 52.8% and 30.2 % respectively.
Table 21: National second-line drug resistance among MDR casesDrug Overall (%, 95%CI)
Pyrazinamide 59.1 (49.0-69.1)
Ethambutol 44.1 (30.2-58.0)
Streptomycin 63.0 (52.8-73.2)
Ethionamide 44.7 (25.9-63.6)
P-aminosalicylic acid 5.3 (2.2-8.3)
Second-line injectable 13.0 (5.0-20.9)
Ofloxacin 13.0 (5.0-21.0)
XDR-TB 4.9 (1.0-8.8)
Cross-resistance among selected drugs
Isoniazid was tested at two concentrations and cross-resistance among isoniazid resistant strains at the higher concentration was 84% (Table 22). For the second-line injectable agents showing kanamycin resistance almost half of the strains showed susceptibility to capreomycin. Fluoroquinolones tested were ofloxacin and the moxifloxacin, a newer generation drug of the same class and showed that 71% of ofloxacin strains were also resistant to moxifloxacin tested at the epidemiological cut-off of 0.5ug/ml.
Table 22: Cross-resistance among selected drugs (crude data) Drug r N %
Isoniazid 0.1ug/ml 232 232 100%
Isoniazid 0.4ug/ml 196 232 84%
Kanamycin 27 27 100%
Amikacin 23 27 85%
Capreomycin 16 27 59%
Ofloxacin 21 21 100%
Moxifloxacin 0.5ug/ml 15 21 71%
28 South African Tuberculosis Drug Resistance Survey 2012–14
DiscussionThe South African TB Drug Resistance Survey, as part of an extended global endeavour of the WHO and the International Union against Tuberculosis and Lung Disease (IUATLD), was the largest of its kind conducted to date anywhere in the world, with over 100 000 persons suspected of suffering from TB tested. All nine provinces were represented in the survey and for the first time laboratory-based information on drug resistance survey data has become available for the Northern Cape province, which was excluded from the last survey. An important consideration of the current survey was to ensure that smear-negative TB cases which occur commonly in South Africa were included in the survey. Almost half of all TB cases in the survey were smear-negative and this finding correlates well with estimates of smear positivity in high HIV-prevalence settings. The TB-HIV co-infection rate was 63.2% nationally and is similar to the 61% reported in the WHO Global Report 2015, confirming the important role of HIV infection in the TB epidemic.
In the previous study the culture positivity rate in survey participants was almost 23.9% while in the current survey it was 9.9%. A concern in the previous survey was the high culture positivity rate that may have been associated with late presentation of presumed TB cases whereas in the current survey positivity rate was close to the 10% recommended by the WHO. This is a positive finding suggesting that the efforts aimed at community awareness have yielded results and more persons are presenting earlier than before for TB investigations.
The number of presumptive cases screened into the survey was higher than targeted and this was a result of the two month extension provided to all provinces to overcome losses encountered during the survey and to ensure that sufficient numbers of culture-positive MTB cases were detected to achieve the required power for the survey. The power calculation was based on the lowest point estimate of MDR-TB cases amongst provinces included in the previous survey of 0.9%; however, in the current survey the lowest provincial point estimate was 1.4%, resulting in robust estimates being made even for the seven provinces that did not achieve the expected number of culture-positive MTB cases. Both first-line and second-line drug resistance estimates were determined for this survey. Determination of resistance to the second-line drugs has become increasingly relevant as new drugs are being introduced and new regimens formulated.
MDR-TB prevalence
The national prevalence of MDR-TB has remained relatively unchanged over a period of more than ten years between the two surveys: The overall MDR-TB rate was 2.9% (95% CI: 2.4%-3.5%) in 2001-2 (Table 10) and was determined at 2.8% (95% CI: 2.0%-3.6%) in the current survey (Table 9). Among new cases the MDR-TB prevalence is 2.1% (95% CI: 1.5%-2.7%) comparable with the global WHO estimate1 of 3.3% (95% CI: 2.2%-4.4%). The prevalence of MDR-TB in previously treated cases, at 4.6% (95% CI: 3.2%-6.0%) was however lower than the global average of 20% (95% CI: 14%-27%). This may be due to the high mortality rate in the local setting among this sub-group or possibly the impact of the introduction of diagnostics for the early detection of drug-resistant TB (e.g. LPA and GXP) that may have resulted in cases within this higher risk group being effectively treated and cured.
Provincial MDR-TB prevalence rates have varied with the highest observed in Mpumalanga province with an overall rate of 5.1% (95% CI: 3.7%-7.0%) which was higher than the national rate (2.8%; 95% CI: 2.0%-3.6%). In the previous survey, Mpumalanga also showed the highest MDR-TB rate. There were no significant differences observed in MDR-TB rates between the other provinces in the current survey and point estimates ranged from 1.8% (Limpopo and Northern Cape) to 3.2% (Gauteng). Compared with the provincial MDR-TB prevalence in the previous survey, there were no major differences among new cases; however among retreatment cases greater variability was noted in the estimates for the previous survey (Table 23).
Concerns about the high MDR-TB rates in Mpumalanga were noted in the previous survey and again feature prominently in the present survey. Several potential contributory factors are at play, one of which is cross-border migration: Swaziland, an immediate neighbour has the highest MDR-TB rate in the region with estimates from 200931 of 7.7% (95% CI: 4.9%-10.5%) among new cases which, although higher, was not significantly different from those of Mpumalanga (4.2%; 95% CI: 2.8%-5.6%). Sub-analysis (data not presented) has shown higher MDR-TB rates in facilities selected in the DRS that were closer to the Swaziland border than those elsewhere in Mpumalanga. Thus regional efforts and co-ordination are required and are essential in dealing with this emerging problem.
Gold mining in the province has also expanded in the recent past, adding to the risk of TB transmission and will need to be closely monitored. Mpumalanga is also one of the provinces in South Africa where HIV prevalence has been above the national average and the Gert Sibande district in particular has one of the highest rates nationally32. Compounded to the existent problems are the high levels of poverty and general deficiencies in health system activities. A comprehensive multi-sectorial intervention aimed at dealing with the issues is required.
29South African Tuberculosis Drug Resistance Survey 2012–14
Rifampicin and isoniazid resistance
For any rifampicin and any isoniazid resistance, regardless of other drug susceptibility findings, increases in point estimates were observed between the previous and current surveys but these were not significant. Significant increases were, however, observed specifically in new cases when the previous and current surveys are compared with any rifampicin resistance almost doubling from 1.8% (95% CI: 1.3%-2.3%) to 3.4% (95% CI: 2.5%-4.3%; see Table 24). When assessed provincially, the same pattern holds with increases in the point estimate seen across all provinces among new rather than previously treated cases, although significance was not shown at this level. Increases among new cases are indicative of primary resistance driven by transmission and this is concerning as South Africa has one of the highest rates of people living with HIV in the world and thus also has high numbers of persons at an increased risk for TB infection.
The introduction of Xpert MTB/RIF as a primary diagnostic tool targeting all presumptive TB cases in South Africa33, has the added advantage of not only detecting TB but also rifampicin resistance. Widespread adoption could lead to early diagnosis of primary drug-resistant cases which would be missed if only retreatment cases were tested. Ensuring that these technologies are effectively used and acted upon is thus an important target for improving TB control efforts. Although the methodology used for susceptibility testing was the WHO-approved MGIT system, recent data has emerged indicating that MGIT testing may record false susceptible findings in strains harbouring specific rpoB mutations34; thus the estimates for rifampicin resistance may be underestimated in the survey but would be detected routinely with the currently used molecular diagnostic methods.
Rifampicin mono-resistance
The prevalence of RMR-TB has shown significant increases from the previous survey, notably among new cases and raises similar issues regarding transmission. Although the point estimate overall is above 1% nationally, this phenomenon was noted in the previous survey and has continued to increase. A study from KZN35 has also noted a higher rate of RMR-TB to what is generally encountered and younger patients (25-29y) were at increased risk. This correlates with the notable increase in new cases we have observed as patients 25-29 years of age are less likely to have had a second episode by this stage of life.
It is unusual for resistance to a single drug to emerge when treatment for TB comprises standardised combination therapy. A study from France36 showed that patients who were either HIV- infected or abused alcohol were at an increased risk for RMR. Adequate dosage levels are critical and concerns have been raised about the current dosing used for rifampicin being too low37. This is further compounded in patients who use alcohol or who are on ART during TB therapy, as these could also affect the bioavailability of the drug. A survey from another African setting in Burundi has also recorded the RMR phenomenon38 and noted that irregular drug intake could also lead to inadequate therapeutic levels. A study including patients from South Africa has shown the use of a higher dose for rifampicin improved culture conversion without a significant increase in adverse events39. Furthermore, a smaller study from Japan40 has highlighted the clonality of strains with RMR in their treatment environment. Such a situation is plausible in our setting since the biggest increase in RMR-TB, has been noted in new cases nationally, suggesting transmission. Although such strains may have originated through the selection of rifampicin resistance during treatment in higher risk patients, transmission will further increase its occurrence.
The increase in RMR-TB is a concern; however, it does leave an effective oral first-line drug isoniazid, available for treatment. Furthermore, the predictive value of rifampicin as a marker of MDR-TB is diminished with wide variability amongst provinces. For the Western Cape the ratio of MDR to RMR cases was 2.5, suggesting that for every RMR case there were 2-3 times as many MDR cases, while for several provinces the ratio was equal or close to one, suggesting equal distribution of the two rifampicin resistance profiles. However, Limpopo province was unusual in having a ratio below one, indicating a higher number of rifampicin mono-resistant than MDR cases. The loss of rifampicin, a potent sterilising drug, is significant, requiring prolonged courses of treatment for cure; however the inclusion of isoniazid is warranted in all rifampicin-resistant cases pending the result of drug susceptibility testing for isoniazid.
Isoniazid mono-resistance
Significant increases have also been noted for isoniazid mono-resistance (IMR) without any other first-line drug resistance, shifting from 2.7% (95% CI: 2.2%-3.2%) in the previous survey to 4.9% (95% CI: 4.1%-5.8%) in the current survey, irrespective of previous treatment history. There was no significant difference by treatment history in the current and previous surveys, suggesting that prior TB combination therapy is not likely to be a contributory factor. The point estimate of IMR, irrespective of resistance to other first-line drugs, was above 5% in all provinces. Comparing the IMR prevalence between the two surveys by province (Table 25), increases in the point estimate can be observed across all provinces, indicating that the increase observed nationally is not being driven by any particular province.
The occurrence of IMR has been observed across many settings in the world and has been recorded by Menzies and colleagues in a meta-analysis to account for almost half of all TB drug resistance41. A study from Iran42 has observed significant increases of IMR prevalence over time, from 4.4% in 2003 to 9.4% in 2011 while a study from the USA43 has shown that the prevalence IMR has remained
30 South African Tuberculosis Drug Resistance Survey 2012–14
unchanged despite declines observed for RMR and MDR in their setting. Among countries neighbouring South Africa whose data were reported in peer-reviewed publications, IMR levels in new cases, irrespective of additional resistance to streptomycin and ethambutol have been 5.1% in Swaziland44, 4.2% in Mozambique45 and 5.1% in Botswana46.
Risk factors for IMR include prior TB therapy and IPT reported by Catamanchi et al.47, while in another study, younger age groups were identified as being at increased risk48. A study by Hazbon and colleagues49 has analysed the genetic basis of isoniazid resistance, comparing IMR with MDR and noted a significant difference with much higher frequency of inhA mutations in IMR; a mutation conferring low-level isoniazid resistance. Thus prior exposure to isoniazid treatment, especially with inconsistent use, could be a contributory factor to the emergence of IMR.
The outcomes from a study in the USA, comparing treatment of IMR patients with that of matched fully susceptible cases were not different, although for the former group of patients, approximately half had received more than six months of therapy. A meta-analysis has highlighted the considerable lack of evidence on therapeutic regimens for IMR cases while failure rates ranged between 18% and 44%. Improved outcomes were associated with longer duration of rifampicin therapy, daily therapy and treatment with a greater number of effective drugs. Furthermore, the authors noted that none of the studies included HIV co-infected individuals. Another study50 has shown higher cure rates when a fluoroquinolone was included in the regimen used for treatment of IMR cases.
An association between IPT and IMR or other drug resistance has not been shown based on a WHO-initiated review of published data51. However, a model-based study on community-administered IPT52, has suggested that this is likely to occur at a population level and could be missed when analysing studies involving small numbers of patients. A presentation at a local HIV conference has summarised data from studies in South Africa asking the question “Is IPT a priority for SA?” and highlights the lack of evidence for IPT benefit and emphasised the increased risk for resistance based on local data53. Although the increased use of isoniazid mono-therapy in IPT is specifically indicated for person/people living with HIV (PLHIV) without active TB. Identification of the latter however, is not always conclusive, especially in HIV patients for whom screening based on absence of symptoms suggestive of TB is applied. Further studies to investigate the relationship between IPT and IMR at a population level are warranted.
The occurrence of IMR could also potentially have implications for the effectiveness of isoniazid preventive therapy as latent organisms are likely to share the same resistance profile as active TB, being its progenitor. A study using whole genome sequencing54 has demonstrated the ability of organisms of latent TB infection (LTBI) to ‘develop’ resistance mutations at the same rate as the organisms of active TB and that LTBI is also affected by environmental pressure. Although this is a new concept, and requires further investigation, it may change our understanding and management of LTBI in the future.
The increase in IMR observed in the current survey compounds the risk of MDR-TB over time, as undetected cases would be effectively receiving rifampicin mono-therapy in the continuation phase of standard therapy, leading to the development of further drug resistance. A study from China has demonstrated the effect of IMR in driving increase in MDR over time in rural communities55. Although MDR-TB rates have remained relatively stable, this could change if IMR is not effectively managed. The use of Xpert MTB/RIF as the first-line diagnostic test has been invaluable in detecting rifampicin-resistant (RR) and MDR but does not test for isoniazid resistance and raises the need to consider additional testing for IMR or alternatively, strengthening the current empiric regimen. This would require further studies to advise on the most appropriate approach.
Other first-line resistance
One of the primary goals of multidrug regimens is to reduce the emergence of drug resistance and this requires treatment with a combination of drugs to which current strains of MTB have been shown to be susceptible at a population level. The current survey has shown an increase in individual first-line drug resistance, relative to the previous survey, for not only isoniazid and rifampicin, but also ethambutol with overall rates in the current survey of 9.3%, 4.9% and 2.5%, respectively. The present rate of pyrazinamide resistance which was not assessed in the previous survey is estimated at 3.7%. However, pyrazinamide phenotypic resistance testing is known to overestimate resistance56 and the true rate is likely to be lower. Thus three of the four drugs used for intensive phase treatment have rates of resistance below 5% and use of the four-drug regimen is likely to continue to be effective. Rational treatment strategies could be enhanced by using Xpert MTB/RIF as a primary test and treating only rifampicin-susceptible cases with the current regimen, since a fair proportion of other first-line drug resistance is associated with rifampicin resistance.
Attempts at reducing the emergence of resistance are not limited to providing effective combination therapy but require high levels of adherence to treatment and the reduction of undetected or untreated cases. These factors remain a concern as pre-treatment loss to follow up rates above 20% have been reported 13,57 and could be amplified in a high-risk HIV endemic setting prevailing in South Africa.
31South African Tuberculosis Drug Resistance Survey 2012–14
Estimating the burden of RR/MDR-TB
During 2014, 332 783 microbiologically confirmed TB cases were reported through the laboratory system. Applying the point estimate and 95% confidence intervals for RR TB cases from this survey, the expected number of RR cases would be 15 308 (11 647-18 969). This correlates with the reported RR cases for that year, being 18 734; however, the RR/MDR numbers include both PTB and extra-pulmonary TB (EPTB) drug-resistant cases and thus would be lower if restricted to PTB cases. Additionally, the current estimates are based on the MGIT methodology which may underestimate rifampicin resistance compared to Xpert MTB/RIF and other molecular assays. For the same year, a total of 272 078 cases were reported as having started on TB treatment. Applying the point estimate and confidence intervals for RR TB cases from this survey, the expected number of RR cases on treatment would be 12 516 (9 523–15 508). In the same year, 11538 RR/MDR cases were reported to have started on treatment. It is reassuring that there is no gross under or overdetection of treatment cases, however the range between the lowest and highest estimates across the two sources is quite wide.
Further investigation is warranted to identify reasons for the difference and to ensure that all diagnosed cases are started on treatment. In the WHO Global TB Report 2015, the trends in the number of cases diagnosed and on treatment are shown for the 27 high-burden countries globally, and included South Africa. The pattern observed in South Africa is not much different to global trends or those in many high-burden countries. Rates of loss to follow up are expected to be higher in drug-resistant TB than in drug-susceptible TB cases, due to a variety of factors, including duration of treatment, use of injectable agents and poor outcomes. New drugs and shorter, patient-friendly treatment regimens associated with good patient outcomes are urgently needed. The increased availability of new diagnostics needs to be paralleled with acceleration in new drug discovery and clinical trials for the evaluation of new treatment regimens.
Fluoroquinolone and pyrazinamide resistance among TB cases
Evidence from early bactericidal studies evaluating different combinations of drugs has shown good outcomes when new agents were combined with fluoroquinolones and pyrazinamide58. The present survey records relatively low resistance rates for both these drugs, with fluoroquinolone resistance overall at 1.4% (95% CI: 0.9%-1.8%), using ofloxacin as an indicator of fluoroquinolone resistance. This finding is encouraging and supports the use of this class of drugs in new regimens for TB treatment. When assessing cross-resistance among ofloxacin-resistant strains, 71.2% were susceptible to moxifloxacin tested at 0.5ug/ml – the tentative epidemiological ‘breakpoint’ concentration for this TB treatment drug. However, this breakpoint concentration has been disputed by some, suggesting that it should be lowered to 0.25ug/ml, though resistance estimates at this concentration would still likely to be below that for ofloxacin. The breakpoint concentration currently suggested for clinical management is 2.0ug/ml and is similar to that of ofloxacin. Resistance estimates would be considerably lower if tested at this much higher concentration.
Pyrazinamide resistance showed an overall national rate of 3.7% (2.9%-4.5%), however based on sequencing of strains for Gauteng and KwaZulu-Natal conducted as part of a multi-country study, resistance rates were 3.1% and 3.9% respectively for the two provinces, compared with 5.3% and 3.7% respectively using phenotypic methods (publication under review). Sequencing of the pncA gene is emerging as the preferred standard test for pyrazinamide resistance59. The higher rates by phenotype in Gauteng relate to this province being the first to enrol in the current national DRS and pyrazinamide resistance reconfirmation was not done in the first few months of the survey, as data only emerged later on high false resistance being recorded on phenotypic testing. The KwaZulu-Natal MGIT-based estimates for pyrazinamide resistance are much closer to the sequencing estimates and retesting using conventional MGIT-based methodology was fully instituted by the time of this provinces’ enrolment.
Second-line drug resistance levels among MDR cases
The outcomes among RR/MDR cases have been shown to be very poor and even worse for XDR-TB cases. On assessing the extent of resistance to currently used drugs among MDR-TB cases, it is clear that, although the frequency of resistance to second-line drugs and specifically fluoroquinolones is relatively low at 13% for the latter, high rates of resistance to the companion drugs prevail. The ethionamide resistance rate is 44.7% (25.9%-63.6%) and even using the lower limit of the 95% confidence interval, isolates from one in four empirically treated MDR-TB patients would be resistant to ethionamide. This estimate holds true as MDR-TB cases are by definition isoniazid-resistant and mutations in the inhA promoter region, accounting for approximately 8-43% of isoniazid resistant strains60 would confer cross-resistance to ethionamide. Furthermore, ethionamide resistance can only partially be attributed to inhA mutations. Pyrazinamide, another drug used in drug resistance regimens is known to have potent sterilising activity but very high resistance rates of between 50% and 70% have been recorded for this drug. This is corroborated by a recent study which analysed the prevalence of PZA resistance among MDR strains from the previous survey and found 52.1% to be PZA resistant61. Similarly, studies both within South Africa and elsewhere have shown a high prevalence of pyrazinamide resistance among MDR TB cases59,62-64. With these high rates of resistance, further selection of resistance and consequently poor patient outcomes are likely to occur.
32 South African Tuberculosis Drug Resistance Survey 2012–14
Ideally, a new treatment regimen would be required, but the challenge facing DR-TB programmes is the limited number of drugs available to deal with M/XDR-TB cases. A pragmatic approach would be the use of available drugs to which the causative strain has been shown to be susceptible and targeting a tailored therapeutic regimen at least in MDR-TB cases but this would require rapid susceptibility testing of the isolates to second-line drugs. One drug to which very low levels of resistance have been encountered has been p-aminosalicylic acid (PAS) which provides a good option, although tolerability concerns associated with this drug have limited its use.
Second-line injectable agents, kanamycin, amikacin and capreomycin, remain a cornerstone of the treatment for drug-resistant cases and the estimate of 13.0% (95% CI: 5.0%-20.9%) was based on resistance to any one of the three injectable agents; thus, despite considerable cross-resistance, resistance to individual drugs would be somewhat lower. When confronted with an MDR-TB patient with kanamycin resistance and thus by definition a pre-XDR TB case, cross-resistance would be lower for amikacin (85%) and lowest for capreomycin (59%). This is a useful management option but would only be relevant for such cases. However, treatment of these cases would be most suited to novel regimens as adding individual drugs to the regimens of these cases could lead to acquisition of resistance to the added drug, taking into account the high levels of resistance observed for the other drugs.
XDR-TB estimates
The XDR-TB estimate among MDR-TB cases in this survey of 4.9% (95% CI: 1.0%-8.8%) was lower than that reported globally at 9.7% (7.4%-12%) but the difference was not statistically significant. This suggests that the XDR-TB problem that has seen two outbreaks during the period between the two surveys has not become widespread across the country. A contributory factor could have been the high mortality associated with these cases. In addition, XDR-TB cases may have been confined to certain provinces or districts and this survey may not have been powered to assess the distribution of such cases at the required level of detail.
Limitations
The survey has produced important findings which will need to be discussed and will additionally require the development of a plan for implementation of recommendations. However, the survey had certain limitations and the findings should be seen in context. The recording of previous treatment history is prone to recall bias; however the retreatment rates reported here are comparable to what was observed in the previous survey. Additionally, the national estimate generated in the previous survey excluded the Northern Cape province; however, when the analysis for the current survey was repeated without this province there were no discernable differences. This is expected since this province accounts for only 2.2% of the South African population65 and has a low burden of MDR-TB. Furthermore, comparing two time points does not necessarily allow a trend to be assessed and the time between the surveys has been just over ten years. Thus the situation could have been worse around the time when the Tugela Ferry outbreak occurred and could have recovered to the present levels, or the trajectory could still be increasing. Further analysis of routine surveillance data is underway to elucidate these questions.
There were also three specific issues that are relevant to the current survey and the analysis. First, large losses of screened candidates occurred due to no or low-specimen volumes, despite the interventions that were applied. The losses were however widespread with no discernable concentration in a specific geographic area and were therefore likely to be random. Low-volume specimens can be expected in an HIV endemic setting and this has been documented previously2,66. Additionally, TB DRS surveys are based on microbiologically confirmed TB cases and thus would inherently exclude cases that could not be tested.
Second, while the study design required consecutive recruitment of presumptive TB cases, it also required informed consent, which to some extent depended on the level of engagement of the local TB nurse. Therefore enrolment was not consistent and could potentially have introduced bias if recruiting nurses were to be more insistent to recruit patients that they thought were more likely to have TB. However this is unlikely to have occurred as the study population included presumptive TB cases, and predicting TB in patients would be difficult, even for experienced clinicians. The survey included smear-negative cases and thus ensured that HIV patients would be included. Furthermore, these concerns have been addressed by imputing and applying inverse probability weighting. The estimates were however similar to the unadjusted but we have reported on the adjusted data.
Third, DST, especially for second-line drugs, is often less reliable; however the survey was conducted following established procedures at an ISO-accredited reference laboratory which is part of the WHO supranational reference laboratory network and showed good performance in the external quality assurance (EQA) programme for both first-line and second-line drug testing. In addition and where available, sequencing performed on strains was used to cross-check resistance profiles and correlate findings with those published in the literature.
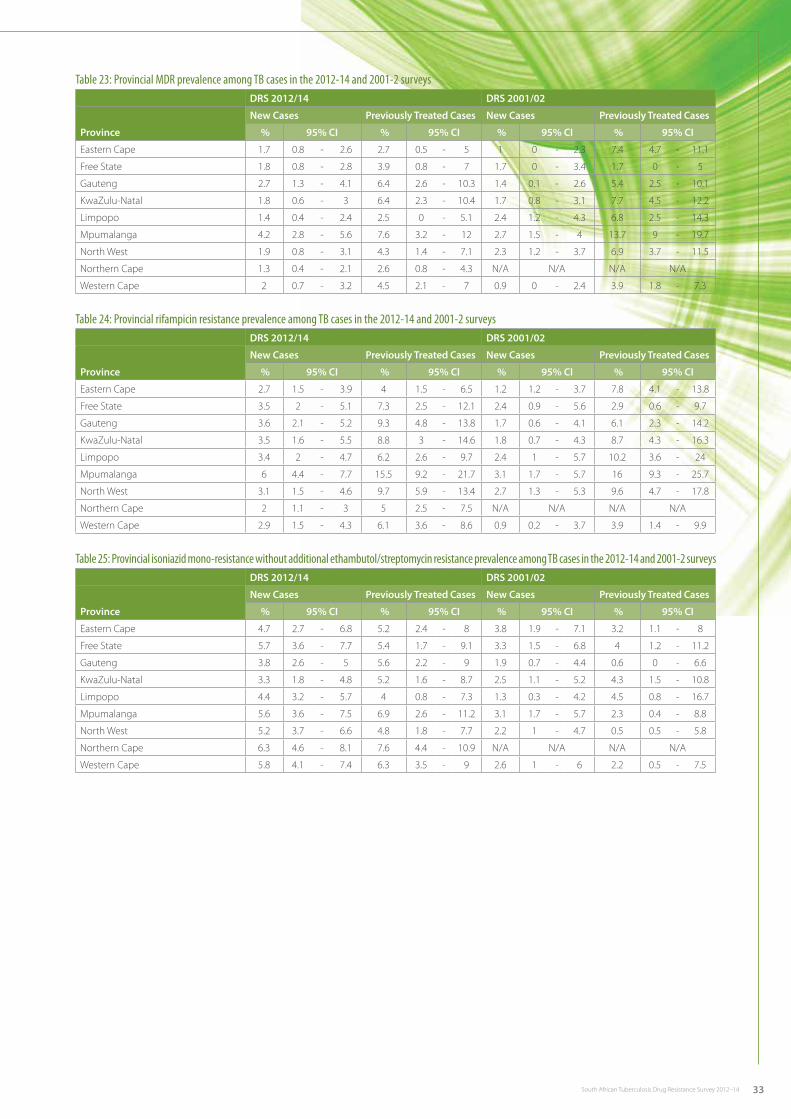
33South African Tuberculosis Drug Resistance Survey 2012–14
Table 23: Provincial MDR prevalence among TB cases in the 2012-14 and 2001-2 surveysDRS 2012/14 DRS 2001/02
Province
New Cases Previously Treated Cases New Cases Previously Treated Cases
% 95% CI % 95% CI % 95% CI % 95% CI
Eastern Cape 1.7 0.8 - 2.6 2.7 0.5 - 5 1 0 - 2.3 7.4 4.7 - 11.1
Free State 1.8 0.8 - 2.8 3.9 0.8 - 7 1.7 0 - 3.4 1.7 0 - 5
Gauteng 2.7 1.3 - 4.1 6.4 2.6 - 10.3 1.4 0.1 - 2.6 5.4 2.5 - 10.1
KwaZulu-Natal 1.8 0.6 - 3 6.4 2.3 - 10.4 1.7 0.8 - 3.1 7.7 4.5 - 12.2
Limpopo 1.4 0.4 - 2.4 2.5 0 - 5.1 2.4 1.2 - 4.3 6.8 2.5 - 14.3
Mpumalanga 4.2 2.8 - 5.6 7.6 3.2 - 12 2.7 1.5 - 4 13.7 9 - 19.7
North West 1.9 0.8 - 3.1 4.3 1.4 - 7.1 2.3 1.2 - 3.7 6.9 3.7 - 11.5
Northern Cape 1.3 0.4 - 2.1 2.6 0.8 - 4.3 N/A N/A N/A N/A
Western Cape 2 0.7 - 3.2 4.5 2.1 - 7 0.9 0 - 2.4 3.9 1.8 - 7.3
Table 24: Provincial rifampicin resistance prevalence among TB cases in the 2012-14 and 2001-2 surveysDRS 2012/14 DRS 2001/02
Province
New Cases Previously Treated Cases New Cases Previously Treated Cases
% 95% CI % 95% CI % 95% CI % 95% CI
Eastern Cape 2.7 1.5 - 3.9 4 1.5 - 6.5 1.2 1.2 - 3.7 7.8 4.1 - 13.8
Free State 3.5 2 - 5.1 7.3 2.5 - 12.1 2.4 0.9 - 5.6 2.9 0.6 - 9.7
Gauteng 3.6 2.1 - 5.2 9.3 4.8 - 13.8 1.7 0.6 - 4.1 6.1 2.3 - 14.2
KwaZulu-Natal 3.5 1.6 - 5.5 8.8 3 - 14.6 1.8 0.7 - 4.3 8.7 4.3 - 16.3
Limpopo 3.4 2 - 4.7 6.2 2.6 - 9.7 2.4 1 - 5.7 10.2 3.6 - 24
Mpumalanga 6 4.4 - 7.7 15.5 9.2 - 21.7 3.1 1.7 - 5.7 16 9.3 - 25.7
North West 3.1 1.5 - 4.6 9.7 5.9 - 13.4 2.7 1.3 - 5.3 9.6 4.7 - 17.8
Northern Cape 2 1.1 - 3 5 2.5 - 7.5 N/A N/A N/A N/A
Western Cape 2.9 1.5 - 4.3 6.1 3.6 - 8.6 0.9 0.2 - 3.7 3.9 1.4 - 9.9
Table 25: Provincial isoniazid mono-resistance without additional ethambutol/streptomycin resistance prevalence among TB cases in the 2012-14 and 2001-2 surveysDRS 2012/14 DRS 2001/02
Province
New Cases Previously Treated Cases New Cases Previously Treated Cases
% 95% CI % 95% CI % 95% CI % 95% CI
Eastern Cape 4.7 2.7 - 6.8 5.2 2.4 - 8 3.8 1.9 - 7.1 3.2 1.1 - 8
Free State 5.7 3.6 - 7.7 5.4 1.7 - 9.1 3.3 1.5 - 6.8 4 1.2 - 11.2
Gauteng 3.8 2.6 - 5 5.6 2.2 - 9 1.9 0.7 - 4.4 0.6 0 - 6.6
KwaZulu-Natal 3.3 1.8 - 4.8 5.2 1.6 - 8.7 2.5 1.1 - 5.2 4.3 1.5 - 10.8
Limpopo 4.4 3.2 - 5.7 4 0.8 - 7.3 1.3 0.3 - 4.2 4.5 0.8 - 16.7
Mpumalanga 5.6 3.6 - 7.5 6.9 2.6 - 11.2 3.1 1.7 - 5.7 2.3 0.4 - 8.8
North West 5.2 3.7 - 6.6 4.8 1.8 - 7.7 2.2 1 - 4.7 0.5 0.5 - 5.8
Northern Cape 6.3 4.6 - 8.1 7.6 4.4 - 10.9 N/A N/A N/A N/A
Western Cape 5.8 4.1 - 7.4 6.3 3.5 - 9 2.6 1 - 6 2.2 0.5 - 7.5
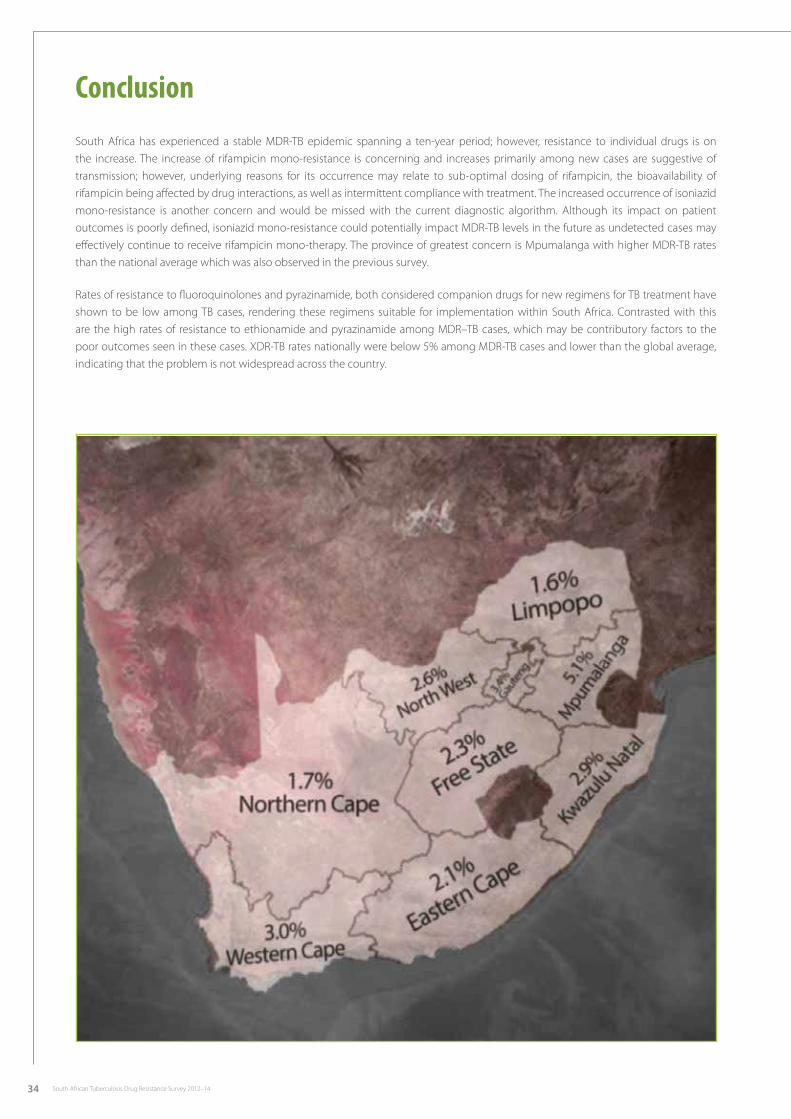
34 South African Tuberculosis Drug Resistance Survey 2012–14
ConclusionSouth Africa has experienced a stable MDR-TB epidemic spanning a ten-year period; however, resistance to individual drugs is on the increase. The increase of rifampicin mono-resistance is concerning and increases primarily among new cases are suggestive of transmission; however, underlying reasons for its occurrence may relate to sub-optimal dosing of rifampicin, the bioavailability of rifampicin being affected by drug interactions, as well as intermittent compliance with treatment. The increased occurrence of isoniazid mono-resistance is another concern and would be missed with the current diagnostic algorithm. Although its impact on patient outcomes is poorly defined, isoniazid mono-resistance could potentially impact MDR-TB levels in the future as undetected cases may effectively continue to receive rifampicin mono-therapy. The province of greatest concern is Mpumalanga with higher MDR-TB rates than the national average which was also observed in the previous survey.
Rates of resistance to fluoroquinolones and pyrazinamide, both considered companion drugs for new regimens for TB treatment have shown to be low among TB cases, rendering these regimens suitable for implementation within South Africa. Contrasted with this are the high rates of resistance to ethionamide and pyrazinamide among MDR–TB cases, which may be contributory factors to the poor outcomes seen in these cases. XDR-TB rates nationally were below 5% among MDR-TB cases and lower than the global average, indicating that the problem is not widespread across the country.
35South African Tuberculosis Drug Resistance Survey 2012–14
Recommendations• UrgentimplementationofinterventionsinMpumalanga
› Identify potential risk factors for targeted interventions
› Improve cross-border co-operation with Swaziland and Mozambique, utilising existing agreements achieved through the SADC declaration
› Conduct further research to fully define drivers of resistance in the province
• DevelopinterventionstocurbIMRanditssecondaryeffects
› Strengthen current first-line regimen for continuation phase by adding ethambutol with or without pyrazinamide(RHE or RHZE), or institute appropriate measures for early identification of IMR
› Assess the contribution and effectiveness of IPT in the light of increasing cases of resistance
• MonitortransmissionofRMR,researchunderlyingreasonsforRMRandinstituteappropriateinterventions
› Regularly review transmission data from surveillance system
› Review current rifampicin dosing and conduct rifampicin bioavailability studies in the four and two-drug combination with and without antiretroviral therapies (ARTs) in areas with high RMR occurrence
› Undertake close monitoring of the quality of drugs used in the standard regimen
• Conduct randomised control trials (RCTs) and reviewexisting standardof caredata to assess effectiveness of existing first andsecond-line regimens
• MonitoruseofXpertMTB/Rifassay forearlydetectionof rifampicin resistanceand improveearlydetectionofsecond-linedrugresistance
• OptimiseexistingMDRregimenandconsidershorteningMDRregimenwithtriagealgorithmforappropriatepatientselection
• Designanappropriateregimenforpre-XDR/XDRpatientsusingacombinationofnewdrugs
• Maintainandenhancetheroutinesurveillancesystemformonitoringexistingandnewdrugresistanceandreducetheproportionof diagnosed cases not started on treatment.
36 South African Tuberculosis Drug Resistance Survey 2012–14
AppendixesA. Case Report Form ........................................................................................................................................................................................................................................................ 37
B. Informed Consent Form .......................................................................................................................................................................................................................................... 38
C. Mono-resistance Tables by Province (strict and other) ........................................................................................................................................................................ 39
D. Individual Province Results .................................................................................................................................................................................................................................... 40
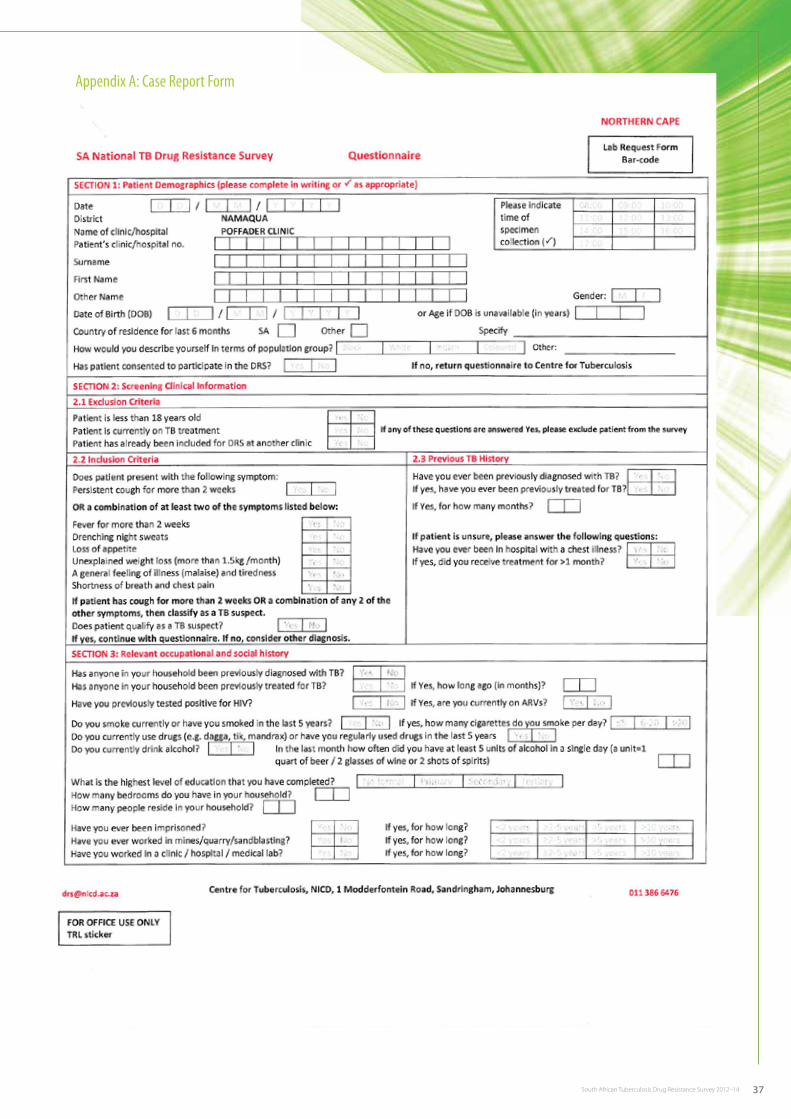
37South African Tuberculosis Drug Resistance Survey 2012–14
Appendix A: Case Report Form
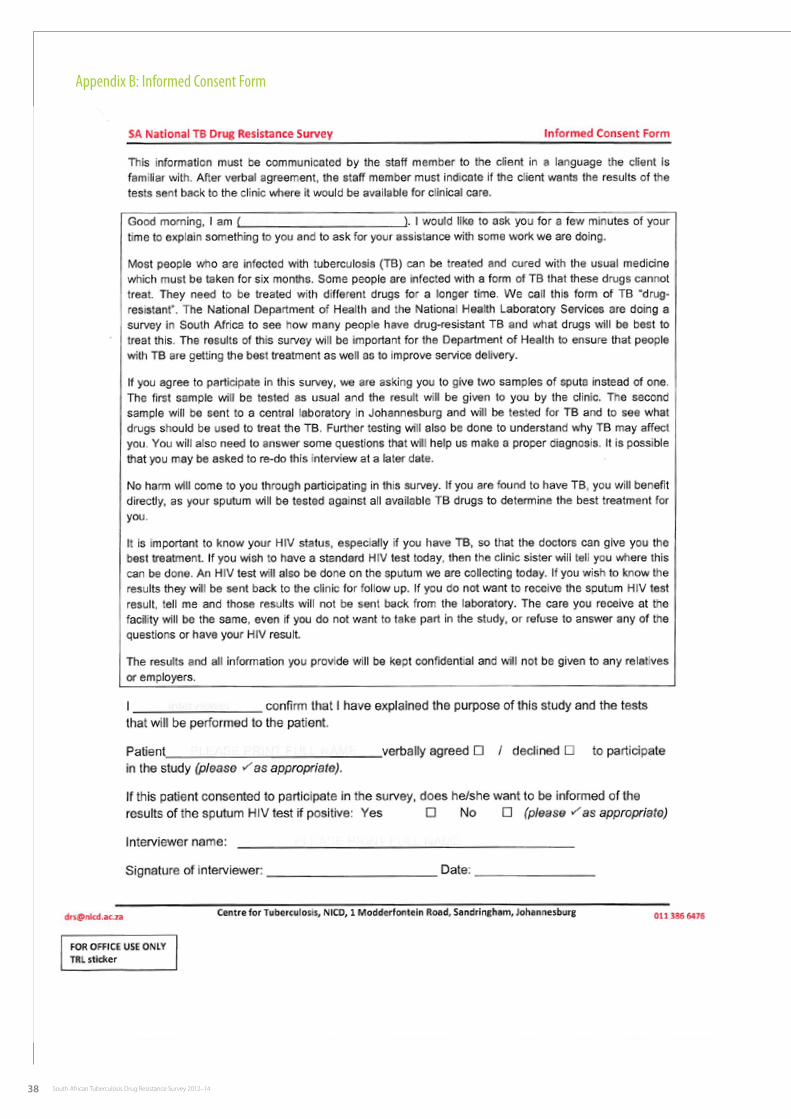
38 South African Tuberculosis Drug Resistance Survey 2012–14
Appendix B: Informed Consent Form
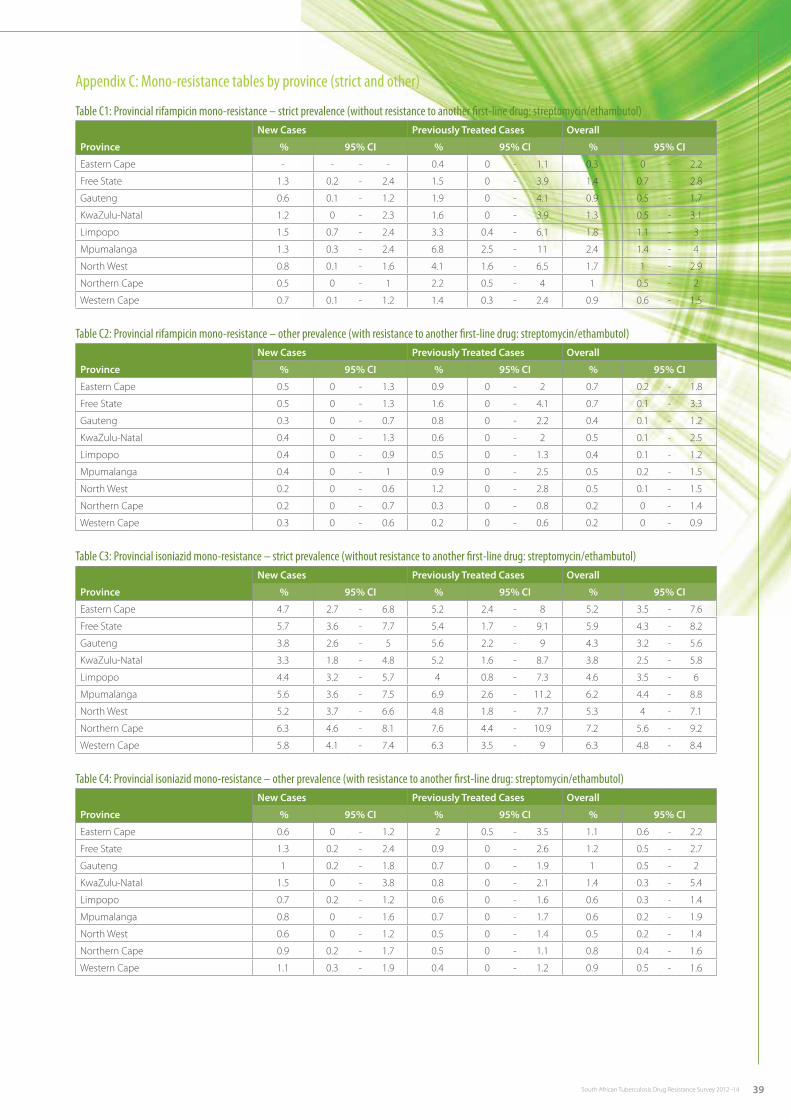
39South African Tuberculosis Drug Resistance Survey 2012–14
Appendix C: Mono-resistance tables by province (strict and other)
Table C1: Provincial rifampicin mono-resistance – strict prevalence (without resistance to another first-line drug: streptomycin/ethambutol)
Province
New Cases Previously Treated Cases Overall
% 95% CI % 95% CI % 95% CI
Eastern Cape - - - - 0.4 0 - 1.1 0.3 0 - 2.2
Free State 1.3 0.2 - 2.4 1.5 0 - 3.9 1.4 0.7 - 2.8
Gauteng 0.6 0.1 - 1.2 1.9 0 - 4.1 0.9 0.5 - 1.7
KwaZulu-Natal 1.2 0 - 2.3 1.6 0 - 3.9 1.3 0.5 - 3.1
Limpopo 1.5 0.7 - 2.4 3.3 0.4 - 6.1 1.8 1.1 - 3
Mpumalanga 1.3 0.3 - 2.4 6.8 2.5 - 11 2.4 1.4 - 4
North West 0.8 0.1 - 1.6 4.1 1.6 - 6.5 1.7 1 - 2.9
Northern Cape 0.5 0 - 1 2.2 0.5 - 4 1 0.5 - 2
Western Cape 0.7 0.1 - 1.2 1.4 0.3 - 2.4 0.9 0.6 - 1.5
Table C2: Provincial rifampicin mono-resistance – other prevalence (with resistance to another first-line drug: streptomycin/ethambutol)
Province
New Cases Previously Treated Cases Overall
% 95% CI % 95% CI % 95% CI
Eastern Cape 0.5 0 - 1.3 0.9 0 - 2 0.7 0.2 - 1.8
Free State 0.5 0 - 1.3 1.6 0 - 4.1 0.7 0.1 - 3.3
Gauteng 0.3 0 - 0.7 0.8 0 - 2.2 0.4 0.1 - 1.2
KwaZulu-Natal 0.4 0 - 1.3 0.6 0 - 2 0.5 0.1 - 2.5
Limpopo 0.4 0 - 0.9 0.5 0 - 1.3 0.4 0.1 - 1.2
Mpumalanga 0.4 0 - 1 0.9 0 - 2.5 0.5 0.2 - 1.5
North West 0.2 0 - 0.6 1.2 0 - 2.8 0.5 0.1 - 1.5
Northern Cape 0.2 0 - 0.7 0.3 0 - 0.8 0.2 0 - 1.4
Western Cape 0.3 0 - 0.6 0.2 0 - 0.6 0.2 0 - 0.9
Table C3: Provincial isoniazid mono-resistance – strict prevalence (without resistance to another first-line drug: streptomycin/ethambutol)
Province
New Cases Previously Treated Cases Overall
% 95% CI % 95% CI % 95% CI
Eastern Cape 4.7 2.7 - 6.8 5.2 2.4 - 8 5.2 3.5 - 7.6
Free State 5.7 3.6 - 7.7 5.4 1.7 - 9.1 5.9 4.3 - 8.2
Gauteng 3.8 2.6 - 5 5.6 2.2 - 9 4.3 3.2 - 5.6
KwaZulu-Natal 3.3 1.8 - 4.8 5.2 1.6 - 8.7 3.8 2.5 - 5.8
Limpopo 4.4 3.2 - 5.7 4 0.8 - 7.3 4.6 3.5 - 6
Mpumalanga 5.6 3.6 - 7.5 6.9 2.6 - 11.2 6.2 4.4 - 8.8
North West 5.2 3.7 - 6.6 4.8 1.8 - 7.7 5.3 4 - 7.1
Northern Cape 6.3 4.6 - 8.1 7.6 4.4 - 10.9 7.2 5.6 - 9.2
Western Cape 5.8 4.1 - 7.4 6.3 3.5 - 9 6.3 4.8 - 8.4
Table C4: Provincial isoniazid mono-resistance – other prevalence (with resistance to another first-line drug: streptomycin/ethambutol)
Province
New Cases Previously Treated Cases Overall
% 95% CI % 95% CI % 95% CI
Eastern Cape 0.6 0 - 1.2 2 0.5 - 3.5 1.1 0.6 - 2.2
Free State 1.3 0.2 - 2.4 0.9 0 - 2.6 1.2 0.5 - 2.7
Gauteng 1 0.2 - 1.8 0.7 0 - 1.9 1 0.5 - 2
KwaZulu-Natal 1.5 0 - 3.8 0.8 0 - 2.1 1.4 0.3 - 5.4
Limpopo 0.7 0.2 - 1.2 0.6 0 - 1.6 0.6 0.3 - 1.4
Mpumalanga 0.8 0 - 1.6 0.7 0 - 1.7 0.6 0.2 - 1.9
North West 0.6 0 - 1.2 0.5 0 - 1.4 0.5 0.2 - 1.4
Northern Cape 0.9 0.2 - 1.7 0.5 0 - 1.1 0.8 0.4 - 1.6
Western Cape 1.1 0.3 - 1.9 0.4 0 - 1.2 0.9 0.5 - 1.6
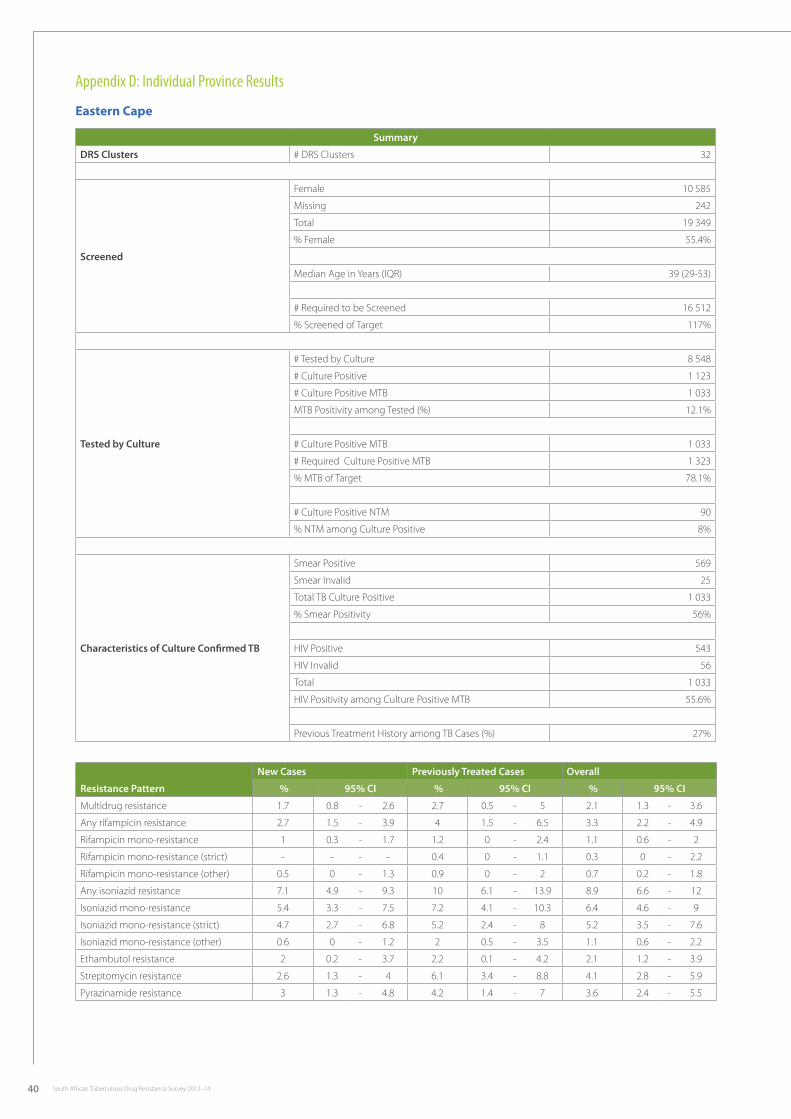
40 South African Tuberculosis Drug Resistance Survey 2012–14
Appendix D: Individual Province Results
Eastern Cape
Summary
DRS Clusters # DRS Clusters 32
Screened
Female 10 585
Missing 242
Total 19 349
% Female 55.4%
Median Age in Years (IQR) 39 (29-53)
# Required to be Screened 16 512
% Screened of Target 117%
Tested by Culture
# Tested by Culture 8 548
# Culture Positive 1 123
# Culture Positive MTB 1 033
MTB Positivity among Tested (%) 12.1%
# Culture Positive MTB 1 033
# Required Culture Positive MTB 1 323
% MTB of Target 78.1%
# Culture Positive NTM 90
% NTM among Culture Positive 8%
Characteristics of Culture Confirmed TB
Smear Positive 569
Smear Invalid 25
Total TB Culture Positive 1 033
% Smear Positivity 56%
HIV Positive 543
HIV Invalid 56
Total 1 033
HIV Positivity among Culture Positive MTB 55.6%
Previous Treatment History among TB Cases (%) 27%
Resistance Pattern
New Cases Previously Treated Cases Overall
% 95% CI % 95% CI % 95% CI
Multidrug resistance 1.7 0.8 - 2.6 2.7 0.5 - 5 2.1 1.3 - 3.6
Any rifampicin resistance 2.7 1.5 - 3.9 4 1.5 - 6.5 3.3 2.2 - 4.9
Rifampicin mono-resistance 1 0.3 - 1.7 1.2 0 - 2.4 1.1 0.6 - 2
Rifampicin mono-resistance (strict) - - - - 0.4 0 - 1.1 0.3 0 - 2.2
Rifampicin mono-resistance (other) 0.5 0 - 1.3 0.9 0 - 2 0.7 0.2 - 1.8
Any isoniazid resistance 7.1 4.9 - 9.3 10 6.1 - 13.9 8.9 6.6 - 12
Isoniazid mono-resistance 5.4 3.3 - 7.5 7.2 4.1 - 10.3 6.4 4.6 - 9
Isoniazid mono-resistance (strict) 4.7 2.7 - 6.8 5.2 2.4 - 8 5.2 3.5 - 7.6
Isoniazid mono-resistance (other) 0.6 0 - 1.2 2 0.5 - 3.5 1.1 0.6 - 2.2
Ethambutol resistance 2 0.2 - 3.7 2.2 0.1 - 4.2 2.1 1.2 - 3.9
Streptomycin resistance 2.6 1.3 - 4 6.1 3.4 - 8.8 4.1 2.8 - 5.9
Pyrazinamide resistance 3 1.3 - 4.8 4.2 1.4 - 7 3.6 2.4 - 5.5

41South African Tuberculosis Drug Resistance Survey 2012–14
Free State
Summary
DRS Clusters # DRS Clusters 39
Screened
Female 14 579
Missing 423
Total 26 288
% Female 56.4%
Median Age in Years (IQR) 42 (31-53)
# Required to be Screened 20 160
% Screened of Target 130%
Tested by Culture
# Tested by Culture 14 080
# Culture Positive 1 155
# Culture Positive MTB 907
MTB Positivity among Tested (%) 6.4%
# Culture Positive MTB 907
# Required Culture Positive MTB 1 291
% MTB of Target 70.3%
# Culture Positive NTM 248
% NTM among Culture Positive 21%
Characteristics of Culture Confirmed TB
Smear Positive 390
Smear Invalid 45
Total TB Culture Positive 907
% Smear Positivity 45%
HIV Positive 578
HIV Invalid 85
Total 907
HIV Positivity among Culture Positive MTB 70.3%
Previous Treatment History among TB Cases (%) 21%
Resistance Pattern
New Cases Previously Treated Cases Overall
% 95% CI % 95% CI % 95% CI
Multidrug resistance 1.8 0.8 - 2.8 3.9 0.8 - 7 2.3 1.5 - 3.6
Any rifampicin resistance 3.5 2 - 5.1 7.3 2.5 - 12.1 4.6 3.2 - 6.6
Rifampicin mono-resistance 1.8 0.4 - 3.1 3.4 0.5 - 6.3 2.2 1.2 - 3.9
Rifampicin mono-resistance (strict) 1.3 0.2 - 2.4 1.5 0 - 3.9 1.4 0.7 - 2.8
Rifampicin mono-resistance (other) 0.5 0 - 1.3 1.6 0 - 4.1 0.7 0.1 - 3.3
Any isoniazid resistance 8.8 6.4 - 11.1 10.1 5.2 - 14.9 10 7.8 - 12.9
Isoniazid mono-resistance 7 4.9 - 9.1 6.1 2.2 - 10 7.3 5.6 - 9.6
Isoniazid mono-resistance (strict) 5.7 3.6 - 7.7 5.4 1.7 - 9.1 5.9 4.3 - 8.2
Isoniazid mono-resistance (other) 1.3 0.2 - 2.4 0.9 0 - 2.6 1.2 0.5 - 2.7
Ethambutol resistance 3 1.5 - 4.5 6.2 1.4 - 11 4 2.7 - 5.9
Streptomycin resistance 3.3 1.4 - 5.2 4.1 0 - 8.3 3.7 2.3 - 5.9
Pyrazinamide resistance 2.8 1.4 - 4.1 2.9 0 - 6.1 2.9 1.9 - 4.6
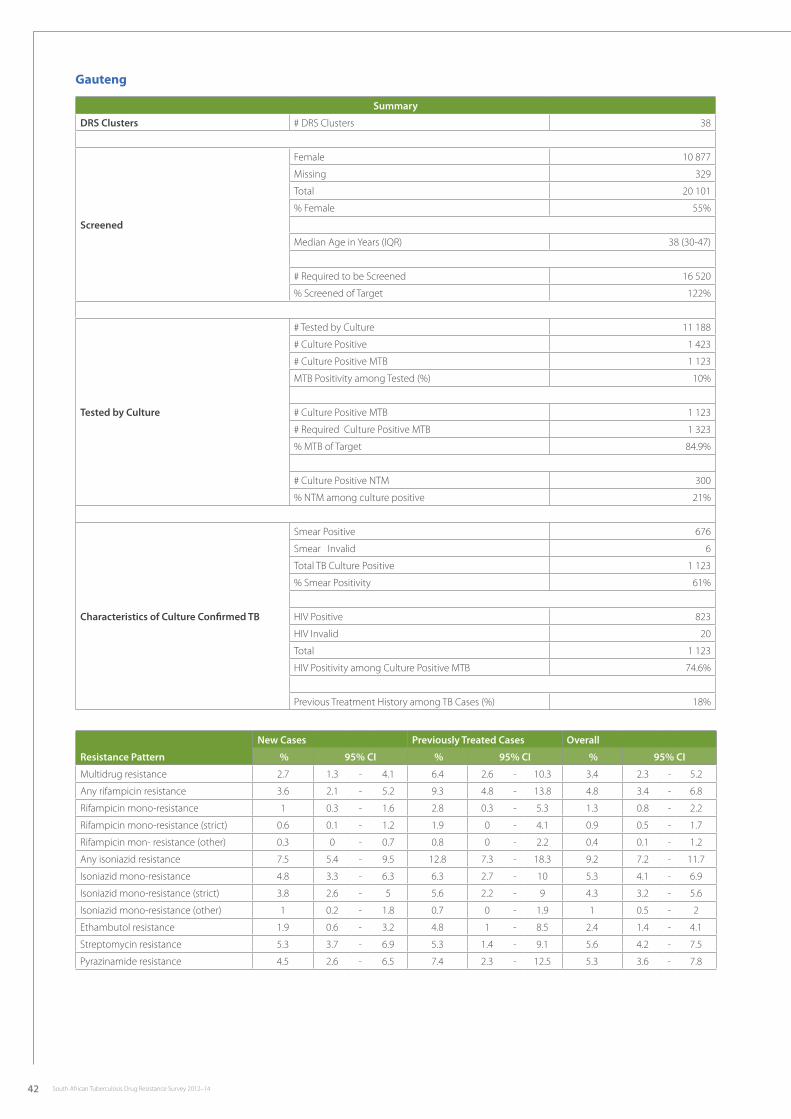
42 South African Tuberculosis Drug Resistance Survey 2012–14
Gauteng
Summary
DRS Clusters # DRS Clusters 38
Screened
Female 10 877
Missing 329
Total 20 101
% Female 55%
Median Age in Years (IQR) 38 (30-47)
# Required to be Screened 16 520
% Screened of Target 122%
Tested by Culture
# Tested by Culture 11 188
# Culture Positive 1 423
# Culture Positive MTB 1 123
MTB Positivity among Tested (%) 10%
# Culture Positive MTB 1 123
# Required Culture Positive MTB 1 323
% MTB of Target 84.9%
# Culture Positive NTM 300
% NTM among culture positive 21%
Characteristics of Culture Confirmed TB
Smear Positive 676
Smear Invalid 6
Total TB Culture Positive 1 123
% Smear Positivity 61%
HIV Positive 823
HIV Invalid 20
Total 1 123
HIV Positivity among Culture Positive MTB 74.6%
Previous Treatment History among TB Cases (%) 18%
Resistance Pattern
New Cases Previously Treated Cases Overall
% 95% CI % 95% CI % 95% CI
Multidrug resistance 2.7 1.3 - 4.1 6.4 2.6 - 10.3 3.4 2.3 - 5.2
Any rifampicin resistance 3.6 2.1 - 5.2 9.3 4.8 - 13.8 4.8 3.4 - 6.8
Rifampicin mono-resistance 1 0.3 - 1.6 2.8 0.3 - 5.3 1.3 0.8 - 2.2
Rifampicin mono-resistance (strict) 0.6 0.1 - 1.2 1.9 0 - 4.1 0.9 0.5 - 1.7
Rifampicin mon- resistance (other) 0.3 0 - 0.7 0.8 0 - 2.2 0.4 0.1 - 1.2
Any isoniazid resistance 7.5 5.4 - 9.5 12.8 7.3 - 18.3 9.2 7.2 - 11.7
Isoniazid mono-resistance 4.8 3.3 - 6.3 6.3 2.7 - 10 5.3 4.1 - 6.9
Isoniazid mono-resistance (strict) 3.8 2.6 - 5 5.6 2.2 - 9 4.3 3.2 - 5.6
Isoniazid mono-resistance (other) 1 0.2 - 1.8 0.7 0 - 1.9 1 0.5 - 2
Ethambutol resistance 1.9 0.6 - 3.2 4.8 1 - 8.5 2.4 1.4 - 4.1
Streptomycin resistance 5.3 3.7 - 6.9 5.3 1.4 - 9.1 5.6 4.2 - 7.5
Pyrazinamide resistance 4.5 2.6 - 6.5 7.4 2.3 - 12.5 5.3 3.6 - 7.8

43South African Tuberculosis Drug Resistance Survey 2012–14
KwaZulu-Natal
Summary
DRS Clusters # DRS Clusters 31
Screened
Female 11 459
Missing 218
Total 20 376
% Female 56.8%
Median Age in Years (IQR) 35 (28-46)
# Required to be Screened 16 704
% Screened of Target 122%
Tested by Culture
# Tested by Culture 9 082
# Culture Positive 899
# Culture Positive MTB 784
MTB Positivity among Tested (%) 8.6%
# Culture Positive MTB 784
# Required Culture positive MTB 1 337
% MTB of Target 58.6%
# Culture Positive NTM 115
% NTM among Culture Positive 13%
Characteristics of Culture Confirmed TB
Smear Positive 350
Smear Invalid 29
Total TB Culture Positive 784
% Smear Positivity 46%
HIV Positive 507
HIV Invalid 51
Total 784
HIV Positivity among Culture Positive MTB 69.2%
Previous Treatment History among TB Cases (%) 22%
Resistance Pattern
New Cases Previously Treated Cases Overall
% 95% CI % 95% CI % 95% CI
Multidrug resistance 1.8 0.6 - 3 6.4 2.3 - 10.4 2.9 1.8 - 4.5
Any rifampicin resistance 3.5 1.6 - 5.5 8.8 3 - 14.6 4.9 3.2 - 7.5
Rifampicin mono-resistance 1.7 0.2 - 3.2 2.4 0 - 4.9 1.9 1 - 3.8
Rifampicin mono-resistance (strict) 1.2 0 - 2.3 1.6 0 - 3.9 1.3 0.5 - 3.1
Rifampicin mono-resistance (other) 0.4 0 - 1.3 0.6 0 - 2 0.5 0.1 - 2.5
Any isoniazid resistance 6.6 3.5 - 9.7 12.5 6.4 - 18.5 8.5 5.9 - 12.4
Isoniazid mono-resistance 4.8 2.1 - 7.4 6 2.3 - 9.8 5.3 3.3 - 8.5
Isoniazid mono-resistance (strict) 3.3 1.8 - 4.8 5.2 1.6 - 8.7 3.8 2.5 - 5.8
Isoniazid mono-resistance (other) 1.5 0 - 3.8 0.8 0 - 2.1 1.4 0.3 - 5.4
Ethambutol resistance 1.9 0.3 - 3.4 6 1.3 - 10.8 2.9 1.6 - 5
Streptomycin resistance 4.5 1.8 - 7.2 5.7 1.4 - 9.9 5 3 - 8.2
Pyrazinamide resistance 2.3 1 - 3.7 8.1 3.1 - 13 3.7 2.6 - 5.4

44 South African Tuberculosis Drug Resistance Survey 2012–14
Limpopo
Summary
DRS Clusters # DRS Clusters 48
Screened
Female 18 398
Missing 734
Total 31 503
% Female 59.8%
Median Age in Years (IQR) 43 (32-56)
# Required to be Screened 31 850
% Screened of Target 99%
Tested by Culture
# Tested by Culture 14 016
# Culture Positive 1 442
# Culture Positive MTB 1 120
MTB Positivity among Tested (%) 8%
# Culture Positive MTB 1 120
# Required Culture Positive MTB 1 274
% MTB of Target 87.9%
# Culture Positive NTM 322
% NTM among Culture Positive 22%
Characteristics of Culture Confirmed TB
Smear Positive 638
Smear Invalid 15
Total TB Culture Positive 1 120
% Smear Positivity 58%
HIV Positive 687
HIV Invalid 39
Total 1 120
HIV Positivity among Culture Positive MTB 63.6%
Previous Treatment History among TB Cases (%) 14%
Resistance Pattern
New Cases Previously Treated Cases Overall
% 95% CI % 95% CI % 95% CI
Multidrug resistance 1.4 0.4 - 2.4 2.5 0 - 5.1 1.6 0.9 - 2.9
Any rifampicin resistance 3.4 2 - 4.7 6.2 2.6 - 9.7 3.9 2.8 - 5.5
Rifampicin mono-resistance 2 1.1 - 2.9 3.5 0.5 - 6.5 2.2 1.5 - 3.4
Rifampicin mono-resistance (strict) 1.5 0.7 - 2.4 3.3 0.4 - 6.1 1.8 1.1 - 3
Rifampicin mono-resistance (other) 0.4 0 - 0.9 0.5 0 - 1.3 0.4 0.1 - 1.2
Any isoniazid resistance 6.6 4.7 - 8.4 7.1 3.2 - 11 7.1 5.5 - 9.1
Isoniazid mono-resistance 5.1 3.8 - 6.5 4.5 1.3 - 7.6 5.3 4.1 - 6.9
Isoniazid mono-resistance (strict) 4.4 3.2 - 5.7 4 0.8 - 7.3 4.6 3.5 - 6
Isoniazid mono-resistance (other) 0.7 0.2 - 1.2 0.6 0 - 1.6 0.6 0.3 - 1.4
Ethambutol resistance 1.8 0.3 - 3.2 1.2 0 - 3.5 1.7 0.9 - 3.5
Streptomycin resistance 2.9 1.7 - 4 2.2 0 - 5.3 2.9 2 - 4.2
Pyrazinamide resistance 1.8 1 - 2.6 4 1 - 7.1 2.2 1.5 - 3.2

45South African Tuberculosis Drug Resistance Survey 2012–14
Mpumalanga
Summary
DRS Clusters # DRS Clusters 38
Screened
Female 12 434
Missing 120
Total 21 739
% Female 57.5%
Median Age in Years (IQR) 39 (30-51)
# Required to be Screened 15 846
% Screened of Target 137%
Tested by Culture
# Tested by Culture 11 800
# Culture Positive 1 418
# Culture Positive MTB 1 193
MTB Positivity among Tested (%) 10.1%
# Culture Positive MTB 1 193
# Required Culture Positive MTB 1 269
% MTB of Target 94%
# Culture Positive NTM 225
% NTM among Culture Positive 16%
Characteristics of Culture Confirmed TB
Smear Positive 543
Smear Invalid 74
Total TB Culture Positive 1 193
% Smear Positivity 49%
HIV Positive 859
HIV Invalid 74
Total 1 193
HIV Positivity among Culture Positive MTB 76.8%
Previous Treatment History among TB Cases (%) 17%
Resistance Pattern
New Cases Previously Treated Cases Overall
% 95% CI % 95% CI % 95% CI
Multidrug resistance 4.2 2.8 - 5.6 7.6 3.2 - 12 5.1 3.7 - 7
Any rifampicin resistance 6 4.4 - 7.7 15.5 9.2 - 21.7 8.4 6.5 - 11
Rifampicin mono-resistance 1.8 0.9 - 2.7 7.8 3.5 - 12.1 3 2 - 4.5
Rifampicin mono-resistance (strict) 1.3 0.3 - 2.4 6.8 2.5 - 11 2.4 1.4 - 4
Rifampicin mono-resistance (other) 0.4 0 - 1 0.9 0 - 2.5 0.5 0.2 - 1.5
Any isoniazid resistance 10.6 8 - 13.1 14.6 7.6 - 21.6 12.7 9.8 - 16.5
Isoniazid mon-resistance 6.3 4 - 8.7 6.9 2.6 - 11.2 6.9 4.8 - 9.9
Isoniazid mono-resistance (strict) 5.6 3.6 - 7.5 6.9 2.6 - 11.2 6.2 4.4 - 8.8
Isoniazid mono-resistance (other) 0.8 0 - 1.6 0.7 0 - 1.7 0.6 0.2 - 1.9
Ethambutol resistance 4.2 2.8 - 5.7 2.8 0 - 5.7 4.2 3 - 5.8
Streptomycin resistance 5.4 3.3 - 7.5 5.8 2.5 - 9.1 5.8 4.2 - 8.1
Pyrazinamide resistance 3.7 2 - 5.4 4.4 0.9 - 7.9 4 2.6 - 6.1

46 South African Tuberculosis Drug Resistance Survey 2012–14
North West
Summary
DRS Clusters # DRS Clusters 35
Screened
Female 10 535
Missing 338
Total 19 589
% Female 54.7%
Median Age in Years (IQR) 40 (30-51)
# Required to be Screened 18 650
% Screened of Target 105%
Tested by Culture
# Tested by Culture 10 344
# Culture Positive 1 370
# Culture Positive MTB 1 024
MTB Positivity among Tested (%) 9.9%
# Culture Positive MTB 1 024
# Required Culture Positive MTB 1 194
% MTB of Target 85.8%
# Culture Positive NTM 346
% NTM among Culture Positive 25%
Characteristics of Culture Confirmed TB
Smear Positive 688
Smear Invalid 7
Total TB Culture Positive 1 024
% Smear Positivity 68%
HIV Positive 691
HIV Invalid 8
Total 1 024
HIV Positivity among Culture Positive MTB 68%
Previous Treatment History among TB Cases (%) 20%
Resistance Pattern
New Cases Previously Treated Cases Overall
% 95% CI % 95% CI % 95% CI
Multi-drug resistance 1.9 0.8 - 3.1 4.3 1.4 - 7.1 2.6 1.7 - 3.9
Any rifampicin resistance 3.1 1.5 - 4.6 9.7 5.9 - 13.4 4.9 3.6 - 6.8
Rifampicin mono-resistance 1.1 0.2 - 2 5.3 2.8 - 7.9 2.2 1.4 - 3.5
Rifampicin mono-resistance (strict) 0.8 0.1 - 1.6 4.1 1.6 - 6.5 1.7 1 - 2.9
Rifampicin mono-resistance (other) 0.2 0 - 0.6 1.2 0 - 2.8 0.5 0.1 - 1.5
Any isoniazid resistance 7.7 6 - 9.5 9.4 5.6 - 13.2 8.9 7.2 - 11
Isoniazid mono-resistance 5.8 4.3 - 7.2 5.1 2.1 - 8.1 6 4.6 - 7.7
Isoniazid mono-resistance (strict) 5.2 3.7 - 6.6 4.8 1.8 - 7.7 5.3 4 - 7.1
Isoniazid mono-resistance (other) 0.6 0 - 1.2 0.5 0 - 1.4 0.5 0.2 - 1.4
Ethambutol resistance 1 0.2 - 1.9 1.8 0 - 4.3 1.3 0.6 - 2.8
Streptomycin resistance 2.1 1 - 3.2 4.9 1.5 - 8.3 2.9 1.9 - 4.5
Pyrazinamide resistance 3.6 1.8 - 5.3 5 1.6 - 8.4 4.1 2.7 - 6.1
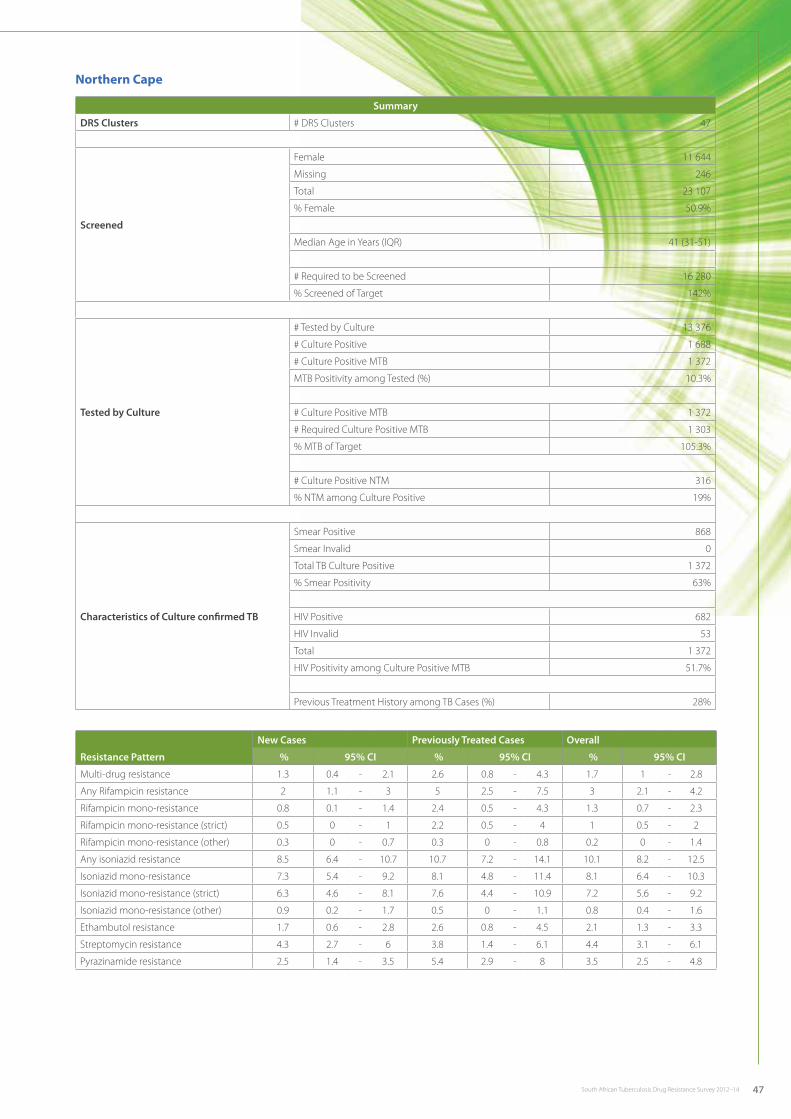
47South African Tuberculosis Drug Resistance Survey 2012–14
Northern Cape
Summary
DRS Clusters # DRS Clusters 47
Screened
Female 11 644
Missing 246
Total 23 107
% Female 50.9%
Median Age in Years (IQR) 41 (31-51)
# Required to be Screened 16 280
% Screened of Target 142%
Tested by Culture
# Tested by Culture 13 376
# Culture Positive 1 688
# Culture Positive MTB 1 372
MTB Positivity among Tested (%) 10.3%
# Culture Positive MTB 1 372
# Required Culture Positive MTB 1 303
% MTB of Target 105.3%
# Culture Positive NTM 316
% NTM among Culture Positive 19%
Characteristics of Culture confirmed TB
Smear Positive 868
Smear Invalid 0
Total TB Culture Positive 1 372
% Smear Positivity 63%
HIV Positive 682
HIV Invalid 53
Total 1 372
HIV Positivity among Culture Positive MTB 51.7%
Previous Treatment History among TB Cases (%) 28%
Resistance Pattern
New Cases Previously Treated Cases Overall
% 95% CI % 95% CI % 95% CI
Multi-drug resistance 1.3 0.4 - 2.1 2.6 0.8 - 4.3 1.7 1 - 2.8
Any Rifampicin resistance 2 1.1 - 3 5 2.5 - 7.5 3 2.1 - 4.2
Rifampicin mono-resistance 0.8 0.1 - 1.4 2.4 0.5 - 4.3 1.3 0.7 - 2.3
Rifampicin mono-resistance (strict) 0.5 0 - 1 2.2 0.5 - 4 1 0.5 - 2
Rifampicin mono-resistance (other) 0.3 0 - 0.7 0.3 0 - 0.8 0.2 0 - 1.4
Any isoniazid resistance 8.5 6.4 - 10.7 10.7 7.2 - 14.1 10.1 8.2 - 12.5
Isoniazid mono-resistance 7.3 5.4 - 9.2 8.1 4.8 - 11.4 8.1 6.4 - 10.3
Isoniazid mono-resistance (strict) 6.3 4.6 - 8.1 7.6 4.4 - 10.9 7.2 5.6 - 9.2
Isoniazid mono-resistance (other) 0.9 0.2 - 1.7 0.5 0 - 1.1 0.8 0.4 - 1.6
Ethambutol resistance 1.7 0.6 - 2.8 2.6 0.8 - 4.5 2.1 1.3 - 3.3
Streptomycin resistance 4.3 2.7 - 6 3.8 1.4 - 6.1 4.4 3.1 - 6.1
Pyrazinamide resistance 2.5 1.4 - 3.5 5.4 2.9 - 8 3.5 2.5 - 4.8
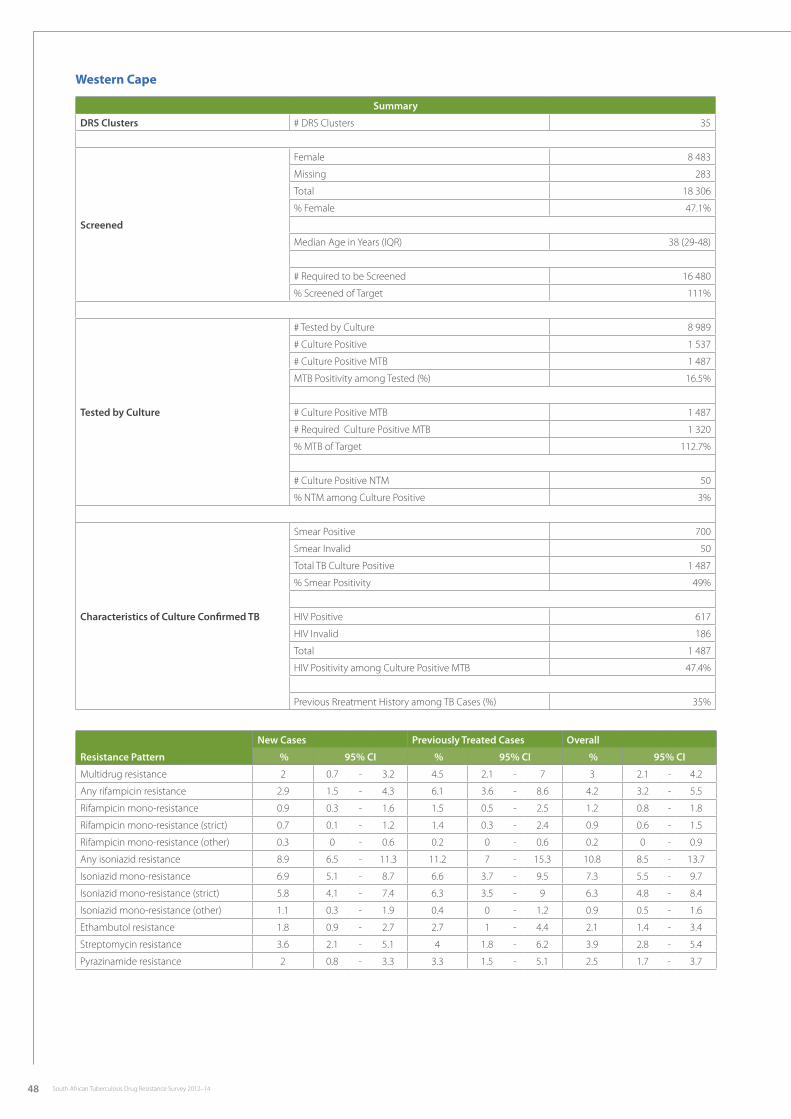
48 South African Tuberculosis Drug Resistance Survey 2012–14
Western Cape
Summary
DRS Clusters # DRS Clusters 35
Screened
Female 8 483
Missing 283
Total 18 306
% Female 47.1%
Median Age in Years (IQR) 38 (29-48)
# Required to be Screened 16 480
% Screened of Target 111%
Tested by Culture
# Tested by Culture 8 989
# Culture Positive 1 537
# Culture Positive MTB 1 487
MTB Positivity among Tested (%) 16.5%
# Culture Positive MTB 1 487
# Required Culture Positive MTB 1 320
% MTB of Target 112.7%
# Culture Positive NTM 50
% NTM among Culture Positive 3%
Characteristics of Culture Confirmed TB
Smear Positive 700
Smear Invalid 50
Total TB Culture Positive 1 487
% Smear Positivity 49%
HIV Positive 617
HIV Invalid 186
Total 1 487
HIV Positivity among Culture Positive MTB 47.4%
Previous Rreatment History among TB Cases (%) 35%
Resistance Pattern
New Cases Previously Treated Cases Overall
% 95% CI % 95% CI % 95% CI
Multidrug resistance 2 0.7 - 3.2 4.5 2.1 - 7 3 2.1 - 4.2
Any rifampicin resistance 2.9 1.5 - 4.3 6.1 3.6 - 8.6 4.2 3.2 - 5.5
Rifampicin mono-resistance 0.9 0.3 - 1.6 1.5 0.5 - 2.5 1.2 0.8 - 1.8
Rifampicin mono-resistance (strict) 0.7 0.1 - 1.2 1.4 0.3 - 2.4 0.9 0.6 - 1.5
Rifampicin mono-resistance (other) 0.3 0 - 0.6 0.2 0 - 0.6 0.2 0 - 0.9
Any isoniazid resistance 8.9 6.5 - 11.3 11.2 7 - 15.3 10.8 8.5 - 13.7
Isoniazid mono-resistance 6.9 5.1 - 8.7 6.6 3.7 - 9.5 7.3 5.5 - 9.7
Isoniazid mono-resistance (strict) 5.8 4.1 - 7.4 6.3 3.5 - 9 6.3 4.8 - 8.4
Isoniazid mono-resistance (other) 1.1 0.3 - 1.9 0.4 0 - 1.2 0.9 0.5 - 1.6
Ethambutol resistance 1.8 0.9 - 2.7 2.7 1 - 4.4 2.1 1.4 - 3.4
Streptomycin resistance 3.6 2.1 - 5.1 4 1.8 - 6.2 3.9 2.8 - 5.4
Pyrazinamide resistance 2 0.8 - 3.3 3.3 1.5 - 5.1 2.5 1.7 - 3.7
49South African Tuberculosis Drug Resistance Survey 2012–14
Steering Committee
Lindiwe Mvusi, Nazir Ahmed Ismail, Chikwe Ihekweazu, Sanni Babatunde, Thabo Molebatsi, Martie van der Walt, Limenako Matsoso, Adeboye Adelekan, Varough Deyde, Shabir Madhi.
Technical Work Group Members
Ananta Nanoo, Andries Dreyer, Shaheed V Omar, Relebohile Ncha, Maanda Mudau, Beki Magazi, Patricia Ntsele.
National and Provincial TB Programme Managers
David Mametja (NDoH), Norbert Ndjeka (NDoH), Sicelo Dlamini (NDoH), Ms Miyakazi Nokwe (EC), Ms Matshidiso Morigihlane and Ms Sonja van der Merwe (FS), Dr Dimakatso Moloi (GP), Ms Jacqui Ngozo (KZN), Dr Harold Hlope (LP), Ms Dudu Mbambo and Dr Andrew Shija (MP), Ms Simangele Ngcombela (NW), Ms Phyllis Baitsiwe (NC), Mr Jimmy Ledwaba and Ms Alvera Swart (WC).
DRS Provincial Co-ordinators
Lifukazi Ngcwangu (EC), Aziza Rangunwala (FS), Danny Lathane (GP), Jovan Dutt (KZN), Dorah Lekalakala (LP), Mbhekiseni Khumalo (MP), Portia Madumo (NC), Moira Mothibi (NW), Phumeza Vazi (WC)
50 South African Tuberculosis Drug Resistance Survey 2012–14
References1. Global TB Report 2015. World Health Organization, 2015. (Accessed 11 April 2016, at http://apps.who.int/iris/bitstream/10665/191102/1/97892
41565059_eng.pdf?ua=1.)
2. Peter JG, Theron G, Singh N, Singh A, Dheda K. Sputum induction to aid diagnosis of smear-negative or sputum-scarce tuberculosis in adults in HIV-endemic settings. European Respiratory Journal 2014;43:185-94.
3. Global TB Report 2014. World Health Organization, 2014. (Accessed 22 January 2016, at http://apps.who.int/iris/bitstream/10665/137094/1/9789241564809_eng.pdf.)
4. WHO Policy Statement: Molecular line probe assays for rapid screening of patients at risk of multidrug-resistant tuberculosis. World Health Organization, 2008. (Accessed 22 January 2016, at http://www.who.int/tb/laboratory/line_probe_assays/en/.)
5. WHO. Xpert MTB/RIF assay for the diagnosis of pulmonary and extrapulmonary TB in adults and children policy update. World Health Organization; 2013.
6. Cox E, Laessig K. FDA Approval of Bedaquiline — The benefit–risk balance for drug-resistant tuberculosis. New England Journal of Medicine 2014;371:689-91.
7. Sirturo (Bedaquiline). European Medicines Agency. (Accessed 15 April 2016, at http://www.ema.europa.eu/ema/index.jsp?curl=pages/medicines/human/medicines/002614/human_med_001730.jsp&mid=WC0b01ac058001d124.)
8. Diacon AH, Pym A, Grobusch MP, et al. Multidrug-resistant tuberculosis and culture conversion with bedaquiline. New England Journal of Medicine 2014;371:723-32.
9. AIDSinfo. Joint United Nations Programme on HIV/AIDS, 2014. (Accessed 22 January 2016, at http://aidsinfo.unaids.org/.)
10. Rapid Mortality Surveillance Report 2014. South African Medical Research Council, 2015. (Accessed 22 January 2016, at http://www.mrc.ac.za/bod/RapidMortalitySurveillanceReport2014.pdf
11. STATSSA. Mortality and causes of death in South Africa 2011: Findings from death notification. Pretoria: Statistics South Africa; 2013.
12. Global TB Report 2009. World Health Organisation, 2010. (Accessed 22 January 2016, at http://reliefweb.int/sites/reliefweb.int/files/resources/F530290AD0279399C12577D8003E9D65-Full_Report.pdf.)
13. Nanoo A, Izu A, Ismail NA, et al. Nationwide and regional incidence of microbiologically confirmed pulmonary tuberculosis in South Africa, 2004-12: A time series analysis. Lancet Infect Dis 2015;15:1066-76.
14. Weyer K, Brand J, Lancaster J, Levin J, Van der Walt M. Determinants of multidrug-resistant tuberculosis in South Africa: Results from a national survey. South African Medical Journal/Suid-Afrikaanse Tydskrif vir Geneeskunde 2007;97:1120-8.
15. Gandhi NR, Moll A, Sturm AW, et al. Extensively drug-resistant tuberculosis as a cause of death in patients co-infected with tuberculosis and HIV in a rural area of South Africa. Lancet (London, England) 2006;368:1575-80.
16. Emergence of XDR-TB. World Health Organisation, 2006. (Accessed 15 April 2016, at http://www.who.int/mediacentre/news/notes/2006/np23/en/.)
17. Marisa K, Robin Mark W, Cindy H, et al. Emergence and spread of extensively and totally drug-resistant tuberculosis, South Africa. Emerging Infectious Disease Journal 2013;19:449.
18. Lim JR, Gandhi NR, Mthiyane T, et al. Incidence and geographic distribution of extensively drug-resistant tuberculosis in KwaZulu-Natal province, South Africa. PloS ONE 2015;10:e0132076.
19. Strategic overview of MDR-TB care in South Africa. 2014. (Accessed 15 April 2016, at http://www.health-e.org.za/wp-content/uploads/2014/03/Strategic_overview_of_MDR_TB_RSA.pdf.)
20. Ndjeka N, Conradie F, Schnippel K, et al. Treatment of drug-resistant tuberculosis with bedaquiline in a high HIV prevalence setting: an interim cohort analysis. The International Journal of Tuberculosis and Lung Disease 15;19:979-85.
21. Koornhof H, Ihekweazu C, Erasmus L, Coetzee G. Update on corporate data warehouse-derived MDR and XDR-TB statistics for eight provinces in South Africa, January 2007 to 30 June 2011. Communicable Disease Surveillance Bulletin 2011;9:68-73.
22. WHO. Antiretroviral therapy coverage: data and estimates by country. World Health Organization, 2013.
23. WHO. Guidelines for surveillance of drug resistance in tuberculosis: World Health Organization, 2015.
51South African Tuberculosis Drug Resistance Survey 2012–14
24. The OraQuick ADVANCE® Rapid HIV-1/2 Antibody Test. Orasure Technologies Inc, 2013. (Accessed 15 April 2016, at http://www.orasure.com/products-infectious/products-infectious-oraquick.asp.)
25. Kubica GP, Dye WE, Cohn ML, Middlebrook G. Sputum digestion and decontamination with N-acetyl-L-cysteine-sodium hydroxide for culture of mycobacteria. Am Rev Respir Dis 1963;87:775-9.
26. GLI. Laboratory diagnosis of TB by smear microscopy: The handbook. Global Laboratory Initiative; 2013.
27. MGIT Procedure Manual for Bactec MGIT 960 TB system. Foundation for Innovative new diagnostics, 2006. (Accessed 3 January 2015, at http://www.finddiagnostics.org/export/sites/default/resource-centre/find_documentation/pdfs/mgit_manual_nov_2007.pdf.)
28. Fisher DG, Reynolds GL, Jaffe A, Johnson ME. Reliability, sensitivity and specificity of self-report of HIV test results. AIDS Care 2007;19:692-6.
29. Talbot EA, Hone NM, Moffat HJ, et al. The validity of HIV testing using sputum from suspected tuberculosis patients, Botswana, 2001. The International Journal of Tuberculosis and Lung Disease 2003;7:710-3.
30. Piwowar-Manning E, Fogel JM, Laeyendecker O, et al. Failure to identify HIV-infected individuals in a clinical trial using a single HIV rapid test for screening. HIV Clinical Trials 2014;15:62-8.
31. Sanchez-Padilla E, Dlamini T, Ascorra A, et al. High prevalence of multidrug-resistant tuberculosis, Swaziland, 2009-2010. Emerging Infectious Diseases 2012;18:29-37.
32. NDoH. The 2012 National Antenatal Sentinel HIV & Herpes Simplex Type-2 Prevalence Survey in South Africa2014.
33. National TB Management Guidelines. National Department of Health, 2014. (Accessed 15 April 2016, at http://www.health-e.org.za/wp-content/uploads/2014/06/NTCP_Adult_TB-Guidelines-27.5.2014.pdf.)
34. Rigouts L, Gumusboga M, de Rijk WB, et al. Rifampin resistance missed in automated liquid culture system for Mycobacterium tuberculosis isolates with specific rpoB mutations. Journal of Clinical Microbiology 2013;51:2641-5.
35. Coovadia YM, Mahomed S, Pillay M, Werner L, Mlisana K. Rifampicin mono-resistance in Mycobacterium tuberculosis in KwaZulu-Natal, South Africa: A significant phenomenon in a high prevalence TB-HIV region. PLoS ONE 2013;8:e77712.
36. Meyssonnier V, Bui TV, Veziris N, Jarlier V, Robert J. Rifampicin mono-resistant tuberculosis in France: A 2005-2010 retrospective cohort analysis. V2014;14:18.
37. Van Ingen J, Aarnoutse RE, Donald PR, et al. Why do we use 600 mg of rifampicin in tuberculosis Treatment? Clinical Infectious Diseases 2011;52:e194-9.
38. Sanders M, Van Deun A, Ntakirutimana D, et al. Rifampicin mono-resistant Mycobacterium tuberculosis in Bujumbura, Burundi: Results of a drug resistance survey. The International Journal of Tuberculosis and Lung Disease 2006;10:178-83.
39. Boeree M, Hoelscher M. High-dose rifampin, SQ109 and moxifloxacin for treating TB: The PanACEA MAMS-TB Trial (Abstract 95LB). Conference on Retroviruses and Opportunistic Infections; 2015; Seattle, USA.
40. Yoshida S, Tsuyuguchi K, Suzuki K, et al. [Molecular epidemiology of rifampicin mono-resistant Mycobacterium tuberculosis]. Kekkaku 2012;87:41-5.
41. Menzies D, Benedetti A, Paydar A, et al. Standardised treatment of active tuberculosis in patients with previous treatment and/or with mono-resistance to isoniazid: A systematic review and meta-analysis. PLoS Medicine 2009;6:e1000150.
42. Varahram M, Nasiri MJ, Farnia P, Mozafari M, Velayati AA. A retrospective analysis of isoniazid-mono-resistant tuberculosis: Among Iranian pulmonary tuberculosis patients. The Open Microbiology Journal 2014;8:1-5.
43. Hoopes AJ, Kammerer JS, Harrington TA, Ijaz K, Armstrong LR. Isoniazid-mono-resistant tuberculosis in the United States, 1993 to 2003. Archives of Internal Medicine 2008;168:1984-92.
44. Sanchez-Padilla E, Dlamini T, Ascorra A, et al. High prevalence of multidrug-resistant tuberculosis, Swaziland, 2009-2010. Emerging Infectious Diseases 2012.
45. Samo Gudo P, Cuna Z, Coelho E, et al. Is multidrug-resistant tuberculosis on the rise in Mozambique? Results of a national drug resistance survey. European Respiratory Journal 2011;38:222-4.
46. Menzies H, Moalosi G, Anisimova V, et al. Increase in anti-tuberculosis drug resistance in Botswana: Results from the fourth National Drug Resistance Survey. The International Journal of Tuberculosis and Lung Disease 2014;18:1026-33.
47. Cattamanchi A, Dantes RB, Metcalfe JZ, et al. Clinical characteristics and treatment outcomes of isoniazid mono-resistant tuberculosis. Clinical Infectious Diseases 2009;48:179-85.
52 South African Tuberculosis Drug Resistance Survey 2012–14
48. Forssbohm M, Loddenkemper R, Rieder HL. Isoniazid resistance among tuberculosis patients by birth cohort in Germany. The International Journal of Tuberculosis and Lung Disease 2003;7:973-9.
49. Hazbón MH, Brimacombe M, Bobadilla del Valle M, et al. Population genetics study of isoniazid resistance mutations and evolution of multidrug-resistant Mycobacterium tuberculosis. Antimicrobial Agents and Chemotherapy 2006;50:2640-9.
50. Lee H, Jeong B-H, Park HY, et al. Treatment outcomes of fluoroquinolone-containing regimens for isoniazid-resistant pulmonary tuberculosis. Antimicrobial Agents and Chemotherapy 2015; Nov 2;60(1):471-7.
51. Guidelines for intensified tuberculosis case-finding and isoniazid preventive therapy for people living with HIV in resource-constrained settings. World Health Organization, 2011. (Accessed 18 April 2016, at http://apps.who.int/iris/bitstream/10665/44472/1/9789241500708_eng.pdf.)
52. Mills HL, Cohen T, Colijn C. Community-wide isoniazid preventive therapy drives drug-resistant tuberculosis: A model-based analysis. Science Translational Medicine 2013;5:180ra49.
53. Wood R. Is IPT a priority for South Africa? SA HIV Clinicians Society; 2014, Cape Town, South Africa.
54. Ford CB, Lin PL, Chase MR, et al. Use of whole genome sequencing to estimate the mutation rate of Mycobacterium tuberculosis during latent infection. Nat Genet 2011;43:482-6.
55. Hu Y, Hoffner S, Jiang W, Wang W, Xu B. Extensive transmission of isoniazid-resistant M. tuberculosis and its association with increased multidrug-resistant TB in two rural counties of eastern China: A molecular epidemiological study. BMC Infectious Diseases 2010;10:1-8.
56. Chedore P, Bertucci L, Wolfe J, Sharma M, Jamieson F. Potential for erroneous results indicating resistance when using the Bactec MGIT 960 System for testing susceptibility of Mycobacterium tuberculosis to pyrazinamide. Journal of Clinical Microbiology 2010;48:300-1.
57. Claassens M, Du Toit E, Dunbar R, et al. Tuberculosis patients in primary care do not start treatment. What role do health system delays play? The International Journal of Tuberculosis and Lung Disease 2013;17:603-7.
58. Dawson R, Diacon AH, Everitt D, et al. Efficiency and safety of the combination of moxifloxacin, pretomanid (PA-824), and pyrazinamide during the first 8 weeks of antituberculosis treatment: A phase 2b, open-label, partly randomised trial in patients with drug-susceptible or drug-resistant pulmonary tuberculosis. The Lancet 385:1738-47.
59. Chang KC, Yew WW, Zhang Y. Pyrazinamide susceptibility testing in Mycobacterium tuberculosis: A systematic review with meta-analyses. Antimicrobial Agents and Chemotherapy 2011;55:4499-505.
60. Zhang Y, Yew WW. Mechanisms of drug resistance in Mycobacterium tuberculosis: Update 2015. The International Journal of Tuberculosis and Lung Disease 2015;19:1276-89.
61. Mphahlele M, Syre H, Valvatne H, et al. Pyrazinamide resistance among South African multidrug-resistant Mycobacterium tuberculosis isolates. Journal of Clinical Microbiology 2008;46:3459-64.
62. Alame-Emane AK, Xu P, Pierre-Audigier C, et al. Pyrazinamide resistance in Mycobacterium tuberculosis arises after rifampicin and fluoroquinolone resistance. The International Journal of Tuberculosis and Lung Disease 2015;19:679-84.
63. Louw G, Warren R, Donald P, et al. Frequency and implications of pyrazinamide resistance in managing previously treated tuberculosis patients. The International Journal of Tuberculosis and Lung Disease 2006;10:802-7.
64. Hoek KG, Schaaf HS, Gey van Pittius N, Van Helden PD, Warren RM. Resistance to pyrazinamide and ethambutol compromises MDR/XDR-TB treatment. SAMJ: South African Medical Journal 2009;99:785-7.
65. Mid-year population estimates 2014. Statistics South Africa, 2015. http://www.statssa.gov.za/publications/P0302/P03022014.pdf.)
66. Ismail N, Said H, Pinini Z, Omar S, Beyers N, Naidoo P. Optimising mycobacterial culture in smear-negative, human immunodeficiency virus-infected tuberculosis cases. PloS ONE 2015;10:e0141851.

viSouth African Tuberculosis Drug Resistance Survey 2012–14
K-12750 [www.kashan.co.za]
NATIONAL INSTITUTE FOR COMMUNICABLE DISEASES
Division of the National Health Laboratory Service
Centre for Tuberculosis
1 Modderfontein RoadSandringham, Johannesburg
Tel: 011 386 6000www.nicd.ac.za