National Non-communicable Diseases Risk Factors Survey ... · National Non-communicable Diseases...
80
Kingdom of Bahrain Ministry of Health National Non-communicable Diseases Risk Factors Survey 2007 Kingdom of Bahrain STEP WISE
Transcript of National Non-communicable Diseases Risk Factors Survey ... · National Non-communicable Diseases...

Kingdom of BahrainMinistry of Health
National Non-communicable DiseasesRisk Factors Survey 2007
Kingdom of Bahrain
STEP
WIS
E

Published by the Ministry of Health,P.O.Box 12, Manama, Kingdom of Bahrain.
© Ministry of Health, 2010
Publications of the Ministry of Health enjoy copyright protection in accordance with the provisions of the protocol of the Universal Copyright Convention. All rights reserved.
The Ministry of Health welcomes requests for permission to reproduce or translate the report, in part or in full. Requests for permission and enquiries should be communicated to the main editor on the following address:
Dr. Jamal AlsayyadChief of Medical Review OfficeMinistry of HealthP.O.Box 12Manama – Kingdom of BahrainTel: +973-17286050Fax: +973-17286651Email: [email protected]
This report is part of the NCD project which was funded by the Ministry of Health mainly through UNDP Country Programme with the Government of Bahrain.
ISBN 978-99958-61-01-8Public Library number 8084/2010 د.ع

National Non-communicableDiseases Risk FactorsSurvey 2007
Edited byDr. Jamal AlsayyadChief of Medical Review OfficeDr. Ahmed OmranMedical Consultant, Medical Review Office
Revised byDr. Fawzi A. AminAssistant Undersecretary for Planning and TrainingProf. Randah HamadehChairperson of Family and Community MedicineArabian Gulf University - College of Medicine and Medical Science
Ministry of Health2010
Kingdom of BahrainMinistry of Health

4 National Non-communicable Diseases Risk Factors Survey 2007
Health Research CommitteeDr. Abdulaziz Y. Hamza (Chairman)
Dr. Fawzi A. Amin (Deputy Chiarman)
Dr. Jamal J. Alsayyad
Prof. Fazel Karim Dar
Prof. Randah Hamadeh
Dr. Shawqi A. Amin
Dr. Qassim Al-Shboul
Dr. Ahmed A. Omran
Dr. Fadheela Almahroos
Dr. Ebtisam E. Fakhro
Dr. Aysha Alshaikh
NCD Survey Technical CommitteeDr. Jamal Alsayyad (Chiarman)
Dr. Ahmed Omran (General Coordinator)
Dr. Qassim Al-Shboul
Dr. Ebtihal Alreefy
Dr. Nahla Madan
Dr. Maha Almoqla
Dr. Maha Altajer
Dr. Majida Hasan
Dr. Sonia Mohammed
Dr. Basim Abbas
Mr. Hasan Albasry
Ms. Layla Al-Nashmi
Mr. Khalifa Mohammed
Mrs. Mariam Al-Manaseer
Mr. Ali Yousif
UNDP CoordinatorsMr. Ali Salman
Mrs. Afnan Saeed

5National Non-communicable Diseases Risk Factors Survey 2007
Chronic non-communicable diseases (NCDs), such as hypertension, cardiovascular diseases and diabetes, pose a major burden and threat to the Bahraini community. Together, these diseases account for more than half of the deaths registered annually, i.e. more than one thousand deaths a year, and many more are living with the agony of one or more of their complications and disabilities.
Having said that however, there is enough evidence on preventability of these diseases, if prompt and effective preventive and curative measures are taken.
On this ground establishing an efficient surveillance system using the step-wise approach to collect information on occurrence, prevalence and morality due to these diseases, and on their known risk factors is of paramount importance for planning and evaluating preventive and curative interventions against them.
This report presents a very important and extensive baseline data on seven major preventable risk factors of NCDs. These are: smoking, obesity, lack of physical activity, hyperlipidaemia poor intake of fruits and vegetables, hypertension and diabetes.
As such, its value as guidance to our fight against those killing diseases extends beyond the health care workers to engage the whole community, both government as well as civic organizations and individuals, in this important battle against ill-health in our kingdom.
Finally, such valuable work and great achievement that is documented in this report would have not been made possible without the sincere and sustainable efforts exerted by all survey team members to translate one of our dreams into reality.
I would, also like to gratefully thank United Nations officers, who actively participated in supporting the Ministry thought out this project.
A word of thanks may not be a sufficient reward for this magnificent achievement, and such
efforts will definitely be highly accredited and appreciated.
Forward
Dr. Faisal Yacob AlhamerMinister of Health
Kingdom of Bahrain

6 National Non-communicable Diseases Risk Factors Survey 2007
Chapter Content Page No
I Introduction 7
II Aim 8
III Objectives 8
IV Subjects and Methods 8
Sample size and Design1. 8
Data collection2. 8
Data cleaning and validation3. 9
Survey management4. 11
V Results 12
Sample size and response1. 13
Socio-demographic characteristic2. 14
Behavioural risk factors3. 17
3.1 Smoking 17
3.2 Nutrition 28
3.3 Physical activity 31
3.4 Physical measurements 37
3.5 Biological measurements 43
VI Appendices 49
Appendix A: Additional Tables of the Survey Results 50
Appendix B: Data Collection Questionnaire 64
Appendix C: Survey Implementation Time frame 77
Table of Contents

7National Non-communicable Diseases Risk Factors Survey 2007
Chronic non-communicable diseases (NCDs) are major causes of morbidity and mortality in
the Kingdom of Bahrain. Every year, one out of every 1000 persons develop cancer and one
out of every 2000 persons die of the disease 1,2. Out of the 2222 total deaths reported in
2005, 434 (19.5%) were due to circulatory system diseases (CSDs), 267 (12%) cancer-related
deaths and 233 (10.5%) endocrine and metabolic disorders, including mainly Diabetes Mellitus.
Together, with fatalities of injuries and poisoning (205 deaths - 9.2%), these disease categories
accounted for half of all deaths reported in that year 2.
Unless tackled and brought under control, such growing NCD burden would result in more
losses of years of life due to death or disability, and could threaten to overwhelm already-
stretched health services and resources. In this respect, primary prevention is the most cost-
effective strategy to contain this emerging epidemic, as it is already known that most of this
burden can be attributed to some key risk factors (namely; Diabetes Mellitus, Hypertension,
Hyperlipidemia, Obesity, Physical inactivity, alcoholism and unhealthy dietary habits) that are
amenable to intervention3.
Surveillance of these risk factors is a key component in the NCD prevention and control
programme, providing information necessary to plan and evaluate the effectiveness of preventive
and control interventions. It involves systematic collection, analysis and interpretation of data
on NCD and these modifiable risk factors.
Earlier community surveys and studies carried out in the Kingdom were based either on self-
reported history of NCD and their risk factors, or used specifically old population. Therefore,
there is a need to establish nation-wide baseline estimates of NCD major risk factors using
standardized methods and laboratory diagnostic tests.
Unlike ad hoc studies or surveys done before, this survey is part of the NCD surveillance
system using the World Health Organization (WHO) Step-wise Approach and instruments for
this purpose, and will be repeated periodically.
Ministry of Health: Bahrain Cancer registry database. Bahrain 2007.1.
Ministry of Health: Health Statistics. Bahrain 2007. 2.
World Health Organization3.
I : Introduction
8 National Non-communicable Diseases Risk Factors Survey 2007
II. AimEstablish and maintain a national database for major NCD risk factors in the kingdom that is
part of NCD prevention and control programme.
Objectives:III. Determine the prevalence of the seven key NCD risk factors in the Kingdom of Bahrain, 1.
namely; smoking, obesity, diabetes mellitus, high blood pressure, high serum lipids,
inadequate fruits and vegetable intake and physical inactivity.
Determine the distribution of these key risk factors across age, gender and geographic 2.
location (governorates).
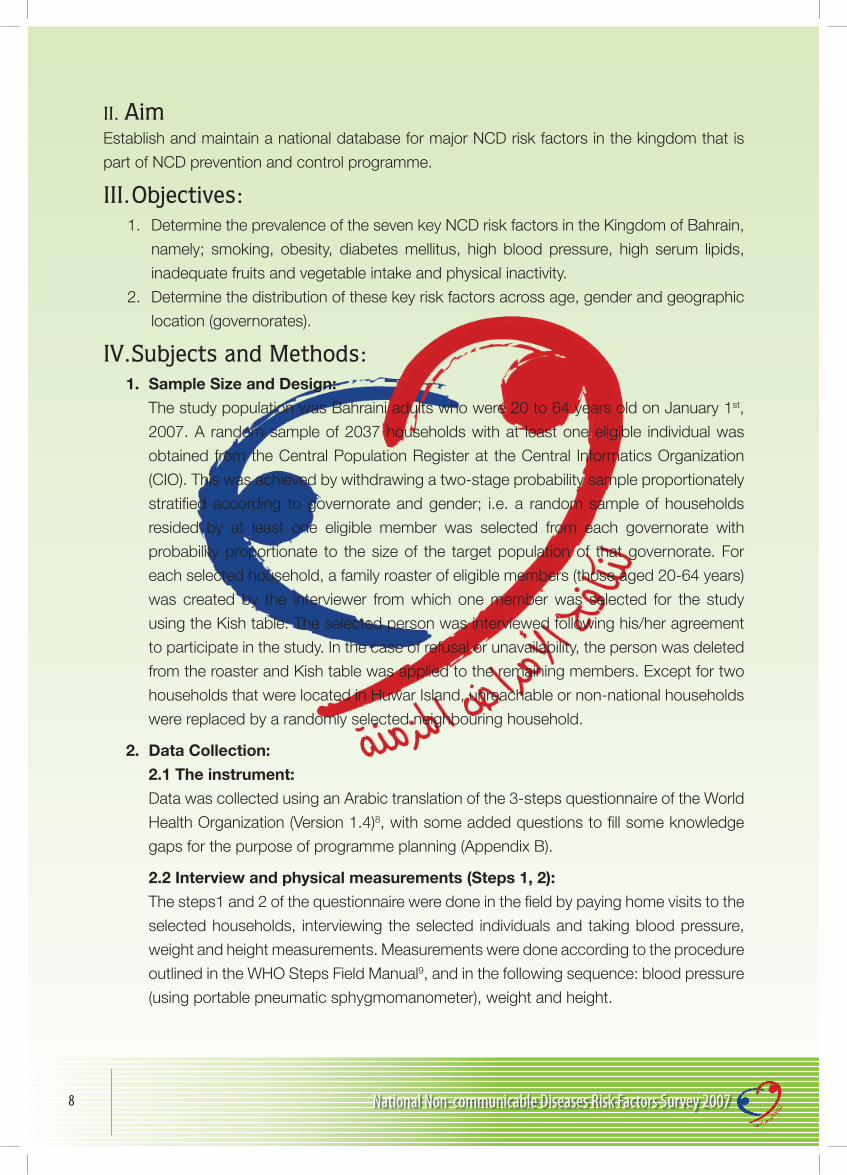
Subjects and Methods:IV. Sample Size and Design:1.
The study population was Bahraini adults who were 20 to 64 years old on January 1st,
2007. A random sample of 2037 households with at least one eligible individual was
obtained from the Central Population Register at the Central Informatics Organization
(CIO). This was achieved by withdrawing a two-stage probability sample proportionately
stratified according to governorate and gender; i.e. a random sample of households
resided by at least one eligible member was selected from each governorate with
probability proportionate to the size of the target population of that governorate. For
each selected household, a family roaster of eligible members (those aged 20-64 years)
was created by the interviewer from which one member was selected for the study
using the Kish table. The selected person was interviewed following his/her agreement
to participate in the study. In the case of refusal or unavailability, the person was deleted
from the roaster and Kish table was applied to the remaining members. Except for two
households that were located in Huwar Island, unreachable or non-national households
were replaced by a randomly selected neighbouring household.
Data Collection:2.
2.1 The instrument:
Data was collected using an Arabic translation of the 3-steps questionnaire of the World
Health Organization (Version 1.4)8, with some added questions to fill some knowledge
gaps for the purpose of programme planning (Appendix B).
2.2 Interview and physical measurements (Steps 1, 2):
The steps1 and 2 of the questionnaire were done in the field by paying home visits to the
selected households, interviewing the selected individuals and taking blood pressure,
weight and height measurements. Measurements were done according to the procedure
outlined in the WHO Steps Field Manual9, and in the following sequence: blood pressure
(using portable pneumatic sphygmomanometer), weight and height.

9National Non-communicable Diseases Risk Factors Survey 2007
2.3 Biochemical measurements (Step three):
Following the household interview, the participants were asked to go to the health centre
at which they were registered, preferably within a week, to proceed with the next step.
The participants were instructed to be fasting for at least 10 hours when they go to health
centre. There, a venous blood sample was collected by a laboratory technician and sent
to the main laboratory at Naim Health Centre for testing the fasting blood glucose, total
serum cholesterol, high-density and low-density lipoproteins, and triglycerides levels
using the wet chemistry technique. Participants whose results showed high readings
were subjected to further confirmatory tests by their General Practitioner to assess their
need for treatment. Those who did not do the tests or those whose laboratory results
have not been received at the survey central office, were traced through the computerized
laboratory system, and results of the requested analyses were recorded for them if they
were done within the survey period or three months prior to it.
Data Cleaning and Validation:3.
The filled questionnaires were checked by the field supervisors, for completeness. The
completed ones were then sent to the governorates’ coordinators for double checking,
coding and cross-item verification. Incomplete or invalid information was reviewed and
verified with the supervisor and the interviewer. The checked questionnaires were then
submitted to the Central Office for data entry, validation and analysis using Microsoft
Access (version 2003) and SPSS (version 15.0).
3.1 Variable verification and classification:
Data entered to the computer database were checked against the data collection form
for each case and corrected accordingly. The data were cleaned further by running
frequency analyses and any odd readings for a variable were rechecked against the
original data in the data collection forms and corrected accordingly. After this, the data
became ready for further classifications.
a) Response: The selected household was visited for three times under different
circumstances until the member was present and interviewed. When the household
member was not available after three visits, or could not be reached (wrong address) he/
she was replaced, by randomly choosing one of the two close households on either side
of the original household. This process was done by the field worker after consulting with
the field supervisor. Households who refused to participate have not been replaced.
b) Age in years: It was calculated from date of birth, if known, or as given by the
respondent. In the second option, the respondent’s answer is checked against the first
two digits of his or her Central Population Register (CPR) number (unique ID number),
which represents the year of birth. Because of presence of year of birth in the person’s
CPR number, there was no missing age data. Respondents’ age was classified into 10-
year classes; 10-29, 30-39, etc., and last class was made 60-64 years.

10 National Non-communicable Diseases Risk Factors Survey 2007
c) Smoking: Participants were classified according to their smoking status into; current
daily, current occasional, ex- and non-smokers. Smokers were classified according to
tobacco types as cigarette (manufactured and hand-rolled), shisha (water pipe) or other
types (cigar or pipe) smokers. For calculation of prevalence rates of each type, the
participant was counted in each type he / she currently smokes or used to smoke.
Age at start of smoking was either directly obtained or derived from the questions on
duration of smoking and date of birth. In case of discrepancy between the two, when
both were present, the one derived from duration and date of birth was recorded. Average
number of cigarettes smoked daily was calculated for daily smokers only.
d) Vegetables and Fruits Intake: Responses were classified into: daily intake, less
than daily intake and no intake.
e) Physical Activity: Physical activity was measured into three situations:
Physical activity at work.•
Physical activity during travelling to and from routine places such as shopping and •
masjid.
Physical activity at leisure time.•
Further, the intensity of physical activity was classified into:
Vigorous-intensity activity: activities such as lifting heavy weights and labour works •
for at least 10 minutes continuously.
Moderate-intensity activity: activities such as fast walking and lifting light weights for •
at least 10 minutes continuously.
Low-intensity activity: those not included in the previous categories.•
f) Obesity: According to WHO definition, Body Mass Index (BMI) readings less than 25
were considered normal or low. Whereas reading between 25 and < 30 were considered
overweight, and readings ≥ 30 as obese. In this classification women who stated they
were pregnant at the time of the interview, were excluded from the analysis.
g) Hypertension: According to the WHO classification for blood pressure measurement,
individuals with systolic blood pressure (SBP) ≥140 mmHg or diastolic blood pressure
(DBP) ≥ 90 mmHg are considered hypertensive. The estimated prevalence of hypertension
was derived by adding up the prevalence of self-reported hypertension and that of
subjects found to have high average reading of systolic or diastolic pressure.
h) Hyperglycaemia & Diabetes: The respondent was considered hyperglycaemic if
his or her fasting blood sugar (FBS) was ≥ 7.0 mmol/L. Fasting blood sugar of > 5.8
and < 7.0 mmol/L was considered impaired FBS. The estimated prevalence of diabetes
was derived by adding up the prevalence of self-reported diabetes and that of newly
discovered hyperglycaemia. For the addition to be done, prevalence of hyperglycaemia
was calculated from the total respondents (not from those who performed the blood

11National Non-communicable Diseases Risk Factors Survey 2007
testing), leaving behind a number of respondents with unknown blood glucose
measurement to raise assumptions about.
Survey Management:4.
4.1 Survey staff:
The survey was organized, managed and conducted through the following committees
and teams; The Health Research committee (11 Members), a technical team (15
members), six governorate coordinators, eight field supervisors, 66 interviewers, one
computer programmer, four data entry staff, four data editors, two secretaries and one
laboratory technician.
4.2 Training and testing the instrument:
Six training workshops were conducted by the head of technical team and the
general coordinator of the survey. All governorate coordinators, field supervisors and
interviewers participated in these workshops in small groups. The training was for four
hours and included the following main modules; general idea about the survey and its’
objectives, survey management process and responsibilities of different categories of
survey staff, method used for the random selection of the household in nuclear families
and interviewees, detail explanation of the content of the questionnaire, interview skills,
anthropometric measurements and methods used to encourage participation. The
theoretical part was followed by practical sessions for conducting interview and taking
anthropometric measurements.
4.3 Implementation plan:
The survey was prepared for and undertaken during the period from January until
December 2007, followed by data cleaning, validation and examination. Data analysis
and publication of draft report extended from September 2008 till May 2009 after which
draft was reviewed and approved by the Ministry’s Health Research Committee and then
sent for printing, in accordance with the plan – Appendix C.

Results

13National Non-communicable Diseases Risk Factors Survey 2007
ResultsV.
Sample Size and Response:1.
Table 1 shows the proportional distribution of the selected study sample in the five
governorates of the Kingdom of Bahrain. Out of the 2037 households randomly selected
for the study, a total of 1769 (86.8%) were reached and participated in the household
interview (Figure 1). The response rate was highest in the Southern Governorate (92.7%)
followed by the Central (91.0%), the Northern (89.2%), Muharraq (84.4%) and Capital
Governorate (72.8%), respectively (Table 2).
Of those responded to the Interview, the response rates for step 2 of the study (valid
readings of body measurements) were 99.5% for blood pressure and 99.0% for weight
and height. For step 3 (laboratory tests) the responses were 62.7% for blood sugar and
63% for cholesterol measurements.
جدول 1: توزيع عينة امل�سح الوطني للأمرا�ض املزمنة ح�سب املحافظة
Table 1: Distribution of the NCD survey sample by governorate
Governorateالعدد
Number % املحافظة
Capital 279 13.7 العا�صمة
Muharraq 352 17.3 املحرق
Northern 665 32.6 ال�صمالية
Central 632 31.0 الو�سطى
Southern 109 5.4 اجلنوبية
Total 2037 100.0 املجموع
�سكل1: ن�سبة اال�ستجابة العامة للمقابلة من العينة املختارة يف امل�سح
Figure1: Overall response rate of the selected study subjects for interview
ParticipatedNot ParticipatedNot Reached
11.90 %
1.30 %
86.80 %

14 National Non-communicable Diseases Risk Factors Survey 2007
جدول2: ن�سبة اال�ستجابة للمقابلة يف املحافظات
Table2: Response rate for interview by governorates
Response
املحافظة
GovernorateTotal االإ�ستجابة
العا�سمة
Capitalاملحرق
Muharraqال�سمالية
Northernالو�سطى
Centralاجلنوبية
Southern
Responded203 297 593 575 101 1769
ا�ستجابوا
72.8% 84.4% 89.2% 91.0% 92.7% 86.8%
Not responded68 42 67 57 8 242
مل ي�ستجيبوا
24.4% 11.9% 10.1% 9.0% 6.4% 11.9%
Not reached8 13 5 0 0 26 مل يتم الو�سول
%2.9اإليهم 3.7% 0.8% 0.0% 0.0% 1.3%
Total279 352 665 632 109 2037
املجموع
100.0% 100.0% 100.0% 100.0% 100.0% 100.0%
Socio-demographic Characteristics:2.
2.1 Age and gender
The proportion of females (51.2%) was slightly higher than males (48.8%), and the
female: male ratio was close to that in the last census (2001).
The highest proportion of the respondents were in the age group 40-49 years (29.7%)
followed respectively by the age groups 30-39 (26.9%), 20-29 (23.8%), 50-59 (16.1%)
and 60-64 years (3.4%) – Table3.
جدول3: امل�ساركون ح�سب الفئة العمرية و اجلن�س
Table3: Participants by age and gender
الفئة العمرية
Age–groupSex-املجموع اجلن�س
TotalMale ذكر Female اأنثى
20 – 29236 185 421
27.3% 20.4% 23.8%
30 – 39215 261 476
24.9% 28.8% 26.9%
40 – 49 252 274 526
29.2% 30.2% 29.7%
50 – 59137 148 285
15.9% 16.3% 16.1%
60 – 6423 38 61
2.7% 4.2% 3.4%
Total املجموع 863 906 1769
100.0% 100.0% 100.0%

15National Non-communicable Diseases Risk Factors Survey 2007
جدول4: امل�ساركون ح�سب املحافظات واجلن�س
Table4: Participants by governorate and gender
GovernorateSex املجموع اجلن�س
Totalاملحافظة
Male ذكر Female اأنثى
Capital 109 94 203
العا�صمة
12.6% 10.4% 11.5%
Muharraq 143 154 297
املحرق
16.6% 17.0% 16.8%
Northern 294 299 593
ال�صمالية
34.1% 33.0% 33.5%
Central 266 309 575
الو�سطى
30.8% 34.2% 32.5%
Southern 51 50 101
اجلنوبية
5.9% 5.5% 5.7%
Total863 906 1769
املجموع100.0% 100.0% 100.0%
2.2 Marital status
Seventy-one percent of the respondents were married, and around 23% were single.
The remaining 6% were divorced, widowed or separated – Table 5.
جدول5: امل�ساركون ح�سب احلالة االجتماعية و اجلن�س
Table 5: Participants by marital status and gender
Marital StatusSex املجموع اجلن�س
Totalاحلالة االجتماعية
Male ذكر Female اأنثى
Single 233 166 399
اأعزب
27.0% 18.3% 22.6%
Married 609 650 1259
متزوج
70.6% 71.7% 71.2%
Divorced 19 39 58
مطلق
2.2% 4.3% 3.3%
Widow 1 46 47
اأرمل
0.1% 5.1% 2.7%
Separated 1 5 6
منف�سل
0.1% 0.6% 0.3%
Total863 906 1769
املجموع100.0% 100.0% 100.0%

16 National Non-communicable Diseases Risk Factors Survey 2007
2.3 Education and employment:
The majority of study participants (72.6%) had a secondary school educational level
or lower and 27.4% had diploma or more (26.3% for males and 28.5% for females,
respectively) – Table 6.
جدول6: امل�ساركون ح�سب اأعلى م�ستوى تعليمي واجلن�س
Table 6: Participants by highest education and gender
Highest Education Completed
Sex املجموع اجلن�سTotal
اأعلى م�ستوى تعليميMale ذكر Female اأنثى
Illiterate 11 92 103
اأمي
1.3% 10.2% 5.8%
Read and Write 25 52 77
يجيد القراءة والكتابة
2.9% 5.7% 4.4%
Primary 81 82 163
ابتدائي
9.4% 9.1% 9.2%
Intermediate 145 108 253
(اإعدادي( متو�سط
16.8% 11.9% 14.3%
Secondary 374 314 688
ثانوي
43.3% 34.7% 38.9%
Diploma or Associate Degree
122 109 231دبلوم اأو دبلوم م�سارك
14.1% 12.0% 13.1%
Bachelor Degree 79 131 210
�سهادة البكالريو�س
9.2% 14.5% 11.9%
Post-graduate Degree26 18 44
�سهادة درا�سات عليا
3.0% 2.0% 2.5%
Total863 906 1769
املجموع100.0% 100.0% 100.0%
2.4 Employment
Of all participants, 1018 (57.5%) were employees with various sectors, contract terms
and payment schemes. Male participants were predominantly government employees
(41.3%) while females were predominantly housewives (54.4%). Overall unemployment
was 5.9% and was nearly equal for males (5.9%) and Females (6.0%) – Table 7.

17National Non-communicable Diseases Risk Factors Survey 2007
جدول7: امل�ساركون ح�سب القطاع املهني واجلن�س
Table7: Participants by working field and sex
Work sectorSex املجموع اجلن�س
Total قطاع العمل
Male ذكر Female اأنثى
Government employee356 155 511
موظف حكومي
41.3% 17.1% 28.9%
Private sector employee300 115 415
موظف قطاع خا�س
34.8% 12.7% 23.5%
Business man74 10 84
رجل اأعمال
8.6% 1.1% 4.7%
Unpaid voluntary work0 5 5
عامل يف املجال التطوعي )بدون اأجر(
0.0% 0.6% 0.3%
Part-time paid job2 1 3
عمل جزئي باأجر
0.2% 0.1% 0.2%
Student35 59 94
طالب
4.1% 6.5% 5.3%
House wife0 493 493
ربة بيت
0.0% 54.4% 27.9%
Retired45 14 59
متقاعد
5.2% 1.5% 3.3%
Unemployed-Capable45 49 94
عاطل غري عاجز عن العمل
5.2% 5.4% 5.3%
Unemployed-Incapable6 5 11
عاطل عاجز عن العمل
0.7% 0.6% 0.6%
Total863 906 1769
املجموع
100.0% 100.0% 100.0%
Behavioural Risk Factors3.
3.1 Smoking
a) Smoking any type of tobacco:
There were 352 current tobacco smokers among the study participants, yielding an
overall prevalence of 19.9%. Of those, 316 (17.9%) were current daily smokers -Figure
2. The prevalence rates of the different types of tobacco use were, 13.8% (244) for
cigarettes, 8.4% (149) for shisha and 0.9% (16) for other types -Figure 3.

18 National Non-communicable Diseases Risk Factors Survey 2007
�سكل 2: معدالت انت�سار تدخني التبغ بجميع اأنواعه ح�سب منط تكرار االإ�ستخدام
Figure 2: Prevalence of tobacco smoking according to usage frequency pattern
�سكل 3: معدالت انت�سار تدخني االأنواع املختلفة من التبغ
Figure 3: Prevalence of smoking different types of tobacco
The Prevalence rate of tobacco smoking among males was 33.4% compared to 7.01%
among females. Current daily smoking rates among them were 30.6% and 5.7%
respectively. The combined ex-smoking rate was 9.6% and it was markedly higher
among males (15.3%) compared to females (4.1%) - Table 8. Of the participants, 16.8%
smoked one type of tobacco only (cigarettes, shisha, or cigar-pipe), and only 4.1%
smoked more than one type of tobacco – Figure 4.
Never Smoker 70.5%
Daily Tobacco Smoker 17.9%
Non-Daily Tobacco Smoker 2.0%
Ex- Smoker 9.6%
19.9 %
Cigarettes Shisha Other Tobacco Any Type
0.9 %
8.4 %
13.8 %
25 %
20 %
15 %
10 %
5 %
0 %

19National Non-communicable Diseases Risk Factors Survey 2007
جدول 8 : ن�سبة انت�سار تدخني التبغ بني امل�ساركني ح�سب منط تكرار االإ�ستخدام واجلن�س
Table 8: Prevalence of tobacco smoking by frequency and gender
اجلن�س
Sex
تدخني التبغ منط تكرار
Tobacco smoking frequency املجموع
Totalمدخن يومي
Daily smokerمدخن غري يومي
Non-daily smokerمقلع عن التدخني
Ex-smokerمل يدخن قط
Never smoker
Male ذكر 264 24 132 443 863
30.6% 2.8% 15.3% 51.3% 100.0%
Female اأنثى 52 12 37 805 906
5.7% 1.3% 4.1% 88.9% 100.0%
Total املجموع 316 36 169 1248 1769
17.9% 2.0% 9.6% 70.5% 100.0%
�سكل 4: ن�سبة انت�سار تدخني نوع واحد اأو اأكرث من التبغ
Figure 4: Prevalence of smoking of single and combined tobacco types
جدول 9: ن�سبة انت�سار تدخني التبغ بني امل�ساركني ح�سب منط تكرار االإ�ستخدام والفئة العمرية
Table 9: Prevalence of tobacco smoking by frequency and age
الفئة العمرية
Age – Group
منط تكرار تدخني التبغ
Tobacco smoking frequency املجموع
Totalمدخن يومي
Daily smokerمدخن غري يومي
Non-daily smokerمقلع عن التدخني
Ex-smokerمل يدخن قط
Never smoker
20 -2992 11 27 291 421
21.9% 2.6% 6.4% 69.1% 100.0%
30 – 3982 12 39 343 476
17.2% 2.5% 8.2% 72.1% 100.0%
40 – 4979 5 57 385 526
15.0% 1.0% 10.8% 73.2% 100.0%
50 – 59 51 8 34 192 285
17.9% 2.8% 11.9% 67.4% 100.0%
60 – 6412 0 12 37 61
19.7% 0.0% 19.7% 60.7% 100.0%
Total املجموع 316 36 169 1248 1769
17.9% 2.0% 9.6% 70.5% 100.0%
Non-smokers 80.1 %
Shisha only 5.3 %
Cigar - pipe only 0.8 %
Cigarette & Shisha 3.1 %
All three types 0.11 %
Cigarette only 10.7 %

20 National Non-communicable Diseases Risk Factors Survey 2007
جدول10: ن�سبة انت�سار تدخني التبغ بني امل�ساركني ح�سب منط تكرار االإ�ستخدام واملحافظات
Table 10: Prevalence of tobacco smoking by frequency and governorate
Governorate
منط تكرار تدخني التبغ
Tobacco smoking frequency املجموع
Total املحافظةمدخن يومي
Daily smokerمدخن غري يومي
Non-daily smokerمقلع عن التدخني
Ex-smokerمل يدخن قط
Never smoker
Capital43 2 23 135 203
العا�صمة
21.2% 1.0% 11.3% 66.5% 100.0%
Muharraq50 12 28 207 297
املحرق
16.8% 4.0% 9.4% 69.7% 100.0%
Northern92 5 49 447 593
ال�صمالية
15.5% 0.8% 8.3% 75.4% 100.0%
Central104 16 60 395 575
الو�سطى
18.1% 2.8% 10.4% 68.7% 100.0%
Southern27 1 9 64 101
اجلنوبية
26.7% 1.0% 8.9% 63.4% 100.0%
Total316 36 169 1248 1769
املجموع
17.9% 2.0% 9.6% 70.5% 100.0%
b) Cigarettes smoking
Prevalence rates(1)
The overall prevalence of smoking cigarettes (manufactured or hand-rolled) was 13.8%.
Figure 5 shows that the prevalence among males was twenty-two folds that among
female participants (27% compared to 1.2%). One of the possible explanations of the
low prevalence of smoking among females might be the social and cultural barriers
that consider female smoking unacceptable and thus make females unwilling to admit
that they are smokers. The study also revealed that the prevalence is highest in the age
group 20-29 years (19.1%) followed by the age group 30-39 years (14.5%), while in the
older age groups it was almost similar (10.5-11.6%) – Table 11.
�سكل 5: ن�سبة تدخني ال�سجائر ح�سب منط تكراراالإ�ستخدام واجلن�س
Figure 5: Cigarettes smoking by frequency and sex
59.2 % 1.0 %
13.8 %
26.0 %
Males
1.2 %1.2 %
97.6 %
Females
Daily smokers
Ex-smokers
Non-daily smokers
Non-smokers
0.0 %

21National Non-communicable Diseases Risk Factors Survey 2007
جدول 11: ن�سبة تدخني ال�سجائر ح�سب منط تكرار االإ�ستخدام والفئة العمرية
Table 11: Prevalence of cigarette smoking by frequency and age
الفئة العمرية
Age–group
منط تكرار تدخني ال�سجائر
Cigarette smoking frequency املجموع
Totalمدخن يومي
Daily smokerمدخن غري يومي
Non-daily smokerمقلع عن التدخني
Ex-smokerمل يدخن قط
Never smoker
20 -2976 4 23 318 421
18.1% 1.0% 5.5% 75.5% 100.0%
30 – 3967 2 31 376 476
14.1% 0.4% 6.5% 79.0% 100.0%
40 – 4954 1 44 427 526
10.3% 0.2% 8.4% 81.2% 100.0%
50 – 59 31 2 24 228 285
10.9% 0.7% 8.4% 80.0% 100.0%
60 – 647 0 8 46 61
11.5% 0.0% 13.1% 75.4% 100.0%
Total املجموع 235 9 130 1395 1769
13.3% 0.5% 7.3% 78.9% 100.0%
It was also noticed that the prevalence of cigarette smoking was highest in the age
group 20-29 years (32.6%) for males, and in the age of 50 years and above among
females – Table A3 (appendix A).
The prevalence of cigarette smoking was highest in the Southern Governorate (23.8%)
and lowest in the Northern Governorate (9.9%) – Table 12. Interestingly, all cigarette
smokers in the Southern Governorate were males who constituted 47.1% of all men there.
On the other hand, the prevalence among females was highest in Central Governorate
(2.3%) followed by Capital Governorate (2.1%) – Table A4 (appendix A).
جدول 12: ن�سبة تدخني ال�سجائر ح�سب منط تكرار االإ�ستخدام واملحافظة
Table 12: Prevalence of cigarette smoking by frequency and governorate
Governorate
منط تكرار تدخني ال�سجائر
Cigarette smoking frequencyاملجموع
Total املحافظة
مدخن يومي
Daily smokerمدخن غري يومي
Non-daily smokerمقلع عن التدخني
Ex-smokerغري مدخن
Never Smoker
Capital33 0 16 154 203
العا�صمة
16.3% 0.0% 7.9% 75.9% 100.0%
Muharraq38 4 29 226 297
املحرق
12.8% 1.3% 9.8% 76.1% 100.0%
Northern59 0 30 504 593
ال�صمالية
9.9% 0.0% 5.1% 85.0% 100.0%
Central82 4 43 446 575
الو�سطى
14.3% 0.7% 7.5% 77.6% 100.0%
Southern23 1 12 65 101
اجلنوبية
22.8% 1.0% 11.9% 64.4% 100.0%
Total 235 9 130 1395 1769
املجموع13.3% 0.5% 7.3% 78.9% 100.0%

22 National Non-communicable Diseases Risk Factors Survey 2007
Average age at start of smoking cigarette(2)
جدول 13: متو�سط العمر عند بداية تدخني ال�سجائر ح�سب جن�س امل�سارك
Table 13: Average age at start smoking cigarettes by gender
اجلن�س
Sexالعدد
Numberاملتو�سط
Meanاالإنحراف املعياري
Std. deviationاحلد االأو�سط
Medianاحلد االأدنى
Minimumاحلد االأق�سى
Maximum
Male 229 ذكر 18.4 5.2 18.0 10.0 46.0
Female 11 اأنثى 21.9 5.4 22.0 10.0 30.0
Total 240 املجموع 18.6 5.3 18.0 10.0 46.0
جدول14: متو�سط العمر عند بداية التدخني ح�سب الفئة العمرية للم�سارك
Table 14: Average age at start smoking cigarettes by age-group
الفئة العمرية
age-groupالعدد
Numberاملتو�سط
Meanاالإنحراف املعياري
Std. deviation احلد االأو�سط
Medianاحلد االأدنى
Minimumاحلد االأق�سى
Maximum
20 – 29 79 17.5 3.6 17.0 10.0 26.0
30 – 39 69 17.8 4.6 17.0 10.0 28.0
40 – 49 53 20.1 6.0 20.0 10.0 40.0
50 – 59 33 20.8 7.7 20.0 12.0 46.0
60 – 64 6 18.2 3.9 18.0 13.0 25.0
Total 240 املجموع 18.6 5.3 18.0 10.0 46.0
جدول 15: متو�سط العمر عند بداية التدخني ح�سب املحافظات
Table 15: Average age at start smoking cigarettes by governorate
Governorateالعدد
Numberاملتو�سط
MeanStd. deviation
احلد االأو�سط
Medianاحلد االأدنى
Minimumاحلد االأق�سى
Maximumاملحافظة
Capital 32 18.2 4.4 18.0 10.0 26.00 العا�صمة
Muharraq 40 19.7 6.8 18.5 11.0 46.00 املحرق
Northern 58 17.3 4.8 16.0 10.0 30.00 ال�صمالية
Central 86 19.2 5.0 18.0 10.0 40.00 الو�سطى
Southern 24 18.3 5.1 18.5 10.0 35.00 اجلنوبية
Total 240 18.6 5.3 18.0 10.0 46.00 املجموع
Daily consumption of cigarettes (3)
جدول 16: معدل اال�ستهالك اليومي لل�سجائر ح�سب جن�س املدخنني املنتظمني
Table 16: Daily average number of cigarettes consumed by daily smokers according to gender
Sex اجلن�سالعدد
Numberاملتو�سط
Meanاالإنحراف املعياري
Std. deviation احلد االأدنى
Minimum احلد االأق�سى
Maximum
Male 224 ذكر 19.35 12.5 1 80
Female 11 اأنثى 10.18 7.2 1 20
Total 235 املجموع 18.92 12.5 1 80

23National Non-communicable Diseases Risk Factors Survey 2007
جدول 17: معدل اال�ستهالك اليومي لل�سجائر ح�سب الفئة العمرية للمدخنني املنتظمني
Table 17: Daily average number of cigarettes consumed by daily smokers in different age-groups
الفئة العمرية
Age-groupالعدد
Numberاملتو�سط
Meanاالإنحراف املعياري
Std. deviation احلد االأدنى
Minimum احلد االأق�سى
Maximum
20 – 29 76 16.87 9.8 1 40
30 – 39 67 19.52 12.5 1 60
40 – 49 54 19.52 13.3 1 60
50 – 59 31 20.35 16.1 1 80
60 – 64 7 24.57 13.9 12 48
Total 235 املجموع 18.92 12.5 1 80
جدول 18 : معدل اال�ستهالك اليومي لل�سجائر ح�سب املحافظات
Table 18: Daily average number of cigarettes consumed by daily smokers in governorates
Governorateالعدد
Numberاملتو�سط
Meanاالإنحراف املعياري
Std. deviation احلد االأدنى
Minimum احلد االأق�سى
Maximumاملحافظة
Capital 33 20.24 16.3 1 60 العا�صمة
Muharraq 38 19.13 12.1 1 60 املحرق
Northern 59 18.78 10 1 50 ال�صمالية
Central 82 17.15 10.3 1 40 الو�سطى
Southern 23 23.39 18.6 1 80 اجلنوبية
Total 235 18.92 12.5 1 80 املجموع
Categories of daily amount of smoking cigarettes(4)
جدول 19 : توزيع مدخنني ال�سجائر املنتظمني ح�سب فئة االإ�ستهالك اليومي واجلن�س
Table 19: Daily cigarette smokers by number of smoked cigarettes and sex
اجلن�س
Sex
فئة ا�ستهالك ال�سجائر
Cigarette smoking amount categoryاملجموع
Total 10 �سجائر اأو اأقل
Up to 10 cigarettesمن 20-11 �سيجارة
11-20 cigarettes من 30-21 �سيجارة
21-30 cigarettesمن 40-31 �سيجارة
31-40 cigarettesاأكرث من 40 �سيجارة
>40 cigarettes
Male ذكر
67 104 23 23 7 224
29.9% 46.4% 10.3% 10.3% 3.1% 100.0%
Female اأنثى
7 4 0 0 0 11
63.6% 36.4% 0.0% 0.0% 0.0% 100.0%
Total املجموع74 108 23 23 7 235
31.5% 46.0% 9.8% 9.8% 3.0% 100.0%

24 National Non-communicable Diseases Risk Factors Survey 2007
جدول 20: توزيع مدخنني ال�سجائر املنتظمني ح�سب فئة االإ�ستهالك اليومي والفئة العمرية
Table 20: Daily cigarette smokers by number of smoked cigarettes and age
Cigarette smoking amount category
الفئة العمرية
Age group Total فئة ا�ستهالك ال�سجائر
20-29 30-39 40-49 50-59 60-64
Up to 10 cigarettes29 16 20 9 0 74
10 �سجائر اأو اأقل38.2% 23.9% 37.0% 29.0% 0.0% 31.5%
11-20 cigarettes33 35 22 13 5 108
من 20-11 �سيجارة
43.4% 52.2% 40.7% 41.9% 71.4% 46.0%
21-30 cigarettes8 7 4 4 0 23
من 30-21 �سيجارة
10.5% 10.4% 7.4% 12.9% 0.0% 9.8%
31-40 cigarettes6 7 5 4 1 23
من 40-31 �سيجارة
7.9% 10.4% 9.3% 12.9% 14.3% 9.8%
>40 cigarettes0 2 3 1 1 7
اأكرث من 40 �سيجارة
0.0% 3.0% 5.6% 3.2% 14.3% 3.0%
Total76 67 54 31 7 235
املجموع100.0% 100.0% 100.0% 100.0% 100.0% 100.0%
جدول 21: توزيع مدخنني ال�سجائر املنتظمني ح�سب فئة االإ�ستهالك اليومي واملحافظات
Table 21: Daily cigarette smokers by number of smoked cigarettes and governorate
Cigarette smoking amount category
املحافظة
Governorate املجموع
Totalفئة ا�ستهالك ال�سجائر
العا�سمة
Capitalاملحرق
Muharraqال�سمالية
Northernالو�سطى
Centralاجلنوبية
Southern
Up to 10 cigarettes10 12 16 30 6 74
10 �سجائر اأو اأقل30.3% 31.6% 27.1% 36.6% 26.1% 31.5%
11-20 cigarettes13 18 30 37 10 108
من 20-11 �سيجارة
39.4% 47.4% 50.8% 45.1% 43.5% 46.0%
21-30 cigarettes3 4 7 7 2 23
من 30-21 �سيجارة9.1% 10.5% 11.9% 8.5% 8.7% 9.8%
31-40 cigarettes4 3 5 8 3 23
من 40-31 �سيجارة
12.1% 7.9% 8.5% 9.8% 13.0% 9.8%
>40 cigarettes3 1 1 0 2 7
اأكرث من 40 �سيجارة
9.1% 2.6% 1.7% 0.0% 8.7% 3.0%
Total33 38 59 82 23 235
املجموع100.0% 100.0% 100.0% 100.0% 100.0% 100.0%
c) Shisha smoking
The overall prevalence of shisha smoking was 8.4%, and was highest in the age group 20-29 (12.4%), followed by the age group 60-64 (9.8%) - Table22. The sex-specific shisha smoking prevalence rate was 10.8% among males compared to 6.2% among females - Figure 6. The prevalence was highest among the youngest males in the age group 20-29 (17.8%). On the other hand, among females it was highest in the older age groups of 50-64 (11.5-13.2%) - Table A5 (appendix A).
The prevalence of shisha smoking was highest in the Capital (10.8%) and lowest in the Northern Governorate (6.7%) –Table 25. The prevalence among males was highest in the Southern Governorate (17.6%), and lowest in the Northern Governorate (7.8%). On the other hand, the prevalence among females was highest in the Capital governorate (8.5%), and lowest in the Southern Governorate (2.0%) Table A6 (appendix A).

25National Non-communicable Diseases Risk Factors Survey 2007
�سكل6 : ن�سبة انت�سار تدخني ال�سي�سة بني امل�ساركني ح�سب اجلن�س
Figure 6: Prevalence of currently Smoking shisha/water-pipe by sex
جدول 22: ن�سبة تدخني ال�سي�سة بني امل�ساركني ح�سب الفئة العمرية
Table 22: Prevalence of currently smoking shisha by age
الفئة العمرية
Age-group
ن�سبة تدخني ال�سي�سة
Current shisha smoking املجموع
TotalYes نعم No ال
20 - 2952 369 421
12.4% 87.6% 100.0%
30 - 3933 443 476
6.9% 93.1% 100.0%
40 - 4932 494 526
6.1% 93.9% 100.0%
50 - 5926 259 285
9.1% 90.9% 100.0%
60 - 64 6 55 61
9.8% 90.2% 100.0%
Total املجموع 149 1620 1769
8.4% 91.6% 100.0%
جدول 23 ن�سبة تدخني ال�سي�سة بني امل�ساركني ح�سب منط تكرار التدخني واجلن�س
Table 23: prevalence of shisha smoking by smoking frequency and sex
اجلن�س
Sex
منط تكرار تدخني ال�سي�سة
Shisha smoking frequency املجموع
Totalمدخن يومي
Daily smokerمدخن غري يومي
Non -daily smokerمقلع عن التدخني
Ex-smokerغري مدخن
Never smoker
Male ذكر 40 53 92 678 863
4.6% 6.1% 10.7% 78.6% 100.0%
Female اأنثى 41 15 31 819 906
4.5% 1.7% 3.4% 90.4% 100.0%
Total املجموع 81 68 123 1497 1769
4.6% 3.8% 7.0% 84.6% 100.0%
100.0%
90.0%
80.0%
70.0%
60.0%
50.0%
40.0%
30.0%
20.0%
10.0%
0.0%
No89.2%
Yes
10.8%
Male
No93.8%
Yes6.2%
Female

26 National Non-communicable Diseases Risk Factors Survey 2007
جدول 24: ن�سبة تدخني ال�سي�سة بني امل�ساركني ح�سب تكرار التدخني والفئة العمرية
Table 24: prevalence of shisha smoking by smoking frequency and age
الفئة العمرية
Age-group
منط تكرار تدخني ال�سي�سة
Shisha smoking frequency املجموع
Totalمدخن يومي
Daily smokerمدخن غري يومي
Non- daily smokerمقلع عن التدخني
Ex-smokerغري مدخن
Non-smoker
20 -2921 31 40 329 421
5.0% 7.4% 9.5% 78.1% 100.0%
30 - 3914 19 37 406 476
2.9% 4.0% 7.8% 85.3% 100.0%
40 - 4923 9 23 471 526
4.4% 1.7% 4.4% 89.5% 100.0%
50 - 59 18 8 18 241 285
6.3% 2.8% 6.3% 84.6% 100.0%
60 - 645 1 5 50 61
8.2% 1.6% 8.2% 82.0% 100.0%
Total املجموع 81 68 123 1497 1769
4.6% 3.8% 7.0% 84.6% 100.0%
جدول 25: ن�سبة تدخني ال�سي�سة بني امل�ساركني ح�سب منط تكرار التدخني واملحافظة
Table 25: prevalence of shisha smoking by smoking frequency and governorate
Governorate
منط تكرار تدخني ال�سي�سة
Shisha smoking frequencyاملجموع
Totalاملحافظة
مدخن يومي
Daily smokerمدخن غري يومي
Non- daily smokerمقلع عن التدخني
Ex-smokerغري مدخن
Non-smoker
Capital14 8 15 166 203
العا�صمة
6.9% 3.9% 7.4% 81.8% 100.0%
Muharraq15 13 12 257 297
املحرق
5.1% 4.4% 4.0% 86.5% 100.0%
Northern24 16 34 519 593
ال�صمالية
4.0% 2.7% 5.7% 87.5% 100.0%
Central24 25 53 473 575
الو�سطى
4.2% 4.3% 9.2% 82.3% 100.0%
Southern4 6 9 82 101
اجلنوبية
4.0% 5.9% 8.9% 81.2% 100.0%
Total81 68 123 1497 1769
املجموع4.6% 3.8% 7.0% 84.6% 100.0%

27National Non-communicable Diseases Risk Factors Survey 2007
d) Cigar & Pipe Smoking Status
�سكل 7: ن�سبة انت�سار تدخني ال�سيجار / البايب ح�سب منط تكرار التدخني
Figure 7: Prevalence of cigar or pipe smoking by frequency
جدول 26: ن�سبة انت�سار تدخني ال�سيجار / البايب ح�سب منط تكرار التدخني والفئة العمرية للم�سارك
Table 26: prevalence of cigar or pipe smoking by frequency and age
املجموع
Total
منط تكرار تدخني ال�سيجار / البايب
cigar / pipe smoking frequencyالفئة العمرية
Age-group غري مدخن
Never smokerمقلع عن التدخني
Ex-smokerمدخن ب�سكل غري يومي
Non-daily smokerمدخن ب�سكل يومي
Daily smoker
42141340420-29
100.0%98.1%1.0%0.0%1.0%
47646750430-39
100.0%98.1%1.1%0.0%0.8%
52651191540-49
100.0%97.1%1.7%0.2%1.0%
28528030250-59
100.0%98.2%1.1%0.0%0.7%
615920060-64
100.0%96.7%3.3%0.0%0.0%
1769173023115Total املجموع
100.0%97.8%1.3%0.1%0.8%
جدول 27: ن�سبة انت�سار تدخني ال�سيجار / البايب ح�سب منط تكرار التدخني وجن�س امل�سارك
Table 27: Prevalence of cigar or pipe smoking by frequency and sex
اجلن�س
Sex
منط تكرار تدخني ال�سيجار / البايب
Smoking cigar / pipe frequencyاملجموع
Totalمدخن ب�سكل يومي
Daily smokerمدخن ب�سكل غري يومي
Non-daily smokerمقلع عن التدخني
Ex-smokerغري مدخن
Never smoker
Male ذكر 14 1 21 827 863
1.6% 0.1% 2.4% 95.8% 100.0%
Female اأنثى 1 0 2 903 906
0.1% 0.0% 0.2% 99.7% 100.0%
Total املجموع 15 1 23 1730 1769
0.8% 0.1% 1.3% 97.8% 100.0%
Daily smokers 0.8 % Ex-smokers 1.3 %
Non-daily smokers 0.1 %
Never cigar or pipe smokers 97.8%

28 National Non-communicable Diseases Risk Factors Survey 2007
جدول 28: ن�سبة انت�سار تدخني ال�سيجار / البايب ح�سب منط تكرار التدخني واملحافظات
Table 28: Prevalence of cigar or pipe smoking by frequency and governorate
Governorate
منط تدخني ال�سيجار / البايب
Smoking cigar / pipe frequency املجموع
Totalمدخن ب�سكل يومي
Daily smokerمدخن ب�سكل غري يومي
Non-daily smokerمقلع عن التدخني
Ex-smokerغري مدخن
smoker Never
Capital1 0 5 197 203
0.5% 0.0% 2.5% 97.0% 100.0%
Muharraq0 0 3 294 297
0.0% 0.0% 1.0% 99.0% 100.0%
Northern13 0 11 569 593
2.2% 0.0% 1.9% 96.0% 100.0%
Central1 1 3 570 575
0.2% 0.2% 0.5% 99.1% 100.0%
Southern0 0 1 100 101
0.0% 0.0% 1.0% 99.0% 100.0%
Total 15 1 23 1730 1769
0.8% 0.1% 1.3% 97.8% 100.0%
3.2 Nutrition
a) Fruits and vegetables consumption
Respondents were asked about the number of days per week and the average number
of servings each day they usually consume fruits or vegetables. Only 5.5% of the
respondents did not take fruits and 5.0% did not take vegetables at all. The daily intake
of vegetables among respondents was higher than the daily intake of fruits (62.0% and
49.6%, respectively) – Figures 8. The intake pattern was not known in 7 (0.4%) subjects
for fruits and in 1 (0.1%) for vegetables.
�سكل 8: منط ا�ستهالك امل�ساركني للفاهكة واخل�سروات
Figure: 8 Participants consumption of fruits and vegetables
Do not take5.5 %
Daily intake49.6 %
Less than 7 days a week44.5 %
Do not take5.0 %
Daily intake62.9 %
Less than 7 days a week32.0 %
VegetalbelsFruits

29National Non-communicable Diseases Risk Factors Survey 2007
b) Other dietary habits:
Dieting was practiced by 15.7% of participants – Table 29, and only 2.7% of them have
always used sweeteners instead of sugar – Table 30. Majority of participants (66.8%)
were consuming soft drinks, and only 8.3% consumed the low-calorie type (diet) – Table
31. Most of participants used vegetable oil for cooking (97.2%) – Table 32, and 67.7%
used olive oil to various extents – Table 33.جدول 29 : اأنواع احلمية التي يتبعها امل�ساركون
Table 29: Types of dieting practiced by participants
Type of dietingالعدد Number%نوع احلمية
84.31492Don't follow any typeال يتبع اأي نوع
0.24Medicinesعقاقري
0.35Herbsاأع�صاب
14.1250Diet controlحمية غذائية
0.815More than one typeاأكرث من نوع
0.23Unknownغري معروف
100.01769Totalاملجموع
جدول 30 : منط تناول املواد املحلية )بدائل ال�سكر( بني امل�ساركني
Table 30: Usage of sweeteners by participants
Use of sweetenersالعدد Number%منط تناول املواد املحلية
91.21614Never use itمل يتناولها اأبدا
2.137Rarely نادرا
2.646Occasionally اأحيانا
0.814Very oftenكثريا
2.747Alwaysدائما
0.711Unknownغري معروف
100.01769Totalاملجموع
جدول 31: ا�ستهالك امل�سروبات الغازية بني امل�ساركني ح�سب النوع
Table 31: Soft drinks consumption among participants by type the drink
Type of soft drink العدد Number%نوع امل�سروب
53.7950Regularعادي8.3146Low-calorie (Diet)قليل ال�سعرات )دايت(
4.885Bothالنوعني
33.2588Don’t drink
100.01769Totalاملجموع

30 National Non-communicable Diseases Risk Factors Survey 2007
جدول 32 : امل�ساركون ح�سب نوع الزيت امل�ستخدم يف الطبخ
Table 32: Types of cooking oil used by Participants
Type of oilالعدد Number%نوع الزيت
97.21719Vegetableنباتي0.815Butter or Gheeدهن اأو �سمن حيواين
0.12Margarineمارجارين0.610Other typeنوع اآخر
0.916Mixed typesي�ستخدم اأكرث من نوع0.35Do not use any typeال ي�ستخدم اأي نوع
0.12Unknownغري معروف100.01769Totalاملجموع
جدول 33 : منط ا�ستخدام زيت الزيتون بني امل�سارركني
Table 33: Use of olive oil among participants
Use of olive oilالعدد Number%ا�ستخدام زيت الزيتون
32.3571Neverمل ي�ستخدم اأبدا13.5238Rarely نادرا
30.2535Occasionallyاأحيانا8.0142Very oftenكثريا
16.0283Alwaysدائما ي�ستخدم100.01769Totalاملجموع
جدول 34 : عدد ومتو�سط مرات االإ�ستهالك االأ�سبوعي لبع�س االأطعمة
Table 34: Number and average weekly intake of some food items
Food intakeالعدد
Numberاملتو�سط
MeanMedian Mode
احلد االأق�سى
MaximumPercentiles %
اال�ستهالك الغذائي25 75
Dates 1766 3.76 3.00 7 21 1.00 7.00 التمر
Beef 1766 1.52 1.00 1 7 1.00 2.00 اللحم
Beef Product 1761 1.64 1.00 0 7 0.00 2.00 منتجات اللحم
Chicken 1757 3.06 3.00 3 7 2.00 4.00 الدجاج
Fish 1767 2.75 3.00 3 7 1.00 4.00 ال�سمك
Prawn 1765 0.74 1.00 0 7 0.00 1.00 الربيان
Egg 1768 2.36 2.00 1 14 1.00 3.00 البي�س
Nuts 1762 1.40 1.00 0 31 0.00 2.00 املك�سرات
Milk 1764 6.07 7.00 7 42 3.00 7.00 احلليب
Milk Product 1768 5.56 7.00 7 21 3.00 7.00 منتجات احلليب
Rice 1769 5.82 7.00 7 14 5.00 7.00 االأرز
Bread 1769 7.27 7.00 7 30 7.00 7.00 اخلبز

31National Non-communicable Diseases Risk Factors Survey 2007
3.3 Physical activity:
a) Physical activity at work:
The survey revealed that out of a total of 1151 working respondents in the sample, 27.6%
only said that their jobs require some light, moderate or aggressive physical activity.
The rate was higher in males compared to females (30.1% and 25.3% respectively) –
Table 35. It was also highest in the age group 20-29 years (30.0%) and decreased with
increasing age - Table 36. Further, it was highest in Muharraq Governorate (38.3%) and
lowest in Northern Governorate (19.2%) – Table 37. Part-time paid job workers reported
the highest rate (33.3%) and unpaid voluntary workers reported the lowest rate (20.0%)
– Table 38.جدول 35 : ن�سبة القيام بالن�ساط البدين اأثناء العمل ح�سب جن�س العامل
Table 35: Rate of physical activity at work by sex of worker
Sex اجلن�س
الن�ساط البدين اأثناء العمل
Physical activity at workاملجموع
Total يقوم بن�ساط
Does activity at work
ال يقوم باأي ن�ساط
No activity at work
غري معروف
Unknown
Male ذكر 220 512 0 732
30.1% 69.9% 0.0% 100.0%
Female اأنثى 197 575 7 779
25.3% 73.8% 0.9% 100.0%
Total املجموع 417 1087 7 1511
27.6% 71.9% 0.5% 100.0%
جدول 36 : ن�سبة القيام بالن�ساط البدين اأثناء العمل ح�سب الفئة العمرية للعامل
Table 36: Rate of physical activity at work by age of worker
الفئة العمرية
Age- Group
الن�ساط البدين اأثناء العمل
Physical activity at work املجموع
Totalيقوم بن�ساط
Does activity at work ال يقوم باأي ن�ساط
No activity at workغري معروف
Unknown
20-2985 198 0 283
30.0% 70.0% 0. 0% 100.0%
30-39124 319 1 444
27.9% 71.8% 0.2% 100.0%
40-49144 345 2 491
29.3% 70.3% 0.4% 100.0%
50-5954 189 3 246
22.0% 76.8% 1.2% 100.0%
60-6410 36 1 47
21.3% 76.6% 2.1% 100.0%
Total املجموع 417 1087 7 1511
27.6% 71.9% 0.5% 100.0%

32 National Non-communicable Diseases Risk Factors Survey 2007
جدول 37 : ن�سبة القيام بالن�ساط البدين اأثناء العمل ح�سب املحافظة
Table 37: Rate of physical activity at work by governorate
Governorate
الن�ساط البدين اأثناء العمل
Physical activity at work املجموع
Totalاملحافظة
يقوم بن�ساط
Does activity at work ال يقوم باأي ن�ساط
No activity at workغري معروف
Unknown
Capital40 126 0 166
العا�صمة
24.1% 75.9% 0.0% 100.0%
Muharraq101 161 2 264
املحرق
38.3% 61.0% 0.8% 100.0%
Northern96 404 1 501
ال�صمالية
19.2% 80.6% 0.2% 100.0%
Central155 335 4 494
الو�سطى
31.4% 67.8% 0.8% 100.0%
Southern25 61 0 86
اجلنوبية
29.1% 70.9% 0.0% 100.0%
Total417 1087 7 1511
املجموع27.6% 71.9% 0.5% 100.0%
جدول 38 : ن�سبة القيام بالن�ساط البدين اأثناء العمل ح�سب قطاع العمل
Table 38: Rate of physical activity at work by type of employment sector
Employment sector
الن�ساط البدين اأثناء العمل
Physical activity at workاملجموع
Totalيقوم بن�ساطقطاع العمل
Does activity at work
ال يقوم باأي ن�ساط
No activity at work
غري معروف
Unknown
Government employee146 365 0 511
موظف حكومي
28.6% 71.4% 0.0% 100.0%
Private sector employee110 305 0 415
موظف يف القطاع اخلا�س
26.5% 73.5% 0.0% 100.0%
Business man17 67 0 84
رجل اأعمال
20.2% 79.8% 0.0% 100.0%
Unpaid voluntary work1 4 0 5
عمل تطوعي غري مدفوع االأجر
20.0% 80.0% 0.0% 100.0%
Part-time paid job1 2 0 3
عمل جزئي باأجر
33.3% 66.7% 0.0% 100.0%
House wife142 344 7 493
ربة منزل - زوجة
28.8% 69.8% 1.4% 100.0%
Total417 1087 7 1511
املجموع
27.6% 71.9% 0.5% 100.0%
Only 2% of working participants said that they do vigorous physical activity, 15.6% do
moderate activity and 5.1% do light activity during their work. Vigorous activity was
much higher among male compared to female workers (3.4% and 0.6% respectively),
and moderate physical activity was higher among females compared to males (16.9%
and 14.1% respectively). The prevalence of doing both vigorous and moderate physical

33National Non-communicable Diseases Risk Factors Survey 2007
activities among working group was 4.2% and the rate among males was three folds
that among females (6.4% and 2.2% respectively) – Table 39.
The rate of vigorous activity was highest (2.9%) in the age-group 30-39 years, moderate
physical activity was highest (18.7%) in age-group 40-49 years and light activity was
highest (6.4%) in age-group 60-64 years – Table 40.
Doing vigorous or moderate physical activity was highest in Muharraq Governorate (4.2%
and 23.5%) and lowest in Northern Governorate (0.6% and 11.6%) – Table 41.
جدول 39 : ن�سبة القيام بالن�ساط البدين اأثناء العمل ح�سب �سدة الن�ساط وجن�س العامل
Table 39: Rate of physical activity at work by intensity of activity and worker’s sex
اجلن�س
Sex
�سدة الن�ساط اأثناء العمل
Intensity of activity at workاملجموع
Totalن�ساط �سديد
Vigorous activity
ن�ساط متو�سط
Moderate activity
ن�ساط �سديد ومتو�سط
Vigorous & moderate
ن�ساط خفيف
Light activity
ال يقوم باأي ن�ساط
No activityغري معروف
Unknown
Male ذكر 25 103 47 41 512 4 732
3.4% 14.1% 6.4% 5.6% 69.9% 0.5% 100.0%
Female اأنثى 5 132 17 36 575 14 779
0.6% 16.9% 2.2% 4.6% 73.8% 1.8% 100.0%
Total املجموع 30 235 64 77 1087 18 1511
2.0% 15.6% 4.2% 5.1% 71.9% 1.2% 100.0%
جدول 40 : ن�سبة القيام بالن�ساط البدين اأثناء العمل ح�سب �سدة الن�ساط والفئة العمرية للعامل
Table 40: Rate of physical activity at work by intensity of activity and worker’s age
الفئة العمرية
Age-group
�سدة الن�ساط اأثناء العمل
Intensity of activity at workاملجموع
Totalن�ساط �سديد
Vigorous activityن�ساط متو�سط
Moderate activityن�ساط �سديد ومتو�سط
Vigorous & moderateن�ساط خفيف
Light activity
ال يقوم باأي
ن�ساط
No activity
غري معروف
Unknown
20-295
1.8%44
15.5%23
8.1%13
4.6%198
70.0%0
0.0%283
100.0%
30-3913
2.9%62
14.0%19
4.3%26
5.9%319
71.8%5
1.1%444
100.0%
40-499
1.8%92
18.7%16
3.3%23
4.7%345
70.3%6
1.2%491
100.0%
50-593
1.2%33
13.4%5
2.0%12
4.9%189
76.8%4
1.6%246
100.0%
60-640
0.0%4
8.5%1
2.1%3
6.4%36
76.6%3
6.4%47
100.0%
Total 30 املجموع2.0%
23515.6%
644.2%
775.1%
108771.9%
181.2%
1511100.0%

34 National Non-communicable Diseases Risk Factors Survey 2007
جدول 41 : ن�سبة القيام بالن�ساط البدين اأثناء العمل ح�سب �سدة الن�ساط واملحافظة
Table 41: Rate of physical activity at work by intensity of activity and governorate
املحافظة
Governorate
�سدة الن�ساط اأثناء العمل
Intensity of activity at work
املجموع
Totalن�ساط �سديد
Vigorous activity
ن�ساط متو�سط
Moderate activity
ن�ساط �سديد
ومتو�سط
Vigorous & moderate
ن�ساط خفيف
Light activity
ال يقوم باأي ن�ساط
No activityغري معروف
Unknown
العا�صمة
Capital 4 20 5 7 126 4 166
2.4% 12.0% 3.0% 4.2% 75.9% 2.4% 100.0%
املحرق
Muharraq11 62 10 18 161 2 264
4.2% 23.5% 3.8% 6.8% 61.0% 0.8% 100.0%
ال�صمالية
Northern3 58 17 15 404 4 501
0.6% 11.6% 3.4% 3.0% 80.6% 0.8% 100.0%
الو�سطى
Central11 81 28 31 335 8 494
2.2% 16.4% 5.7% 6.3% 67.8% 1.6% 100.0%
اجلنوبية
Southern1 14 4 6 61 0 86
1.2% 16.3% 4.7% 7.0% 70.9% 0.0% 100.0%
Total املجموع 30 235 64 77 1087 18 1511
2.0% 15.6% 4.2% 5.1% 71.9% 1.2% 100%
b) Physical activity during travel to routine places (As a means of transportation):
Although 36% of respondents reported walking to and from routine places for at least
10 minutes at a time, only 17.6% said that they do this on a daily basis, with an overall
average of 5 days per week.
There was small variation between males and females in doing this kind of activity (38.1%
and 34.0% respectively) – Table 42, and on average males do this activity 5.5 days a
week compared to 4.3 days a week for females. People in older age groups, tend to
do the activity more than the young – Table 43, with a highest average days per week
(5.7) for those aged 50-59 years. The rate was also highest in the Capital Governorate
(41.4%) and lowest in the Southern Governorate (22.8%) – Table 44, but the average
days per week of doing the activity was highest in the Southern (6 days) and lowest in
the Northern Governorate (4.8 days)
جدول 42 : ن�سبة ممار�سة الن�ساط البدين اأثناء التنقالت ح�سب جن�س امل�ساركني
Table 42: Rates of physical activity as means of transportation by sex
اجلن�س
Sex
الن�ساط البدين اأثناء التنقالت
Physical activity during transportation املجموع
TotalYes نعم No ال Unknown غري معروف
Male ذكر 329 532 2 863
38.1% 61.6% 0.2% 100.0%
Female اأنثى 308 598 0 906
34.0% 66.0% 0.0% 100.0%
Total املجموع 637 1130 2 1769
36.0% 63.9% 0.1% 100.0%

35National Non-communicable Diseases Risk Factors Survey 2007
جدول 43 : ن�سبة ممار�سة الن�ساط البدين اأثناء التنقالت ح�سب الفئة العمرية للم�ساركني
Table 43: Rates of physical activity as means of transportation by age-group
الفئة العمرية
Age- group
الن�ساط البدين اأثناء التنقالت
Physical activity during transportation املجموع
TotalYes نعم No ال Unknown غري معروف
20-29152 269 0 421
36.1% 63.9% 0.0% 100.0%
30-39151 324 1 476
31.7% 68.1% 0.2% 100.0%
40-49186 339 1 526
35.4% 64.4% 0.2% 100.0%
50-59122 163 0 285
42.8% 57.2% 0.0% 100.0%
60-6426 35 0 61
42.6% 57.4% 0.0% 100.0%
Total املجموع 637 1130 2 1769
36.0% 63.9% 0.1% 100.0%
جدول 44 : ن�سبة ممار�سة الن�ساط البدين اأثناء التنقالت ح�سب املحافظة
Table 44: Rates of physical activity as means of transportation by governorate
Governorate
الن�ساط البدين اأثناء التنقالت
Physical activity during transportation املجموع
Totalاملحافظة
Yes نعم No ال Unknown غري معروف
Capital84 119 0 203
العا�صمة
41.4% 58.6% 0.0% 100.0%
Muharraq96 201 0 297
املحرق
32.3% 67.7% 0.0% 100.0%
Northern226 366 1 593
ال�صمالية
38.1% 61.7% 0.2% 100.0%
Central208 366 1 575
الو�سطى
36.2% 63.7% 0.2% 100.0%
Southern23 78 0 101
اجلنوبية
22.8% 77.2% 0.0% 100.0%
Total637 1130 2 1769
املجموع36.0% 63.9% 0.1% 100.0%
c) Activity at leisure time:
More than half of respondents (57.1%) said that they do not do any physical activity at
leisure time – Figure 9. Males practice leisure time activity (52.6%) more than females
(33.7%), and men also tended to do more vigorous activities (8.7%) than females (2%)
– Table 45.
The rate of doing physical activity at leisure time was inversely proportional to age, where
the young tend to do more vigorous activity than the old – Table 46. Respondents from
the Central Governorate had the highest rate of doing this physical activity (45.2%) while
those from the Capital Governorate were the least to do it (39.9%) – Table 47.

36 National Non-communicable Diseases Risk Factors Survey 2007
�سكل 9: ن�سبة ممار�سة الن�ساط البدين اأثناء الفراغ
Figure 9: Rate of physical activity at leisure time
جدول 45: ن�سبة مزاولة الن�ساط البدين اأثناء الفراغ ح�سب �سدة الن�ساط وجن�س امل�سارك
Table 45: Rate of physical activity at leisure time by intensity of activity and sex of participant
اجلن�س
Sex
�سدة الن�ساط البدين اأثناء الفراغ
Intensity of physical activity at leisure timeاملجموع
Totalن�ساط �سديد
Vigorous activity
ن�ساط متو�سط
Moderate activity
ن�ساط �سديد ومتو�سط
Vigorous & moderate
ن�ساط خفيف
Light activity
ال يقوم باأي ن�ساط
Does not do any activity
Male ذكر 75 209 114 56 409 863
8.7% 24.2% 13.2% 6.5% 47.4% 100.0%
Female اأنثى
18 205 17 65 601 906
2.0% 22.6% 1.9% 7.2% 66.3% 100.0%
Total املجموع 93 414 131 121 1010 1769
5.3% 23.4% 7.4% 6.8% 57.1% 100.0%
جدول 46: ن�سبة مزاولة الن�ساط البدين اأثناء الفراغ ح�سب �سدة الن�ساط والفئة العمرية للم�سارك
Table 46: Rate of physical activity at leisure time by intensity of activity and age-group
الفئة العمرية
Age-group
�سدة الن�ساط البدين اأثناء الفراغ
Intensity of physical activity at leisure timeاملجموع
Totalن�ساط �سديد
Vigorous activity
ن�ساط متو�سط
Moderate activity
ن�ساط �سديد ومتو�سط
Vigorous & moderateن�ساط خفيف
Light activity
ال يقوم باأي ن�ساط
Does not do any activity
20-2933 91 64 32 201 421
7.8% 21.6% 15.2% 7.6% 47.7% 100.0%
30-3934 101 33 27 281 476
7.1% 21.2% 6.9% 5.7% 59.0% 100.0%
40-4917 138 28 39 304 526
3.2% 26.2% 5.3% 7.4% 57.8% 100.0%
50-597 72 6 20 180 285
2.5% 25.3% 2.1% 7.0% 63.2% 100.0%
60-642 12 0 3 44 61
3.3% 19.7% 0.0% 4.9% 72.1% 100.0%
Total املجموع 93 414 131 121 1010 1769
5.3% 23.4% 7.4% 6.8% 57.1% 100.0%
No activity 57.1% Does activity 42.9 %

37National Non-communicable Diseases Risk Factors Survey 2007
جدول 47: ن�سبة مزاولة الن�ساط البدين اأثناء الفراغ ح�سب �سدة الن�ساط واملحافظة
Table 47: Rate of physical activity at leisure time by intensity of activity and governorate
املحافظة
Governorate
�سدة الن�ساط البدين اأثناء الفراغ
Intensity of physical activity at leisure timeاملجموع
Totalن�ساط �سديد
Vigorous activity
ن�ساط متو�سط
Moderate activity
ن�ساط �سديد ومتو�سط
Vigorous & moderate
ن�ساط خفيف
Light activity
ال يقوم باأي ن�ساط
Does not do any activity
العا�صمة
Capital 6 51 15 9 122 203
3.0% 25.1% 7.4% 4.4% 60.1% 100.0%
املحرق
Muharraq11 89 17 16 164 297
3.7% 30.0% 5.7% 5.4% 55.2% 100.0%
ال�صمالية
Northern40 127 41 34 351 593
6.7% 21.4% 6.9% 5.7% 59.2% 100.0%
الو�سطى
Central33 129 51 47 315 575
5.7% 22.4% 8.9% 8.2% 54.8% 100.0%
اجلنوبية
Southern3 18 7 15 58 101
3.0% 17.8% 6.9% 14.9% 57.4% 100.0%
Total املجموع 93 414 131 121 1010 1769
5.3% 23.4% 7.4% 6.8% 57.1% 100.0%
3.4 Physical measurements
Blood pressure measurementsa)
According to the WHO classification for blood pressure measurement, individuals with
systolic blood pressure (SBP) ≥140 mmHg or diastolic blood pressure (DBP) ≥ 90 were
considered hypertensive.
The study results showed that the mean systolic and diastolic blood pressure of the
study participants with valid measurements (1760) were 134.6 mmHg and 80.6 mmHg
respectively. The means were higher in males (137.2 mmHg and 82.1 mmHg) than
females (132.1 mmHg and 79.2 mmHg).
High blood pressure reading was found in 38.2% of all participants. The rate was higher
among males compared to females (42.9% versus 33.7%) – Table 48, and increased
steadily with increasing age reaching to 80.3% in the elderly (age group of 60-64 years)
– Table 49.
History of diagnosed hypertension was positive in 16.3%. The percentage was higher
among females (18.7%) than males (13.9%) – Table 50, and it increased with age, from
5% in the age of 20-29 years to 60.7% in the age of 60-64 years – Table 51. The history
of the diagnosed disease ranged from 10.8% in the Capital to 20.8% in the Southern
Governorate – Table 52.
The overall prevalence of hypertension among participants was 42.7%. Those with
history of diagnosed disease constituted 16.3% and the newly detected disease was
26.4% of participants – Table 53.

38 National Non-communicable Diseases Risk Factors Survey 2007
جدول 48: ن�سبة فرط قيا�س �سغط الدم ح�سب جن�س امل�ساركني
Table 48: Rate of high blood pressure reading by sex
Blood pressure readingSex اجلن�س
Total قراءة �سغط الدم املجموعMale ذكر Female اأنثى
High 370 305 675
عايل
42.9% 33.7% 38.2%
Normal / low487 598 1085
طبيعي
56.4% 66.0% 61.3%
Not measured 6 3 9
مل يقا�س
0.7% 0.35% 0.5%
Total863 906 1769
املجموع100.0% 100.0% 100.0%
جدول 49: ن�سبة فرط قيا�س �سغط الدم ح�سب الفئة العمرية للم�ساركني
Table 49: Rate of high blood pressure reading by age
Blood pressure reading
الفئة العمرية
Age – group املجموعTotal
قراءة �سغط الدم
20-29 30 - 39 40 - 49 50 - 59 60 - 64
High 87 143 232 164 49 675
عايل
20.7% 30.0% 44.1% 57.5% 80.3% 38.2%
Normal / low 332 332 292 118 11 1085
طبيعي
78.9% 69.7% 55.5% 41.4% 18.0% 61.3%
Not measured2 1 2 3 1 9
مل يقا�س
0.5% 0.2% 0.4% 1.1% 1.6% 0.5%
Total 421 476 526 285 61 1769
املجموع
100.0% 100.0% 100.0% 100.0% 100.0% 100.0%
جدول50: ن�سبة انت�سار فرط �سغط الدم امل�سخ�س �سابقا ح�سب اجلن�س
Table 50: Prevalence of history of diagnosed hypertension by sex
History hypertensionSex اجلن�س
Total املجموعفرط �سغط الدم
اأنثى Female ذكر Maleم�سخ�س �سابقا
Positive120 169 289
اإيجابية
13.9% 18.7% 16.3%
Negative742 736 1478
�سلبية
86.0% 81.2% 83.6%
Unknown1 1 2
غري معروفة
0.1% 0.1% 0.1%
Total863 906 1769
املجموع
100.0% 100.0% 100.0%

39National Non-communicable Diseases Risk Factors Survey 2007
جدول 51: ن�سبة انت�سار فرط �سغط الدم امل�سخ�س �سابقا ح�سب الفئة العمرية
Table 51: Prevalence of history of diagnosed hypertension by age-group
History of hypertension
الفئة العمرية
Age- Group املجموع
Totalفرط �سغط الدم
م�سخ�س �سابقا20-29 30-39 40-49 50-59 60-64
Positive21 45 87 99 37 289
اإيجابية
5.0% 9.5% 16.5% 34.7% 60.7% 16.3%
Negative400 430 438 186 24 1478
�سلبية
95.0% 903% 83.3% 65.3% 39.3% 83.6%
Unknown0 1 1 0 0 2
غري معروفة
0.0% 0.2% 0.2% 0.0% 0.0% 0.1%
Total421 476 526 285 61 1769
املجموع100.0% 100.0% 100.0% 100.0% 100.0% 100.0%
جدول 52: ن�سبة انت�سار فرط �سغط الدم امل�سخ�س �سابقا ح�سب املحافظة
Table 52: Prevalence of history of diagnosed hypertension by governorate
History of hypertension
املحافظة
Governorate املجموع
Totalفرط �سغط الدم
العا�سمةم�سخ�س �سابقا
Capital املحرق
Muharraqال�سمالية
Northernالو�سطى
Centralاجلنوبية
Southern
Positive22 60 79 107 21 289
اإيجابية
10.8% 20.2% 13.3% 18.6% 20.8% 16.3%
Negative181 237 512 468 80 1478
�سلبية
89.2% 79.8% 86.3% 81.4% 79.2% 83.6%
Unknown0 0 2 0 0 2
غري معروفة
0.0% 0.0% 0.3% 0.0% 0.0% 0.1%
Total203 297 593 575 101% 1769
املجموع100.0 % 100.0% 100.0% 100.0% 100.0% 100.0%
جدول 53: ن�سبة انت�سار فرط �سغط الدم ح�سب طريقة اكت�ساف املر�س واجلن�س
Table 53: Prevalence of hypertension by method of detection and sex
Method of detection
اجلن�س
Sex املجموع
Totalطريقة االإكت�ساف
Male ذكر Female اأنثى
History of hypertension120 169 289
ت�سخي�س �سابق
13.9% 18.7% 16.3%
Newly detected hypertension278 189 467
اكت�سف حديثا
32.2% 20.9% 26.4%
Not hypertensive490 546 1006
غري م�ساب ب�سغط الدم
53.3% 60.3% 56.9%
Hypertension status unknown5 2 7
احلالة غري معروفة
0.6% 0.2% 0.4%
Total863 906 1769
املجموع100.0% 100.0% 100.0%

40 National Non-communicable Diseases Risk Factors Survey 2007
جدول 54: ن�سبة انت�سار فرط �سغط الدم ح�سب طريقة اكت�ساف املر�س والفئة العمرية
Table 54: Prevalence of hypertension by method of detection and age
Method of detection
الفئة العمرية
Age- Group Total طريقة االإكت�ساف
20-29 30-39 40-49 50-59 60-64
History of hypertension21 45 87 99 37 289
ت�سخي�س �سابق
5.0% 9.5% 16.5% 34.7% 60.7% 16.3%
Newly detected hypertension72 121 164 93 17 467
اكت�سف حديثا
17.1% 25.4% 31.2% 32.6% 27.9% 26.4%
Not hypertensive326 309 273 92 6 1006
غري م�ساب ب�سغط الدم
77.4% 64.9% 51.9% 32.3% 9.8% 56.9%
Hypertension status unknown2 1 2 1 1 7
احلالة غري معروفة
0.5% 0.2% 0.4% 0.4% 1.6% 0.4%
Total421 476 526 285 61 1769
املجموع100.0% 100.0% 100.0% 100.0% 100.0% 100.0%
جدول 55 : ن�سبة انت�سار فرط �سغط الدم ح�سب طريقة اكت�ساف املر�س واملحافظة
Table 55: Prevalence of hypertension by method of detection and governorate
Method of detection
املحافظة
Governorate املجموع
Totalطريقة االإكت�ساف
العا�سمة
Capital املحرق
Muharraqال�سمالية
Northernالو�سطى
Centralاجلنوبية
Southern
History of hypertension22 60 79 107 21 289
ت�سخي�س �سابق
10.8% 20.2% 13.3% 18.6% 20.8% 16.3%
Newly detected hypertension56 79 164 142 26 467
اكت�سف حديثا
27.6% 26.6% 27.7% 24.7% 25.7% 26.4%
Not hypertensive125 158 349 321 53 1006
غري م�ساب �سغط الدم
61.6% 53.2% 58.9% 55.8% 52.5% 56.9%
Hypertension status unknown0 0 1 5 1 7
احلالة غري معروفة
0.0% 0.0% 0.2% 0.9% 1.0% 0.4%
Total203 297 593 575 101 1769
املجموع100.0% 100.0% 100.0% 100.0% 100.0% 100.0%
b) Anthropometric measurements
(1) Body Mass Index (BMI)
According to the WHO definition, BMI readings less than 25 were considered as normal
or low, those between 25 and < 30 as overweight, and those ≥ 30 as obese.
جدول 56: متو�سط موؤ�سر كتلة الوزن للم�ساركني ح�سب اجلن�س
Table 56: Average Body Mass Index (BMI) for participants by Sex*
Sex اجلن�س Number العدد Mean املتو�سط االإنحراف املعياري
Std. Deviation
Male 854 ذكر 27.9 5.7
Female 858 اأنثى 29.2 6.9
Total 1712 املجموع 28.5 6.3
* Forty pregnant women were excluded

41National Non-communicable Diseases Risk Factors Survey 2007
(2) Overweight and obesity
The study revealed that the overall prevalence of obesity was 36.3% and was higher
in females than males (40.3% and 32.3%, espectively). On the other hand, the overall
prevalence of overweight was 32.9% and was higher in male respondents than females
(34.8% Vs 31.1%) – Table 57.
Obesity was most prevalent (46.1%) in the age of 40-49 years and least prevalent (20%)
in the youngest age of 20-29 years. On the other hand, overweight prevalence was
highest (51.7%) in the oldest age group – Table 58.
The study also showed that among male respondents the prevalence was highest in the
age group 40-49 years (43.4%), while in female respondents the prevalence was highest
in the age group 50-59 years (51.4%). In contrast, the prevalence of obesity was the
lowest in the age group 20-29 years for both male and female respondents – Table 59.
Furthermore, the overall and sex-specific prevalence of obesity were highest in southern
governorate. Slightly more than half of the respondents (54.3%) in the Southern
Governorate were obese. Surprisingly, around two thirds of female respondents (70.5%)
and also two-fifths (40%) of male respondents in the Southern Governorate were obese.
On the other hand, the Capital Governorate had the lowest overall prevalence (28.1%)
and the prevalence among females (26.2%) of obesity, while the prevalence among male
respondents was lowest in Northern Governorate (27.6%) – Tables 60, 61.
جدول 57: ن�سبة انت�سار فرط الوزن وال�سمنة بني امل�ساركني ح�سب اجلن�س
Table 57: Prevalence of overweight and obesity by Sex *
Body Mass Index
اجلن�س
Sex املجموع
Totalموؤ�سر كتلة الوزن
Male ذكر Female اأنثى
Normal or Low281 245 526
طبيعي اأو منخف�س
32.9% 28.6% 30.7%
Overweight297 267 564
زيادة يف الوزن
34.8% 31.1% 32.9%
Obese276 346 622
بدانة
32.3% 40.3% 36.3%
Total854 858 1712
املجموع100.0% 100.0% 100.0%
* Forty pregnant women were excluded

42 National Non-communicable Diseases Risk Factors Survey 2007
جدول 58: ن�سبة انت�سار فرط الوزن وال�سمنة بني امل�ساركني ح�سب الفئة العمرية
Table 58: Prevalence of overweight and obesity by age *
Body Mass Index
الفئة العمرية
Age Group املجموع
Totalموؤ�سر كتلة الوزن
20-29 30-39 40-49 50-59 60-64
Normal or Low212 131 107 65 11 526
طبيعي اأو منخف�س
53.0% 28.9% 20.6% 23.2% 18.3% 30.7%
Overweight108 160 173 92 31 564
زيادة يف الوزن
27.0% 35.3% 33.3% 32.9% 51.7% 32.9%
Obese80 162 239 123 18 622
بدانة
20.0% 35.8% 46.1% 43.9% 30.0% 36.3%
Total400 453 519 280 60 1712
املجموع
100.0% 100.0% 100.0% 100.0% 100.0% 100.0%
* Forty pregnant women were excludedجدول 59: ن�سبة انت�سار فرط الوزن وال�سمنة بني امل�ساركني ح�سب الفئة العمرية واجلن�س
Table 59: Prevalence of overweight and obesity by age and sex *
اجلن�س
SexBody Mass
Index
الفئة العمرية
Age-group املجموع
Totalموؤ�سر كتلة الوزن
20-29 30-39 40-49 50-59 60-64
ذكر
Male
Normal or Low129 60 49 39 4 281
طبيعي اأو منخف�س
55.1% 28.2% 19.5% 29.1% 18.2% 32.9%
Overweight62 83 93 47 12 297
زيادة يف الوزن
26.5% 39.0% 37.1% 35.1% 54.5% 34.8%
Obese43 70 109 48 6 276
بدانة
18.4% 32.9% 43.4% 35.8% 27.3% 32.3%
Total234 213 251 134 22 854
املجموع
100.0% 100.0% 100.0% 100.0% 100.0% 100.0%
اأنثى
Female
Normal or Low83 71 58 26 7 245
طبيعي اأو منخف�س
50.0% 29.6% 21.6% 17.8% 18.4% 28.6%
Overweight46 77 80 45 19 267
زيادة يف الوزن
27.7% 32.1% 29.9% 30.8% 50.0% 31.1%
Obese37 92 130 75 12 346
بدانة
22.3% 38.3% 48.5% 51.4% 31.6% 40.0%
Total166 240 268 146 38 858
املجموع
100.0% 100.0% 100.0% 100.0% 100.0% 100.0%
* Forty pregnant women were excluded

43National Non-communicable Diseases Risk Factors Survey 2007
جدول 60: ن�سبة انت�سار فرط الوزن وال�سمنة بني امل�ساركني ح�سب املحافظة
Table 60: Prevalence of overweight and obesity by governorate*
Body Mass Index
املحافظة
Governorate املجموع
Totalموؤ�سر كتلة الوزن
العا�سمة
Capital املحرق
Muharraqال�سمالية
Northernالو�سطى
Centralاجلنوبية
Southern
Normal or Low80 65 189 173 19 526
طبيعي اأو منخف�س
41.7% 22.4% 32.9% 30.8% 20.2% 30.7%
Overweight58 99 207 176 24 564
زيادة يف الوزن
30.2% 34.1% 36.0% 31.4% 25.5% 32.9%
Obese54 126 179 212 51 622
بدانة
28.1% 43.4% 31.1% 37.8% 54.3% 36.3%
Total192 290 575 561 94 1712
املجموع100.0% 100.0% 100.0% 100.0% 100.0% 100.0%
* Forty pregnant women were excluded جدول 61: ن�سبة انت�سار فرط الوزن وال�سمنة بني امل�ساركني ح�سب املحافظة واجلن�س
Table 61: Prevalence of overweight and obesity by governorate and sex*
اجلن�س
Sex Body Mass
Index
املحافطة
Governorate املجموع
Totalموؤ�سر كتلة الوزن
العا�سمة
Capital املحرق
Muharraqال�سمالية
Northernالو�سطى
Centralاجلنوبية
Southern
ذكر
Male
Normal or Low
45 38 95 91 12 32.9%طبيعي اأو منخف�س
41.7% 26.8% 32.3% 35.0% 24.0% 297
Overweight31 49 118 81 18 34.8%
زيادة يف الوزن
28.7% 34.5% 40.1% 31.2% 36.0% 276
Obese32 55 81 88 20 32.3%
بدانة
29.6% 38.7% 27.6% 33.8% 40.0% 854
Total108 142 294 260 50 100.0%
املجموع
100.0% 100.0% 100.0% 100.0% 100.0% 245
اأنثى
Female
Normal or Low
35 27 94 82 7 28.6%طبيعي اأو منخف�س
41.7% 18.2% 33.5% 27.2% 15.9% 267
Overweight27 50 89 95 6 31.1%
زيادة يف الوزن
32.1% 33.8% 31.7% 31.6% 13.6% 346
Obese22 71 98 124 31 40.3%
بدانة
26.2% 48.0% 34.9% 41.2% 70.5% 858
Total84 148 281 301 44 100.0%
املجموع100.0% 100.0% 100.0% 100.0% 100.0% 281
* Forty pregnant women were excluded
3.5 Biological measurements
Of 1769 successfully interviewed participants, 1109 (62.7%) have valid blood specimens
for fasting blood glucose level testing.
a) Hyperglycaemia and Diabetes
(1) Fasting blood glucose
The respondents were considered, hyperglycemic if fasting blood sugar was ≥ 7.0 mmol/L,
and impaired FBS if the fasting blood sugar > 5.8 and < 7.0 mmol/L was considered.

44 National Non-communicable Diseases Risk Factors Survey 2007
Accordingly, the prevalence of hyperglycemia was 13.5%. The rate was higher among
female respondents compared to males (14.9% compared to 11.8%). The prevalence of
impaired FBS was 12.0% with 12.3% and 11.5% for females and males respectively –
Table 62. Hyperglycemia was increasing with age from 2.4% in the age of 20-29 years to
30.6% among those of 60-64 years of age – Table 63. Both Hyperglycemia and impaired
FBS were highest in Muharraq Governorate (18.3% and 18.8% respectively) and they
were lowest in the Capital (10.7%) and Southern Governorate (5.4%) – Table 64.
جدول 62: قيا�س م�ستوى ال�سكر يف الدم ح�سب اجلن�س ملن مت فح�سهم
Table 62: Fasting blood sugar levels and sex of tested participants
Fasting blood glucose levelSex اجلن�س
املجموع
Totalم�ستوى ال�سكر يف الدم
Male ذكر Female اأنثى
Hyperglycemia 57 93 150
فرط �سكر الدم
11.8% 14.9% 13.5%
Impaired FBS56 77 133
اختالل �سكر الدم
11.5% 12.3% 12.0%
Normal 372 454 826
طبيعي
76.7% 72.8% 74.5%
Total485 624 1109
املجموع100.0% 100.0% 100.0%
جدول 63: قيا�س م�ستوى ال�سكر يف الدم ح�سب الفئة العمرية ملن مت فح�سهم
Table 63: Fasting blood sugar levels and age of tested participants
الفئة العمرية
Age–group
م�ستوى ال�سكر يف الدم
Fasting blood glucose level املجموع
Totalفرط �سكر الدم
Hyperglycemia Impaired اختالل �سكر الدم
FBSطبيعي
Normal
20 – 295 7 198 210
2.4% 3.3% 94.3% 100.0%
30 – 3917 22 248 287
5.9% 7.7% 86.4% 100.0%
40 – 4957 48 243 348
16.4% 13.8% 69.8% 100.0%
50 – 5956 48 111 215
26.0% 22.3% 51.6% 100.0%
60 – 6415 8 26 49
30.6% 16.3% 53.1% 100.0%
Total150 133 826 1109
13.5% 12.0% 74.5% 100.0%

45National Non-communicable Diseases Risk Factors Survey 2007
جدول 64: قيا�س م�ستوى ال�سكر يف الدم ح�سب املحافظة ملن مت فح�سهم
Table 64: Fasting blood sugar levels and governorate of tested participants
Fasting blood glucose level
املحافظة
Governorate املجموعTotal
م�ستوى ال�سكر يف الدمالعا�سمة
Capitalاملحرق
Muharraqال�سمالية
Northernالو�سطى
Centralاجلنويبة
Southern
Hyperglycemia13 36 43 50 8 150
فرط �سكر الدم
10.7% 18.3% 11.1% 14.5% 14.3% 13.5%
Impaired14 37 42 37 3 133
اختالل �سكر الدم
11.6% 18.8% 10.8% 10.7% 5.4% 12.0%
Normal94 124 304 259 45 826
طبيعي
77.7% 62.9% 78.1% 74.9% 80.4% 74.5%
Total 121 197 389 346 56 1109
املجموع100.0% 100.0% 100.0% 100.0% 100.0% 100.0%
(2) History of diagnosed diabetes mellitus
Of all the participants, 203 (11.5%) gave history of diagnosed diabetes mellitus with a higher prevalence among females (13.4%) compared to males (9.5%) – Table 65. The prevalence increased steadily with increasing age group reaching upto 37.7% in the age group of 60-64 years – Table 66. Participants from the Muharraq Governorate had the highest prevalence of history of the disease (16.8%), while those from the Capital had the lowest prevalence (6.4%) – Table 67.
جدول 65: ن�سبة انت�سار داء ال�سكري م�سخ�س �سابقا بني امل�ساركني ح�سب اجلن�س
Table 65: Prevalence of history of diagnosed diabetes mellitus by sex
مر�س ال�سكري م�سخ�س �سابقا
History of diabetes mellitusSex املجموع اجلن�س
TotalMale ذكر Female اأنثى
Yes نعم82 121 203
9.5% 13.4% 11.5%
No ال781 785 1566
90.5% 86.6% 88.5%
Total املجموع 863 906 1769
100.0% 100.0% 100.0%
جدول 66: ن�سبة انت�سار داء ال�سكري م�سخ�س �سابقا بني امل�ساركني ح�سب الفئة العمرية
Table 66: prevalence of history of diagnosed diabetes mellitus by age
الفئة العمرية
Age - group
مر�س ال�سكري م�سخ�س �سابقا
History of diabetes mellitus املجموع
TotalYes نعم No ال
20 – 297 414 421
1.7% 98.3% 100.0%
30 – 3924 452 476
5.0% 95.0% 100.0%
40 – 4972 454 526
13.7% 86.3% 100.0%
50 – 5977 208 285
27.0% 73.0% 100.0%
60 – 6423 38 61
37.7% 62.3% 100.0%
Total املجموع 203 1566 1769
11.5% 88.5% 100.0%

46 National Non-communicable Diseases Risk Factors Survey 2007
جدول 67: ن�سبة انت�سار داء ال�سكري م�سخ�س �سابقا بني امل�ساركني ح�سب املحافظة
Table 67: Prevalence of history of diagnosed diabetes mellitus by governorate
مر�س ال�سكري م�سخ�س �سابقا
History of diabetes mellitus
املحافظة
Governorate املجموع
Totalالعا�سمة
Capitalاملحرق
Muharraqال�سمالية
Northernالو�سطى
Centralاجلنويبة
Southern
Yes نعم
13 50 58 70 12 203
6.4% 16.8% 9.8% 12.2% 11.9% 11.5%
No ال190 247 535 505 89 1566
93.6% 83.2% 90.2% 87.8% 88.1% 88.5%
Total املجموع 203 297 593 575 101 1769
100.0% 100.0% 100.0% 100.0% 100.0% 100.0%
(3) Prevalence of diabetes mellitus:
The lowest estimate of the overall prevalence of diabetes mellitus among study
participants is 14.3% (253 cases; 203 cases with history of diagnosed disease and
50 newly diagnosed cases) – Table 68. As expected, the prevalence was positively
associated with age reaching upto 41% in the oldest age-group – Table 69. According
to governorates, the prevalence of was highest in the Muharraq Governorate (19.5%)
and lowest in the Capital Governorate (9.8%) – Table 70.
جدول 68: ن�سبة انت�سار ال�سكري بني امل�ساركني ح�سب طريقة اكت�ساف املر�س واجلن�س
Table 68: Estimated prevalence of diabetes among participants by method of diabetes detection and sex
Method of detection Sex اجلن�س املجموع
Totalطريقة االإكت�ساف
Male ذكر Female اأنثى
History of diagnosed diabetes 82 121 203
م�سخ�س �سابقا
9.5% 13.4% 11.5%
Newly detected diabetes19 31 50
مكت�سف من الدرا�سة
2.2% 3.4% 2.8%
Impaired FBS 45 54 99
اختالل �سكر الدم مكت�سف من الدرا�سة
5.2% 6.0% 5.6%
Not diabetic 365 437 802
غري م�ساب بال�سكري
42.3% 48.2% 45.3%
Status unknown352 263 615
احلالة غري معروفة
40.8% 29.0% 34.8%
Total863 906 1769
املجموع100.0% 100.0% 100.0%

47National Non-communicable Diseases Risk Factors Survey 2007
جدول 69 : ن�سبة انت�سار ال�سكري بني امل�ساركني ح�سب طريقة اكت�ساف املر�س والفئة العمرية
Table 69: Estimated prevalence of diabetes among participants by method of diabetes detection and age
الفئة العمرية
Age–group
Method of detection طريقة االإكت�ساف
املجموع
Totalم�سخ�س �سابقا
History of DM
مكت�سف حديثا
Newly detected DM
اختالل �سكر الدم
Impaired FBSغري م�ساب بال�سكري
Not diabetic
احلالة غري معروفة
Status unknown
20 – 297 1 7 196 210 421
1.7% 0.2% 1.7% 46.6% 49.9% 100.0%
30 – 3924 9 19 242 182 476
5.0% 1.9% 4.0% 50.8% 38.2% 100.0%
40 – 4972 23 35 237 159 526
13.7% 4.4% 6.7% 45.1% 30.2% 100.0%
50 – 5977 15 32 105 56 285
27.0% 5.3% 11.2% 36.8% 19.6 100.0%
60 - 6423 2 6 22 8 61
37.7% 3.3% 9.8% 36.1 13.1% 100.0%
Total املجموع 203 50 99 802 615 1769
11.5% 2.8% 5.6% 45.3% 34.8% 100.0%
جدول 70: ن�سبة انت�سار ال�سكري بني امل�ساركني ح�سب طريقة اكت�ساف املر�س واملحافظة
Table 70: Estimated prevalence of diabetes among participants by method of diabetes detection and governorate
Method of detection
املحافظة
Governorate املجموع
Totalطريقة االإكت�ساف
العا�سمة
Capitalاملحرق
Muharraqال�سمالية
Northernالو�سطى
Centralاجلنوبية
Southern
History of diagnosed diabetes13 50 58 70 12 203
م�سخ�س �سابقا
6.4% 16.8% 9.8% 12.2% 11.9% 11.5%
Newly detected diabetes7 8 17 16 2 50 مكت�سف حديثا من
%3.4الدرا�سة 2.7% 2.9% 2.8% 2.0% 2.8%
Impaired FBS 13 28 31 25 2 99
اختالل �سكر الدم
6.4% 9.4% 5.2% 4.3% 2.0% 5.6%
Not diabetes 93 119 295 252 43 802
غري م�ساب بال�سكري
45.8% 40.1% 49.7% 43.8% 42.6% 45.3%
Unknown77 92 192 212 42 615
احلالة غري معروفة
37.9% 31.0% 32.4% 36.9% 41.6% 34.8%
Total 203 297 593 575 101 1769
املجموع100.0% 100.0% 100.0% 100.0% 100.0% 100.0%
b) Total serum cholesterol
The mean total serum cholesterol, among the 1117 subjects whom were tested, was 5.0 mmol/l. Both males and females had nearly equal means (5.0 and 4.9 mmol/l respectively).The survey results revealed that the overall prevalence of hypercholesterolemia (>=5.2 mmol/l) was 40.6% with no significant differences between male (41.2%) and female respondents (40.2%) – Table 71. There was an evident increase in the prevalence of hypercholesterolemia with increasing age reaching 61.2% in elderly of 60-64 years – Table 72. On the other hand, the prevalence was slightly higher in the Muharraq Governorate
(44.4%) and lowest in the Northern Governorate (39.3%) – Table 73.

48 National Non-communicable Diseases Risk Factors Survey 2007
جدول 71: ن�سبة انت�سار فرط الكولي�ستريول يف الدم بني امل�ساركني ح�سب اجلن�س
Table 71: Prevalence of hypercholesterolemia among participants by sex
Sex اجلن�س
Cholesterol blood level ن�سبة الكولي�سرتول يف الدماملجموع
Total>=5.2 mmol/l High مرتفع
Normal / Low طبيعي / منخف�س
< 5.2 mmol/l
Male ذكر
202 288 490
41.2% 58.8% 100.0%
Female اأنثى 252 375 627
40.2% 59.8% 100.0%
Total املجموع 454 663 1117
40.6% 59.4% 100.0%
جدول 72: ن�سبة انت�سار فرط الكولي�ستريول يف الدم بني امل�ساركني ح�سب الفئة العمرية
Table 72: Prevalence of hypercholesterolemia among participants by age
Age-group الفئة العمرية
Cholesterol blood level ن�سبة الكولي�سرتول يف الدماملجموع
TotalHigh مرتفع
>=5.2 mmol/lNormal / Low طبيعي / منخف�س
< 5.2 mmol/l
20 – 2946 163 209
22.0% 78.0% 100.0%
30 – 39103 189 292
35.3% 64.7% 100.0%
40 – 49162 189 351
46.2% 53.8% 100.0%
50 – 59113 103 216
52.3% 47.7% 100.0%
60 – 6430 19 49
61.2% 38.8% 100.0%
Total املجموع 454 663 1117
40.6% 59.4% 100.0%
جدول 73 : ن�سبة انت�سار فرط الكولي�ستريول يف الدم بني امل�ساركني ح�سب املحافظة
Table 73: Prevalence of hypercholesterolemia among participants by governorate
Governorate
Cholesterol blood level ن�سبة الكولي�سرتول يف الدم املجموعTotal
مرتفع Highاملحافظة
>=5.2 mmol/lNormal / Low طبيعي / منخف�س
< 5.2 mmol/l
Capital51 73 124
العا�صمة
41.1% 58.9% 100.0%
Muharraq88 110 198
املحرق
44.4% 55.6% 100.0%
Northern154 238 392
ال�صمالية
39.3% 60.7% 100.0%
Central139 209 348
الو�سطى
39.9% 60.1% 100.0%
Southern22 33 55
اجلنوبية
40.0% 60.0% 100.0%
Total454 663 1117
املجموع40.6% 59.4% 100.0%

Appendices

50 National Non-communicable Diseases Risk Factors Survey 2007
Appendix A: Additional Tables of Survey Results
جدول A1: ن�سبة انت�سار تدخني التبغ بني امل�ساركني ح�سب منط تكرار التدخني واجلن�س والفئة العمرية
Table A1: Prevalence of tobacco smoking among participants by frequency, sex and age
اجلن�س
Sex الفئة العمرية
Age-group
منط تكرار تدخني التبغ
Tobacco smoking frequency
Totalمدخن التبغ ب�سكل يومي
Daily Tobacco Smoker
مدخن التبغ ب�سكل غري يومي
Not-Daily Tobacco Smoker
مقلع عن التدخني
Ex-Smokerغري مدخن
Never Smoker
ذكر
Male
20-2984 8 26 118 236
35.6% 3.4% 11.0% 50.0% 100.0%
30-3974 6 35 100 215
34.4% 2.8% 16.3% 46.5% 100.0%
40-4966 4 40 142 252
26.2% 1.6% 15.9% 56.3% 100.0%
50-5933 6 23 75 137
24.1% 4.4% 16.8% 54.7% 100.0%
60-647 0 8 8 23
30.4% 0.0% 34.8% 34.8% 100.0%
Total املجموع 264 24 132 443 863
30.6% 2.8% 15.3% 51.3% 100.0%
اأنثىFemale
20-298 3 1 173
93.5%185
4.3% 1.6% 0.5% 100.0%
30-398 6 4 243
93.1%261
3.1% 2.3% 1.5% 100.0%
40-4913 1 17 243
88.7%274
4.7% 0.4% 6.2% 100.0%
50-5918 2 11 117
79.1%148
12.2% 1.4% 7.4% 100.0%
60-645 0 4 29
76.3%38
13.2% 0.0% 10.5% 100.0%
Total املجموع 52 12 37
4.1%805 906
5.7% 1.3% 88.9% 100.0%

51National Non-communicable Diseases Risk Factors Survey 2007
جدول A2 : ن�سبة انت�سار تدخني التبغ بني امل�ساركني ح�سب منط تكرار التدخني واملحافظة واجلن�س
Table A2: Prevalence of tobacco smoking among participants by frequency, sex and governorate
اجلن�س
Sexاملحافظة
Governorate
Tobacco smoking frequency منط تكرار تدخني التبغ
املجموع
Totalمدخن التبغ ب�سكل يومي
Daily Tobacco Smoker
مدخن التبغ ب�سكل غري يومي
Not-Daily Tobacco Smoker
مقلع عن التدخني
Ex-Smokerغري مدخن
Never Smoker
ذكر
Male
العا�صمة
Capital36 1 17 55 109
33.0% 0.9% 15.6% 50.5% 100.0%
املحرق
Muharraq43 9 27 64 143
30.1% 6.3% 18.9% 44.8% 100.0%
ال�صمالية
Northern77 3 35 179 294
26.2% 1.0% 11.9% 60.9% 100.0%
الو�سطى
Central82 10 45 129 266
30.8% 3.8% 16.9% 48.5% 100.0%
اجلنوبية
Southern26 1 8 16 51
51.0% 2.0% 15.7% 31.4% 100.0%
Total املجموع 264 24 132 443 863
30.6% 2.8% 15.3% 51.3% 100.0%
اأنثىFemale
العا�صمة
Capital7 1 6 80
85.1%94
7.4% 1.1% 6.4% 100.0%
املحرق
Muharraq7 3 1 143
92.9%154
4.5% 1.9% 0.6% 100.0%
ال�صمالية
Northern15 2 14 268
89.6%299
5.0% 0.7% 4.7% 100.0%
الو�سطى
Central22 6 15 266
86.1%309
7.1% 1.9% 4.9% 100.0%
اجلنوبية
Southern1 0 1 48
96.0%50
2.0% 0.0% 2.0% 100.0%
Total املجموع 52 12 37
4.1%805 906
5.7% 1.3% 88.9% 100.0%

52 National Non-communicable Diseases Risk Factors Survey 2007
جدول A3 : ن�سبة انت�سار تدخني ال�سجائر ح�سب منط تكرار التدخني والفئة العمرية واجلن�س
Table A3: Prevalence of cigarette smoking by frequency, sex and age
اجلن�س
Sex الفئة العمرية
Age-group
Cigarettes smoking frequencyمنط تكرار تدخني ال�سجائر
املجموع
Totalمدخن التبغ ب�سكل يومي
Daily Tobacco Smoker
مدخن التبغ ب�سكل غري يومي
Not-Daily Tobacco Smoker
مقلع عن التدخني
Ex-Smokerغري مدخن
Never Smoker
ذكر
Male
20- 2973 4 22 137 236
30.9% 1.7% 9.3% 58.1% 100.0%
30- 3966 2 29 118 215
30.7% 0.9% 13.5% 54.9% 100.0%
40- 4951 1 38 162 252
20.2% 0.4% 15.1% 64.3% 100.0%
50- 5927 2 24 84 137
19.7% 1.5% 17.5% 61.3% 100.0%
60- 647 0 6 10 23
30.4% 0.0% 26.1% 43.5% 100.0%
Total املجموع 224 9 119 511 863
26.0% 1.0% 13.8% 59.2% 100.0%
اأنثى
Female
20- 293 0 1 181 185
1.6% 0 0.5% 97.8% 100.0%
30- 391 0 2 258 261
0.4% 0 0.8% 98.9% 100.0%
40- 493 0 6 265 274
1.1% 0 2.2% 96.7% 100.0%
50- 594 0 0 144 148
2.7% 0 0.0% 97.3% 100.0%
60- 640 0 2 36 38
0.0% 0 5.3% 94.7% 100.0%
Total املجموع 11 0 11 884 906
1.2% 0 1.2% 97.6% 100.0%

53National Non-communicable Diseases Risk Factors Survey 2007
جدول A4 : ن�سبة انت�سار تدخني ال�سجائر ح�سب منط تكرار التدخني واملحافظة واجلن�س
Table A4 : Prevalence of cigarette smoking by frequency, sex and governorate
اجلن�س
Sexاملحافظة
Governorate
منط تكرار تدخني ال�سجائر
Cigarette smoking frequency املجموع
Total مدخن التبغ ب�سكل يومي
Daily Tobacco Smoker
مدخن التبغ ب�سكل غري يومي
Not-Daily Tobacco Smoker
مقلع عن التدخني
Ex-Smokerغري مدخن
Never Smoker
ذكر
Male
العا�صمة
Capital31 0 15 63 109
28.4% 0.0% 13.8% 57.8% 100.0%
املحرق
Muharraq37 4 28 74 143
25.9% 2.8% 19.6% 51.7% 100.0%
ال�صمالية
Northern58 0 30 206 294
19.7% 0.0% 10.2% 70.1% 100.0%
الو�سطى
Central75 4 36 151 266
28.2% 1.5% 13.5% 56.8% 100.0%
اجلنوبية
Southern23 1 10 17 51
45.1% 2.0% 19.6% 33.3% 100.0%
Total املجموع 224 9 119 511 863
26.0% 1.0% 13.8% 59.2% 100.0%
اأنثى
Female
العا�صمة
Capital2 0 1 91 94
2.1% 0 1.1% 96.8% 100.0%
املحرق
Muharraq1 0 1 152 154
0.6% 0 0.6% 98.7% 100.0%
ال�صمالية
Northern1 0 0 298 299
0.3% 0 0.0% 99.7% 100.0%
الو�سطى
Central7 0 7 295 309
2.3% 0 2.3% 95.5% 100.0%
اجلنوبية
Southern0 0 2 48 50
0.0% 0 4.0% 96.0% 100.0%
Total املجموع 11 0 11 884 906
1.2% 0 1.2% 97.6% 100.0%

54 National Non-communicable Diseases Risk Factors Survey 2007
جدول A5 : ن�سبة انت�سار تدخني ال�سي�سة بني امل�ساركني ح�سب اجلن�س والفئة العمرية
Table A5: Prevalence of current shisha/water-pipe smoking by sex and age
اجلن�س
Sexالفئة العمرية
Age - Group
تدخني ال�سي�سة
Smoking shisha/ water-pipe املجموع
TotalYes نعم No ال
ذكر
Male
20 - 2942 194 236
17.8% 82.2% 100.0%
30 - 3921 194 215
9.8% 90.2% 100.0%
40 - 4920 232 252
7.9% 92.1% 100.0%
50 - 599 128 137
6.6% 93.4% 100.0%
60 - 641 22 23
4.3% 95.7% 100.0%
Total املجموع 93 770 863
10.8% 89.2% 100.0%
اأنثى
Female
20 - 2910 175 185
5.4% 94.6% 100.0%
30 - 3912 249 261
4.6% 95.4% 100.0%
40 - 4912 262 274
4.4% 95.6% 100.0%
50 - 5917 131 148
11.5% 88.5% 100.0%
60 - 645 33 38
13.2% 86.8% 100.0%
Total املجموع 56 850 906
6.2% 93.8% 100.0%

55National Non-communicable Diseases Risk Factors Survey 2007
جدول A6 : ن�سبة انت�سار تدخني ال�سي�سة بني امل�ساركني ح�سب املحافظة واجلن�س
Table A6 : Prevalence of current shisha / water-pipe smoking by sex and governorate
اجلن�س
Sex Governorate
تدخني ال�سي�سة
Smoking shisha / water-pipe املجموع
Totalاملحافظة
Yes نعم No ال
ذكر
Male
Capital14 95 109
العا�سمة12.8% 87.2% 100.0%
Muharraq19 124 143
املحرق
13.3% 86.7% 100.0%
Northern23 271 294
ال�صمالية
7.8% 92.2% 100.0%
Central28 238 266
الو�سطى
10.5% 89.5% 100.0%
Southern9 42 51
اجلنوبية
17.6% 82.4% 100.0%
Total 93 770 863
املجموع10.8% 89.2% 100.0%
اأنثى
Female
Capital8 86 94
العا�صمة
8.5% 91.5% 100.0%
Muharraq9 145 154
املحرق
5.8% 94.2% 100.0%
Northern17 282 299
ال�صمالية
5.7% 94.3% 100.0%
Central21 288 309
الو�سطى
6.8% 93.2% 100.0%
Southern1 49 50
اجلنوبية
2.0% 98.0% 100.0%
Total 56 850 906
املجموع6.2% 93.8% 100.0%

56 National Non-communicable Diseases Risk Factors Survey 2007
جدول A7 : الن�ساط البدين اأثناء العمل ح�سب جن�س العامل واملحافظة
Table A7: Physical activity at work among working participants by sex and governorate
اجلن�س
Sex Governorate
الن�ساط البدين اأثناء العمل
Physical activity at workاملجموع
Total يقوم بن�ساط بدين اأثناء العملاملحافظة
Does activity at workال يقوم باأي ن�ساط بدين اأثناء العمل
No activity at workغري معروف
Unknown
ذكر
Male
Capital21 68 0 89
العا�صمة
23.6% 76.4% 0.0% 100.0%
Muharraq52 71 0 123
املحرق
42.3% 57.7% 0.0% 100.0%
Northern55 199 0 254
ال�صمالية
21.7% 78.3% 0.0% 100.0%
Central78 146 0 224
الو�سطى
34.8% 65.2% 0.0% 100.0%
Southern14 28 0 42
اجلنوبية
33.3% 66.7% 0.0% 100.0%
Total220 512 0 732
املجموع30.1% 69.9% 0.0% 100.0%
اأنثى
Female
Capital19 58 0 77
العا�صمة
24.7% 75.3% 0.0% 100.0%
Muharraq49 90 2 141
املحرق
34.8% 63.8% 1.4% 100.0%
Northern41 205 1 247
ال�صمالية
16.6% 83.0% 0.4% 100.0%
Central77 189 4 270
الو�سطى
28.5% 70.0% 1.5% 100.0%
Southern11 33 0 44
اجلنوبية
25.0% 75.0% 0.0% 100.0%
Total197 575 7 779
املجموع25.3% 73.8% 0.9% 100.0%

57National Non-communicable Diseases Risk Factors Survey 2007
جدول A8 : الن�ساط البدين للعاملني اأثناء العمل ح�سب �سدة الن�ساط واملحافظة وجن�س العامل
Table A8: Physical activity at work among working participants by activity intensity, worker’s sex and governorate
اجلن�س
Sexاملحافظة
Governorate
�سدة الن�ساط اأثناء العمل
Intensity of activity at workاملجموع
Totalن�ساط �سديد
Vigorous activity
ن�ساط متو�سط
Moderate activity
ن�ساط �سديد ومتو�سط
Vigorous & moderate
ن�ساط خفيف
Light activityال يقوم باأي ن�ساط
No activityغري معروف
Unknown
ذكر
Male
العا�صمة
Capital 3 6 5 4 68 3 89
3.4% 6.7% 5.6% 4.5% 76.4% 3.4% 100.0%
املحرق
Muharraq11 22 8 11 71 0 123
8.9% 17.9% 6.5% 8.9% 57.7% 0.0% 100.0%
ال�صمالية
Northern3 31 16 5 199 0 254
1.2% 12.2% 6.3% 2.0% 78.3% 0.0% 100.0%
الو�سطى
Central8 36 15 18 146 1 224
3.6% 16.1% 6.7% 8.0% 65.2% 0.4% 100.0%
اجلنوبية
Southern0 8 3 3 28 0 42
0.0% 19.0% 7.1% 7.1% 66.7% 0.0% 100.0%
Total املجموع 25 103 47 41 512 4 732
3.4% 14.1% 6.4% 5.6% 69.9% 0.5% 100.0%
اأنثى
Female
العا�صمة
Capital 1 14 0 3 58 1 77
1.3% 18.2% 0.0% 3.9% 75.3% 1.3% 100.0%
املحرق
Muharraq0 40 2 7 90 2 141
0.0% 28.4% 1.4% 5.0% 63.8% 1.4% 100.0%
ال�صمالية
Northern0 27 1 10 205 4 247
0.0% 10.9% 0.4% 4.0% 83.0% 1.6% 100.0%
الو�سطى
Central3 45 13 13 189 7 270
1.1% 16.7% 4.8% 4.8% 70.0% 2.6% 100.0%
اجلنوبية
Southern1 6 1 3 33 0 44
2.3% 13.6% 2.3% 6.8% 75.0% 0.0% 100.0%
Total املجموع 5 132 17 36 575 14 779
0.6% 16.9% 2.2% 4.6% 73.8% 1.8% 100.0%

58 National Non-communicable Diseases Risk Factors Survey 2007
جدول A9 : ن�سبة ممار�سة الن�ساط البدين اأثناء التنقالت ح�سب اجلن�س والفئة العمرية للم�ساركني
Table A9: Prevalence of physical activity as a means of transportation by age and sex
Sex اجلن�س الفئة العمرية
Age-group
الن�ساط البدين اأثناء التنقالت
Activity during transportation TotalYes نعم No ال Missing غري معروف
ذكر
Male
20-2987 149 0 236
36.9% 63.1% 0.0% 100.0
30-3975 139 1 215
34.9% 64.7% 0.5% 100.0
40-4990 161 1 252
35.7% 63.9% 0.4% 100.0
50-5968 69 0 137
49.6% 50.4% 0.0% 100.0
60-649 14 0 23
39.1% 60.9% 0.0% 100.0
Total املجموع 329 532 2 863
38.1% 61.6% 0.2% 100.0
اأنثى
Female
20-2965 120 0
0185
35.1% 64.9% 100.0
30-3976 185 0
0261
29.1% 70.9% 100.0
40-4996 178 0
0274
35.0% 65.0% 100.0
50-5954 94 0
0148
36.5% 63.5% 100.0
60-6417 21 0
038
44.7% 55.3% 100.0
Total املجموع 308 598 0
0906
34.0% 66.0% 100.0
جدول A10: ن�سبة انت�سار فرط �سغط الدم م�سخ�س �سابقا بني امل�ساركني ح�سب الفئة العمرية واجلن�س
Table A10 : Prevalence of history of diagnosed hypertension by age and sex
اجلن�س
Sexفرط �سغط الدم م�سخ�س �سابقا
History of hypertension
الفئة العمرية
Age-group املجموع
Total20-29 30-39 40-49 50-59 60-64
ذكر
Male
Positive history اإيجابية 15 21 36 39 9 120
6.4% 9.8% 14.3% 28.5% 39.1% 13.9%
Negative history سلبية� 221 184 215 98 14 742
93.6% 90.2% 85.3% 71.5% 60.9% 86.0%
Unknown history غري معروفة
0 0 1 0 0 1
0.0% 0.0% 0.4% 0.0% 0.0% 0.1%
Total املجموع236 215 252 137 23 863
100.0% 100.0% 100.0% 100.0 % 100. 0% 100.0%
اأنثى
Female
Positive history اإيجابية 6 24 51 60 28 169
3.2% 9.2% 18.6% 40.5% 73.7% 18.7%
Negative history سلبية� 179 236 223 88 10 736
96.8% 90.4% 81.4% 59.5% 26.3% 81.2%
Unknown history غري معروفة
0 1 0 0 0 1
0.0% 0.4% 0.0% 0.0% 0.0% 0.1%
Total املجموع 185 261 274 148 38 906
100.0% 100.0% 100.0% 100.0% 100.0% 100.0%

59National Non-communicable Diseases Risk Factors Survey 2007
جدول A11: ن�سبة انت�سار فرط �سغط الدم م�سخ�س �سابقا بني امل�ساركني ح�سب املحافظة واجلن�س
Table A11: Prevalence of history of diagnosed hypertension by governorate and sex
اجلن�س
Sexفرط �سغط الدم م�سخ�س �سابقا
History of hypertension
املحافظة
Governorateاملجموع
Totalالعا�سمة
Capital املحرق
Muharraqال�سمالية
Northernالو�سطى
Centralاجلنوبية
Southern
ذكر
Male
Positive history اإيجابية 12 22 34 43 9 120
11.0% 15.4% 11.6% 16.2% 17.6% 13.9%
Negative history سلبية� 97 121 259 223 42 742
89.0% 84.6% 88.1% 83.8% 82.4% 86.0%
Unknown history غري معروفة
0 0 1 0 0 1
0.0% 0.0% 0.3% 0.0% 0.0% 0.1%
Total املجموع109 143 294 266 51 863
100.0% 100.0% 100.0% 100.0% 100.0% 100.0%
اأنثى
Female
Positive history اإيجابية 10 38 45 64 12 169
10.6% 24.7% 15.1% 20.7% 24.0% 18.7%
Negative history سلبية� 84 116 253 245 38 736
89.4% 75.3% 84.6% 79.3% 76.0% 81.2%
Unknown history غري معروفة 0 0 1 0 0 1
0.0% 0.0% 0.3% 0.0% 0.0% 0.1%
Total املجموع94 154 299 309 50 906
100.0% 100.0% 100.0% 100.0% 100.0% 100.0%
جدول A12 : ن�سبة انت�سار مر�س ال�سكري م�سخ�س �سابقا ح�سب اجلن�س واملحافظة
Table A12: Prevalence of history of diagnosed diabetes mellitus by sex and governorate
اجلن�س
Sexمر�س ال�سكري م�سخ�س �سابقا
History of diabetes mellitus
املحافظة
Governorateاملجموع
Totalالعا�سمة
Capitalاملحرق
Muharraqال�سمالية
Northernالو�سطى
Centralاجلنويبة
Southern
ذكر
Male
Yes نعم 7 18 30 21 6 82
6.4% 12.6% 10.2% 7.9% 11.8% 9.5%
No ال 102 125 264 245 45 781
93.6% 87.4% 89.8% 92.1% 88.2% 90.5%
Total املجموع109 143 294 266 51 863
100.0% 100.0% 100.0% 100.0% 100.0% 100.0%
اأنثى
Female
Yes نعم
6 32 28 49 6 121
6.4% 20.8% 9.4% 15.9% 12.0% 13.4%
No ال 88 122 271 260 44 785
93.6% 79.2% 90.6% 84.1% 88.0% 86.6%
Total املجموع94 154 299 309 50 906
100.0% 100.0% 100.0% 100.0% 100.0% 100.0%

60 National Non-communicable Diseases Risk Factors Survey 2007
جدول A13 : ن�سبة انت�سار مر�س ال�سكري ح�سب طريقة اكت�ساف املر�س والفئة العمرية واجلن�س
Table A13 : Estimated prevalence of diabetes by method of detection, age and sex
اجلن�س
Sex Diabetes category
الفئة العمرية
Age-group املجموع
Totalطريقة االإكت�ساف
20-29 30-39 40-49 50-59 60-64
ذكر
Male
History of diagnosed diabetes
2 8 35 29 8 82م�سخ�س �سابقا
0.8% 3.7% 13.9% 21.2% 34.8% 9.5%
Newly detected diabetes(=>7.0 mmol.)
1 4 9 4 1 19مكت�سف من الدرا�سة
0.4% 1.9% 3.6% 2.9% 4.3% 2.2%
Impaired FBS (> 5.8 - <7.0 mmol.)
6 11 12 14 2 45 اختالل �سكر الدم مكت�سف من
%2.5الدرا�سة 5.1% 4.8% 10.2% 8.7% 5.2%
Not diabetic (< 5.8 mmol )
99 97 106 55 8 365غري م�ساب بال�سكري
41.9% 45.1% 42.1% 40.1% 34.8% 42.3%
Status unknown128 95 90 35 4 352
احلالة غري معروفة
54.2% 44.2% 35.7% 25.5% 17.4% 40.8%
Total 236 215 252 137 23 863
املجموع100.0% 100.0% 100.0% 100.0% 100.0% 100.0%
اأنثى
Female
History of diagnosed diabetes
5 16 37 48 15 121م�سخ�س �سابقا
2.7% 6.1% 13.5% 32.4% 39.5% 13.4%
Newly detected diabetes(=>7.0 mmol.)
0 5 14 11 1 31مكت�سف من الدرا�سة
0.0% 1.9% 5.1% 7.4% 2.6% 3.4%
ImpairedFBS (> 5.8 - <7.0 mmol.)
1 8 23 18 4 54 اختالل �سكر الدم مكت�سف من
%0.5الدرا�سة 3.1% 8.4% 12.2% 10.5% 6.0%
Not diabetic (< 5.8 mmol
97 145 131 50 14 437غري م�ساب بال�سكري
52.4% 55.6% 47.8% 33.8% 36.8% 48.2%
Status unknown82 87 69 21 4 263
احلالة غري معروفة
44.3% 33.3% 25.2% 14.2% 10.5% 29.0%
Total185 261 274 148 38 906
املجموع100.0% 100.0% 100.0% 100.0% 100.0% 100.0%

61National Non-communicable Diseases Risk Factors Survey 2007
جدول A14 : ن�سبة انت�سار ال�سكري بني امل�ساركني ح�سب طريقة اكت�ساف املر�س والفئة العمرية
Table A14 : Estimated prevalence of diabetes among participants by method of diabetes detection, governorate and sex
اجلن�س
SexDiabetes-category
املحافظة
Governorate املجموع
Total طريقة اكت�ساف مر�س
العا�سمةال�سكري
Capitalاملحرق
Muharraqال�سمالية
Northernالو�سطى
Centralاجلنوبية
Southern
ذكر
Male
History of diagnosed diabetes
7 18 30 21 6 82م�سخ�س �سابقا
6.4% 12.6% 10.2% 7.9% 11.8% 9.5%
Newly detected diabetes4 3 6 4 2 19
مكت�سف من الدرا�سة
3.7% 2.1% 2.0% 1.5% 3.9% 2.2%
Impaired FBS 4 16 15 9 1 45 اختالل �سكر الدم مكت�سف
%3.7من الدرا�سة 11.2% 5.1% 3.4% 2.0% 5.2%
Not diabetic 41 53 135 119 17 365
غري م�ساب بال�سكري
37.6% 37.1% 45.9% 44.7% 33.3% 42.3%
Status unknown53 53 108 113 25 352
احلالة غري معروفة
48.6% 37.1% 36.7% 42.5% 49.0% 40.8%
Total109 143 294 266 51 863
املجموع100.0% 100.0% 100.0% 100.0% 100.0% 100.0%
اأنثى
Female
History of diagnosed diabetes
6 32 28 49 6 121م�سخ�س �سابقا
6.4% 20.8% 9.4% 15.9% 12.0% 13.4%
Newly detected diabetes3 5 11 12 0 31
مر�س مكت�سف من الدرا�سة
3.2% 3.2% 3.7% 3.9% 0.0% 3.4%
Impaired FBS 9 12 16 16 1 54 اختالل �سكر الدم مكت�سف
%9.6من الدرا�سة 7.8% 5.4% 5.2% 2.0% 6.0%
Not diabetic 52 66 160 133 26 437
غري م�ساب بال�سكري
55.3% 42.9% 53.5% 43.0% 52.0% 48.2%
Status unknown24 39 84 99 17 263
احلالة غري معروفة
25.5% 25.3% 28.1% 32.0% 34.0% 29.0%
Total94 154 299 309 50 906
املجموع100.0% 100.0% 100.0% 100.0% 100.0% 100.0%

62 National Non-communicable Diseases Risk Factors Survey 2007
جدول A15 : ن�سبة انت�سار فرط الكولي�ستريول يف الدم ح�سب اجلن�س والفئة العمرية
Table A15 : Prevalence of hypercholesterolemia by sex and age
اجلن�س
Sexالفئة العمرية
Age-group
ن�سبة الكولي�سرتول يف الدم
Cholesterol blood levelاملجموع
Totalمرتفع
High>=5.2mmol/l
طبيعي / منخف�س
Normal / Low<5.2 mmol/l
ذكر
Male
20-2925 83 108
23.1% 76.9% 100.0%
30-3950 68 118
42.4% 57.6% 100.0%
40-4974 79 153
48.4% 51.6% 100.0%
50-5944 50 94
46.8% 53.2% 100.0%
60-649 8 17
52.9% 47.1% 100.0%
Total املجموع202 288 490
41.2% 58.8% 100.0%
اأنثى
Female
20-2921 80 101
20.8% 79.2% 100.0%
30-3953 121 174
30.5% 69.5% 100.0%
40-4988 110 198
44.4% 55.6% 100.0%
50-5969 53 122
56.6% 43.4% 100.0%
60-6421 11 32
65.6% 34.4% 100.0%
Total املجموع252 375 627
40.2% 59.8% 100.0%

63National Non-communicable Diseases Risk Factors Survey 2007
جدول A16 : ن�سبة انت�سار فرط الكولي�ستريول يف الدم ح�سب اجلن�س واملحافظة
Table A16: Prevalence of hypercholesterolemia by sex and governorate
اجلن�س
SexGovernorate
ن�سبة الكولي�سرول يف الدم
Hypercholesterolemiaاملجموع
Totalمرتفع املحافظة
High>=5.2mmol/l
طبيعي / منخف�س
Normal / Low<5.2 mmol/l
ذكر
Male
Capital20 32 52
العا�صمة
38.5% 61.5% 100.0%
Muharraq33 51 84
املحرق
39.3% 60.7% 100.0%
Northern78 102 180
ال�صمالية
43.3% 56.7% 100.0%
Central60 90 150
الو�سطى
40.0% 60.0% 100.0%
Southern11 13 24
اجلنوبية
45.8% 54.2% 100.0%
Total202 288 490
املجموع41.2% 58.8% 100.0%
اأنثى
Female
Capital31 41 72
العا�صمة
43.1% 56.9% 100.0%
Muharraq55 59 114
املحرق
48.2% 51.8% 100.0%
Northern76 136 212
ال�صمالية
35.8% 64.2% 100.0%
Central79 119 198
الو�سطى
39.9% 60.1% 100.0%
Southern11 20 31
اجلنوبية
35.5% 54.5% 100.0%
Total 252 375 627
املجموع40.2% 59.8% 100.0%

64 National Non-communicable Diseases Risk Factors Survey 2007
Appendix B: Data Collection Questionnare
يناير 2007 م
ا�ستبيان املقابلة امليدانية والقيا�سات الطبيعية )اخلطوة االأوىل والثانية(
امل�سح الوطني للأمرا�ض املزمنة
مملكة البحرينوزارة الصـــحــــة
* * * *رقم العينـــــــة1 *ا�سم / رمز املحافظة2
1. العا�سمة 2. املحرق 3 . ال�سمالية 4. الو�سطى 5. اجلنوبية
* *ا�سم / رمز املركز ال�سحي3* * *ا�سم / رمز الباحث امليداين4اليوم ** ال�سهر ** ال�سنة ** تاريخ اإمتام اإجراء املقابلة5
SignatureNameDateResponsibilityProcedure
InterviewerInterview Completed
InterviewerCoding Completed
Field SupervisorQuestionnaire Checked
Gov. CoordinatorData Validation Completed
Data entry StaffData entered
اأفراد العائلة الذين يحق لهم امل�ساركة يف امل�سح يف الفئة العمرية من 20 اإىل 64 �سنة )البدء بالذكور من االأكرب اإىل
االأ�سغر �سنًا، ثم االإناث من االأكرب اإىل االأ�سغر �سنًا(:
العمرتاريخ امليالداجلن�ساال�سمالرقم
1
2
3
4
5
6
7
8
9
10
رقم العينـــــــة * * * *

65National Non-communicable Diseases Risk Factors Survey 2007
اال�سم االأول وا�سم االأب1
ا�سم اجلد / لقب العائلة2
منزل: نقال: هاتف3
منزل: طريق: جممع: العنوان4
* * (Kish Table) رقم ال�سخ�س الذي مت اختياره بناءًا على جدول ك�س
اإذا مل يوافق ال�ســـخ�س الذي مت اختيــاره على اإجـــراء املقابلة الرجاء الرجـــوع اإىل امل�ســرف مالحظة هامة:
امليداين واإتباع التعليمات ال�سادرة منه.
الرجاء قراءة و�سرح الدرا�سة واأهدافها وطلب املوافقة على اال�سرتاك. املوافقة على اإجراء املقابلة:
الرقم ال�سكاين للم�سرتك الذي مت اختياره * * * * * * * * *
هل وافق امل�سرتك؟ *11 نعم
2 ال اإذا كانت االإجابة ال، اإنهي املقابلة واخطر امل�سرف حاال
دقيقة، �ساعة **:**وقت بدء اإجراء املقابلة )نظام 24 �ساعة(2
رقم العينـــــــة * * * *
)C( اخلطوة االأوىل: معلومات دميوغرافية اأ�سا�سية
عمود الرتميزخيارات االإجابة
C1اجلن�س ذكر 1
*اأنثى 2C2
تاريخ الوالدة
)C3( اإذا مل يعرف، انتقل اإىل* * * * اليوم ** ال�سهر ** ال�سنة
C3كم عمرك؟
* * * * ....................... �سنة
C6ما هي اأعلى مرحلة تعليمية اأنهيتها؟
1 اأمي
2 اقل من املرحلة االبتدائية – يقراأ ويكتب
3 املرحلة االبتدائية
4 املرحلة املتو�سطة )االإعدادية(
5 املرحلة الثانوية
6 دبلوم )اأو ما يعادله(
7 درا�سات جامعية )بكالوريو�س(
8 درا�سات عليا )ماج�ستري- دكتوراه(
* *
C7اأي من الفئات التالية ت�سف جيدُا عملك
االأ�سا�سي خالل االإثنا ع�سر �سهرا االأخرية؟
1 موظف حكومي
2 موظف غري حكومي )قطاع خا�س(
3 اأعمال حرة
4 عمل غري مدفوع )متطوع(
5 عمل غري م�ستمر باجرة )دوام جزئي(
6 تلميذ / طالب
7 ربة منزل
8 متقاعد
9 عاطل عن العمل )قادر علي العمل(
10 عاطل عن العمل )غري قادر علي العمل(
* *

66 National Non-communicable Diseases Risk Factors Survey 2007
رقم العينـــــــة * * * *
عمود الرتميزخيارات االإجابة
C8اأفرادكم فردًا يعي�س يف هذا املنزل مبا فيهم اأنت؟ ..............* *C11غرفكم غرفة ت�ستخدم للنوم يف املنزل؟ .................* *C12فردا / اأفرادكم فردًا من هذا املنزل يعمل مبا فيهم اأنت؟ ..............* *C13ما هو اإجمايل الدخل ال�سهري لالأ�سرة
اأقل من 150. 1 د.ب
150 -500. 2 د.ب.
اأكرث من 500. 3 د.ب
*
C14مراتخالل ال�سنة املا�سية كم مرة زار اأفراد االأ�سرة عيادات خا�سة .............* *C15
خالل ال�سنة املا�سية كم مرة زار اأفراد االأ�سرة م�ست�سفيات
خا�سة؟* *............. مرات
C16خالل ال�سنة املا�سية كم بلغ اإجمايل ما اأنفقته االأ�سرة علي
العالج واالأدوية )با�ستثناء ق�سط التاأمني ال�سحي اخلا�س(؟* * * *................ د.ب.
C17ما هو ق�سط التاأمني ال�سحي اخلا�س ال�سنوي لكل فرد من
االأ�سرة؟ * * * ........... د.ب. لكل فرد
اخلطوة االأوىل: البيانات ال�سلوكية االأ�سا�سية
االآن �سوف اطرح بع�س االأ�سئلة حول خمتلف ال�سلوكيات ال�سحية. هذه االأ�سئلة تت�سمن موا�سيع مثل التدخني، �سرب
الكحول، تناول اخل�سار و الفاكهة و الريا�سة البدنية. لنبداأ بالتدخني.
ا�ستعمال التبغ )S( - ال�سيجارة وال�سيجار وال�سبيل
تعليماتعمود الرتميزخيارات االإجابة
S1aهل تدخن حاليًا اأى نوع من ال�سجائر، ال�سيجار
)اجلروت(، اأو ال�سبيل )بايب(؟
1 نعم
2 اإذا ال S4 f*ال
S1bاإذا كان اجلواب نعم، هل تدخن حاليًا ال�سيجارة اأو
ال�سيجار اأو ال�سبيل يوميًا؟
1 نعم
2 *ال
S2aكم كان عمرك عندما بداأت تدخن ال�سيجارة اأو ال�سيجار
اأو ال�سبيل؟اإذا عرفS3 f **............ �سنة
S2bf77 اإذا
S2b
هل تذكر منذ متى بداأت تدخن ال�سيجارة اأو ال�سيجار اأو
ال�سبيل ؟
..................... �سنوات
..................... ا�سهر
..................... اأ�سابيع
******
S3
ما هو معدل اإ�ستهالكك اليومي الأي من هذه االأنواع؟
................ �سيجارة
.............. �سيجارة لف
.............. �سيجار/ �سيجار �سغري
.............. بايب )�سبيل(
............. اأخرى :................
**********
S9ما املدة التي تنق�سي بني اال�ستيقاظ وتدخني اأول �سيجارة
اأو �سيجار اأو �سبيل؟
اقل من 30. 1 دقيقة
30. 2 دقيقة اإىل �ساعةاكرث من �ساعة 3 .
* S10 a f
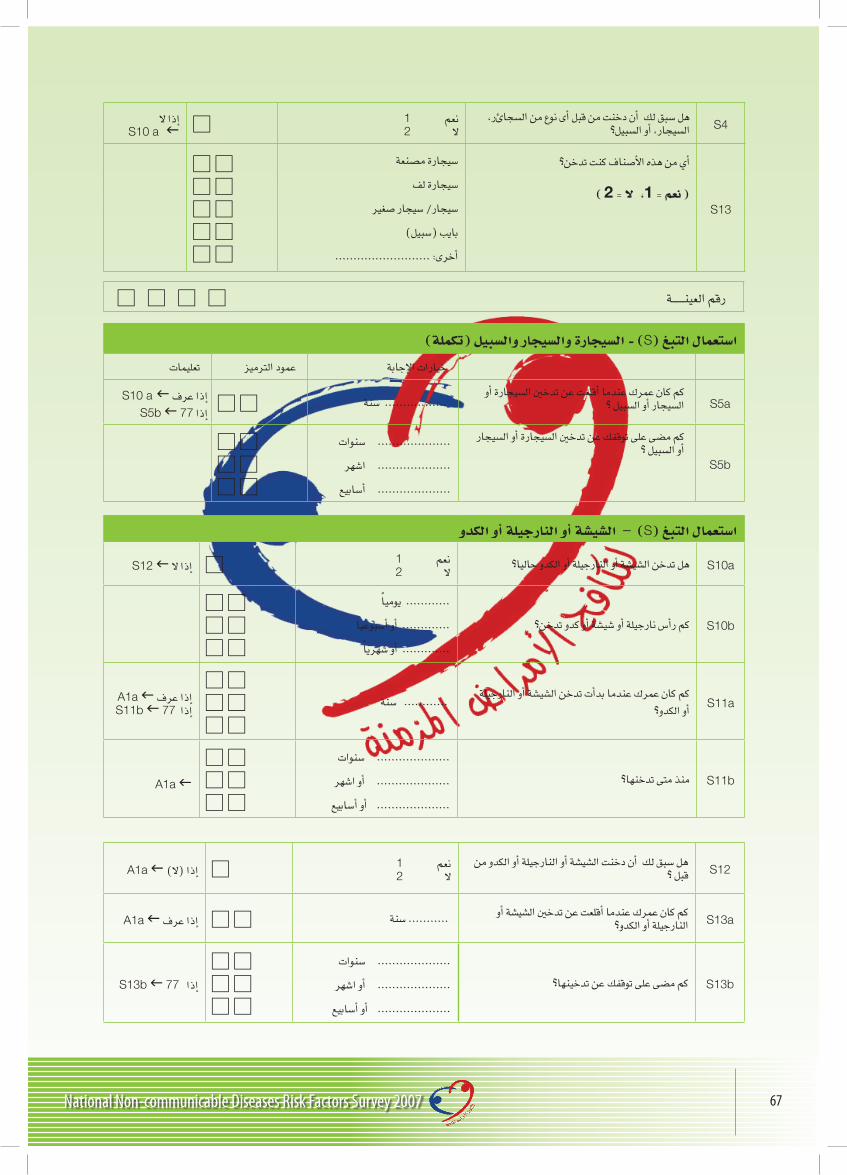
67National Non-communicable Diseases Risk Factors Survey 2007
رقم العينـــــــة * * * *
S4هل �سبق لك اأن دخنت من قبل اأى نوع من ال�سجائر،
ال�سيجار، اأو ال�سبيل؟
1 نعم
2 اإذا ال*ال
S10 a f
S13
اأي من هذه االأ�سناف كنت تدخن؟
) نعم = 1، ال = 2 (
�سيجارة م�سنعة
�سيجارة لف
�سيجار/ �سيجار �سغري
بايب )�سبيل(
اأخرى: ..........................
**********
ا�ستعمال التبغ )S( - ال�سيجارة وال�سيجار وال�سبيل )تكملة(
تعليماتعمود الرتميزخيارات االإجابة
S5aكم كان عمرك عندما اأقلعت عن تدخني ال�سيجارة اأو
اإذا عرف S10 a f **................. �سنة ال�سيجار اأو ال�سبيل ؟
S5b f 77 اإذا
S5b
كم م�سى على توقفك عن تدخني ال�سيجارة اأو ال�سيجار
اأو ال�سبيل ؟.................... �سنوات
.................... ا�سهر
.................... اأ�سابيع
******
ا�ستعمال التبغ )S( – ال�سي�سة اأو النارجيلة اأو الكدو
S10aهل تدخن ال�سي�سة اأو النارجيلة اأو الكدو حاليا؟1 نعم
2 اإذا ال S12 f *ال
S10bكم راأ�س نارجيلة اأو �سي�سة اأو كدو تدخن؟
............ يوميًا
............. اأو اأ�سبوعيا
............. اأو �سهريًا
******
S11aكم كان عمرك عندما بداأت تدخن ال�سي�سة اأو النارجيلة
اأو الكدو؟ ............ �سنة
******
A1a f اإذا عرف
S11b f 77 اإذا
S11bمنذ متى تدخنها؟
.................... �سنوات
.................... اأو ا�سهر
.................... اأو اأ�سابيع
******
A1a f
S12هل �سبق لك اأن دخنت ال�سي�سة اأو النارجيلة اأو الكدو من
قبل ؟
1 نعم
2 اإذا )ال( A1a f*ال
S13aكم كان عمرك عندما اأقلعت عن تدخني ال�سي�سة اأو
النارجيلة اأو الكدو؟ اإذا عرف A1a f ** ........... �سنة
S13bكم م�سى على توقفك عن تدخينها؟
.................... �سنوات
.................... اأو ا�سهر
.................... اأو اأ�سابيع
******
S13b f 77 اإذا

68 National Non-communicable Diseases Risk Factors Survey 2007
)A( تعاطي الكحول
�ساأقوم ب�سوؤالك عن تعاطي امل�سروبات الكحولية، وهو �سوؤال مهم للدرا�سة مع �سمان اأن تكون هذه املعلومات �سرية للغاية
تعليماتعمود الرتميزخيارات االإجابة
A1aهل �سبق اأن تعاطيت م�سروبُا كحوليُا
مثل برية، نبيذ، وي�سكي، عرق، الخ
...؟
1 نعم
2 اإذا ال D1a f*ال
A1bاإذا كان اجلواب نعم، هل كان ذلك
خالل االإثناع�سر �سهر االأخرية؟
1 نعم
2 اإذا ال D1a f*ال
A2خالل االثناع�سر �سهر االأخرية، كم
مرة �سربت و لو م�سروبًا واحدًا؟
1 5 اأيام اأو اأكرث اأ�سبوعيا 1 - 4 اأيام اأ�سبوعيا 23 1 - 3 اأيام �سهريا 4 اقل من مرة يف ال�سهر
*
A3معدل كم علبة �سغرية اأو كاأ�س من
ال�سراب ت�سرب يف املرة الواحدة**العدد: ................. علبة / كاأ�س
A4
خالل ال�سبعة اأيام االأخرية، كم
م�سروبًا )مقيا�س عادي( من الكحول
�سربت كل يوم؟
علبة اأو قنينة برية �سغرية،
كاأ�س نبيذ متو�سط احلجم،
مقيا�س عادي من ال�سراب الثقيل
)وي�سكي، اإلخ ...(
ال�سبت : .............
االأحد : ..............
االثنني : ............
الثالثاء : .............
االأربعاء : .............
اخلمي�س : .............
اجلمعة : ..............
**************
رقم العينـــــــة * * * *

69National Non-communicable Diseases Risk Factors Survey 2007
رقم العينـــــــة * * * *
)D( التغذية
تعليماتعمود الرتميزخيارات االإجابة
D1aكم يومًا يف االأ�سبوع عادة )اأي يف غري املنا�سبات(
تتناول الفاكهة الطازجة؟اإذا ال D2a f**............ اأيام
D1bكم ح�سة من الفواكه الطازجة اأو الع�سري الطازج
تتناولها عادة كل يوم؟
........... ح�سة )قطعة متو�سطة من
الفاكهة، 10حبات عنب اأو كرز، 2/1 كوب
�سلطة فواكه اأو ع�سري(**
D2aكم يومًا يف االأ�سبوع عادة تتناول اخل�سار الطازجة ؟اإذا ال D5 f*............. اأيام
D2bكم ح�سة من اخل�سار تتناول عادة كل يوم ؟
.......... ح�سة )كوب خ�سار طازجة، 2/1
**كوب خ�سار مطبوخة اأو ع�سري(كم مرة يف االأ�سبوع عادة ) اأي غري املنا�سبات( تتناول اأي من اأنواع االأطعمة التالية؟
D5مرات يف االأ�سبوعرطب / متر ...............**D6مرات يف االأ�سبوعحلم بقر اأو غنم ...............**D7)مرات يف االأ�سبوعمنتوجات اللحم )همربجر، نقانق، �ساورما ...............**D8مرات يف االأ�سبوعحلم دجاج ...............**D9 مرات يف االأ�سبوع�سمك ...............**D10مرات يف االأ�سبوعروبيان ...............**D11مرات يف االأ�سبوعبي�ض ...............**D12
مك�سرات )ف�ستق ، كازو ، فول �سوداين –
�سمبل(**............... مرات يف االأ�سبوع
D13)مرات يف االأ�سبوعبقوليات )باقلة ، نخي ، فا�سوليا ...............**D14مرات يف االأ�سبوعكم مرة يف االأ�سبوع عادة ت�سرب احلليب؟ ...............**
D15ما نوع احلليب الذي عادة ت�سربه؟
كامل الد�سم 1
قليل الد�سم 2
خايل الد�سم 3
نوع اآخر : .................... 4
منوع 5
*
D16 كم مرة يف االأ�سبوع عادة تتناول اأي من م�ستقات
احلليب )اجلنب، الروب، اللنب؟**............... مرات يف االأ�سبوع
D17ما النوع الذي عادة تتناوله من هذه امل�ستقات؟
كامل الد�سم 1
قليل الد�سم 2
خايل الد�سم 3
نوع اآخر : ..................... 4
منوع 5
*

70 National Non-communicable Diseases Risk Factors Survey 2007
رقم العينـــــــة * * * *
التغذية )D( - تكملة
تعليماتعمود الرتميزخيارات االإجابة
D18كم مرة يف االأ�سبوع عادة تتناول الرز اأو
املكرونة؟**............... مرات يف االأ�سبوع
D19كم مرة يف االأ�سبوع تتناول اخلبز
واحلبوب )كورن فالك�س( عادة؟**............... مرات يف االأ�سبوع
D20اأي نوع من اخلبز تتناول عادة؟
1 اأبي�س
2 اأ�سمر )بني(
3 اآخر: ...................
*
D3ما نوع الزيت اأو ال�سمن الذي ت�ستخدمه
غالبًا يف حت�سري الطعام؟
1 زيت نباتي
2 زبده اأو �سمن
3 مرجا رين
4 اآخر: .............................
5 ال يوجد نوع حمدد
6 ال ا�ستخدم اأي نوع
*
D4هــل ت�ستخدم زيت الزيتون يف اإعداد
الطعام غري املطبوخ يف املنزل؟
1 ال اأ�ستخدمه على االإطالق
2 نادراً
3 اأحيانا
4 كثرياً
5 دائماً
*
D21هل تتبع اأي نوع من احلمية )الرجيم /
نظام غذائي(؟
1 ال اأتبع اأي نوع
اأدوية 2
3 اأع�ساب
4 رجيم غذائي
اأتبع اأكرث من نوع 5
*
D22هل مت و�سف هذه احلمية لك من قبل
اأخ�سائي؟
1 نعم
2 ال *
D23هل ت�سيف مادة حملية بديلة
لل�سكر)sweetener(لل�ساي اأو للقهوة
اأو للطعام؟
1 ال اأ�سيفها على االإطالق
2 نادراً
3 اأحيانا
4 كثرياً
5 دائماً
*
D24هل ت�سرب اأي من امل�سروبات الغازية؟1 نعم
2 ال *P1 f اإذا ال
D25اإذا كان اجلواب نعم، اأي االأنواع ت�سرب؟
1 عادي
2 )Diet( قليل ال�سعرات
3 النوعني
*
D26معدل كم علبة اأو قنينة )غر�سة( ت�سرب
ا�سبوعيا؟
العادي: ................علبة/قنينة يف االأ�سبوع
قليل ال�سعرات: .......علبة/قنينة يف االأ�سبوع
****

71National Non-communicable Diseases Risk Factors Survey 2007
رقم العينـــــــة * * * *
)P( الن�ساط البدين
و االآن �سوف اأ�ساألك عن الوقت الذي مت�سيه مبمار�سة اأنواع خمتلفة من الن�ساط البدين. اأرجو االإجابة على هذه االأ�سئلة حتى لو مل تكن
ريا�سيًا. فكر اأوال بالوقت الذي مت�سيه يف العمل �سواء كان باأجرة اأو بدون اأجرة، اأعمال منزلية، زراعة اأو �سيد.
تعليماتعمود الرتميزخيارات االإجابة
P1
هل طبيعة عملك يغلب عليها اجللو�س اأو
الوقوف واإذا م�سيت ال تزيد مدة امل�سي عن
ع�سر دقائق يف املرة الواحدة؟
نعم 1
ال 2*P6 fاإذا نعم
P2هل تقوم باأن�سطة �ساقة مثل احلمل الثقيل،
احلفر، بناء....ملدة ع�سرة دقائق على االأقل
كل مرة تنجز فيها عمل؟
نعم 1
اإذا الP4 f*ال 2
P3aكم يوم يف االأ�سبوع تقوم بن�ساط �ساق كجزء
من عملك؟
**............. اأيامP3b
كم �ساعة اأو دقيقة عمل يف اليوم الواحد
تق�سيها يف هذا الن�ساط ال�ساق؟**:** .......... �ساعة / ....... دقيقة
دقيقة �ساعة
P4
هل ي�سمل عملك اأن�سطة متو�سطة ال�سدة مثل
امل�سي ال�سريع، حمل اأ�سياء خفيفة الوزن
ملدة ع�سر دقائق على االأقل كل مرة -------
توؤدي فيها عمل؟
نعم 1
ال 2* P6 fاإذا ال
P5aكم من اأيام االأ�سبوع يتوجب عليك الن�ساط
املتو�سط؟
*............. اأيام
P5bكم من الوقت ت�ستغرق يف اليوم الواحد
الإجناز هذا الن�ساط املتو�سط؟
**:** .......... �ساعة / ....... دقيقة دقيقة �ساعة
P6 ساعات **كم عدد �ساعات يوم عملك االعتيادي؟� ................
غري االأن�سطة التي ذكرتها االآن، اأود اأن اأ�ساألك عن طريقة تنقلك من و اإىل اأماكن اعتيادية مثاًل اإىل عملك، للت�سوق، لل�سالة.
P7
هل مت�سي اأو تركب دراجة لكي تذهب اإىل اأي
من تلك االأماكن ملدة ع�سر دقائق متوا�سلة
على االأقل؟
نعم 1
ال 2*P9 fاإذا ال
P8aكم يوما يف االأ�سبوع العادي مت�سي اأو ت�ستعمل
الدراجة من و اإىل اأي مكان؟
*............. اأيام
P8bيف املتو�سط كم �ساعة اأو دقيقة يف اليوم مت�سي
اأو ت�ستخدم الدراجة؟
**:** .......... �ساعة / ....... دقيقة دقيقة �ساعة

72 National Non-communicable Diseases Risk Factors Survey 2007
رقم العينـــــــة * * * *
االأ�سئلة التالية تتعلق بالن�ساطات التي تقوم بها خالل وقت الفراغ مثال الريا�سة اأو ال�سباحة، ال تتحدث عن االأن�سطة البدنية املتعلقة
بالعمل اأو بالتنقالت التي ذكرتها �سابقًا.
تعليماتعمود الرتميزخيارات االإجابة
P9هل تقوم يف وقت فراغك العادي باأي ن�ساط بدين
يزيد عن ع�سر دقائق كل مرة؟
نعم 1
ال 2*P14 fاإذا ال
P10
هل تقوم يف وقت الفراغ بن�ساط �ساق مثل اجلري،
ع�سر ملدة ..... البناء احلفر، الثقيل، احلمل
دقائق على االأقل كل مرة تقوم فيها بن�ساط؟
نعم 1
ال 2*P12 f اإذا ال
P11aاإذا كان اجلواب نعم، كم يوما يف االأ�سبوع العادي
تقوم بن�ساط �ساق كجزء من وقت فراغك؟*............. اأيام
P11bت�ستغرق يف هذا الوقت من كم العادي، اليوم يف
العمل ال�ساق؟**:** .......... �ساعة / ....... دقيقة
دقيقة �ساعة
P12
هل تقوم يف وقت فراغك باأن�سطة متو�سطة ال�سدة،
اأ�سياء حمل دراجة، ركوب ال�سريع، امل�سي مثل
خفيفة الوزن ملدة ع�سر دقائق على االأقل كل مرة؟
نعم 1
اإذا ال P14 f*ال 2
P13aتقوم االأ�سبوع يف يوما كم نعم، اجلواب كان اإذا
باأن�سطة متو�سطة ال�سدة كجزء من وقت الفراغ؟*............. اأيام
P13b
الن�ساط الإجناز ت�ستغرقها دقيقة او �ساعة كم
من العادي اليوم يف الفراغ وقت خالل املتو�سط
اأيام االأ�سبوع؟.......... �ساعة / ....... دقيقة
**:** دقيقة �ساعة
االأ�سئلة التالية تتعلق باجللو�س اأو اال�ستلقاء. تذكر ال�سبعة اأيام املا�سية، خالل العمل اأو الفراغ، يف البيت اأو خارجه،
خالل زيارة االأ�سحاب اأو القراءة اأو م�ساهدة التلفاز، لكن ال ت�سمل اأوقات النوم.
P14خالل االأ�سبوع الفائت كم �ساعة اأو دقيقة
ق�سيتها جال�سًا اأو م�ستلقيا يف اليوم؟**:** .......... �ساعة / ....... دقيقة
دقيقة �ساعة

73National Non-communicable Diseases Risk Factors Survey 2007
رقم العينـــــــة * * * *
الق�سم املو�سع )H( : تاريخ ارتفاع �سغط الدم
تعليماتعمود الرتميزخيارات االإجابة
H1متى اأخر مرة مت قيا�س �سغط الدم لك من
قبل طبيب اأو ممر�س؟
مل يق�س 0
1 خالل اأقل من �سنة
2 1 – 5 �سنوات
3 اأكرث من خم�س �سنوات
*
H2aهل اأخربك طبيب اأو ممر�س اأن لديك �سغط
دم مرتفع؟
1 نعم
2 ال *H6 f إذا ال
H2bاإذا نعم، متى مت اإخبارك الأول مرة اأن
لديك �سغط دم مرتفع؟
................... �سنة
................... �سهر
................... يوم
******
هل تاأخذ اأو تتبع حاليا اأي من هذه العالجات ل�سغط الدم املرتفع بناءا على ما و�سفه الطبيب؟
H3aاأدوية تناولتها خالل االأ�سبوعني االأخريين1 نعم
2 ال *
H3bحمية غذائية خا�سة مت و�سفها لك1 نعم
2 ال *
H3cن�سيحة اأو عالج لتخفيف الوزن1 نعم
2 ال *
H3dن�سيحة اأو عالج لالإقالع عن التدخني )اإذا
كنت مدخنا(
1 نعم
2 ال *
H3eن�سيحة لبدء اأو لزيادة الن�ساط البدين1 نعم
2 ال *
H4
خالل االثنا ع�سر �سهرا االأخرية، هل قابلت
معاجلا يف الطب التقليدي / طب اأع�ساب
ملعاجلة ارتفاع �سغط الدم؟
1 نعم
2 ال *
H5هل تتابع حاليا اأي من عالجات االأع�ساب اأو
من العالجات التقليدية الرتفاع �سغط الدم؟
1 نعم
2 ال *

74 National Non-communicable Diseases Risk Factors Survey 2007
رقم العينـــــــة * * * *
الق�سم املو�سع )H( : تاريخ داء ال�سكري
تعليماتعمود الرتميزخيارات االإجابة
H6هل قمت بقيا�س معدل ال�سكر يف الدم خالل االإثني
ع�سر �سهرا االأخرية؟
1 نعم
2 ال *
H7aهل اأخربك الطبيب اأنك م�ساب بال�سكري؟1 نعم
2 ال *H11 f إذا ال
H7bمتى مت اإخبارك الأول مرة انك م�ساب بال�سكري ؟
................... �سنة
................... �سهر
................... يوم
******
هل تاأخذ اأي من العالجات التالية لل�سكري و�سفت لك من قبل الطبيب ؟
H8aاإن�سولني1 نعم
2 ال *
H8bاأقرا�س )حبوب( خالل االأ�سبوعني االأخريين1 نعم
2 ال *
H8cحمية غذائية خا�سة1 نعم
2 ال *
H8dن�سيحة اأو عالج لتخفيف الوزن1 نعم
2 ال *
H8eكنت )اإذا التدخني عن لالإقالع عالج اأو ن�سيحة
مدخنًا(
1 نعم
2 ال *
H8fن�سيحة لبدء اأو لزيادة الن�ساط البدين1 نعم
2 ال *
H9خالل االإثنا ع�سر �سهرا االأخرية، هل قابلت معاجلا
يف الطب التقليدي / طب اأع�ساب ملعاجلة ال�سكري؟
1 نعم
2 ال *
H10من اأو االأع�ساب عالجات من اأي حاليا اأخذ هل
العالجات التقليدية الرتفاع لل�سكري؟
1 نعم
2 ال *
الق�سم املو�سع )H( : تاريخ اأمرا�س مزمنة اأخرى
H11الربو1 نعم
2 ال *
H12ورم خبيث1 نعم
2 ال *
H13: )مر�س اآخر )اذكره1 نعم
2 ال *

75National Non-communicable Diseases Risk Factors Survey 2007
رقم العينـــــــة * * * *
اأ�سئلة اإ�سافية حول مو�سوع ال�سالمة
K1هل ت�ستعمل حزام االأمان عند قيادتك ال�سيارة؟
1 دائماً
2 اأحياناً
3 ال
*
K2هل ت�سع طفلك يف الكر�سي اخلا�س باالأطفال عندما تقود
ال�سيارة؟
1 دائماً
2 اأحياناً
3 ال
*
K3هل ت�سمح لطفلك )دون العا�سرة( باجللو�س يف املقعد
االأمامي؟
1 دائماً
2 اأحياناً
3 ال
*
**:** وقت انتهاء املقابلة بال�ساعات والدقائق دقيقة �ساعة
رقم العينـــــــة * * * *
اخلطوة الثانية: املقايي�س البدنية
عمود الرتميزقيا�س �سغط الدم
M1الرمز التعريفي للباحث امليداين* * *M10الرمز التعريفي جلهاز قيا�س ال�سغط* * *
M12a
M12b
1 قراءة
�سغط الدم االنقبا�سي
�سغط الدم االنب�ساطي
مم زئبق
مم زئبق
* * ** * *
M13a
M13b
2 قراءة
�سغط الدم االنقبا�سي
�سغط الدم االنب�ساطي
مم زئبق
مم زئبق
* * ** * *
M14a
M14b
3 قراءة
�سغط الدم االنقبا�سي
�سغط الدم االنب�ساطي
مم زئبق
مم زئبق
* * ** * *
M15
هل كنت تاأخذ عالج عن ارتفاع �سغط الدم خالل
االأ�سبوعني ال�سابقني بو�سفة من طبيب؟
1 نعم
2 ال *
رقم العينـــــــة * * * *

76 National Non-communicable Diseases Risk Factors Survey 2007
قيا�س الطول و الوزن
M1الرمز التعريفي للباحث امليداين* * *M2
a & bالرمز التعريفي جلهاز قيا�س الطول و الوزن
2a الطول
2b الوزن * * ** * *
M3ســـــــمالطول )دون احلذاء( بال�سنتيمرت�* * *.*M4
الوزن )اإذا كان ال�سخ�س ثقيل على امليزان، اأعطى
الرمز 666.6(*.* * *كيلوغرام
M5للن�ساء فقط
هل اأنت حامل حاليًا؟
1 نعم
2 ال *

77National Non-communicable Diseases Risk Factors Survey 2007
App
endi
x C:
NCD
Sur
vey
Impl
emen
tati
on T
imef
ram
e
Task
2006
2007
2008
2009
Q4
Q1
Q2
Q3
Q4
Q1
Q2
Q3
Q4
Q1
Q2
Q3
Q4
Rev
isio
n of
Pro
toco
l
Sam
ple
With
draw
al
Pre
para
tions
for
Fiel
d W
ork
S
elec
tion
of in
terv
iew
ers
T
rain
ing
of fi
eld
wor
kers
Med
ia C
ampa
ign
Dat
a M
anag
emen
t
D
ata
colle
ctio
n
T
rain
ing
of d
ata
entr
y st
aff
D
ata
editi
ng a
nd v
alid
atio
n
D
ata
anal
ysis
Dra
ft R
epor
t Pro
duct
ion
Fina
l Rep
ort P
rodu
ctio
n