Infectious Respiratory Diseases Communicable Diseases Unit Lesson 2.

1
National Tuberculosis and Other Respiratory Communicable
Diseases Program
Annual Report2019-2020


ii
ACKNOWLEDGEMENTS
The Ministry of Health and Rwanda Biomedical Centre gratefully acknowledge the Government of Rwanda through strong leadership of H.E the President of Republic of Rwanda for the continuous support to fight TB and ORD in Rwanda.
Our gratitude goes out to:
● The staff from different Health Facilities who continue to provide care and treatment to patients and implement activities according to the national policies and guidance.
● To all stakeholders including Civil Society Organizations (CSO) and NGOs for their great contribution.
We would also like to thank the following partners: World Health Organization, Global Fund for HIV&AIDS, TB and Malaria, USG PEPFAR, KNCV and Action Damien who support the government of Rwanda to reach the global targets by ensuring that Rwanda is free of Tuberculosis and Leprosy.

iii
TABLE OF CONTENTS
FOREWORD ............................................................................................................................. i ACKNOWLEDGEMENTS ..................................................................................................... ii TABLE OF CONTENTS ....................................................................................................... iii LIST OF TABLES ................................................................................................................... v
LIST OF FIGURES ................................................................................................................. vi LIST OF ANNEXES .............................................................................................................. vii ABBREVIATIONS .............................................................................................................. viii
Centers for Disease Control and Prevention .................................................................. viii
EXECUTIVE SUMMARY .................................................................................................... xi
CHAPTER I: TUBERCULOSIS AND OTHER RESPIRATORY COMMUNICABLE
DISEASES CONTROL ........................................................................................................... 1 1. CONSIDERING THE PATIENT PATHWAY FOR TUBERCULOSIS: .................................... 1
1.1. Accelerating early screening and appropriate diagnosis of TB ................. 1
1.2. Quality of care and ensuring a cure, including aDSM and patient support ............................................................................................................................. 7
1.2.1. Treatment outcome............................................................................................. 7
1.3. Promoting care seeking and prevention through community engagement ................................................................................................................... 10
2. TARGETED APPROACHES FOR KEY DRIVERS OF TB EPIDEMIC AND SELECTED
POPULATIONS: ........................................................................................................................................... 12
2.1. Enhancing Programmatic Management of Drug – Resistant Tuberculosis .................................................................................................................. 12
2.1.1. Diagnostic and Notification of MDR-TB .................................................. 12
2.2. Ensuring prevention, diagnosis and treatment of Childhood Tuberculosis .................................................................................................................. 17
2.3. Strengthening management of TB / HIV and other co-morbidities .. 19
2.4. Ensuring diagnosis and management of Lung health diseases .......... 21
2.5. Promote intensified screening and diagnosis of high-risk group (HRG) populations ...................................................................................................... 22
3. PROGRAMMATIC MANAGEMENT, MULTI-SECTORAL COLLABORATION &
ENGAGING ALL CARE PROVIDERS ...................................................................................................... 26
3.1. Political commitment with adequate resources (human, financial, equipment and infrastructure) for tuberculosis care and prevention ............. 26
3.2. Management of tuberculosis care and prevention ................................. 26
3.3. Engagement of communities, civil society organizations, and public and private care providers ......................................................................................... 29
3.4. Migrant and cross boarder .......................................................................... 31
3.5. TB infection prevention & control (IPC) .................................................. 31
4. UNIVERSAL HEALTH COVERAGE, SOCIAL PROTECTION, HUMAN RIGHTS &
GENDER, NUTRITION .............................................................................................................................. 33
4.1. Universal Health Coverage and social protection ...................................... 33
iv
4.2. Human rights and gender ............................................................................ 33
4.3. Social Protection and patient support ...................................................... 34
5. STABLE AND QUALITY ASSURED SUPPLY OF DRUGS, DIAGNOSTICS AND
COMMODITIES ........................................................................................................................................... 35
5.1. Supply chain management .............................................................................. 35
5.2. Rational use of medicine .............................................................................. 38
6. M&E AND DATA QUALITY SYSTEM (E-TB, HEALTH INFORMATION SYSTEM, CIVIL
REGISTRATION AND VITAL STATISTICS (CRVS) SYSTEM ........................................................... 40
6.1. Surveillance system including mortality registration ............................... 40
7. DATA FOR PROGRAMMATIC MONITORING, EVALUATION, LEARNING AND
PLANNING ................................................................................................................................................... 42
7.1. Evidence generation and use of electronic data systems ......................... 42
8. RESEARCH PRIORITIES ............................................................................................................. 47
8.1. Research strengthening ................................................................................... 47
CHAPTER II: LEPROSY CONTROL ................................................................................. 49 1. STRENGTHEN GOVERNMENT OWNERSHIP, COORDINATION AND PARTNERSHIP,
INCLUDING STRENGTHENING SURVEILLANCE AND HEALTH INFORMATION SYSTEMS.
.......................................................................................................................................................................... 49
1.1. Ensuring political commitment, advocacy, and resource mobilization by engaging all stakeholders for leprosy elimination. ......................................... 49
1.2. Strengthening surveillance and health information systems for program planning, monitoring and evaluation ..................................................................... 50
2. STOP LEPROSY AND ITS COMPLICATIONS .......................................................................... 50
2.1. Strengthening patient and community awareness on leprosy ................ 50
2.2. Enhancing early case detection of leprosy in the community through active case finding and contact management. ...................................................... 51
2.3. Treating all leprosy cases detected with adequate multidrug therapy (MDT) 52
2.4. Reinforcing adherence to treatment ......................................................... 53
2.5. Strengthening prevention of disabilities and ensuring proper care. . 53
2.6. Ensuring capacity building of health professionals to scale up access to intervention and sustain expertise in leprosy .................................................. 54
3. STOP DISCRIMINATION AND PROMOTE SOCIO-ECONOMICAL INCLUSION .................................................................................................................. 55
3.1. Stopping discrimination .................................................................................. 55
3.2. Promoting socio-economical inclusion..................................................... 55
CHAPTER III: FINANCING THE NSP TB ....................................................................... 56 1. INTRODUCTION ............................................................................................................................ 56
2. FUNDING SOURCES FOR TB EXPENDITURES IN RWANDA FY 2019-2020 ............... 56
3. PUBLIC AND EXTERNAL FUNDING SOURCES FOR TB NSF ........................................... 56
4. GOVERNMENT CONTRIBUTION TO TB NATIONAL STRATEGIC PLAN ...................... 57
5. THE GLOBAL FUND CONTRIBUTION .................................................................................... 58
ANNEXES .............................................................................................................................. 60

v
LIST OF TABLES
Table 1: Culture performed in FY 2019-2020 ................................................................. 2 Table 2: Drug susceptibility testing (DST) of tuberculosis performed in Rwanda in FY 2019-2020 .................................................................................................................... 2 Table 3: TB detection and contribution of each screening level, Rwanda, July 2019-June 20. ......................................................................................................................... 3 Table 4: Quality control of microscopy from July 2019 - June20. ............................. 3 Table 5: External quality control of GeneXpert sites in FY 2019-2020 .................... 4
Table 6: Household TB contact investigation, Rwanda. July 2019-June 2020 .... 11 Table 7: RR-TB cases notified during July 2019-June 20, by province of origin. 12
Table 8: Repartition of MDR-TB cases by categories of origin, July 2019-June20................................................................................................................................................... 12
Table 9: MDR-TB cases by gender, age and HIV status, July 2019-June20. ........ 13
Table 10: Interim results- culture conversion at six months for cohort initiated on treatment during October 2018-September 2019. ................................................. 14 Table 11: Final treatment outcome: confirmed MDR-TB patients enrolled on the shorter and longer MDR-TB treatment regimen. ........................................................ 14 Table 12: Patients who developed adverse events on MDR-TB treatment............. 15
Table 13: Treatment outcome of TB patients under 15 years for the cohort notified, July 2018-June19. ............................................................................................... 17
Table 14: Under 5 years initiated on tuberculosis preventive therapy, July 2019-June20. .................................................................................................................................. 18 Table 15: Screening of HIV among TB presumptive cases, July 2019-June20. .... 19
Table 16: Initiation of PLHIV on Tuberculosis preventive therapy, July 2019-June 20. ................................................................................................................................. 20
Table 17: Summary result of TB screening and diagnostic among selected HRG, July 2019-June20. ............................................................................................................... 22 Table 18: Enhance case findinds among prisonners at Rubavu and Nyarugenge prisons. ................................................................................................................................... 24 Table 19: TB active screening cascade among youth in transit centers, July 2019-June 20. ................................................................................................................................. 24 Table 20: TB active screening cascade in Kigali, July 2019-June20. ...................... 25
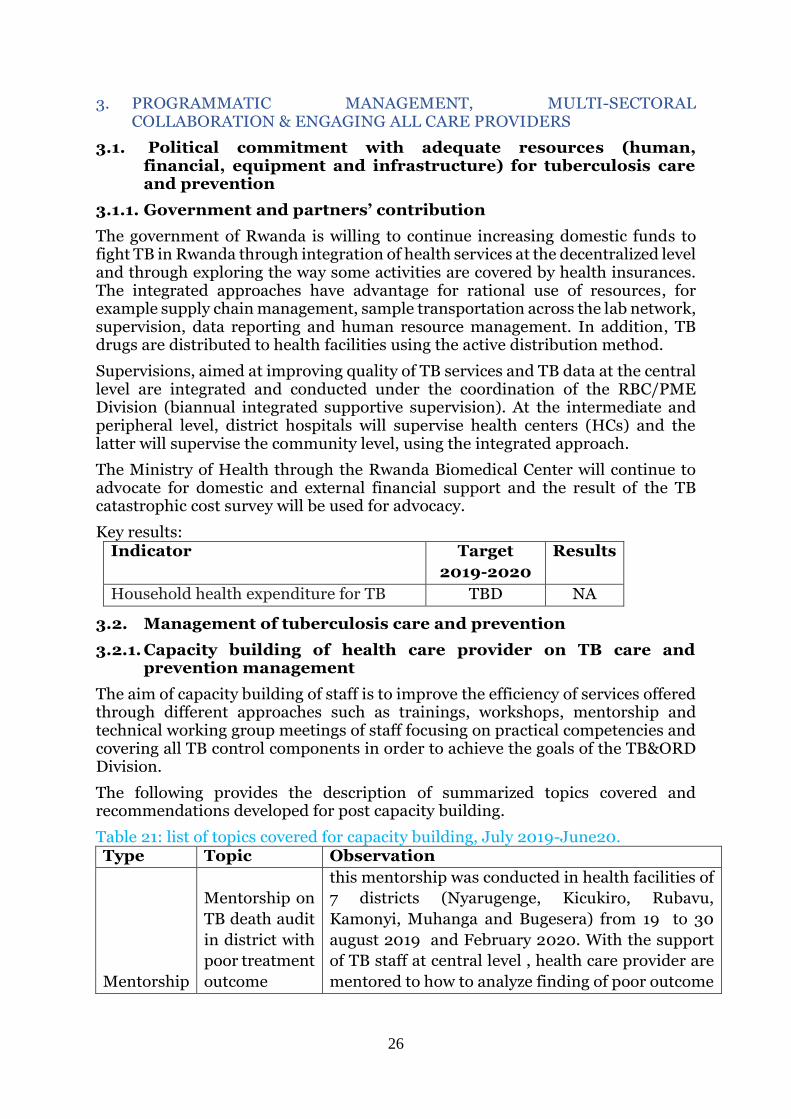
Table 21: list of topics covered for capacity building, July 2019-June20. .............. 26 Table 22: Screening of health care providers per province, July 2019-June20. ... 32
Table 23: Forecast accuracy of TB medecine, July 2019-June20. ............................ 36 Table 24: Adverses events reported among TB cases, July 2019-June20. ............. 39
Table 25: Status of recommendation made during TB epireview October 2018. . 44
Table 26: Leprosy prevalence and new case detection rate in Rwanda and neighbouring countries. ..................................................................................................... 49
Table 27: Leprosy notification.July 2019-June 2020 ................................................. 51 Table 28: Leprosy treatment outcome for cohort .July 2017-June 2018................ 53 Table 29: Contribution of Different Funding Sources for the year ended 30 June 2020 ........................................................................................................................................ 56 Table 30: Damien Foundation expenditures per budget category for the year ended 30 June 2020 ........................................................................................................... 57 Table 31: GoR TB NSP budget and expenditure per MTEF chapter for the year ended 30 June 2020 ........................................................................................................... 58
Table 32: GF TB NSP budget and expenditure per NSP cost category for the period of July 2019 to June 2020 .................................................................................... 58

vi
LIST OF FIGURES
Figure 1: Age pyramid of TB cases, all forms, by sex, Rwanda, July 2019-June 2020 .......................................................................................................................................... 4 Figure 2: Distribution of TB cases by provinces ........................................................... 5 Figure 3: Notification of TB cases by district ................................................................ 5
Figure 4: Drug susceptibility Testing among TB cases, FY 2019-2020 .................. 6
Figure 5: TB Treatment outcomes for the TB cohort registered during July 2019-June 2020, by case category and in special populations. ................................ 7
Figure 6: TB treatment outcome by for cohort July 2019-June 2020. ................... 8 Figure 7: Proportion of TB notification among children by district ...................... 17
Figure 8: Treatment outcome of TB/HIV co-infected ............................................... 20
Figure 9: Presumptive TB by screening method among prisoners during 2019-2020 FY .................................................................................................................................. 23
Figure 10: Contribution of CHWs in TB cases detection in Rwanda, July 2019-June 2020 .............................................................................................................................. 29 Figure 11: Procurement status of TB products, FY 2019-2020 ............................... 37
Figure12: Patient Pathway analysis care seeking for adults experiencing TB symptoms DHS 2014/2015 ............................................................................................... 43
Figure 13 : Trends in leprosy notification, by case category, Rwanda, July 2004 to June 2020 ......................................................................................................................... 52

vii
LIST OF ANNEXES
Annex 1: TB Indicators in Monitoring and evaluation framework, Rwanda from July 2019 to June 2020. ..................................................................................................... 60 Annex 2: RBF achievment, from July 2019 to June 2020. ........................................ 65 Annexe 3 : New algorithm proposed for Xpert MTB/Rif ........................................... 66
Annexe 4: Distribution plan for CSB at district hospitals for the fiscal year 2019-2020........................................................................................................................................ 67 Annex 5: Participants who developed TB&ORD annual report July 2019-June 2020 FY .................................................................................................................................. 68

viii
ABBREVIATIONS
ACF Active Case Finding
aDSM Active Drugs Safety Monitoring
AIDS Acquired Immunodeficiency Syndrome
ART Antiretroviral Therapy
BCC Behaviour change communication
CBHI Community based health insurance
CDC Centers for Disease Control and Prevention
CDT Centre for Diagnosis and Treatment of Tuberculosis
CHUB Butare University Teaching Hospital
CHUK Kigali University Teaching Hospital
CHW Community Health Worker
COVID-19 Coronavirus Disease 2019
CRVS Civil Registration and Vital Systems
CSB Corn -Soya Blend
CSO Civil Society Organizations CT Centre for Treatment of Tuberculosis
CXR Chest X-ray
DF Damian Foundation
DH District Hospital
DHIS2 District Health Information System version 2
DIAMA Diagnostics for Multidrug-resistant tuberculosis in Africa
DOT Directly Observed Treatment
DQA Data Quality Audit
DS-TB Drug Susceptible Tuberculosis
DR-TB Drug Resistant Tuberculosis
DST Drug Susceptibility Testing
DTC Drug Therapeutic Committee
EPTB Extra Pulmonary TB
E-TB Electronic Tuberculosis surveillance system
EQA External Quality Assessment
FDA Rwanda Food and Drugs Authority
FNA Fine Needle Aspiration
FY Fiscal year
G2D Grade 2 Disability
GDF Global Drug Facility
GFATM Global Fund for AIDS, TB and Malaria
GHSC USAID Global Health Supply Chain Program
GoR Governement of Rwanda
HC Health Center
HH Household
HF Health Facility
HFN High False Negative
HFP High False Positive
HIV Human Immune Virus
HISP Health Information Systems Program
HMIS Health Management Information System
HRG High Risk Group
HRTT Health Resource Tracking Tool
ix
HSSP Health Sector Strategic Plan
IC Infection Control
IEC Information, education and communication
IPT Isonizid Preventive Therapy
ISS Integrated Supportive Supervision
LFN Low False Negative
LFP Low False Positive
LMIS Logistics Management and Information System
LPA Line Probe Assay
LTBI Latent tuberculosis infection
M&E Monitoring and Evaluation
MB Multibacillary
MCCH Maternal Child Community Health Division
MD Medical Doctor
MDR-TB Multidrug Resistant Tuberculosis
MDT Multidrug therapy MoH Ministry of Health
MPPD Medical Production and Procurement Division
MTB Mycobacterium Tuberculosis
MTEF Medium Term Expenditure Framework
MTR Mid-Term Review
NCD Non-Communicable Diseases
NGOs Non-Government Organizations
NRL National Reference Laboratory
NSP National Strategic Plan
NTPB New Pulmonary Bacteriological confirmed
NTWG National Technical Working Group
NYC National Youth Council
PAL Practical Approach for Lung diseases
PB Paucibacillary
PBF Performance- Based Financing
PLHIV People Living with HIV
PMDT Programmatic Management of Drug Resistant Tuberculosis
PMEBS Planning Monitoring Evaluation and Business Strategies division
PPA Patient Pathway Analysis
QC Quality Control
QE Quantification Error
RBC Rwanda Biomedical Center
RBF Results Based Financing (of the Global Fund)
RDA Rwanda diabetic associations
RH Referral Hospital
RMH Rwanda Military Hospital
RR Rifampicin Resistant Tuberculosis
RRP+ Reseau Rwandais des Personnes vivant avec HIV
RSQA Rapid Services Quality Assessment
SLD Second Line Drug
SMART FMIS Integrated Financial Management Information System
SOPs Standard Operating Procedures
SPH School of Public Health
SPIU Single Project Implementation Unit (MoH)

x
TB&ORD Tuberculosis and Other Respiratory Communicable Diseases
TIME TB impact modeling estimate TPB+ TB Pulmonary Bacteriologically confirmed TPT Tuberculosis Preventive Therapy TSR Treatment Success Rate
TWG Technical Working Group
USD United States Dollars
VOT Virtually Observed Treatment
WHO World Health Organization
XDR-TB Extensively drug-resistant tuberculosis

xi
EXECUTIVE SUMMARY
TB screening and diagnosis
The Ministry of Health through Rwanda Biomedical Center developed a new national strategic plan to fight TB and Other Respiratory Communicable Diseases
2019-2024. This strategic plan adopted the use of molecular testing for initial diagnostic testing and reinforceed TB screening among high risk populations. In total, 140,860 TB presumptive cases were identified during this FY 2019-2020 versus 187,871 in 2018-2019 FY, representing a 25% reduction. 43.4% of presumptive cases were identified by community health workers compared to 56.9% in the previous fiscal year 2018-2019. Twenty thousand and two hundred twenty (20,220) chest x-rays were performed and 7% (1,325) of X-rays were abnormal, suggestive of TB. 99.6% of TB presumptive clients were tested for HIV and 13.6% were HIV positive. The total number of all TB cases diagnosed was 5,678 including 76 RR/MDR-TB cases. Among notified TB cases, 6% were under 15 years, males represented 70% and 16.4% were brought by CHWs. Three quarters (3/4) of TB cases were bacteriologically confirmed and new and relapse cases represented 98.2%. The proportion of HRG was 50.4% compared to 53.4% in 2018-2019 FY and 61.8% of notified new and relapse TB cases used molecular test for initial diagnostic testing. Treatment initiation was 5,573 (98. 2%).
To ensure the quality of diagnostic tests, external quality control is performed at NRL for smear microscopy and Xpert done by district hospitals and at Supra National Reference laboratory for all Xpert, Culture, LPA and DST done. External quality assurance was conducted in 88.6% of all CDT visited at least 3 times and the performance for microscopy and Xpert was at 94.9% (by NRL to hospitals, and Hospitals to Health Centers) and 83.7% (by CDC-Atlanta) respectively. The result for EQA SRL-Uganda from was 100% for microscopy, 100% for Xpert, 100% for culture &LPA while NRL is still waiting for results of DST phenotypic 2020.
TB management and treatment outcomes
All planned TB medicines were procured at 95% however 17% of laboratory commodities were delayed due to the issue of transport caused by the CoVid-19 pandemic. There was no registered stock out of laboratory reagents at the central or decentralized levels.
The overall treatment success rate for TB was 86.4% for susceptible TB and 86.7% for RR/MDR-TB cases notified for the cohort of 2018-2019 FY. 88.0% of bacteriological confirmed TB cases and 82.1% of clinically diagnosed cases were successfully treated. TB associated death was 6% for bacteriological confirmed cases new and relapse and 14.8% for clinically diagnosed cases.
The proportion of co-infected TB/HIV on antiretroviral therapy (ART) by the end of their TB treatment reached 97.4% while the target is 90%. TSR of HIV/TB co-infected cases for susceptible TB cases was 77.6% and 75.9% for MDR TB cases.
For the first time we monitored Adverse Events (AEs) associated with TB treatment through the case-based monitoring (DHIS-2) tracker. Adverse events were recorded for only 53.9% (3059/5678) of TB patients and 2.0% (62/3059) reported adverse events. Two out of 45 MDR TB patients on a shorter regimen reported having grade III oadverse events.

xii
TB prevention
The new national TB strategic plan recognized the importance of implementing the management of latent TB (LTBI) and proposed to extend this management among PLHIV and household contact of index cases. During this FY, we started the management of LTBI among PLHIV in five districts among newly enrolled HIV persons, and this will be extended for all PLHIV nationwide in 2020-2021 FY. A total of 1,547 HIV + newly enrolled were screened and 59% were initiated on treatment of latent TB. Isoniazid preventive therapy for persons under 5 years (U5) has been implemented in Rwanda since 2005. During this reporting year 2019-2020, 1,405 (97.7%) were screened for TB and 1,343 initiated TB preventive therapy. For the cohort of 2018-2019 FY, 99.7% (907/910) of children U5 initiated and completed INH prophylaxis.
Systematic TB screening among health care workers (HCWs) and among community health workers have been conducted to prevent and early detect TB acquisitation. The proportion of HCWs and CHWs screened for TB was 80% and 87% respectively.
TB program management and coordination
During 2018/2019 fiscal year, the division of Tuberculosis and other respiratory disease in collaboration with the Ministry of Health and development partners has developed and approved a new TB national strategic plan for 2019-2024. A patient centered framework approach was used to make our plan more evidence based. For the first time, we conducted a modelling of our intervention to estimate two major TB impact indicators (TB mortality and TB incidence). In collaboration with Avenir for Health, the modelling used the TB impact modeling estimate (TIME) and the findings revealed that the expanding use of molecular testing for initial diagnostic testing and management of latent TB (TB contact and PLHIV) will help to reduce TB incidence and mortality.
In collaboration with HISP, MoH and PMEBS divison, we developed a user friendly TB case-based surveillance system (DHIS-2 tracker) which was implemented countrywide since July 2019 and generated data that are used for this annual report 2019-2020.
Rapid quality assessment service was conducted in 113 out of 200 CDTs (57%) to assess the quality of TB service provision . The overall score decreased from 82.0% (FY 18-19) to 77.9% (19-20); this may partially be explained by the introduction of new items in the revised checklist administered during this reporting period.
Leprosy control
In collaboration with Damien foundation, the Leprosy national strategic plan 2019-2024 was developed with the aim to eliminate leprosy in Rwanda. This new strategic plan will emphasize control of leprosy in endemic and non-endemic areas. During this fiscal year, 20 leprosy cases were diagnosed among them 19 were new cases and 1 retreated case after default. The proportion of MB cases represented 57.9% and 84.2% of cases were female. The proportion of G2D among new cases is 15.8 % for MB and 0% for PB.
The treatment completion rates for PB registered from July 2018 to June 2019 and MB forms registered from July 2017 to June 2018 for new cases were respectively 92% and 100%.

xiii
Damien Fondation has been our historical partner for leprosy control and their support will end in December 2020. There is a need to advocate for domestic and external funds to fight leprosy in Rwanda.
TB&ORD financing
During the Fiscal year 2019-2020, the total budget planned was USD 9,335,186 with contribution of 67.2% from Global Fund (GF), 27.6% from Government of Rwanda (GoR), 4.5% from World Health Organization (WHO) and 0.7% from Damien Foundation (DF).
The budget execution was at 86%. The budget execution for funding from WHO, GoR, GF and DF was 100%, 97%, 80% and 77% respectively. Low budget execution was due to lockdown which delayed procurement of X-ray machines and the implementation of TB catastrophic cost survey for Global fund and training of staff for Damien Foundation.

1
CHAPTER I: TUBERCULOSIS AND OTHER RESPIRATORY COMMUNICABLE
DISEASES CONTROL
1. CONSIDERING THE PATIENT PATHWAY FOR TUBERCULOSIS:
1.1. Accelerating early screening and appropriate diagnosis of TB
This intervention focuses on accelerating early TB screening and diagnosis with sensitive diagnostics tools. This requires a comprehensive set of activities, using improved screening and diagnostic tools at all levels of the health system.
1.1.1. Screening and diagnosis
1.1.1.1 Screening of symptomatic clients with chest x-ray
In Rwanda, two screening methods are used to identify TB presumptive cases. Active case finding is performed among people attending health facilities or in the community and for those not classified as high risk groups for TB. The second method of TB screening is performed among people classified as high risk groups (HRG) to develop TB. TB screening is based on 4 questions (cough of ≥ 2 weeks, fever, night sweats and weight loss). Community health workers (CHWs) play a big role in identification and referring potential presumptive TB cases to health centres for early screening, thus bringing TB services to the community. The total number of presumptive TB cases was 140,860 and 61,180 (43.4%) were referred by CHWs. During the period from 1st July 2019 to 30th June 2020, prisonners, PLHIV, and youths in rehabilitation centers were screened with chest x-ray. Twenty thousand two hundred twenty (20,220) chest x-rays were performed and 1,325 images were showing abnormalties suggestive of TB disease. 1.1.1.2 Diagnostic techniques Diagnostic capacity for TB has been strengthened in the country. Genexpert is used for initial testing countrywide among HRG and presumptive TB cases in Kigali city because of high TB incidence compared to the rest of the country. Smear microscopy is used as a initial test for the rest of the presumptive TB cases and for treatment follow-up. 1,473 confirmed TB cases were diagnosed with smear microscopy out of 5,678 confirmed TB cases. The number of Genexpert tests performed was 86,481 out of the 140,860 presumptive TB population. 77% of TB cases (4,303 susceptible-TB + 76 RR-TB) were diagnosed with Xpert machines out of 5,678 total TB cases. This number was lower than that of the previous fiscal year 2018-2019 due to the change on the new algorithm: we discovered that 47% of RR were false positives due to low bacillary load1. The total number of TB cases diagnosed with molecular testing as the initial diagnostic test represented 63.0% (3,575/5,678) of TB cases registered.
1 Article on Prevalence and drivers of false-positive rifampicin-resistant Xpert MTB/RIF results: a prospective observational study in Rwanda was published in (Lancet Microbe 2020; 1: e74–83)
2
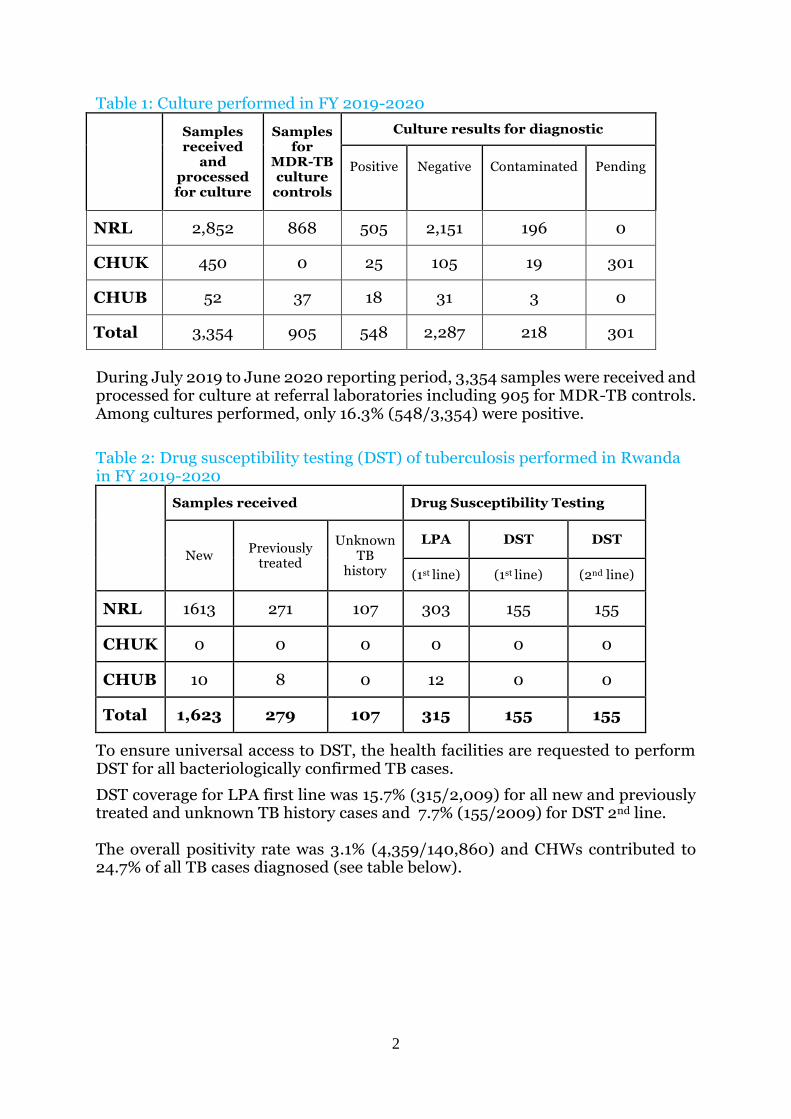
Table 1: Culture performed in FY 2019-2020
Samples received
and processed for culture
Samples for
MDR-TB culture
controls
Culture results for diagnostic
Positive
Negative
Contaminated
Pending
NRL 2,852 868 505 2,151 196 0
CHUK 450 0 25 105 19 301
CHUB 52 37 18 31 3 0
Total 3,354 905 548 2,287 218 301
During July 2019 to June 2020 reporting period, 3,354 samples were received and processed for culture at referral laboratories including 905 for MDR-TB controls. Among cultures performed, only 16.3% (548/3,354) were positive.
Table 2: Drug susceptibility testing (DST) of tuberculosis performed in Rwanda in FY 2019-2020
Samples received Drug Susceptibility Testing
New Previously
treated
Unknown TB
history
LPA DST DST
(1st line) (1st line) (2nd line)
NRL 1613 271 107 303 155 155
CHUK 0 0 0 0 0 0
CHUB 10 8 0 12 0 0
Total 1,623 279 107 315 155 155
To ensure universal access to DST, the health facilities are requested to perform DST for all bacteriologically confirmed TB cases.
DST coverage for LPA first line was 15.7% (315/2,009) for all new and previously treated and unknown TB history cases and 7.7% (155/2009) for DST 2nd line. The overall positivity rate was 3.1% (4,359/140,860) and CHWs contributed to 24.7% of all TB cases diagnosed (see table below).

3
Table 3: TB detection and contribution of each screening level, Rwanda, July 2019-June 20.
Detection CDT CT CHWS TOTAL
Presumptive TB Case 45,715 33,965 61,180 140,860
32.5% 24.1% 43.4% 100%
B+ among presumptive TB case
2,216 1066 1,077 4,359
50.8% 24.5% 24.7% 100%
Positivity rate 4.8% 3.1% 1.8% 3.1%
Fine needle aspiration technique has been adopted by the program to improve the diagnosis of extra-pulmonary tuberculosis which is a simple, rapid, inexpensive procedure that needs minimal training. Medical doctors and laboratory technicians were trained from district, provincial and referral hospitals. In addition 7 pathologists have been trained and deployed in 7 provincial and referral hospitals. Pathologists conduct mentorship to improve knowledge of trained staff in all hospitals. 143 TB cases were diagnosed with the FNA technique.
1.1.2. Quality control
Quality control (QC) is performed for smear microscopy and conducted quarterly for each CDT. This is done at 2 levels: the National Referral Lab (NRL) does the quality control for all hospitals; and District Hospitals conduct the quality control for CDTs in their respective catchment areas. From July 2019 to June 2020, quality control was done 3 times in 87% (178/201) of CDTs and a total of 10,643 slides were reviewed.
Table 4: Quality control of microscopy from July 2019 - June20.
CDT
controlle
d at least
3x
Nb slides controlled Errors Nb
CDT
with
major
error
Total Pos Scanty Neg HF
P
HF
N LFP LFN QE
178/201
(88.6%) 10643 699 151 9778 3 7 1 7 5 9
CDTs
with
Major
errors
HFN: Kiziguro DH (1), Ngarama DH (1), Ruli DH (2), Kabutare DH (1), Musambira
CS (1), Muyange CS (1)
HFP: Nemba DH (1), Simbi CS (1), Kigeme DH (1).

4
External quality control in FY 2019-2020
During this fiscal year, 49 out of 67 GeneXpert sites 73.1% received external quality controls from CDC-Atlanta. The quality control performance was successfully evaluated at 83.7% (41/49) and 16.3% was attributed to the 8 Genexpert sites which underperformed as shown in the table below.
Table 5: External quality control of GeneXpert sites in FY 2019-2020
GXP sites
Genexpert sites
controlled
Genexpert sites with
pass (≥ 85%)
Genexpert sites with no Pass
List of genexpert sites with no Pass
Number 67 49 41 8 Gisenyi, Gitwe, Kabgayi, Kilinda, Muhima, Ngarama, Nyamata and Ruhango hospitals (8)
% 73.1% 83.7% 16.3%
The Rwanda National Referral Laboratory also received panels from SRL-Uganda for microscopy, GeneXpert, Culture, LPA and DST. The findings revealed that NRL performed microscopy and Xpert at 100% and culture, LPA at 100% while DST phenotypic result for 2020 are pending.
1.1.3. Notification of susceptible TB
1.1.3.1 Notification of TB by sex and age groups The total number of TB cases diagnosed was 5,678 and 316 (6%) were children under 15 years. The majority of cases were male (70%) and the ratio male to female is 2.3. The most age group affected was 25-34 years which represent 26% (1464/5678) of total TB cases and 77% (4364/5678) were diagnosed among 15 to 54 years (see figure below). The figure shows the number of notified TB by sex and age groups.
Figure 1: Age pyramid of TB cases, all forms, by sex, Rwanda, July 2019-June 2020

5
1.1.3.2 Notification by type and tuberculosis history Applying WHO criteria of TB cases classification, 75.9% (4,309/5,678) were bacteriologically confirmed and 24.1% (1,369/5,678) were clinically diagnosed. The proportions of newly treated, previously treated and both new and relapse were respectively 91.1%, 8.9% and 98.2%. CHWs contributed to the diagnosis of 16.4% of all TB cases registered. 97% (5,485) of all TB cases initiated the 1st line treatment.
1.1.3.3 Notification by districts and provinces The City of Kigali, South, East, West and North provinces respectively notified 32%; 24%; 20%; 17% and 8% of total TB cases (see figure 2).
Figure 2: Distribution of TB cases by provinces
51.67% (2,934) of total TB cases were notified by seven districts: Nyarugenge, Gasabo, Kicukiro, Rubavu, Huye, Rwamagana and Muhanga. Burera and Nyaruguru districts have the lowest notification (45 and 44 TB cases)
Figure 3: Notification of TB cases by district
32.3%
23.6%
19.6%
16.7%
7.8%
0.0%
5.0%
10.0%
15.0%
20.0%
25.0%
30.0%
35.0%
0
200
400
600
800
1,000
1,200
1,400
1,600
1,800
2,000

6
1.1.4. Drug susceptibility testing
The new TB national strategic plan 2019-2024 defined the indicator of universal DST as a total of TB cases: all forms with DST result (pulmonary and extraordinary TB case).
Drug susceptibility testing was done for 78% (4,432) of all forms of TB cases.
Drug susceptibility testing was 77.1% (3,990/5,174) and 87.7% (442/504) respectively for new and previously treated TB cases (see figure 4).
Figure 4: Drug susceptibility Testing among TB cases, FY 2019-2020
The NSF framework provides the proportion of TB patients with DST for at least RR among the total TB notified cases (new and retreatment) and is calculated among all bacteriologically confirmed. The proportion of bacteriologically confirmed TB patients was 93.2% (4019/4309)
Key results
Indicator Target 2019-2020
Results
Proportion of newly notified TB patients tested using WHO-recommended rapid molecular test at the time of diagnosis
65% 61.8%
(3,197/5,174)
DST coverage for TB patients.
70% 78.0%
(4,432/5,678) Proportion of health facilities diagnostic sites scoring pass in EQA for smear microscopy
95% 94.4%
Proportion of health facilities Xpert sites scoring pass in EQA for Xpert MTB/RIF
85% 83.7%

7
1.2. Quality of care and ensuring a cure, including aDSM and patient support
1.2.1. Treatment outcome
Treatment outcomes presented in this reporting period from July 2019 to June 2020 are from the cohort of TB cases registered from 1st July 2018 to 30th June 2019. Total TB cases registered in all forms were 5,941. Among them 5,845 TB cases were initiated on 1st line TB treatment while 107 cases moved to 2nd line TB treatment.
Among bacteriologically confirmed new and relapse TB cases (B+ N&R), treatment success rate (TSR) was 88.0% (3,734/4,241), including 77.5% cured and 10.5% with treatment completed. For clinically diagnosed (CD), the treatment success rate was 82.1% (1237/1506).
The main unfavourable TB treatment outcome was “death” which represented 6% (252/4,241) for bacteriological confirmed cases new and relapse and 14.8% (223/1506) for clinically diagnosed cases. TB cases that were not evaluated were respectively 1.1% (46/4241) and 2.1% (32/1506) for B+ N&R and clinically diagnosed.
When considering the treatment outcomes for all forms (DS&DR), it was observed that 86.4% (5142/5950) were successfully treated. For all susceptible TB, the treatment success rate was 86.4% (5051/5845) while 8.2% (479/5845) of them died and 1.3% (78/5845) were not evaluated. 79.3% (917/1,157) of all TB/HIV co-infected patients initiated ART were successfully treated for TB (cured or treatment completed); 14% (161/1157) among TB/HIV co-infected patients on ART died and 1% (12/1157) were not evaluated.
Figure 5: TB Treatment outcomes for the TB cohort registered during July 2019-June 2020, by case category and in special populations.
* OPT: Other previously Treated TB cases

8
When comparing the treatment outcome by District hospital catchment area, 15 Hospital performed well with TSR above 88% for all TB cases forms. These hospitals were Munini (96.3%), Ruhango (93.8%), Kaduha (93.8%), Kiziguro (93.6%), Gisenyi (93.5%), Ruli (93.3%), Ngarama (93.2%), Gakoma (92.2%), Kabgayi (91.9%), Kirehe (91.8%), Remera-Rukoma (90.6%), Nyagatare (90.6%), Mibilizi (90.0%), Nemba (88.7%) and Rwamagana (88.1%). We really commend the effort made by Kiziguro, Nyagatare, Rwamagana, Gisenyi, Kabgayi and Remera Rukoma in term of treatment success rate in comparison to their performance of in the previous fiscal years.
Figure 6: TB treatment outcome by for cohort July 2019-June 2020.
1.2.2 Nutrition support.
Adequate nutritional intake is essential to ensure adequate absorption of TB drugs to meet the increased demand of body metabolism and required nutrients, thus contributing to a quick patients’ recovery. The NSP 2019-2024 advocates for the provision of nutritional support to all TB patients who present moderate and severe malnutrition (BMI below 18.5). During this FY, the TB&ORD division distributed Corn-Soya Blend (CSB) in all district hospitals based on the number of TB cases and the estimated cases with BMI<18.5. We have also developed a register to facilitate the monitoring. In general, 27,090 kg were distributed to hospitals.
1.2.3. Use of digital tools for treatment supervision The treatment of Tuberculosis requires daily intake of multiple medications for 6 months or 2 years or more (MDR patients). The long duration of TB treatment provides an opportunity for the interruption of medication that could eventually lead to the emergence and transmission of drug-resistant-TB in the absence of strong and structured adherence support. Directly observed treatment administration together with patient support has been recommended to improve adherence to TB treatment. However, daily treatment observation presents challenges for both patients and health facilities, specifically during this COVID-19 pandemic. Digital technologies like video (virtually) observed treatment (VOT) are being considered to improve patient adherence. VOT requires patients to film themselves taking medications on a computer or mobile device, then transmit these images to a remote observer via internet. TB NSP 2019-2024 has among other adherence strategies the implementation of VOT for TB patients.

9
1.2.4. Supply of first line TB drugs.
The national TB technical working team for management of TB commodities conducted stock monitoring at all levels and regular follow up of shipments of medicine in the pipeline to ensure the availability of TB medicines and diagnostic commodities in all health facilities. The monitoring of stock status and in pipeline is routinely done at the central level. No stock out was observed for first line TB medicines during the fiscal year of 2019-2020. According to the RSQA reports, stocks of TB drugs and reagents were well monitored at the level of 82.3% in all CDTs. Despite the availability of TB medicines at the central level, 27 CDTs reported stock outs during this 2019-2020 fiscal year.
1.2.5. Improve quality of care for TB patients High quality care for TB involves early and accurate diagnosis, including drug-susceptibility testing. Diagnosis should be followed by rapid initiation of the correct drug regimen, patient support, and management of relevant comorbidities. During this FY 2019-2020 different activities have been conducted to improve the quality of care by providing mentorship and analysis of verbal autopsy results. The TB program in collaboration with expert physicians conducted a field visit in hospitals with high TB mortality rates:
- to improve provision of TB services, - build capacity of medical doctors and nurses at provincial and district
hospitals, - conduct a staff meeting on management of unfamiliar or complicated cases of
TB and strengthen collegial decisions to avoid TB diagnostic errors.
Selected health facilities within 7 districts (Nyarugenge, Kicukiro, Rubavu, Kamonyi, Muhanga and Bugesera) from 19 to 30 August 2019 and February 2020 beneficiated with this mentorship. An observation check list approved by staff from the TB & ORD Division was also used to assess the risk factors which caused poor outcomes in those District hospitals. The checklist was filled for 36 patients and the following observations were made:
- For patient with outcome of lost to follow-up:
61.1% are patients who don’t have a fixed address (homeless),
41.6% were HIV positive;
13.9% didn’t start their treatment at initiation, 41.7% were lost during the intensive phase and 44.4% stopped the treatment during the continuation phase.
From the findings it was recommended that mentorship and supervision should be consistent for prevention of poor treatment outcome among TB patients. TB&ORD Division requested every hospital to conduct a verbal autopsy for all deaths that occurred among TB patients. A checklist was developed and filled by health care providers at health facilities. Then they sent it to central level for analysis. We analysed data on deaths that occurred during the treatment of patients notified from July 2018-June 2019. We received 138 death audit reports out of 483 death reports during the analysed period and following observations were made:
- 64% (2/3) of patients who died were malnourished - HIV was the second leading cause of death (41%)
10
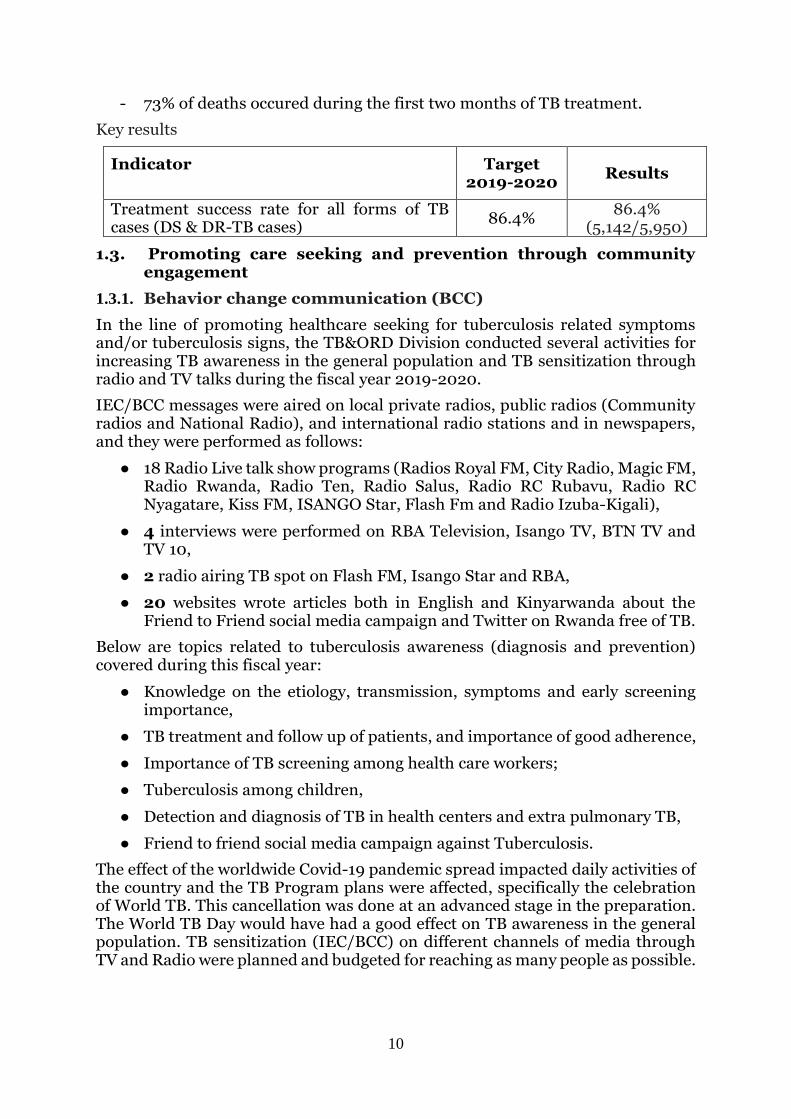
- 73% of deaths occured during the first two months of TB treatment.
Key results
Indicator Target 2019-2020
Results
Treatment success rate for all forms of TB cases (DS & DR-TB cases)
86.4% 86.4%
(5,142/5,950)
1.3. Promoting care seeking and prevention through community engagement
1.3.1. Behavior change communication (BCC)
In the line of promoting healthcare seeking for tuberculosis related symptoms and/or tuberculosis signs, the TB&ORD Division conducted several activities for increasing TB awareness in the general population and TB sensitization through radio and TV talks during the fiscal year 2019-2020.
IEC/BCC messages were aired on local private radios, public radios (Community radios and National Radio), and international radio stations and in newspapers, and they were performed as follows:
● 18 Radio Live talk show programs (Radios Royal FM, City Radio, Magic FM, Radio Rwanda, Radio Ten, Radio Salus, Radio RC Rubavu, Radio RC Nyagatare, Kiss FM, ISANGO Star, Flash Fm and Radio Izuba-Kigali),
● 4 interviews were performed on RBA Television, Isango TV, BTN TV and TV 10,
● 2 radio airing TB spot on Flash FM, Isango Star and RBA,
● 20 websites wrote articles both in English and Kinyarwanda about the Friend to Friend social media campaign and Twitter on Rwanda free of TB.
Below are topics related to tuberculosis awareness (diagnosis and prevention) covered during this fiscal year:
● Knowledge on the etiology, transmission, symptoms and early screening importance,
● TB treatment and follow up of patients, and importance of good adherence,
● Importance of TB screening among health care workers;
● Tuberculosis among children,
● Detection and diagnosis of TB in health centers and extra pulmonary TB,
● Friend to friend social media campaign against Tuberculosis.
The effect of the worldwide Covid-19 pandemic spread impacted daily activities of the country and the TB Program plans were affected, specifically the celebration of World TB. This cancellation was done at an advanced stage in the preparation. The World TB Day would have had a good effect on TB awareness in the general population. TB sensitization (IEC/BCC) on different channels of media through TV and Radio were planned and budgeted for reaching as many people as possible.

11
1.3.2. Tuberculosis preventive therapy among contacts of TB cases (all ages)
Tuberculosis (TB) contacts are people who have close contact with infectious TB patients. As they are at high risk for infection, TB contacts should be investigated systematically and actively for TB infection and disease.
Household contacts of TB cases are our focus and a systematic contact investigation was conducted using a symptoms based approach, for children under 5 years old and people above 5 years old. We used the symptom and chest x- ray screening among our TB household contacts but the majority was screened based on the following symptoms: cough, fever, night sweats, weight loss/poor weight gain then they underwent clinical and lab investigation to exlude active TB .
During FY 2019-2020, 95.1% (14,878/15,643) of TB HH contacts above 5 years old were screened for Tuberculosis and 19.3% (2,872/14,878) were identified as presumptive TB cases. For under 5 years old children TB contacts, 98.5% (1,405/1,427) were screened and 10.0% (141/1,405) were found as presumptive TB. The table below highlights the TB contact investigation cascade:
Table 6: Household TB contact investigation, Rwanda. July 2019-June 2020
Total contact
s of TPB+
Total contacts screened
% Presumprive
TB %
Contacts of TPB+ ≥ 5 years
15,643 14,878 95.1% 2,872 19.3%
Contacts of TPB+ <5 years
1,427 1,405 98.5%
141 10.0%
Total contact 17,070 16,283 95.4
% 3,013 18.5%
Key results:
Indicator Target 2019-2020 Results
Proportion of people with TB referred by
community health volunteers ≥25%
16.4% (930/5,678)
Contact investigation coverage ≥90%
95.4% (16,283/17,070)
Proportion of eligible household
contacts under 5 years who are contacts
of bacteriologically confirmed index
patients, who are started on TB
preventive therapy
90% 96.9%
(1,343/1,386)
Proportion of eligible household
contacts 5 years and older who are
contacts of bacteriologically confirmed
NA NA

12
index patients, who are started on TB
preventive therapy
2. TARGETED APPROACHES FOR KEY DRIVERS OF TB EPIDEMIC AND SELECTED POPULATIONS:
2.1. Enhancing Programmatic Management of Drug – Resistant Tuberculosis
2.1.1. Diagnostic and Notification of MDR-TB
With reference made to data from the DIAMA study implementation, it has been identified that there are a lot of false positive rifampicin-resistant (RR) cases detected on Xpert MTB/Rif machines among low bacilli load sputum samples. This challenge in interpreting RR results from Xpert tests with very low MTB detection was presented to the MDR-TB technical working group and to TB&ORD staff for inputs: an orientation on the new Xpert MTB/Rif diagnostic algorithm to improve on results accuracy has been discussed. Based on the finding, a new algorithm has been proposed and approved by authorities and the implementation started on January 2020 (see Annex 4: new algorithm). We estimated that this will reduce by 40% our notification rate for rifampicine resistance. Consequently, laboratory managers with the GeneXpert testing platform and TB focal persons from the same health facilities were trained on this new testing algorithm.
A total of 4,429 (78.1%) out 5,668 TB cases notified during July 2019-June 2020 fiscal year have benefited from an Xpert MTB/Rif test and 76 cases were rifampicin resistant.
Table 7: RR-TB cases notified during July 2019-June 20, by province of origin.
East Kigali
City North South West
Grand Total
RR-TB cases 15 33 1 21 6 76
The modification of the Xpert MTB/Rif diagnostic algorithm and lockdown could have probably contributed to the 30% reduction in numbers of resistant TB cases in Rwanda, during July 2019 – June 2020 period compared to the previous 2018-2019 fiscal year. Most of the RR-TB cases (77.6%), were diagnosed among new cases before any TB treatment initiation.
Table 8: Repartition of MDR-TB cases by categories of origin, July 2019-June20.
Bacteriologicall
y Confirmed Clinically
Diagnosed
NTPB Positive_before treatment initiation or before completing 1 month on TB drugs
59 0
NTPB with positive control at the end of 2 months on treatmen
2 0
Failure Cat 1 5 0
Return after lost to follow up 0 0
Relapse 9 0
Cat 2 positive at 3 months on treatment 0 0
Failure Cat 2 0 0

13
Extra Pulmonary 1 0
Relapse Cat 4 0 0
Others (MDR-TB) 0 0
Regarding the HIV status, 75 (98.6%) knew their HIV status and 22 (28.9%) patients were HIV+. Fifty-seven MDR-TB cases were male which represented 75% and sex ratio male to female was 3.
Table 9: MDR-TB cases by gender, age and HIV status, July 2019-June20.
Bacteriologically Confirmed
Clinically Diagnosed
Male Female Male Female
MDR-TB patients 57 19 0 0
MDR-TB patients HIV Tested 57 19 0 0
MDR-TB patients HIV Positive 16 6 0 0
MDR-TB patients HIV positive on ART 16 5 0 0
MDR-TB patients under 15 years 2 1 0 0
MDR-TB patients under 15 years HIV Tested
2 1 0 0
MDR-TB patients under 15 years HIV positive
0 0 0 0
MDR-TB patients under 15 years HIV positive on ART
0 0 0 0
MDR-TB - Extensively Drug Resistance 0 0 0 0
All admitted RR-TB patients have to provide samples for first and second line drug susceptibility testing. With reference made to patient registers from April 2019 to March 2020 (in the future we will use data which are being entered in the electronic register), only 46.3% (37/80) have been tested for 2nd line DST due to the high proportion (36%) of primary negative cultures and 10% pending results. However, the situation will probably change with the introduction of the modified RR-TB diagnostic algorithm.
2.1.1. Drug resistant tuberculosis treatment initiation
The guideline on treatment of drug-resistant TB patients was reviewed according to the new WHO recommendations published in December 2018. The new DR-TB treatment regimens have been presented to the TB&ORD Division staff for further dissemination to health facilities countrywide. The following are four different DR-TB treatment options, currently available in Rwanda:
Shorter regimen (Newly RR/MDR-TB diagnosed cases): 4Am– Cfz – E – Z – Mfx – H – Pto /5Cfz – E – Z – Mfx
Longer regimen (RR/MDR-TB cases not eligible to the shorter regimen): 6Bdq – Lzd – Lfx – Cfz – Cs/12Bdq – Lfx – Cfz – Cs
Pediatric: 6Dlm – Lzd – Lfx – Cfz – Cs/12Lfx – Cfz – Cs
Pre-XDR FLQ/XDR: 6Bdq – Lzd – Cfz – CS – Dlm – Z/12Bdq – Cfz – Cs – Z

14
The new treatment regimens are effective starting from July 2019.
During the July 2019 – June 2020, 76 bacteriologically confirmed RR-TB cases have been initiated on second-line MDR-TB treatment regimen in MDR-TB centres; among them, 61 and 15 patients were hospitalized in Kibagabaga and Kabutare DHs respectively. The majority of the patients (63) were initiated on a shorter regimen while the 13 remaing patients were treated with a longer all-oral treatment regimen.
2.1.2. Treatment outcomes of MDR-TB patients
Sputum culture conversion is a step on the way to achieve high MDR-TB treatment success rates. Culture conversion at six months is defined as a MDR TB patient with negative culture at the end of six month of treatment. One hundred cases of MDR-TB patients who initiated 2nd line TB drugs were laboratory confirmed. At six months of treatment, 66 were culture negative.
Table 10: Interim results- culture conversion at six months for cohort initiated on treatment during October 2018-September 2019.
Nb confirmed MDR-
TB
Deaths before 6 months
Lost to follow-up before 6 months
Negative smear
and culture
> 1 positive smear and/or culture
Smear and/or culture
not done
Contaminated culture
100 5 3 66 0 14 12
5% 3% 66% 0.0% 14% 12%
During the July 2019 – June 2020, we evaluated 105 patients who started shorter regimen from July 2018 to June 2019; two remaining cases were treated with longer regimen and will be evaluated next 2020-2021 FY. The treatment success rate was 86.7% including 83 (79.0%) cured. The treatment success rate among HIV co-infected patients was at 75.9%.
Table 11: Final treatment outcome: confirmed MDR-TB patients enrolled on the shorter and longer MDR-TB treatment regimen.
MDR-TB Final Treatment Outcomes
RR-TB and MDR-TB(confirmed 12
months ago)
PRE-XDR and XDR-TB (confirmed 24
months ago)
HIV NEGATIV
E
HIV POSITIV
E
HIV NEGATIV
E
HIV POSITIV
E
MDR-TB_DR-TB Registered patients who initiated the treatment
76 29 0 0
MDR-TB_DR-TB Patients Cured 63 20 0 0
MDR-TB_DR-TB Patients Treatment completed
6 2 0 0
MDR-TB_DR-TB Patients Treatment failed 0 0 0 0
MDR-TB_DR-TB Patients Died 4 4 0 0

15
MDR-TB_DR-TB Patients Lost to follow up 3 3 0 0
MDR-TB_DR-TB Patients Not evaluated 0 0 0 0
2.1.3. Adverse drugs reactions among MDR-TB patients
TB disease can be deadly, but the drugs used to treat the disease can also be harmful in many ways. Second-line anti-TB drugs have many more adverse effects than the first-line anti-TB drugs. Close monitoring of patients is necessary to ensure that the adverse effects of second-line anti-TB drugs are recognized quickly and properly managed. The active drug-safety monitoring and management is a new concept in TB and MDR-TB management in Rwanda. Its reporting form has recently been introduced in TB and MDR-TB tools (patients files and e-TB); however data for analysis are not yet available. Only data on numbers of MDR-TB patients on treatment who developed adverse event and its level of gravity were reported by MDR-TB treatment centres through R-HMIS.
Out of 45 reported adverse events during the July 2019 – June 2020 period, two were on grade III.
Table 12: Patients who developed adverse events on MDR-TB treatment.
Treatment regimen Grade
I Grade
II Grade
III Grade
IV
Standard short treatment regimen 39 3 1 0
Individualized short treatment regimen 1 0 1 0
Treatment regimen for Pre-XDR and XDR-TB 0 0 0 0
In the new 2019-2024, Tuberculosis and Lung Diseases National Strategic Plan in its 2021-2024 impementation period, long-term treatment outcome has been planned for DR-TB patients one year after treatment completion. Consequently, data for analysis for this indicator are currently not available.
Capacity building of health care providers on MDR-TB management
TB&ORD Division in collaboration with the WHO Rwanda Country Office, is hiring an expert consultant in pharmacovigilance to develop a national TB drugs pharmacovigilance guidelines including active drug-safety monitoring (aDSM), reporting tools and training materials. Therefore, the training of the health care providers will be organized after completion and approval of the guidelines.
Key results:
Indicator Target
2019-2020 Results
Proportion of notified patients with rifampicin resistant (RR) or MDR who receive second line DST
85% 46.3%
(37/80)

16
Proportion of RR/MDR TB followed one year aftertreatment
80% NA

17
2.2. Ensuring prevention, diagnosis and treatment of Childhood Tuberculosis
2.2.1. Diagnostic and notification of childhood TB
During July 2019 – June 2020, 316 under 15 years all TB cases were notified. The proportion of children under 15 years new and relapse represented 5.6% (315/5,578).
We observe a good detection rate (more than 7% of national target) of TB among children in some districts like Kamonyi, Bugesera, Rusizi, Rulindo, Muhanga, Gakenke, Karongi, Gatsibo and Nyamasheke while some districts did not notify any case or have low (less than 7% of national target) notification of TB among children under 15 years (Rutsiro, Gicumbi, Nyabihu, Nyanza, Rwamagana, Nyamagabe, Huye and Kayonza).
Figure 7: Proportion of TB notification among children by district
2.2.2. Treatment outcome of childhood TB
The success rate for children under fifteen years registered during July 2018 up to June 2019 is 94.4% (423/448). Other outcomes were death with 4.2% (19/448), not evaluated 1.1% (5/448) and lost to follow up 0.2% (1/448), three cases moved to 2nd line treatment. The treatment success rate among children under 15 years is higher compare to those above 15 years.
Table 13: Treatment outcome of TB patients under 15 years for the cohort notified, July 2018-June19.
Treatment Outcome
Registered Moved
to SLD*
Cured Treatment complete
Treatment failed
Died Lost to follow-
up
Not evaluated
Childrens 0-14 Years
451 3 63 360 0 19 1 5
Percentage 94.4% 0% 4.2% 0.2% 1.1%

18
2.2.3. Management of latent TB infection (LTBI) under 5 years
During July 2019 – June 2020, 98.5% (1,405/1,427) of all children under 5 years who were contacts of pulmonary tuberculosis bacteriologically confirmed cases were screened for TB. Of them 10.0% (141/1,405) were identified as presumptive TB cases and 29.1% (41/141) diagnosed with TB among presumptive TB. The number of under 5 years contacts of pulmonary tuberculosis bacteriologically confirmed cases put on IPT was 1,343.
Table 14: Under 5 years initiated on tuberculosis preventive therapy, July 2019-June20.
Number Screened Presumptive TB Cases
Contacts of TPB+ <5ans years
1,427 1,405 141 41
Put on IPT 1,343
2.2.4. Improve management of childhood TB in Rwanda
TB&ORD division in collaboration with pediatric association conducted in February 2020, a mentorship to reinforce knowledge on diagnostic and management of TB childhood in 7 hospitals which are Muhima, La Medicale, Masaka, Kibagabaga, Rwamagana, Gisenyi, and Kabutare. During this childhood TB/HIV mentorship in Kigali City the mentors have emphasized health centers.
The recommendations made during mentorship are the following:
- Document all pediatric patients with a history of cough and or fever lasting more than 2 weeks and provide systematic screening of patients in pediatric ward rounds especially in severely malnourished children,
- Avail tuberculin skin tests in the health facilities for use in screening, - Do regular cough triage and to document it in the appropriate register; use
TB algorithm for pediatric TB diagnosis, - Do regular supervision visits on childhood TB of the health facilities; - Organize onsite training on childhood TB
Key results:
Indicator Target
2019-2020 Results
Proportion of children 0-14 years notified among TB case new and relapse
8% 5.6%
(315/5578) Proportion of children with TB successful treated 90%
93.4 % (423/448)
Proportion of eligible children aged 0 to 4 years who are contacts of bacteriologically confirmed index patients started on TB preventive treatment (treatment for LTBI) who completed TPT
90% 99.7%
(907/910)
Proportion of eligible children aged 5 to 14 years who are contacts of bacteriologically confirmed index patients started on TB preventive treatment (treatment for LTBI) who completed TPT
NA NA

19
2.3. Strengthening management of TB / HIV and other co-morbidities
2.3.1. Screening of HIV among TB presumptive and cases
Among 140,860 TB presumptive cases registered, 13% knew their HIV status and 87% didn’t know their HIV status of whom 99.6% were tested for HIV. The HIV prevalence among TB presumptive cases was 13.6%. See table
Table 15: Screening of HIV among TB presumptive cases, July 2019-June20.
Screening of HIV among presumptive TB
TB Presumptive living with HIV/AIDS 18,362
TB Presumptive With unknown HIV status 122,498
TB Presumptive With unknown HIV status tested for HIV 121,983
TB Presumptive With unknown HIV status whose Status become HIV+ (after test)
841
Total HIV positive Presumptive 19,203
During this fiscal year 2019-2020, we conducted an active case finding among PLHIV in three health facilities of Nyamata DH (Nyamata DH, Nyamata HC, Mareba HC ) using also chest x-ray as screening tool. A total of 431 out of 959 (44.9%) people living with HIV were screened for pulmonary tuberculosis, 8.8% were presumptive TB and one TB case was diagnosed. Among TB cases diagnosed, the HIV prevalence was 19.9%(1132/5667). The TB NSP 2019-2024 approved the use of the LF-LAM technique to improve diagnostic of TB among PLHIV and during 2020-2021 FY we will provide directive and start train staff on this diagnostic test.
2.3.2. Tuberculosis Preventive Therapy among PLHIV (implementation process)
Rwanda decided to resume the implementation of management of latent TB among PLHIV. In September 2018, the national TB/HIV technical working group recommended progressive implementation of the TPT program among newly tested HIV positive clients, starting with 5 district hospitals and all health centres in their respective catchment area. Then in the new TB NSP, the adoption of expanding this strategy to all PLHIV were made. The pilot implementation started by enrolling only new PLHIV in Kibagabaga DH, Rwamagana RH, Ruhengeri PH, Gisenyi DH and Kigeme DH and using chest x-ray screening was mandatory. Based on the program data and evidence gathered from literature including WHO recommendations on TPT, which highlight that the reliability of symptom-based screening for TB for public health purposes and that the chest X-Ray is no longer a necessity, especially if it poses a significant barrier to TPT, the National Technical Working Group (NTWG) in April 2020 concluded on the recommendations that chest X-Ray should not be a requirement for every PLHIV to initiate TPT.
From November 2019 to June 2020, 1,547 HIV+ newly enrolled were screened for TB related symptoms and 53.7% were symptoms negative, thus eligible for chest X-ray screening: 19.3% were TB presumptive and among them 38 were TB cases including 6 clinically diagnosed. The remaing 1,509 were eligible for TB preventive therapy but only 895 (59.3%) started the treatment: this represents only 0.4% (895 out of 201,629) of all PLHIVenrolled in HIV program.
20
Table 16: Initiation of PLHIV on Tuberculosis preventive therapy, July 2019-June 20. TPT cascade Number %
Newly HIH + enrolled 1,547
Symptom screening Negative
Symptom screened Negative 1,293
84%
Symptom screened Positive 241 16%
Symptom screened not done 13
1%
Chest x-ray screening
Normal chest x-ray 694 45%
Abnormal chest x-ray 59 4%
chest x-ray not done 540 35% TB presumptive
based on symptom 241
based on chest x-ray 59
TB case 38
Eligible for TPT 1509
Started TPT 895 59.3%
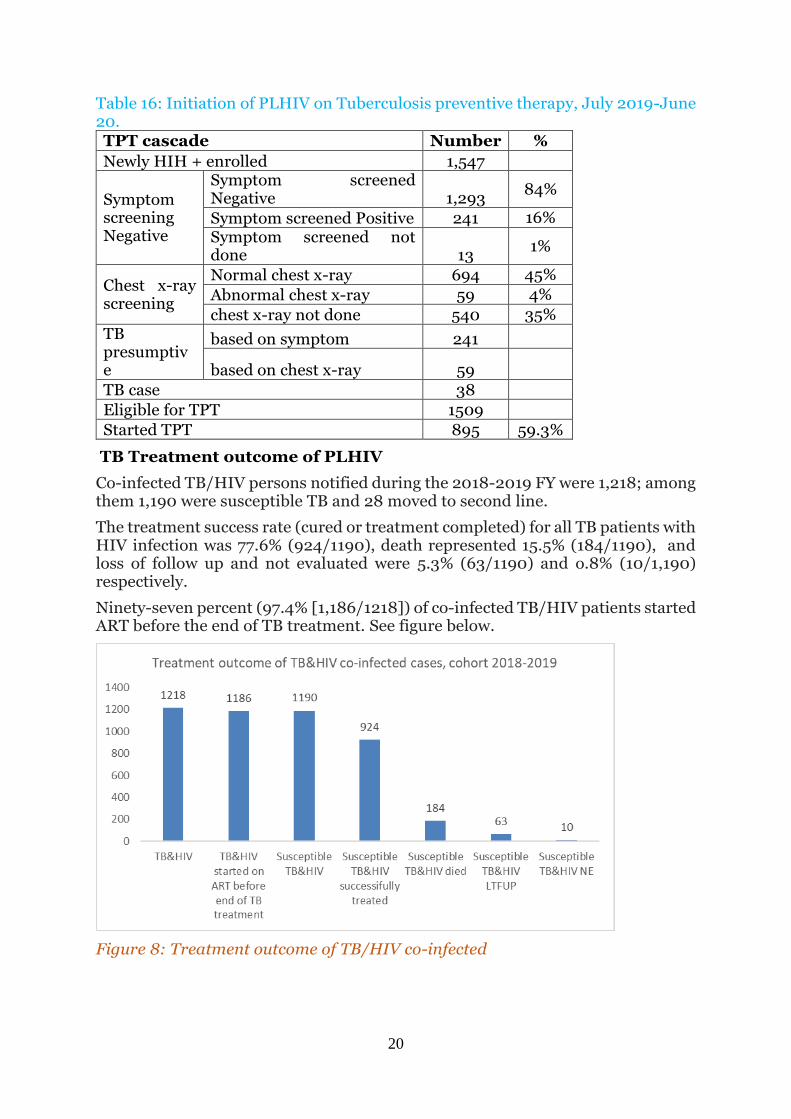
TB Treatment outcome of PLHIV
Co-infected TB/HIV persons notified during the 2018-2019 FY were 1,218; among them 1,190 were susceptible TB and 28 moved to second line.
The treatment success rate (cured or treatment completed) for all TB patients with HIV infection was 77.6% (924/1190), death represented 15.5% (184/1190), and loss of follow up and not evaluated were 5.3% (63/1190) and o.8% (10/1,190) respectively.
Ninety-seven percent (97.4% [1,186/1218]) of co-infected TB/HIV patients started ART before the end of TB treatment. See figure below.
Figure 8: Treatment outcome of TB/HIV co-infected

21
2.3.4. Tuberculosis and Diabetes
TB&ORD and NCD divisions under RBC in collaboration with Rwanda Diabetic Associations (RDA) organized field visits to carry out an assessment on holistic management of diabetic patients in 6 health facilities (Ruhengeri RH, Rwamagana PH, Mibirizi DH, Ruhango PH, Muhima DH, RDA clinic) and some recommendations were proposed:
- Integrate TB screening in routine diabetic management via National NCD Electronic Medical Records (open MRS and open clinic) and hard copies files.
- Organize TB screening among diabetes patients once per year (Active Case Finding).
In total, 165 forms using symptom based screening were completed and analyzed in those six facilities, and diabetes patients who were presumptive TB provided sputum for GeneXpert. The findings showed that diabetes patients with presumptive TB were 6.06% (10/165) and zero TB cases. However the small sample size has not allowed to real figure of TB cases among diabetic patients to be captured.
Key results:
Indicator Target
2019-2020 Results
Treatment success rate among HIV positive TB cases
79% 79.6% (924/1190)
LTBI treatment coverage among PLHIV 20% 0.4% (895/201,629)
Proportion TB-HIV on ART at the end of TB treatment
93% 97.4% (1186/1218)
Proportion of diabetes patients screened for TB TBD Not yet started
2.4. Ensuring diagnosis and management of Lung health diseases
2.4.1. Management of practical approach for lung diseases (PAL)
The Practical Approach to Lung health (PAL) is a syndromic approach to the management of patients who attend primary health care services for respiratory symptoms. The PAL strategy targets multi-purpose health workers, nurses, doctors, and managers in primary health care settings with successful TB control programs in low and middle-income countries2.
The PAL approach has been progressively implemented in all health facilities over the country. The RSQA conducted in February 2020 showed the current situation compared to the last fiscal year. The overall score of implementation of PAL has decreased from 78.0% (FY 18-19) to 71.4% (19-20); this may be attributed to the influence of four new questions introduced in the checklist during this fiscal year and turnover of staff trained on PAL is contributing to this issue. Even if the PAL equipment has been distributed to the health facilities, the score of their availability decreased from 77.3% (FY 18-19) to 74.3% (FY 19-20). Most of the staff in health facilities are not aware on the availability and use of the peak flow meter.
2 Who.int/tb/health_system/pal/en/

22
Furthermore, the staff in health facilities still encounter difficulties in the management of chronic respiratory disease. To address these issues we have to enhance collaboration with the NCDs Division to improve quality of PAL strategies through the appropriate screening of TB among patients with chronic respiratory disease and also through improving their management.
Key results:
Indicator Target 2019-
2020 Results
Proportion of first level health facilities
that have at least one staff trained to
provide PAL services
19% 19.2%
(109/568)
2.5. Promote intensified screening and diagnosis of high-risk group (HRG) populations
2.5.1. TB screening and diagnosis among high risk groups
Overall, two thousand eight hundred fifty-six (2,860) TB cases were confirmed
among people at higher risk of TB, representing 50.4% of 5,678 all TB cases. The 2019-2024 TB NSP target is at 53% for 2019-2020 FY.
Table 17: Summary result of TB screening and diagnostic among selected HRG, July 2019-June20.
Risk group Screened Presump
tive TB TB
cases %
New Prisoners admitted in prisons during the reported quarter
27,433 1,251 414 7.3%
Prisoners at the end of the quarter previous to the reported quarter
155,594 12,335
Contacts of TPB+ ≥ 5 years (of cases registered during the evaluated quarter)
14,878 2,872
425 7.5% Contacts of TPB+ < 5 years (of cases registered during the evaluated quarter)
1,405 141
HIV+ persons (exclude prisoners, contacts, children <15 years, elderly≥55 years)
548,958 15,103 912 16.1%
Children < 15 yrs (exclude children prisoners, children contacts)
1,477,191 12,012 251 4.4%
Elderly≥55 years (exclude prisoners ≥55 years and contacts ≥55 years)
1,038,221 40,503 858 15.1%
Total 2,860 50.4%
Source DHIS2 (R-HMIS&TB case surveillance)

23
During this FY 2019-2020, ACF was planned in 3 prisons (Rubavu, Nyarugenge, and Huye Prisons), 3 hospital catchment areas (Nyamata DH, Ruhengeli RH, and Rwamagana PH) and 4 times among youth in rehabilitation transit centers. Unfortunately, the activity was conducted in two of the three prisons (Rubavu and Nyarugenege), the Nyamata DH cathment area (Nyamata DH, Nyamata HC and Mareba HC), two youth transit centres (Kigali and Nyamagabe) and in Kigali hotspots (Kacyiru and Kimisagara Sectors). This was due to technical problems of trucks and X-ray machines that led to use one X-ray machine or one truck thus spending double time in one prison than was planned before. Additionally, the COVID-19 pandemic which occurred in our country since March 2020 influenced the implementation of this plan. This report will focus on the key achievements of ACF during this FY 2019-2020.
2.5.2. TB screening and diagnosis among prisoners
A total of 15,901 out of 18,483 (86.0%) prisoners of Rubavu (96.7%) and Nyarugenge Prisons (78.0%), were screened for pulmonary tuberculosis using symptomatic (a cough ≥ 2 weeks) and chest x-ray screening. Among all screened for TB, 960 (6.0%) were presumptive TB; 5 (0.5%) were presumptive TB by symptoms with normal chest X-ray, 601 (62.6%) were presumptive TB by chest X-ray suggestive of TB without TB symptoms and 354 (36.9%) were presumptive TB by both symptoms and chest X-rays suggestive of TB.
Figure 9: Presumptive TB by screening method among prisoners during 2019-2020 FY
A total of 59 new TPB+ (including 2 MDR TB cases) were detected in Rubavu and Nyarugenge Prisons. All TB cases were from presumptive TB by chest X-ray suggestive of TB with both symptoms or not (see details in table no 16). The added value of chest X-ray screening in all detected TB cases is 52.5% and the average of TB case notification rate is 381 per 100,000 populations.

24
Table 18: Enhance case findinds among prisonners at Rubavu and Nyarugenge prisons.
Category TB cases among prison inmates
% Rubavu Nyarugenge Total
Symptom screening only 0 0 0 0.0%
CXR screening only 22 9 31 52.5%
Symptom and CXR screening 16 12 28 47.5%
Total 38 21 59 100%
2.5.3. TB screening and diagnosis among youth in rehabilitation centers
Youth in transit centers (Nyamagabe and Kigali) during September 2019 and June 2020, were screened for pulmonary tuberculosis using symptoms and chest X-ray. Among them, 8.4% (327/3,888) were presumptive of TB. The added value of CXR for screening was at 40.7% (133/327).
Twenty-eight TB cases were diagnosed and CXR contribution was at 42.9% (12/28). See the following table for more details:
Table 19: TB active screening cascade among youth in transit centers, July 2019-June 20. Population Nyamagabe
Transit
Center_Sept
2019
Kigali
Transit
Center_Sept
2019
Kigali Transit
Center_June
2020
Total
Total screened 1,440 1,414 1,034 3,888
Total screened positive 205 70 52 327
Symptom only 98 1 0 99
CXR only 54 38 41 133
Symptom + CXR 53 31 11 95
TB cases 11 10 7 28
Symptom only 1 0 0 1
CXR only 2 5 5 12
Symptom + CXR 8 5 2 15
2.5.4. TB screening and diagnosis among people living with HIV
A total of 431 out of 959 (44.9%) people living with HIV in three health facilities of Nyamata DH zone, were screened for pulmonary tuberculosis using symptomatic (any TB symptoms) and chest X-ray screening. Among people living with HIV screened, 8.8% (38/431) were presumptive TB and one TB case was diagnosed.
2.5.5. TB screening and diagnosis in some TB hot spots
A total of 350 persons were screened for pulmonary tuberculosis using symptoms in Kacyiru and Kimisagara Sectors. Among them, 40.9% (143/350) were presumptive TB and 19 TB cases were diagnosed. See details in the following table.

25
Table 20: TB active screening cascade in Kigali, July 2019-June20.
HF Site
#population consulted (Coughers screened)
#presume TB
#cas TB
KACYIRU HC catchment sites
Kacyiru 63 52 5
COR UNUM HC catchment sites
Cor Unum 287 91 14
Total 350 143 19
Key results: Indicator Target 2019-
2020 Results
Proportion of TB cases notified among high risk groups (disaggregated per HRG)
53% 50.4%
(2856/5668)
26
3. PROGRAMMATIC MANAGEMENT, MULTI-SECTORAL COLLABORATION & ENGAGING ALL CARE PROVIDERS
3.1. Political commitment with adequate resources (human, financial, equipment and infrastructure) for tuberculosis care and prevention
3.1.1. Government and partners’ contribution
The government of Rwanda is willing to continue increasing domestic funds to fight TB in Rwanda through integration of health services at the decentralized level and through exploring the way some activities are covered by health insurances. The integrated approaches have advantage for rational use of resources, for example supply chain management, sample transportation across the lab network, supervision, data reporting and human resource management. In addition, TB drugs are distributed to health facilities using the active distribution method.
Supervisions, aimed at improving quality of TB services and TB data at the central level are integrated and conducted under the coordination of the RBC/PME Division (biannual integrated supportive supervision). At the intermediate and peripheral level, district hospitals will supervise health centers (HCs) and the latter will supervise the community level, using the integrated approach.
The Ministry of Health through the Rwanda Biomedical Center will continue to advocate for domestic and external financial support and the result of the TB catastrophic cost survey will be used for advocacy.
Key results: Indicator Target
2019-2020
Results
Household health expenditure for TB TBD NA
3.2. Management of tuberculosis care and prevention
3.2.1. Capacity building of health care provider on TB care and prevention management
The aim of capacity building of staff is to improve the efficiency of services offered through different approaches such as trainings, workshops, mentorship and technical working group meetings of staff focusing on practical competencies and covering all TB control components in order to achieve the goals of the TB&ORD Division.
The following provides the description of summarized topics covered and recommendations developed for post capacity building.
Table 21: list of topics covered for capacity building, July 2019-June20. Type Topic Observation
Mentorship
Mentorship on
TB death audit
in district with
poor treatment
outcome
this mentorship was conducted in health facilities of
7 districts (Nyarugenge, Kicukiro, Rubavu,
Kamonyi, Muhanga and Bugesera) from 19 to 30
august 2019 and February 2020. With the support
of TB staff at central level , health care provider are
mentored to how to analyze finding of poor outcome
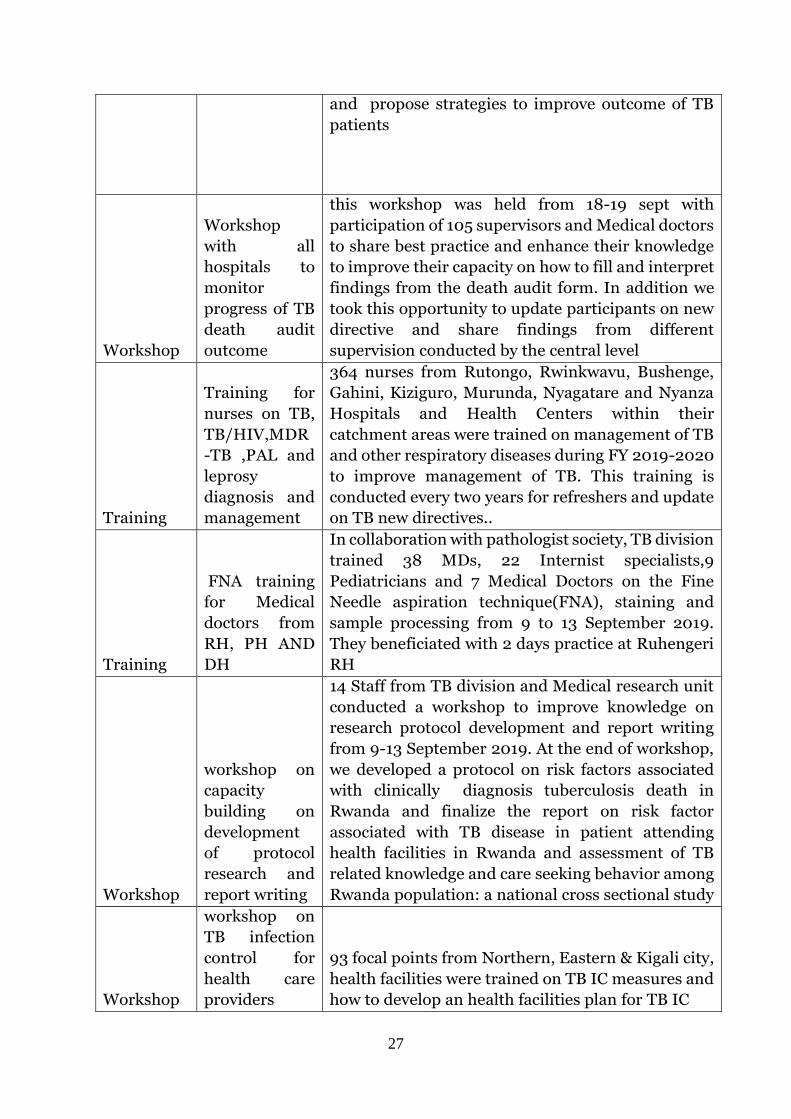
27
and propose strategies to improve outcome of TB
patients
Workshop
Workshop
with all
hospitals to
monitor
progress of TB
death audit
outcome
this workshop was held from 18-19 sept with
participation of 105 supervisors and Medical doctors
to share best practice and enhance their knowledge
to improve their capacity on how to fill and interpret
findings from the death audit form. In addition we
took this opportunity to update participants on new
directive and share findings from different
supervision conducted by the central level
Training
Training for
nurses on TB,
TB/HIV,MDR
-TB ,PAL and
leprosy
diagnosis and
management
364 nurses from Rutongo, Rwinkwavu, Bushenge,
Gahini, Kiziguro, Murunda, Nyagatare and Nyanza
Hospitals and Health Centers within their
catchment areas were trained on management of TB
and other respiratory diseases during FY 2019-2020
to improve management of TB. This training is
conducted every two years for refreshers and update
on TB new directives..
Training
FNA training
for Medical
doctors from
RH, PH AND
DH
In collaboration with pathologist society, TB division
trained 38 MDs, 22 Internist specialists,9
Pediatricians and 7 Medical Doctors on the Fine
Needle aspiration technique(FNA), staining and
sample processing from 9 to 13 September 2019.
They beneficiated with 2 days practice at Ruhengeri
RH
Workshop
workshop on
capacity
building on
development
of protocol
research and
report writing
14 Staff from TB division and Medical research unit
conducted a workshop to improve knowledge on
research protocol development and report writing
from 9-13 September 2019. At the end of workshop,
we developed a protocol on risk factors associated
with clinically diagnosis tuberculosis death in
Rwanda and finalize the report on risk factor
associated with TB disease in patient attending
health facilities in Rwanda and assessment of TB
related knowledge and care seeking behavior among
Rwanda population: a national cross sectional study
Workshop
workshop on
TB infection
control for
health care
providers
93 focal points from Northern, Eastern & Kigali city,
health facilities were trained on TB IC measures and
how to develop an health facilities plan for TB IC
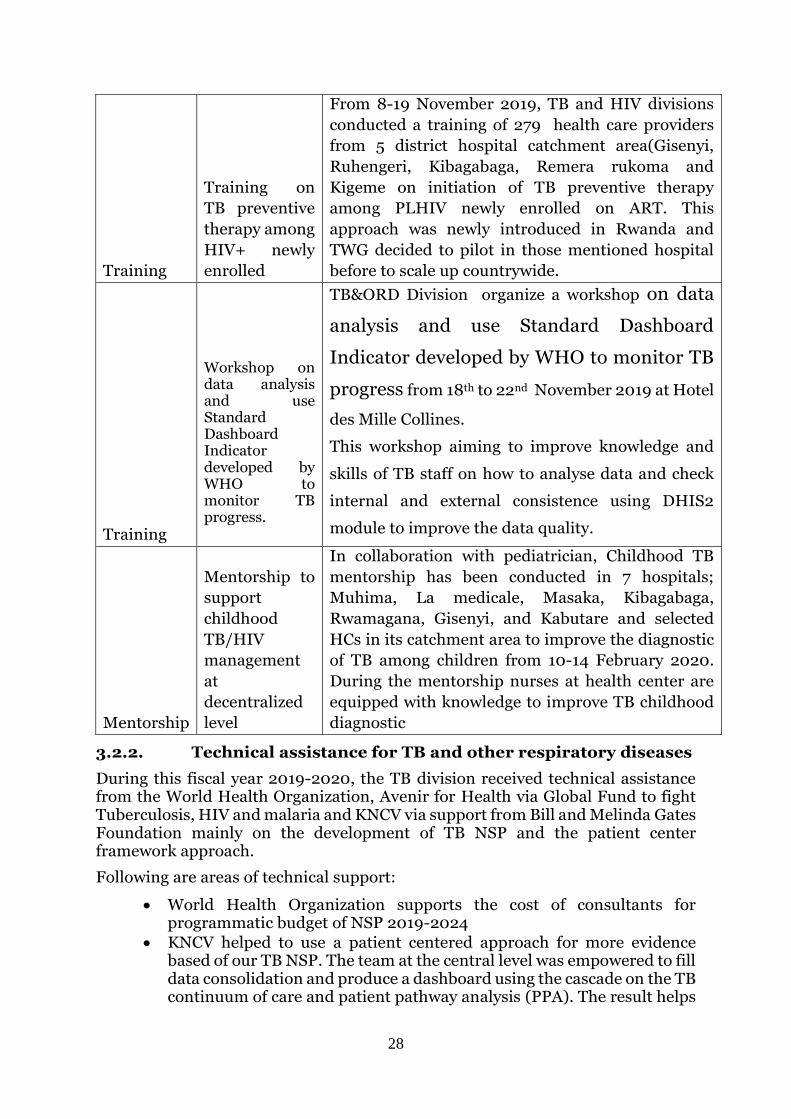
28
Training
Training on
TB preventive
therapy among
HIV+ newly
enrolled
From 8-19 November 2019, TB and HIV divisions
conducted a training of 279 health care providers
from 5 district hospital catchment area(Gisenyi,
Ruhengeri, Kibagabaga, Remera rukoma and
Kigeme on initiation of TB preventive therapy
among PLHIV newly enrolled on ART. This
approach was newly introduced in Rwanda and
TWG decided to pilot in those mentioned hospital
before to scale up countrywide.
Training
Workshop on data analysis and use Standard Dashboard Indicator developed by WHO to monitor TB progress.
TB&ORD Division organize a workshop on data
analysis and use Standard Dashboard
Indicator developed by WHO to monitor TB
progress from 18th to 22nd November 2019 at Hotel
des Mille Collines.
This workshop aiming to improve knowledge and
skills of TB staff on how to analyse data and check
internal and external consistence using DHIS2
module to improve the data quality.
Mentorship
Mentorship to
support
childhood
TB/HIV
management
at
decentralized
level
In collaboration with pediatrician, Childhood TB
mentorship has been conducted in 7 hospitals;
Muhima, La medicale, Masaka, Kibagabaga,
Rwamagana, Gisenyi, and Kabutare and selected
HCs in its catchment area to improve the diagnostic
of TB among children from 10-14 February 2020.
During the mentorship nurses at health center are
equipped with knowledge to improve TB childhood
diagnostic
3.2.2. Technical assistance for TB and other respiratory diseases
During this fiscal year 2019-2020, the TB division received technical assistance from the World Health Organization, Avenir for Health via Global Fund to fight Tuberculosis, HIV and malaria and KNCV via support from Bill and Melinda Gates Foundation mainly on the development of TB NSP and the patient center framework approach.
Following are areas of technical support:
World Health Organization supports the cost of consultants for programmatic budget of NSP 2019-2024
KNCV helped to use a patient centered approach for more evidence based of our TB NSP. The team at the central level was empowered to fill data consolidation and produce a dashboard using the cascade on the TB continuum of care and patient pathway analysis (PPA). The result helps

29
to identify priority gaps and opportunities to plan based on available data in order to design effective, evidence-based interventions. We want to highlight that the PPA technical support was provided remotely during the COVID-19 lockdown and it was a great experience
Avenir for Health helps to model our interventions to visualize the impact on TB incidence and mortality. A workshop has been provided to the TB central staff of TIME Impact modeling and we contributed to improve model calibration and reviewed of the model scenario. Three scenarios (O: doing business as usual; 1: ambitious but feasible and 2: very ambitious) were developed and costed. We adopted the scenario 1 which will help to reduce TB incidence and mortality by 39% and 53% respectively based on 2015 targets.
Key results: Indicator Target
2019-2020
Results
Proportion of public health facilities where at least one staff has participated in training on TB during the evaluated years
19% 19.2%
(109/568)
3.3. Engagement of communities, civil society organizations, and public and private care providers
3.3.1. Community engagement
During the FY 2019 – 2020, the contribution of Community Health Workers (CHWs), in TB case detection is 16.4% (930/5,678). The target being 21%, this has not been reached, and it is below the 25.2% that was found in the previous FY. This may be due:
- to the poor performance of CHWs - or there is a delay on filing data in the individual cases based surveillance
after the enrolment of TB cases, - Or mistake or inattention when they need to choosethe option “CHW” on
the variable “Patient referred by”!
Figure 10: Contribution of CHWs in TB cases detection in Rwanda, July 2019-June 2020

30
3.3.2. Civils society organization contribution
3.3.2.1. Rwanda network of People Living with HIV (RRP+)
The sensitization of people living with HIV was made in order to prevent co-infection of HIV-TB, RRP+ through their peer educators. This sensitization focused on the following topics: TB symptoms, TB prevention methods, COVID-19 symptoms and its relation with TB and COVID-19 prevention measures. A total number of 130,558 people living with HIV were sensitized on TB.
Peer education is organized during home visits to the patients and they transfer to the nearest health facilities when they find a presumptive TB case. After the home visits, the Peer Educators (PE) have to link the patients that they are following up in the community with the health facilities and encourage the clients to respect the appointment in the ART services for good adherence. The number of 154 people were presumptive TB and were referred to Health Facilities for screening and laboratory investigation.
Since March 2020, Rwanda is facing the COVID-19 pandemic and RRP+ consequently stopped the group support education session that were supposed to be prepared and conducted by peer educators. Although education sessions were organized on mobile phones, using RRP+ toll free (1245).
3.3.2.2. National Youth Council (NYC)
In the community, IEC was specially oriented to youth in schools where the crowding settings in which they live may easily spread mycobacterium tuberculosis. A total number of 63 secondary schools with 32,850 students were sensitized on TB prevention; the screening was directly conducted in groups and 1,024 students were considered as presumptive TB. The sensitization sessions were conducted in collaboration with 28 health facilities and National Youth Council (NYC).
3.3.3. Contribution of private health care on TB management
Private sector engagement needs to be urgently expanded in order to reach the End TB strategy.
Engaging private health facilities are also essential for reducing the missing TB cases. To cover the gap, TB program has to collaborate with private health facilities for accelerating their strategic full engagement in TB detection and management, and the program is committed to increase the number of private health sectors as CDT and CT. Currently there are three private clinics working as centers for diagnostics and treatment which contributed to identification of 0.34% (19/5,668) of TB cases nationwide.
Key results:
Indicator Target
2019-2020
Results
Number of private clinics engaged to provide
comprehensive TB services 10 3
Proportion of TB notifications contribution by
private clinics 3%
0.33%
(19/5,678)

31
3.4. Migrant and cross boarder
3.4.1. TB Prevention and care among migrants
With the aim of reducing the mortality and morbidity rate of tuberculosis in the community residing in refugee camps, the TB & ORD Division in collaboration with District Hospitals organized and conducted a sensitization campaign on the prevention, detection and management of tuberculosis and leprosy for community health workers from refugee camps.
The cumulative number of community health workers that were trained on TB prevention, symptoms and screening reached 550 out of 560 expected, that represent 98.2%.
3.5. TB infection prevention & control (IPC)
3.5.1. TB infection control measures at health facilities
During the fiscal year 2019 - 2020, a Rapid TB Services Quality Assessment was conducted. This covers different components of Tuberculosis quality services delivery in health facility settings.
Findings from the RSQA 2019-2020 activity, specifically for the component of the Tuberculosis Infection Control was summarized as follows:
- 76.5% of assessed HFs had their TB IC plan updated compared to 72.6% from the previous FY 2018-2019;
- 45.9% of HFs evaluated their TB IC plan compared to 39.9% but the score is still low;
- A decrease has been noticed in the existence of a committee and a focal point for TB IC and availability of updated TB IC IEC plans;
- TB IC activities are not integrated in the IPC at hospital level and no standard format is present to regularly evaluate implementation of TB IC plans.
- The overall score of information on cough hygiene for general population, coughing patients separated from others and TB screening among health facility workers has increased from 81.5% (FY 18-19) to 83.6% (FY 19-20).
- There has been constant performance in the score of room ventilation for TB services and the existence and use of health workers personal protection from 79.3% (FY 18-19) to 79.4% (FY 19-20).
- The availability and functionality of extractor fans had a score of 25.7%. This will need advocacy to avail and maintain these equipment in the health facilities.
The prevention of disease should be among the TB program frontline defenses to avoid transmission and exposure risk at HFs. The hospital should understand the importance of applying TB infection control measures to protect their staff and other persons.
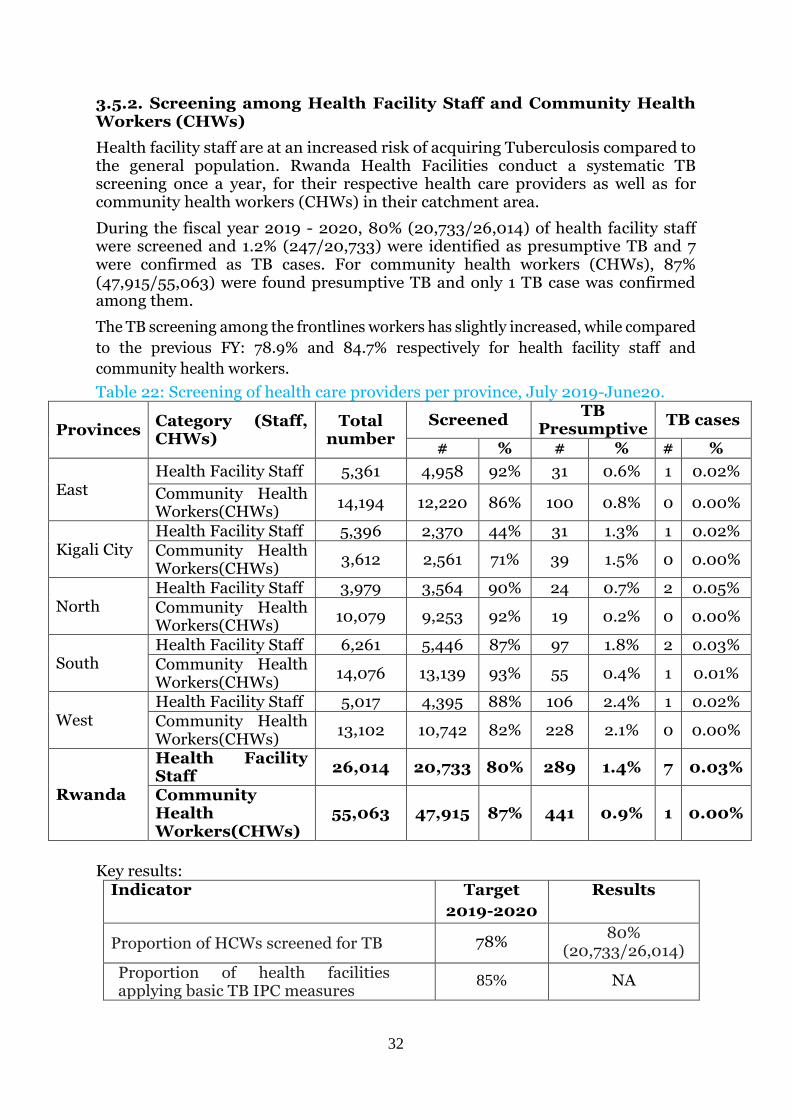
32
3.5.2. Screening among Health Facility Staff and Community Health Workers (CHWs)
Health facility staff are at an increased risk of acquiring Tuberculosis compared to the general population. Rwanda Health Facilities conduct a systematic TB screening once a year, for their respective health care providers as well as for community health workers (CHWs) in their catchment area.
During the fiscal year 2019 - 2020, 80% (20,733/26,014) of health facility staff were screened and 1.2% (247/20,733) were identified as presumptive TB and 7 were confirmed as TB cases. For community health workers (CHWs), 87% (47,915/55,063) were found presumptive TB and only 1 TB case was confirmed among them.
The TB screening among the frontlines workers has slightly increased, while compared
to the previous FY: 78.9% and 84.7% respectively for health facility staff and
community health workers.
Table 22: Screening of health care providers per province, July 2019-June20.
Provinces Category (Staff, CHWs)
Total number
Screened TB
Presumptive TB cases
# % # % # %
East Health Facility Staff 5,361 4,958 92% 31 0.6% 1 0.02%
Community Health Workers(CHWs)
14,194 12,220 86% 100 0.8% 0 0.00%
Kigali City Health Facility Staff 5,396 2,370 44% 31 1.3% 1 0.02% Community Health Workers(CHWs)
3,612 2,561 71% 39 1.5% 0 0.00%
North Health Facility Staff 3,979 3,564 90% 24 0.7% 2 0.05%
Community Health Workers(CHWs)
10,079 9,253 92% 19 0.2% 0 0.00%
South Health Facility Staff 6,261 5,446 87% 97 1.8% 2 0.03% Community Health Workers(CHWs)
14,076 13,139 93% 55 0.4% 1 0.01%
West Health Facility Staff 5,017 4,395 88% 106 2.4% 1 0.02% Community Health Workers(CHWs)
13,102 10,742 82% 228 2.1% 0 0.00%
Rwanda
Health Facility Staff
26,014 20,733 80% 289 1.4% 7 0.03%
Community Health Workers(CHWs)
55,063 47,915 87% 441 0.9% 1 0.00%
Key results: Indicator Target
2019-2020
Results
Proportion of HCWs screened for TB 78% 80%
(20,733/26,014)
Proportion of health facilities applying basic TB IPC measures
85% NA
33
4. UNIVERSAL HEALTH COVERAGE, SOCIAL PROTECTION, HUMAN RIGHTS & GENDER, NUTRITION
4.1. Universal Health Coverage and social protection
The Government of Rwanda has made significant efforts to develop its Health care system at the National and community levels and to make it possible for most people in the country to access affordable Health care.
In Rwanda, all Tuberculosis related services are free of charge. For all presumptive TB patients, the whole flow of TB diagnosis and treatment are being provided freely. For sustainability of the program and mobilisation to increase the domestic financing, the following strategies are proposed:
- Advocate TB diagnosis and control (Laboratory tests, chest X Ray, Abdominal ultrasounds) to be covered by Insurances Health schemes in Rwanda to reduce financial barriers to accessing care and minimize the adverse socio- economic impact of TB,
- Strengthen the collaboration between the Ministry of Health and the Ministry of Local Government, for a special consideration of TB patients within the ubudehe cluster 1
- Create a charity fund for TB Patients
4.2. Human rights and gender
The declaration of the rights of people affected by Tuberculosis launched on 14th May 2019 was published to guide countries on how to implement the commitments made in United Nations High Level Meeting in 2018 on Tuberculosis. The lack of human rights protections makes people more vulnerable in developing TB disease, negatively affects their ability to access effective treatment and exposes them to stigma and discrimination by the fact of having TB.
Rwanda has made good progress on human rights and gender, specifically for ensuring access to TB diagnostics and care free of charge. However the level of stigma faced by TB patients is unkown. The country is mobilizing funds to conduct an assessment on TB stigma in order to develop an appropriate action plan.
Key results:
Indicator Target
2019-2020
Results
Percentage of people diagnosed with TB who report
stigma in health care settings that inhibited them from
seeking and accessing TB services
TBD NA
Percentage of people diagnosed with TB who report
stigma in community settings that inhibited them from
seeking and accessing TB services
TBD NA

34
4.3. Social Protection and patient support
The TB&ORD Division in collaboration with different stakeholders, has been ensuring psycho-emotional and financial support to all MDR-TB patients diagnosed and treated in Rwanda from July 2019 to June 2020 period. The trend of the component related to the BMI monitoring for susceptible TB patients and nutritional support, newly introduced in this fiscal year, will be established in the next year.
Individual counseling after MDR-TB diagnosis includes health education on the disease, possibility of treatment, duration of treatment and the mode of treatment. The patient is advised to begin treatment as soon as possible. Upon entering the MDR-TB center at district level, another individual counseling session is organized. During hospitalization at the MDR-TB center, group counseling led by an MDR-TB psychologist or one of the nurses is carried out weekly. During ambulatory care, the health center providing DOT is mainly responsible for counseling and treatment follow up.
Hospitalization, clinical exams, drugs, food and hygiene materials are given to MDR-TB patients during hospitalization.
During ambulatory treatment, MDR-TB patients are provided with drugs, clinical exams, free medical insurance (that covers all medical costs, including 90% of costs for family members), transportation fees and nutritional support (food packages).
The two MDR-TB wards have been paid sixty thousand Rwandan francs
(60,000frw) of health insurance for 20 persons. Seventy-eight patients on
outpatient treatment, have been provided with support for nutrition in their
respective health facilities. Sixty-three health facilities with MDR-TB patients as
well as two MDR-TB wards (Kabutare and Kibagabaga), have benefited MDR-TB
financial support equivalent to one hundred forty-five million nine hundred fifty
thousand and two hundred eighteen Rwandan francs (145,950,218 Rwf).
Key results:
Indicator Target
2019-2020 Results
Proportion of TB patients who are
evaluated for nutritional support 100%
100%
(5678/5678)

35
5. STABLE AND QUALITY ASSURED SUPPLY OF DRUGS, DIAGNOSTICS AND COMMODITIES
5.1. Supply chain management
5.1.1 Collaboration with stakeholders to ensure the uninterrupted supply chain of TB commodities
TB&ORD Division is fully integrated in the Coordinated Procurement and
Distribution System (CPDS) to ensure that TB national needs are estimated and
conducted regularly. Participation in this framework increases collaboration with
other stakeholders, mainly the Global Health Supply Chain-PSM (GHSC-PSM) for
the technical and finance support to conduct the quantification workshop, training
on e-LMIS and for prevision of TPT products. In addition, this integration offers a
number of key benefits for the parties involved in the supply chain of health
products: cost saving on perdiem and lodging for key personnel who would
normally be required to attend quantification exercises more than one time during
the year, time saving to conduct quantification and supply planning reviews, and
approval processes.
We worked closely with the UNFPA in estimation of product related to nutrition
support together with HIV and MCCH Division in framework of integration and
teamwork.
TB&ORD is always working with MoH, MPPD and NRL to monitor regular stock
level at both level central and decentralized level and data triangulation to assess
the accuracy data within different reporting tools.
Furthermore, the TB&ORD Division increases collaboration with other
institutions; University of Rwanda, School of medicine and pharmacy together
with NRL support development of a module for therapeutic Drug Monitoring of
TB medicines. It has been also noted that there is a good collaboration with
international organization like UNOPS and through that collaboration RBC has
signed an agreement for a donation of TB pediatric second line medicines from
UNOP/GDF. Finally, we worked with WHO to get consultant-supported
development of pharmacovigilance guidelines to enhance safety of patients,
mostly on new medicines.

36
5.1.2 Forecasted accuracy of TB medicines
The total expected TB cases of all forms were 5,571. The registered TB cases all
forms on first line medicines totaled 5591 cases, meaning that the target was
achieved at 100.1% (5580/5571). MDR-TB cases registered for the period of July
2019 - June 2020 represented 82.6 % (76/92) of expected cases.
Table 23: Forecast accuracy of TB medecine, July 2019-June20.
Regimen
Target in
Quantifi
cation
Cases
registered % Comments
Patients under
first line adult
medicines
5215 5345 102% Quantity needed were under
estimated of 2%
Children
under
pediatrics
formulation
356 235 66%
The data is sourced in e-TB in
which we considered the
children with weight under 25
Kg. TB diagnosis among children
is still lower than the cases
expected in quantification. We
have a stock of medicine in risk
at level of 66%. However, the
calculation adjustment could be
always done in accordance with
the current trends or we have to
adapt to the strategy of
childhood.
DR TB Cases 92 76 82.6
%
We observed a reduction of
MDR-TB cases compared to the
previous years, this may due to
the implementation of new
algorithm that exclude MDR-TB
resistant case with low MTB
detected.
5.1.3 Procurement status of TB products at end of June 2020
All planned medicines in the fiscal year 2019-2020 were procured at 95%. However, the delivery of Rifabutin 150 mg was not made due to Active Pharmaceutical Ingredient (API) impurity in its production, investigations are still ongoing. For lab commodities, which are still in pipeline (17%), the delay to deliver was caused by the COVID-19 pandemic where boundaries of some countries were closed before the delivery is scheduled. There is a challenge of not having those products delivered because some suppliers are not willing to support manufacturing and transportation costs, which are already increased.
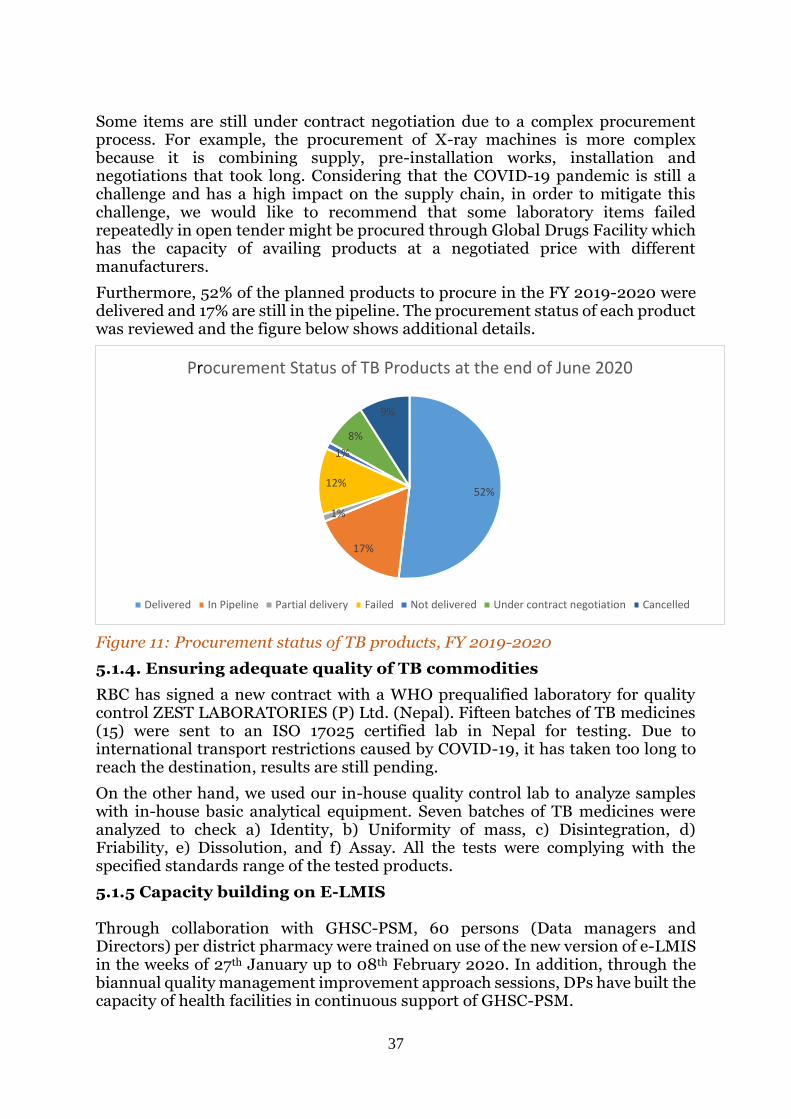
37
Some items are still under contract negotiation due to a complex procurement process. For example, the procurement of X-ray machines is more complex because it is combining supply, pre-installation works, installation and negotiations that took long. Considering that the COVID-19 pandemic is still a challenge and has a high impact on the supply chain, in order to mitigate this challenge, we would like to recommend that some laboratory items failed repeatedly in open tender might be procured through Global Drugs Facility which has the capacity of availing products at a negotiated price with different manufacturers.
Furthermore, 52% of the planned products to procure in the FY 2019-2020 were delivered and 17% are still in the pipeline. The procurement status of each product was reviewed and the figure below shows additional details.
Figure 11: Procurement status of TB products, FY 2019-2020
5.1.4. Ensuring adequate quality of TB commodities
RBC has signed a new contract with a WHO prequalified laboratory for quality control ZEST LABORATORIES (P) Ltd. (Nepal). Fifteen batches of TB medicines (15) were sent to an ISO 17025 certified lab in Nepal for testing. Due to international transport restrictions caused by COVID-19, it has taken too long to reach the destination, results are still pending.
On the other hand, we used our in-house quality control lab to analyze samples with in-house basic analytical equipment. Seven batches of TB medicines were analyzed to check a) Identity, b) Uniformity of mass, c) Disintegration, d) Friability, e) Dissolution, and f) Assay. All the tests were complying with the specified standards range of the tested products.
5.1.5 Capacity building on E-LMIS Through collaboration with GHSC-PSM, 60 persons (Data managers and Directors) per district pharmacy were trained on use of the new version of e-LMIS in the weeks of 27th January up to 08th February 2020. In addition, through the biannual quality management improvement approach sessions, DPs have built the capacity of health facilities in continuous support of GHSC-PSM.
52%
17%
1%
12%
1%
8%
9%
Procurement Status of TB Products at the end of June 2020
Delivered In Pipeline Partial delivery Failed Not delivered Under contract negotiation Cancelled

38
Key results:
Indicator Target
2019-2020 Results
Percentage of CDT with no stock out of FL tracers
(RHZE and RH ad) drugs of experienced in the last 12
months
100% 86.6%
(174/201)
Percentage of MDR TB centers with no stock out of SLD
in the last 12 months 100%
100%
(2/2)
5.2. Rational use of medicine
5.2.1. Implementation of TDM in Rwanda
A number of TB patients remain inadequately treated due to poor response to treatments with the consequence of treatment failure and subsequent death although effective therapy has been widely implemented. The low serum concentration of anti-tuberculosis drugs has an association with treatment failure, relapse, acquired drug resistance; adjustments of drug dose after therapeutic drug monitoring have been related to clinical improvements. Thus, support was needed to monitor anti tuberculosis drug (Isoniazid, Pyrazinamide, Ethambutol and Rifampicin) levels for treatment optimization.
The RBC/TB&ORD Division in collaboration with the RBC/BIOS-NRL Division intends to start performing plasma therapeutic drug measurement of anti-TB drugs (Isoniazid, Pyrazinamide, and Rifampicin) for Rwandan TB patients in need, using the HPLC system available at NRL as one of the tools for rapid quality service assessment of anti-TB treatment outcome.
Following the workshop held in May 2019 to develop a method for plasma therapeutic drug monitoring of Anti-TB drugs for Rwanda TB patients in need, the TB&ORD Division in collaboration with the RBC/BIOS-NRL Division under the support of toxicology experts of UR held two sessions for validating and optimizing the method.
The first session of workshops was held from 8-12 July 2019 and 15-19 July and the second took place from 16- 20 September 2019 and 23- 27 September 2019. At the end of workshops, we saw successful results with four peaks interesting of pyrazinamide, Isoniazid, Naproxen and Rifampicin (PZA, INH, NAP and RFP) were well separated. The method was optimized and subject to mini validation.
Consumables and other reagents are available to perform the TDM test, the next step is to develop a clinical protocol and test the method with biological samples.
5.2.2. Collaborative meetings on use of antibiotics (fluoroquinolones)
For the past few decades, antimicrobial resistance (AMR) has been a growing threat to effective treatment of an ever-increasing range of infections caused by bacteria, parasites, viruses and fungi.
The Rwanda Food and Drugs Authority (FDA) was established by the law No 003/2018 of 09/02/2018 with the mandate of protecting public health through regulation of human and veterinary medicines, vaccines and other biological products, processed foods, poisons, medicated cosmetics, medical devices, household chemical substances, and tobacco products.

39
In Collaboration with the Ministry of Health, Rwanda FDA, RBC and other multisector stakeholders started developing the National Action Plan of Antimicrobial Resistance. The plan outlined the key strategic objectives, interventions and activities that aim to improve awareness and understanding of antimicrobial resistance through effective communication, education and training.
5.2.3. Capacity building on a-DSM implementation From 16th to 20 September 2019, the TB&ORD Division has conducted training of 41 hospital pharmacists and 58 staffs of district pharmacies on new DR TB regimens and a-DSM at Muhanga district. The training aimed to strengthen capacity of staff involved in the supply chain of TB commodities management and members of the Drug Therapeutic Committee (DTC) to reinforce reporting of a-DSM. Currently TB&ORD in collaboration with WHO have recruited a consultant to develop pharmacovigilance guideline of TB medicines. The a-DSM activities have been integrated in both e-TB and in RSQA checklist for continuous monitoring of related indicators. The table below shows key findings on the a-DSM indicator.
The TB&ORD division introduced active drug safety monitoring and management (a-DSM) as standard practice as part of the recommendation of the MTR of the 2013-2018 TB NSP to reduce risks from drug-related harm in patients. The a-DSM is mostly aimed at MDR-TB patient management with new drugs or new regimens but it is also extended to DS-TB during clinical follow-up. This activity is monitored during the RSQA by the staff from the TB&ORD Division. However, in collaboration with the WHO country office, the TB&ORD Division will hire a consultant to develop guidelines on TB drug pharmacovigilance including training materials on a-DSM. The monitoring of a-DSM has been integrated in e-TB and RSQA check list for continuous monitoring of related indicators. Among 5,678 TB cases registered in FY 2019-2020, 3,059 (53.9%) were reported on a-DSM and 62 (2.0%) had side effect on TB drugs. These are preliminary results and the real figures on a-DSM reporting for these cases will be available in FY 2020-2021 at the end of their TB treatment. The table below shows key findings on the a-DSM indicator.
Table 24: Adverses events reported among TB cases, July 2019-June20. N=5,668(total Tb cases registered)
Total reported Percent
Reported on aDSM 3059 53.9%
Side effect 62 2.0%
Key results:
Indicator Target 2019-
2020
Results
Proportion of TB treatment
cards where aDSM section is
completed
100% 53.9%
(3059/5678)

40
6. M&E AND DATA QUALITY SYSTEM (E-TB, HEALTH INFORMATION SYSTEM, CIVIL REGISTRATION AND VITAL STATISTICS (CRVS) SYSTEM
6.1. Surveillance system including mortality registration
6.1.1. Implementation of individual case based surveillance
The TB&ORD Division in collaboration with RBC-PMEBS/HIS and HISP-RWANDA has regularly reinforced the reporting and recording system to make a transition from the paper-based register to the web-based electronic register (e-TB) with individual data for TB cases. It has been updated based of WHO benchmarks and recommendations from TB Epidemiological Review 2018. Therefore, it was endorsed to start using new e-TB from July 2019. In that line, the TB Focal Points and Data Managers from all hospitals were trained on data entry in the new e-TB instances. Since July 2019, the TB&ORD Division phased out the aggregate reporting on TB cases in favor of TB case-based surveillance system in order to make e-TB functional and usable, to reduce the workload and improve quality of data in e-TB. Even efforts have been done on use of individual case based surveillance; we are still facing a challenge of delaying to fill data in real time by health facilities
6.1.2. Reporting of TB
Since July 2019, based on WHO benchmarks and recommendations from TB Epidemiological Review conducted in 2018, the TB&ORD Division phased out the aggregate reporting on TB notification and treatment outcomes in favor of the TB case-based surveillance system in order to make it optimized and usable. The TB treatment outcome information is still reported in both aggregate and individual systems up to June 2020 so that we have information on the TB treatment outcome of the cohort July 2018 – June 2019.
The information on TB screening and presumption is still captured in the HMIS aggregate TB quarterly report.
- Advantages of TB case-based surveillance system
The TB surveillance system with individual data will allow the availability of individual data in real time (e.g. no need to wait for one year to report on TB treatment outcome),
improve quality of TB data, patient management, follow-up of patients during TB treatment and continuation of care.
This system will also facilitate operational research due to several cross tabulations that can be performed with the individual data.
- Current challenges with TB case-based surveillance system Despite the above mentioned advantages of the TB case-based surveillance system, users are still facing some challenges such as: - Delay in completing all the required stages, - Limited computer skills of TB focal points, - Line listing of information from different stages is still done manually, - The aggregated standard reports not yet fully customized in the TB case-
based surveillance system.

41
6.1.3. Rapid Service Quality Assessment
During FY 2019-2020 the TB RSQA checklist was updated based on the new protocols, guidelines and needs of the NTP program, where around 14 questions were added. This revised checklist was used during the TB RSQA conducted in Feb-Mar 2020. Only 113 centers of TB diagnosis and treatment (CDTs) were visited out of 200 planned (57%). This low coverage was due to the suspension of most of the planned field activities to prioritize the ones related to fight against the COVID-19 that appeared in Rwanda from 14th March 2020.
After this RSQA we were able to compare results of different fiscal years; 2018-2019 and 2019-2020 FYs for the health facilities visited in both periods. Overall the score has decreased from 82.0% (FY 18-19) to 77.9% (19-20); this may be explained by the introduction of new items in the revised checklist during this fiscal year. The trend of the component related to the BMI monitoring for TB patients and nutritional support, newly introduced in this fiscal year, will be established in the next year. The sections on a-DSM, MDR-TB management, PAL and leprosy management still need particular attention.
Regarding the impact of TB RSQA on the control and surveillance of the TB&ORD program, we recommend that this activity continue in order to strengthen the capacity of Health Care providers at the decentralized level and provide close follow up of the recommendations through mentorship and trainings.
6.1.4. Civil registration and vital surveillance in Rwanda
The Civil Registration and Vital Statistics (CRVS) system is key to national planning and service delivery, especially in planning and delivering social protection services like education, health and social security. Civil registration of vital events guarantees the provision of essential legal documents to secure one’s identity, nationality, civil rights and access to social services.
Information on birth and death by age, sex and cause is the cornerstone of public health planning. Registration of vital events enables the government to have documented evidence and understanding of the prevalence and distribution of causes of death as well identify health inequalities and priorities.
The current legislative framework for CRVS improvement has been amended and gazetted to permit registration of birth and death in the digital CRVS system (NCI-CRVS) in Health facilities and at the Cell level to avoid the scandal of invisibility and to have every life known and count. This will improve timely registration, coverage and completeness for birth and death. Civil registrars at Cell level will be responsible for conducting verbal autopsy (VA) for community deaths using the WHO VA questionnaire which accounts for a large number for total deaths. 590 civil registrars of Birth and Death in Health facilities were trained on use of digital registration system (NCI-CRVS system) and registration SOPs. The training of Cell civil registrars is underway, where over 400 executive secretaries was trained on digital CRVS system (NCI-CRVS).
All hospitals are certifying death using MCCOD form and data reported using ICD 10 coding system.

42
1. Challenges - Insufficient mechanisms for monitoring the quality of death certification in
all health facilities - Insufficient mechanisms for monitoring the quality of birth and death
registration in all health facilities - Need of regular monitoring civil registrars in Health facilities and at the cell
level - Lack of IT equipment for reporting of community deaths and causes of
death using verbal autopsy mechanisms
Key results:
Indicator Target
2019-2020 Results
(Source : RSQA)
e-TB coverage in CDT and CT as proxy of Timeliness
of routine reporting 95% 97.2%
7. DATA FOR PROGRAMMATIC MONITORING, EVALUATION, LEARNING AND PLANNING
7.1. Evidence generation and use of electronic data systems
7.1.1. National Strategic Plan development
During this FY 2019-2020, we developed a Tuberculosis National Strategic Plan 2019-2024 which will be the guiding document for the five years. The development started in July 2019 with participation of all stakeholders where two workshops were conducted, one to identify gaps and develop strategies and the second to validate developed interventions to be implemented. Later on, we decided to integrate the patient centered framework approach to provide a more evidence based NSP. Our strategic plan has three pillars using the End TB strategy with eight interventions and the total cost for five years is 50 Million dollars with a funding gap of 33%. This emphasizes the need for more resource funding by increasing domestic funds and mobilizing external resources. The TB NSP 2019-2024 was adopted by Rwanda Biomedical Center and Ministry of Heath on May 2020. Based on our NSP, we submitted the TB/HIV funding request to the Global fund.
7.1.2. Patient centered framework
In 2019, WHO published a people centred framework with the aim to facilitate a systematic approach to country-led, data-driven and people-centred planning, prioritization and decision making. The people-centred framework consists of three main components. First, it is based on the continuum of care. Second, it uses three major types of data: epidemiological, people-centred and system-related. Third, it is based on three planning steps: problem prioritization, root cause analysis and optimization of interventions. The people-centred framework provides a structure for organizing data for decision-making and planning in a National Tuberculosis program.
Use of consolidated data along the continuum of care in the three planning steps provides the basis for planning, prioritization and resource allocation using a people-centred approach.

43
In collaboration with KNCV, the TB&ORD division adopted the use of this approach to use available data to inform and provide evidence based in prioritization of NSP.
We started to fill information on the data consolidation tool which produced dashboards on the three continuums of care to show the gap. Data used comes from RHMIS, though we missed recent data on patient seeking behavior: the last data set was produced during the National TB prevalence survey conducted in 2012.
Then we conducted patient pathway analysis (PPA) during the lockdown to compliment the data on data consolidation. PPA is a key analytical tool for implementing the people-centred framework for NSP development. The PPA aims to describe the steps TB patients taken from the initial point of seeking care to the point of being treated. At the same time, the analysis reviews the availability of TB screening, diagnosis, and treatment at various levels of the health system. By examining the alignment of care seeking with service availability, the PPA may reveal where TB patients experience delay during care seeking or treatment initiation or where they access inappropriate care during their journey toward cure. This analysis helps the program to identify some of the health system alignment gaps that can be addressed through targeted program interventions.
We analyzed the secondary data collected during DHS 2014/2015 on TB health seeking care and data for health facilities mapping to generate the PPA. Only data for adults were considered for the analysis.
The result of PPA indicated that 79% accessed public level 1 which had diagnostic capacity and 81% of the person seeking care for TB accessed facilities with diagnostic services of which 56% through sample transportation system. This indicate the importance of sample transportation system. We observed that 8% of people consult the private level of health facility without capacity diagnostics and seeking care for TB was lower for males (74%) compare to females (85%). See figure below for detail
Figure12: Patient Pathway analysis care seeking for adults experiencing TB symptoms DHS 2014/2015

44
7.1.3. Interoperability of different information systems used for TB management
The Rwanda Biomedical Centre through its TB&ORD, PMEBS and NRL divisions in collaboration with FIND have started a new project to install the OpenInterop for interoperability between Genexpert machines and the TB case surveillance System (e-TB). The principal aim is to reduce staff turn-around time, transcription errors, and facilitate M&E processes. This means that the GeneXperts captured the patients personal and medical information as well as the test results prior to sending them to the health providers via internet, sending data automatically to the TB case surveillance system (e-TB) and also pushing the data to DHIS2-HMIS (aggregated data).
The objective of this project is to develop a current TB technology solution to a fully supportable service that can be widely adopted. And:
- To automate the collection of GeneXpert TB diagnostic test data to:
Reduce the manual effort of data collection
Assure the accuracy of collected data
Provide a real-time view of data collection and testing activity - To make data available in existing DHIS2 systems and use existing skills
and investments in DHIS2 to:
Automate inclusion of connected data into existing reports
Generate new reports
Generate new dashboards
Conduct analytics - To link connected data to enrolments into TB case surveillance system(e-
TB) to the WHO TB tracker.
7.1.4. Implementation progress on recommendation Epi review
Table 25: Status of recommendation made during TB epireview October 2018. Recommendations Status of implementation
Finalize new eTB and set a clear objective
and timeline to implement it countrywide
Done and implemented countrywide
since July 2019. Data from individual
was used for reporting during 2019-2020
FY
Ensure the use of a universal unique ID for
all persons in Rwanda (including <16,
foreigners, prisoners, homeless) that can
reliably entered in the new eTB
The unique ID is generated by the
system while waiting the unique ID to be
provided
Flexibility to allow a % of cases with no ID
to be registered in the eTB
Done all cases are registered and ID is no
longer a requirement
Develop a plan for the transition and
migration of data (including completing
2013 reports in HMIS)
Transition has been done
Continue the recording of presumptive TB
to aggregated and not case-based as was
done recently
Done

45
Medium term: consider entering
close/household contacts case-based (but
not at the cost of TB case reporting).
Prioritize eligible IPT to follow up start,
completion and effectiveness.
Done and integrated in current
individual case
Interoperate electronic systems: new eTB,
HIV case base database, LIS, National
Identity Agency, CRVS, among other
relevant - with a unique ID
Interoperate electronic systems is under
development
Increase the number of staff with full time
dedication to M&E activities at national
level, especially considering
implementation of new eTB
Not done
Train in data analysis and interpretation,
using dashboards
TB coordinators at province and TB staff
at central level are trained on the analysis
and interpretation of key TB indicators,
using dashboards in the new eTB
Analyze subnational data, per age/sex, to
monitor case detection and treatment
outcomes
The TB data are analyzed by district
age/sex, to monitor case notification and
treatment outcomes
Prioritize key indicators for data quality, in
ISS&DQA and TB&ORD in meetings
quarterly, document findings
2 keys indicators included for data
quality, in ISS&DQA and 10 indicators in
TB&ORD quarterly evaluation meetings,
Develop plan update SOP for data quality
assessment of the new eTB, especially
during the transition
The job aid SOP using by end users (data
manager) for data quality was developed
Encourage the implementation of the new
CRVS to document all TB hospital and
community deaths using ICD-10 codes
Civil registration and vital sign started to
be operational at health facilities and
only death occurs in the community are
still challenging. There is a project to
train staff from cell at local
administration minutes to record death
using ICD-10 code
Work with pediatricians and primary care
physicians to improve TB diagnosis in
children, especially < 5 and in Kigali
Partial done and there is plan to have
meeting with all pediatric clinic in Kigali
for sensitization.
Consider ACF among household contacts
<5 up to 1-2 years after exposure in
selected sites –especially among those not
on IPT
Not done
Ensure new eTB allows routine
surveillance of drug resistance (% of
rifampicin resistant among new and
previously treated)
From July 2019, the surveillance of TB
DR is done routinely through e-TB.

46
Utilize GeneXpert platforms to full
capacities
Medium term: scale up Xpert MTB/RIF to
all presumptive, beyond Kigali
The Xpert is done to all presumptive
beyond Kigali for all PLHIV, presumptive
>55ans, Prisoners, HCP, Contact of case
index.
Continue efforts among PLHIV, household
contacts and prisoners
Active case finding is conducted among
all high risk (prisoners, PLHIV,
household contacts, Kigali high spot and
youth in Transit Centers)

47
8. RESEARCH PRIORITIES
8.1. Research strengthening
The vision of the Ministry of Health is to provide better quality health services through evidence based policy and planning. The TB & ORD Division has responded to this vision by conducting operational research to inform TB&ORD planning, intervention and to build research capacity of the staff.
8.1.1 Publications made during 2019 -2020 fiscal year
Five high impact manuscripts were published in peer reviewed journals:
1. An article on Reduction of diagnostic and treatment delays reduces rifampicin-resistant tuberculosis mortality in Rwanda was published in Int J of Tuberc and Lung Dis, 2020; it showed that between 2006 and 2016, the median diagnostic delay significantly decreased from 88 days to 1 day and the therapeutic delay from 76 days to 3 days. Simultaneously, RR-TB mortality significantly decreased from 30.8% in 2006 to 6.9% in 2016. Total delay in starting multidrug-resistant TB (MDR-TB) treatment of more than 100 days was associated with more than two-fold higher odds for dying. The reduction of diagnostic and treatment delays reduced RR-TB mortality. Universal testing for RR-TB, short diagnostic and therapeutic delays and effective standardized MDR-TB treatment will further decrease RR-TB mortality in Rwanda (http://dx.doi.org/10.5588/ijtld.19.0298). An article on the Prevalence and drivers of false-positive rifampicin-resistant Xpert MTB/RIF results: a prospective observational study in Rwanda was published in (Lancet Microbe 2020; 1: e74–83). This study demonstrates that half of the patients diagnosed with rifampicin resistance in fact had rifampicin-susceptible TB. Because of the false resistance diagnosis, these patients were treated without rifampicin. Having a very low bacillary load on Xpert testing was strongly associated with false rifampicin resistance at the initial Xpert assay (aOR 63·6, 95% CI 9·9–410·4). Since 3 January 2020 the National TB Programme in Rwanda changed its diagnostic algorithm based on this finding. If a patient with few bacteria is now diagnosed with rifampicin resistance, additional testing confirms or rules out rifampicin resistance before they are started on appropriate treatment. Today, TB patients in Rwanda only receive second line treatment if they really need it.
2. A scientific article about “A sister lineage of the Mycobacterium tuberculosis complex discovered in the African Great Lakes region (Nature Communications, 2020). This article describes a new Tuberculosis strain, known as Lineage 8 (L8), which was found by chance in Rwanda. This discovery is described as a “missing link” in the evolution of one of the world’s oldest and deadliest pathogens. Tuberculosis is one of the oldest pathogens to affect humans. It has several different strains or ‘lineages’. It has known about six lineages for over a decade and a seventh was discovered in Ethiopia about five years ago. Now scientists have found an eighth lineage in Rwanda and Uganda, which seems to be much older than the other lineages and could be a missing link in the evolution of what causes TB.

48
This discovery further supports an East African origin for the MTBC and provides additional molecular clues on the ancestral genome reduction associated with adaptation to a pathogenic lifestyle. (https://www.nature.com/articles/s41467-020-16626-6).
3. We published the results of the first nationwide survey entitled: Result of the first nationwide survey in 2012 yield important lessons for TB control was published in PLoS One, 23rd April 2020) results revealed that a TB prevalence of 74.1 (95% CI 48.3-99.3) per 100,000 adult populations for smear positive TB and 119.3 (95% CI 78.8-159.9) per 100,000 adult population for bacteriological confirmed MTB was estimated for Rwanda. The survey findings indicated a lower TB prevalence than previously estimated by WHO providing key lessons for national TB control, calling for more sensitive screening and diagnostic tools and a focus on key populations. Use of chest x-ray as screening tool was introduced to improve the diagnostic yield of TB. (https://pubmed.ncbi.nlm.nih.gov/32324750/)
4. Case Report abstract on: Dynamics of Acquired Fluoroquinolone Resistance under Standardized Short-Course Treatment of Multidrug-Resistant Tuberculosis was also published in Am. J. Trop. Med. Hyg., 00(0), 2020, pp. 1–4 doi:10.4269/ajtmh.20-0201 Copyright © 2020 by The American Society of Tropical Medicine and Hygiene. We report a case of acquired fluoroquinolone (FQ) resistance under short-course multidrug-resistant tuberculosis (MDR-TB) treatment. A low dose of moxifloxacin was used in the first three critical months. Acquired resistance was identified at the ninth month of treatment, 3 months after stopping kanamycin in a strain initially susceptible only to FQs, kanamycin, and clofazimine. Fluoroquinolone resistance was detected in the same month by deep sequencing as routinely used second-line probe assay and phenotypic drug susceptibility testing. High-dose FQ, preferably gatifloxacin, should be used to maximize effectiveness
8.1.2 Studies and protocols under development this fiscal year
Protocols developed:
1. Socio-demographic and Clinical Risk Factors Associated with Mortality Among Clinically Diagnosed Tuberculosis Patients: Hospital-based prospective cohort in Rwanda
2. Clinical and social long term outcomes among multi-drug resistant tuberculosis (MDR-TB) patients who successfully completed MDR-TB treatment under the Rwanda TB program
3. An evaluation of costs borne by Tuberculosis-affected households in Rwanda
4. Evaluation of the impact of lockdown and disruptions caused by the COVID-19 pandemic which led to cases of tuberculosis (TB) undetected and untreated in Rwanda
Study reports finalized:
1. An Assessment of TB-related knowledge and care-seeking behaviors among Rwandan Population: A national cross-sectional study
2. Risk factors associated with TB disease in patients attending health facilities

49
CHAPTER II: LEPROSY CONTROL
TB&ORD Division developed a leprosy National Strategic Plan 2019-2024, which aims to reduce the leprosy burden towards elimination in Rwanda, with a target of zero children diagnosed with leprosy and visible deformities and to maintain the rate of newly diagnosed leprosy patients with visible deformities. These following activities related to the prevention and control of leprosy were carried out in the FY 2019-2020.
1. STRENGTHEN GOVERNMENT OWNERSHIP, COORDINATION AND PARTNERSHIP, INCLUDING STRENGTHENING SURVEILLANCE AND HEALTH INFORMATION SYSTEMS.
1.1. Ensuring political commitment, advocacy, and resource mobilization by engaging all stakeholders for leprosy elimination.
The elimination of leprosy as public health problem was defined by WHO as a registered prevalence of less than 1 case per 10,000 population. Rwanda has achieved already this target of leprosy elimination (0.02) and the next step will be to receive certification from the WHO.
In that regard we expect to at the earliest disseminate the leprosy NSP 2019-2024 to all partners and stakeholders including the health facilities in districts with high burdens in order to integrate leprosy preventive and control measures in their action plans.
It is of critical importance to advocate for increased domestic and external funds to fulfill the gaps to implement strategies set in our leprosy NSP 2019-2024 and to cover the funding of our historical partner Damien foundation, which will end in December 2020. There is a need to maintain the effort and good progress made by Rwanda because we are bordering with some countries with high prevalence rates of leprosy per 10,000 population as shown below:
Table 26: Leprosy prevalence and new case detection rate in Rwanda and neighbouring countries.
Source: Weekly epidemiological record. WHO. 30 AUGUST 2019, 94th YEAR. Nos. 35/36, 2019, 94, 389–412
Population
NC
detected in
2018
NC
detection
rate x
100.000
Registered
prevalence
at end of
2018
Prevalence
rate x
10.000
Democratic Republic of Congo 84.069.000 3.323 3,95 3318 0,39
Burundi 11.175.000 339 3,03 382 0,34
Tanzania 56.313.000 1.482 2,63 1419 0,25
Ouganda 42.729.000 201 0,47 331 0,08
Rwanda 12.089.712 35 0,29 20 0,02
50
1.2. Strengthening surveillance and health information systems for program planning, monitoring and evaluation
1.2.1. Improve leprosy surveillance system
The recording and reporting system was put in place in order to enable the monitoring and evaluation of leprosy activities. The aggregated data related to leprosy are reported through HMIS-DHS2 on quarter basis by all health facilities countrywide. In addition, in collaboration with the HIS unit, we developed an individual case based surveillance for leprosy, which will be improved by other features in order to monitor the new strategies proposed in our strategic plan.
During this fiscal year the following tools were printed:
- leprosy screening register (120), - disability register (30), - leprosy case register (50), - contacts and chemoprophylaxis (50), Community Patient follow up cards
(300).
1.2.2. Improve data reporting and quality
The accuracy of data related to the leprosy reporting system is assured during the TB&ORD Quarterly Evaluation Meetings where the validation is made. In addition, the regular leprosy Data Quality Audit (DQA), as an integrated activity, enhances the capacity of Data managers they met in the health facilities.
1.2.3. Policy strategy and research
The new strategic plan has been developed and before the consultant, the end term review was conducted for the leprosy NSP 2013-2018 in September 2019. The finding from the assessment (September 2019) showed that more than 80% of the new cases are detected in endemic districts where ACF activities were conducted and the decline on percentage of MB and disability grade 2 (G2D) demonstrate the earlier detection. However, 1 out of 10 new case has G2D in endemic districts and then in non-endemic districts, G2D remains high, about 1 out of 2 new cases. Disability assessment was performed at the end of treatment for 97% of the PB patients but only for 60% of MB patients were below the target of 95%.
The adoption of the new leprosy strategic plan serves as a policy strategy that guides the framework of leprosy implementation processes with specific interventions in the endemic area and non-endemic area.
2. STOP LEPROSY AND ITS COMPLICATIONS
2.1. Strengthening patient and community awareness on leprosy
2.1.1. Behavior change communication
The wide sensitization for the general population and high group risks on leprosy signs/symptoms and stigma aims to raise community awareness and behavior changes on leprosy disease. The involvement of all health facilities, local leaders and CHW representatives (cell coordinators) in sensitizing of the community expect to promote the earliest detection of leprosy and treatment, especially in endemic areas. In addition, we produced a visual audio/DVD on leprosy prevention and management to be displayed in the waiting area in all health

51
facilities. We also aired radio and TV shows and carried out sensitization campaigns during active case findings, in prisons and refugee camps.
We build on the TB experience in refugee camps and prisons, to build the capacity of peer educators on leprosy knowledge (signs and symptoms), and we distributed 4,047 leaflets.
2.2. Enhancing early case detection of leprosy in the community through active case finding and contact management.
2.2.1. Leprosy screening and notification
Leprosy screening is conducted either actively by health care facilities at the decentralized level or in collaboration with participation of the central level, health centers and CHWs or passively at outpatient consultations.
In total, 20 leprosy cases were diagnosed, among them 19 were new cases and 1 retreated case after default. The proportion of MB cases represented 57.9% while PB were 42.1% and 89.5% of cases female. The proportion of G2D among new cases is 15.8 % for MB and 0% for PB. For more detail, see the following table.
Table 27: Leprosy notification.July 2019-June 2020
LEPROSY CASES MB PB Total
New cases (NC).
# of new cases (NC) 11 8 19
# of children among new cases (0-14 years) 1 3 4
# of women among new cases 9 7 16
# of new cases detected during active case finding
campaign
11
# of new cases evaluated for their disability at diagnosis 11 8 19
# with grade 1disabilities 3 0 3
# of children with visible deformities (G2D) 0 0 0
# of all new cases with visible deformities (G2D) 3 0 3
# of foreign born new cases notified in Rwanda for less
than 15 years at the time of diagnosis
0 0 0
Retreatment cases
# of relapses 0 0 0
# of retreatment after default 0 1 1
Total cases 11 9 20

52
Trend of leprosy notification
The figure below shows, the trend of leprosy notification for 20 years. We observed that the number of MB and PB cases have been fluctuating since 2013 with the reduction of MB compared to an increase of PB. Nevertheless, the last two fiscal years, the number of MB is higher than the PB.
Figure 13 : Trends in leprosy notification, by case category, Rwanda, July 2004 to June 2020
2.3. Treating all leprosy cases detected with adequate multidrug therapy (MDT)
Patients diagnosed with leprosy are promptly registered and enrolled on treatment. The adequate multidrug therapy have been used to treat the cases of all leprosy patients diagnosed. Since January 2020, the Rwanda program started to implement the new WHO guidelines issued in October 2018, recommending the administration of 3-drug MDT to PB patients.
2.3.1. Supply chain of leprosy drugs
There is an adequate provision of MDT blister packs through WHO, free of charge. MDT packs are stored and distributed through the national drug management system with support of the TB Division pharmacist. No stock out was notified during the reported fiscal year.
The requisition of these medicines by health facilities to the district pharmacies depends on the number of leprosy cases which happened in endemic or non-endemic areas. The reserve stock of MDT blister packs for all cases area has been ensured in endemic areas based to the frequency and type of case of leprosy notified. The use of use the existing system (e-LMIS) for reporting and requisition of leprosy medicine and monitor quantity consumed is also required.

53
2.3.2. Treatment outcome
We have a success of treatment outcome for PB (92%) recorded in the FY 2018-2019 and MB cases registered in FY 2017-2018 was evaluated at 100%.
Table 28: Leprosy treatment outcome for cohort .July 2017-June 2018 Cases
New cases Relapses Retreatment
after default
MB PB MB PB MB PB
Registered 6 13 1 0 1 0
Completed Treatment 6 12 1 0 1 0
Lost to follow up 0 0 0 0 0 0
Deaths 0 1 0 0 0 0
Non evaluated 0 0 0 0 0 0
Treatment success (%) 100% 92% 100% - 100% -
Number of patients having
developed leprosy reactions during
treatment
0 0 0 0 0 0
Number and proportion of patients
assessed for disabilities at least both
at the beginning and end of
treatment
6 13 1 0 1 0
100% 92% 100% - - -
Number of patients having
developed new disabilities during
treatment
0 0 0 0 0 0
2.4. Reinforcing adherence to treatment
Supervision of the monthly dose is important to monitor regularity of treatment, to identify complications such as neuritis and leprosy reaction at an early stage, to ensure cure and prevent relapse. The new NSP adopted the involvement of CHWs in order to apply the DOT in the community, especially to the patients with poor adherence. We therefore observed a good adherence on treatment with the patients followed in the reported period. The adherence on treatment for MB and PB in all forms was good (100%) with uninterrupted treatment.
2.5. Strengthening prevention of disabilities and ensuring proper care.
Disability assessment is routinely performed at diagnosis for all patients and the corresponding target (100%) was achieved this year. The prevention of disabilities and providing proper care have been ensured in the health facilities located in endemic areas. It comprises the early detection of leprosy, hinders contact investigations, reduces the ability to continuously strengthening capacities of the health providers to quickly detect and treat reactions, and provide education to all patients about the prevention of disability in way of always performing self-assessment and self-care. In relationship with patient outcome, there was no case of leprosy that developed the reaction of leprosy and worsened disability until the end of treatment.

54
2.6. Ensuring capacity building of health professionals to scale up access to intervention and sustain expertise in leprosy
Capacity building and supervision aim at strengthening the quality of leprosy services. The Onsite trainings in favour of the leprosy focal point were carried out during the activity of active case finding. In that opportunity, a total number of forty-two community health workers (CHWs) from Maraba health center were trained on leprosy signs/ symptoms.
The integrated training on the management of TB, PAL and leprosy for health care provider from different district hospitals: Kiziguro (41), Gahini (32), Rutongo (41), Bushenge (26), Murunda (60), Nyagatare (69), Nyanza (69), and Rwinkwavu (32) as reported in the above section about sites where TB capacity building was performed. For leprosy, an emphasis was aiming at early detection and prevention of disabilities due to leprosy. We recommended to all attendees in non-endemic areas to organize a kind of active case finding at least a once a year.
The cumulative number of peer educators in prisons that benefited from refresher trainings on TB and leprosy prevention, symptoms and screening during the fiscal year 2019-2020, was 2,590 out of the 2,600 expected, which represents 99.6%.
During the activity of infection control aimed at sensitizing and providing TB screening in refugee camps, the developed questionnaire addressed to the health care provider was intended to assess their knowledge in leprosy detection, case management and their ability to conduct a leprosy screening. As a result, the means of 13.1% showed that the health facility was able to screen leprosy but that refreshment training is still needed.
A training of TB &ORD Division staff in detection and management of leprosy was planned in order to reinforce their ability in detection and case management of leprosy is their own assigned districts, however this was not performed due to the pandemic of COVID-19.
55
3. STOP DISCRIMINATION AND PROMOTE SOCIO-ECONOMICAL INCLUSION
3.1. Stopping discrimination
Use of different channels of communication like community gathering (umuganda, inteko z’abaturage) and national and local radios could increase awareness of leprosy and stigma reduction among the general population. In addition, this can also replace the persistent image of a mutilating or witchcraft-like disease with that of a curable disease if diagnosed on time.
3.2. Promoting socio-economical inclusion
The associations of leprosy-affected persons have been created in most endemic sites with the aim to promote their integration into society through the activities generating incomes. In contrast, they faced many difficulties to maintain these projects, including poor financial management, lack of technical support, bad weather, and elderly members. Currently, only two associations are still active (Jarama and Nyabitimbo).
We provided social support to the vulnerable people affected by leprosy that include the provision of 478 CBHI (157 Nzangwa, 147 Gikundamvura, 130 Nyabitimbo, 30 Bugarama, 14 Mareba), 6 renovated houses (3 in Gikundamvura, 1 in Mareba, 1 Kimonyi, 1 Gisagara), and 4 prosthesis purchased by Damian Foundation were distributed to the people with amputation.
Indeed, we need the commitment of local leadership to mitigate the impact of leprosy and advocate for patients’ support through a social protection mechanism by adding them among the eligible because all these activities were supported by Damien Foundation which will end its support by December 2020. The main support provided was paying their CBHI, renovating houses for the poor and supporting the former leprosy association for some income generating activities.

56
CHAPTER III: FINANCING THE NSP TB
1. INTRODUCTION
The TB National Strategic Plan (NSP) is a key instrument to guide TB control work in Rwanda in accordance with the most recent World Health Organization (WHO) international guidance.
The major funding sources for the Rwanda TB programs are:
Government Revenues
Development Partner contributions through the General and Sector Budget Support and Donor funds, partially on budget as seen in the development budget, and partially earmarked and project related. These include the Global Fund for HIV & AIDS, TB and Malaria, Damien Foundation and CDC – COAG.
2. FUNDING SOURCES FOR TB EXPENDITURES IN RWANDA FY 2019-2020
The Ministry of Health and the Rwanda Biomedical Center in collaboration with its partners worked on the design and development of the Health Resource Tracking Tool (HRTT), where all health sector actors (Government institutions and development partners) report on a periodic basis. The system is designed to collect expenditures and budgets on a quarterly and annual basis.
To facilitate the collection of financial information for this year’s report, a separate data collection process was adopted using SMART IFMIS (Integrated Financial Management Information System) for Global Fund grant and Government contribution.
3. PUBLIC AND EXTERNAL FUNDING SOURCES FOR TB NSF
The Global Fund for AIDS, TB and Malaria (GFATM) contributed USD 6,274,015; the GoR contributed USD 2,574,643; Damien Foundation contributed USD 66,528 and WHO contributed USD 420,000 to give a total budget of USD 9,335,186 for fiscal year 2019/2020.
The TB/NSP total spending amounted to USD 8,019,316 (86%) as follows: Global Fund spent USD 5,049,603; GoR expenditures were USD 2,498,341; Damien Foundation USD 51,372 and WHO expenditures were USD 420,000.
Table 29: Contribution of Different Funding Sources for the year ended 30 June 2020
Donor Budget in
USD Expenditures
in USD
Budget execution rate
in%
Damian Foundation 66 528 51 372 77%
Global Fund 6 274 015 5 049 603 80%
GoR (Recurrent budget)
2 574 643 2 498 341 97%
WHO 420 000 420 000 100%
Grand Total 9 335 186 8 019 316 86%

57
Table 30: Damien Foundation expenditures per budget category for the year ended 30 June 2020
Activities Budget in USD
Expenditures in USD
Variances in USD
Performance
in %
Conduct Leprosy active case finding in endemic area by central level
5 817 2 202 3 615 38%
conduct leprosy active case finding and contact examination by health center (Transfer to Health center)
3 668 500 3 168 14%
Ensure socio support for leprosy patients 23 914 23 914 1 100%
Maintain and repair RBC vehicles
5 052 5 042 10 100%
Pay salaries and PBF for RBC contractual staff on Fondation Damien
14 692 14 691 1 100%
Provide logistic support to RBC Staff
5 025 4 945 79 98%
Train Health care workers on leprosy management 1 070 0 1 070 0%
Training on leprosy management for TB&ORD staff 7 009 0 7 009 0%
Bank charges 280 78 202 28%
Total 66 528 51 372 15 155 77%
As the table shows for FY 2019-2020, the Damien Foundation is contributing to TB expenditures the total budget of USD 66,528 with TB Expenditures by budget activities of USD 51,372 representing 77 % of total budget planned for Fiscal year 2019-2020. Unused budget is related to the training and workshops on leprosy management not implemented due to the COVID-19 pandemic.
4. GOVERNMENT CONTRIBUTION TO TB NATIONAL STRATEGIC PLAN
Methodology used to estimate the GOR allocations to various health programs
The GoR funds are allocated to different health programs during the annual planning and budgeting process, which entails the prioritization process by the Ministry, RBC and decentralized levels based on the HSSP III and different disease program strategic plans serving as guiding documents.
Apart from program specific financing, the estimation of GoR contribution takes into consideration all other health related programs costs, categorized as health system strengthening costs in the MTEF Chapter of (i) Compensation of employees; (ii) Use of Goods & Services; (iii) Acquisition of fixed assets; (iv) Subsidies; (v) Grants; (vi) Social assistance and (vii) Other expenditures.

58
Table 31: GoR TB NSP budget and expenditure per MTEF chapter for the year ended 30 June 2020
MTEF Chapter Budget in USD
Expenditures in USD
Variance in USD
Performance in %
21 Compensation of employees
1,166,835 1,125,387 41,449 96%
22 Use of goods and services
246,296 220,337 25,960 89%
23 Acquisition of fixed assets
389,371 330,490 58,881 85%
25 Subsides 15,306 22,212 (6,906) 145%
26 Grants 193,409 205,352 (11,943) 106%
27 Social assistance
280,228 279,036 1,192 100%
28 Other expenditures
283,197 315,527 (32,330) 111%
Total 2,574,643 2,498,341 76,302 97%
As the table shows for FY 2019-2020, the GoR is contributing to TB expenditures the total amount of USD 2,574,643 with TB Expenditures by MTEF budget category of USD 2,498,341 representing 97 % of total budget planned for Fiscal year 2019-2020.
5. THE GLOBAL FUND CONTRIBUTION
For the Global Fund contribution, the budget for the year 2019–2020 was USD 6,274,015. Out of this budget, a total of USD 5,049,603 has been effectively spent by the sub-recipients representing 80% of total budget for TB NSF GF grant.
Table 32: GF TB NSP budget and expenditure per NSP cost category for the period of July 2019 to June 2020
GF Budget categories
Opening balance in USD
Initial Budget for FY 2019-2020 in USD
Revised budget for FY 2019-2020 in USD
Expenditures for FY 2019-2020 in USD
Variance in USD
Budget execution rate in %
1.0 Human Resources (HR)
895,701 825,155 781,874 43,281 95%

59
10.0 Communication Material and Publications (CMP)
31,466 41,434 41,434 (0) 100%
11.0 Program Administration costs (PA)
1,715,880 1,715,880 1,467,263 248,616 86%
12.0 Living support to client/ target population (LSCTP)
215,326 215,326 133,740 81,587 62%
2.0 Travel related costs (TRC)
491,534 491,534 477,947 13,587 97%
4.0 Health Products - Pharmaceutical Products (HPPP)
375,021 375,021 369,238 5,783 98%
5.0 Health Products - Non-Pharmaceuticals (HPNP)
2,393,927 2,393,927 1,579,300 814,627 66%
7.0 Procurement and Supply-Chain Management costs (PSM)
126,326 126,326 109,394 16,932 87%
8.0 Infrastructure (INF)
18,764 10,070 89,412 89,412 (0) 100%
Total 18764 6,255,251 6,274,015 5,049,603 1,224,4
11 80%
The table above shows the TB NSP budget execution per NSP cost category for the period of July 2019 to June 2020 representing a total rate of 80%. The unused budget of USD 1 224 411 for mainly activities like : purchase of digital CXR machines for news DHs and DH with old X-ray , carry out survey on catastrophic costs due to TB is subject of carry-over for next Fiscal year 2020-2021.
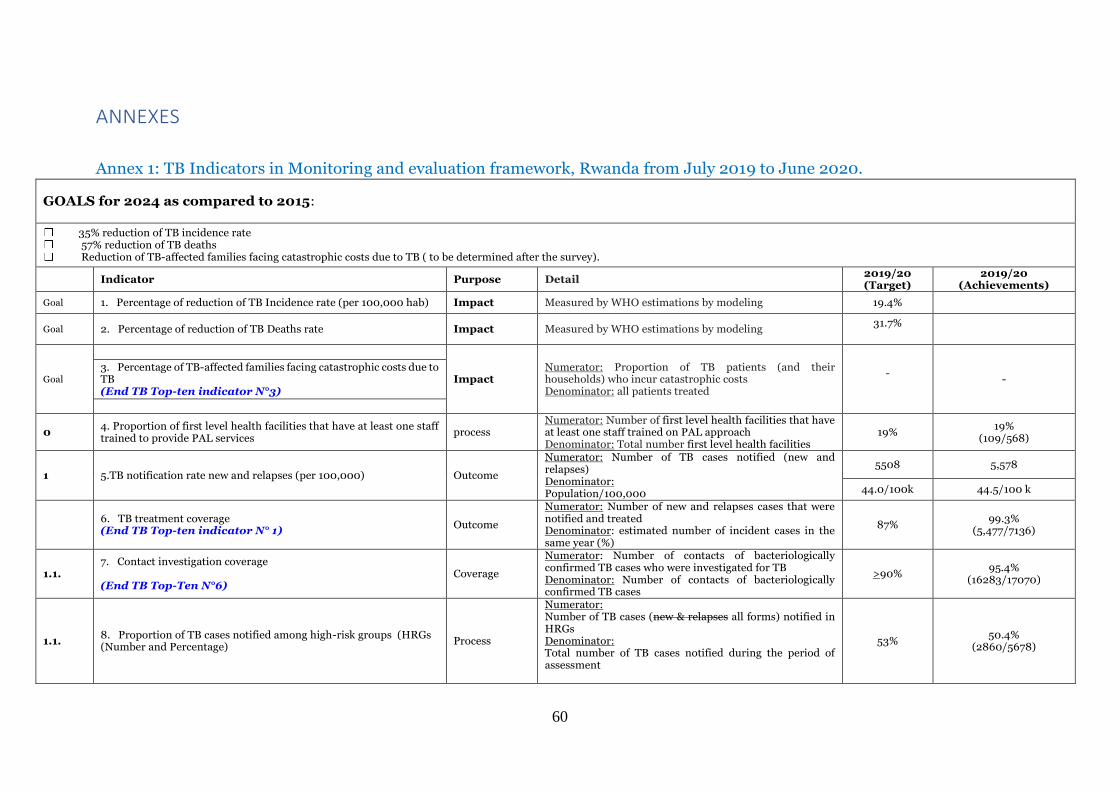
60
ANNEXES
Annex 1: TB Indicators in Monitoring and evaluation framework, Rwanda from July 2019 to June 2020.
GOALS for 2024 as compared to 2015:
35% reduction of TB incidence rate 57% reduction of TB deaths Reduction of TB-affected families facing catastrophic costs due to TB ( to be determined after the survey).
Indicator Purpose Detail 2019/20 (Target)
2019/20 (Achievements)
Goal 1. Percentage of reduction of TB Incidence rate (per 100,000 hab) Impact Measured by WHO estimations by modeling 19.4%
Goal 2. Percentage of reduction of TB Deaths rate Impact Measured by WHO estimations by modeling 31.7%
Goal
3. Percentage of TB-affected families facing catastrophic costs due to TB (End TB Top-ten indicator N°3)
Impact Numerator: Proportion of TB patients (and their households) who incur catastrophic costs Denominator: all patients treated
-
-
0 4. Proportion of first level health facilities that have at least one staff trained to provide PAL services
process Numerator: Number of first level health facilities that have at least one staff trained on PAL approach Denominator: Total number first level health facilities
19% 19%
(109/568)
1 5.TB notification rate new and relapses (per 100,000) Outcome
Numerator: Number of TB cases notified (new and relapses) Denominator: Population/100,000
5508 5,578
44.0/100k 44.5/100 k
6. TB treatment coverage (End TB Top-ten indicator N° 1)
Outcome
Numerator: Number of new and relapses cases that were notified and treated Denominator: estimated number of incident cases in the same year (%)
87% 99.3%
(5,477/7136)
1.1. 7. Contact investigation coverage (End TB Top-Ten N°6)
Coverage
Numerator: Number of contacts of bacteriologically confirmed TB cases who were investigated for TB Denominator: Number of contacts of bacteriologically confirmed TB cases
>90% 95.4%
(16283/17070)
1.1. 8. Proportion of TB cases notified among high-risk groups (HRGs (Number and Percentage)
Process
Numerator: Number of TB cases (new & relapses all forms) notified in HRGs Denominator: Total number of TB cases notified during the period of assessment
53% 50.4%
(2860/5678)

61
GOALS for 2024 as compared to 2015:
35% reduction of TB incidence rate 57% reduction of TB deaths Reduction of TB-affected families facing catastrophic costs due to TB ( to be determined after the survey).
1.2. 9. Proportion of children 0-14 years notified among TB cases new and relapse
Output
Denominator: Total number of TB cases notified during the period of assessment Number of TB cases aged 0-14 (new & relapses) Denominator: Total number of TB cases notified (new and relapses)
8% 5.7%
(315/5577)
1.3.
10. Proportion of newly notified patients diagnosed using WHO recommended rapid tests (End TB Top-Ten N°4)
Output
Numerator: Number of all newly notified TB patient diagnosed with WHO recommended rapid tests Denominator: All number of newly notified TB patients
S1:60%
61.8% (3,197/5174)
11. DST Coverage for TB patients (End TB Top-Ten indicator N° 7)
Coverage
Numerator: Number of TB patients with a drug susceptibility result for at least Rifampicin (Xpert MTB/RIF or phenotypic DST) Denominator: Number of all notified cases in the same year. Disaggregation for New TPB+ and previously treated cases
70% 78.1%
(4,432/5,678)
1.3.
12. Proportion of notified patients with rifampicin resistant (RR) or MDR who receive second line DST
Numerator: Number of TB notified patients with rifampicin resistant (RR) or MDR who receive second line DST (LPA or phenotypic DST) Denominator: Number of all notified patients with rifampicin resistant (RR) or MDR in the same year.
85% 46.3%
(37/80)
1.4.
13.a. Proportion of health facilities diagnostic sites scoring pass in EQA for smear microscopy
Numerator: Laboratories sites scoring pass in EQA for smear microscopy (once per year) Denominator: Total number of laboratories with smear microscopy (number and percentage)
95% 94.9%
13. b Proportion of health facilities Xpert sites scoring pass in EQA for Xpert MTB/RIF
Numerator: Laboratories sites scoring pass in EQA for Xpert MTB/RIF (once per year) Denominator: Total number of laboratories with Xpert MTB/RIF (number and percentage)
85% 83.7%

62
GOALS for 2024 as compared to 2015:
35% reduction of TB incidence rate 57% reduction of TB deaths Reduction of TB-affected families facing catastrophic costs due to TB ( to be determined after the survey).
2 14. Treatment success rate (TSR) for all forms of TB cases (DS & DR-TB cases)
(End TB Top-ten 2) Outcome
Numerator: TB cases (DS- and DR-TB cases) successfully treated (cured plus completed treatment) Denominator: total number of TB cases (DS- and DR-TB cases) registered during the year
S1˃ 86%
86.4% (5,142/5,950)
2.1. 15. Percentage of CDT with no stock out of FL tracers (RHZE and RH ad) drugs of experienced in the last 12 months
coverage
Numerator: Percentage of CDT with no stock out of First-Line TB tracer drugs (R150H75ZE&R150H75) Denominator Total number of CDT
97% 86.6%
(174/201)
2.1. 16. Percentage of MDR TB centers with no stock out of SLD in the last 12 months
coverage
Numerator: Number of MDR TB centers with no stock out of SLD in the last 12 months Denominator Total number of MDR TB centers
100% 100% (2/2)
17. Proportion of eligible PLHIV initiated on TPT coverage
Numerator: Number of eligible PLHIV initiated on TPT Denominator Total number of eligible PLHIV
20% 0.4%
(895/201,629)
2.3 18. Treatment success rate, confirmed RR/MDR-TB Outcome
Numerator: Rifampicin resistant (RR)/MDR-TB cases successfully treated (cured plus completed treatment) Denominator: RR/MDR-TB cases enrolled on second-line anti-TB treatment (shorter regimen: patients enrolled in the previous 12 to 24 months; conventional regimen; patients enrolled in the previous 24 to 36 months)
85% 86.7%
(91/105)
2.3 19. Treatment coverage new drugs (End TB Top-ten indicator N°8)
Coverage
Numerator: Number of TB patients treated with regimens that include new TB drugs Denominator: Number of notified TB patients eligible for treatment with new drugs
80% 100%
(13/13)

63
GOALS for 2024 as compared to 2015:
35% reduction of TB incidence rate 57% reduction of TB deaths Reduction of TB-affected families facing catastrophic costs due to TB ( to be determined after the survey).
2.5. 20. Proportion of TB treatment cards where ADSM section is completed
Output
Numerator: Number of TB patients whose TB treatment card section on AE was completed adequately (every month for MDR-TB and for DS-TB); to reported at the end of TB treatment. Denominator: Total number of registered TB cases during the period of assessment; to reported at the end of TB treatment.
30% N/A
2.5. 21. Proportion of diagnosed TB cases tested for HIV infection (End TB Top-ten indicator N°9)
Output
Numerator: Number of TB patients who had an HIV test result recorded in the TB register Denominator: Total number of registered TB cases during the period of assessment.
>95% 99.9%
(5,676/5,678)
2.5. 22. Proportion of HIV positive TB cases given antiretroviral therapy during TB treatment
Output
Numerator: number of HIV-positive TB cases given antiretroviral therapy during TB treatment Denominator: number of HIV-positive TB cases registered during the evaluated period
93% 97.4%
(1,186/1,218)
2.6. 23. Treatment success rate for TB patients (all forms) receiving DOT through community health workers (CHW)
Outcome
Numerator: TB patients receiving DOT by CHW who were successfully treated Denominator: all TB patients receiving DOT by CHW during the evaluated period
95% 94.9%
(2,266/2,388)
3.1. 24. Percentage of Health providers screened for TB at least once during the year. (health facility workers)
Coverage Numerator: number of Health providers screened for TB at least once during the year. Denominator: number of health providers
78% 80%
(20,733/26,014)
3.2 25.a LTBI treatment coverage among contacts < 5 years (End TB Top-ten indicator N°5)
Coverage
Numerator: number of children who are contacts of TB cases started on LTBI treatment Denominator: number of children eligible for LTBI treatment
90% 96.9%
(1,343/1,386)
25.b LTBI treatment coverage among contacts > 5 years Coverage
Numerator: number of people of > 5 years who are contacts of TB cases started on LTBI treatment Denominator: number of people of > 5 years eligible for LTBI treatment
NA NA
25.c Contact investigation coverage Coverage
Numerator: number of contact people with bacteriologically confirmed TB cases who are screened for TB Denominator: total number of contact eligible for TB screening
80% 95.3%
(16,283/17,070)
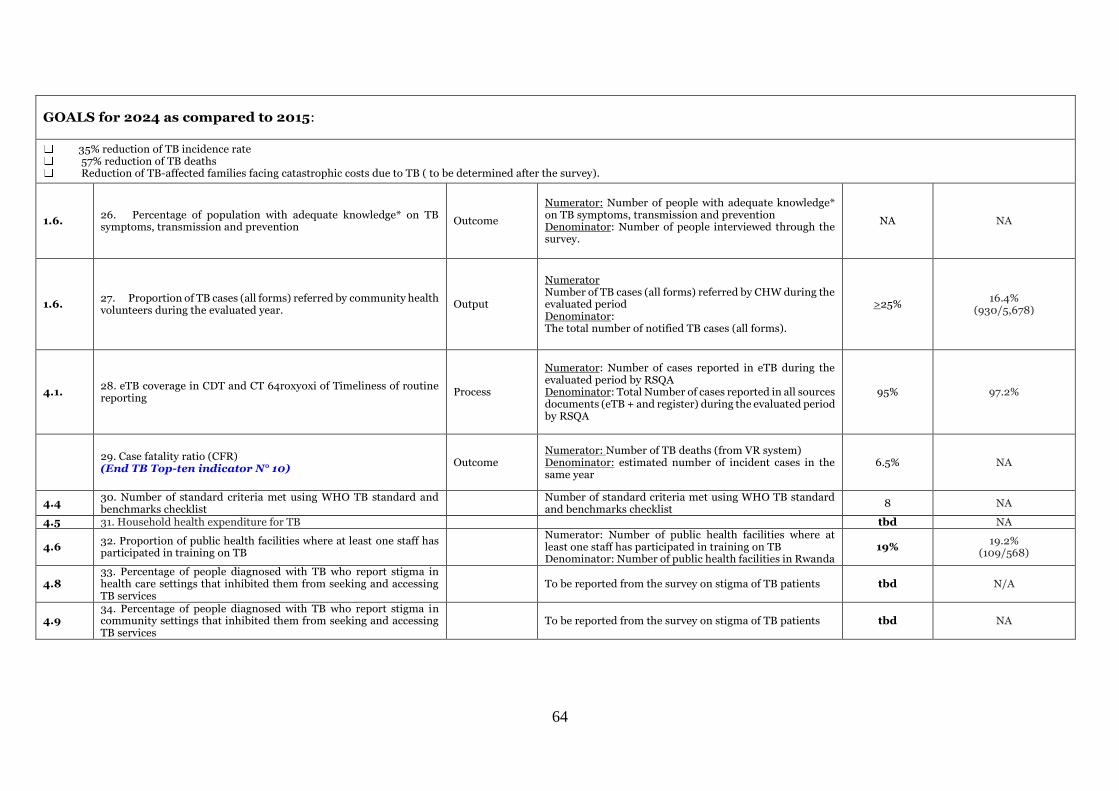
64
GOALS for 2024 as compared to 2015:
35% reduction of TB incidence rate 57% reduction of TB deaths Reduction of TB-affected families facing catastrophic costs due to TB ( to be determined after the survey).
1.6. 26. Percentage of population with adequate knowledge* on TB symptoms, transmission and prevention
Outcome
Numerator: Number of people with adequate knowledge* on TB symptoms, transmission and prevention Denominator: Number of people interviewed through the survey.
NA NA
1.6. 27. Proportion of TB cases (all forms) referred by community health volunteers during the evaluated year.
Output
Numerator Number of TB cases (all forms) referred by CHW during the evaluated period Denominator: The total number of notified TB cases (all forms).
>25% 16.4%
(930/5,678)
4.1. 28. eTB coverage in CDT and CT 64roxyoxi of Timeliness of routine reporting
Process
Numerator: Number of cases reported in eTB during the evaluated period by RSQA Denominator: Total Number of cases reported in all sources documents (eTB + and register) during the evaluated period by RSQA
95% 97.2%
29. Case fatality ratio (CFR) (End TB Top-ten indicator N° 10)
Outcome Numerator: Number of TB deaths (from VR system) Denominator: estimated number of incident cases in the same year
6.5% NA
4.4 30. Number of standard criteria met using WHO TB standard and benchmarks checklist
Number of standard criteria met using WHO TB standard and benchmarks checklist
8 NA
4.5 31. Household health expenditure for TB tbd NA
4.6 32. Proportion of public health facilities where at least one staff has participated in training on TB
Numerator: Number of public health facilities where at least one staff has participated in training on TB Denominator: Number of public health facilities in Rwanda
19% 19.2%
(109/568)
4.8 33. Percentage of people diagnosed with TB who report stigma in health care settings that inhibited them from seeking and accessing TB services
To be reported from the survey on stigma of TB patients tbd N/A
4.9 34. Percentage of people diagnosed with TB who report stigma in community settings that inhibited them from seeking and accessing TB services
To be reported from the survey on stigma of TB patients tbd NA

65
Annex 2: RBF achievment, from July 2019 to June 2020.
D. Modules and outcome/coverage indicators
Module 1 TB care and prevention
Coverage/Output
indicator
NSF Target
(Jul 2019- June 2020)
Program Results
(Jul 2019- June 2020)
Level
of
achie
veme
nt
N# % Source
N# % Source
D# D#
TCP-Other 1: Case
notification rate of all forms of
TB per 100,000 population -
bacteriologically confirmed
plus clinically diagnosed, new
and relapse cases
42.9
Grant
agreement
5,578
44.6 Grant
agreement 96.3%
12,518,758
TCP-2(M): Treatment success
rate all forms: Percentage of
TB cases, all forms,
bacteriologically confirmed
plus clinically diagnosed,
successfully treated (cured
plus treatment completed)
>87%
5,051
86.4% Grant
agreement 99.3%
5,845
TCP-Other 3: Percentage of
TB cases notified among high
risk groups
> 40% Grant
agreement
2,860
50.4% Grant
agreement 126%
5,678
TCP-Other 2: LTBI treatment
coverage among contacts
under 5
87%
1,343
96.9%
Grant
agreement
111.4
% 1,386
Module 2 MDR-TB
MDR TB-6: Percentage of TB
patients with DST result for at
least Rifampicin among the
total number of notified (new
and retreatment) cases in the
same year
83%
N/A
4,019
93.3%
Grant
agreement
112.4
% 4,309
MDR TB-other 1: Treatment
success rate of RR TB and/or
MDR-TB: Percentage of cases
with RR TB and/or MDR-TB
successfully treated.
≥ 87% Grant
agreement
91
86.7% Grant
agreement 99.7%
105
Module 3
TB/HIV-6 (M): Percentage of
HIV-positive new and relapse
TB patients on ART during TB
treatment
>90% Grant
agreement
1,186
97.4%
Grant
agreement
108.2
% 1,218
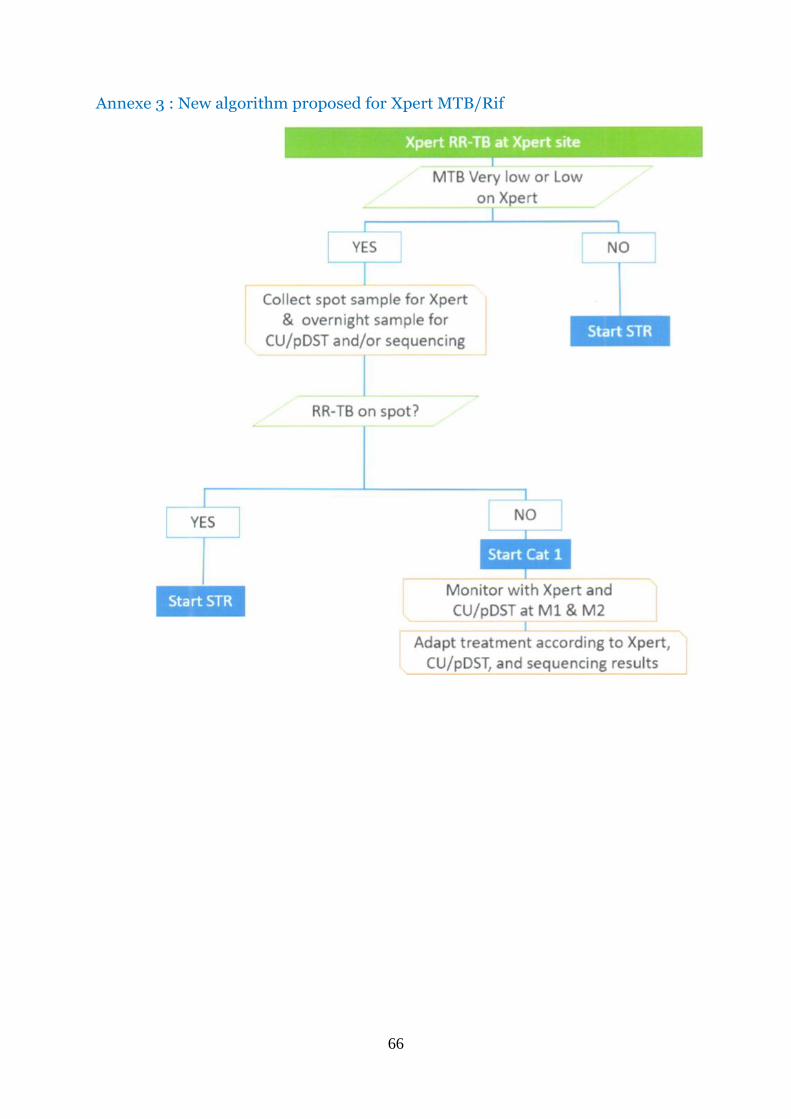
66
Annexe 3 : New algorithm proposed for Xpert MTB/Rif

67
Annexe 4: Distribution plan for CSB at district hospitals for the fiscal year 2019-
2020.
NameQuantity
in KGName
Quantity
in KG Bushenge 270 Masaka 2,250 Butaro 225 Mibilizi 405 Byumba 495 Mugonero 180 Gahini 405 Muhima 3,510 Gakoma 450 Muhororo 225 Gihundwe 495 Munini 225 Gisenyi 1,215 Murunda 270 Gitwe 405 Nemba 180 Kabaya 180 Ngarama 225 Kabgayi 720 Nyagatare 630 Kabutare 1,845 Nyamata 945 Kaduha 90 Nyanza 540 Kibagabaga 2,610 Remera Rukoma 540 Kibilizi 495 Ruhango 405 Kibogora 315 Ruhengeri 900 Kibungo 900 Ruli 90 Kibuye 495 Rutongo 360 Kigeme 315 Rwamagana 945 Kinihira 180 Rwinkwavu 405 Kirehe 675 Shyira 360 Kirinda 225 Total 27,090 Kiziguro 495

68
Annex 5: Participants who developed TB&ORD annual report July 2019-June
2020 FY
N0 Names Function Institution
1 BESIGYE Moses Financial Specialist
RBC/SPIU
2 BYIRINGIRO Aimable TB Supervisor Bushenge DH
3 Dr HABIMANA MUCYO Yves
MDR TB RBC/TB & ORD Division
4 Dr MIGAMBI Patrick DM RBC/TB & ORD Division
5 Dr MUNYANEZA Ildephonse
C&T RBC/TB & ORD Division
6 Dr MUTEMBAYIRE Grace C&T RBC/TB & ORD Division
7 Dr NSHIMIYIMANA Felix Clinical Director Polyclinique La Medicale
8 Dr RUSISIRO Byiringiro IC RBC/TB & ORD Division
9 DUSHME Augustin Statistician RBC/TB & ORD Division
10 GAKUBA Fidele TB M&E coordination specialist
RBC/SPIU
11 GASANA Evariste TB Epidemiol RBC/TB & ORD Division
12 HABIMANA Theoneste TB budget controller specialist
RBC/SPIU
13 KABANYANA Grace Planner&M&E Muhima DH
14 MUCYO Alice Accountant RBC/Corporate service
15 MUKAMURIGO Judith Lecturer UR-SPH
16 MUKESHIMANA Genevieve Supervisor Rutongo DH
17 MURAGIJIMANA Annonciatte
MPDD MPDD
18 NDABANA Didier TB supervisor Nyamata DH
19 NSABIMANA MUREGO Felix
TB Reseacrh RBC/TB & ORD Division
20 NSHIMIYIMANA Kizito ORD RBC/TB & ORD Division
21 SEZIRAHIGA Jean Pierre C&T RBC/TB & ORD Division
22 UMUHOZA Stella Matutina Assistant Lecturer UR-SPH
23 UWEMEYINKIKO Emmanuel
Budget manager -Corporate
RBC (Ordinary Budget)
24 UWIZEYE Petronille C&T RBC/TB & ORD Division

2
www.moh.gov.rw I www.rbc.gov.rw