Clinical Research: Sample Measure (Intervene) Analyze Infer.

1
NASPGHAN CLINICAL PRACTICE SURVEY
How to We Measure Up?
NASPGHAN Clinical Practice CommitteeWith Statistician, Jack Wiedrick, M.S.
October 10, 2015
Objectives
• Participants will be able to perform the following:
– Describe demographics of respondents to the 2014‐2015 NASPGHAN Clinical Practice Survey
– Access NASPGHAN web‐link to view survey data
– Describe limitations for analysis of Work RVUs, base salary & bonus data due to categorical answers
– Suggest one method to improve future surveys
Disclosure: Conflict of Interest
There are no relevant financial relationships with a manufacturer(s) of any commercial product(s) and/or provider(s) of commercial
services discussed in this presentation.

2
Why Study U.S. Practices of NASPGHAN?‐U.S. Medicine is Changing Rapidly
Methodology
• NASPGHAN leadership draft approval, 2014
• OHSU IRB approval obtained
• Surveymonkey used for data collection
• Three response announcements/reminders fall of 2014 and winter of 2015 before closing.
• Paper & online responses accepted
• 487 anonymous respondents out of 1697 (29 %) US NASPGHAN members at closing date, 2015.
Survey Response Analysis
• Surveymonkey basic analysis
• Statistical analysis by OHSU statisticians
– Thuan Nguyen, Eric Chen, & Jack Wiedrick
• Limitations
– Categorical answers limit statistical analysis
– Cannot derive mean, SEM/SD or accurate ranges
• Taking mean of the midpoint of the answer range is a guesstimate, and is not accurate.

3
Who Comprise the U.S. Part of NASPGHAN?
Gender Reported by 480 Respondents
38% Female
62% Male
Age Distribution 486 Answered, 1 Skipped

4
Respondents‐ Board Certified/Eligible in Pediatric Gastroenterology Answered: 485
Ethnic Composition of
485 Respondents
7%
19%
2%
67%
1%
3%
1%
0.0% 20.0% 40.0% 60.0% 80.0% 100.0%
American Indian, Alaska Native
Hispanic, Latino
Asian (SE Asia, Indian subcontinent, Philippino)
Native Hawaiian, Pacific Islander
Black or African American
White or Causasian
More than one race
Prefer not to answer
Other
Number of Pediatric Gastroenterologists in GroupAnswered: 478 Skipped: 9

5
Clinical Practice Survey, Practice Setting
53.31%
7.44%
2.48%
15%
4.34%
6.40%
8.26%
2.49%
0% 10% 20% 30% 40% 50% 60%
Academic, Primarily Clinical
Academic, Primarly Research
Academic ‐ Primarily Administrative
Hospital‐Based Practice
Private Practice, Solo
Private Practice, Group Single Specialty
Private Practice, Multi‐Specialty Group
Other
19%
63%
N=484
Academic Practice TracksAnswered: 325 Skipped: 162
10%
15%
10%
47%
14%
5%
0% 5% 10% 15% 20% 25% 30% 35% 40% 45% 50%
Tenure Track, Research
Tenure Track, Clinical Educator
Tenure Track, Clinical Investigator
Non‐Tenure Track: Clinical Educator
Non‐Tenure Track: Clinical Investigator
None
61%
Regional Representation Compared to 2010 CensusAnswered: 487 Skipped: 0
9
25
33
14
6
13
5
20
33
18
7
17
0
5
10
15
20
25
30
35
Northeast Atlantic Midwest Southeast Rocky Mtn West
Percent of Total Survey Sample
Percent of US Population, 2010 US Census

6
Productivity Measurements
• Total vs. Work RVUs
• Clinical fte (cfte)
• National benchmarks
– AAAP, MGMA, AMGA, FPSC
– % cfte confounds comparison of Work RVUs
– Extrapolation to 1.0 cfteskews & inflates benchmarks
WRVUs Reported by Full‐Time Respondents
Academic Rank, Practice Setting vs. wRVUs

7
wRVUs by Academic Rank or Practice Setting
WRVUs vs. Practice Setting & cfte, full‐time physicians
What accounts for the difference in wRVUs in Practice Setting?
• Number of patient seen/week?
• Increased proportion of new patients?
• Increased procedures proportion?
• More support?
• Fellows in the practice?

8
Proportion of New Patients by Practice Type
Proportion of Weekly Procedures vs. Practice Setting
Do Academic Programs with Fellows Have HigherWork RVUs?
• 275 full‐time academic physicians responded
– 72% of those reported having a fellow
• No evidence that having a fellow significantly influenced wRVU totals.
9
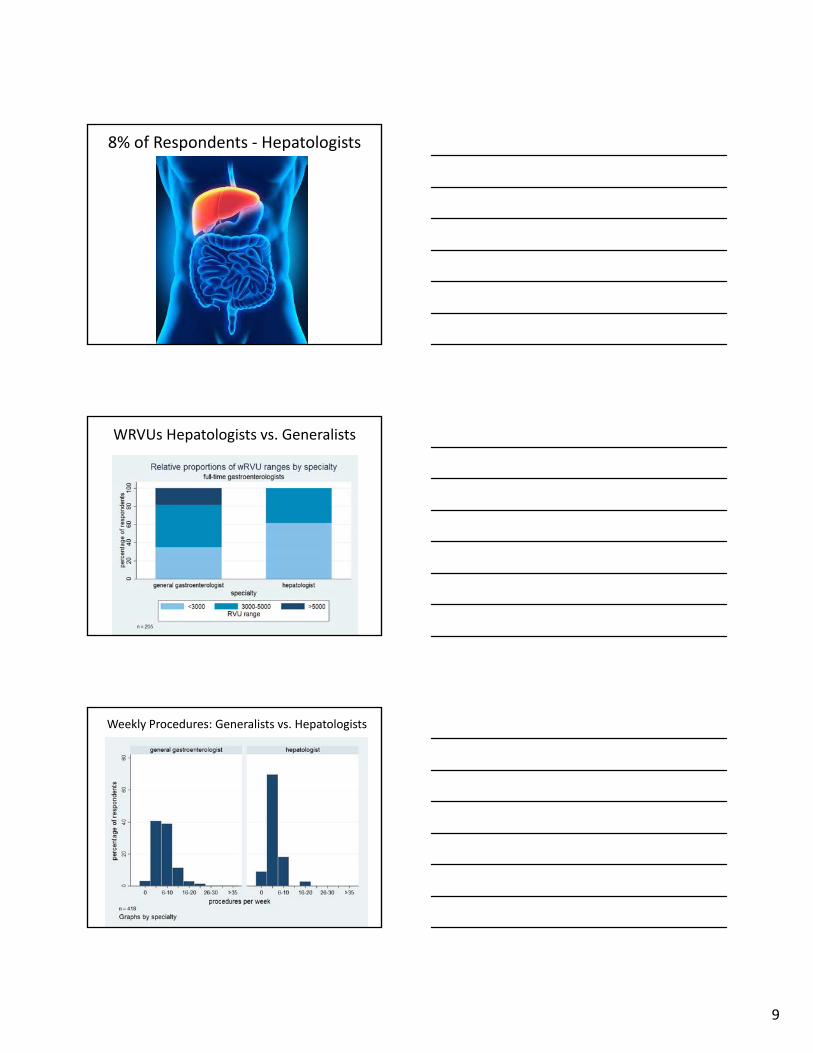
8% of Respondents ‐ Hepatologists
WRVUs Hepatologists vs. Generalists
Weekly Procedures: Generalists vs. Hepatologists

10
Base Salary for Generalists vs. Hepatologists
Base Salary, Bonuses & Penalties
Salary Ranges for Full Time Gastroenterologists

11
Base Compensation Reported vs. cfte
% respondents reporting salary ran
ge
Base Salary By Practice Setting
Base Salary by Region

12
Productivity‐based incentives last year?
38%
13%
4%
9%
5%
8%
5%
4%
4%
2%
2%
2%
0% 10% 20% 30% 40%
Not available in practice
Available, but I did not receive one
$100 ‐ 1,000
$1,001 ‐ 5000
$5,001 ‐ 10,000
$10,001 ‐ 20,000
$20,001 ‐ 30,000
$30,001 ‐ 40,000
$40,001 ‐ 50,000
$50,001 ‐ 75,000
$75,001 ‐ 100,000
$100,001 ‐ 150,000
% of 441 respondents
Base Salary at Risk if Targets Not MetAnswered: 444 Skipped: 43
25%
Possible Game Changers
13
Indirect Patient Care Time
• Indirect patient care = time spent reviewing records, test results, coordinating care & communication with patents/families, not face‐to‐face.
• Ratio of direct: indirect patient care
equivalents reported is 5:2• Ratio is independent of cfte.
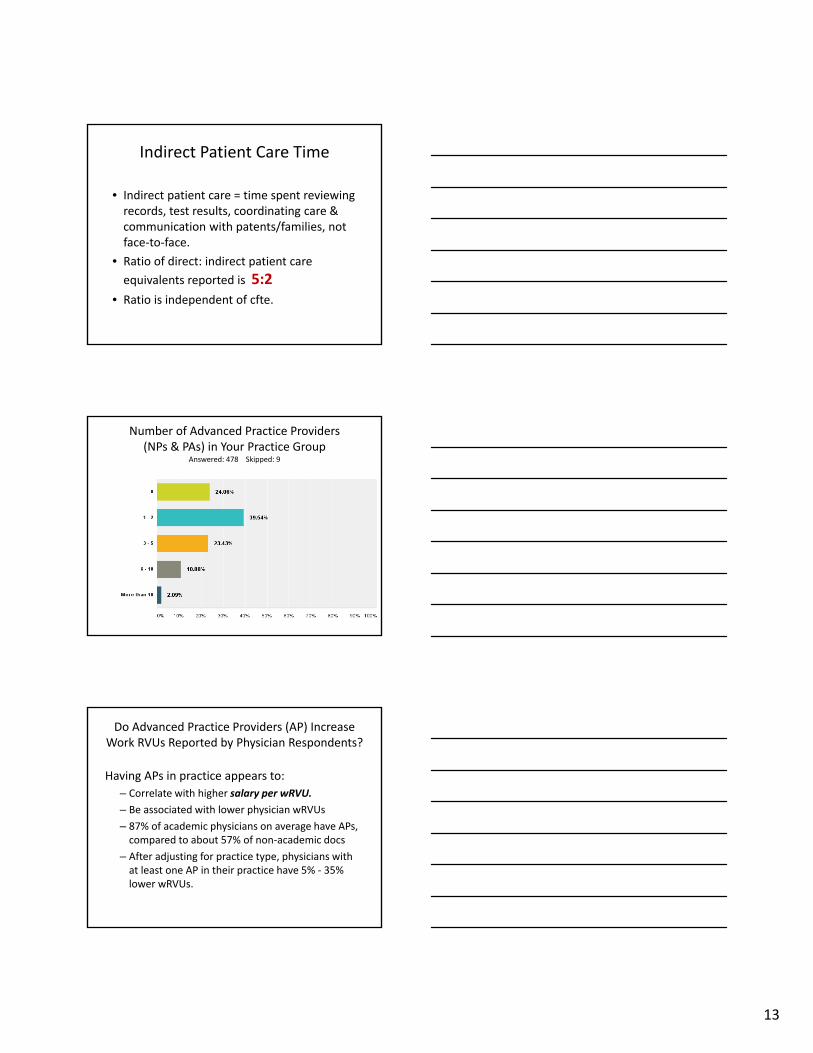
Number of Advanced Practice Providers (NPs & PAs) in Your Practice Group
Answered: 478 Skipped: 9
Do Advanced Practice Providers (AP) Increase Work RVUs Reported by Physician Respondents?
Having APs in practice appears to:
– Correlate with higher salary per wRVU.
– Be associated with lower physician wRVUs
– 87% of academic physicians on average have APs, compared to about 57% of non‐academic docs
– After adjusting for practice type, physicians with at least one AP in their practice have 5% ‐ 35% lower wRVUs.

14
Percentage of patients with limited English proficiency requiring translator
Answered: 470 Skipped: 17
Percentage of patients with Medicaid or SCHIPAnswered: 462 Skipped: 25
Rate of No‐Show/Same Day CancellationAnswered: 469 Skipped: 18

15
Number of sites served, >10 miles away from primary practice location
Answered: 356 Skipped: 131
Support
• pix
Services assigned/immediately available to clinic Answered: 473

16
Ratio of RN: Provider by Practice Setting
MA: Provider Ratio by Practice Setting
Is there an optimal RN:MD ratio for productivity?

17
Optimal RN:MD Ratio for Efficiency
Conclusions
• 2014 NASPGHAN Clinical Practice Survey included 487 physician responses, 29% of U.S. NASPGHAN membership.
• East coast was slightly over‐represented
• West coast was slightly under‐represented
• No regional difference in base compensation detected.
Conclusions, Practice Setting
Private practice & hospital‐based practitioners:
– Saw more patients weekly
– Performed more weekly procedures
– Reported higher wRVUs
– Had higher ratio of nursing to provider support
– Earned higher base salary
– More likely to receive a productivity bonus
Academic practitioners:
– Saw fewer patients & higher % new patients
– Earned lower wRVUs
– Earned lower base salary
– Were 8 times less likely to earn a bonus
– Had lower ratio of nursing‐to‐provider support

18
Conclusions, Continued
Fellows did not impact wRVUs of supervising/ attending physicians
Hepatologists compared to generalists
– Saw fewer new patients
– Performed fewer procedures
– Earned lower wRVUs than generalists
Categorical data limited statistical analysis
Future Studies & Directions
NASPGHAN needs regular clinical practice surveys
• Discrete, numerical responses will allow deeper analysis of wRVUs, optimal nursing & ancillary service support ratios, salary, bonuses
• Alternate survey tools may enhance analysis
• Statistician should assist in design & analysis
Thanks to NASPGHAN leadership for supporting the survey effort
Survey Results & Analysis‐ NASPGHAN Website Link

19
NASPGHAN Clinical Practice Committee
Adam NoelMatthew RileyLinda MuirSudipta MisraJohathan TeitelbaumAnn SheinmannSarah VermilyeaMichael BatesMunir MobassalehRobert DillardRitu VermaRobin Shannon
Michael HartMounif El‐YousesefAmy DefeliceRathna AmarnathDana HongAnca SaftaNarendra VadlumudiRobin ShannonHumaira HashmiRanjana GokhaleMariastella SerranoSari AcraNorberto Rodriguez‐Baez
Thank You ‐ OHSU Statisticians
Thuan Nguyen, MD, PhD Erin Chen, MS Jack Wiedrick, MS