Nansen Environmental Research Centre (India) · Mr. George Mathew, and NORINCO Pvt Ltd, India Mrs....
8
Nansen Environmental Research Centre (India) $ QRQSUR¿W UHVHDUFK FHQWUH IRU (QYLURQPHQW &OLPDWH DQG (QHUJ\ UHVHDUFK LQ WKH 1DQVHQ *URXS RI 1RUZD\ Annual Report 2005-2006
Transcript of Nansen Environmental Research Centre (India) · Mr. George Mathew, and NORINCO Pvt Ltd, India Mrs....

Nansen Environmental Research Centre (India)
Annual Report 2005-2006

Board of Directors
Prof. Ola M.Johannessen, Founding Director, Nansen Environmental and Remote Sensing Centre, also chair in Remote Sensing/Oceanography at Geophysical Institute, University of Bergen, NorwayMr. Lasse H. Pettersson, Leading Scientist NERSC and Director of International relations. Mr. George Mathew, NORINCO Pvt Ltd, IndiaMrs. Bente E. Johannessen,Director of Administration, NERSC, NorwayMrs. Mary Thomas, Marangoly, India
Chairman of Board
Prof. Ola M. JohannessenFounding Director, Nansen Environmental and Remote Sensing CentreDirector, Mohan-Sverdrup Centre for Global Ocean Studies and Operational Oceanography, Norway
Executive Director
Mr. Thomas Mathew, Advisor, NORINCO Pvt Ltd, India
Prof. N.R. Menon, UGC Emeritus Professor, Marine Biology. CUSAT, INDIAProf. P.V. Joseph, UGC Emeritus Professor, Meteorology,CUSAT, INDIA.Dr. Geir Evensen, Principal engineer, Norsk Hydro ASA, Bergen / Research Director II, Mohn-Sverdrup Center for Global Ocean studies and Operational Oceanography, Bergen, NorwayProf. J. D. Shukla, President, Institute of Global Environment and Society, Distinguished Professor, Climate Dynamics, George Mason University, USA.Prof. Ola M. Johannessen, Founding Director of NERSC and Chairman of NERCI Director Board.Mr. Lasse H. Pettersson, Leading Scientist NERSC and Director of International relationsDr. K. Ajith Joseph, Senior Scientist and Member Secretary.Mr. Thomas Mathew, Executive Director.
Prof. N.R. Menon, UGC Emeritus Professor, Marine Biology, CUSAT, INDIA
Activity report
VisionMake a significant contribution to environmental and earth sciences research and application in India through local capacity building as well as increased regional and international cooperation.
Main research focus areas are:Numerical Ocean ModellingSatellite Remote Sensing and GIS ApplicationsCoastal Zone ManagementAppropriate Technology for Sustainable Environment Development
NERCI has expertise in development and implementation of algorithms for satellite remote sensing data analysis, numerical ocean and coastal models for eco-system studies as well as data assimilation techniques with the technical support of Nansen Group of institutions in Norway, UK, Russia and China.
OrganizationThe Nansen Environmental Research Center - India (NERCI) was established in 1998 as a joint venture between Indian and Norwegian partners. It is a
research center, performing reserach, consultancy and training within the Nansen Group. The Other members of the Nansen Group are 1.Nansen Environmental and Remote Sensing Centre, Bergen, Norway. 2. Terra Orbit AS, Bergen, Norway. 3. Nansen International Environmental and Remote Sensing Center, St. Petersburg, Russia. 4. Nansen-Zhu International Research Center, Beijing, China. 5. Mohn-Sverdrup Center - Global Ocean Studies- Operational Oceanography 6. G.C.Reiber Climate Institute. 7. Ocean Numerics, UK, 8. COTO AS, Bergen Norway. 9. Arctica, Bergen.
The Nansen Centre India conducts basic and applied research in Ocean Sciences mainly funded under contrcatual research projects and by NERSC, Norway and exploring possibilities of
funding from international agencies and research councils to become self reliant.
StaffNansen Centre (India) currently
staff with two consultant scientists and four administrative staff on part time basis. At the end of 2005, two Indian students have been admitted to conduct doctoral programme at NERSC and Geophysical Institute, University of Bergen, Norway and be inducted into the main stream research activity of NERCI after completion of
research advisory board was consulted for taking guidance for R&D activities and promotion of education and social interaction with institutes in India and abroad.
improved facilities and working environment with the support of
are satisfactory to accommodate more
years. The activities of the center does not cause any damage to the local environment.
The Doctoral Fellowship program
The Doctoral fellowship program of two students Mr. Rahman Mankettikara and Ms. Mary Swapna George is funded by NERSC/Mon-sverdrup Center, Norway and by private donation from Mr. Trond Mohn c/o Frank Mohn AS for the Doctoral degree from University of Bergen in the following topics:
1. Validation of the HYCOM model for the Indian Ocean region and mesoscale ocean studies of the area
2. Data assimilation into the HYCOM model of the Indian Ocean.

NANSEN-NERCI short term Fellowship
NERCI has introduced Nansen-Nerci short term fellowship from 2006 for outstanding young postgraduate students in Oceanography /Ocean Technology from India. Mr. Roshin P. Raj f rom Dept .of Physical Oceanography, Cochin University of Science and Technology has been nominated for this fellowship for the current year.
Financial Situation
registered in India in 1998 under Article 25 of the companies Act and no devidend is shared between the shareholders. The Centre does not receive any basic governmental funding but has been registered under Educational and Social category in the Ministry of Home Affairs, Govt. of India to receive international funding.Mr. A.Mohanan, B.Sc., F.C.A, M/s.
Accountants and auditor of NERCI to
matters. The authorized share capital of NERCI is INR.2,000,000/- as on 31.3.2006 and the accrued expendiure for the period 1.4.2005 to 31.3.2006 is INR. 380,677/- as per the audited balance sheet of the Centre. NERCI is also registered as a charitable institution under section 12AA of the Income Tax act of Govt. of India.
Prospects for 2006-2007
NERCI expects a substantial expansion in its research activities in 2006-2007 due to increased cooperation, man power and projects to be submitted during this period.It is expected to start external funded projects in the year 2006-07 with new projects kick off. NERCI has already submitted projects to agencies like Norwegian Research Council, British
Environment Development in the tune of INR.25,00,000/- for the current year. It is expected to have moderate
increase in its project income in the coming years through funding from Norwegian Ministry of Forreign Affairs, European Union, World Bank, India-Australia Strategic Fund scheme and National Science and Technology Management Information System of Dept. of Science and Technology, Govt. of India.
activities
NERCI has launched its website www.nerci.in for global outreach of its activities and the site is maintained by M/s. ArideOcean, Cochin.
NERCI has entered into a consortium with Centre for Earth Research and
society to take up joint projects in India, www.ceremindia.org
Registration of NERCI is in progress in the Consultancy Development Centre, an autonomous institution
Industrial research (DSIR), Ministry of science and technology, Govt. of India.
Initiated a dialogue between the International Association for Research and Science (IARAS, http://www.iaras.org) in collaboration with WSEAS, http://www.wseas.org for submitting research proposals on Energy, Environment, Ecosystem, Sustainable Development, Agriculture and Geology for projects in future under the European Union.
A research proposal under the UK-INDIA Education and Research Initiate (UKIERI) in collaboration with Coastal Engineering Group, University of Plymouth is under consideration for initial funding for project formulation.
Proposal under the BILAT2007 for Indo-Norwegian institutional c o o p e r a t i o n i n o p e r a t i o n a l oceanography and climate research in cooperation with NERSC, Norway,
was submitted by NERSC, Bergen to Research Council of Norway.
Forum for Environmental Development, Japan) is under consideration for the project on “Water quality monitoring and low cost purification strategies for inland waterways of low-lying areas”.
P r o p o s a l s w i t h b u d g e t s INR.120,00,000/- are in different stages to be submitted to World Bank and also under India-Australia Strategic Research Fund schemes and DST-NSTMI, Govt. of India.
International / National Collaborating Partners
NERCI has established initial co-operation in collaborative research with the following institutions.
• Nansen Environmental and Remote Sensing Centre, Bergen, Norway
• Coastal Engineering Group, University of Plymouth, UK
• School of Earth Sciences, University of Melbourne
• Indian National Centre for Ocean Information Services, India
• National Institute of Oceanography, India
• Space Application Centre, ISRO, India
• Cochin University of Science and Technology, India
• Centre for Earth Science Studies, Kerala, India
• Central Institute of Fisheries Technology, India
• Central Marine Fisheries Research Institute, India
• Centre for Earth Research and
Environment Management, India
• Anna University, Chennai, India

Synergistic use of Ocean colour,
Prasanth, D., Research Fellow,Dr. K. Ajith Joseph, Senior Scientist,
NERCI
Upwelling is an oceanographic phenomenon that involves wind-driven motion of dense, cooler, and usually nutrient-rich water towards the ocean surface, replacing the warmer, usually nutrient-deplete surface water. The coastal areas of the Arabian Sea are major zones of upwelling during the SW monsoon (Currie et al., 1973). Particularly off the Arabian coast (Oman coast), upwelling is observed to extend 400 km offshore and runs parallel to the coast for nearly 1000 km. This area shows the maximum abundance of phytoplankton and zooplankton in the Indian Ocean (Rao and Griffiths, 1998). Off the southwest coast of India, upwelling starts even before the onset of the SW monsoon and continues till it ends in September. In this study we adopted a synergy of different satellite Earth observation sensor data like ocean colour (SeaWiFs and MODIS), AVHRR and radar altimeter data to make an integrated approach in studying upwelling features in the coastal seas in the Northern Indian Ocean in general and also in the seas around India in particular. It provides information on upwelling of northern Indian Ocean using sea surface temperature (SST) and sea surface height (SSH) anomaly measured from satellites. The upwelling is inferred as low sea surface temperature and low sea surface height variability. The horizontal scales for SST and SSH are not equal, due to SSH being more dominated by the dynamic processes in the ocean than SST, which is more dominated by the smooth atmospheric fields. The Area plot of Ocean color provides the development of chlorophyll maxima in the seas around India in synergy with the upwelling signals in the Indian
from the TOPEX/POSEIDON satellite altimeter data. Strong semi-annual variability of sea level anomaly was observed along the equator. The characteristic features of the westward propagating Rossby waves along 4 , 6 , 12 and 18 N were analysed and found that it’s speed decreases from 48 cm/sec at 4 N to 6 cm/sec at 18 N. These speeds are comparable to the theoretical phase speed of Rossby waves. Further studies showed that the sea-level anomaly along eastern and western side of the Indian Ocean is out off phase with each other, especially in the equatorial region. By analysing the ten-year SSH anomaly it is found that it’s magnitude changes every year. The major change was noticed in 1998, year after the major El Nino which occurred in the year 1997. Rossby waves in 1998 were seen as
signal of the Rossby wave may have
Another interesting result is that in normal years the Ocean acts like an
capacity of the Ocean ceases (in it’s negative phase). Similarly the studies on the mixed layer depth showed that the MLD also changes in accordance with the Kelvin and Rossby wave propagation in the Indian Ocean, which has a large impact on the heat capacity of the Oceans.
Ocean. This synergetic approach would provide a tool for understanding and predicting the impacts marine hazards like climate change and other oceanic phenomena like El Nino and
potential in the seas around India by comparing the chlorophyll anomaly data and SST variability data.
Upper: SST image of the Northern Indian Ocean during August, 2004. Middle: Sea Level Anomaly in the Northern Indian Ocean during upwelling period. Lower: Chlorophyll-a concentration in the Northern Indian Ocean during upwelling period.
Characteristic features of Rossby
from Satellite Altimetry
Prasanth, D.,Research Fellow, NERCI Saji, P.K, Sr. Lecturer, Dept.of Physical
Oceanography, Cochin University of Science and Technology,
Dr. K.Ajith Joseph, Sr. Scientist, NERCI
The characteristics of Rossby and Kelvin waves in the Northern Indian Ocean, was deciphered from ten years (1993-2002) of sea level observations
Upper: Kelvin wave propagation in the Northern Indian ocean along the Equator.Lower: Rossby wave propagation through 6°N latitude in the Northern Indian Ocean.

Time series of SSH anomaly on respectively the eastern (upper) and western (lower) side of the Equator.
impacts of El Nino
Ocean Tsunami on Chlorophyll
Sea using Ocean Colour Data
Dr K. Ajith Joseph, Sr. ScientistPrasanth, D., Research Fellow, NERCI
Eastern Arabian Sea is one of the major productive regions in the Indian Ocean as this region often shows maximum abundance of phytoplankton and zooplankton. But this region at times shows decrease in productivity due to the impacts of oceanic phenomena like El Nino signals and events like Tsunami in the Indian Ocean which
present study utilized ocean colour data from SeaWiFs with the aid of GIOVANNI (GES-DISC Interactive Online Visualization ANd aNalysis Infrastructure) online software to analyse these impacts for the eastern Arabian Sea region which is of interest to Indian marine scientists. We observed Chlorophyll reduction in this highly productive regions during the years after the occurrence of El Nino in 1997 and also in the year after the
occurrence of Indian Ocean Tsunami in December 2004. This reduction in chlorophyll production has directly
west coast of India in the year 1998 and 2005 respectively. The approach for the study was carried out by using ocean colour data from SeaWiFs for the year 1998 and 2005 Southwest monsoon period (June- September) which was the time of occurrence of upwelling features and associated nutrient increase in the surface waters causing increased primary productivity in the eastern Arabian Sea. The eight-year long ocean color data record from SeaWiFS was used for chlorophyll concentration anomaly analysis. The Giovanni climatological anomaly analysis for chlorophyll data was performed for the monsoon season at the study region and compared the values for that time period to the SeaWiFS climatological mean data values and derived the positive and negative anomalies of chlorophyll concentration. This was compared with the chlorophyll anomaly image of the same study region for a normal Southwest monsoon time (2004) which was prior to the occurrence of Tsunami and observed a positive anomaly which shows increase in chlorophyll production during this season due to algal blooming. The Area plot of Ocean color provides the development of chlorophyll maxima in the seas around India in synergy with the upwelling signals in the Indian Ocean in normal years. However during year after the occurrence of El Nino and Indian Ocean Tsunami in the Indian Ocean it is found that chlorophyll concentration is reduced which in
eastern Arabian Sea during these years (1998 and 2005).
that oceanic phenomena (El Nino) and events (Tsunami) have negative effect on the chlorophyll production in the normally productive regions of the eastern boundary currents surrounding the Oceanic regions in the Arabian Sea.
Roshin P. Raj, NANSEN-NERCI Research Fellow,
Prasanth, D, Research Fellow, Dr. K. Ajith Joseph, Sr. Scientist, NERCI
In the summer monsoon, chlorophyll-a concentration (Chl-a) maps derived from the Seaviewing Wide Field of view Sensor (SeaWiFS) indicates phytoplankton bloom around the southern tip of peninsular India. Physical processes associated with the bloom are studied using sea surface temperature (TMI-SST data) and geostropic velocity anomaly calculated from sea level anomalies (SLA data merged from TOPEX/POSEIDON and JASON). From the present study, it is determined that eddies play a major role in the distribution of chlorophyll-a. The flow pattern of South-West Monsoon Current (SMC)
meso-scale eddies. Meso-scale eddies observed in this region are of the order of 100 km in diameter. Fig. 1a-c shows respectively the geostrophic velocity anomaly, chlorophyll-a concentration and SST during the last week of June 2002. From Fig 1a, it is determined that 4 eddies are formed in the study region which controls the shaped spreading of chlorophyll-a. The
Eddies in the Palk Bay and southern coast off Sri Lanka causes intense upwelling. The SST map confirms upwelling associated with meso-scale eddies. From Fig 2a-c, we can see an intensification in the chlorophyll-a concentration pattern, which is clearly controlled by the strengthening and respective positions of the eddies. Nutrient transport in to the upper layers caused by coastal upwelling driven by monsoon winds and eddy induced upwelling contributed to the high chlorophyll-a distribution in this region during summer monsoon. This study is a novel approach and gives an insight into the role of meso-scale eddies for the development of phytoplankton blooms in the coastal waters of the seas around India which is of great interest
Chlorophyll-a concentration anomaly in the eastern Arabian Sea respetively after the El Nino year (left) and during a normal SW monsoon situation (right).

occurrence and spreading of harmful algae blooms in the Indian waters.
Rahman Mankettikara, Ph.D. student, NERCI-NERSC
Over the past twenty years, there have been lots of efforts to study the
Indonesian Throughflow(ITF) as it is a choke point of the global ocean thermohaline circulation. It is the only tropical oceanic pathway exists in the world Oceans connecting the
ITF has been linked to the regional as well as the global climate. Large scale observational studies reveal
water to the Indian Ocean through the Indonesian seas. The complex geography of the region, with multiple narrow constrictions connecting a series of large, deep basins, leads to
into the Indian Ocean due to mixing, upwelling and air-sea exchanges.The ITF is maintaining the heat and salt budgets of the Indian and Pacific oceans. Thus, it influences
and hence influencing the oceanic and atmospheric circulation. Without the ITF the nature and characteristics of the Indian Ocean and Pacific Ocean would be very different. ITF is studied extensively during past few decades using observational and modeling methods. However, the role of ITF in the mean state of the Ocean-Atmosphere is not completely understood yet. The major hindrance to a conclusion on this aspect is lack
time-scale. For this same reason most of the researches on ITF are based on numerical modeling.
the regional as well as global climate, efforts were made to understand its effect on the Indian Ocean. The Hybrid Coordinate Ocean Model (HYCOM, Bleck, 2002) setup for the Indian ocean
region and South Equatorial Current . The circulation near the Australia does not affect the variations in the transport. Model results for different months does not show the seasonal variations of the
Ocean.It is proposed to Implement data assimilation for the Indian Ocean
model and the in-situ, remotely sensed sea-level anomalies (SLA) and sea-surface temperature data will be assimilated to the model using the Ensemble Kalman Filter (EnKF, Evensen, 2003). The assimilative run will have to be compared with the free running model results to improve the present capability for forecasting the Indian Ocean and to setup a nested forecasting system in a regional sea in the North Indian Ocean.
Mary Swapna George,Ph.D student, NERCI-NERSC
As part of the Ph.D, the model (developed at NERSC) has been running for the years 1992- 2002 and was validated using published results and WOCE (World Ocean Circulation Experiment) data. The validation was done for the surface currents for the Indian Ocean and for water masses of selected sections. The temperature and salinity structure were compared
Fig. 1 upper: Geostrophic velocity anomaly in the seas around S.India during June,2002Lower left: Chlorophyll-a concentration in the seas around S.India during June,2002.Lower right: SST in the seas around S.India during June, 2002.
Fig. 2 upper. Geostrophic velocity anomaly vectors showing mesoscale eddies in the seas around S. India during monsoon.Lower left: High chlorophyll-a concentration associated with cold core mesoscale eddiesLower right: Low SST showing generation of cold core eddies in the seas around S. India during monsoon.
Upper: The normal circulation pattern of South Equatorial current in the Indian Ocean without
Lower: The increasing strength of South
Ocean circulation with increase in ITF
with the WOCE sections from the year 1996. The same model sections as that of WOCE were used for the comparison. The following figures show the simulation of surface currents in the Northern Indian Ocean for the year 1995-96, the major currents can be found with their speeds in m/s in the background (in color).January - the Winter Monsoon Current between 8°N and equator which becomes the Summer Monsoon Current in the figure for July. The high speed Somali Current’s simulated by the model, reversing the direction in both seasons. The Equatorial circulation can be found in both the figures. The South Equatorial Current which is present althorughout the year is
10S and the GreatWhirl is simulated centered around 8N. These studies show that the model does a good work in simulating the surface currents and water masses and is also good in comparison with the WOCE sections. But a closer comparison with the Argo float profiles for the region showed that the model is simulating much fresher and warm waters in the surface and subsurface waters. This
with the GDEM (Generalized Digital Environmental Model; Teague et al 1990) climatology data. The surface precipitation climatology (Legates and Willmott 1990) used during the model
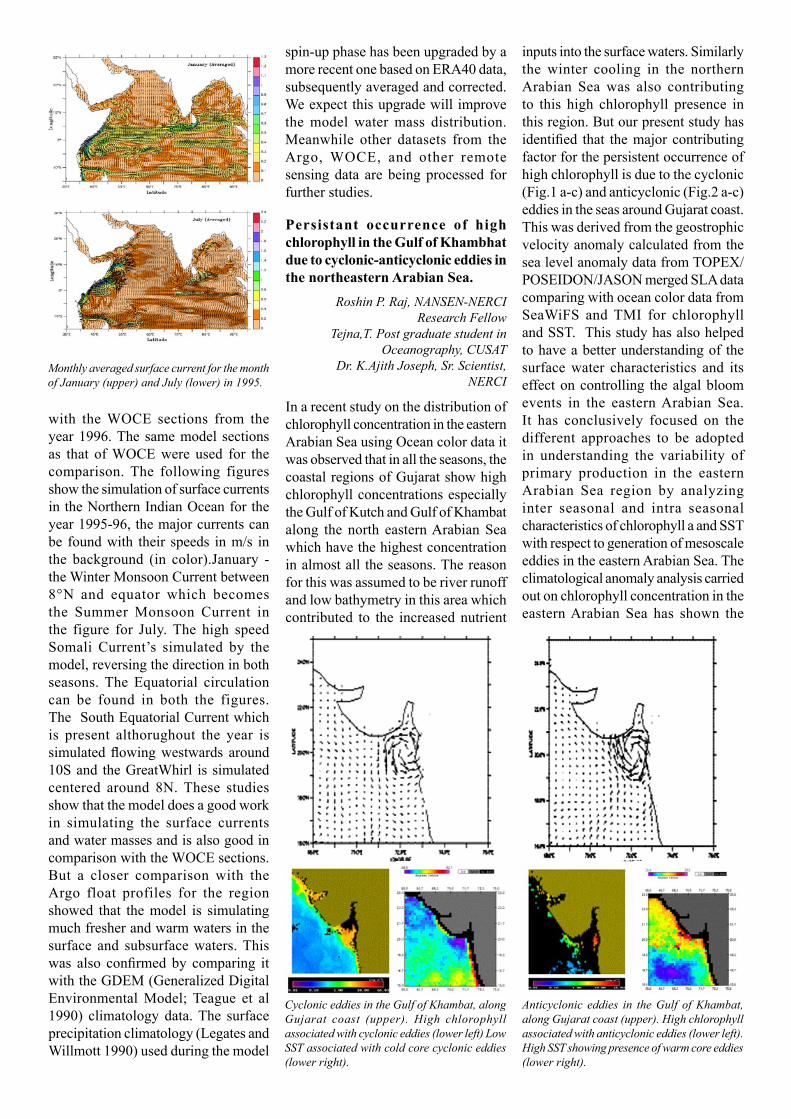
Persistant occurrence of high chlorophyll in the Gulf of Khambhat
the northeastern Arabian Sea.
Roshin P. Raj, NANSEN-NERCI Research Fellow
Tejna,T. Post graduate student in Oceanography, CUSAT
Dr. K.Ajith Joseph, Sr. Scientist, NERCI
In a recent study on the distribution of chlorophyll concentration in the eastern Arabian Sea using Ocean color data it was observed that in all the seasons, the coastal regions of Gujarat show high chlorophyll concentrations especially the Gulf of Kutch and Gulf of Khambat along the north eastern Arabian Sea which have the highest concentration in almost all the seasons. The reason for this was assumed to be river runoff and low bathymetry in this area which contributed to the increased nutrient
inputs into the surface waters. Similarly the winter cooling in the northern Arabian Sea was also contributing to this high chlorophyll presence in this region. But our present study has
factor for the persistent occurrence of high chlorophyll is due to the cyclonic (Fig.1 a-c) and anticyclonic (Fig.2 a-c) eddies in the seas around Gujarat coast. This was derived from the geostrophic velocity anomaly calculated from the sea level anomaly data from TOPEX/POSEIDON/JASON merged SLA data comparing with ocean color data from SeaWiFS and TMI for chlorophyll and SST. This study has also helped to have a better understanding of the surface water characteristics and its effect on controlling the algal bloom events in the eastern Arabian Sea. It has conclusively focused on the different approaches to be adopted in understanding the variability of primary production in the eastern Arabian Sea region by analyzing inter seasonal and intra seasonal characteristics of chlorophyll a and SST with respect to generation of mesoscale eddies in the eastern Arabian Sea. The climatological anomaly analysis carried out on chlorophyll concentration in the eastern Arabian Sea has shown the
spin-up phase has been upgraded by a more recent one based on ERA40 data, subsequently averaged and corrected. We expect this upgrade will improve the model water mass distribution. Meanwhile other datasets from the Argo, WOCE, and other remote sensing data are being processed for further studies.
Monthly averaged surface current for the month
Cyclonic eddies in the Gulf of Khambat, along
SST associated with cold core cyclonic eddies
Anticyclonic eddies in the Gulf of Khambat,
High SST showing presence of warm core eddies

ADDRESS/LINKS:
Priya Square IInd Floor, Karshaka RoadCochin - 682016, Kerala, IndiaPhone : +91 (484) 2322351/2319629Fax : +91 (484) 2323694E-mail : [email protected] http://www.nerci.in
comparatively unusual high values in the bloom season. In pre monsoon season, the higher concentrations in the range 7.4-17 mg m-3. were seen in the Gujarat coast, with higher concentration in the gulf of Khambath. SST maps show an inverse relation with chlorophyll-a concentration. In the Gujarat coast, the SST was in the range 26-29 ºc, which is lowest in the coastal regions. In the monsoon season, the chlorophyll concentration all along the western coast of India was high, reaching up to 30 mg m-3. and SST also shows an inverse relationship in high concentration areas. In the Gujarat
coasts the SST was above 28.5 ºC, which is an anomalous phenomenon that there is still high concentrations of chlorophyll in this region, or it shows a positive relation ship between chlorophyll and SST in this region in September.In the post monsoon season the chlorophyll concentration higher values were observed in the Gujarat coasts. Open ocean concentrations were still lower than the near shore regions. And SST and chlorophyll-a concentration here also shows an inverse relationship.The interrelationship between two biophysical parameters like chlorophyll
a and SST has shown some characteristic relationship as mutually exclusive and mutually dependent in view of different environmental conditions in the marine environment. The role of mesoscale eddies in determining the occurrence and distribution of chlorophyll concentration and phytoplankton blooms due to eddy induced upwelling has to be incorporated in the prediction
zones in the Arabian Sea rather than relying only on identification of thermal fronts and wind induced upwelling in the seas.