N64-30339 - NASA
13
N64-30339 DISCOVERIES FROM SPACE EXPLORATION ROBERT JASTROW Director NASA Goddard Institute for Space Studies Space science is the collection of problems in science to which space vehicles can make some specific con- tribution not achievable by ground-based experiments. At the present time this field includes broad segments of the traditional disciplines of the earth sciences, physics, and astronomy. In later years the biological sciences will join this group in an important role, as explorations of the Moon and planets provide oppor- tunities for studying the conditions under which physi- cal life may have developed. Some highlights of recent space research will be reviewed here. GEODESY Important results have been achieved in determin- ing the internal structure of our own planet with the aid of near-Earth satellites. A satellite's orbit is de- termined by the distribution of mass within the Earth. If the Earth were a perfect sphere, under the attrac- tion of the mass point at the Earth's center of gravity, the satellite would move in an ellipse whose plane would keep a constant orientation in space. Actually, the plane of a satellite's orbit rotates slowly in space because of the additional force of attraction exerted by the equatorial bulge. Studies of the orbital rotation rates of a number of satellites have yielded a very precise value for the height of the equatorial bulge. These indicate a discrepancy between the observed value of the flattening and the value that should exist on the assumption of hydro- static equilibrium. Hence the interior of the Earth is not in hydrostatic equilibrium; the Earth must have a mechanical strength within its interior or some other cause for departure from static equilibrium which is sufficient to maintain its shape in spite of the stresses applied to the mantle by the excess equatorial bulge. There are other departures of the geoid from the shape of hydrostatic equilibrium, in addition to the discrepancy in the flattening. These departures, which have been determined primarily from the analysis of the Vanguard I orbit, include a pear-shaped com- ponent, or third harmonic, in the expansion of the gravitational field. The departures from the figure of hydrostatic equilibrium are of very great significance because they represent variations in the force of gravity, and these depend on the entire distribution of mass within the planet; they are therefore mcre significant for the gross structure of the planet than the simple topo- graphical variations, such as mountains, which repre- sent the distribution of the mass at the surface only. Detailed analysis of these gravitational variations yields a figure of the Earth in which there is a posi- tive anomaly, or a lump, in the region of the western Pacific near Indonesia and the Philippines; a de- pression, or negative anomaly, in the Indian Ocean; and a large negative anomaly, or hole, in the Antarctic Although these depressions and elevations are rela- tively minute, they are exceedingly significant because (fig. 1). FIGURE 1 .-Shape of Earth. 109
Transcript of N64-30339 - NASA

N 6 4 - 3 0 3 3 9
DISCOVERIES FROM SPACE E X P L O R A T I O N ROBERT JASTROW
Director NASA Goddard Institute
for Space Studies
Space science is the collection of problems in science to which space vehicles can make some specific con- tribution not achievable by ground-based experiments. At the present time this field includes broad segments of the traditional disciplines of the earth sciences, physics, and astronomy. In later years the biological sciences will join this group in an important role, as explorations of the Moon and planets provide oppor- tunities for studying the conditions under which physi- cal life may have developed. Some highlights of recent space research will be reviewed here.
GEODESY
Important results have been achieved in determin- ing the internal structure of our own planet with the aid of near-Earth satellites. A satellite's orbit is de- termined by the distribution of mass within the Earth. If the Earth were a perfect sphere, under the attrac- tion of the mass point at the Earth's center of gravity, the satellite would move in an ellipse whose plane would keep a constant orientation in space.
Actually, the plane of a satellite's orbit rotates slowly in space because of the additional force of attraction exerted by the equatorial bulge. Studies of the orbital rotation rates of a number of satellites have yielded a very precise value for the height of the equatorial bulge. These indicate a discrepancy between the observed value of the flattening and the value that should exist on the assumption of hydro- static equilibrium. Hence the interior of the Earth is not in hydrostatic equilibrium; the Earth must have a mechanical strength within its interior or some other cause for departure from static equilibrium which is sufficient to maintain its shape in spite of the stresses applied to the mantle by the excess equatorial bulge.
There are other departures of the geoid from the shape of hydrostatic equilibrium, in addition to the discrepancy in the flattening. These departures, which have been determined primarily from the analysis of the Vanguard I orbit, include a pear-shaped com- ponent, or third harmonic, in the expansion of the gravitational field.
The departures from the figure of hydrostatic equilibrium are of very great significance because they represent variations in the force of gravity, and these depend on the entire distribution of mass within the planet; they are therefore mcre significant for the gross structure of the planet than the simple topo- graphical variations, such as mountains, which repre- sent the distribution of the mass at the surface only.
Detailed analysis of these gravitational variations yields a figure of the Earth in which there is a posi- tive anomaly, or a lump, in the region of the western Pacific near Indonesia and the Philippines; a de- pression, or negative anomaly, in the Indian Ocean; and a large negative anomaly, or hole, in the Antarctic
Although these depressions and elevations are rela- tively minute, they are exceedingly significant because
(fig. 1).
FIGURE 1 .-Shape of Earth.
109

110 PEA_EFU_ USES OF SPACE
they represent variations in the force of gravity, or
the amount of matter per square centimeter, in the
regions in question. For example, the depression in
the Indian Ocean is only 60 meters deep, but it sig-nifies that the force of gravity there is so weak that
the waters of the sea are not drawn together to the
depth that they would be if the whole Earth were
subject to a uniform gravitational force.These anomalies are correlated with the rate at
which heat flows through the body of the Earth tothe surface. The correlation is such that where the
geoid is anomalously high, the heatflow is anoma-
lously low. On the average, the flow of heat outward
through the crust of the earth is 60 ergs/cm2-sec.
In the depression of the geoid near India, the flow
of heat is substantially higher," 80 ergs/cm2-sec. At
the elevation of the geoid in the western Pacific, the
flow of heat is substantially lower, about 40 ergs/cm o-see.
This kind of correlation would be expected if there
is a mass transport, or convection of matter, from the
deep interior of the Earth to the surface in these
regions. If there were an upward motion through
the interior of the Earth, which carried relatively
warm material from below to the surface, this upward-
moving column would have a lower density than its
surroundings, and therefore the mass per square centi-
meter in the column, and the gravitational force onthe surface of the Earth about it, would be lower
than on the average. At the same time, the heat trans-
ported upward by the warm column would add to
the normal release of radioactive heat throughout the
mantle and crust; thus, above that same upward-
moving column there would be an exceptionally large
rate of heat flow through the surface.
The converse would hold for a descending column,
which would carry a relatively dense and therefore
relatively cold material from the surface layer to theinterior of the Earth. Above the cold and dense
column the gravitational force would be relatively
great, and a bump would appear in the sea level there.
That is presumably the cause of the elevation in thewestern Pacific.
METEOROLOGY
In geocentric order, the next major area of investi-
gation in space science concerns the atmosphere and
the control exerted over it by the Sun. This field of
research includes questions related to the circulation
of the winds in the lower atmosphere and to the
vertical structure of the atmosphere at higher altitudes.
Regarding atmospheric circulation, eight Tiros
satellites have been laundl_d in tile past 4 years, all
carrying vidicon cameras for the global study of the
cloud cover; Tiros II, III, IV, and VII carried inaddition a set of infrared detectors for the measure-
ment of the intensity of infrared radiation emitted
from the atmosphere.
The cloud-cover photographs have already yielded
results of great interest when correlated with ground
observations, and they have the promise of leading
to a substantial improvement in weather forecasting
by providing global and nearly continuous coverageof regions of weather activity. The matter of global
coverage is critically important, because the success
of weather forecasting has been found to increase
rapidly with the size of the region covered by the
observations; yet at the present time large parts of
the globe are very poorly covered, and constitute
regions in which weather activity can develop and
grow without detection before moving out into the
inhabited areas. The sparsely covered territories in-
clude the polar regions, the major deserts, and the
southern oceans. Satellite coverage will greatly
strengthen the hand of the meteorologist by filling
in these blank portions of the global weather map
and may be expected to have important consequences
for the economies of this country and the world.The measurement of infrared radiation is less im-
portant than cloud-cover photography for the im-
mediate objectives of weather forecasting, but it
should have greater importance for the basic objec-
tives of long-range forecasting and the understandingof the causes of weather.
Although the Sun is the original source of energy,most of the solar radiation is in the visible band of
wavelengths which passes freely through the atmos-phere. This visible radiation reaches the surface of
the Earth where it is absorbed and heats the ground
to a temperature in the neighborhood of 235 ° K.
The ground emits radiation corresponding to this
temperature. For a glowing body at a temperature
of 235 ° K, most of the energy is radiated at wave-lengths in the far infrared. This infrared radiation
is strongly absorbed by several constituents of the
atmosphere, including water, carbon dioxide, and
ozone. The absorption of infrared from the ground
by these molecules heats the lower atmosphere, which
reradiates the absorbed energy, partly upward to outer
space and partly downward to provide additional
heating of the surface. (The additional heating of

DISCOVERIES FROM SPACE EXPLORATION 111
the surface by the return of infrared from the atmos- phere is referred to as the "greenhouse effect." On the Earth it is sufficient to raise the temperature by about 5 5 O K, so that the average temperature of the surface of our planet becomes 290' I(.)
Local variations in the amount of water vapor, and in other circumstances which control the penetration of visible light and the reradiation of infrared, lead to regional variations in the temperature and pressure of the atmosphere, which in turn provide the driving force for large-scale weather activity (fig. 2 and 3 1.
If a good spectral distribution of infrared intensi- ties is available, we can obtain from it the temperature distribution in the lower atmsophere, as well as the global variations in the total transfer df energy. These are vital data for the atmospheric physicist seeking the causes of weather.
In addition, the cloud-cover information obtained from satellites can be used to estimate the amount of incoming visible radiation which actually reaches the ground. The difference between the incoming visible radiation and the outgoing terrestrial radiation in the infrared region makes up the energy balance of the Earth and the atmosphere, which is the fundamental datum for long-range prediction.
These are the general circumstances which underlie the development of weather activity. The details of the process involve the following considerations. The intensity of infrared radiation emitted from the ground is determined by the temperature of the ground : the higher the ground temperature, the stronger the infrared radiation. The absorption of this infrared in the atmosphere is largely determined
by the water vapor present, this being the principal absorbing constituent. It is also affected by any clouds which may be present since liquid water drop- lets also absorb infrared strongly. Thus, the most important factors which control the outgoing infrared radiation are, in order: the ground temperature, the amount of water vapor in the atmosphere, and the extent and height of the clouds.
It is seen that the distribution of cloudiness plays an important role in the determination of both the inflow and the outflow of energy through the Earth's atmosphere. Thus far the distributions of clouds- amount, types, and approximate heights-have all been taken f rom ground-based observations. Satellite observations by television cameras enable us to obtain extensive cloud-cover data on a global scale in a relatively short period of time.
Albert Arking of the Goddard Institute for Space Studies has compared the Tiros results with a clima- tological mean cloudiness compiled from ground ob- servations by K. Telegadas and J. London (1954) for the Northern Hemisphere. The broad features are in agreement, although there are small numerical disagreements at some latitudes. The most noticeable disagreement, which occurs around 20° S. latitude, is probably due to the incorrectness of the assumption that cloudiness is the same during southern winters as during northern winters.
These results are preliminary, but this approach seems to be promising, and it is hoped that the temporal and geographical variations in the distribu- tion of energy balance will now be available through the use of both outgoing and incoming radiation
'FIGURE 2.-Energy balance, summer (left) and winter (right) of 1961. From Tiros I11 ,

112 PEACEFUL USES OF SPACE
FIGURE 3.-Energy balance, spring of 1962. From Tiros IV
obtained from satellites. In turn, this method may provide a better understanding of the role played by the energy balance of the atmosphere for long-range weather forecasting.
THE UPPER ATMOSPHERE The physical processes which control the upper
atmosphere are determined largely by the absorption of solar ultraviolet radiation by the atoms and mole- cules existing at great heights. Although the ultra- violet component of the solar radiation is only a small fraction of the total solar energy flux, the absorption of cross sections in the far ultraviolet are so large that these wavelengths are effectively removed from the incident spectrum by the time the incident flux has penetrated to a height of 100 km. The ultraviolet radiation is the principal source of heating of the thin upper air and the major determining factor in its structure.
At lower altitudes the air is composed of oxygen and nitrogen, and we can measure the proportions of these rather accurately. At the highest altitudes these gases have partially settled out of the air through diffusion. The lighter gases dominate the composi- tion of the air at sufficiently high altitudes. Of these gases hydrogen is the lightest, and for this reason it was once believed to be the dominant constituent of the air above the oxygen-nitrogen layer. The hydro- gen atmosphere was thought to emerge at an altitude of about 1,200 km. However, in July 1961, Marcel Nicolet of Belgium suggested on the basis of an initial examination of the density data of Echo I1 that be- tween the oxygen-nitrogen atmsophere and the hy- drogen atmosphere there should lie a iayer of helium. The existence of the helium layer was confirmed ex- perimentally at approximately the same time (fig. 4 ) .
Our knowledge of atmospheric properties at alti- tudes of about 250 km is dependent on the measure-

DISCOVERIES FROM SPACE EXPLORATION 113
Ap 40 t
vI
-r52!
.43.3
_g ¢ ]
-r5.5
-43.6
I
2O 0
! i i
I--ILtUh4q
d'r f
/I I
4 8
t
I I I | I
12 • _ 0 4
_t (h]
|
I I |
8 12 16 20
FIGURE 4.--Satellite drag.
ments of the atmospheric drag acting on satellites.
The period of revolution of a satellite decreases
steadily at a rate proportional to the drag force ex-
erted by the atmosphere; and the coefficient of the
observed rate of change of period therefore gives the
value of the air density suitably averaged around theorbit.
The detailed study of satellite drag has in factbeen a very valuable source of information on atmos-
pheric properties. The most interesting result of
investigations carried on by L. G. Jacchia of the Smith-
sonian Astrophysical Observatory was the discovery
that the upper atmosphere is extremely responsive to
solar control, undergoing excursions in density which
were lately found to be as much as a factor of 100,
and variations in temperature of hundreds of degrees,
according the level of solar activity.The significance of this correlation can be under-
stood as follows: During the maximum of the sun-
spot cycle, the surface of the Sun is the scene of great
activity, marked by sunspots and by hot, dense regions
with temperatures of some millions of degrees, which
are located in the solar corona above the sunspot areas.When such an active region faces the Earth in the
course of the Sun's rotation, extreme ultraviolet radi-
ation emitted from these active regions is absorbed
in the upper atmosphere. The precise correlation
between solar activity and density, discovered initially
by Jacchia of the Smithsonian Astrophysical Observ-
atory and W. Priester of the Institute for Space
Studies, suggests that the amount of energy trans-
ferred to the Earth is sufficient to heat the atmosphere
appreciably, causing an upward expansion and a large
increase in the density of the exceedingly thin air at
high altitudes. This discovery provided the first
direct evidence regarding the effects of solar surface
activity on fundamental atmospheric properties.
The continuing analysis of the correlation has given
us a rather full picture of the degree of solar control
over the upper atmosphere. It indicates that the
atmosphere is appreciably heated by the ultraviolet
emitted at times of general solar surface activity;
analysis has also indicated that the atmosphere isfurther heated by interaction of the Earth with the
solar plasma clouds, which are emitted from the Sun
following solar surface eruptions. The arrival of the
clouds of solar plasma at the Earth is signified by
the onset of geomagnetic disturbances or "magneticstorms" (fig. 5). It is found that increases in the
temperature of the atmosphere occur at just the time
that the magnetic storms and, hence, the solar particles
commence. Thus it appears that both ultraviolet radi-
ation and corpuscular streams constitute sources of en-
ergy for the upper atmosphere. The question of

114 PEACEFUL USES OF SPACE
FIGURE 5.-Solar plasma cloud.
the energy sources for the upper atmosphere is the most important single problem for upper-atmosphere physics at this time and the continuing investigation of this matter, and in particular of the roles played by particle and radiation sources respectively, will be one of the main areas of experimental and theoretical effort in the next several years.
THE MAGNETOSPHERE
The evidence that has been cited suggests that corpuscular streams from the Sun transfer appreciable amounts of energy to the atmosphere. The question arises, How does the transfer of energy in the atmos- phere occur?
The general answer seems to be connected with the properties of the outermost layer of the atmos- phere. The density of the upper air merges into the density of the interplanetary gas at an altitude of about ~00,000 km, marking the boundary of the atmosphere. Early in 1958, however, J. A. Van Allen of the State University of Iowa discovered, by analysis of Geiger counter data from Explorer I, that there was an additional layer of energetic charged particles in the upper atmosphere. These charged particles are trapped in the atmosphere by the Earth’s magnetic field. The atmospheric layer which they constitute is called the magnetosphere, since it is the region dominated by the geomagnetic field.
During the last few years, three important develop- ments have substantially changed our earlier impres- sions about the character of the magnetically trapped particles and their geophysical effects.
First, B. O’Brien, also of the State University of Iowa, using measurements from the Injun I satellite, discovered that the flux of charged particles coming down from the trapped region was so large that, if this flux consisted of previously trapped particles which had just been dislodged by solar disturbances, it would drain the whole magnetosphere in about an hour. He also found that when a solar disturbance occurred, both the flux of untrapped descending par- ticles and the number of trapped particles increased. Thus, he concluded that the leakage of trapped par- ticles from the Van Allen belts cannot be the‘principal source of the electrons which pass down through the atmosphere. He decided that while a few charged particles are trapped during or after a solar disturb- ance, most pass into the atmosphere directly without spending an appreciable amount of time in the trapped region. Apparently, the charged particles which are observed in auroral displays and other at- mospheric phenomena are those which come directly down the lines of force into the atmosphere.
Secondly, a large population of low-energy protons, having a range from 100 Kev to several MeV, was discovered by A. H. Davis and J. M. Williamson of the Goddard Space Flight Center. The concentra- tion of these protons peaks at 3.5 Earth radii. At that point their density is about 1 per cubic centi- meter.
This value of the trapped-proton density has inter- esting implications. As a result of the magnetic-field gradient and curvature effects, the trapped protons drift westward in the magnetic field, with an asso- ciated electric current that produces magnetic effects. These have been calculated by S. Akasofu of the University of Alaska and S. Chapman of the Uni- versity of Colorado and, in an unpublished work, by R. A. Hoffman of the Goddard Space Flight Center. They find that the changes in the intensities of these trapped protons produce magnetic perturba- tions large enough to explain most magnetic storms observed on the Earth, and also the very large per- turbations of the geomagnetic field in space, in the neighborhood of the proton belt. The relation be- tween the trapped-proton drift current and the geo- magnetic storms was suggested by S. F. Singer of the University of Maryland in 1956.
The third development was the discovery of a sub- stantial flux of electrons with very high energies, in the neighborhood of 1 million volts, at a distance of 3 or 4 Earth radii, presumably produced by beta decay

DISCOVERIES FROM SPACE EXPLORATION 115
of albedo neutrons resulting from cosmic-ray inter-
actions in the atmosphere. These electrons penetratethe Geiger counters with high efficiency, and when
allowance is made for their presence, th.e earlier esti-mate of the total flux of electrons is reduced from
Van Allen's value of 10 TM to the latest value of 108.
THE MAGNETOPAUSE
The connection between the magnetosphere and the
transfer of corpuscular energy to the atmosphere is
probably to be found in the properties of the mag-
netosphere near the magnetopause, a region which
separates the interplanetary medium from the region
around the Earth in which the geomagnetic field is
dominant. Its sharply defined surface marks the
termination of both the trapped-particle region and
the geomagnetic field. Satellite measurements of the
geomagnetic field by L. J. Cahill of NASA Head-
quarters in Washington show that the magnetopause
has a thickness on the order of 100 km and occurs
at a distance of 8 to 10 Earth radii on the sunlit
side of the Earth (fig. 6).
Within the region of the geomagnetic field there
are no substantial particle fluxes other than those of
the magnetically trapped particles. Outside the geo-
magnetic field, experiments on Explorer X andMariner II have shown that a substantial number of
particles move outward in a radial direction from the
Sun at velocities varying from 300 to 600 km/sec
and at an average flux of 108/cm2/sec. Mariner II
measured a higher kinetic energy in the directed solar
plasma streams than in the random particle motions
in the stream. The solar plasma cloud drags the
lines of solar magnetic field with it, and its bulk
motion is not affected by the presence of the field(fig. 7).
These results, taken together, indicate that the Sun
is the source of a solar particle stream which flows
IFI
4OO
30O
|00
I00
0
21 ZO
I I
UT
¥I t I8 I0
R[
FIGURE 6.--Magnetopause.
16 12
i I
INBOUND
13 SEPT. i961.
IIZ
18o
120
50
'-' 0
!
t I,
360
24O
120
0
116 PEACEFUL USES OF SPACE
~~
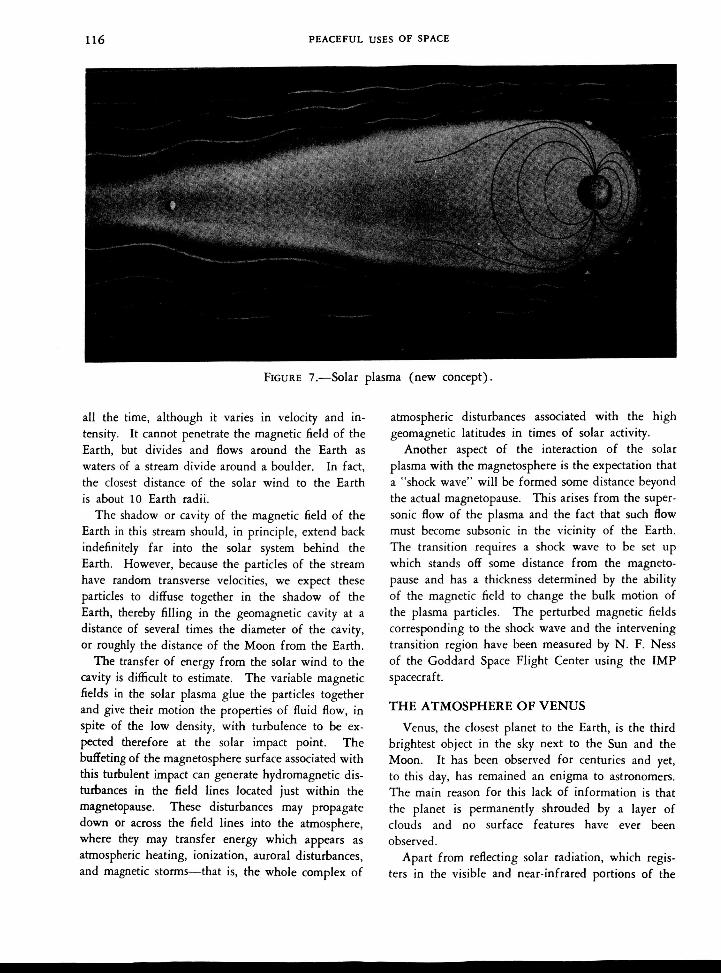
FIGURE 7.-Solar plasma (new concept).
all the time, although it varies in velocity and in- tensity. It cannot penetrate the magnetic field of the Earth, but divides and flows around the Earth as waters of a stream divide around a boulder. In fact, the closest distance of the solar wind to the Earth is about 10 Earth radii.
The shadow or cavity of the magnetic field of the Earth in this stream should, in principle, extend back indefinitely far into the solar system behind the Earth. However, because the particles of the stream have random transverse velocities, we expect these particles to diffuse together in the shadow of the Earth, thereby filling in the geomagnetic cavity at a distance of several times the diameter of the cavity, or roughly the distance of the Moon from the Earth.
The transfer of energy from the solar wind to the cavity is difficult to estimate. The variable magnetic fields in the solar plasma glue the particles together and give their motion the properties of fluid flow, in spite of the low density, with turbulence to be ex- pected therefore at the solar impact point. The buffeting of the magnetosphere surface associated with this turbulent impact can generate hydromagnetic dis- turbances in the field lines located just within the magnetopause. These disturbances may propagate down or across the field lines into the atmosphere, where they may transfer energy which appears as atmospheric heating, ionization, auroral disturbances, and magnetic storms-that is, the whole complex of
atmospheric disturbances associated with the high geomagnetic latitudes in times of solar activity.
Another aspect of the interaction of the solar plasma with the magnetosphere is the expectation that a “shock wave” will be formed some distance beyond the actual magnetopause. This arises from the super- sonic flow of the plasma and the f ad that such flow must become subsonic in the vicinity of the Earth. The transition requires a shock wave to be set up which stands off some distance from the magneto- pause and has a thickness determined by the ability of the magnetic field to change the bulk motion of the plasma particles. The perturbed magnetic fields corresponding to the shock wave and the intervening transition region have been measured by N. F. Ness of the Goddard Space Flight Center using the IMP spacecraft.
THE ATMOSPHERE OF VENUS
Venus, the closest planet to the Earth, is the third brightest object in the sky next to the Sun and the Moon. It has been observed for centuries and yet, to this day, has remained an enigma to astronomers. The main reason for this lack of information is that the planet is permanently shrouded by a layer of clouds and no surface features have ever been observed.
Apart from reflecting solar radiation, which regis- ters in the visible and near-infrared portions of the

DISCOVERIES FROM SPACE EXPLORATION 117
spectrum, a planet also emits its own radiation, whichis confined to the far-infrared and microwave regions
of the spectrum. Measurements of planetary radi-
ation provide valuable information on the tempera-
ture structure of the atmosphere. Such a study of
Venus has been hampered by the presence of clouds
that are opaque to infrared. However, the small
amount of radiation emitted by the planet in the
centimeter wavelength region penetrates through the
clouds without significant attenuation and can be use-
fully detected to determine the temperature of the
surface of the planet.
First attemps to measure this radiation from Venus
were made in 1956 with the radiotelescope of the
Naval Research Laboratory. The temperature in-
ferred from the measured radiation intensity was,
however, unexpectedly high---of the order of 600 ° F,
which is certainly too hot to support any imaginable
form of life. Repeated measurements in the follow-
ing years have forced a complete revision of our
understanding of the surface conditions and the lower
atmosphere of Venus.
One way of explaining such a high surface tem-
perature is by assuming the presence of an extremely
dense atmosphere composed of large quantities of
carbon dioxide and water vapor. These molecules
have strong absorption bands in the infrared region
of the spectrum, but are relatively transparent to
visible radiation. The major part of the sunlight
which has not been reflected back by the planet will
therefore penetrate through the atmosphere and heat
the surface of the planet to a certain temperature.
Venus, whose reflectivity of visible radiation is
very high (76 percent of the light received, as com-
pared with some 40 percent for Earth), would be
heated to only -40 ° F by the weak sunlight thatfilters through the clouds. Because of this cold sur-
face temperature, Venus would emit radiation
primarily in the far-infrared region, which would
immediately be absorbed by the dense atmosphere.
Reradiation from the atmosphere, according to this
theory, then sends a major part of the radiation back
to the ground, heating it to a very high temperature.
This phenomenon is called the "greenhouse effect"
of the atmosphere, an allusion to the glass cover of
a greenhouse that is transparent to the Sun's visible
radiation but opaque to the infrared radiation emitted
from the plants. Thus the infrared is trapped within
the greenhouse and heats it up. If it were not for
the greenhouse effect of the Earth's atmosphere, the
average temperature of the Earth's surface would bea cold --20 ° F instead of a comfortable 60 ° F.
In the case of Venus, it is difficult to imagine a
greenhouse effect so efficient as to raise the ground
temperature to 600 ° F. This would require an at-
mosphere of extreme opacity in the infrared, and at
the same time considerable transparency in the visible
spectrum. Since such an atmosphere would be quite
unique, this explanation of Venus' high surface tem-
perature is very controversial.
It is possible that microwave emission from high
densities of electrons in the ionosphere of Venus giverise to emission of microwave radiation which results
in spuriously high values of the measured tempera-
ture. In order to measure the actual temperature,
the United States launched the Mariner II Venus fly-
by, which passed 20,900 miles from the planet and
made crucial measurements of the temperature across
the disk. The spacecraft was equipped with two
radiation experiments, one in the infrared and one
in the microwave region.
The radiation emitted by the planet in the micro-
wave region was measured at two discrete wavelengths
--13.5 mm, where the radiation is strongly absorbed
by water vapor, and- 19 ram, which passed through
the atmosphere unattenuated and, hence, provided a
measure of the ground temperature.
The measurements at 19 mm tested the possibility
that the high temperatures observed on Venus origi-
nate from a thick ionosphere rather than from the
surface. If the ground has a high temperature, then
measurements made of the edge or "limb" of the
planet should show a slightly lower temperature or
"darkening" due to the greater thickness of the in-
tervening atmosphere. If the high temperatures are
caused by a high-electron density in the ionosphere
of Venus, then the readings at the limb should in-
dicate a "brightening" because of the greater thick-
ness of the ionosphere in the line of sight.
The wavelengths used to measure the infrared radi-
ation of the planet were chosen to give information
regarding the temperature at the cloud top and theamount of carbon dioxide above the clouds. Obser-
vations of Venus from Earth in the infrared region
to date have indicated a temperature of --40 ° F. As
clouds are opaque to infrared, it is believed that this
temperature exists at the top of the clouds, similar to
the temperature frequently observed at the top ofterrestrial clouds.

118 PEACEFUL USES OF SPACE
The Mariner results indicate that the measured
values of temperatures were actually correct There
is a limb darkening, indicating that the surface of
Venus may actually be at a temperature of 600 ° K.The infrared radiometer confirmed the earlier tem-
perature of --35 ° C at the cloud top. It also indi-cated that there were no breaks in the clouds of
Venus during the time of measurement.
EXPLORATION OF THE MOON
The Moon is a uniquely important body in the
study of the history of the solar system because its
surface has preserved the record of its history re-
markably well. The Moon has a negligible atmos-
phere and no oceans. It is, therefore, unchanged by
the processes of erosion which erased the history of
the Earth's surface in a relatively short period of time
--between 10 and 30 million years.
This is evidenced, in part, by the tens of thousands
of craters on the lunar surface, produced by the im-
pact of meteorites which presumably have been col-
liding with the Moon since its formation. This is
perhaps the only physical record which we have of
events in the development of the solar system going
back to that early time.
Because of this antiquity of the Moon's surface,
another remarkable record has been preserved--a
layer of cosmic dust which is believed to have rained
on it from the solar system since its formation. This
dust may be as much as a foot or more in depth and
may contain organic molecules and the precursors of
life on Earth, providing clues to the origin of physicallife.
The most important measurements of lunar proper-
ties from spacecraft have resulted from the Russian
flights of Lunik II and Lunik III. From the Lunik II
magnetometer data Soviet scientists concluded that
an upper limit of approximately 100 gammas couldbe placed on the Moon's magnetic field. In future
flights, improvements on this limiting value of the
Moon's magnetic field may provide information on
the presence or absence of a liquid core within that
body. On the Earth the magnetic field is supposed
to be associated with currents in the liquid core of
the planet. This in turn could have a bearing on
our understanding of the formation of the Moon and
similar bodies in the solar system.
Lunik III has provided us with the first pictures
of the remote side of the Moon. In spite of some
blurring, the photographs are still of great interest,
for it is possible to distinguish a large number of
features resembling the craters and maria on the front
face. Perhaps the most interesting feature is the
Soviet Mountain Range, a chain extending across thecenter of the Moon's hidden face. It resembles the
great ranges on the Earth and is unlike the mountainformations characteristics of the Moon's front face
which seem to be circular crater walls and deposits
of debris formed by the impact of large meteoriteson the lunar surface.
According to our present ideas, terrestrial moun-tains result from the combined effects of erosion and
wrinkling of the Earth's crust, but these mountain-
building forces are believed to have been much less
effective on the Moon. The markings of the Soviet
Mountain Range could have resulted from the run-
ning together of several obscured but independent
markings. However, if they continue to appear as
a single range in later, more detailed pictures, we
may have to revise our theories of lunar structure.
SOLAR PHYSICS
One of the most interesting questions in solar
physics is the manner in which energy is transported
above the surface of the Sun to heat the chromosphereand corona.
We know that near the center of the Sun, where
"the temperature is approximately 15 million degrees
Kelvin, hydrogen is converted into helium by a varietyof nuclear reactions. We also know that the Sun is
a self-adjusting system which expands or contracts in
order to maintain a precise balance between the energy
generation at the center and the energy emission fromthe surface.
All regular mechanisms of energy transport can
carry heat only from a region of high temperature
to a region of low temperature. Therefore, in order
to carry away from the center of the Sun the heat ,
generated by nuclear reactions, it is necessary for the
temperature to fall continuously from the center to
the edge. This is in fact the case, the temperature
falling from 15 million degrees at the center to
5,800 ° K'at the visible edge of the Sun.
However, above the visible edge, which is called
the photosphere, there lies a relatively tenuous region
of gas which constitutes the atmosphere of the Sun.
This region is divided into the chromosphere and,above that, the corona.
The puzzling fact about these circumstances is that
the temperature of the Sun rises again from the

DISCOVERIES FROM SPACE EXPLORATION 119
photosphere, reaching a value of 1.5 to 2 million
degrees in the corona. One of the paramount questions
of solar physics is, What constitutes the source of the
energy which produces the very high temperatures inthe solar corona? Also, What is the mechanism of
energy transport which can carry energy without
appreciable losses through i_he dense gases of the
photosphere and yet undergo strong losses in the
tenuous regions of the corona ?A current belief is that a wave motion---either a
sound wave, a hydromagnetic wave, or a gravity wave
-----carries energy upward from the photosphere and
deposits it in the corona. When a sound wave propa-
gates into a region of decreasing density, its amplitude
increases and it will steepen into a shock wave. This
is a mechanism in which considerable energy dis-
sipation takes place. It appears that hydromagnetic
waves are rapidly damped out below the photosphere,
but if they can be generated in the region of the
chromosphere, they will not tend to be dissipated until
they have reached the corona. Magnetic disturbances
above the photosphere may be particularly effectivein generating these waves. Gravity waves consist of
a kind of rolling motion similar to the waves on the
surface of the ocean. These may, like sound waves,
be generated by the motions of convecting material
in the transition layer; they will have a vertical com-
ponent of propagation and will be dissipated in thecorona.
It may be that all three of these mechanisms are
effective for the heating of the chromosphere and
corona. If this is the case there may be a steady heating
of the corona, upon which is superimposed a localized
heating associated with magnetic activity. Thus, the
heating of the corona is expected to depend upon the
magnetic structure in the outer layers of the Sun.
This is observed in many phenomena; in particular,
in sunspot regions where the magnetic-field strengths
are higher than is normal on the Sun's surface, both
the chromosphere and the corona have a higher than
normal temperature.
The behavior of the chromosphere and the corona
is most easily observed by studying the ultraviolet
emission from the Sun, since in the ultraviolet region
the amount of light emitted from the photosphere
greatly decreases, whereas the higher temperatures in
the chromosphere and corona are responsible for the
presence of large numbers of emission lines. The
most important emission lines are due to hydrogenand helium. In order to understand solar surface
physics in more detail, it is essential to obtain obser-vations of the time variations of these emission lines
as indicators of the time variations of behavior in the
chromosphere and corona.
The first experiments in this direction were very
successfully accomplished by the flight of the first
Orbiting Solar Observatory, which was launched on
March 7, 1962. It gave several months of data, con-
tinuously monitoring a number of different wave-
length regions for emission from the Sun.
Particularly interesting are the data for the l lth
through the 22d of March, 1962. At the beginning
of this period the Sun was in an exceptionally quiet
condition, but as the period progressed the Sun be-came more and more active, until on March 22 there
was a flare of importance 3. Experiments revealed
that the Lyman alpha line of He II at 304 A increased
by some 33 percent during the interval, and during
the flare itself the line increased by an additional
14 percent. The lines of Fe XV at 284 A and Fe
XVI at 335 A also increased in intensity by a factor
of 4. At longer wavelengths, the Lyman alpha line
of hydrogen was observed to increase in intensity by
6.8 percent during the flare.
Very interesting results were also obtained in the
X-ray region, 1 to 10 A. During the quiet perioda flux was observed which was 360 times the theo-
retical background which would be obtained from a
corona at a temperature of 1.8 million degrees Kelvin.
This indicates that nonthermal processes are present
and important in the corona under even the quietestsolar conditions.
A continuing series of Orbiting Solar Observatories
is planned in which these interesting phenomena can
be monitored continuously during future years.
X-RAYS AND GAMMA RAYS
The space research program is not confined to the
discovery of new facts about the solar system. It
also represents an important opportunity for the
astrophysicist to extend his knowledge of more dis-
tant parts of space through observations at wave-
lengths for which photons do not penetrate through
the atmosphere. The principal regions involved are
the X-ray and gamma-ray region, the ultraviolet, the
infrared, and long-wave length radio waves. The early
rocket and satellite measurements of X-rays and
gamma rays have been particularly interesting to
physicists because they suggest several possible new
types of phenomena in space.

120 PEACEFUL USES OF SPACE
X-rays and gamma rays can be produced by a
variety of high-energy processes. These processesinclude collisions between high-energy nucleons which
can create neutral pions, which in turn decay to give
gamma rays exceeding 50 Mev in energy. Fast elec-
trons can produce X-rays or bremsstrahlung when
they pass close to a nucleus. Fast electrons can also
collide with photons of visible starlight and increase
the energy of the photons into the X-ray and gamma-
ray region. If radioactive nuclei are produced and
dispersed in space between the stars, some of them
should emit characteristic gamma-ray energies which
might be detected. If positrons are produced in
dense regions of matter, such as stellar surfaces, then
upon being slowed down and annihilated they willemit the characteristic gamma rays of 0.51 Mev
energy. If neutrons are produced near stellar sur-
faces and are slowed down and captured by the
overwhelmingly abundant hydrogen that is present,
then these will provide characteristic capture gamma
rays with an energy of 2.31 Mev. Finally, we may
note that if objects should exist in space with surface
temperatures of some millions of degrees Kelvin, then
photons in the X-ray region will be emitted by
thermal processes from their surfaces.
Preliminary measurements now exist of the fluxes
of X-rays and gamma rays in a number of different
energy intervals. A general background of X-rays of
a few thousand electron volts energy was observed in a
rocket flight by R. Giacconi, H. Gursky, F. R. Paolini,
and B. B. Rossi. A general background radiation of
gamma rays in the region near 1 Mev energy was meas-
ured in the Ranger 3 flight by J. R. Arnold, A. E.
Metzger, E. C. Anderson, and M. A. Van Dilla. A
small but still significant flux of gamma rays with en-
ergies exceeding 50 Mev was observed with the Ex-
plorer XI gamma-ray satellite by W. L. Kraushaar andG. W. Clark.
A number of attempts have been made to explain
the presence of these background X-rays and gamma
rays. Most mechanisms thus far examined appear
quantitatively inadequate to explain the observed
fluxes. One promising explanation is due to J. E.
Felten and P. Morrison, who suggested the importance
of the inverse Compton effect, in which the high-
energy electrons present in the cosmic rays collide
with photons with engeries of the order of 1 electron
volt which are emitted from stars. Following such a
collison, the photons can easily be raised to the ob-
served range of X-ray and gamma-ray energies,
depending upon the energies of the electrons with
which they collide.
Calculations by Felten and Morrison were based
on this effect. A flux will be emitted by the outer
halo region of our galaxy if the observed flux of high-
energy electrons at the position of the Earth exists
throughout this large outer region of the galaxy.Electrons in the halo fail to account for the observed
X-ray and gamma ray fluxes by some 21/2 orders of
magnitude. However, if it were to be assumed that
the high-energy electrons are present throughout all
of space with the same intensity with which they areobserved near the Earth, then a background radiation
of some 30,000 times that which would be produced
within the galactic halo would be observed. Evi-
dently, such high fluxes of electrons cannot exist
throughout all of space. One percent of such a flux
of electrons can be expected to give a backround of
X-rays and gamma rays which fits the observations
very nicely.
However, perhaps the most interesting questions
concerning the celestial X-rays have been raised
through the discovery of discrete sources by Rossi and
his colleagues and by H. Friedman, S. Bowyer, T. A.
Chubb, and E. T. Byram of the Naval Research
Laboratory. Both groups have observed a strong
X-ray source in Scorpius which is not coincident with
any conspicuous object. Friedman has suggested thatthis object is a neutron star having a surface tem-
perature of several million degrees, and that the
X-rays are due to thermal emission from the surface
layers. Rossi and his colleagues have determined
from atmospheric absorption measurements that if the
Scorpius source has a thermal spectrum its tempera-
ture is approximately 8 million degrees Kelvin.
Friedman and his colleagues have also observed
X-rays from the direction of the Crab Nebula, the
remnant of the supernova explosion of 1054 A.D.
Neutron stars are hypothetical objects which form
one class of degenerate stars, the other class being
the degenerate white dwarf stars, which are observed.
A typical density for matter in a white dwarf star is
10'; gm/cm:L and the electrons form a degenerate gas
which exerts sufficient pressure to maintain the stars
against further contraction. If mass were to be added
to such a star, the central region would have to be-
come denser in order to supply the additional pressurerequired to support the additional mass. There is a
relativistic upper limit to the mass of white dwarf

DISCOVERIES FROM SPACE EXPLORATION 121
stars, but before this limit is reached the energies of
the degenerate electrons have become so high that
the nuclei are forced to undergo multiple electron
capture reactions, and the nuclei dissolve mainly into
neutrons, with only enough protons and electrons left
to prevent the neutrons from undergoing their usual
mode of decay into electrons and protons.
At 1015 gm/cm 3 or more, densities comparable tothose in the atomic nucleus, this neutron-rich nuclear
matter itself becomes degenerate, and it is expectedthat stable stars could be constructed of it. Such
stars may be formed in the central regions of more
massive stars when these stars undergo supernova
explosions and blow off most of their mass. Recent
work by D. Morton, E. E. Salpeter, H. Y. Chiu,S. Tsuruta, and A. G. W. Cameron indicates that the
surface temperature of a neutron star is likely to lie
between one and two orders of magnitude below its
central temperature. Thus, if such stars are formed
with central temperatures over 100 degrees Kelvin, as
would be likely in a supernova explosion, then their
surface temperatures are likely to be many millions
of degrees for several thousand years.
If these speculations are correct, it is to be expectedthat several dozen neutron stars can be detected in
our galaxy as X-ray astronomy improves its tech-
niques. The neutron-star hypothesis predicts a spe-
cific thermal shape for the X-ray spectrum of the
Scorpius source, with the possibility that the com-
position of the surface will be revealed by character-
istic absorption edges. It should not be long before
decisive tests of this hypothesis have been made.