MSIP 5 Performance Standards 4 - Missouri Department of
32
Department of Elementary and Secondary Education March 4, 2013 MSIP 5 Performance Standards 1 1 MSIP 5 Performance Standards Webinar Series 2 f 2 2 of 2 Missouri Department of Elementary and Secondary Education March 4, 2013
Transcript of MSIP 5 Performance Standards 4 - Missouri Department of

Department of Elementary and Secondary Education
March 4, 2013
MSIP 5 Performance Standards 1
1
MSIP 5Performance Standards
Webinar Series 2 f 22 of 2
Missouri Departmentof Elementary and Secondary EducationMarch 4, 2013

Department of Elementary and Secondary Education
March 4, 2013
MSIP 5 Performance Standards 2
1. Academic Achievement
Performance Standards3
2. Subgroup Achievement
3. College and Career Readiness (CCR) (K‐12 only)
or
3. High School Readiness (HSR) (K‐8 only)
4. Attendance Rate
5. Graduation Rate (K‐12 only)
MSIP 5 Standards 3 and 4
Multiple MeasuresSt t
4
Status
Progress
Goal Be in the top 10 performing states by 2020

Department of Elementary and Secondary Education
March 4, 2013
MSIP 5 Performance Standards 3
MSIP 5 Status Targets
2020 Target – represents a level of performance approximately equivalent to the projected 2020 performance of the top 10 states on the corresponding
5
NAEP exam OR, in subjects for which state‐by‐state NAEP data are unavailable, an equally rigorous target.
On Track—represents a level of performance about equal to 75% proficient by year 2020. Current performance is compared to this target, then a linear trajectory is created that requires equal annual progress increments to reach the 2020 target.
Approaching—represents a level of performance about equal to 100% Basic if each score at the Basic level yields 300 pts.
Floor—represents a level of performance less than 100% Basic
3. (K-12 only) College and Career Readiness (CCR) – The district provides adequate post-secondary preparation for all students.
1. The percent of graduates who scored at or above the state standard on any department‐approved measure(s) of college and career‐readiness, for example, ACT®, SAT®, COMPASS® or Armed Services Vocational Aptitude Battery (ASVAB), meets or exceeds the state standard or d i d i
6
demonstrates required improvement.
2. The district’s average composite score(s) on any department‐approved measure(s) of college and career readiness, for example, ACT®, SAT®, COMPASS® or Armed Services Vocational Aptitude Battery (ASVAB), meets or exceeds the state standard or demonstrate(s) required improvement.
3. The percent of graduates who participated in any department‐approved measure(s) of college and career readiness, for example, ACT®, SAT®, COMPASS® or Armed Services Vocational Aptitude Battery (ASVAB), meets or exceeds the state standard or demonstrates required improvement.
4. The percent of graduates who earned a qualifying score on an Advanced Placement (AP), International Baccalaureate (IB), or Technical Skills Attainment (TSA) assessments and/or
i ll di h h l ll d l ll d d l direceive college credit through early college. dual enrollment, or approved dual credit courses meets or exceeds the state standard or demonstrates required improvement.
5. The percent of graduates who attend post‐secondary education/training or are in the military within six (6) months of graduating meets the state standard or demonstrates required improvement.
6. The percent of graduates who complete career education programs approved by the department and are placed in occupations directly related to their training, continue their education, or are in the military within six (6) months of graduating meets the state standard or demonstrates required improvement,

Department of Elementary and Secondary Education
March 4, 2013
MSIP 5 Performance Standards 4
College and Career Readiness *1-67
Academic A hi t
CCR *1‐3 CCR *4 CCR *5‐6 TotalAchievement
Status 2020 Target = 10On Track = 7.5Approaching = 6Floor = 0
2020 Target = 10On Track = 7.5Approaching = 6Floor = 0
2020 Target = 10On Track = 7.5Approaching = 6Floor = 0
Progress Exceeding = 7.5On Track = 4
Exceeding = 7.5On Track = 4
Exceeding = 7.5On Track = 4On Track 4
Approaching = 2Floor = 0
On Track 4Approaching = 2Floor = 0
On Track 4Approaching = 2Floor = 0
PointsPossible
10 10 10 30
Standard 3 CCR *1- 68
Graduate File
d l d C Unduplicated Count
Highest Score where applicable
No Full Academic Year (FAY)

Department of Elementary and Secondary Education
March 4, 2013
MSIP 5 Performance Standards 5
CCR *1-3
The number of graduates is based on June Enrollment and Attendance Records with an Exit
9
Enrollment and Attendance Records with an Exit Code indicating the student graduated.
Example District A: Number of graduates = 155
CCR *1-3
d i i i l
10
Student Weight
ACT Composite Score
SAT Critical Reading + SAT Math COMPASS ASVAB AFQT
0No record of participation
No record of participation
No record of participationNo record of participation
0.25 < 18 < 870
Algebra < 66 and Reading < 81 OR Algebra < 66 and No Reading Score ORReading < 81 and No
< 30g
Algebra Score
0.75 18 ‐ 21 870 ‐ 980Algebra >= 66 OR Reading
>= 8130 ‐ 62
1 22 ‐ 25 990 ‐ 1180Algebra >= 66 ANDReading >= 81
63‐87
1.25 26 ‐ 36 1190 ‐ 1600 n/a 88‐99

Department of Elementary and Secondary Education
March 4, 2013
MSIP 5 Performance Standards 6
UNDUPLICATED Count Calculation
a) number of graduates who score at or above a 26 on the ACT® or who demonstrate comparable performance on a department‐approved measure multiplied by 1.25
a) 18 x 1.25 = 22.5 22.5
b) number of graduates who score at or above a 22 on the ACT® but below a 26 or who demonstrate comparable performance on a department‐approved measure multiplied
b) 43 x 1 = 43 43
p p pp pby 1
c) number of graduates who score at or above an 18 on the ACT® but below 22 or who demonstrate comparable performance on a department‐approved measure multiplied by .75
c) 52 x .75 = 39 39
d) number of graduates who participate in a department approved measure of college and career readiness but score below comparable performance of an 18 on the ACT® multiplied by 25
d) 23 x .25 = 5.75 5.75
multiplied by .25
e) number of graduates without a score multiplied by zero e) 19 x 0 = 0 0
Example District A: Number of graduates scoring at or above the state standard 22.5 + 43 + 39 + 5.75+ 0 = 110.25
CCR *1-3 Status12
STEP 2‐ Divide the number of points earned by the number of S v de t e u be o po ts ea ed by t e u be ograduates and multiply by 100.
Add the scores for Years 1, 2 and 3 and divide by 3 to determine the status.
Points Earned
No. of Graduates
Percent
110.25 / 155 = .711 x 100 71.1%
, y
Year 1 Year 2 Year 3 3 Year Total
3 Year Average
58.7 64.4 71.1 = 194.2 / 3 64.7%

Department of Elementary and Secondary Education
March 4, 2013
MSIP 5 Performance Standards 7
CCR *1-3 Status Points 13
StatusStatus
Status
Measures
Status
Points Earned
Percent of graduates
scoring at or above the
state standard
2020 Target 10 71.5‐100%
On Track 7.5 59.9‐71.4%On Track 7.5 59.9 71.4%
Approaching 6 40.0‐ 59.8%
Floor 0 0.0‐39.9%
CCR *1-3 Progress – Rolling Average
Year 1 Year 2 Year3
14
STEP 1 – Add the scores for Years 1 and 2 and divide by 2 to determine the average. (58.7 + 64.4) / 2 = 61.6
STEP 2 ‐ The average for Years 1 and 2 is subtracted from 100 to determine the CCR*1‐3 GAP.
Percent 58.7 64.4 71.1
Constant Year 1 and 2 Average
Gap
100 ‐ 61.6 = 38.4

Department of Elementary and Secondary Education
March 4, 2013
MSIP 5 Performance Standards 8
CCR *1-3 Progress – Rolling Average
Year 1 Year 2 Year 3
Percent 58 7 64 4 71 1
15
STEP 3‐ The CCR*1‐3 Gap is used to establish progress targets as determined by multiplying the gap by the associated percentage, i.e. 25% for exceeding, 15% for on track, 5% for approaching.
Percent 58.7 64.4 71.1
CCR *1‐3 Gap
Percent Increase N d d
Years 1 and 2 Average
Years 2 and 3 Average Progress Targetp
Neededg g g
Exceeding 38.4 *25%=
9.6 61.6 71.2‐100
On Track 38.4 *15%=
5.8 61.6 67.4‐71.1
Approaching 38.4 *5%=
1.9 61.6 63.5‐67.3
CCR *1-3 Progress – Rolling Average
Year 1 Year 2 Year 3
Percent 58.7 64.4 71.1
16
STEP 4 – Add the scores for Years 2 and 3 and divide by 2 to determine the average. (64.4 + 71.1) / 2 = 67.8
STEP 5 ‐ The LEA’s Years 2 and 3 average is used to determine if the LEA is exceeding, on track, or approaching the required increase. In this example, Year 2 and 3 average is 67.8, which means that it designated as “on track” with the progress target.
PercentCCR *1‐3 Gap
Percent Increase Needed
Years 1 and 2 Average
Years 2 and 3 AverageProgress Target
Exceeding 38.4 *25%=
9.6 61.6 71.2‐100
On Track 38.4 *15%=
5.8 61.6 67.4‐71.1
Approaching 38.4 *5%=
1.9 61.6 63.5‐67.3

Department of Elementary and Secondary Education
March 4, 2013
MSIP 5 Performance Standards 9
CCR *1-3 Progress Points
Progress
17
Progress
Measures
Progress Points
Earned
Progress Measure
Description
Exceeding 7.525% of CCR*1‐3 Gap
increase
On Track 415% of CCR*1‐3 Gap
increase
fApproaching 2
5% of CCR*1‐3 Gap
increase
Floor 0<5% of CCR*1‐3 Gap
increase
CCR *4
The percent of graduates who earned a qualifying score on the AP IB or a Department
18
qualifying score on the AP, IB or a Department recognized Technical Skills Attainment (TSA) / Industry Recognized Credential /Certificate (IRC) assessments and/or received college credit through early college, dual enrollment, or approved dual credit courses is determined byapproved dual credit courses is determined by dividing the number of graduates scoring or earning a qualifying score by the number of graduates, then multiplying by 100.

Department of Elementary and Secondary Education
March 4, 2013
MSIP 5 Performance Standards 10
CCR *4
The number of graduates is based on June Enrollment and Attendance Records with an Exit
19
Enrollment and Attendance Records with an Exit Code indicating the student graduated.
When possible – data reported by official testing companies for scores on department‐approved measures
CCR *420
companies for scores on department approved measures of college and career readiness will be used in these calculations.
When students take multiple types of tests and/or a single test multiple times or earn multiple credits, the highest score is used for the APR calculation.
SY 2012‐2013 is the first year data is collected for IRC/TSA field
Department of Elementary and Secondary Education
March 4, 2013
MSIP 5 Performance Standards 11
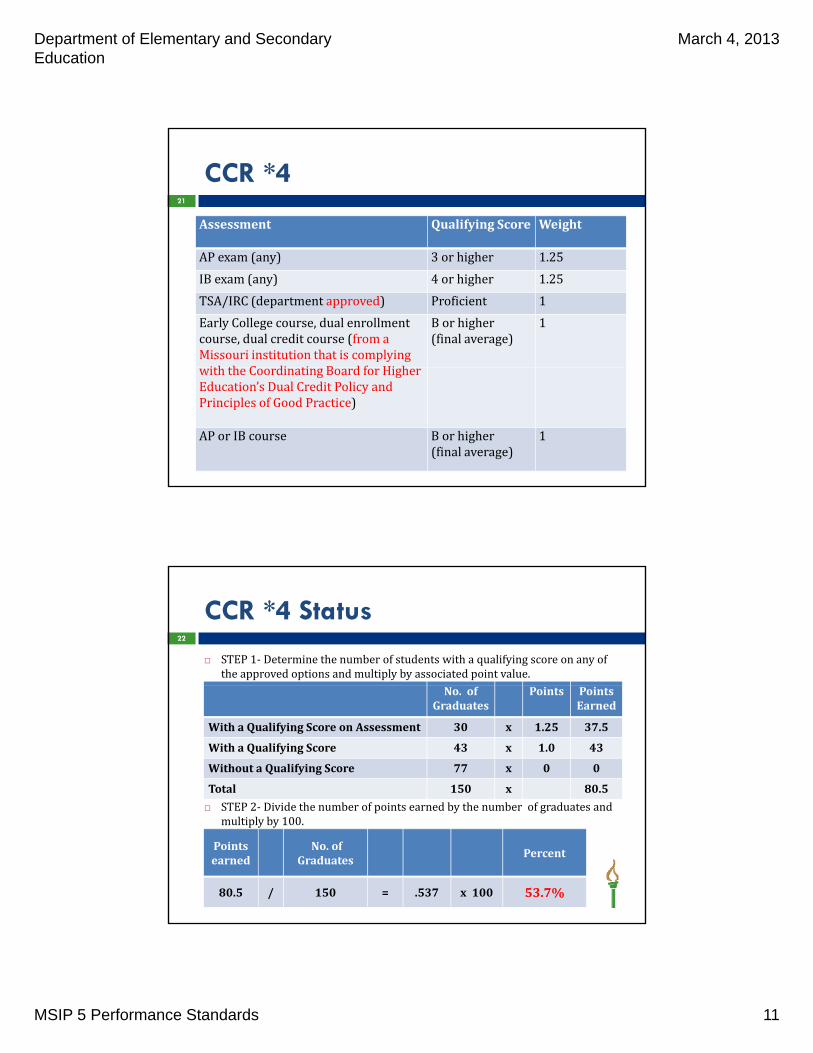
CCR *421
Assessment Qualifying Score Weight
AP exam (any) 3 or higher 1.25
IB exam (any) 4 or higher 1.25
TSA/IRC (department approved) Proficient 1
Early College course, dual enrollment course, dual credit course (from a Missouri institution that is complying ith th C di ti B d f Hi h
B or higher (final average)
1
with the Coordinating Board for Higher Education’s Dual Credit Policy and Principles of Good Practice)
AP or IB course B or higher (final average)
1
CCR *4 Status22
STEP 1‐ Determine the number of students with a qualifying score on any of the approved options and multiply by associated point value.
STEP 2 Di id th b f i t d b th b f d t d
No. of Graduates
Points Points Earned
With a Qualifying Score on Assessment 30 x 1.25 37.5
With a Qualifying Score 43 x 1.0 43
Without a Qualifying Score 77 x 0 0
Total 150 x 80.5
STEP 2‐ Divide the number of points earned by the number of graduates and multiply by 100.
Points earned
No. of Graduates
Percent
80.5 / 150 = .537 x 100 53.7%

Department of Elementary and Secondary Education
March 4, 2013
MSIP 5 Performance Standards 12
CCR *4 Status23
Add the scores for Years 1, 2 and 3 and divide by 3 to determine the status.determine the status.
Year 1 Year 2 Year 3 3 Year Total
3 Year Average
58.9 63.2 53.7 = 175.8 / 3 58.6
CCR *4 Status Points
Status
24
Status MeasuresStatus
Points Earned
Percent of graduates
earning a qualifying
score
2020 Target 10 47.8‐100%
k 5On Track 7.5 37.3‐47.7%
Approaching 6 5.0%‐37.2%
Floor 0 0.0‐4.9%

Department of Elementary and Secondary Education
March 4, 2013
MSIP 5 Performance Standards 13
CCR *4 Progress – Rolling Average
Year 1 Year 2 Year 3
Percent 58 9 63 2 53 7
25
STEP 1 – Add the scores for Years 1 and 2 and divide by 2 to determine the average. (58.9 + 63.2) / 2 = 61.1
STEP 2 ‐ The average for Years 1 and 2 is subtracted from 100 to determine the CCR*4 Gap.
Percent 58.9 63.2 53.7
Constant Year 1 and 2 Average
CCR*4 Gap
100 ‐ 61.1 = 38.9
CCR *4 Progress – Rolling Average
Year 1 Year 2 Year 3
Percent 58 9 63 2 53 7
26
STEP 3‐ The CCR*4 Gap is used to establish progress targets as determined by multiplying the gap by the associated percentage, i.e. 25% for exceeding, 15% for on track, 5% for approaching.
Percent 58.9 63.2 53.7
CCR *4Gap
Percent Increase
Years 1 and 2 Average
Years 2 and 3 Average Progress TargetGap
NeededAverage Progress Target
Exceeding 38.9 *25%=
9.7 61.1 70.8‐100
On Track 38.9 *15%=
5.8 61.1 66.9‐70.7
Approaching 38.9 *5%=
1.9 61.1 63.0‐66.8

Department of Elementary and Secondary Education
March 4, 2013
MSIP 5 Performance Standards 14
CCR *4 Progress – Rolling Average
Year 1 Year 2 Year 3
Percent 58.9 63.2 53.7
27
STEP 4 – Add the scores for Years 2 and 3 and divide by 2 to determine the average. (63.2 + 53.7) / 2 = 58.5
STEP 5 ‐ The LEA’s Years 2 and 3 average is used to determine if the LEA is exceeding, on track, or approaching the required increase. In this example, Year 2 and 3 average is 58.5, which means that it will not earn points for the CCR*4 progress target.
CCR *4Gap
Percent Increase Needed
Years 1 and 2 Average
Years 2 and 3 AverageProgress Target
Exceeding 38.9 *25% = 9.7 61.1 70.8‐100
On Track 38.9 *15% = 5.8 61.1 66.9‐70.7
Approaching 38.9 *5% = 1.9 61.1 63.0‐66.8
CCR *4 Progress
Progress
28
Progress
Measures
Progress Points
Earned
Progress Measure
Description
Exceeding 7.525% of CCR*4 Gap
increase
On Track 415% of CCR*4 Gap
increaseincrease
Approaching 25% of CCR*4 Gap
increase
Floor 0<5% of CCR*4 Gap
increase

Department of Elementary and Secondary Education
March 4, 2013
MSIP 5 Performance Standards 15
CCR *5-6
The percent of post‐secondary placement is determined by dividing the number of graduates
29
determined by dividing the number of graduates who attend post‐secondary education or training, are in the military, or who complete a Department‐approved Career Education program and are placed in an occupation directly related to their training by the numberdirectly related to their training by the number of graduates, and then multiplying by 100.
CCR *5-6
The number of graduates is based on June Enrollment and Attendance Records with an Exit
30
Enrollment and Attendance Records with an Exit Code indicating the student graduated.

Department of Elementary and Secondary Education
March 4, 2013
MSIP 5 Performance Standards 16
CCR *5-6 Status31
Weight
Number of Graduates who attend post‐secondary education
1.0
Number of Graduates who attend post‐secondary training
1.0
Number of Graduates who are in the military 1.0
Number of Graduates who complete a Department‐approved Career Education Program and are placed in an occupation directly related to their training
1.0
Number of Graduates without recognized placement 0.0
CCR *5-6 Status32
STEP 1‐ Determine the number of students with recognized post‐secondary placement and multiply by associated point value.
No. Grads X Points
Number of Graduates who attend post‐secondary education
147 1.0 147
Number of Graduates who attend post‐secondary training
118 1.0 118
Number of Graduates who are in the military 17 1.0 17
Number of Graduates who complete a Department‐approved Career Education Program and are placed in an occupation directly related to their training
57 1.0 57
Number of Graduates without recognized placement 46 0.0 0
Total 385 0.0 339

Department of Elementary and Secondary Education
March 4, 2013
MSIP 5 Performance Standards 17
CCR *5-6 Status33
STEP 2‐ Divide the number of points earned by the number of graduates and multiply by 100number of graduates and multiply by 100
Points earned
No. of Graduates
Percent
339 / 385 = .881 x 100 88.1%
CCR *5-6 Status34
Add the scores for Years 1, 2 and 3 and divide by 3 to determine the status. (85.0 + 93.2 + 88.1) / 3 = 88.8determine the status. (85.0 + 93.2 + 88.1) / 3 88.8
Year 1 Year 2 Year 3 3 Year Total
3 Year Average
85.0 93.2 88.1 = 266.3 / 3 88.8%

Department of Elementary and Secondary Education
March 4, 2013
MSIP 5 Performance Standards 18
CCR *5-6 Status Points
Status
35
Status
Measures
Status
Points Earned
Percent of post‐
secondary placement
2020 Target 10 90.0‐100%
On Track 7.5 80.0‐89.9%
Approaching 6 70.0‐79.9%
Floor 0 0.0‐69.9%
CCR *5-6 Progress – Rolling Average
Year 1 Year 2 Year 3
Percent 85 0 93 2 88 1
36
STEP 1 – Add the scores for Years 1 and 2 and divide by 2 to determine the average. (85.0 + 93.2) / 2 = 89.1
STEP 2 ‐ The average for Years 1 and 2 is subtracted from 100 to determine the CCR*5‐6 Gap.
Percent 85.0 93.2 88.1
Constant Year 1 and 2 Average
Gap
100 ‐ 89.1 = 10.9

Department of Elementary and Secondary Education
March 4, 2013
MSIP 5 Performance Standards 19
CCR *5-6 Progress – Rolling Average
Year 1 Year 2 Year 3
Percent 85 0 93 2 88 1
37
STEP 3‐ The CCR*5‐6 Gap is used to establish progress targets as determined by multiplying the gap by the associated percentage, i.e. 25% for exceeding, 15% for on track, 5% for approaching.
Percent 85.0 93.2 88.1
CCR *5‐6 Gap
Percent Increase
Years 1 and 2 Average
Years 2 and 3 Average Progress TargetGap
NeededAverage Progress Target
Exceeding 10.9 *25%=
2.7 89.1 91.8‐100
On Track 10.9 *15%=
1.6 89.1 90.7‐91.7
Approaching 10.9 *5%=
.5 89.1 89.6‐90.6
CCR *5-6 Progress – Rolling Average
Year 1 Year 2 Year 3
Percent 85.0 93.2 88.1
38
STEP 4 – Add the scores for Years 2 and 3 and divide by 2 to determine the average. (93.2 + 88.1) / 2 = 90.7
STEP 5 ‐ The LEA’s Years 2 and 3 average is used to determine if the LEA is exceeding, on track, or approaching the required increase. In this example, Year 2 and 3 average is 90.7, which means that the LEA is “on track” with its progress target.
PercentCCR *5‐6 Gap
Percent Increase Needed
Years 1 and 2 Average
Years 2 and 3 Average Progress Target
Exceeding 10.9 *25%=
2.7 89.1 91.8‐100
On Track 10.9 *15%=
1.6 89.1 90.7‐91.7
Approaching 10.9 *5%=
0.5 89.1 89.6‐90.6

Department of Elementary and Secondary Education
March 4, 2013
MSIP 5 Performance Standards 20
CCR *5-6 Progress Points
Progress
P P P i t P M
39
Progress
Measures
Progress Points
Earned
Progress Measure
Description
Exceeding 7.525% of CCR*5‐6 Gap
increase
On Track 415% of CCR*5‐6 Gap
increase
Approaching 25% of CCR*5‐6 Gap
increase
Floor 0<5% of CCR *5‐6 Gap
increase
MSIP 5 Performance Standard 3 HSR
4. High School Readiness (K‐8) ‐ the district provides adequate post elementary preparation for all
40
adequate post elementary preparation for all students. The percent of students who earn a proficient score on one (1) or more of the high school end‐of‐course (EOC) assessments while in elementary school meets or exceeds the state standard or demonstrates required improvement.

Department of Elementary and Secondary Education
March 4, 2013
MSIP 5 Performance Standards 21
HSR
June Enrollment and Attendance ‐ 8th Grade Exiters
41
Exiters
Unduplicated Count
A qualifying score of Proficient or Advanced
No Full Academic Year (FAY)
HSR Status
Year 1 Year 2 Year 3 Status
Number of Grade 8 student
42
Number of Grade 8 student
exiters63 48 56
Number of Grade 8 students who
earned a qualifying score of
proficient or advanced on a MAP
EOC
12 8 15
Percent of Grade 8 student
exiters earning a qualifying score19.0 16.7 26.8 20.8

Department of Elementary and Secondary Education
March 4, 2013
MSIP 5 Performance Standards 22
HSR Status
Year 1 Year 2 Year 3 Status
19.0 16.7 26.8 / 3 20.8
43
/
STATUS
Status MeasuresStatus
Points Earned
Percent of High School
Readiness
2020 Target 10 25 0 1002020 Target 10 25.0‐100
On Track 7.5 19.0‐24.9
Approaching 6 12.0‐18.9
Floor 0 0‐11.9
HSR Rolling Average
Step 1 ‐ Add the scores for Years 1 and 2 and divide by 2 to determine the average and round to the tenth.
44
(19.0 + 16.6) / 2 = 17.8
Step 2‐ The average percentage for Years 1 and 2 is subtracted from 50
Year 1 Year 2 Year 3
19.0 16.7 26.8
p g p gto determine the HSR*1 Gap.
Constant Years 1 and 2 Average
Gap
50 ‐ 17.9 = 32.1

Department of Elementary and Secondary Education
March 4, 2013
MSIP 5 Performance Standards 23
HSR Rolling Average45
Year 1 Year 2 Year 3
19.0 16.7 26.8
HSR Gap
Percent Increase Needed
Years 1 and 2 Average
Years 2 and 3 Average Progress Target
Step 3 ‐ The high school readiness gap is used to establish progress targets as determined by multiplying the high school readiness gap by the associated percentage, i.e. 25% for exceeding, 15% for on track, 5% for approaching.
g
Exceeding 32.1 *25%=
8.0 17.8 25.8‐100
On Track 32.1 *15%=
4.8 17.8 22.6‐ 25.7
Approaching 32.1 *5%=
1.6 17.8 19.5‐22.5
HSR Rolling Average46
Year 1 Year 2 Year 3
19.0 16.7 26.8
HSR Percent Increase Years 1 and 2 Years 2 and 3 Average
Step 4‐ Add the scores for Years 2 and 3 and divide by 2 to determine the average round to the tenth.
(16.7 + 26.8) / 2 = 21.8
Step 5 ‐ The district’s Years 2 and 3 average percentage is used to determine if the district is exceeding, on track, or approaching the required percent increase. In this example, the ABC school district has a Year 2 and 3 average percentage of 18.7, which means that it designated as “approaching” the progress target and subsequently receives 2 points as its Progress Score in HSR .
Gap Needed AverageAverage
Progress Target
Exceeding 32.2 *25%=
8.1 17.8 25.9‐100
On Track 32.2 *15%=
4.8 17.8 22.6‐ 25.8
Approaching 32.2 *5%=
1.6 17.8 19.4‐22.5

Department of Elementary and Secondary Education
March 4, 2013
MSIP 5 Performance Standards 24
HSR Progress
Rolling Average
47
Progress
Exceeding 7.5
On Track 4
Approaching 2
Floor 0
Attendance Rate—The district ensures all students regularly attend school.
MSIP 5 Performance Standards 448
regularly attend school.
1. The percent of students who regularly attend school meets or exceeds the state standard or demonstrates required improvement. The calculation is based on 90% of the students attending 90% of the time.

Department of Elementary and Secondary Education
March 4, 2013
MSIP 5 Performance Standards 25
Attendance
Hours of attendance and hours of absence for EACH student is reported in the June MOSIS Student enrollment
49
student is reported in the June MOSIS Student enrollment and attendance.
Attendance hours + hours of absence = Total Hours Enrolled
(Hours of attendance / Total Hours Enrolled) * 100 = Individual Student Attendance Rate
C l l d i i h i i LEA Calculated in proportion to the time in LEA
Attendance rate is determined for all K‐12 students.
Students with zero hours of attendance are excluded.
Students reported as Resident I, Non‐Resident, DESEG‐In, Federal Lands, and Parent Tuition are included
Explanations of Calculations Examples of Data Examples of Calculations
1) The hours of attendance and the
hours of absence for each studentAttendance Hours
Attendance: Student Enrolled Less than a Year50
hours of absence for each student
are reported in the MOSIS June
Student Enrollment and Attendance.
a) Hours of attendance = 249
b) Hours of absence = 30
2) The total hours enrolled for the
individual student is determined by
the sum of reported hours of
attendance + hours of absence
249+30=279
3) The attendance rate of the
individual student using the
“hours of absence” method is
determined by dividing the hours of
attendance for the individual
student by the total hours enrolled
a) Hours of attendance = 249
b) Total hours enrolled = 279
249 ÷ 279 = .893
.893 X 100 = 89.3%
student by the total hours enrolled
for the individual student, then
multiplying by 100 rounded to the
tenth.
4) The total calendar hours are
reported on Core Data Screen 10a) Total calendar hours = 1,062
5) Each student’s proportional weight
of attendance is determined by the
total hours enrolled divided by the
total calendar hours rounded to the
thousandth.
a) Hours of attendance = 249
b) Hours of absence = 30
c) Calendar hours as reported on Core
Data Screen 10 = 1,062
249 + 30 = 279
279 ÷ 1,062 = 0.263

Department of Elementary and Secondary Education
March 4, 2013
MSIP 5 Performance Standards 26
Proportional Attendance Rate
Explanations of Calculations Examples of Data Examples of Calculations
1) Any student with an attendance rate
equal to or greater than 90% isAttendance Hours
51
equal to or greater than 90% is
included in the numerator and the
denominator. Any student with an
attendance rate less than 90% is
included in the denominator only.
a) Attendance Rate ≥ 90% = numerator
b) All Students = denominator
2) Example: student one is in attendance
over 90% with a proportional weight
of 1.0. Student two is in attendance
less than 90% with a proportional
weight of 0.263.
a) Numerator = 1.0 + 0
b) Denominator = 1.0 + 0.2631.0 + 0 = 1.0
1.0 + 0.263 = 1.263
3) The percent of students with an
attendance rate at or above the state
standard is determined by dividingstandard is determined by dividing
the “proportion” of students scoring
at or above the state standard by the
“proportion” of students attendance
that year, and then multiplying by
100 rounded to the tenth.
1.0 ÷ 1.263 = 0.792
0.792 X 100 = 79.2%
4) The district’s or school’s Status is
determined by adding Year1, Year2,
and Year3 of the percent of students
with an attendance rate at or
above the state standard.
(Year1 + Year2 + Year3) / 3
79.2 + 87.3+ 88.9 = 255.4
255.4 ÷ 3 = 85.1%
Attendance Progress – Rolling Average
Year 1 Year 2 Year 3
Percent 79 2 87 3 88 9
52
STEP 1 – Add the scores for Years 1 and 2 and divide by 2 to determine the average. (79.2 + 87.3) / 2 = 83.3
Percent 79.2 87.3 88.9

Department of Elementary and Secondary Education
March 4, 2013
MSIP 5 Performance Standards 27
Attendance Progress – Rolling Average
STEP 2‐ The Year 1 and Year 2 average is used to establish progress targets as determined by increasing the rate by the associated
53
percentage, i.e. 3% for exceeding, 2% for on track, 1% for approaching.
Years 1 and 2 Average
Percent IncreaseNeeded
Years 2 and 3 Average Progress
Target
Exceeding 83.3 3.0% = 2.5 85.8 ‐100
On Track 83.3 2.0% = 1.7 85.0 ‐85.7
Approaching 83.3 1.0% = .8 84.1 ‐84.9
Attendance Progress – Rolling Average
Year 1 Year 2 Year 3
Percent 79 2 87 3 88 9
54
STEP 3 – Add the scores for Years 2 and 3 and divide by 2 to determine the average. (87.3 + 88.9) / 2 = 88.1
Percent 79.2 87.3 88.9
Years 1 and 2 Average
Percent IncreaseNeeded
Years 2 and 3 AverageProgress
NeededTarget
Exceeding 83.3 3.0% = 2.5 85.8 ‐100
On Track 83.3 2.0% = 1.7 85.0 ‐85.7
Approaching 83.3 1.0% = .8 84.1 ‐84.9

Department of Elementary and Secondary Education
March 4, 2013
MSIP 5 Performance Standards 28
Attendance55
STATUS PROGRESS
Status Measures
StatusPoints Earned
Percent of students
attending 90% of time
Progress Measures
Progress Points Earned
Progress Measure
Description
2020 Target 10 90.0‐100 Exceeding 7.5 3% increase
On Track 7.5 85.0‐89.9 On Track 4 2% increase
Approaching 6 80.0‐84.9 Approaching 2 1% increase
Floor 0 0‐79.9 Floor 0 <1% increase
Attendance Total: Status + Progress A maximum of 10 points may be applied to the LEA or building level score.
Reports for Standards 3&4
MSIP 5 Navigation Page (MCDS Portal – Accountability ‐Accountability Reports – MSIP 5)
56
ccou tab ty epo ts S 5)
All reports by District/LEA level and Building levels
Level 1 – Summary Reports Summary Report Annual Performance Report
Level 2 and 3 – Supporting Data Reports Supporting Data Report
Level 4 and 5 Supporting Detail Reportspp g p Standard 3 – CCR Indicators 1‐3 (ACT, SAT, COMPASS, ASVAB)
Standard 3 – CCR Indicator 4 (AP, IB, Dual Credit/Enrollment, TSA)
Standard 3 – CCR Indicators 5&6 (Post secondary Follow‐Up)
Standard 3 – High School Readiness
Standard 4 – Attendance Rate

Department of Elementary and Secondary Education
March 4, 2013
MSIP 5 Performance Standards 29
Accountability Data Reporting
Data correction deadline is March 19th at 5:00 pm for the March release
58
pm for the March release
LND Rate vs. Participation Rate – difference
Algebra I – A+ Retesters
Appeals – Types and How to Handle
Data Quality ChecksQ y

Department of Elementary and Secondary Education
March 4, 2013
MSIP 5 Performance Standards 30
Accountability Data Reporting
MOSIS Submissions that impact MSIP 5 APR:
O b S d C
59
October Student Core
October Course & Assignment
February Student Graduate Follow‐Up
April Student Core
June Enrollment & Attendance
June Course Completion
June ID Cleanup
EOC Exception Collection
Changes to March 2012 Draft APR
Status and Progress Titles
h d l A d
60
Weighted Proportional Attendance Rate
6‐Year & 7‐Year Graduation Rate
Revised Cut Scores

Department of Elementary and Secondary Education
March 4, 2013
MSIP 5 Performance Standards 31
Guidance Document
Appendix
M i f A i l E i l CCR *1 3
61
Matrix of Approximately Equivalent CCR *1‐3 Assessment Scores
Missouri institutions complying with the Coordinating Board for Higher Education’s Dual Credit Policy and Principles of Good Practice for Dual Credit Courses
Approved Technical Skills Attainment (TSA) Assessments
Accreditation Levels
Accredited with Distinction >90% of points + other criteria as determined
62
other criteria as determined
Accredited >70% of points
Provisional >50% to 69.9% of points
Unaccredited < 50% of points

Department of Elementary and Secondary Education
March 4, 2013
MSIP 5 Performance Standards 32
Transition into MSIP 5
Assessment Data
APR release Classification
63
Data
2011‐2012 4th Cycle MSIP ‐ 2012 APR (summer 2012)
Board Classification for all remaining 4th Cycle districts
2011‐2012 MSIP 5 ‐ 2012 APR(fall 2012)
Draft MSIP 5
2012‐2013 MSIP 5 ‐ 2013 APR (summer 2013)
Year 1 MSIP 5 Year 1 APR(summer 2013) APR
2013‐2014 MSIP 5 ‐ 2014 APR (summer 2014)
Year 2 MSIP 5 Year 2 APR
2014‐2015 MSIP 5 ‐ 2015 APR (summer 2015)
Year 3 MSIP 5Board Classification for all districts based on MSIP 5
Year 3APR
Office of Quality Schools 573‐751‐4426
Jocelyn Strand Coordinator jocelyn strand@dese mo govJocelyn Strand, Coordinator [email protected]
Melissa Hensley, Director [email protected]
Cathi Rust, Supervisor [email protected]
Office of Data SystemsManagement 573‐522‐3207
Jason Young, Coordinator [email protected]
Janet Duncan Assistant Director janet duncan@dese mo govJanet Duncan, Assistant Director [email protected]
Office of College and Career Readiness 573‐751‐3545
Kristie Davis, Supervisor
Drew Linkon, Assistant Director