MSc Martin Fosse Wired Drill Pipe Technology Technical and ...
65
Transcript of MSc Martin Fosse Wired Drill Pipe Technology Technical and ...


2| P a g e
The Author intentionally left this page blank

3| P a g e
Abstract
The author have designed this thesis to give the reader detailed knowledge about wired drill pipe
technology (WDP technology). Focusing on providing the reader with unbiased examples and explanations
have been of top priority. The optimal result being that the reader will be able to, with only little or none
prior knowledge about WDP technology, fully understand the WDP technology’s economics and technical
aspects.
Wired drill pipe technology (WDP technology) is becoming more and more known to the oil industry. WDP
provides wired communication with downhole tools, instead of conventional wireless communicating-
methods like mud pulse telemetry (MPT) and electromagnetic telemetry (EMT). Up to this point, this new
and sophisticated technology have been used to drill more than 120 wells worldwide. The technology
have been around for some time, but have in later years gained more attention from oil companies,
especially the companies regularly drilling highly challenging fields.
This thesis gives a close examination of all the technical parts of the technology. Looks closer upon the
transmission speed. How the telemetry works and the route between surface equipment and all the way
down to the bottom hole assembly (BHA). The thesis also closely examines the economics of the
technology and relate this to the cost of drilling operations offshore in the North Sea.
New technology provide new possibilities, but they often tend to have a steep price tag. This thesis
examines if the additional cost of wired pipe is worth the investment. It also provides calculations from
two different example-wells, and the results from these calculations clearly states the cost of WDP.
The use of WDP technology provide multiple new options in regards of communication with different
sensors. Since there now is a constant dataflow, from the drill floor and down to downhole tools, you
have the opportunity to place sensors along the string. These sensors are more commonly known as Along
String Measurements or ASMs for short. The ASMs will play an important role within the development of
automated drilling rigs. The combination of wired drill pipe network, the ASMs and automated drilling
computers are closer examined as well.
The WDP technology is not only saving time during the drilling operation, but it also makes the drilling
operation safer for the personnel involved. The technology shows strong resilience, but still have a few
weak spots that needs further improvement.

4| P a g e
Acknowledgement
The author would like to give a special thanks to the following individuals, which have provided
information, guidance and great advice along the process of writing this thesis.
For their professional insight, willingness to help and positive feedback I am grateful.
Listed in alphabetical order:
Atle Øglend Associate Professor at UiS. My Academic Supervisor on the thesis.
Marcelo Hernandez Network Field Specialist at NOV IntelliServ.
Reina Teelken Senior Technical Advisor at NOV IntelliServ.
Steven Williams Directional Driller at Baker Hughes.

5| P a g e
Table of Contents
Abstract ......................................................................................................................................................... 3
Acknowledgement ........................................................................................................................................ 4
Table of Contents .......................................................................................................................................... 5
Table of Figures ............................................................................................................................................. 6
Table of Abbreviations, Acronyms and Technical Terms .............................................................................. 7
1. Introduction .......................................................................................................................................... 9
1.1 Aim of the Thesis ......................................................................................................................... 10
1.2 Structure of the Thesis ................................................................................................................ 10
2. Background ......................................................................................................................................... 11
2.1 Petroleum Industry –Brief Historical Summary .......................................................................... 11
2.2 Petroleum Industry – Brief Economic Overview ......................................................................... 12
2.3 Communication with Downhole Tools ........................................................................................ 13
2.4 Challenges Today ........................................................................................................................ 15
3. Technical Specifications and Explanations of WDP Technology ......................................................... 17
3.1 The main advantage of the WDP Technology Network .............................................................. 17
3.2 A quick overview of the complete WDP Technology Network ................................................... 18
3.3 The Vital Components of the WDP Technology Network ........................................................... 19
3.3.1 The NetCon and Surface Cabling......................................................................................... 20
3.3.2 The Data Swivel ................................................................................................................... 22
3.3.3 The Wired Drill Pipe, the Coil and the Data Cable .............................................................. 24
3.3.4 Data Link.............................................................................................................................. 27
3.3.5 The Interface Sub ................................................................................................................ 29
3.3.6 ASM – Along String Measurement ...................................................................................... 30
4. Economic Viewpoints of WDP Technology – Drilling Operations ....................................................... 31
4.1 Value of Time – Oil Price Fluctuation .......................................................................................... 31
4.2 The Cost of Drilling Operations ................................................................................................... 33
4.3 The Cost of Drill Pipe ................................................................................................................... 35
4.4 Time-Saving - Categorized .......................................................................................................... 37
4.4.1 - Data Transmission ............................................................................................................. 37
4.4.2 - Drilling Performance – ROP .............................................................................................. 38
4.4.3 - Run Reduction ................................................................................................................... 38
6| P a g e
4.4.4 - Hole Cleaning .................................................................................................................... 38
4.4.5 - Trip Speed Optimization ................................................................................................... 38
5. Review, Savings and Discussion – The complete WDP Network ........................................................ 40
5.1 Time-Saving – 5000-meter Production Well ............................................................................... 40
5.2 Time Saving – 2200-meter Exploration Well .............................................................................. 46
5.3 Automated Drilling and ASMs ..................................................................................................... 49
5.4 Discussing Wired Drill Pipe Technology ...................................................................................... 52
6. Summary and Conclusion ................................................................................................................... 56
References .................................................................................................................................................. 57
Appendix ..................................................................................................................................................... 59
A. Wired drill pipe sizes ....................................................................................................................... 59
B. Data Link information ..................................................................................................................... 60
C. Time-Savings – 5000-meter Production Well – Calculator ............................................................. 61
D. Time-Savings – 2200-meter Exploration Well – Calculator ............................................................ 63
E. Rig Cost Calculations – Currency. .................................................................................................... 65
Table of Figures
Figure 1: Mud Pulse Telemetry Vs. Wired Drill Pipe Telemetry (Saenz, 2014) ........................................... 17
Figure 2: The complete wired drill pipe network (IntelliServ N. C., 2015) .................................................. 19
Figure 3: The NetCon (IntelliServ N. C., 2015) ............................................................................................ 20
Figure 4: Surface Cabling - From the NetCon to The Data Swivel ............................................................... 22
Figure 5: Data Swivel mounted in topdrive (IntelliServ N. R., 2015) .......................................................... 23
Figure 6: The Coil and Single Wired Joint (IntelliServ N. , 2014) ................................................................. 24
Figure 7: Double Shoulder Tool Joint (IntelliServ N. , 2014) ....................................................................... 25
Figure 8: Data Link (DrillingContractor, Drilling Contractor - WP content, 2015) ...................................... 27
Figure 9: Data Link -Top and Bottom Radio ................................................................................................ 28
Figure 10: The Interface Sub ....................................................................................................................... 29
Figure 11: Along String Measurements - ASMs .......................................................................................... 30
Figure 12: Europe Brent Oil Price (EIA, 2015) ............................................................................................. 31
Figure 13: The NetCon in use (DrillingContractor, Drilling Contractor - WP content, 2015) ...................... 39
Figure 14: Extended Reach Production well - 5000 meter long ................................................................. 40
Figure 15: Time-Savings Summary | 5000 meter long well (NOV_Intelliserv, 2015) ................................. 44
Figure 16: Short Exploration well - 2200 meter long .................................................................................. 46
Figure 17: Time-Savings Summary | 2200 meter long well (NOV_Intelliserv, 2015) ................................. 48
Figure 18: Automated Drilling (DrillingContractor, Drilling Contractor - WP content, 2015) ..................... 50
7| P a g e
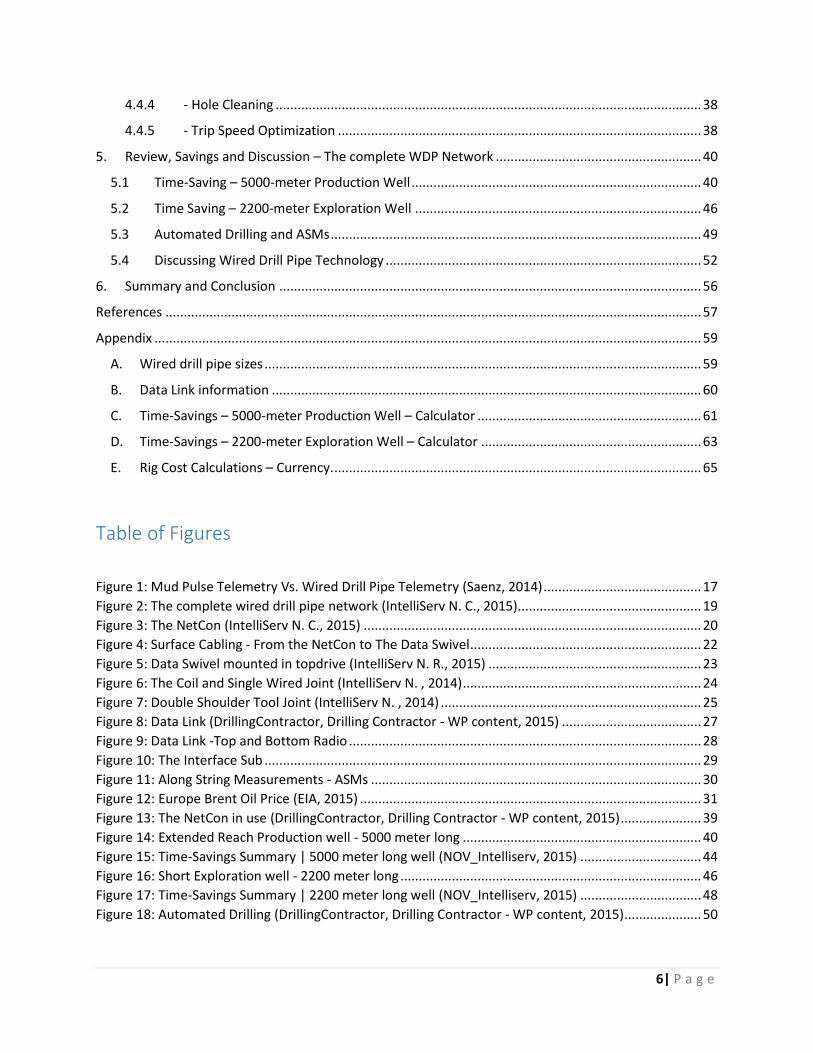
Table of Abbreviations, Acronyms and Technical Terms
Acronym, Abbreviation and Technical Terms
Definition and explanation
AFE Authority of expenditure
ASM Part of the WDP Technology. Along String Measurement – Sensors along the drill string
Backward whirl Drill pipe rotates clockwise - the complete string rotates counter-clockwise
BHA Bottom Hole Assembly. A section of tools/sensors located behind the bit
BIT Drilling bit – always at the end of the drill string
BOP Blowout Preventer – Safety Barrier
Box end The female threaded side of a tool join. Box&Pin makes up a connection.
BPS (as in transfer speed) Bits Per Second
Coil / IntelliCoil Part of the WDP Technology. Making the transferal of data over connections possible.
Data Cable Part of the WDP Technology. An armored coaxial wire, threaded through the inside of the pipe, making wired communication possible.
Data Link / Booster / Transceiver
Part of the WDP Technology. Amplifies signal throughout the drill string
Data Swivel Part of the WDP Technology. Installed in the top drive
DC Drill Collar - heavier and larger OD drill pipe to give weight to bit
Derrick / Drilling Derrick A tall stationary work frame, making it possible to connect stands of 30m to the drill string in slips. Holding racked drill pipe, top drive, piping etc.
DP Drill Pipe - one single joint of drill pipe – approx. 9 meter long
Drift / Drift ID The smallest inner diameter of a given section. I.e. a drill pipe, drill collar etc.
Drill Floor The part of the rig where the roughnecks and the driller work together.
Drill String All components connected. From the uppermost drill pipe to the bit
Driller The person who controls the top drive and drills the well
Drilling rig Construction/Installation used for onshore/offshore drilling
ERD Extended Reach Drilling – long horizontal wells
HSE Health Safety and Environment
HWDP Heavy Weight Drill Pipe. Single joints – but heavier than normal DP
IBOP Internal Blowout Preventer
ID Inner/Internal Diameter
IEU Internal External Upside - The part/section where the ID and OD changes from the “tool joint size” to “normal” ID and OD of the drill pipe.
Interface-sub Part of the WDP Technology. Communicate with 3rd party BHA
JB Junction box. A box that protects cable connections from wear.
KPI Key Performance Indicator
Lag Time The time from an event actually happens until it is effectively noticed
MD Measure Depth – Length of the well path
MSL Mean Sea Level. – often representing depth between drill floor and the MSL
NCS Norwegian Continental Shelf
NetCon Part of the WDP Technology. Network Communicator
NOV National Oilwell Varco
8| P a g e
OD Outer/External diameter
Operator The oil/operating company that own the oil produced. E.g. Statoil, ExxonMobil, BP, etc.
Petroleum A liquid mixture of hydrocarbons, which can be refined into products like gasoline, paraffin and oil.
Pin end The male threaded side of a toll joint. Pin&Box makes up a connection.
POOH/TOH Pull Out Of Hole or Trip Out Of Hole. Pulling pipe out of your well, without rotation or flow
Proactive (proactivity) To act/prepare in advance of a future situation
PWB Printed Wiring Boards. Typically green boards with different communication circuits printed on them.
R&D Research and Development
RIH/TIH Run In Hole or Trip In Hole. Putting drill pipe into your well, without rotation or flow
RKB Rotary Kelly Bushing. Often referred to as start point of your well = 0.0 m
Roughneck Worker assisting the operation. Working under the drillers supervision
RSS Rotary Steerable Assembly – technology used for steering while drilling
Stand A stand is multiple joints of drill pipe connected together. Typically 3 joints of drill pipe are connected, making up a stand of approx. 27 m in length
Stator A stationary component in a rotating system. Using/generating inductance to transfer signals.
SUB An intermediate component making different modifications possible. E.g., “cross over sub” helps to connect drill pipe joints with different sizes.
Surface Cabling Part of the WDP Technology. Connecting the NetCon and Data Swivel
Tool Joint The part of the drill pipe that connects them together with other drill pipe. Often have a bigger OD and a smaller ID to be more robust.
Top Drive Tool/Machine used to rotate the drill string and drill the well
TVD True Vertical Depth – Vertical depth from drill floor to the well path
UPS Uninterrupted Power Supply. Providing stored battery power, during power shutdowns/emergencies.
WDP Wired Drill Pipe. Drill pipe with wired communication throughout
Wildcatter A person with little or none relevant education, going all in to find enough oil to live off of it, for the rest of his/hers life.
WPO/WDPO Wired Drill Pipe Operator. The person running WDP service at the rig site
9| P a g e
1. Introduction
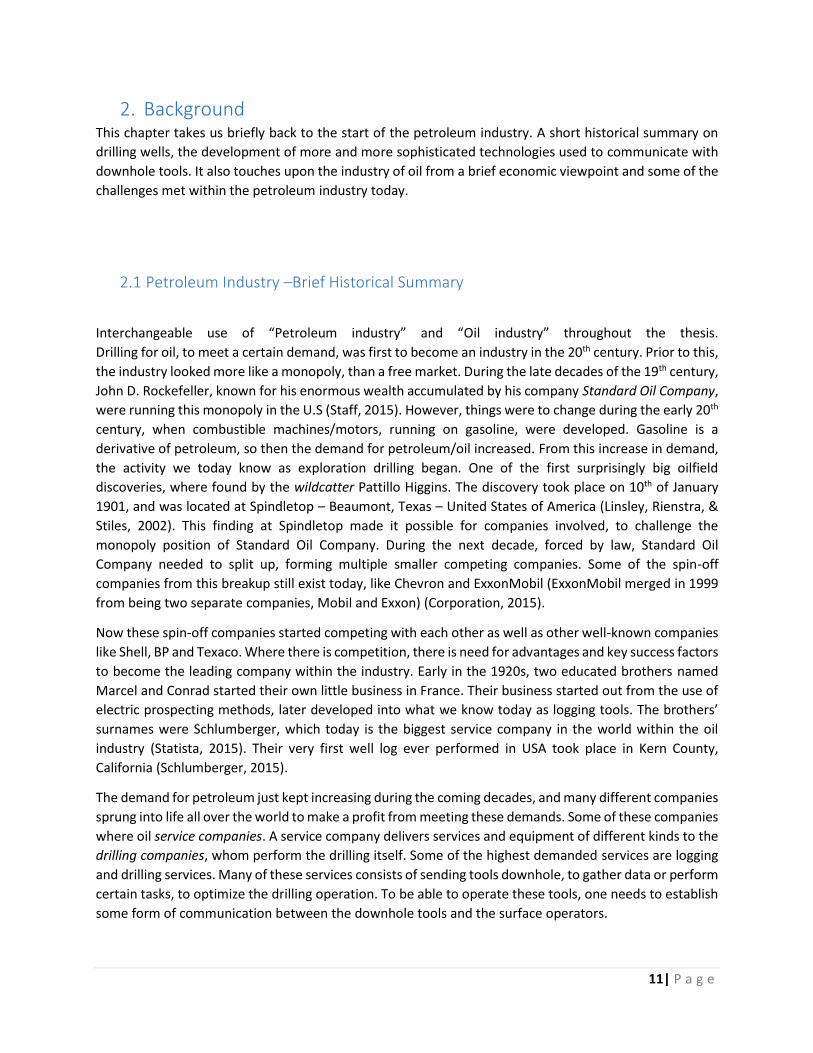
The personal motivation behind writing a thesis on wired drill pipe technology, have grown on me the last
couple of months. After finishing my bachelor degree within petroleum engineering, I started working in
the oil industry myself. Since then, my curiosity for drilling and technology have only increased. When
now being a part of the industry, I look upon the different technologies from completely new perspectives.
During the last decades, there have been some developments/improvements on the different ways of
communicating with downhole tools, but none labeled revolutionary. The development and reliability of
the technology now seems to reach new heights, and that is making it much more interesting. To
implement a new technology to an already fixed industry are often very hard, so to look closer at the
wired drill pipe technology seemed to make a great topic.
Arguments about the tradeoff between cost and opportunity becomes a hot topic whenever new
enhanced technology presents itself. On background of the latter phrase, I thought it would make a very
interesting thesis to look closer upon the technology from both a technical and an economic viewpoint.
During latter years, wired drill pipe technology have become more and more known to the drilling
industry, and I am very excited to follow its future development.

10| P a g e
1.1 Aim of the Thesis
Does Wired Drill Pipe Technology provide enough usable possibilities to make up for its cost?
The thesis will look upon the up-and-coming technology known as wired drill pipe. It will study the
technical aspect of the technology, and the economics of it. It is often challenging to implement new
technology before the industry approves of it.
So what is wired drill pipe technology?
What are the differences between using regular drill pipe and wired drill pipe?
Is wire drill pipe the future of data transmission?
Is wired drill pipe economically beneficial for the user?
Is wired drill pipe just a fancy but not cost-efficient tool for the oil industry, which will not endure into
the future?
The thesis will answer these statements. The thesis explains general and detailed information of WDP
technology, to provide the reader with a competent understanding of what wired drill pipe costs and how
the WDP technology works.
1.2 Structure of the Thesis
This thesis is structured as follows.
Chapter 2 will be giving quick summaries on the history of the oil industry, some economics, how
communications with downhole tools are conventionally performed and challenges met in todays’ oil
industry.
Chapter 3 consists of detailed information about how the WDP technology works and explains the tasks
that belong to each of the different vital components in the network.
Chapter 4 is mainly focused on the economics regarding the use of WDP technology, but it also explains
the cost of a drilling operation, and how the WDP technology contribute to save time.
Chapter 5 consist of two example-wells, to show realistic time-savings, a section on automated drilling
and a discussion on the pros and cons of wired drill pipe technology.
The final conclusion and answer to the aim of the thesis is found in chapter 6.
A table of references is located in the penultimate part of the thesis.
While the appendix are located at the very end of the thesis.
The thesis is designed to give the reader a comprehensive understanding of the WDP technology. Very
specific details on how to troubleshoot the network, what materials are used to assemble different parts,
what programing language is used for the Network Controller and other very fine details are left out.
These limitations are set to enhance the reader’s knowledge, without overburdening the reader with too
much detail.
11| P a g e
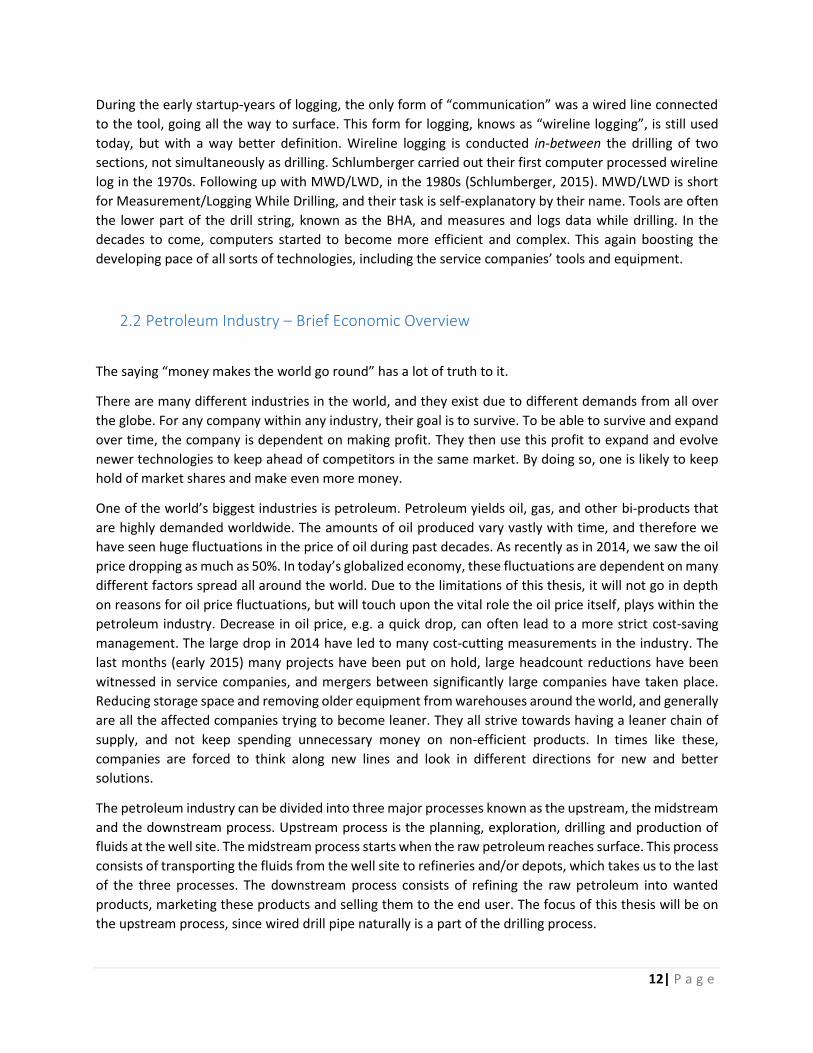
2. Background This chapter takes us briefly back to the start of the petroleum industry. A short historical summary on
drilling wells, the development of more and more sophisticated technologies used to communicate with
downhole tools. It also touches upon the industry of oil from a brief economic viewpoint and some of the
challenges met within the petroleum industry today.
2.1 Petroleum Industry –Brief Historical Summary
Interchangeable use of “Petroleum industry” and “Oil industry” throughout the thesis.
Drilling for oil, to meet a certain demand, was first to become an industry in the 20th century. Prior to this,
the industry looked more like a monopoly, than a free market. During the late decades of the 19th century,
John D. Rockefeller, known for his enormous wealth accumulated by his company Standard Oil Company,
were running this monopoly in the U.S (Staff, 2015). However, things were to change during the early 20th
century, when combustible machines/motors, running on gasoline, were developed. Gasoline is a
derivative of petroleum, so then the demand for petroleum/oil increased. From this increase in demand,
the activity we today know as exploration drilling began. One of the first surprisingly big oilfield
discoveries, where found by the wildcatter Pattillo Higgins. The discovery took place on 10th of January
1901, and was located at Spindletop – Beaumont, Texas – United States of America (Linsley, Rienstra, &
Stiles, 2002). This finding at Spindletop made it possible for companies involved, to challenge the
monopoly position of Standard Oil Company. During the next decade, forced by law, Standard Oil
Company needed to split up, forming multiple smaller competing companies. Some of the spin-off
companies from this breakup still exist today, like Chevron and ExxonMobil (ExxonMobil merged in 1999
from being two separate companies, Mobil and Exxon) (Corporation, 2015).
Now these spin-off companies started competing with each other as well as other well-known companies
like Shell, BP and Texaco. Where there is competition, there is need for advantages and key success factors
to become the leading company within the industry. Early in the 1920s, two educated brothers named
Marcel and Conrad started their own little business in France. Their business started out from the use of
electric prospecting methods, later developed into what we know today as logging tools. The brothers’
surnames were Schlumberger, which today is the biggest service company in the world within the oil
industry (Statista, 2015). Their very first well log ever performed in USA took place in Kern County,
California (Schlumberger, 2015).
The demand for petroleum just kept increasing during the coming decades, and many different companies
sprung into life all over the world to make a profit from meeting these demands. Some of these companies
where oil service companies. A service company delivers services and equipment of different kinds to the
drilling companies, whom perform the drilling itself. Some of the highest demanded services are logging
and drilling services. Many of these services consists of sending tools downhole, to gather data or perform
certain tasks, to optimize the drilling operation. To be able to operate these tools, one needs to establish
some form of communication between the downhole tools and the surface operators.
12| P a g e
During the early startup-years of logging, the only form of “communication” was a wired line connected
to the tool, going all the way to surface. This form for logging, knows as “wireline logging”, is still used
today, but with a way better definition. Wireline logging is conducted in-between the drilling of two
sections, not simultaneously as drilling. Schlumberger carried out their first computer processed wireline
log in the 1970s. Following up with MWD/LWD, in the 1980s (Schlumberger, 2015). MWD/LWD is short
for Measurement/Logging While Drilling, and their task is self-explanatory by their name. Tools are often
the lower part of the drill string, known as the BHA, and measures and logs data while drilling. In the
decades to come, computers started to become more efficient and complex. This again boosting the
developing pace of all sorts of technologies, including the service companies’ tools and equipment.
2.2 Petroleum Industry – Brief Economic Overview
The saying “money makes the world go round” has a lot of truth to it.
There are many different industries in the world, and they exist due to different demands from all over
the globe. For any company within any industry, their goal is to survive. To be able to survive and expand
over time, the company is dependent on making profit. They then use this profit to expand and evolve
newer technologies to keep ahead of competitors in the same market. By doing so, one is likely to keep
hold of market shares and make even more money.
One of the world’s biggest industries is petroleum. Petroleum yields oil, gas, and other bi-products that
are highly demanded worldwide. The amounts of oil produced vary vastly with time, and therefore we
have seen huge fluctuations in the price of oil during past decades. As recently as in 2014, we saw the oil
price dropping as much as 50%. In today’s globalized economy, these fluctuations are dependent on many
different factors spread all around the world. Due to the limitations of this thesis, it will not go in depth
on reasons for oil price fluctuations, but will touch upon the vital role the oil price itself, plays within the
petroleum industry. Decrease in oil price, e.g. a quick drop, can often lead to a more strict cost-saving
management. The large drop in 2014 have led to many cost-cutting measurements in the industry. The
last months (early 2015) many projects have been put on hold, large headcount reductions have been
witnessed in service companies, and mergers between significantly large companies have taken place.
Reducing storage space and removing older equipment from warehouses around the world, and generally
are all the affected companies trying to become leaner. They all strive towards having a leaner chain of
supply, and not keep spending unnecessary money on non-efficient products. In times like these,
companies are forced to think along new lines and look in different directions for new and better
solutions.
The petroleum industry can be divided into three major processes known as the upstream, the midstream
and the downstream process. Upstream process is the planning, exploration, drilling and production of
fluids at the well site. The midstream process starts when the raw petroleum reaches surface. This process
consists of transporting the fluids from the well site to refineries and/or depots, which takes us to the last
of the three processes. The downstream process consists of refining the raw petroleum into wanted
products, marketing these products and selling them to the end user. The focus of this thesis will be on
the upstream process, since wired drill pipe naturally is a part of the drilling process.

13| P a g e
Upstream processes are happening all over the world. Many of these locations are offshore well sites, as
in the North Sea and in the Gulf of Mexico. In these offshore locations, the rental of equipment, and the
operations as a whole, will automatically cost more than drilling onshore. The storage capacity of
equipment is limited and the focus on logistics are extremely high. Another focus often being particularly
high at offshore installations are health, safety and environment (HSE). If there is an unwanted
emergency, e.g. a fire or a gas leak on an installation offshore, you have very limited escape routes. Due
to all the limitations of an offshore installation, HSE regulations are commonly very strict. Rules and
regulations are vastly different around the world, but on the Norwegian Continental Shelf (NCS) the focus
on HSE is extremely high. The mentioned focuses are benefactors to increasing the cost, and there is
always a need for smarter and more cost-effective solutions on how to overcome day-to-day tasks.
The want and need for newer and smarter solutions often lead to more competition on the market.
Different companies gets the chance to contribute to make the drilling operations safer, more efficient,
all with the main goal reducing the overall cost of the operation. The technology is always moving forward,
but at different speeds at different times. There are many different opinions on the following matter.
Some mean that regression is the correct time to implement new cost-saving products, while other mean
it is too risky. All products come with a certain risk attached to them and can therefore face a hard time
getting into the market.
2.3 Communication with Downhole Tools
Today, different logging tools are vast in numbers. Within the communicational part of the technology,
not so much have happened during latter years. There are different methods to communicate with
downhole tools, such as mud pulse telemetry, electromagnetic telemetry (EMT) and wired drill pipe
telemetry (WDP). The most commonly used is mud pulse telemetry.
There are different ways of using mud pulse communication, but here is a simplified explanation of the
technology. Most wells are using a mud system. The mud is a fluid that the mud engineers design to hold
specific properties. The mud is serving many different purposes during a drilling operation, but its main
purpose is to act as a primary barrier. A primary barrier between the rig personnel and the formation
downhole. The weight of the mud keeps the well stable, by establishing a hydrostatic pressure in the well
equal to the in-situ pressure of the formation. You do not want to provoke the formation stability
downhole, which can result in fracturing or collapsing the formation. A collapse being the formation
packing off into the wellbore, while a fracture is if you exert too high of a pressure on the formation,
leading physical cracks and mud losses to the surrounding formation. Other tasks the mud fulfills is cooling
the bit, transporting cuttings out of the hole and finally yet importantly, to act as a medium for
communication. Mud pulses telemetry consists of signals sent and received by the tools and sensors on
surface and downhole.
The technology developed to communicate through liquid mediums mainly consists of sensors and valves.
There are limiting factors to how liquid works as a telemetry medium, but this thesis will not go depth on
that subject. Communication happens between the programmed tools in the BHA and pressure sensors
on surface. The downhole tools and surface sensors recognize different patterns of pulsing. Creating
patterns consists of a sequence of starting and stopping flow through different valves. These changes in

14| P a g e
flow, creates pressure drops and spikes. These drops and spikes travel through the mud and the tools in
the BHA interprets them. Then the tools in principle does the exact same thing. The tools open and closes
a valve inside the drill string, which creates a pattern that the surface sensors picks up. The surface sensors
transmits the signal to a computer, which interprets the signal and displays a message. A MWD engineers
read this message and act accordingly. The different patterns of pulses are just like binary coding for
computers. There are different transmission speeds obtainable, using different techniques of mud pulse
telemetry. The average data transmission speed is around 5-10 BPS (Poletto & Miranda, 2014).
When using electromagnetic telemetry, transmitters located in the BHA sends the information through
low-frequency guided waves. These waves travel through the formation and/or casing while surface
antennas detects the waves. This technology is originally limited to shallower wells than the use of mud
pulse telemetry, due to the attenuation of the signal. There are possibilities of enhancing the signal
strength with the use of amplifiers in your drill string. The biggest advantages of the EM technology is
getting transmission speed up to 100 BPS (Poletto & Miranda, 2014). EM makes it possible to
communicate with tools in wells drilled with aerated fluids like air, mist and/or foam. In the wells where
it is not optimal to use the conventional drilling fluid mud, using mud pulse telemetry is naturally out of
the picture (Halliburton, 2015).
A third and newer way of communicating with your downhole tools while drilling, is through wired
communication. This wired drill pipe technology is the primary focus of this thesis, so there is a lot more
to come regarding WDP technology in later chapters.
15| P a g e
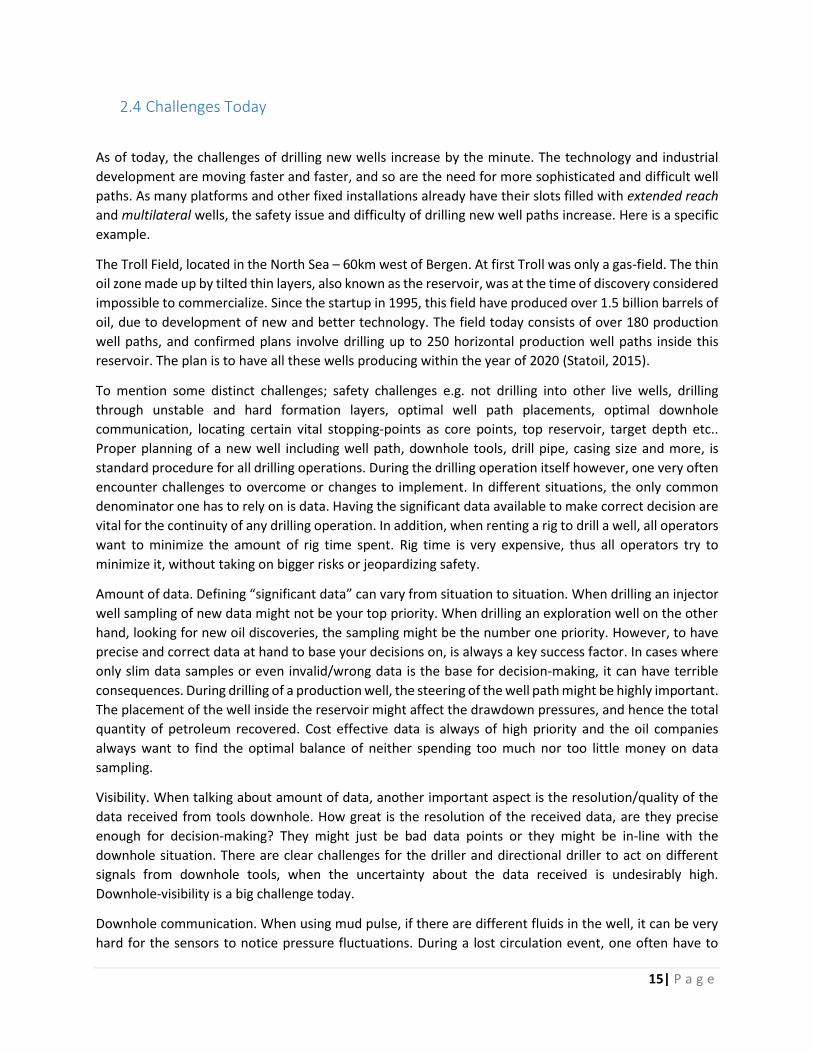
2.4 Challenges Today
As of today, the challenges of drilling new wells increase by the minute. The technology and industrial
development are moving faster and faster, and so are the need for more sophisticated and difficult well
paths. As many platforms and other fixed installations already have their slots filled with extended reach
and multilateral wells, the safety issue and difficulty of drilling new well paths increase. Here is a specific
example.
The Troll Field, located in the North Sea – 60km west of Bergen. At first Troll was only a gas-field. The thin
oil zone made up by tilted thin layers, also known as the reservoir, was at the time of discovery considered
impossible to commercialize. Since the startup in 1995, this field have produced over 1.5 billion barrels of
oil, due to development of new and better technology. The field today consists of over 180 production
well paths, and confirmed plans involve drilling up to 250 horizontal production well paths inside this
reservoir. The plan is to have all these wells producing within the year of 2020 (Statoil, 2015).
To mention some distinct challenges; safety challenges e.g. not drilling into other live wells, drilling
through unstable and hard formation layers, optimal well path placements, optimal downhole
communication, locating certain vital stopping-points as core points, top reservoir, target depth etc..
Proper planning of a new well including well path, downhole tools, drill pipe, casing size and more, is
standard procedure for all drilling operations. During the drilling operation itself however, one very often
encounter challenges to overcome or changes to implement. In different situations, the only common
denominator one has to rely on is data. Having the significant data available to make correct decision are
vital for the continuity of any drilling operation. In addition, when renting a rig to drill a well, all operators
want to minimize the amount of rig time spent. Rig time is very expensive, thus all operators try to
minimize it, without taking on bigger risks or jeopardizing safety.
Amount of data. Defining “significant data” can vary from situation to situation. When drilling an injector
well sampling of new data might not be your top priority. When drilling an exploration well on the other
hand, looking for new oil discoveries, the sampling might be the number one priority. However, to have
precise and correct data at hand to base your decisions on, is always a key success factor. In cases where
only slim data samples or even invalid/wrong data is the base for decision-making, it can have terrible
consequences. During drilling of a production well, the steering of the well path might be highly important.
The placement of the well inside the reservoir might affect the drawdown pressures, and hence the total
quantity of petroleum recovered. Cost effective data is always of high priority and the oil companies
always want to find the optimal balance of neither spending too much nor too little money on data
sampling.
Visibility. When talking about amount of data, another important aspect is the resolution/quality of the
data received from tools downhole. How great is the resolution of the received data, are they precise
enough for decision-making? They might just be bad data points or they might be in-line with the
downhole situation. There are clear challenges for the driller and directional driller to act on different
signals from downhole tools, when the uncertainty about the data received is undesirably high.
Downhole-visibility is a big challenge today.
Downhole communication. When using mud pulse, if there are different fluids in the well, it can be very
hard for the sensors to notice pressure fluctuations. During a lost circulation event, one often have to

16| P a g e
pump down different types of mud to try to lower the original mud weigh creating the losses. E.g. the
result might be having a fluid column of 30% 1.40 SG oil based mud (OBM), 20% 1.10 SG OBM and 50%
0.85 SG base oil. Trying to establish communication through this column of mixed fluids would be very
hard, If not impossible. Getting correct data from the tools in situations like these can be vital.
Time-saving. Another important challenge in the drilling industry is time efficiency. Operators always
strives to, in a safe and healthy manner, minimize time usage. This especially applies when drilling
offshore, where most of the equipment and personnel are invoiced using day-rates. Time can almost be
looked upon as an own currency when it comes to this industry. Time is always of the essence, and all oil
companies strive to stay within the projected cost budget, AFE (Authority of Expenditures).
Environment. Protecting the environment and not causing harm to sea/wild-life affected by the rig site
have become increasingly important in past years. To what extent one protects the environment is a
matter of opinion, but it is hard to argue that proactivity trumps all. In addition, being able to have highly
advanced technology spotting possible failures/dangers as early as possible, might be the difference
between an accident happening or almost happening.
Price of Oil. Oil prices fluctuate and as a result, what was profitable one year might not be profitable the
next. A highly dynamic and globalized industry, dependent on many different factors all over the world.
Unlikely events. If things does not go according to plan, one can encounter unlikely events. Unlikely events
can be of many, but typically a situation that might have a severe impact on the operations, and thus the
personnel, the environment and the companies involved. It can be a well control issue or lost time
incident. A reason for that some of these unlikely events keeps appearing, is that they start out as a small
incident, but due to lack of information wrong decisions are taken and in worst case scenarios, the results
are devastating.

17| P a g e
3. Technical Specifications and Explanations of WDP Technology Theory and technical viewpoints on the different components making up the technology. The majorities
of the following text is written based on my own knowledge. Minor parts of information are gathered
from the manufacturing company’s product catalog (NOV I. 2., 2013). Direct quotations are referenced in
the text below as well.
3.1 The main advantage of the WDP Technology Network
Briefly explained, the main advantage of the wired drill pipe technology network is that it allows you to
transmit and receive real time data at a new level of speed.
The named provider of such technology, which this thesis is based upon, is NOV IntelliServ. Their
network/technology are referred to as IntelliServ Network, IntelliServ2 Network (which is 2nd generation
update and improved version of the original IntelliServ Network) or WDP technology throughout the
thesis. With this technology it is now possible to send and receive up to 57 600 bits per second (BPS)
(National Oilwell Varco, 2015). To give a more general comparison of this speed, think of a road with one
single lane (conventional telemetry) and then a road with multiple lanes (WDP technology). If there are
10 000 more lanes than the single lane, then there are room for 10 000 more cars to pass a certain point,
during a given time interval. This number, 10 000, is approximately how much more data it is possible to
transmit and receive, using WDP technology compared to conventional communication methods like mud
pulse and/or electromagnetic telemetry. The speed that one can send or receive data using ordinary mud
pulse telemetry is, as earlier mentioned, on average between 5-10 BPS. For EM it can go up to 100 BPS.
Figure 1: Mud Pulse Telemetry Vs. Wired Drill Pipe Telemetry (Saenz, 2014)

18| P a g e
3.2 A quick overview of the complete WDP Technology Network
First, a quick and general overview of the wired drill pipe technology network as a whole. As figure 2 below
shows, the network consists of different components. Every component play a crucial role in the transferal
of data, this is because of the components are connected in series. If there is a serious fault or a shortage
in one of the components, the complete network will not function optimally.
The network consists of a looped circuit. A simplified way to look at it is to imagine a constant flow of
packages throughout the looped circuit. This flow starts from the NetCon, then it goes through the surface
cabling and into the data swivel. The data swivel is physically a part of the top drive system and needs to
be installed prior to using WDP technology on any installation. The flow now continues through the data
swivel, and into the wired drill pipe. It flows through every joint of WDP, and all the way down to the
interface-sub, and maybe passing through some ASMs on the way.
Over every tool joint there are coils making communication over the connections possible. Inside the
wired drill pipes, there is stretched an armored co-axial cable referred to as the data cable, which transfers
the data through every joint of drill pipe. On the way down to the interface sub it passes through x amount
of data links, depending on the length of the string. The data links will interchangeably be referred to as
boosters, amplifiers or simply links, throughout the thesis. The interface sub is a converter that makes the
WDP technology serviceable with different third party components, like for instance their respective
Bottom Hole Assemblies (BHAs). From the bottom, the flow goes all the way back to surface and into the
NetCon, but it does not end here. The NetCon makes it possible to transfer all the downhole data to third
party computers/databases. Then service companies and oil companies have the opportunity to interpret
the huge amounts of downhole data transmitted, at new record-breaking speed.
A wired drill pipe string lasts almost as long as a regular drill string, around 7 years before it needs a higher
level of maintenance. The lifespan will vary, depending on what field the string is used, and what
formations it drills on a daily basis. More detailed information about each of the components in the next
section.
19| P a g e
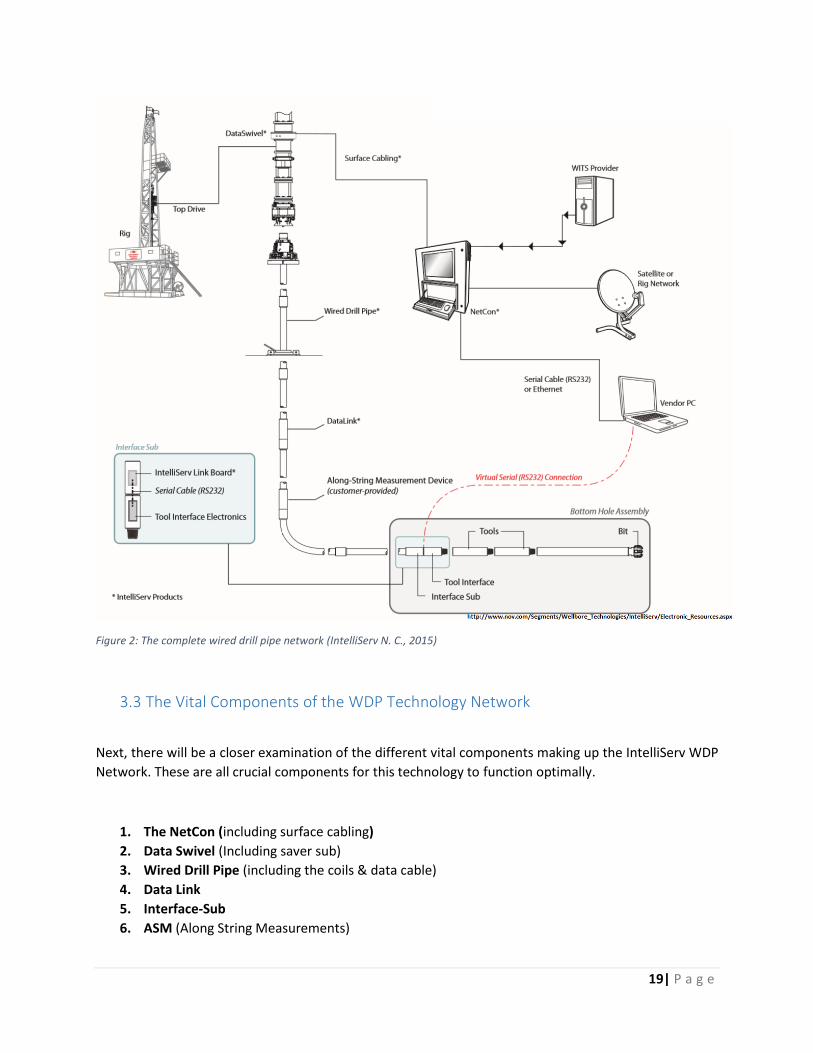
Figure 2: The complete wired drill pipe network (IntelliServ N. C., 2015)
3.3 The Vital Components of the WDP Technology Network
Next, there will be a closer examination of the different vital components making up the IntelliServ WDP
Network. These are all crucial components for this technology to function optimally.
1. The NetCon (including surface cabling)
2. Data Swivel (Including saver sub)
3. Wired Drill Pipe (including the coils & data cable)
4. Data Link
5. Interface-Sub
6. ASM (Along String Measurements)

20| P a g e
3.3.1 The NetCon and Surface Cabling
The Network Controller or NetCon for short is a huge cabinet filled with electronics and an integrated
touch sensitive screen. It is the working brain of the WDP Technology. Without the NetCon, the
information itself would be non-interpretable, or more precisely; the informational flow would be
nonexistent. The surface cabling is what connects the NetCon to the Data Swivel, and the rest of the wired
drill pipe network.
Figure 3: The NetCon (IntelliServ N. C., 2015)
The cabinet is made of robust material and weighs just short of 100 kg. The physical measurements of the
NetCon varies, because it is applicable with an adjustable stand. The measurements thus vary accordingly
to the adjustable height of: 92-183 cm. The depth and width on the other hand remain constant at 30 and
76 cm, respectively (IntelliServ N. , 2014). The NetCon optionally comes with an internal UPS, which is
typical for onshore/land rigs. The other option is to assemble it without the internal UPS, making it a bit
21| P a g e
lighter but dependent on a direct hook up to an external UPS source, typical for offshore installations. It
have different connection points, for different type of cabling and a self-adjusting power supply regarding
the differences in power, all over the globe. Lower down in the chapter we examine the field kit of
different cables and tools, making up the surface cabling. The software installed on the NetCon is a normal
Windows based software, tuned specifically for facility operating machines/tools, which makes it very
user friendly. The use of a touch sensitive screen or a set of external keyboard & mouse are controlling
the NetCon.
In the Driller’s Cabin or close to the drill floor, is the most preferable placement of the NetCon. Remote
control of the NetCon is also an option, but is not preferred due to the switching between the different
cables in use, for the different NetCon day-to-day tasks. The NetCon is as mentioned the working brain of
the WDP technology. On the NetCon screen you can control the different programs running on the NetCon
and these programs allows you to check upon your connections. Check that the signal strengths is looking
good and that the data from your tools, as well as you borehole conditions, are looking great. To get an
optimal feel of the borehole conditions, we need to have tools (ASMs and/or a BHA) in the drill string,
which provides relative information to the NetCon. More detailed information about ASMs in section 3.3.6
of this chapter.
To check that the connections status is good while tripping new wired drill pipe into the well, a test fixture
is connected to the top of approximately every fifth stand. To check that you have communication with
the whole drill string, all the way down to the interface-sub and the BHA, the same test fixture is used.
Another of the Netcon’s vital tasks are to send/receive data to/from external databases and computers.
This means that using different connection ports, like serial- or ethernet connections, it is possible for
different users to acquire their desired information, while others tasks simultaneously are being
performed on the NetCon. There is a lot of information being stored in the NetCon database, both from
downhole tools and from surface sensors. The information from the surface sensors make it easier to
correlate logs and data, which the NetCon can provide in different format/template files. The
simultaneous use of the NetCon requires separate users, easily set up by the wired drill pipe operator
(WDPO). Each user will then get access to designated areas of the database, where the relevant
information for that user is stored.
The physical connection between the NetCon and the rest of the drill string is through the surface cabling
and the data swivel. Look at figure 2 in section 3.2 to get e better feel for how it is connected. The surface
cabling mainly consists of different types of cables, connected through a number of junction boxes (JB),
as shown in figure 4.
The first JB being located close to the NetCon and the last JB is mounted to the master gear on the top
drive. The different cables between the NetCon and the data swivel is made of different material, to fit its
particular functionality and placement on site. The cables that are exposed to mud have better and thicker
armor, than the ones placed close to the NetCon (IntelliServ N. , 2014). The cable going from JB3 to JB4 is
often referred to as the “sacrificial cable”. This cable might be one of the week spots in the network,
because JB3 is standing still, while JB4 is rotating when the master gear on the top drive rotates. If the top
drive over-rotates, this cable will tend to break/snap, and you lose connection with the rest of the drill
string. While operating the wired drill pipe network, the main reason for having multiple JBs on the surface
cabling is so that is will be easier to troubleshoot in case of any failures. There are different ways to set

22| P a g e
up the external connections as well as troubleshooting the surface system, but this thesis will not go into
any further detail on these matters.
Figure 4: Surface Cabling - From the NetCon to The Data Swivel
3.3.2 The Data Swivel
The data swivel makes it possible to transfer the downhole data to the surface cabling network. It is a part
of the top drive system, and is located on top of the internal blowout preventer (IBOP) stack.
The data swivel is a fixed component that allows transferal of the downhole data, to the surface cabling.
It comes in different engineered sizes to fit different top drive system. It is part of the components making
up the top drive stack and the data swivel’s location is on top of the IBOP. Underneath the data swivel
comes the upper and lower IBOPs that also are specially manufactured for the use of wired drill pipe
technology. The last, but also important part of the top drive stack is the saver sub. The saver sub is a
sacrificial component of the top drive system, where its main task is to save the top drive itself from
abrasion. When the driller make and break connections, to build the entire drill string, the save sub is
worn down and when needed replaced with a new one. It also has the purpose of working as a cross over
sub, making it possible to connect wired drill pipe with different IDs and ODs to the topdrive.

23| P a g e
Figure 5: Data Swivel mounted in topdrive (IntelliServ N. R., 2015)
The significant component of the data swivel is the stator. The stator is the component making it possible
to transfer the data from the rotating system, to the fixed surface cabling network. Different rigs have
different top drive assemblies, and thus there are different components available for making this
transferal of data possible (NOV I. 2., 2013). As mentioned earlier in this chapter about troubleshooting,
this thesis will not go into any further detail on the subject, but if there is something wrong, the saver sub
is a logical component to double check. The saver sub is also one of the weaker links in the system, due
to unwanted events like miss stabs, during the making/breaking of wired drill pipe tubulars.
24| P a g e
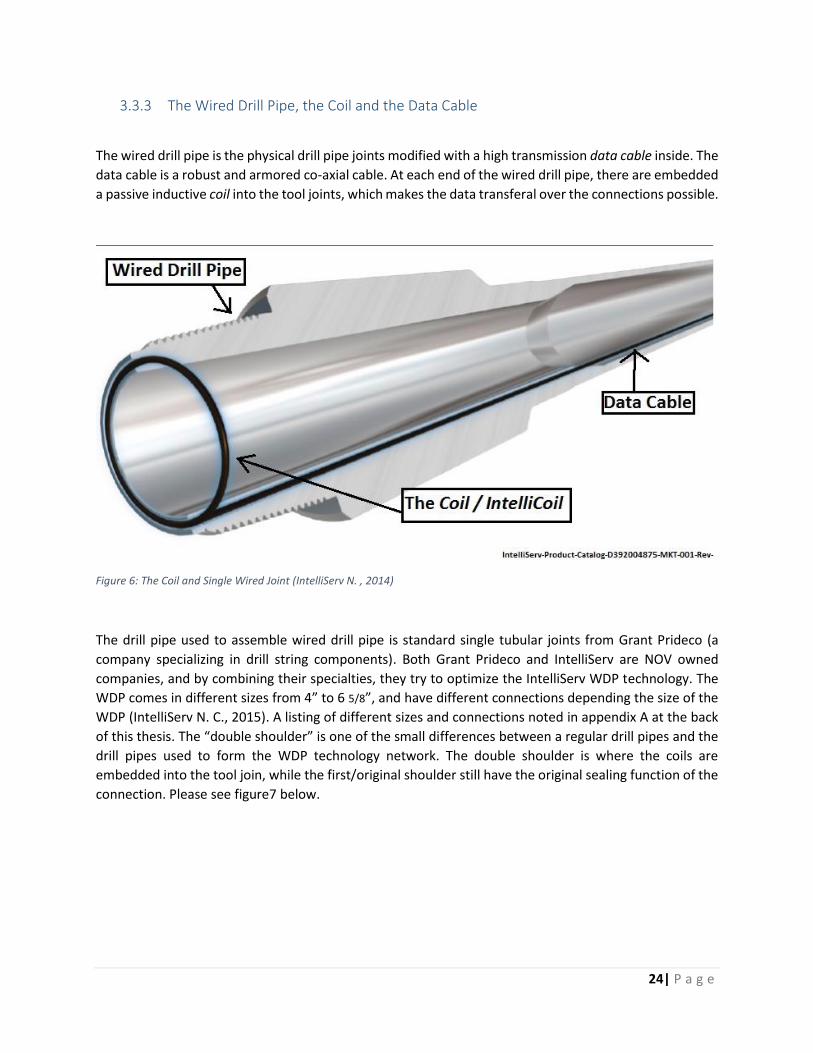
3.3.3 The Wired Drill Pipe, the Coil and the Data Cable
The wired drill pipe is the physical drill pipe joints modified with a high transmission data cable inside. The
data cable is a robust and armored co-axial cable. At each end of the wired drill pipe, there are embedded
a passive inductive coil into the tool joints, which makes the data transferal over the connections possible.
Figure 6: The Coil and Single Wired Joint (IntelliServ N. , 2014)
The drill pipe used to assemble wired drill pipe is standard single tubular joints from Grant Prideco (a
company specializing in drill string components). Both Grant Prideco and IntelliServ are NOV owned
companies, and by combining their specialties, they try to optimize the IntelliServ WDP technology. The
WDP comes in different sizes from 4” to 6 5/8”, and have different connections depending the size of the
WDP (IntelliServ N. C., 2015). A listing of different sizes and connections noted in appendix A at the back
of this thesis. The “double shoulder” is one of the small differences between a regular drill pipes and the
drill pipes used to form the WDP technology network. The double shoulder is where the coils are
embedded into the tool join, while the first/original shoulder still have the original sealing function of the
connection. Please see figure7 below.

25| P a g e
Figure 7: Double Shoulder Tool Joint (IntelliServ N. , 2014)
The operation of pulling the data cable through the joint happens at IntelliServ’s plant in Provo, Utah.
Custom-made machines drill a hole in the tool joint to pass the cable through. First from the inner
secondary shoulder of the box-end of the pipe and through the internal/external upside (IEU). Then on
the other side of the joint, the hole is drilled from the pin-end and through the IEU. This makes it is a
possible to pass the data cable through the box-end tool joint, through the inside of the pipe, and out
through the pin-end tool joint. Before fastening the data cable in both ends of the drill pipe, it is stretched
to a certain amount of strain, and then fastened. This strain helps to hold the data cable straight inside
the pipe, where it could have buckled and moved freely, if not stretched. The OD of the data cable is 0.2
inches, and thus decreases the drift diameter of the pipe with 0.2 inches (NOV I. 2., 2013).The strain also
helps to keep the data cable straight, even though the pipe itself is bent. If the pipe itself is bent, it is
important to be aware that the drift diameter of the pipe can decreases even more, due to the data cable
taking up more space of the drift diameter than normally, when the pipe was straight. The cable is still
straight, which results in making the drift diameter substantially smaller. The drift diameter represent the
maximum OD any object flowing through the inside of the pipe can hold, and still be able to pass through
without complications. To activate/deactivate some tools used in the string, balls are dropped inside the
string from drill floor, and fits into a seat in the BHA, redirecting flow or whatever the task of that particular
ball drop was. These balls must never have an OD larger than the strings minimum drift ID.
Now that the cable is in place inside the WDP, how can it provide a continuous stream of data over the
connections? Do the data cables have to have perfectly alignment over each connection to make this
possible? This perfect alignment would not be possible in operations, due to the constant rotating of the
pipe, sometimes changing the turn of the connections. This is where the coil, also referred to as IntelliCoil,
comes into play. This coil is what makes the transfer of data over connections possible, without having to
worry about making up an almost impossible perfect aligned connection. The coil is made of different

26| P a g e
conductive material, including ferrite, which makes it possible to send data over the connections. The coil
is embedded into small recesses in the double/secondary shoulder of the connection and then connected
to the data cable. One coil on the pin-end of the pipe and one coil in the box-end of the pipe. Then when
you make up connections out in the field, to build your drill string, the coils will stay very close, almost
touching, while the data transferal is made possible with inductive properties of the coil. There is a small
signal loss over every connection for different reasons. Mainly because the signal have to cross over from
one cable to another, through the coil. The coils wear down over time, due to making/breaking
connections among other activities. The signal, passing through the data cables, attenuates over the coils.
The signal, depending on the length of the well, needs amplification to maintain its strength so the
interpretation by the NetCon at surface will be correct. Read more about signal strength amplification in
section 3.3.4 – Data Link.
27| P a g e
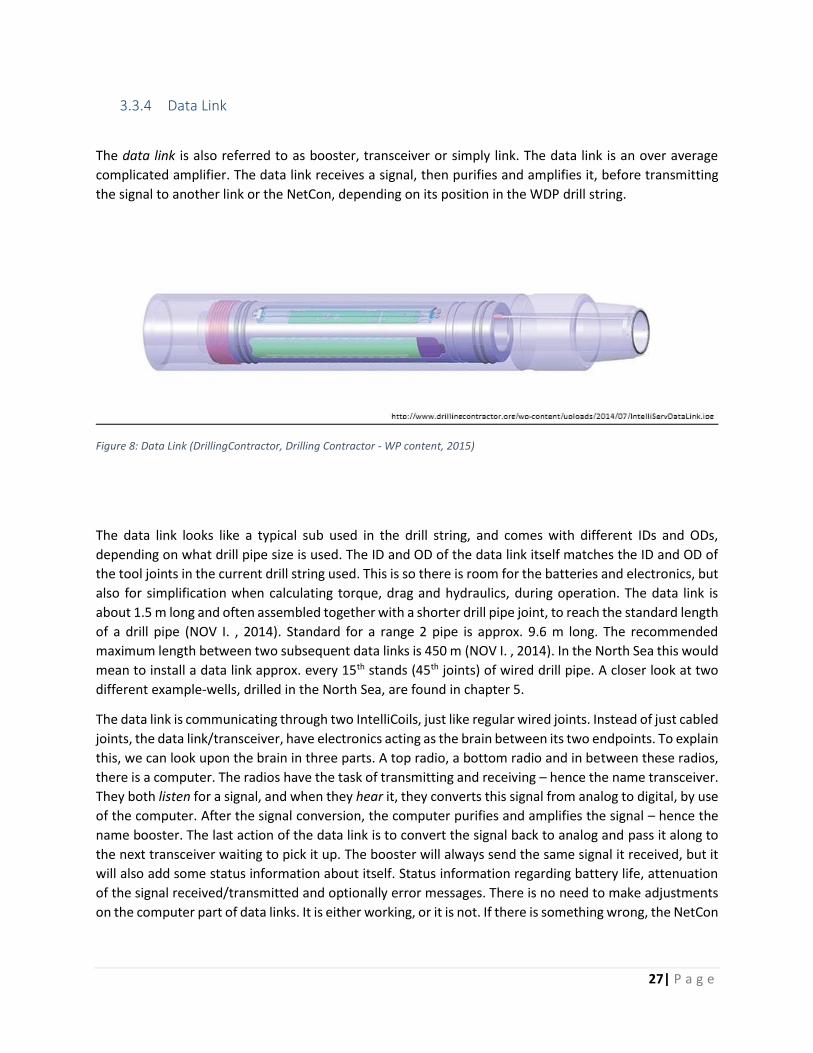
3.3.4 Data Link
The data link is also referred to as booster, transceiver or simply link. The data link is an over average
complicated amplifier. The data link receives a signal, then purifies and amplifies it, before transmitting
the signal to another link or the NetCon, depending on its position in the WDP drill string.
Figure 8: Data Link (DrillingContractor, Drilling Contractor - WP content, 2015)
The data link looks like a typical sub used in the drill string, and comes with different IDs and ODs,
depending on what drill pipe size is used. The ID and OD of the data link itself matches the ID and OD of
the tool joints in the current drill string used. This is so there is room for the batteries and electronics, but
also for simplification when calculating torque, drag and hydraulics, during operation. The data link is
about 1.5 m long and often assembled together with a shorter drill pipe joint, to reach the standard length
of a drill pipe (NOV I. , 2014). Standard for a range 2 pipe is approx. 9.6 m long. The recommended
maximum length between two subsequent data links is 450 m (NOV I. , 2014). In the North Sea this would
mean to install a data link approx. every 15th stands (45th joints) of wired drill pipe. A closer look at two
different example-wells, drilled in the North Sea, are found in chapter 5.
The data link is communicating through two IntelliCoils, just like regular wired joints. Instead of just cabled
joints, the data link/transceiver, have electronics acting as the brain between its two endpoints. To explain
this, we can look upon the brain in three parts. A top radio, a bottom radio and in between these radios,
there is a computer. The radios have the task of transmitting and receiving – hence the name transceiver.
They both listen for a signal, and when they hear it, they converts this signal from analog to digital, by use
of the computer. After the signal conversion, the computer purifies and amplifies the signal – hence the
name booster. The last action of the data link is to convert the signal back to analog and pass it along to
the next transceiver waiting to pick it up. The booster will always send the same signal it received, but it
will also add some status information about itself. Status information regarding battery life, attenuation
of the signal received/transmitted and optionally error messages. There is no need to make adjustments
on the computer part of data links. It is either working, or it is not. If there is something wrong, the NetCon

28| P a g e
will interpret the information sent form the booster and alert the wired drill pipe operator, typically by
putting an error message on the screen.
Figure 9: Data Link -Top and Bottom Radio
The data link is a two-part component. The first part containing battery packages that providing power to
the link, while the other part holds all the electronics operating within the link. The data link holds two
printed wiring boards (PWB), where the first controls the transceiver part, and the second controls the
battery part. The data link is not serviceable on the rig, thus it is marked with a “non-break-X” mark mid-
body, to show that this connection should not be broken. One of the reasons for not breaking the link is
the part containing batteries, or more precisely lithium. If there was to be a lithium spill, it can have fatal
impacts on the surroundings. Another reason for marking this non-break-zone clearly, is that the
electronic inside the link is highly sensitive to moist, dirt or other form of contamination. Specifications
about the data links noted in appendix B.
29| P a g e
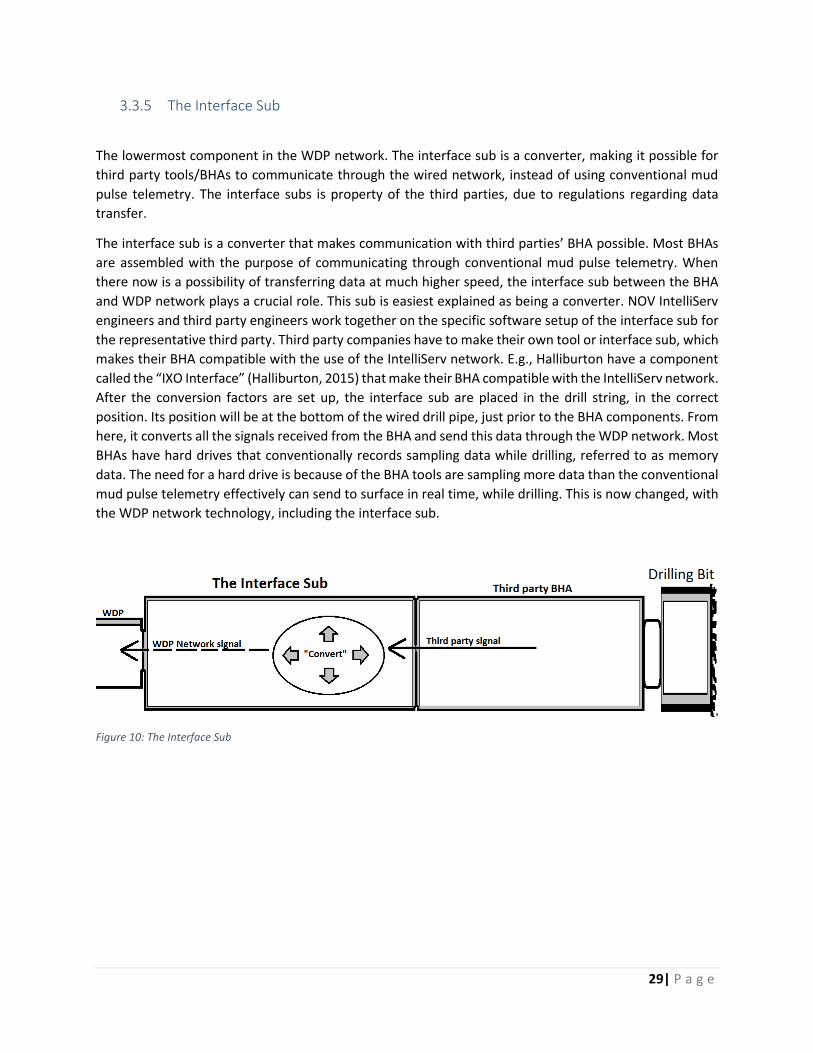
3.3.5 The Interface Sub
The lowermost component in the WDP network. The interface sub is a converter, making it possible for
third party tools/BHAs to communicate through the wired network, instead of using conventional mud
pulse telemetry. The interface subs is property of the third parties, due to regulations regarding data
transfer.
The interface sub is a converter that makes communication with third parties’ BHA possible. Most BHAs
are assembled with the purpose of communicating through conventional mud pulse telemetry. When
there now is a possibility of transferring data at much higher speed, the interface sub between the BHA
and WDP network plays a crucial role. This sub is easiest explained as being a converter. NOV IntelliServ
engineers and third party engineers work together on the specific software setup of the interface sub for
the representative third party. Third party companies have to make their own tool or interface sub, which
makes their BHA compatible with the use of the IntelliServ network. E.g., Halliburton have a component
called the “IXO Interface” (Halliburton, 2015) that make their BHA compatible with the IntelliServ network.
After the conversion factors are set up, the interface sub are placed in the drill string, in the correct
position. Its position will be at the bottom of the wired drill pipe, just prior to the BHA components. From
here, it converts all the signals received from the BHA and send this data through the WDP network. Most
BHAs have hard drives that conventionally records sampling data while drilling, referred to as memory
data. The need for a hard drive is because of the BHA tools are sampling more data than the conventional
mud pulse telemetry effectively can send to surface in real time, while drilling. This is now changed, with
the WDP network technology, including the interface sub.
Figure 10: The Interface Sub

30| P a g e
3.3.6 ASM – Along String Measurement
Along string measurement, often called ASM, is the general name of different tools that can now be placed
anywhere along the drill string, using the WDP network technology. These are more of an additional
feature to the wired drill pipe network than a vital one. The network can operate normal without ASMs.
Along string measurements are tools that now can sit anywhere on the wired drill string. Since the WDP
technology gives a network of communication, instead of just sending and receiving data to and from the
BHA, it is now possible to place tools along the drill string. The name speaks for itself, and in the future,
the ASMs will become an entirely new field of development. NOV IntelliServ have set up their own group
-PSI (Partner Support and Integration) that can help third parties with information on how to build their
own ASM tools, compatible with the IntelliServ WDP network (IntelliServ A. -N., 2015). The effects of
eventually opening this market to third parties are not in within the specs of this thesis, but a freer market
will often tend to push technology faster forward, and thereby create an even bigger demand for ASMs
and WDP network.
Figure 11: Along String Measurements - ASMs
The ASM sensors measure physical parameters like pressure, stress, strain, vibration, rotation etc. and
can give new information from new perspectives. The sensors can also give directional information, like
inclinations, azimuthal, gyros measurements and more, so you are able to pinpoint the exact location of
sections along the wellbore. ASMs can come in all different kind of shapes and sizes, depending on its
purpose. ASMs are still at an early stage of the development process, and will most likely become more
reliable in the future. In the future, automated drilling systems will probably also be a new and upcoming
technology, only made possible with the speed the WDP network provides. More about automated drilling
and ASMs in chapter 5, section 3.
31| P a g e
4. Economic Viewpoints of WDP Technology – Drilling Operations Looking closer on the economics within the oil industry. Examining cost related to the activity of drilling
for oil and the use of wired drill pipe technology. When the symbol [$] is used, it refers to US Dollar.
4.1 Value of Time – Oil Price Fluctuation
Within this industry, as mentioned beforehand, time is always of the essence. Due to different currencies
worldwide and dynamic exchange rates it can often make more sense to use “time” as the unit for cost,
rather than dollars or pounds. I will go as far and state that “time” is an own currency within the oil
industry. Most companies are fully aware of the importance of time, and therefore it is often more
practical to converse using time as the unit.
The biggest challenge speaking of time as a currency is that the value of time change. As mentioned,
fluctuations in the price of oil causes profit margins to change respectively. An oil field can one day be
making money on their production, but then be losing money the next day at the exact same production
rate. A simplified example to demonstrate follows.
When the overall cost of producing one barrel of oil from a particular field is $50, and the sales price of
oil is $55 per barrel, the operator would make a $5 profit on every barrel produced. Now, if the oil price
where to drop $25, the operator would lose $20 on each barrel produced, and over a longer period, this
might have crucial consequences for the company. This is as mentioned a simplified example, but it paints
a picture of how rapidly things change within the industry.
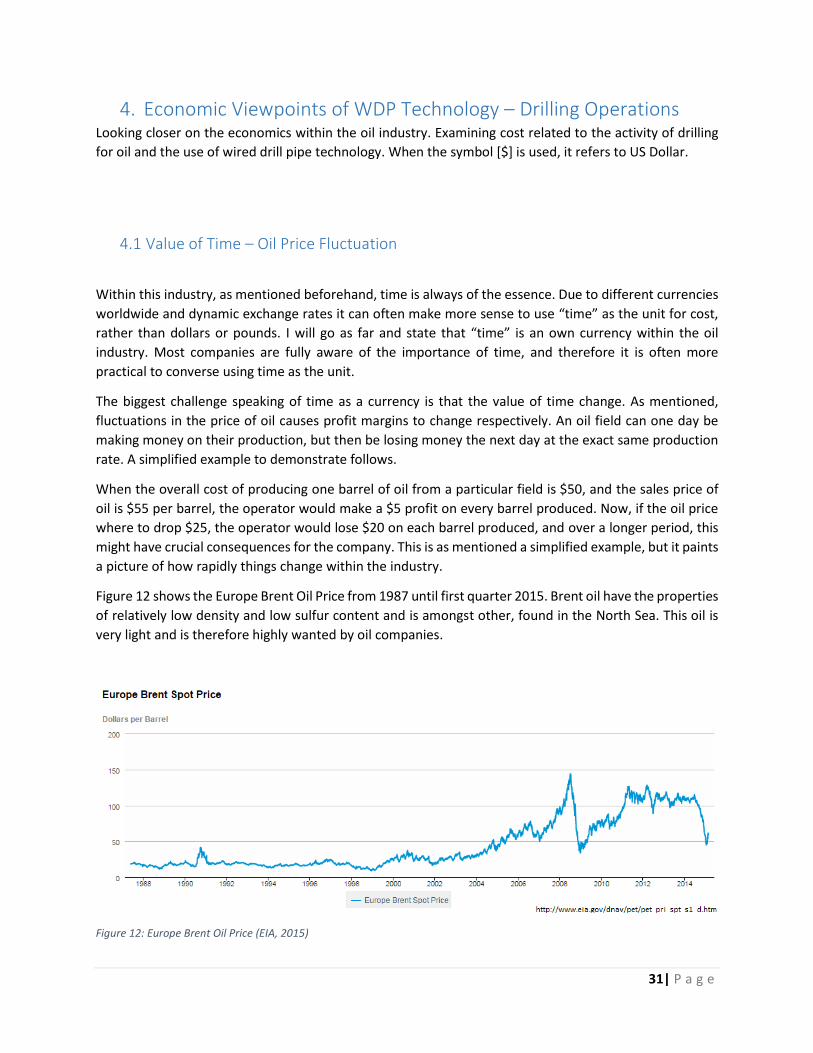
Figure 12 shows the Europe Brent Oil Price from 1987 until first quarter 2015. Brent oil have the properties
of relatively low density and low sulfur content and is amongst other, found in the North Sea. This oil is
very light and is therefore highly wanted by oil companies.
Figure 12: Europe Brent Oil Price (EIA, 2015)
32| P a g e
Periods with way lower oil-price than the representative former months are known as down-periods.
These down-periods are harsh on the industry, and most often halt development of newer technologies.
These halts happen because of big uncertainties regarding the near future. In down-periods like these,
the value of time can decrease. This depend on which viewpoint one have on time and the agreement
between the operator and the drilling contractor established prior to startup of the drilling project. If no
one thought of a quick drop in oil prices, and did not consider this when making the contract, one of the
parts might take a heavy blow.
On the other side, when oil prices are high, time most often has greater value. If we look at the period
from 2007-2008 where the oil price reach an all-time high, before plunging in the later period of 2008.
Also the period from 2011-2014, when the price of oil was on average over 110 USD per barrel of oil. In
good times like these, all operators want to produce and sell as much oil as possible, which again can
lead to overproduction. Overproduction will over time lead to plunging oil prices, as we have seen so
many times before. This thesis will not go in more detail on the rollercoaster behavior of the oil price,
but it is important to touch upon this subject for a thesis, regarding the upstream process of the
industry.

33| P a g e
4.2 The Cost of Drilling Operations
As mentioned, the focus of this thesis will be in the upstream process of the industry. A vital object in the
operation of oil extraction is the drilling installation. There are many different types of installations
available, depending on your requirements. The different installations have different cost, and some form
of day rate is the most common way of pricing a drilling installation. The drilling contractor and the
operator agrees on a day rate for the specific installation, depending the size of the rig, the water depth
where the rig will drill, and other factors like projected rental period. Day rates vary, but most times it
follows the changes in the price of oil. When the oil prices are high, operators want to produce more,
which increases the demand for drilling installations and thus rig rates go up.
In late 2014, there was a steep decline in the price of oil. This will typically lead to a drop in activity of
drilling operations, due to low oil prices. Some operators might go as far as docking their already rented
installations. This means putting their drilling installation at a dock somewhere, not drilling for oil, and
paying a day-rate agreed upon in the contract. In times like these, docking the rig will often reduce losses
for the operator. The contrary option would be to have the installation loaded with drilling crew, marine
crew and service companies, operating as normal. The price of having an installation in normal activity
drilling for oil can vary a lot. Many of the rates for the different services onboard a rig are hard to come
by (they are confidential in many cases). However, we will first take a closer look on what it approximately
costs to have a semi-submersible drilling rig in “full-operation” in the North Sea.
There are very many different lines of services, working non-stop on an operative drilling rig. Most
positions have two shifts, so there is one person working a 12-hour nightshift and another working a 12-
hour dayshift. This leads to the whole rig being in operation all day long, 24 hours a day. This again leads
to most services companies charging a fixed day rate for each worker, depending on their individual
experience. A typical senior or junior rate is charged. To give a better understanding of the cost of a drilling
operation, here are some figures from the article “Så mye koster en letebrønn” (“The price of an
exploration well”) written in 2009 (Bjerke, 2009). In this article, the expenses are grouped into different
batches, as stated below in table 1. The rates in the article were in NOKs, and are converted into US dollars.
For more details on the conversion and calculations, see appendix E.
The total rig rate for the semi-submersible rig West Alpha, during its’ 116 days stay at the Fulla prospect,
summed up to $28 million. These 116 days featured from the beginning of the project, until somewhere
in the completion phase (Bjerke, 2009). A closer look at these number shows that this boils down to only
$241 000 per day. Today (1Q 2015) the same rig is per contract rented by Karmorneftegaz (Rosneft and
ExxonMobil joint venture) at $519 000 per day (Offshore.no, 2015). This gives over 100% increase in
price. It is worth mentioning that West Alpha’s construction year was 1986.
The 2009 article states that the second largest expenditure during this stay was the group labeled services.
The total cost of services added up to $12.9 million. The services, which fall into this category, are casing
services, measuring & logging services, directional drilling and more. The logistics added up to $11.8
million, consisting of diesel fuel for the tankers, onshore-base workers and rig shipments plus more. The
next expenditure post is equipment and material which consists of different parts and components
needed for the drilling operations to run smoothly. These components adding up to $7.0 million. The last
category is marked as personal cost and ads up to $4.3 million. These numbers are as mentioned from

34| P a g e
2009. Today, in 2015, it is not an exaggeration to state that the cost of a “fully operational semi-
submersible drilling rig” in the North Sea will come close to $1 million per day. A typical rule of thumb is
that the spread cost of a drilling rig in full operations is approximately twice the day rate (IHS, 2015), which
suits the numbers below pretty well. For demonstrational purposes throughout the thesis, $1 million per
day will be the cost used for a “fully operational semi-submersible drilling rig” in the North Sea. This might
be on the more expensive side, but for different operations, prices will be different. This depends on what
drilling installation to use, what equipment quality, difficulty level of the well profile etc. The cost
designated to the different branches stated in the table 1 below are based on the cost-distribution found
in the 2009 article (Bjerke, 2009). For more information on estimated numbers for demonstrational use,
see appendix E - Rig Cost Calculations - Currency.
Product Cost in $ USD
Rig Rate 440 000
Services 200 000
Logistics 190 000
Equipment 100 000
Personnel 70 000
SUM 1 000 000 Table 1: Categorized cost of a drilling operation (Appendix E)
There are lots of different equipment needed to drill a hole in the ground. A lot of different technologies
and businesses/companies have grown from the demand for oil. One of these companies are IntelliServ,
which NOV bought in 2006. Today IntelliServ, as earlier mention, bring a completely new technology to
the table. A technology that might play a big role and change parts of the industry, forever. We will look
closer upon these possibilities in the discussion section 5.4.
35| P a g e
4.3 The Cost of Drill Pipe
We will first look at one of the most, if not the most fundamental component in the operation, the drill
string. The drill string consists of drill pipes/joints connected to form a long string of steel. The drill strings
purpose is to pave its way through different formations-layers of rock, and ideally enter a reservoir filled
with hydrocarbons. A drill bit sits at the bottom of the drill string, making it easier to break down the
tough formations. Drill bits come in a vast number of different models, all models specified to optimize
the drilling process in particular formations. Drill bits wear out because of all the rough treatment it gets
downhole, and the lifespan of a drill bit can vary a lot. A bits’ lifespan is dependent on how much exposure
the bit sees. Exposure to unwanted abrasion like vibration, torque and stick slip, all contribute to shorten
the lifespan of the bit. This also applies for the drill string itself, and if it only was possible to get a better
picture of what is happening downhole, this would help a lot.
As mentioned in section 2.4 “challenges today” it often is a challenge for the driller to act on warning signs
from downhole tools, when received data is not of sufficient resolution. If the signs were clearer on what
was going on down hole, the driller could easily make the drilling process as smooth and non-destructive
for the drill string components as possible.
A regular drill string typically lasts from seven to nine years, before replaced with a new string. The cost
and lifespan of a regular drill string will vary depending on grade of the steal used, its’ dimensions and its’
ID/OD specifications. For this thesis, the steal and specification used for the regular drill pipe and the
wired drill pipe comparison are identical (except the wired drill pipe will hold the data cable and coils, of
course). This makes it possible to make a fair cost comparison of the regular drill pipe versus the wired
drill pipe.
The figures used on the cost of the regular and the wired drill pipe are gathered from a NOV representative
via e-mail correspondence and interview (NOV R. T., 2015). The NOV owned company Grant Prideco,
which is a manufacturer of drill pipe, is the company that makes the special double-shouldered tool joints
used in the wired drill pipe system. Grant Prideco make all sorts of different regular pipe and they make
the joints for the wired drill pipe. The fact that they manufacture both regular and wired pipes it make
sense to use Grant Pridecos price for comparison of the two.
The following figures are based on drill pipe needed to drill a 5000 m long well. They originate from e-mail
correspondence with a NOV representative (NOV R. T., 2015). For commercial reasons, the specific grade,
ID and OD of this particular pipe is confidential. The price tag of this specific regular drill pipe is
approximately $5000 per joint. Thus, to complete a 5000 m MD long well, this sums up to approximately
500 joints. (A typical drill pipe, also known as joint, is typically 9.6 m long, but for convenience 10 m is
used throughout the thesis.) This will give a total cost of $5000 x 500 joints = $2.5 million for a regular drill
string. For a shorter exploration well, with length 2200 m, a number of 220 joints are needed, summing
up to the total cost to $1.1 million for regular drill pipe.
If the operator wanted to run the wired drill pipe instead, the cost would normally be higher. The price
tag of wired drill pipe and components needed to run this system, based on the same 5000 m long well,
is found in table 2.

36| P a g e
The surface cabling and surface equipment will cost $200 000. The surface equipment is a one-time
investment, and is reusable for that particular rig. If this equipment is not demobilized, it will function
with wired drill pipe in the future as well. There is an insignificant small additional cost, regarding repair
and maintenance of the booster links. This amount is already embedded in the price tag of the wired drill
pipe. The wired drill pipe, or wired joints, will cost an additional $3000 per joint on top of regular the drill
pipe. Hence, the total cost of one single joint of wired drill pipe costs $8000.
The production well having the target depth of 5000 m MD, making the total cost of using wired drill pipe
$8000 x 500 + $200 000 = $4.2 million. For the explorations well, reaching 2200 m, it would cost $1.96
million. As stated, the extra cost of wired drill pipe is significant. The cost and possible time-savings for
each well, will be thoroughly examined in chapter 5, section 5.1 and 5.2.
Type of pipe Length of well [m] Joints needed Per joint [$] Surface Eq. [$] Total [$]
Regular Drill Pipe 5000 500 5000 0 2 500 000
Regular Drill Pipe 2200 220 5000 0 1 100 000
Wired Drill Pipe 5000 500 8000 200 000 4 200 000
Wired Drill Pipe 2200 220 8000 200 000 1 960 000 Table 2: Cost of Wired Drill Pipe
37| P a g e
4.4 Time-Saving - Categorized
First, a short explanation of all the different time-saving categories, then chapter 5 gives a more specific
and detailed examination of the time saved with the use of WDP to drill two different wells.
To establish figures for the time saved with wired drill pipe, I have used the “Efficiency Calculator” found
on IntelliServ’s website (NOV_Intelliserv, 2015). After a thorough walkthrough regarding this calculator, it
was clear to my professor and me that it is trustworthy. The NOV representative explained how the
database was built, and how all its data originates from the over 100 wells drilled with wired drill pipe
technology (NOV R. T., 2015).
One of biggest benefits of using wired drill pipe today are the time-savings accomplished during the drilling
operation. Figure 14 (see page 39) shows a 5000-meter common ERD production well in the North Sea. In
an ERD well like this, the directional driller needs to do a lot of steering to follow the projected well profile.
Figure 16 (see page 45) shows a somewhat shorter well, reaching 2200 meter. This shorter exploration
well does not need the same amount of steering to follow the projected well path, and thus the time-
savings will be different.
I have chosen two different, but very common, well profiles to demonstrate the time-saving possibilities
when using WDP technology. To make it even clearer, I have decided to split the time-saving portions into
5 different quantifiable categories. Underneath you find each category listed (also referred to as batches)
with a quick explanation to what part of the drilling operation they contribute. We touch upon each
category in more detail while studying the example wells.
The time-saving categories:
1. Data Transmission
2. Drilling Performance - ROP
3. Run Reduction
4. Hole Cleaning
5. Trip Speed Optimization – using ASMs (optional)
4.4.1 - Data Transmission As of today, the easiest batch to recognize is the time saved on data transmission. The main advantage of
using wired drill pipe is that it allows bidirectional communication at speeds up to 57 600 BPS. The result
being that all communication with the downhole tools go a lot faster. During drilling there are a lot of
communication going on between the surface and the downhole tools. Messages sent back and forth,
containing information regarding surveys, pressure parameters, diagnostics of the tools, rotational check
shots, formation pressure tests and more. The numbers in this category are very easy to quantify, even
without the help of the NOV calculator. Here is an example.

38| P a g e
A normal survey will typically take somewhere between 2 to 4 minutes (BHI & Williams, Directional Drilling
- Facts, 2015). This will depend on the different companies’ procedure on taking surveys, but with wired
drill pipe, it takes 4-5 seconds. This might sound like a small saving, but when you add up these savings
for the whole well, it sums up to hours, if not days. As mentioned many times before, time is always of
the essence.
4.4.2 - Drilling Performance – ROP The ROP (Rate of Penetration) says something about how fast one drills through the formation. The metric
unit used for ROP is [m/hr] and the imperial unit is [ft/hr]. There are often KPIs (key performance indicator)
related to the ROP for each section drilled, and one always want to hold as high ROP as possible, without
affecting the stability and safety of the operation. There are many different limiting factors when it comes
to drilling at certain speeds, and it is the driller’s responsibility to optimize the ROP. Using and interpreting
data/information from downhole tools, the driller/directional driller can adjust parameters to drill as fast
as possible, within set criteria for each section. To mention some criteria, it can be sampling rate,
minimum definition on logs, minimum sampling points per meter etc.
4.4.3 - Run Reduction Run reduction is more of an indirect way of saving time. This batch relates to the huge amount of dataflow
sent through the IntelliServ broadband network. When the drill string is experiencing rough conditions
downhole, it is now possible to act on such signals way faster. This reduces the number of trips due to
tool failure, and accordingly the number of runs needed to drill a section to TD. E.g. backward whirl, which
exerts unwanted high lateral vibrations on the drill string, can easily destroy important components within
10-15minutes. If a vital component is destroyed, then one have to trip out, replace the component, trip
back in and then be able to continue drilling.
4.4.4 - Hole Cleaning During drilling of every section, it is very important to have good hole cleaning. It can be hard at times to
determine if the transportation of cuttings are normal. The ECD (equivalent circulation density) is a result
of the hydrostatic pressure of the fluid column and the additional pressure applied when circulating,
hence the name equivalent circulating density. Combination of ECD readings downhole and standpipe
pressure will most times give a good indication if the hole is cleaning properly. An unexpected increase in
standpipe pressure and ECD will often be an indication of non-sufficient hole cleaning. The consequence
being that the driller needs to pull off-bottom, stop drilling and circulate the accumulated cuttings out of
the hole. Being able to spot these accumulations of cuttings earlier, will give chance to optimize flowrates,
and reduce the time needed to circulate the well clean at TD. This again leading to saved rig time. To
achieve optimal time saving in this category, the correct use of ASMs can be a key factor.
4.4.5 - Trip Speed Optimization This last batch is the trip speed optimization. This will not account for the majority of time saved, but still
plays a certain role. This shows time-savings while tripping in/pulling out of the hole. Surge and swab

39| P a g e
events limit the tripping/pulling speed. The definition of a surge event is the creation of an unwanted high
pressure in the wellbore while running in hole and worst case this pressure ends up fracturing the
formation. The opposite of a surge event is a swab event. Swab events are when creating a vacuum behind
a drill string component while pulling the string out of hole, and worst case swabbing unwanted fluids into
the wellbore. Unwanted fluid in the well bore can affect well stability and this again affecting the safety
of the entire operation. Time-savings in this category are likely to increase in the future, as ASMs and
automated drilling becomes more and more common. Read more about the future of ASMs and
automated drilling in section 5.3
Figure 13: The NetCon in use (DrillingContractor, Drilling Contractor - WP content, 2015)
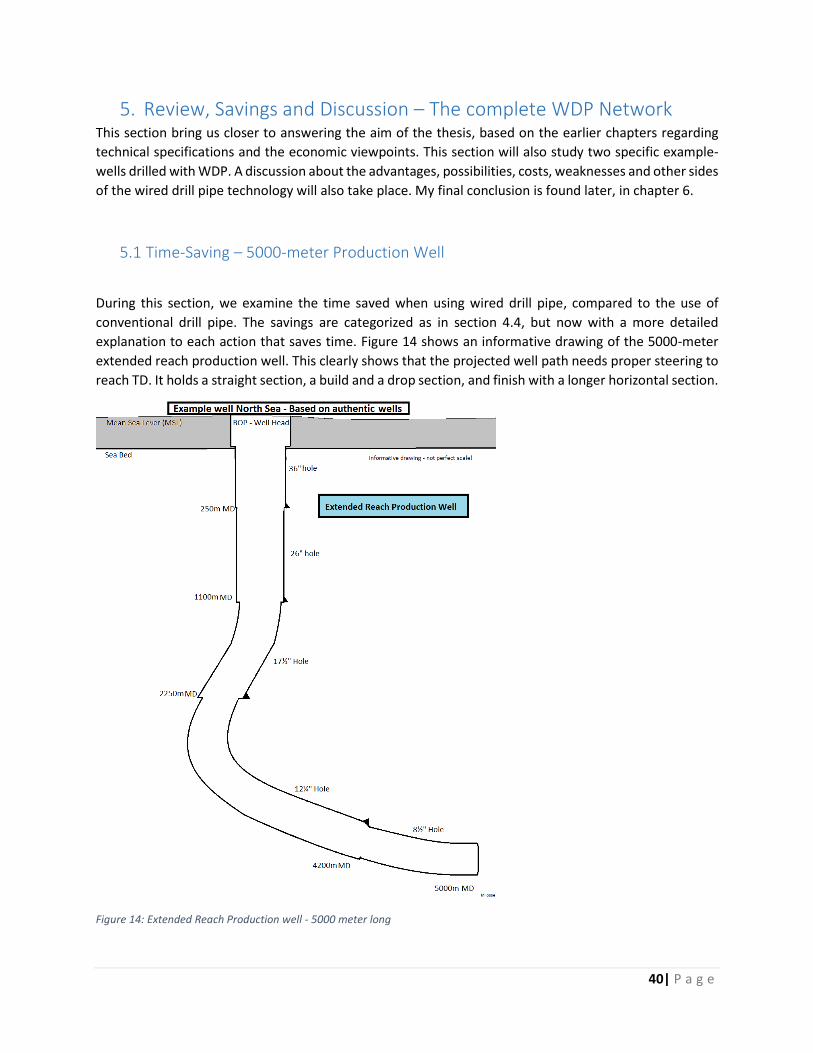
40| P a g e
5. Review, Savings and Discussion – The complete WDP Network This section bring us closer to answering the aim of the thesis, based on the earlier chapters regarding
technical specifications and the economic viewpoints. This section will also study two specific example-
wells drilled with WDP. A discussion about the advantages, possibilities, costs, weaknesses and other sides
of the wired drill pipe technology will also take place. My final conclusion is found later, in chapter 6.
5.1 Time-Saving – 5000-meter Production Well
During this section, we examine the time saved when using wired drill pipe, compared to the use of
conventional drill pipe. The savings are categorized as in section 4.4, but now with a more detailed
explanation to each action that saves time. Figure 14 shows an informative drawing of the 5000-meter
extended reach production well. This clearly shows that the projected well path needs proper steering to
reach TD. It holds a straight section, a build and a drop section, and finish with a longer horizontal section.
Figure 14: Extended Reach Production well - 5000 meter long

41| P a g e
The well profile is based on authentic wells in the North Sea. We will now look closer on the time saved
when using wired drill pipe to drill this well. Every category will be closely examined and explained during
this analysis of a 5000-meter long well. Afterwards we will study the shorter exploration well with the
same accuracy.
Figure 15 on page 43 shows the summary of time saved when using wired drill pipe instead of regular drill
pipe to drill this production well. The detailed input and output data/figures for this summary are located
in Appendix C. Appendix C also shows which category and sub-category saving the most time. All input
data used are thoroughly advice from a very experienced directional driller, with over 30 years of
experience in this field, now working for Baker Hughes (BHI & Williams, Directional Drilling - Facts, 2015).
The drilling ROPs for each section are from an anonymous well, drilled in the North Sea using RSS (rotary
steerable assembly). RSS is a method of steering the well while drilling, instead of using a down hole
motor, with pre-determined angle. The RSS is a part of the BHA, located close to the bit. It rotates together
with the string, but at a slower pace (designed bearings makes it possible for the RSS to rotate at much
lower RPM than the drill string itself). There are sensors keeping track of directions, so the directional
driller are able to steer the well path in desired direction.
Data Transmission. We start looking at the time saved on data transmission. When it comes to data
transmission through WDP (for more info see section 4.4.1), this is the easiest quantifiable way of saving
time. Time saved is directly and intuitively recognized by adding up all the minutes spared on
communication with downhole tools. For this 5000-meter long well there are quite a lot of communication
needed to actually follow the projected well path. To do so, the directional driller, with help of the MWD
engineer, use the system software and communicate with the tools. There are procedures on when to
engage in such communication, but also several unwritten rules of thumb to follow, depending on each
directional driller’s experience.
It is procedure for most directional driller to do a survey on every connection, but when there is a lot of
steering involved, surveys are also taken on-bottom (while drilling). The time interval of taking a survey
can vary, but on average, a survey takes 3 minutes using conventional methods (BHI & Williams,
Directional Drilling - Facts, 2015). When using wired pipe, just on surveys alone, the savings for this well
ads up to 8.3 hours. 8.3 hours only account for the good surveys taken on connection; now let us include
repeated surveys (repeated because the first survey was bad - no confirmation, bad signal etc) and the
surveys mid-stand when steering. Total time saved on surveys alone now ads up to 14.5 hours.
When drilling with RSS, which is the most common way of steering in the North Sea today, downlinks (tool
commands) need to be sent on regular basis. Downlinks are commands sent from the MWD engineer’s
software to the downhole tools. These commands often regards steering, but can also be about
activating/deactivating tools. On this well, the WDP technology saves close to 14 hours on downlinks.
Before drilling a new section, a test of the formations integrity is standard procedure. There are varieties
of different tests used, depending on the operator. These tests consists of recording data downhole
(mainly pressure), while exerting additional pressure on the wellbore, in a controlled environment. After
the test is complete, the recorded data are in most cases sent to surface, using the conventional telemetry.
42| P a g e
This process can take quite some time, because of limitations on transmission speed of wireless
communication. With the wired pipe, the pressure data is received real time during the test, and for this
well saves 0.8 hours. You will save approximately 10 minutes on each test performed.
Adding up the data transmission batch, this saves 29.3 hours on this particular well.
Drilling Performance - ROP. When it comes to drilling performance the time-savings are not as easily
quantified as the data transmission time. I will divide this category into four sub categories. Shock and
Vibration, ECD management, Formation Evaluation (FE) and Directional Control.
Shock and vibration is a common challenge when drilling the latter section of the well, and by receiving
more real time data at 5-second intervals, compared to the conventional 1-2 minute intervals, it is now
possible to act much faster to optimize the drilling parameters.
The high focus on ECD management during the drilling process is vital. As mentioned earlier, it can be
hard to ascertain optimal hole cleaning, however, combining optimal flow rate with optimal ROP goes a
long way. ECD management and hole cleaning are closely related, since if cuttings are accumulated
downhole, the ECD will increase and you have to decrease the ROP. The faster ROP, the more cuttings
created down hole, and the more important it is to keep the correct flowrate to obtain optimal hole
cleaning. Having the quickly updating data present makes it possible to optimize the ROP, and still keeping
ECD management under control.
For reservoir sections essentially, the Formation Evaluation are very important. This often limits the ROP,
affected by the limitation on transmission speed when using wireless telemetry. E.g. the operator sets a
minimum number of data points sampled per meter – minimum acceptable resolution on the real time
formation logs. If the ROP goes above a certain point, the tools will still sample at sufficient rate, but it
will only save these high definition logs as memory data downhole. For the gathered data to be available
on surface in real time, it needs to be transmitted. Here, the limiting factor again is the transmission speed
available for sending data to surface. These real time data are very important, since it is these data the
geologists uses to pinpoint core-points, casing depths or geo-steering the well path, when drilling inside
the reservoir. When using wired communication this limitation is no longer an issue, it is the exact
opposite. The data sent to surface are now real time memory data (which normally is stored in the
memory of the tool, and dumped on surface for analysis after the section is complete). The real time data
with conventional telemetry holds 1-2 minute interval updates and ok resolution. The wired drill pipe
provides much more data, with greater resolution, which results in today’s possibility to drill with a higher
ROP, without compromising safety and definition of the FE logs.
During the middle sections of the well, i.e. 17½ and 12¼” sections, the need for Directional Control is
significant. Being able to spot unwanted deviations from the well projection sooner, will help the
directional drillers’ confidence and give him opportunity to use a higher overall ROP for the sections. These
sections are often the ones with most build/drop angels in them. The end of these build and drop sections
are often the starting point for a horizontal 8½” section.
The calculations shows that for all the different sections, one can increase the ROP with approximately
15%. The adjustment on how big of an impact the input will have can be adjusted, and after discussions

43| P a g e
with representative personnel, I decided to be conservative with the adjustable features of the calculator
(NOV R. T., 2015).
Adding up the drilling performance batch, this saves 26.4 hours on this particular well.
Run Reduction. During drilling of a well, occasional need for additional unplanned BHA-runs arises. These
non-planned events most often happen because of tool, string or bit failures. Amongst the wells drilled
with WDP in different locations around the world, a reduction in BHA-runs needed to complete a well is
significant (NOV R. T., 2015). Run reductions are related to quicker response on warning signals, and less
exposure to unwanted wear on tools, string and bits. To trip for failure is a costly act. Intuitively the longer
the well, the more time is wasted. It is hard to determine an average amount of time spent on tripping
(from drilling stops until it continues); this naturally depends on the particular well paths and limiting
factors when tripping. More about these factors in section 4.4.5 “trip speed optimization”. For this
particular well, using the average count of unplanned trips encountered because of component-failure,
the savings are significant.
Adding up the run reduction batch, this saves 12.0 hours on this particular well.
Hole Cleaning. As touched upon under the drilling performance section, the ECD monitoring is a vital part
of drilling a well. Now hole cleaning decisions are made quicker, because of frequently updating (5-second
intervals) data in high definition, is displayed and monitored, like never before. This is made possible with
use of networked pipe, and the optional use ASMs. The ASMs optimizing the process of pinpointing
locations of abnormal pressures. The reduction in time spent circulating the well clean are less than the
batches above, but still significant.
Adding up the hole cleaning batch, this saves 6.7 hours on this particular well.
Trip Optimization. Prior to drilling a section, the drill string is made up and tripped into hole. The opposite
happens at the end of a section. After drilling to TD, the string is pulled out of hole and laid out on surface.
The tripping process can be a very time consuming process, especially on longer wells where pressure
margins often are small. Because of the wired drill pipes’ amazing bandwidth and feature of transmitting
signals to surface without flow, it is now possible to optimize the tripping process drastically. Even more
so, with the use of pressure sensors positioned at desired locations along the string (ASMs). These sensors
can transmit live feed data of pressures from anywhere in the wellbore, and thus optimize the tripping
speed. The system can monitor the whole string being tripped safely, without the risk of breaking the
limitations of swab and surge pressures. Per early 2015, as mentioned in section 3.3.6, the ASMs need
further research and development (R&D) to become more precise. Nevertheless, when it in the future will
be possible to combine ASMs downhole and automated drilling systems on surface, which will really show
the benefits of the wired drill pipe network. Read about automated drilling in chapter 5.3.
Adding up the trip optimization batch, this saves 3.5 hours on this particular well.

44| P a g e
An event that the calculator does not take into account is the shallow tool test, which is normally
performed every time a new BHA is tripped into the hole. The length of this test varies, depending what
tools assembled in the BHA. On average this test take somewhere between 10-20 minutes (BHI & Williams,
Directional Drilling - Facts, 2015). So taking our five section well, there will be need for a shallow tool test
on four of these five sections. (There is no need for a test prior to drilling the 36” hole, as this is so close
to the surface anyway). Using the average of 15 minutes per test, multiplying with the four sections,
resulting in another hour saved. The possibility for skipping the shallow tool test is that there is no need
for circulation to communicate with the tools, as we now have the wired connection. Most operators
today still do the shallow tool test, because most third party tools are dependent on flow to power up,
and I will not use this 1 hour saved in any of my calculations further down in this section. Nevertheless, it
is important to mention that in the future there will probably not be any need for circulation to power up
the tools. There will be a simple solution of sending a signal through the wired connection to turn them
on; this is already being worked on by different third parties (BHI & Williams, Directional Drilling - Facts,
2015).
Figure 15: Time-Savings Summary | 5000 meter long well (NOV_Intelliserv, 2015)
As figure 15 shows, the total saving when using wired drill pipe in a 5000-meter long production well, adds
up to almost 78 hours, or 3.2 days. We will closer examine this number and relate these time-savings to
the price tag of operating a drilling installation.
The price tag (ref. table 2 - section 4.3) on all the components needed for a complete wired drill pipe
network, used in a 5000-meter long well, is $4.2 million. However, you have to have some sort of drill pipe
anyway and the price tag on regular drill pipe, with the exact same specifications, is $2.5 million. This

45| P a g e
result in $1.7 million additional cost when using WDP, instead of non-wired drill pipe with the exact same
specifications.
One important aspect, not touched upon yet, is the uptime of the wired drill pipe network (uptime being
the time that the system is working). During different projects, there are noted different results of uptime.
One of the WDP technology projects consisted of drilling five wells, in a highly challenging filed, offshore
in Trinidad and Tobago. During this project, they used the 1st generation of WDP and the project stretched
over a 24 months period (Veeningen, Palmer, Steinicke, Saenz, & Hansen, 2012). The overall broadband
network uptime, as a ratio of the total time that telemetry was required, exceeded 85% throughout this
project (Veeningen, Palmer, Steinicke, Saenz, & Hansen, 2012). Now, over 100 wells have been drilled
using wired drill pipe, and the uptime of the WDP network early 2015, is as high as 91% (NOV R. T., 2015).
This 91% is only taking into account the projects that have been drilled with the 1st generation of pipe.
The 2nd generation of WDP (IntelliServ2Network) have already been on the market for quite some time.
Despite being on the market, not enough wells have been drilled using the 2nd generation pipe that an
average number on uptime is manifested yet (NOV R. T., 2015).
Result:
Doing some calculations, and taking into account that the system on average works 91% of the time, lets
shorten the time-savings found above, with the given 9%. This will give a more accurate number for the
time saved. The calculator bases its final numbers on the system being 100% operative, all the time.
77.9 hours x 91% = 70.9 hours or (2.95 days)
Now we will compare these savings with the figures, found in table 1 - section 4.2, with the cost of
having a semi-submersible drilling rig drilling in the North Sea.
The cost of this, based on the numbers calculated earlier, summed up to $1.0 million per day.
If we now take the savings and multiply with the cost per day, the time saved represents $2.95 million.
Implementing the additional cost of using WDP, which was $ 1.7 million, the overall cost for using WDP
on this well is $1.7 million – $2.95 million = -$ 1.25 million. This means that the operator actually saves
$1.25 million by using the WDP network to drill this particular well. This being under the assumption that
the system is working on average uptime, equal to 91%.
Even if the price of renting a rig and personnel plunged by 50%, and the price of WDP remained
unchanged, the operator would more or less break even on this well. This shows that one have to invest
to save money. In troubled times like the industry are facing today, early 2015, investments in newer
technologies can help you save money.
It is worth mentioning that not all wells drilled, are 5000-meter long with a lot of steering and limiting
factors of different kinds. The following section contains a run-through of another example, using a much
shorter and simpler well path, reaching 2200-meter. This is to set things in a better perspective.

46| P a g e
5.2 Time Saving – 2200-meter Exploration Well
During this example, we will be looking at a shorter well. This well have common well profile for an
exploration well. The profile shown in figure 16 is based on anonymous authentic exploration wells drilled
in the North Sea.
Figure 16: Short Exploration well - 2200 meter long
We will first go through the same categories as the 5000-meter example, without the same level of
explanations to each batch. There is no need to repeat oneself more than necessary.
Figure 17 shows the summary of time saved when using wired drill pipe instead of conventional drill pipe
to drill an exploration well. Detailed input and output figures for this summary are located in Appendix D.
Appendix D also displays which category and sub-category saving significant time. All input data used are
thoroughly advice from an experienced directional driller, with over 30 years of experience in this field,
now working for Baker Hughes (BHI, Directional Drilling - Facts, 2015). The ROPs for each section are from
an anonymous well, drilled in the North Sea using RSS.

47| P a g e
Data Transmission. For this well, the data transmission also holds the largest portion of time saved,
despite the fact that there is no need for the same amount of downhole communication. There is saved
the exact same amount of time on pressure test prior to each section, but the time saved on surveys and
downlinks are less than it was for the 5000-meter well. The RSS downlinks still save some time, adding up
to 4.4 hours, while the surveys, including repeated ones add up to 3.5 hours. This also seems logical, since
this well is under half the length than the production well, and the projected well path does not require
much as much steering. The shape of this well relates to most exploration wells drilled, being more or less
vertical and with the purpose of striking oil in any of the penetrated layers.
Adding up the data transmission batch, this saves 8.8 hours on this particular well.
Drilling Performance -ROP. The ROPs used when drilling explorations wells differ a lot. For this example,
I have chosen to use conservative numbers, with not so high speed, the result being the time-savings also
being a bit conservative. Specifically for exploration drilling, there start of the 8½” section is important
with respect to finding an eventual core point. If there is oil in the predicted reservoir, it will show on the
formation evaluation logs (FE logs) and the drilling will in most cases halt, and conducting a coring
operation. To observe this typical scenario, the geologist are again very dependent on sufficient data from
downhole tools, and when using wireless telemetry the ROP are restricted. Using wired pipe, the driller
can hold a much higher ROP, and the geologist still pick the core point without risking drilling too far.
Updates every 5-seconds are a huge difference to the conventional 1-2 minute update.
Example to demonstrate the combination of high lag time (lag time – the time from the data sampled until
received on surface) and high ROP follows. With an ROP of 40 m/hr, the bit drill through 0.66 meter of
formation every minute. If the data then only updates ever other minute, the bit would in a worst-case
scenario, pass the core point with over 1.3 meter. To give a perspective, when measuring cores on surface,
they are measured in centimeters.
Adding up the drilling performance batch, this saves 5.4 hours on this particular well.
Run Reduction. For a shorter well, naturally the risk of doing unplanned additional BHA-runs are lower.
On the contrary, the drilling location might be highly difficult, with hard formations and unpleasant
downhole environment. Nevertheless, the time spent tripping are likely to be shorter, because of the
wells’ length.
Adding up the run reduction batch, this saves 4.0 hours on this particular well.
Hole Cleaning. This category is always of major importance, since you are likely to end up in unwanted
well control situations if the hole cleaning is not sufficient. The same surveillance of ECD and standpipe
pressure is vital, and if possible, obtaining optimal hole cleaning throughout the section reduces time
spent circulating off-bottom.
Adding up the hole cleaning batch, this saves 4.4 hours on this particular well.

48| P a g e
Trip Optimization. The limitations on this well is only set to 200 meter. These 200 meters would typically
represent the reservoir section, where the danger of swabbing in fluids normally are higher. Only a
neglectable portion of time is saved on trip optimization.
Adding up the trip optimization batch, this saves 0.2 hours on this particular well.
Figure 17: Time-Savings Summary | 2200 meter long well (NOV_Intelliserv, 2015)
As figure 17 shows, the total time-savings on this exploration well adds up to 22.8 hours, or 0.9 days.
Down below we bring the cost figures into the equation, and calculate the result.
Result:
The price (ref table 2 – section 4.3) for wired drill pipe and surface equipment, to drill this exploration well
sum up to $1.98 million. Regular drill pipe have the price tag of $1.1 million and this leaves the additional
cost of WDP to be $0.86 million or $860 000.
Next, we will be subtracting the 9% of downtime on the system, leaving us with 20.7 hours, or 0.86 days.
Now converting the time saved to the a sum of money, taken ground in the fully operational drilling rig,
that costs $1 million per day, the savings equal $0.86 million, or $860 000.
If we now subtract the savings, from the additional cost of using wired drill pipe, the operator saves
$860 000 - $860 000 = $0. In this particular case, only accounting for price, it would be indifferent using
regular drill pipe or wired drill pipe, they would break even on the dollar. Most likely, the operator would
choose to use the WDP, when keeping in mind all the other advantages with this technology. There will
be a lot more about possibilities, advantages, disadvantages, and general discussion about the wired drill
pipe technology in section 5.4.

49| P a g e
5.3 Automated Drilling and ASMs
Fully closed-loop automated drilling systems are now under development, that with a rising level of
interest. Very likely, a realistic future situation is where computers are in charge of adjusting the drilling
parameters while drilling. The necessity of human supervision and override possibilities for the
computerized system might be reality, but ideally, the computerized systems can completely operate on
their own. Possibly, the main-reason for not seeing an earlier commitment to the research and
development of automated drilling systems, have been the limitations on telemetry speed. Making a
system that acts on real time data, which in reality has a lag time of 2-3 minutes, would not be reasonable.
With new technology as WDP, providing real time data at speeds up to 57 600 BPS mitigating lag time
drastically, this is a realistic scenario. More about why and how, down below.
First, let me elaborate what I mean by a fully closed and automated drilling system. As of now, with the
possibility of using WDP technology, receiving huge amounts of downhole data instantly, is the new
reality. This was not the case ten years ago. Now, high definition data from a 4000-meter long drill string
can be present on drill floor with as little as 3 seconds lag time (Pink, Koederitz, Barrie, Bert, & Overgaard,
2013). This makes it possible for a computer on surface to interpreted these data, and adjust surface
drilling parameters accordingly, in “real” real time. These adjustments on surface will lead downhole
parameters changing and then the sensors will make new reading that are sent back to surface (this
happens continuously throughout the drilling operation). The surface computer will then continuously
interpret the new feedback data, and adjust surface parameters accordingly.
This computer would know exactly how to adjust surface parameters, to gain the wanted optimal
downhole parameters. For downhole readings to be precise, it is necessary to have downhole sensors
measuring the wanted parameters like downhole WOB, torque, bending, rpm etc. Many of the downhole
parameters estimated/calculated from values measured by surface sensors, and then the downhole
parameters are calculated from the surface readings. The problem with these methods are that it is not
given that the sensors on surface always give exact calculations/readings of downhole parameters. Let
me demonstrated by giving an example of how weight on bit readings often are executed today.
Different sensors for weight on bit (WOB) readings exist, but a calculation method is often used. This
method takes the calculated weight of the drill string (adding up all the components, always accurately
measured before tripped in hole), subtracts the actual sensor reading for the weight of the drill string,
and the difference between these two numbers, will represent the weight on bit.
Formula:
“Calculated weigh of the drill string” – “Actual weight on hook” = “WOB”
Example values: 200 tons – 195 tons = 5 tons
The sensor on surface measuring the weight of the drill string should always be calibrated prior to tripping
in hole. The problem with this method is that there is no guarantee that the weight difference is the actual
WOB, it could just be a different component hanging up on some ledge down hole, and thus you are
somewhat blind to real downhole parameters.
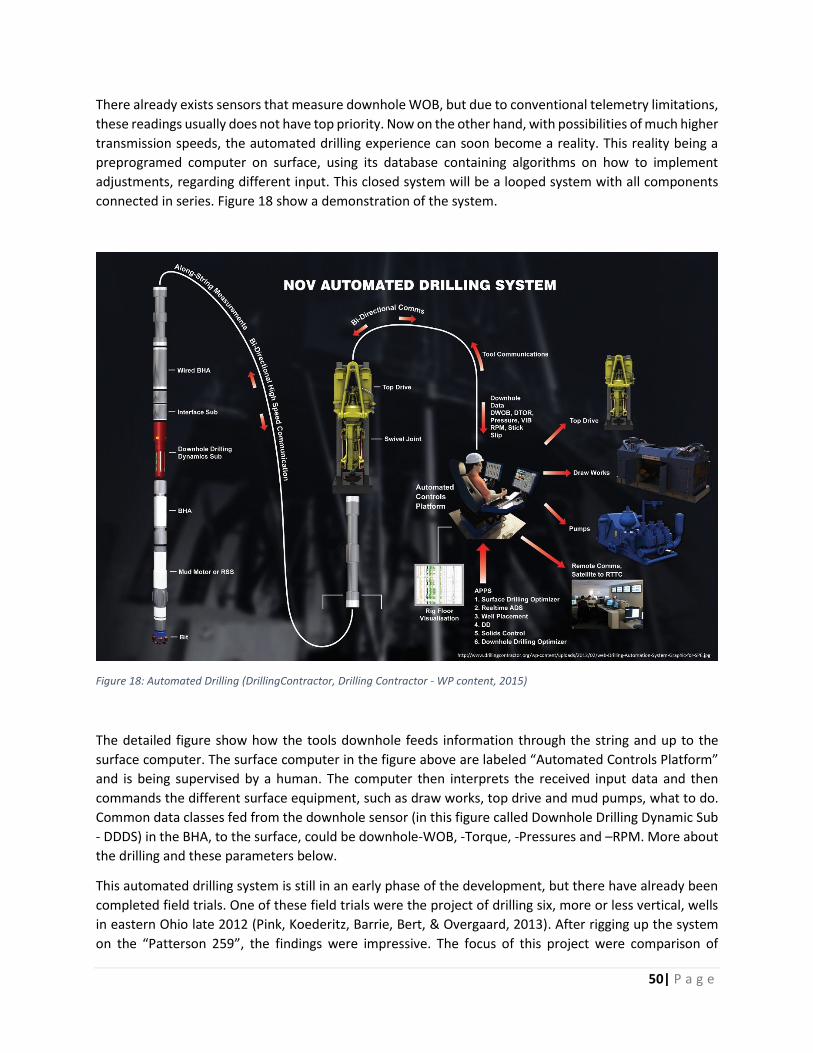
50| P a g e
There already exists sensors that measure downhole WOB, but due to conventional telemetry limitations,
these readings usually does not have top priority. Now on the other hand, with possibilities of much higher
transmission speeds, the automated drilling experience can soon become a reality. This reality being a
preprogramed computer on surface, using its database containing algorithms on how to implement
adjustments, regarding different input. This closed system will be a looped system with all components
connected in series. Figure 18 show a demonstration of the system.
Figure 18: Automated Drilling (DrillingContractor, Drilling Contractor - WP content, 2015)
The detailed figure show how the tools downhole feeds information through the string and up to the
surface computer. The surface computer in the figure above are labeled “Automated Controls Platform”
and is being supervised by a human. The computer then interprets the received input data and then
commands the different surface equipment, such as draw works, top drive and mud pumps, what to do.
Common data classes fed from the downhole sensor (in this figure called Downhole Drilling Dynamic Sub
- DDDS) in the BHA, to the surface, could be downhole-WOB, -Torque, -Pressures and –RPM. More about
the drilling and these parameters below.
This automated drilling system is still in an early phase of the development, but there have already been
completed field trials. One of these field trials were the project of drilling six, more or less vertical, wells
in eastern Ohio late 2012 (Pink, Koederitz, Barrie, Bert, & Overgaard, 2013). After rigging up the system
on the “Patterson 259”, the findings were impressive. The focus of this project were comparison of

51| P a g e
downhole WOB (DWOB) to surface WOB (SWOB), and adjustments of the surface parameters to optimize
drilling performance. By allowing an automated “WOB controller” to adjust surface parameters, the
results were significant. In the curved sections of the wells, the fluctuations on DWOB decreased by 93%,
by going from 28-226% variations from the average, to 8-9% variations from the average (Pink, Koederitz,
Barrie, Bert, & Overgaard, 2013). Observation from the straight sections, showed 86% decrease in
variations. This further resulting in increased average ROP by 23% (Pink, Koederitz, Barrie, Bert, &
Overgaard, 2013).
These figures shows the opportunities that lies within the use of an automated drilling systems. The main
reason for this technology now made possible is the wired drill pipe technology. WDP providing high
speed, high definition and data with high reliability, at very low lag time. In this section, it would also be
natural to mention the ASMs one more time. The only sensor mentioned feeding signals to surface this
far have been the Downhole Drilling Dynamic Sub (DDDS). Now, imagine a variety of ASMs placed along
the drill string, operating in the exact same way as the DDDS. This will provide data from the entire well
bore, not just the bottom of the string. This feature will give room for even more applications and data
sampling.
It will probably take years, if not decades, before this technology is standard inventory of every drilling
installation. One of the reasons for this statement is the complexity of this technology. The complexity of
interpreting all input, how to prioritize received data and what changes to implement on surface, to
optimize downhole parameters. In the future, when multiple ASMs most likely become a normal part of
the drill string, the 57 600 BPS transmission speed might not be enough, and the telemetry ends up being
the limiting factor once again. This is how technology works, by changing the limiting factors, forcing
improvements and innovation to increase the efficiency of services.
The singular activity of drilling a hole in the ground is relying on multiple persons working on site. The rig
crew have a vast number for day-to-day tasks needing fulfillment, just to keep the rig in continuous
operation. Another benefit of automated drilling operations, are less human handling of heavy
equipment, leading to a safer workplace. The less human exposure to all sorts of operations, the less
chance of human error leading to accidents. I am not going to try to predict the future, but in the years to
come, it is most likely for humans to perform more repair and maintenance related tasks, than the
operational tasks themselves, which will most likely be performed by automated machines.
Looking back in time, there is more than enough proof of situations where machines have taken over
human tasks. Looking at the manufacturing industry, where today, machines solely complete most tasks.
Humans complete the repair and maintenance of these machines that took over their old jobs. In most
cases, this improves cost-efficiency for the operator and save the owner a lot of money. Having said that,
automation often also results in safer working environment for the employees. Mitigating human
exposure to unsafe/hazardous working environments, by using remote-controlled machines, will lead to
fewer accidents. An example of such an event is the use of ROV to complete underwater inspections
offshore. Now a Remotely Operated Vehicle have taken over the role of the human divers. Instead of the
humans being in the water, these humans can now safely sit onboard the rig, and operate this “robotic-
diver” to complete the inspection for them.
This thesis will not go any deeper into the advantages and disadvantages of an automated drilling system,
but have now simply shown the importance of having a high bandwidth network for this technology to
become reality.

52| P a g e
5.4 Discussing Wired Drill Pipe Technology
The wired drill pipe technology provide many new possibilities. Succeeding is a discussion on how WDP
technology makes it easier and more efficient to overcome operational challenges met on a daily basis.
We look upon where it provides new solutions, but also on what the more negative sides of the technology
is. The drilling operation is a part of the upstream process, as explained in section 2.2, and some of the
challenges encountered during drilling can be found in section 2.4.
To keep everyone and everything at minimum risk is always a challenge. Keeping the workplace as safe as
possible is a top priority for all companies. Accidents of certain severity have enormous consequences for
everyone involved. Not limited to events like loss of life and/or sever injuries, but also environmental
accidents like oil spills, which are hazardous to wildlife and causes costly cleanup operations. The wired
drill pipe technology might not directly minimize these risks, but indirectly it helps to prevent smaller
issues becoming bigger accidents. We also look specifically into how this technology improves the
operational tasks directly, and as a side effect leading to better safety for the environment and the
personnel on site.
The amount of data transmitted to surface is no longer limited in the same way as it would be when using
conventional telemetry. With a bandwidth of 57 600 BPS, the data you want displayed on surface can be
handpicked by the personnel involved. The possibility to receive memory data in real time on surface bring
us into a new era of real time monitoring. Example follow.
You are now able to monitor every sensor in the BHA, instantly. The BHA often consists of many different
tools. Tools that the driller and directional driller are dependent on working, to be able to drill the section
to TD. If some of these tools fail or turns bad, the result is often to perform a trip for failure. With WDP
technology, providing real time data from all the sensors located in the BHA, this gives the driller the
opportunity to react on unwanted parameters, thus saving equipment from destruction.
Example: Lateral vibrations is an unwanted phenomenon to encounter while drilling. These vibrations
destroy your components quite quickly, so they need to stop as soon as possible. When using conventional
telemetry, the sensors transmitting signals of lateral vibration might only be 2 out of 4 sensors in total,
due to telemetry limitations. These two sensors are often located in each end of the BHA, and thus it is
very hard to spot lateral vibrations in-between these points. (The option is to go through all the memory
logs after the section is drilled, and then use these data as a “lessons learned” for next section. You will
have no guarantee that the implemented changes will decrease lateral vibrations in the BHA during drilling
of the next section, since every section is unique.) The driller’s possibility to have a screen displaying all
the sensors in the BHA real time, gives him the opportunity react and thus minimize the amount of
unwanted parameters exerted on the drill string components. The result of interacting at the correct time
makes it possible to drill longer sections without tripping for failure. As mentioned during the example
wells, the run reduction is a result from having the option to display data from all the sensors downhole,
and to react in time. This will save a lot of tools, bits, and other components as well as rig time. The
advantages mentioned above in this section are dependent on having a driller that knows how to use all
the new parameters available, when using WDP technology.

53| P a g e
This takes us to an important aspect of using WDP technology, something I chose to name the adaptation
phase. There are so many new possibilities regarding data transmission that all the personnel involved
need some time getting comfortable with using the technology. Most drillers, directional drillers,
geologists and other personnel involved need this phase to adapt, to start taking full advantage of the
WDP network features. This also goes for the roughnecks on drill floor, which handle the wired drill pipe
components. Every single WDP component needs handling with more care than regular pipe. It is not just
a regular drill pipe made of steel anymore, it now holds coils in every tool joint and an exposed cable
stretched through its inside. This means the roughnecks need to change some of the ways they usually
handle regular pipe, they need to be more aware when handling WDP. The adaptations phase apply for
most new activities, it take some time getting used to new equipment.
Another point, which in my opinion makes it hard for the WDP technology to enter the market, is
skepticism. The oil industry is a very conservative industry, even though it in later years have seen great
benefits of new technology. Many of the new technologies only get a few shots to prove itself; if not
successful/accepted, it is most likely the end for that particular technology. Either, it is over forever, or at
least until someone comes along and significantly improves the technology and then make a new attempt
to get acceptance. In my opinion, after asking around about the wired drill pipe technology, most people
are skeptical to all parts being connected in series. Connected in series means that if one component dies,
you lose connection with the complete string. On the contrary, it is important to mention that the uptime
is surprisingly high at 91%. This percentage is only representing the wells drilled with 1st generation pipe.
If more customers knew about the actual uptime of WDP technology, it would get more acknowledgment
and quicker achieve acceptance from the industry. Commercialization of the IntelliServ network took
place in 2007 (Pixton, Graig, & NOV, 2014), and now in 2015, I think it is on the verge of getting more or
less complete acceptance from the industry. It have soon persisted 10 years in the industry, and this under
contract by a numerous oil companies, with notable results. The 91% uptime might not still be sufficient
in this high-demanding industry, but it is getting better and better with time.
The time-savings shown in the examples earlier in this chapter, clearly states how the oil companies can
save money using WDP. If an operator are in the planning phase of a new field, they can contact the
providers of WDP technology and get calculations on how many wells they need to drill to break even.
The result then shows if the oil company will save money on using WDP technology, or if it will not, thus
making it easy for the operator to choose to invest in WDP. The time-saving part of the technology is what
the provider of WDP technology must use to sell their product to their customers. Then, in addition,
explain all the other features and advantages of using their high-bandwidth communication network. In
my opinion, if the customer comes close to a break-even price (the additional cost of investing of WDP
equals the time saved on transmission speed) on the time-savings alone, they should highly consider using
WDP instead of regular drill pipe. Another important aspect of downhole communication and data
transmission is visibility.
Visibility is mentioned as one of the challenges encountered in the industry. Visibility being the ability to
see what is going on downhole, through communication with tools. When using regular drill pipe and mud
pulse telemetry, it happens that bad decoding appears and false values are displayed on the monitor.
These bad data points are decreased to a neglectable amount when using WDP technology. The reason
being that there now is a physical cabled connection between the sensors and the software interpreting
the signals, leaving no room for misinterpretation. As mentioned earlier, the average uptime for the 1st
generation WDP is 91%, leaving an average of 9% downtime. Theoretically, this means that the driller is
54| P a g e
completely blank on downhole information 9% of the time during drilling. In reality, this is of course not
the case. When using WDP technology you always run the conventional mud pulse telemetry as backup.
Therefore, if the WDP network lose connection, you can continue drilling using conventional telemetry.
The uptime is likely to increase from 91% as the 2nd generation becomes standard, but regardless, bad
data points related to decoding will not be an issue when using WDP technology.
Another number, which are changing with time, is the price of oil. The oil price have been steady above
100$ per barrel during later years, until the price plunged during late 2014 and early 2015. This huge drop
in price already show huge impacts on the industry, where bigger headcounts and cost saving
measurements are implemented. During such hard times, newer technologies can be of help to reduce
cost, but to get the managements approval to invest in new technology during down-periods are rare.
Therefore, the low oil prices now a day will most likely have an impact on amount of upcoming wells
drilled with WDP technology. The fluctuation in oil price is not a new phenomenon, it have been like this
since the beginning of the industry, and will most likely stay the same in the future. These slow times can
halt the development for some period, especially if the company providing WDP technology are not able
to make profit, which again is invest in research and development to improve the WDP technology.
A different aspect, which is worth touching upon, is the ability to send and receive data without flow or
continuous fluids in the well. E.g. during tripping or loss situations. This ability to use the wired pipe,
instead of wireless communication, can have many positive applications. For instance, the ability to
receive trustworthy data while in a loss situation. This will increase knowledge about the downhole
conditions, and lead to making correct decisions in a timely manner. In situations like these, where you
are in risk of losing the well (losing the ability to continue drilling the well path –result being that you need
to cement back the drilled hole and create a sidetrack), making correct decisions within short time is
crucial. Without the WDP technology, it can be very hard to establish any form of communication with
the downhole tools, actually leaving you blinded regarding downhole conditions. As mentioned earlier, it
is also very hard to establish downhole communication when there is a variety of different fluids in the
wellbore. This option to communicate without flow also saves time during formation pressure tests. There
is no need to pulse the test results to surface after test completion. With WDP technology, the test results
are received on surface in real time, throughout the execution of the test, which is not the case when
using regular drill pipe.
Environment and “unlikely events” were both mentioned in the beginning of the thesis. The WDP
technology does not directly improve the environment at the rig site, but indirectly and proactively
contribute to avoid spills and disasters. With quicker updating cycles, more reliable data, and without the
need for a consistent fluid medium to communicate with tools downhole, it decreases the chance of
making mistakes. These mistakes, now avoided with the use of WDP technology, could have developed
into bigger “unlikely events”, with terrible environmental impacts.
Due to the high speed of data transmission, the result of sending on-bottom downlinks will no longer
affect the sampling of FE data, making gaps in the FE logs. When drilling, using regular drill pipe and mud
pulse telemetry, an on-bottom downlink would lead to loss of sampling data during the time interval
where the downlink is sent, received and interpreted. Depending on the ROP at the time of downlinking,
you would lose different amounts of data for the FE logs. With ROP equal to 30 m/hr, you could lose up
to 3-4 meter of sampling data on one downlink (BHI & Williams, Directional Drilling - Facts, 2015). When
55| P a g e
using WDP technology, the downlink takes around 5 seconds, and the result being no data lost and no
gaps in the FE logs.
The additional price of the wired drill pipe will of course have a big impact on getting acceptance within
the oil industry. As mentioned in the cost chapter, accurate and detailed pricing are dependent on what
specifics you want your drill string to hold. It will always be a more expensive option to choose the WDP
over the regular drill pipe, but looking at it in a bigger picture; you might end up saving money. In many
cases, the additional price tag of WDP combined with lack of knowledge about the technology will leave
potential customer to stick with old habits, and continue drilling with regular drill pipe instead of WDP.
With these last words, I would like to end this discussion and move on to present my final conclusion.

56| P a g e
6. Summary and Conclusion My final conclusion follows.
The wired drill pipe technology has come to stay. It will endure into the future, and most likely become
more or less a revolution within the field of downhole communication. This thesis have already explained
how WDP technology works and what makes it so distinct from regular drill pipe and conventional
telemetry. During the discussion, there were a lot more positives than negatives. The negatives standing
out were price, lack of knowledge and the 9% average downtime.
It is highly important to have a reliable system when working in the oil industry, and WDP technology still
have a few steps to climb. The uptime of 91% is a lot higher than most oil companies today actually are
aware of, but getting these 91% closer to 100% will most certainly increase the demand for WDP
technology.
The price of wired drill pipe are depending on what specifications of the pipe, but the extra cost (compared
to regular pipe) will in most cases be returned in favor of time-savings, data-definition, data-availability
and data-reliability. The value of certain data are hard to quantify, but the ability to make correct decisions
based on real time high definition data will save time and money. The skepticism to new technologies will
not work in the favor of WDP technology, but with growing knowledge about the reliability (which is now
becoming even better with the 2nd generation of pipe), I think this skepticism will pass, and the technology
will find its place in the history of the drilling industry. With all the benefits made possible with wired drill
pipe technology, it is in most cases economically beneficial for the user/buyer.
The transmission time is outstanding, while the quality and definition of the data is nothing less. The user
friendliness of the NetCon is great, and the advantages that comes with the possibility of having ASMs in
the drill string are huge. The best is yet to come in regards of ASMs, but WDP technology makes the
optimal use of ASMs possible, which is a huge advantage. In addition, the WDP network will play an
important role in making fully automated drilling rigs possible, operating with minimal human interaction.
Automated drilling will most likely increase the safety on the rig directly, due to less room for human
error, but automated drilling as the operating standard is probably still some years away. Nonetheless,
the safety onboard the rig will increase when using WDP technology today as well, due to the great
visibility of downhole conditions. With these reliable data at hand and qualified personnel to take
advantage of the vast amount of data, decision-making are optimized and drilling operations are carried
out in a more safe and efficient manner.
Based on the research and writing of this thesis, I would most certainly say that the wired drill pipe
technology provides more than enough usable possibilities to make up for its cost. My strongest opinion
state that WDP technology will get complete acceptance in the oil industry in the near future, and that
the technology will be the standard way of communicating with downhole tools for years to come.

57| P a g e
References
BHI, D. D. (2015, 02 26). Directional Drilling - Facts. (M. Fosse, Interviewer)
BHI, D. D., & Williams, S. (2015, 02 26). Directional Drilling - Facts. (M. Fosse, Interviewer)
Bjerke, E. (2009, 01 23). Så mye koster en letebrønn. Dagen Næringsliv, 2. Retrieved 03 23, 2015, from http://www.dn.no/nyheter/energi/2009/01/23/sa-mye-koster-en-letebronn
Corporation, E. B. (2015). Extreme Oil. Retrieved from The History: http://www.pbs.org/wnet/extremeoil/history/
DrillFaster. (2015, 04 02). DrillFaster NOV. Retrieved from DrillFaster NOV: http://www.nov.com/intelliserv/drillfaster/
DrillingContractor. (2015, 03 30). Drilling Contractor - WP content. Retrieved from Drilling Automated System Graphic: http://www.drillingcontractor.org/wp-content/uploads/2012/02/web-Drilling-Automation-System-Graphic-for-SPE.jpg
DrillingContractor. (2015). WP-content. Retrieved from Wired Drillpipe Content: http://www.drillingcontractor.org/wp-content/uploads/2014/07/IntelliServDataLink.jpg
EIA. (2015, 03). Energy Information Administration. Retrieved from Energy Information Administration: http://www.eia.gov/dnav/pet/pet_pri_spt_s1_d.htm
Halliburton. (2015, 01 21). Sperry Drilling . Retrieved from Sperry Drilling Telemetry: http://www.halliburton.com/en-US/ps/sperry/drilling/telemetry/ixo-interface.page#
Halliburton. (2015). Sperry Drilling - Telemetry. Retrieved from Sperry Drilling - Telemetry: http://www.halliburton.com/en-US/ps/sperry/drilling/telemetry/mwd-lwd-telemetry-systems.page?node-id=hfyjrqux
IHS. (2015, 04 10). Daily average cost of Semi-Sub NorthSea. Daily average cost of Semi-Sub NorthSea. Houston, Texas, USA: IHS.
IntelliServ, A. -N. (2015). Along String Measurements. Retrieved from Partner Support and Integration: http://www.nov.com/Segments/Wellbore_Technologies/IntelliServ/Partner_Support_and_Integration/Partner_Support_and_Integration.aspx
IntelliServ, N. (2014, 10 17). NOV IntelliServ - Electronic Resources. Retrieved from Brochures and Catalouges: http://www.nov.com/Segments/Wellbore_Technologies/IntelliServ/Electronic_Resources.aspx
IntelliServ, N. C. (2015, 01 15). IntelliServ-Product-Catalog-D392004875-MKT-001-Rev-01. Utah, Provo, USA. Retrieved from IntelliServ-Product-Catalog-D392004875-MKT-001-Rev-01: http://www.nov.com/Segments/Wellbore_Technologies/IntelliServ/Electronic_Resources.aspx
IntelliServ, N. R. (2015, 01 15). IntelliServ Product Catalog D392004875 MKT 001 Rev-01. Utah, Provo, USA. Retrieved from IntelliServ-Product-Catalog-D392004875-MKT-001-Rev-01: http://www.nov.com/Segments/Wellbore_Technologies/IntelliServ/Electronic_Resources.aspx
58| P a g e
Linsley, W. J., Rienstra, W. E., & Stiles, A. J. (2002). Giant Under the Hill: History of the Spindletop Oil Discovery at Beaumont, Texas in 1901. Texas State Historical Association.
National Oilwell Varco. (2015, 01 14). Electronic Resources. Retrieved from www.nov.com: http://www.nov.com/Segments/Wellbore_Technologies/IntelliServ/Electronic_Resources.aspx
NOV, I. 2. (2013, 5 1). FINAL D392005027-MKT-001 Rev 02 IntelliServ Handbook. FINAL D392005027-MKT-001 Rev 02 IntelliServ Handbook. Provo, Utah, USA. Retrieved 1 15, 2015, from http://www.nov.com/Segments/Wellbore_Technologies/IntelliServ/Electronic_Resources.aspx
NOV, I. (2014, 01 01). Component and Inspection Certification. Component and Inspection Certification. Provo, Utah, United States of America: NOV.
NOV, R. T. (2015, 02 23). Wired Drill Pipe. (M. Fosse, Interviewer)
NOV_Intelliserv. (2015). Efficiency Estimator. Retrieved from Efficiency Estimator: http://www.nov.com/intelliserv/drillfaster/estimate/
Offshore.no. (2015, 03 23). Rigg Informasjon. Retrieved from Rigg Informasjon: http://www.offshore.no/Prosjekter/rigg-informasjon.aspx?navn=West+Alpha
Pink, T., Koederitz, W., Barrie, A., Bert, D., & Overgaard, D. (2013). SPE 166428. New Orleans, Louisiana, USA: SPE Internationa.
Pixton, D., Graig, A., & NOV, I. (2014). IADC/SPE SPE-167965-MS. Fort Worth, Texas, USA,: IADC/SPE Drilling Conference and Exhibition. Retrieved 2015
Poletto, F. B., & Miranda, F. (2014). Seismic While Drilling: Fundamentals of Drill-Bit Seismic for Exploration. In Seismic While Drilling: Fundamentals of Drill-Bit Seismic for Exploration (pp. 27-59). Elsevier.
Saenz, J. (2014, 1 14). Retrieved from http://www.nov.com/WorkArea/DownloadAsset.aspx?id=10498: http://www.nov.com/WorkArea/DownloadAsset.aspx?id=10498
Schlumberger. (2015). slb about History. Retrieved from slb about History: http://www.slb.com/about/history/.aspx
Staff, H. (2015, 01 22). History.com John D. Rockefeller. Retrieved from History.com John D. Rockefeller: http://www.history.com/topics/john-d-rockefeller
Statista. (2015). Statusta Statistics Oil Service and Oil Equipment providers market value. Retrieved from Statusta Statistics Oil Service and Oil Equipment providers market value: http://www.statista.com/statistics/272712/top-oil-service-and-oil-equipment-providers-based-on-market-value/
Statoil. (2015, 03). Multimedia News and Media. Retrieved from Technology: http://www.statoil.com/en/NewsAndMedia/Multimedia/Pages/2014_08May_Troll.aspx
Veeningen, D., Palmer, J., Steinicke, G., Saenz, J., & Hansen, T. (2012). SPE 151386. San Diego, California, USA: IADC/SPE.

59| P a g e
Appendix
A. Wired drill pipe sizes
The different wired drill pipe sizes available as of today, Q1 2015.
Ref: IntelliServ-Product-Catalog-D392004875-MKT-001-Rev-01 (IntelliServ N. R., 2015).
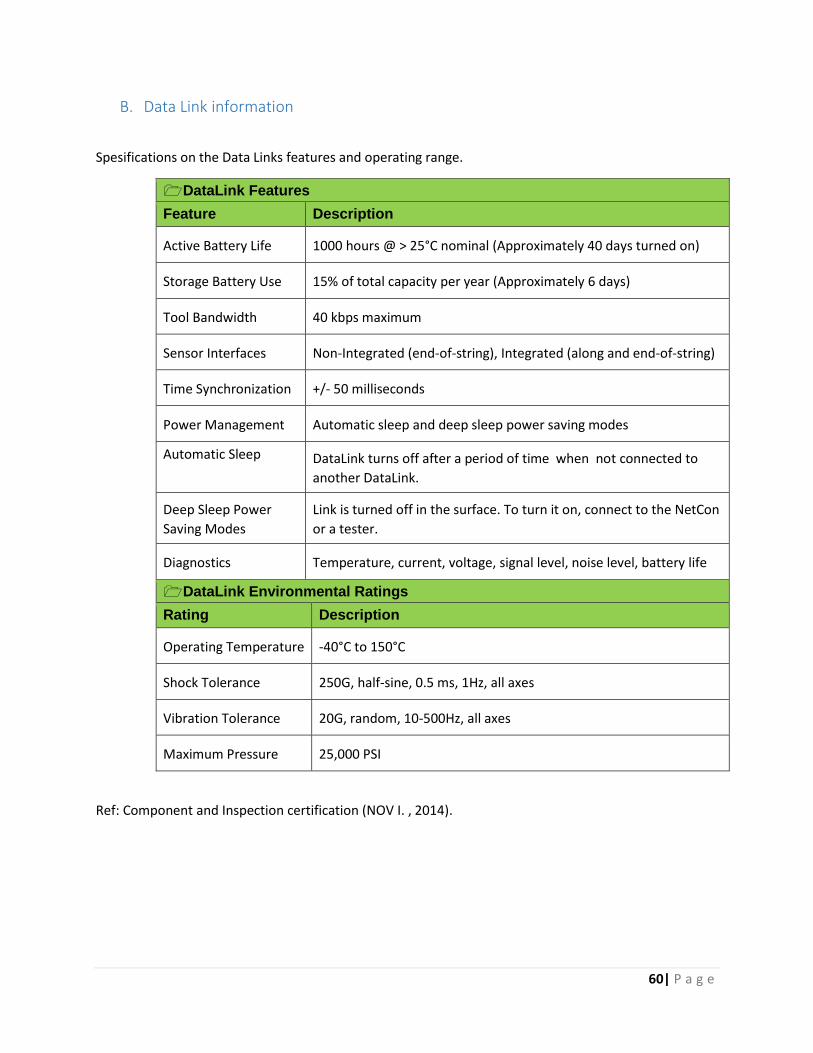
60| P a g e
B. Data Link information
Spesifications on the Data Links features and operating range.
DataLink Features
Feature Description
Active Battery Life 1000 hours @ > 25°C nominal (Approximately 40 days turned on)
Storage Battery Use 15% of total capacity per year (Approximately 6 days)
Tool Bandwidth 40 kbps maximum
Sensor Interfaces Non-Integrated (end-of-string), Integrated (along and end-of-string)
Time Synchronization +/- 50 milliseconds
Power Management Automatic sleep and deep sleep power saving modes
Automatic Sleep DataLink turns off after a period of time when not connected to
another DataLink.
Deep Sleep Power
Saving Modes
Link is turned off in the surface. To turn it on, connect to the NetCon
or a tester.
Diagnostics Temperature, current, voltage, signal level, noise level, battery life
DataLink Environmental Ratings
Rating Description
Operating Temperature -40°C to 150°C
Shock Tolerance 250G, half-sine, 0.5 ms, 1Hz, all axes
Vibration Tolerance 20G, random, 10-500Hz, all axes
Maximum Pressure 25,000 PSI
Ref: Component and Inspection certification (NOV I. , 2014).

61| P a g e
C. Time-Savings – 5000-meter Production Well – Calculator Appendix C: Print-Screen (NOV_Intelliserv, 2015).
Appendix C1 - Total time saved on data transmission: 29.3 hours.
Appendix C2 - Total time saved on ROP increase: 26.4 hours.
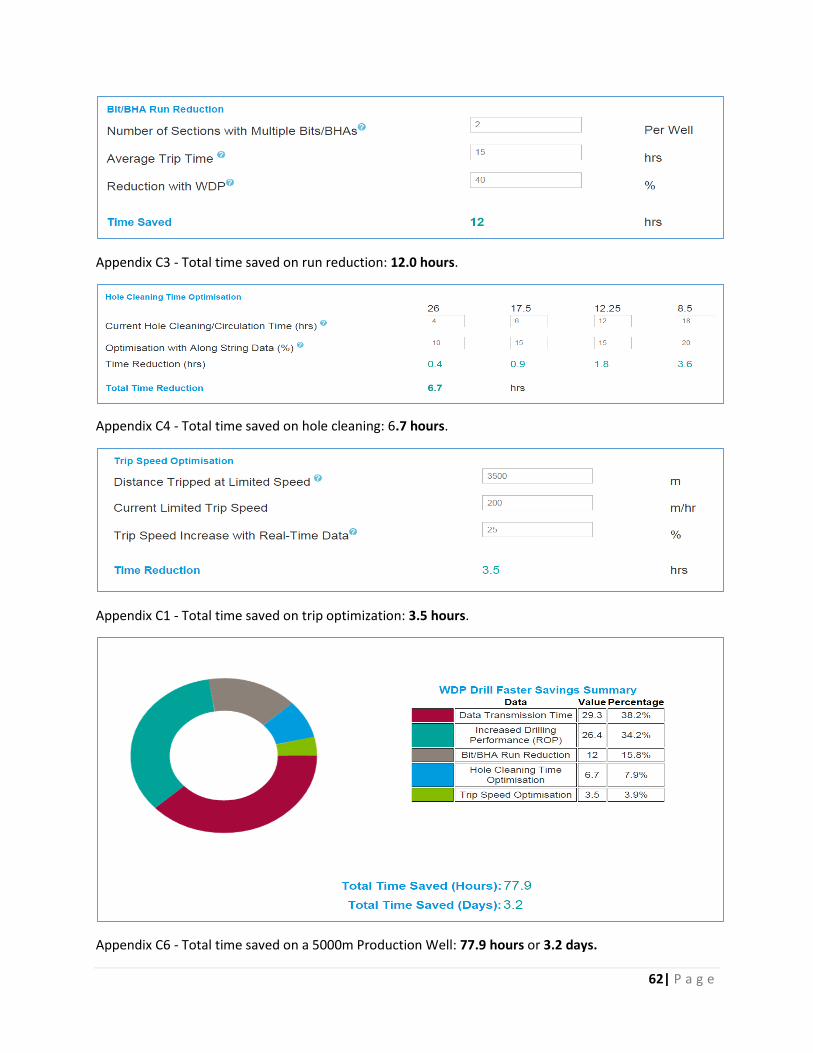
62| P a g e
Appendix C3 - Total time saved on run reduction: 12.0 hours.
Appendix C4 - Total time saved on hole cleaning: 6.7 hours.
Appendix C1 - Total time saved on trip optimization: 3.5 hours.
Appendix C6 - Total time saved on a 5000m Production Well: 77.9 hours or 3.2 days.

63| P a g e
D. Time-Savings – 2200-meter Exploration Well – Calculator Appendix D: Print-Screen (NOV_Intelliserv, 2015).
Appendix D1 - Total time saved on data transmission: 8.8 hours.
Appendix D2 - Total time saved on ROP increase: 5.4 hours.
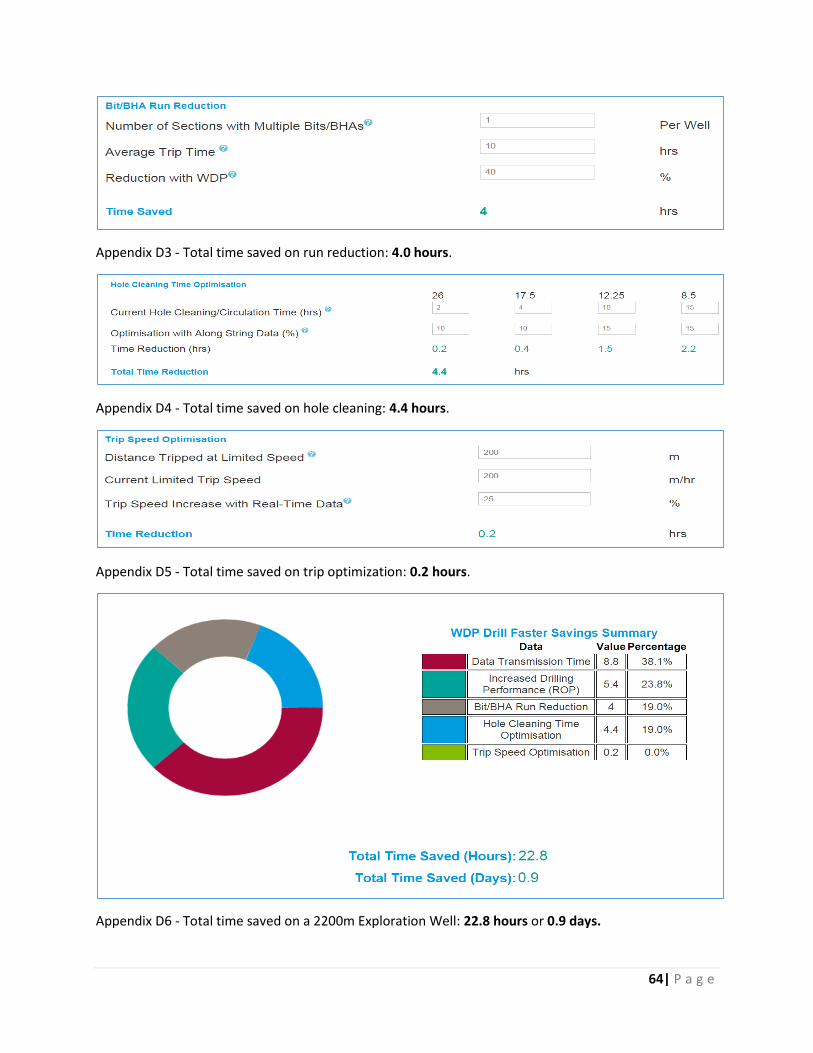
64| P a g e
Appendix D3 - Total time saved on run reduction: 4.0 hours.
Appendix D4 - Total time saved on hole cleaning: 4.4 hours.
Appendix D5 - Total time saved on trip optimization: 0.2 hours.
Appendix D6 - Total time saved on a 2200m Exploration Well: 22.8 hours or 0.9 days.
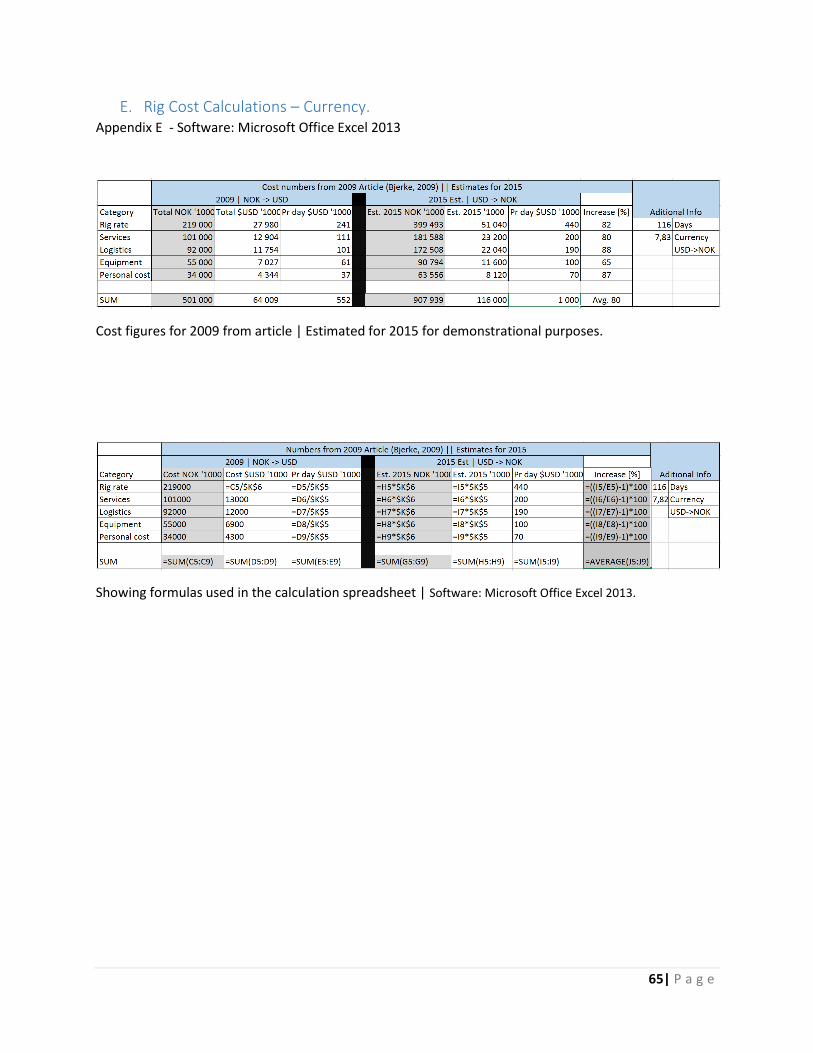
65| P a g e
E. Rig Cost Calculations – Currency. Appendix E - Software: Microsoft Office Excel 2013
Cost figures for 2009 from article | Estimated for 2015 for demonstrational purposes.
Showing formulas used in the calculation spreadsheet | Software: Microsoft Office Excel 2013.