Mowat-Wilson syndrome: growth charts
12
RESEARCH Open Access Mowat-Wilson syndrome: growth charts Ivan Ivanovski 1,2,3† , Olivera Djuric 4,5† , Serena Broccoli 4† , Stefano Giuseppe Caraffi 1† , Patrizia Accorsi 6 , Margaret P. Adam 7 , Kristina Avela 8 , Magdalena Badura-Stronka 9 , Allan Bayat 10,11 , Jill Clayton-Smith 12,13 , Isabella Cocco 6 , Duccio Maria Cordelli 14 , Goran Cuturilo 15,16 , Veronica Di Pisa 13 , Juliette Dupont Garcia 17 , Roberto Gastaldi 18 , Lucio Giordano 6 , Andrea Guala 19 , Christina Hoei-Hansen 20 , Mie Inaba 21 , Alessandro Iodice 22 , Jens Erik Klint Nielsen 23 , Vladimir Kuburovic 24,25 , Brissia Lazalde-Medina 26 , Baris Malbora 27 , Seiji Mizuno 21 , Oana Moldovan 17 , Rikke S. Møller 28,29 , Petra Muschke 30 , Valeria Otelli 31 , Chiara Pantaleoni 32 , Carmelo Piscopo 33 , Maria Luisa Poch-Olive 34 , Igor Prpic 35 , Purificación Marín Reina 36 , Federico Raviglione 37 , Emilia Ricci 14 , Emanuela Scarano 38 , Graziella Simonte 1,39 , Robert Smigiel 40 , George Tanteles 41 , Luigi Tarani 42 , Aurelien Trimouille 43,44 , Elvis Terci Valera 45 , Samantha Schrier Vergano 46,47 , Karin Writzl 48 , Bert Callewaert 49,50 , Salvatore Savasta 51 , Maria Elisabeth Street 52 , Lorenzo Iughetti 53,54 , Sergio Bernasconi 55 , Paolo Giorgi Rossi 4 and Livia Garavelli 1* Abstract Background: Mowat–Wilson syndrome (MWS; OMIM #235730) is a genetic condition caused by heterozygous mutations or deletions of the ZEB2 gene. It is characterized by moderate-severe intellectual disability, epilepsy, Hirschsprung disease and multiple organ malformations of which congenital heart defects and urogenital anomalies are the most frequent ones. To date, a clear description of the physical development of MWS patients does not exist. The aim of this study is to provide up-to-date growth charts specific for infants and children with MWS. Charts for males and females aged from 0 to 16 years were generated using a total of 2865 measurements from 99 MWS patients of different ancestries. All data were collected through extensive collaborations with the Italian MWS association (AIMW) and the MWS Foundation. The GAMLSS package for the R statistical computing software was used to model the growth charts. Height, weight, body mass index (BMI) and head circumference were compared to those from standard international growth charts for healthy children. Results: In newborns, weight and length were distributed as in the general population, while head circumference was slightly smaller, with an average below the 30th centile. Up to the age of 7 years, weight and height distribution was shifted to slightly lower values than in the general population; after that, the difference increased further, with 50% of the affected children below the 5th centile of the general population. BMI distribution was similar to that of non-affected children until the age of 7 years, at which point values in MWS children increased with a less steep slope, particularly in males. Microcephaly was sometimes present at birth, but in most cases it (Continued on next page) © The Author(s). 2020 Open Access This article is licensed under a Creative Commons Attribution 4.0 International License, which permits use, sharing, adaptation, distribution and reproduction in any medium or format, as long as you give appropriate credit to the original author(s) and the source, provide a link to the Creative Commons licence, and indicate if changes were made. The images or other third party material in this article are included in the article's Creative Commons licence, unless indicated otherwise in a credit line to the material. If material is not included in the article's Creative Commons licence and your intended use is not permitted by statutory regulation or exceeds the permitted use, you will need to obtain permission directly from the copyright holder. To view a copy of this licence, visit http://creativecommons.org/licenses/by/4.0/. The Creative Commons Public Domain Dedication waiver (http://creativecommons.org/publicdomain/zero/1.0/) applies to the data made available in this article, unless otherwise stated in a credit line to the data. * Correspondence: [email protected] † Ivan Ivanovski, Olivera Djuric, Serena Broccoli and Stefano Giuseppe Caraffi contributed equally to this work. 1 Medical Genetics Unit, Department of Mother and Child, Azienda Unità Sanitaria Locale - IRCCS di Reggio Emilia, Viale Risorgimento, 80 42123 Reggio Emilia, Italy Full list of author information is available at the end of the article Ivanovski et al. Orphanet Journal of Rare Diseases (2020) 15:151 https://doi.org/10.1186/s13023-020-01418-4
Transcript of Mowat-Wilson syndrome: growth charts

RESEARCH Open Access
Mowat-Wilson syndrome: growth chartsIvan Ivanovski1,2,3†, Olivera Djuric4,5†, Serena Broccoli4†, Stefano Giuseppe Caraffi1†, Patrizia Accorsi6,Margaret P. Adam7, Kristina Avela8, Magdalena Badura-Stronka9, Allan Bayat10,11, Jill Clayton-Smith12,13,Isabella Cocco6, Duccio Maria Cordelli14, Goran Cuturilo15,16, Veronica Di Pisa13, Juliette Dupont Garcia17,Roberto Gastaldi18, Lucio Giordano6, Andrea Guala19, Christina Hoei-Hansen20, Mie Inaba21, Alessandro Iodice22,Jens Erik Klint Nielsen23, Vladimir Kuburovic24,25, Brissia Lazalde-Medina26, Baris Malbora27, Seiji Mizuno21,Oana Moldovan17, Rikke S. Møller28,29, Petra Muschke30, Valeria Otelli31, Chiara Pantaleoni32, Carmelo Piscopo33,Maria Luisa Poch-Olive34, Igor Prpic35, Purificación Marín Reina36, Federico Raviglione37, Emilia Ricci14,Emanuela Scarano38, Graziella Simonte1,39, Robert Smigiel40, George Tanteles41, Luigi Tarani42,Aurelien Trimouille43,44, Elvis Terci Valera45, Samantha Schrier Vergano46,47, Karin Writzl48, Bert Callewaert49,50,Salvatore Savasta51, Maria Elisabeth Street52, Lorenzo Iughetti53,54, Sergio Bernasconi55, Paolo Giorgi Rossi4 andLivia Garavelli1*
Abstract
Background: Mowat–Wilson syndrome (MWS; OMIM #235730) is a genetic condition caused by heterozygousmutations or deletions of the ZEB2 gene. It is characterized by moderate-severe intellectual disability, epilepsy,Hirschsprung disease and multiple organ malformations of which congenital heart defects and urogenitalanomalies are the most frequent ones. To date, a clear description of the physical development of MWS patientsdoes not exist. The aim of this study is to provide up-to-date growth charts specific for infants and children withMWS. Charts for males and females aged from 0 to 16 years were generated using a total of 2865 measurementsfrom 99 MWS patients of different ancestries. All data were collected through extensive collaborations with theItalian MWS association (AIMW) and the MWS Foundation. The GAMLSS package for the R statistical computingsoftware was used to model the growth charts. Height, weight, body mass index (BMI) and head circumferencewere compared to those from standard international growth charts for healthy children.
Results: In newborns, weight and length were distributed as in the general population, while head circumferencewas slightly smaller, with an average below the 30th centile. Up to the age of 7 years, weight and heightdistribution was shifted to slightly lower values than in the general population; after that, the difference increasedfurther, with 50% of the affected children below the 5th centile of the general population. BMI distribution wassimilar to that of non-affected children until the age of 7 years, at which point values in MWS children increasedwith a less steep slope, particularly in males. Microcephaly was sometimes present at birth, but in most cases it(Continued on next page)
© The Author(s). 2020 Open Access This article is licensed under a Creative Commons Attribution 4.0 International License,which permits use, sharing, adaptation, distribution and reproduction in any medium or format, as long as you giveappropriate credit to the original author(s) and the source, provide a link to the Creative Commons licence, and indicate ifchanges were made. The images or other third party material in this article are included in the article's Creative Commonslicence, unless indicated otherwise in a credit line to the material. If material is not included in the article's Creative Commonslicence and your intended use is not permitted by statutory regulation or exceeds the permitted use, you will need to obtainpermission directly from the copyright holder. To view a copy of this licence, visit http://creativecommons.org/licenses/by/4.0/.The Creative Commons Public Domain Dedication waiver (http://creativecommons.org/publicdomain/zero/1.0/) applies to thedata made available in this article, unless otherwise stated in a credit line to the data.
* Correspondence: [email protected]†Ivan Ivanovski, Olivera Djuric, Serena Broccoli and Stefano Giuseppe Carafficontributed equally to this work.1Medical Genetics Unit, Department of Mother and Child, Azienda UnitàSanitaria Locale - IRCCS di Reggio Emilia, Viale Risorgimento, 80 42123Reggio Emilia, ItalyFull list of author information is available at the end of the article
Ivanovski et al. Orphanet Journal of Rare Diseases (2020) 15:151 https://doi.org/10.1186/s13023-020-01418-4

(Continued from previous page)
developed gradually during infancy; many children had a small head circumference, between the 3rd and the 10thcentile, rather than being truly microcephalic (at least 2 SD below the mean). Most patients were of slender build.
Conclusions: These charts contribute to the understanding of the natural history of MWS and should assistpediatricians and other caregivers in providing optimal care to MWS individuals who show problems related tophysical growth. This is the first study on growth in patients with MWS.
Keywords: Mowat-Wilson syndrome, ZEB2, Growth charts, Weight, Length, Height, Head circumference, Body massindex, BMI
BackgroundMowat-Wilson syndrome (MWS; OMIM #235730) is arare autosomal dominant disorder caused by haploinsuf-ficency in the ZEB2 gene located on chromosome 2. It ischaracterized by distinctive facial features, moderate-to-severe intellectual disability, epilepsy, Hirschsprung dis-ease and multiple congenital anomalies, including genitalanomalies, congenital heart defects, agenesis of the cor-pus callosum and eye defects. Since the first report in1998, more than 350 individuals have been described inthe literature [1–8].The incidence of MWS is estimated to be 1:50.000–
70.000 live births [9].
Several studies have reported the presence of shortstature in MWS patients. In a recent article [7], whichincluded the clinical data of 87 patients with MWS, wedemonstrated that basic growth parameters - weight,length or height, body mass index (BMI), head circum-ference - are often normal at birth, but have a tendencyto descend well below the normal range in childhoodand later on. These results urged us to extend our studyand construct growth charts specific for MWS.Growth charts specific for a disease are fundamental
instruments in order to monitor growth and observe de-viations from normal patterns [10–20]. They allow clini-cians to advise parents concerning growth expectations
Fig. 1 Constructed length and height growth charts for MWS patients in relation to the CDC reference charts (black) for males (blue)
Ivanovski et al. Orphanet Journal of Rare Diseases (2020) 15:151 Page 2 of 12

for their children, and they can be very useful even in agroup of patients for whom growth anomalies are notthe most severe problem. Moreover, these charts de-scribe the natural history of the disease.The aim of this study was to provide a growth refer-
ence for MWS patients. We collected the measurementsof 99 MWS patients from 20 countries and developedspecific growth charts that describe the natural historyof height, weight, BMI and head circumference in MWS.
MethodsStudy populationGrowth data of MWS patients previously published byour workgroup were incorporated into this study [7]. Aninvitation to participate in the study, explaining its pur-pose and design, was sent to all our colleagues who had aprevious history of publications on MWS. Furthermore,the Italian Mowat-Wilson Association (AIMW) and theMWS Foundation forwarded the invitation to their mem-bers. To those who agreed to participate, we sent a spe-cially designed questionnaire where they could insert thelength/height, weight and head circumference measure-ments of patients at different ages. The collected datawere reviewed and assembled in a password-protecteddatabase. Whenever we detected inconsistencies, probable
errors or missing data, we contacted the family/referringdoctor for corrections and further information, if needed.Only individuals with both clinical and molecular con-firmation of the disease were included in the study. Twopatients were excluded since the causative ZEB2 variantcould not be found despite molecular testing.A total of 20 nationalities were represented in this
study: 38 Italian patients, 16 from the USA, 7 fromPoland, 6 from Japan, 5 from Denmark, 4 from Spain, 4from the UK, 3 from Portugal, 3 from Finland, 2 fromCroatia, 2 from Serbia, and 1 each from Albania, Brazil,Chile, Cyprus, France, Germany, Mexico, Turkey andUkraine. None of the affected individuals originatedfrom a consanguineous family. One Italian family com-prised two affected siblings. None of the patients hadever been treated with growth hormone.A total of 99 patients were included in the study, 53
females and 46 males, born between 1986 and 2016. Atotal of 2865 measurements were available: 1220 datapoints from 46 males and 1645 data points from 53 fe-males. These patients had a mean age of 12 years (range4–20 years) in males and 13 years (range 3–23 years) infemales at the time of assessment.A total of 1013 height measurements (573 for females,
440 for males), 1110 weight measurements (631 for
Fig. 2 Constructed length and height growth charts for MWS patients in relation to the CDC reference charts (black) for females (pink)
Ivanovski et al. Orphanet Journal of Rare Diseases (2020) 15:151 Page 3 of 12

females, 479 for males), and 742 head circumferencemeasurements (441 for females, 301 for males) wereavailable. We gathered measurements from at least 2time points in 97 patients, and from more than 4 timepoints in 89 patients. For each patient we had an averageof 10.39 (SD 6.52) height measurements, 11.37 (SD 6.77)weight measurements, and 7.64 (SD 5.76) head circum-ference measurements (Additional file 1 Table 1).Due to limited data availability, no growth curves
could be generated for individuals with MWS past theage of 16 years.Data from 1986 to 2019 were included. Height, weight
and head circumference parameters were analyzed frombirth until 23 years of age, both for males and females.BMI was calculated from these data, using the formulaBMI =mass(kg)/(height(m))2.Distribution centiles for weight, length and head cir-
cumference at birth were computed including pretermand at term newborns, i.e. from 32 to 42 gestationalweeks (mean 36.5), and presented separately for malesand females.The data after birth were divided into different age
and sex groups, with 1-month intervals during the firstyear of life, 3-month intervals during the 2nd and 3rd
years of life, and 6-month intervals between the 4th and23rd years of life.Our growth charts were compared with the reference
percentiles for anthropometric measurements in healthychildren provided by the Centers for Disease Controland Prevention (CDC), with a few exceptions: for neo-natal anthropometric assessment we referred to the Ital-ian Neonatal Study (INeS) growth charts, data on headcircumference in males and females aged between 3 and16 years were compared with the Tanner reference per-centiles, and standard deviations of the head circumfer-ence in males and females aged between birth and 18years were compared with the Nellhaus reference stand-ard deviations [21–28].
Statistical analysisThe growth charts were developed using the GeneralizedAdditive Models for Location, Scale and Shape(GAMLSS) [29, 30] package for the R statistical comput-ing software [31].Centile estimation of anthropometric data Y (weight,
length, BMI and head circumference) for any given agewas:
Fig. 3 Constructed weight growth charts for MWS patients in relation to the CDC reference charts (black) for males (blue)
Ivanovski et al. Orphanet Journal of Rare Diseases (2020) 15:151 Page 4 of 12

Y � D μ; δ; ν; τð Þg1 μð Þ ¼ h1 xð Þg2 δð Þ ¼ h2 xð Þg3 νð Þ ¼ h3 xð Þg4 τð Þ ¼ h4 xð Þx ¼ ageξ
where the distribution D represents the best generalprobability (density) function according to Akaike Infor-mation Criterion (AIC) and μ the first parameter of thedistribution (usually location), δ the second parameter ofthe distribution (usually scale, coefficient of variation), νthe third parameter of the distribution (usually shape,e.g. skewness), τ the fourth parameter of the distribution(usually shape, e.g. kurtosis).The g() functions represent appropriate link functions,
h() are non-parametric smoothing functions and ξ is apower transformation of age (Additional file 2 Table 2).The more traditional LMS method developed by Cole
and Green [32] can be fitted within this framework byassuming that the response variable has a Box-Cox Coleand Green distribution [33, 34]. Additional file 2 Table 2describes the model specifications by anthropometric
measure and sex. The Q test was conducted to evaluatethe fit of the model [35].The estimated centiles by age and sex were converted
back to Excel to create charts for each anthropometricvariable, including the reference CDC growth charts forhealthy children.
ResultsLength, weight and head circumference at birthInformation on weight at birth was available for 47 fe-males and 35 males. Information on length at birth wasavailable for 47 females and 31 males. Information onhead circumference at birth was available for 40 femalesand 26 males.The average gestational age was 39 weeks, with a range
between 32 and 42. Gestational age in MWS was com-pletely comparable to that of the general population.Weights at birth were found to be within the normal
range in both males and females. The average weight inmales was 3288 g, with a range between 1850 g and4500 g; the average weight in females was 3340 g, with arange between 1620 g and 4060 g. The birth weight of allmales was between the 2nd and 100th centiles for gesta-tional age (mean 51st centile); the females’ birth weight
Fig. 4 Constructed weight growth charts for MWS patients in relation to the CDC reference charts (black) for females (pink)
Ivanovski et al. Orphanet Journal of Rare Diseases (2020) 15:151 Page 5 of 12
was between the 3rd and 100th centiles (mean 54thcentile).Length at birth was within the normal range for the
vast majority of patients, both males and females. Theaverage birth length in males measured 50 cm, with arange between 43 and 56 cm (range 2nd to 99th centile,mean 44th centile). The average birth length in femaleswas 49.1 cm, with a range between 41 and 54 cm(range < 1st to 100th centile, mean 53rd centile).Despite the fact that in both sexes the average head
circumference at birth was within the normal range,most patients were under the 50th centile, with meanvalues at the 27th centile for males and 31st for females.In males, the mean was 33.2 cm, with a range between28.5 and 36 cm (<1st to 96th centile); in females, themean was 33.7 cm, with a range between 28.5 and 36 cm(<1st to 100th centile).
Length and heightThe mean number of longitudinal measurements per pa-tient in males was 9.56 (SD 5.51). For 45 patients we hadat least 2 measurements, and for 40 patients we gatheredmore than 4 measurements.
The mean number of longitudinal measurements perpatient in females was 11.00 (SD 7.11). For 53 patientswe had at least 2 measurements, and for 48 patients wegathered more than 4 measurements.Up to the age of 2 months, the length of both males
and females was within, or just below, the normal range.Subsequently, height in males began to increase moreslowly. A significant reduction in the slope of the growthcurves was noted after 7 years of age, as the height ofboys affected by MWS became even more distant fromthe reference curves of the general population (Fig. 1and Additional file 3 Fig. RD1).Mean height for male patients at the age of 9 years
was 121 cm (<3rd percentile, mean reference group at50th percentile: 133 cm) and for female patients was123.8 cm (3rd-5th percentile, mean reference group at50th percentile: 130 cm).In females, from 2months of age, height had a slower
increase as in males, and subsequently diverged evenfurther from the reference curves of the general popula-tion. A significant reduction in the slope of the growthcharts was noted after 11 years of age, much later thanin males. At this age, females affected by MWS becamenoticeably distant from the reference curves of the
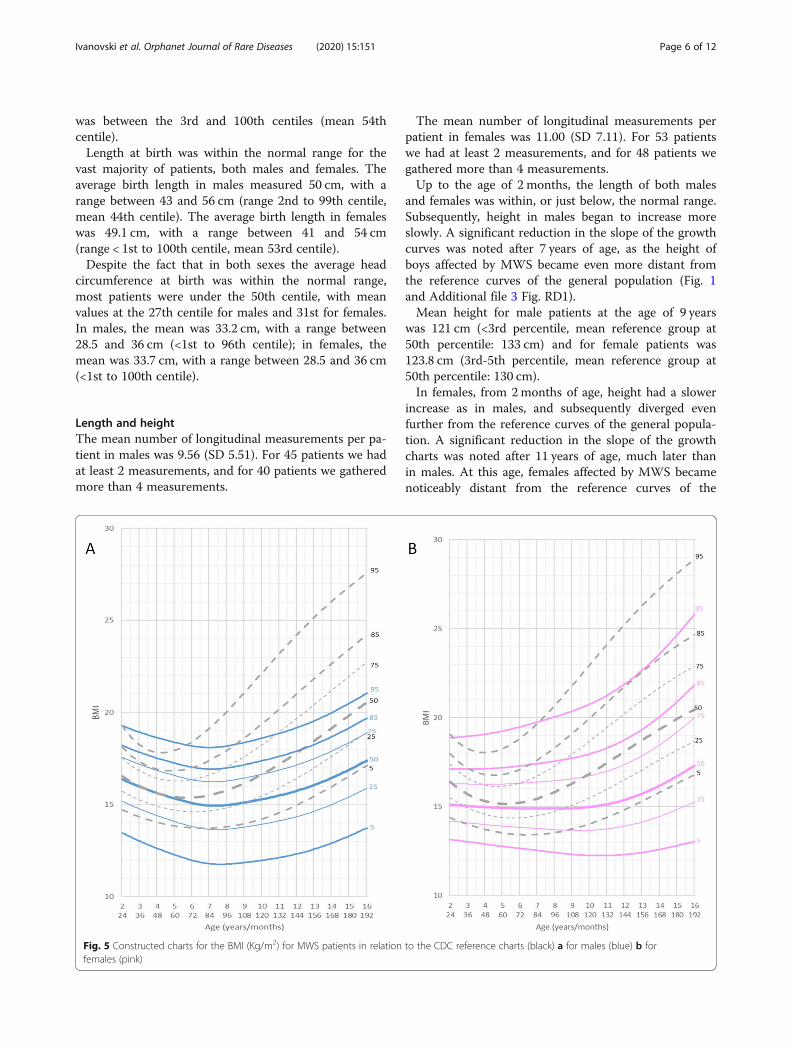
Fig. 5 Constructed charts for the BMI (Kg/m2) for MWS patients in relation to the CDC reference charts (black) a for males (blue) b forfemales (pink)
Ivanovski et al. Orphanet Journal of Rare Diseases (2020) 15:151 Page 6 of 12

general population, but were slightly less distant thanmales (Fig. 2 and Additional file 4 Fig. RD2).We were not able to extend the growth charts over
the age of 16 years due to the limited availability of mea-surements after this age. Furthermore, it is not yet pos-sible to calculate the final height because MWS has onlyrelatively recently been described and the data on ado-lescent and young adult patients is still very limited.
Weight and body mass indexThe mean number of weight measurements per patientin males was 10.41 (SD 5.67). For 45 patients we had atleast 2 measurements and for 41 patients we gatheredmore than 4 measurements.The mean number of weight measurements per pa-
tient in females was 12.07 (SD 7.41). For 52 patients wehad at least 2 measurements and for 50 patients we col-lected more than 4 measurements.
At age 0 to 36 months, compared to the referencegroup, the growth curves for weight were slightly lowerthan normal in both genders. Mean weight for male pa-tients at age 5 years and 6months was 16.800 kg (10thpercentile, mean reference group at 50th percentile:19.500 kg) and for female patients was 15.400 kg (10thpercentile, mean reference group at 50th percentile:19 kg).After this age the growth charts flatten out consider-
ably when compared to the normal reference group(Figs. 3 and 4, Additional file 5 Fig.RD3, Additional file 6Fig. RD4).At the age of 16 years both male and female pa-
tients were considerably lighter (males: mean 48 kg5th percentile, mean reference group at 50th percent-ile: 61 Kg; females: mean 39 kg <3rd percentile, meanreference group at 50th percentile: 54 Kg). Most pa-tients were of slender build, with normal bodyproportions.
Fig. 6 Constructed charts for the head circumference (cm) for MWS patients with age 0–3 years in relation to the CDC reference charts (black) formales (blue)
Ivanovski et al. Orphanet Journal of Rare Diseases (2020) 15:151 Page 7 of 12

BMI in the age range 0 to 6 years was slightly lowerwith respect to the normal reference group. Mean BMIfor male patients at 6 years of age was 15 kg/m2 (meanreference group: 15.4 kg/m2) and for female patients was14.9 kg/m2 (mean reference group: 15.3 kg/m2). There-after, between the ages of 6 and 16 years, the curve forBMI flattened out significantly in both genders, but inmales the shift of the curve towards lower values wasmore pronounced and occurred earlier, at the age of 7years, while in females it became significant after the ageof 9 years (Fig. 5).BMI of male patients aged 16 years (mean 17.2 kg/m2)
was significantly lower compared to the reference group(mean 20.5 kg/m2). BMI of female patients aged 16 years(mean 17.1 kg/m2) was significantly lower compared tothe reference group (mean 20.5 kg/m2).
Head circumferenceThe mean number of head circumference measurementsper patient in males was 6.54 (SD 4.79). For 39 patientswe had at least 2 measurements, and for 31 patients wecollected more than 4 measurements.The mean number of head circumference measure-
ments per patient in females was 8.54 (SD 6.23). For 51patients we had at least 2 measurements, and for 41 pa-tients we collected more than 4 measurements.At birth, head circumference differed only slightly
from the reference group in both genders. Indeed, dur-ing the first months of life, most measurements were
between the 3rd and the 25th percentile of the curvesfor healthy controls. This changed after 1 year of age:MWS patients had a significantly smaller head circum-ference between the ages of 1 and 2 years. Between theages of 2 and 3 years the curves flattened out even moreand the head circumference was significantly smallercompared to healthy controls.Mean head circumference for male patients at age 3
years was 47 cm (5th percentile, <− 2SD, mean referencegroup at 50th percentile: 50 cm) and for female patientswas 46 cm (5th percentile, − 2SD, mean reference groupat 50th percentile: 49 cm) (Figs. 6 and 7 and Add-itional file 7 Fig. RD5 Additional file 8 Fig.RD6).It should be noted that not all children were micro-
cephalic (at least 2 SD below the mean).The curves for males and females continued to flatten
out in the following age ranges, up to the age of 16 years.Adolescent male patients at the age of 16 years had amean head circumference of 52 cm (<3rd percentile, <−2SD), the females had a mean head circumference of 49.8cm (<3rd percentile, <−2SD) (Figs. 8 and 9).
DiscussionVarious genetic disorders are characterized by growthabnormalities. Specific growth charts developed for theseconditions are useful for the clinical follow-up of thesepatients [10–20].In this study, charts for height, weight, BMI and head
circumference were created using a sample of 99
Fig. 7 Constructed charts for the head circumference (cm) for MWS patients with age 0–3 years in relation to the CDC reference charts (black) forfemales (pink)
Ivanovski et al. Orphanet Journal of Rare Diseases (2020) 15:151 Page 8 of 12

patients whose clinical diagnosis of MWS had been con-firmed through genetic or cytogenetic testing.Typically, children affected by MWS had normal
length and weight at birth, and then showed a growthdelay over time. The average head circumference wasalready slightly smaller than in the general population atbirth (3rd-25th percentile) and showed a further delayduring growth, leading to a mean head circumference inMWS patients below the 3rd centile of the generalpopulation. These results indicate that intrauterinegrowth retardation in MWS is not a consistent findingin terms of length and weight, and only plays a minorrole in terms of head circumference.In males, since the age of 2 months, the slope of the
growth curves for length underwent an initial decrease.A significant further decrease was noted after 7 years ofage, as the values for height became markedly distant
from the reference curves of the general population. Infemales we observed a similar tendency, but the delay inthe height growth chart took place considerably later,after 11 years of age.Through these length, weight and head circumference
growth charts we demonstrate that postnatal growth re-tardation in MWS becomes evident after the secondmonth of life, is quite pronounced after 6 months and,after 1 year of age, growth flattens out even further.Males tend to be thinner than females and they alsotend to have a similar head circumference when com-pared to females.In addition, we observed the absence of the growth
spurt during adolescence, as has already been observedin other genetic diseases, such as Turner syndrome andSHOX-related conditions [36, 37], but we do not yethave useful and sufficient data to calculate a final height,
Fig. 8 Constructed charts for the head circumference (cm) for MWS patients with age 3–16 years in relation to the Tanner reference charts (black)for males (blue)
Ivanovski et al. Orphanet Journal of Rare Diseases (2020) 15:151 Page 9 of 12

because the definition of MWS is quite recent andknown adult individuals are still rare.We also assessed BMI in MWS patients. BMI of male
patients aged 16 years (mean 17.2 kg/m2) was found tobe significantly lower when compared to the referencegroup (mean 20.5 kg/m2). BMI of female patients aged16 years (mean 17.1 kg/m2) was significantly lower com-pared to the reference group (mean 20.5 kg/m2).A limitation of the present study is the small absolute
number of available subjects, which slightly reduces theprecision of the growth curves, particularly in the ado-lescence age range. Nevertheless, this cohort includes alarge portion of all well-described MWS patients in theworld, and including only MWS patients with a con-firmed ZEB2 defect significantly increases the reliabilityof our results by excluding any misclassification of cases.
ConclusionsThe growth charts we prepared for height, weight, BMIand head circumference may be used to assess thegrowth of MWS children compared to the generalpopulation.Specific growth charts can be useful for pediatricians
and clinicians in evaluating growth-related issues and inproviding optimal care to MWS individuals. Further-more, they contribute to our understanding of the nat-ural history of MWS.The growth charts presented here may be put to
good use all over the world, however they ought tobe used carefully in MWS individuals with other eth-nic backgrounds. In circumstances such as these, it isessential to consider variations according to the areaof origin.
Fig. 9 Constructed charts for the head circumference (cm) for MWS patients with age 3–16 years in relation to the Tanner reference charts (black)for females (pink)
Ivanovski et al. Orphanet Journal of Rare Diseases (2020) 15:151 Page 10 of 12

Supplementary informationSupplementary information accompanies this paper at https://doi.org/10.1186/s13023-020-01418-4.
Additional file 1: Table S1. Number of measurements for male andfemale patients for height, weight and head circumference in relation tothe age groups.
Additional file 2: Table S2. Model specification parameters byanthropometric measures and sex.
Additional file 3: Figure S1. RD1. Raw data of length and height (cm)for males showing the construction of the charts with individual datapoints.
Additional file 4: Figure S2. RD2. Raw data of length and height (cm)for females showing the construction of the charts with individual datapoints.
Additional file 5: Figure S3. RD3. Raw data of weight (Kg) for malesshowing the construction of the charts with individual data points.
Additional file 6: Figure S4. RD4. Raw data of weight (Kg) for femalesshowing the construction of the charts with individual data points.
Additional file 7: Figure S5. RD5. Raw data of head circumference(cm) for males showing the construction of the charts with individualdata points.
Additional file 8: Figure S6. RD6. Raw data of head circumference(cm) for females showing the construction of the charts with individualdata points.
AbbreviationsMWS: Mowat-Wilson syndrome; BMI: Body mass index; SD: Standarddeviation; AIMW: Italian Mowat-Wilson syndrome association
AcknowledgmentsThe authors thank the Galliera Genetic Bank, member of the TelethonGenetic Biobank Network (project GTB12001), funded by Telethon Italy, andthe Associazione Italiana Mowat Wilson ONLUS for assistance in managingpatients’ samples. We also thank all cooperating family members forcontributing the medical data necessary for this study. In addition, we aregrateful to Luca Valcavi for helping with the design and adaptation of thefigures.
Authors’ contributionsII and SGC made substantial contributions to conception, design, analysisand interpretation of data; were involved in drafting the manuscript andrevising it critically for important intellectual content; OD, SB and PGR wereinvolved in statistical drafting of the manuscript, analysis and interpretationof the data; PA, MPA, KA, MBS, AB, JCS, IC, DMC, GC, VDP, JDG, RG, LG, AG,CHH, MI AI, JEKN, VK, BLM, BM, SM, OM, RSM, PM, VO, CP, CP, MLPO, IP, MRP,FR, ER, ES, GS, RS, GT, LT, AT, ETV, SSV, KW, BK and SS made substantialcontributions to acquisition of data; MES, LI and SB were involved in draftingthe manuscript and revising it critically for important intellectual content; LGmade substantial contributions to conception and design and interpretationof data; was involved in drafting the manuscript and revising it critically forimportant intellectual content. The authors read and approved the finalmanuscript.
FundingNo funding.
Availability of data and materialsThe dataset is summarized in the additional files. The raw data used duringthe current study are available from the corresponding author uponreasonable request.
Ethics approval and consent to participateWith resolution of the General Manager n. 0252 of 03.10.2017 was issued theauthorization to start the study, pursuant to art. 7 of the L.R. n. 9/2017. In thesession of 13.09.2017, the Provincial Ethics Committee issued its favorableopinion, as per note n. 89486 of 26.09.2017.
Consent for publicationNot applicable.
Competing interestsThe authors have no conflict of interest to declare.
Author details1Medical Genetics Unit, Department of Mother and Child, Azienda UnitàSanitaria Locale - IRCCS di Reggio Emilia, Viale Risorgimento, 80 42123Reggio Emilia, Italy. 2Department of Surgical, Medical, Dental andMorphological Sciences with interest in Transplant, Oncology andRegenerative Medicine, University of Modena and Reggio Emilia, Modena,Italy. 3Institut für Medizinische Genetik, Universität Zürich, Zürich, Switzerland.4Epidemiology Unit, Azienda Unità Sanitaria Locale - IRCCS di Reggio Emilia,Reggio Emilia, Italy. 5Center for Environmental, Nutritional and GeneticEpidemiology (CREAGEN), Section of Public Health, Department ofBiomedical, Metabolic and Neural Sciences, University of Modena and ReggioEmilia, Modena, Italy. 6Neuropsychiatric Department, Spedali Civili Brescia,Brescia, Italy. 7Division of Genetic Medicine, University of Washington Schoolof Medicine, Seattle, Washington, USA. 8Department of Clinical Genetics,Helsinki University Hospital, Helsinki, Finland. 9Chair and Department ofMedical Genetics, Poznan University of Medical Sciences, Poznań, Poland.10Institute for Regional Health Service, University of Southern Denmark,Odense, Denmark. 11Department of Epilepsy Genetics and PersonalizedMedicine, Danish Epilepsy Centre Dianalund, Dianalund, Denmark. 12Divisionof Evolution and Genomic Sciences, School of Biological Sciences, Faculty ofBiology, Medicine and Health, University of Manchester, Manchester, UK.13Manchester Centre for Genomic Medicine, St Mary’s Hospital, ManchesterUniversity NHS Foundation Trust, Health Innovation Manchester, Manchester,UK. 14Child Neurology and Psychiatry Unit, Pediatric Department, St.Orsola-Malpighi Hospital, University of Bologna, Bologna, Italy. 15Faculty ofMedicine, University of Belgrade, Belgrade, Serbia. 16Department of MedicalGenetics, University Children’s Hospital, Belgrade, Serbia. 17Serviço deGenética Médica, Departamento de Pediatria, Hospital de Santa Maria, CentroHospitalar Lisboa Norte, Centro Académico de Medicina de Lisboa, Lisbon,Portugal. 18UOC Clinica Pediatrica, Istituto Giannina Gaslini, Genoa, Italy.19SOC Pediatria, Ospedale Castelli, Verbania, Italy. 20Department ofPaediatrics, Copenhagen University Hospital, Rigshospitalet, Denmark.21Department of Pediatrics, Central Hospital, Aichi Human Service Center,Kasugai, Japan. 22Child Neurology and Psychiatry Unit, Azienda UnitàSanitaria Locale - IRCCS di Reggio Emilia, Reggio Emilia, Italy. 23Departmentof Pediatrics, Zealand University Hospital Roskilde, Roskilde, Denmark.24Department of Cardiology, Mother and Child Health Care Institute,Belgrade, Serbia. 25Skånes universitet sjukhus, Barnkliniken, Lund, Sweden.26Biomedical Research Unit, Mexican Institute of Social Security, Durango,Mexico. 27Department of Pediatric Hematology & Oncology, Tepecik Trainingand Research Hospital, Izmir, Turkey. 28Danish Epilepsy Centre, Dianalund,Denmark. 29Institute for Regional Health Services, University of SouthernDenmark, Odense, Denmark. 30Institute for Human Genetics, UniversityHospital Magdeburg, Magdeburg, Germany. 31ATS Bergamo, Brembana Valleydistrict, Bergamo, Italy. 32Developmental Neurology Unit, Fondazione IRCCSIstituto Neurologico Carlo Besta, Milan, Italy. 33U.O.S.C. Medical Genetics,A.O.R.N. “A. Cardarelli”, Naples, Italy. 34Department of Pediatrics, H. San Pedro,La Rioja, Logrono, Spain. 35Department of Pediatrics–Child Neurology Service,University Hospital Rijeka, Medical Faculty, University of Rijeka, Rijeka, Croatia.36Dismorphology and Reproductive Genetics, Neonatal Research Group,Health Research Institute Hospital La Fe, University & Polytechnic Hospital LaFe, Valencia, Spain. 37Child Neuropsychiatry Unit, U.O.N.P.I.A ASST–Rhodense,Rho, Milan, Italy. 38Unit of Pediatrics, Department of Medical and SurgicalSciences, St. Orsola-Malpighi Hospital, University of Bologna, Bologna, Italy.39Department of Pediatrics and Medical Sciences, “Vittorio Emanuele”Hospital, University of Catania, Catania, Italy. 40Department of Pediatrics,Division Pediatric Propedeutics and Rare Disorders, Wroclaw MedicalUniversity, Wroclaw, Poland. 41Clinical Genetics Clinic, Cyprus Institute ofNeurology and Genetics, Nicosia, Cyprus. 42Department of Pediatrics,University “La Sapienza,”, Rome, Italy. 43CHU de Bordeaux, Service deGénétique Médicale, Bordeaux, France. 44INSERM U1211, Univ. Bordeaux,Bordeaux, France. 45Department of Pediatrics, Ribeirão Preto Medical School,University of São Paulo, São Paulo, Brazil. 46Department of Pediatrics, EasternVirginia Medical School, Norfolk, Virginia, USA. 47Division of Medical Geneticsand Metabolism, Children’s Hospital of The King’s Daughters, Norfolk,
Ivanovski et al. Orphanet Journal of Rare Diseases (2020) 15:151 Page 11 of 12

Virginia, USA. 48Clinical Institute of Medical Genetics, University MedicalCentre Ljubljana, Ljubljana, Slovenia. 49Center for Medical Genetics, GhentUniversity Hospital, Ghent, Belgium. 50Department of Biomolecular Medicine,Ghent University, Ghent, Belgium. 51Pediatric Clinic, IRCCS Policlinico “S.Matteo” Foundation, University of Pavia, Pavia, Italy. 52Division of PediatricEndocrinology and Diabetology, Department of Mother and Child, AziendaUnità Sanitaria Locale - IRCCS di Reggio Emilia, Reggio Emilia, Italy.53Post-graduate School of Pediatrics, University of Modena and ReggioEmilia, Modena, Italy. 54Department of Medical and Surgical Sciences ofMother, Children and Adults, Pediatric Unit, University of Modena andReggio Emilia, Modena, Italy. 55Microbiome Research Hub, University ofParma, Parma, Italy.
Received: 12 March 2020 Accepted: 25 May 2020
References1. Mowat DR, Croaker GD, Cass DT, Kerr BA, Chaitow J, Adès LC, et al.
Hirschsprung disease, microcephaly, mental retardation, and characteristicfacial features: delineation of a new syndrome and identification of a locusat chromosome 2q22-q23. J Med Genet. 1998;35:617–23.
2. Wilson M, Mowat D, Dastot-Le Moal F, Cacheux V, Kääriäinen H, Cass D,et al. Further delineation of the phenotype associated with heterozygousmutations in ZFHX1B. Am J Med Genet A. 2003;119A:257–65.
3. Zweier C, Thiel CT, Dufke A, Crow YJ, Meinecke P, Suri M, et al. Clinical andmutational spectrum of Mowat-Wilson syndrome. Eur J Med Genet. 2005;48:97–111.
4. Adam MP, Schelley S, Gallagher R, Brady AN, Barr K, Blumberg B, et al.Clinical features and management issues in Mowat-Wilson syndrome. Am JMed Genet A. 2006;140:2730–41.
5. Garavelli L, Mainardi PC. Mowat-Wilson syndrome. Orphanet J Rare Dis.2007;2:42.
6. Garavelli L, Zollino M, Mainardi PC, Gurrieri F, Rivieri F, Soli F, et al. Mowat-Wilson syndrome: facial phenotype changing with age: study of 19 Italianpatients and review of the literature. Am J Med Genet A. 2009;149A:417–26.
7. Ivanovski I, Djuric O, Caraffi SG, Santodirocco D, Pollazzon M, Rosato S, et al.Phenotype and genotype of 87 patients with Mowat–Wilson syndrome andrecommendations for care. Genet Med. 2018;20:965–75.
8. Adam MP, Conta J, Bean LJH. Mowat-Wilson syndrome. 2007 march 28,2007 [updated 2019 July 25]. In: Pagon RA, Bird TD, Dolan CR, Stephens K,editors. GeneReviews. Seattle: University of Washington, Seattle; 2007. p.1993.
9. Ghoumid J, Drevillon L, Alavi-Naini SM, Bondurand N, Rio M, Briand-SuleauA, et al. ZEB2 zinc-finger missense mutations lead to hypomorphic allelesand a mild Mowat-Wilson syndrome. Hum Mol Genet. 2013;22:2652–61.
10. Rongen-Westerlaken C, Corel L, van den Broeck J, Massa G, Karlberg J,Albertsson-Wihland K, et al. Reference values for height, height velocity andweight in Turner’s syndrome. Acta Paediatr. 1997;86(9):937–42.
11. Clementi M, Milani S, Mammi I, Boni S, Monciotti C, Tenconi R.Neurofibromatosis type 1 growth charts. Am J Med Genet. 1999;87(4):317–23.
12. Martin NDT, Smith WR, Cole TJ, Preece MA. New height, weight and headcircumference charts for British children with Williams syndrome. Arch DisChild. 2007;92:598–601.
13. Montano AM, Tomatsu S, Brusius A, Smith M, Orii T. Growth charts forpatients affected with Morquio a disease. Am J Med Genet A. 2008;146A(10):1286–95.
14. Verbeek S, Eilers PHC, Lawrence K, Hennekam RCM, Versteegh FGA. Growthcharts for children with Ellis–van Creveld syndrome. Eur J Pediatr. 2011;170:207–11.
15. Tarquinio D, Jones MC, Lyons Jones K, Bird LM. Growth charts for 22q11deletion syndrome. Am J Med Genet A. 2012;158A(11):2672–81.
16. Beets L, Rodriguez-Fonseca C, Hennekam R. Growth charts for individualswith Rubinstein-Taybi syndrome. Am J Med Genet A. 2014;164A(9):2300–9.
17. Butler MG, Lee J, Manzardo AM, Gold JA, Miller JL, Kimonis V, et al. Growthcharts for non-growth hormone treated Prader-Willi syndrome. Pediatrics.2015;135(1):e126–35.
18. Quartel A, Hendriksz CJ, Parini R, Graham S, Lin P, Harmatz P. Growth chartsfor individuals with Mucopolysaccharidosis VI (Maroteaux-Lamy syndrome).JIMD Rep. 2015;18:1–11.
19. Zemel BS, Pipan M, Stallings VA, Hall W, Schadt K, Freedman DS, et al.Growth charts for children with Down syndrome in the United States.Pediatrics. 2015;136(5):e1204–11.
20. Muschol NM, Pape D, Kossow K, Ullrich K, Arash-Kaps L, Hennermann JB,et al. Growth charts for patients with Sanfilippo syndrome(Mucopolysaccharidosis type III). Orphanet J Rare Dis. 2019;14(1):93. https://doi.org/10.1186/s13023-019-1065-x.
21. Nellhaus G. Head circumference from birth to 18 years. Practical compositeinternational and interracial graphs. Pediatrics. 1968;41:106–14.
22. Tanner JM. Normal growth and techniques of growth assessment. ClinEndocrinol Metab. 1986;15(3):411–51.
23. Hauspie RC, Vercauteren M, Susanne C. Secular changes in growth. HormRes. 1996;45(Suppl 2):8–17.
24. Kuczmarski RJ, Ogden CL, Guo SS, Grummer-Strawn LM, Flegal KM, Mei Z,et al. 2000 CDC growth charts for the United States: methods anddevelopment. National Center for Health Statistics. Vital Health Stat. 2002;11(246):1–190.
25. Ogden CL, Kuczmarski RJ, Flegal KM, Mei Z, Grummer-Strawn LM, Curtin LR,et al. Centers for Disease Control and Prevention 2000 growth charts for theUnited States: improvements to the 1977 National Center for HealthStatistics version. Pediatrics. 2002;109:45–60.
26. Bertino E, Spada E, Occhi L, Coscia A, Giuliani F, Gagliardi L, et al. Neonatalanthropometric charts: the Italian neonatal study compared with otherEuropean studies. J Pediatr Gastroenterol Nutr. 2010;51(3):353–61.
27. Schaffrath Rosario A, Schienkiewitz A, Neuhauser H. German heightreferences for children aged 0 to under 18 years compared to WHO andCDC growth charts. Ann Hum Biol. 2011;38(2):121–30.
28. Flegal KM, Cole TJ. Construction of LMS parameters for the Centers forDisease Control and Prevention 2000 growth charts. Natl Health Stat Rep.2013;63:1–3.
29. Rigby RA, Stasinopoulos DM. Generalized additive models for location, scaleand shape (with discussion). Appl Stat. 2005;54:507–54.
30. Rigby RA, Stasinopoulos DM. Automatic smoothing parameter selection inGAMLSS with an application to centile estimation. Stat Methods Med Res.2014;23(4):318–32.
31. R Development Core Team R. A language and environment for statisticalcomputing. Vienna: R Foundation for Statistical Computing; 2008. Availableat: https://www.R-project.org.
32. Cole TJ, Green PJ. Smoothing reference centile curves: the LMS method andpenalized likelihood. Stat Med. 1992;11(10):1305–19.
33. Stasinopoulos MD, Rigby B, Voudouris V, Heller G, De Bastiani F. Flexibleregression and smoothing: the GAMLSS packages in R; 2015. GAMLSS forStatistical Modelling. GAMLSS for Statistical Modeling.
34. Stasinopoulos MD, Rigby RA, Heller GZ, Voudouris V, De Bastiani F. Flexibleregression and smoothing: using GAMLSS in R. J Stat Softw. 2018;85:2.https://www.crcpress.com/978113819790. https://doi.org/10.18637/jss.v085.b02.
35. Royston P, Wright EM. Goodness-of-fit statistics for age-specific referenceintervals. Stat Med. 2000;19:2943–62.
36. Haeusler G, Frisch H. Methods for evaluation of growth in Turner’ssyndrome: critical approach and review of the literature. Acta Paediatr. 1994;83(3):309–14.
37. Kosho T, Muroya K, Nagai T, Fujimoto M, Yokoya S, Sakamoto H, et al.Skeletal features and growth patterns in 14 patients with Haploinsufficiencyof SHOX: implications for the development of turner syndrome. J ClinEndocrinol Metab. 1999;84(12):4613–21.
Publisher’s NoteSpringer Nature remains neutral with regard to jurisdictional claims inpublished maps and institutional affiliations.
Ivanovski et al. Orphanet Journal of Rare Diseases (2020) 15:151 Page 12 of 12