MONTHLY ECONOMIC INDICATORS - Central Bank of Kenya
27
MONTHLY ECONOMIC INDICATORS July 2019
Transcript of MONTHLY ECONOMIC INDICATORS - Central Bank of Kenya
1 | Monthly Economic Bulletin July 2019
“To be a World Class Modern Central Bank”
MONTHLY ECONOMIC INDICATORS
July 2019

2 | Monthly Economic Bulletin July 2019
“To be a World Class Modern Central Bank”
Table of Contents
SYMBOLS ............................................................................................................................. 3
DEFINITIONS ........................................................................................................................ 4
1. INFLATION ........................................................................................................................... 6
2. MONEY, CREDIT AND INTEREST RATES .................................................................................. 10
3. REAL SECTOR INDICATORS .................................................................................................. 13
4. BALANCE OF PAYMENTS AND EXTERNAL SECTOR INDICATORS ................................................. 14
5. DEVELOPMENTS IN THE BANKING SECTOR. ........................................................................... 17
6. GOVERNMENT BUDGETARY OPERATIONS .............................................................................. 19
7. PUBLIC DEBT ...................................................................................................................... 22
8. CAPITAL MARKETS INDICATORS ........................................................................................... 24
3 | Monthly Economic Bulletin July 2019
“To be a World Class Modern Central Bank”
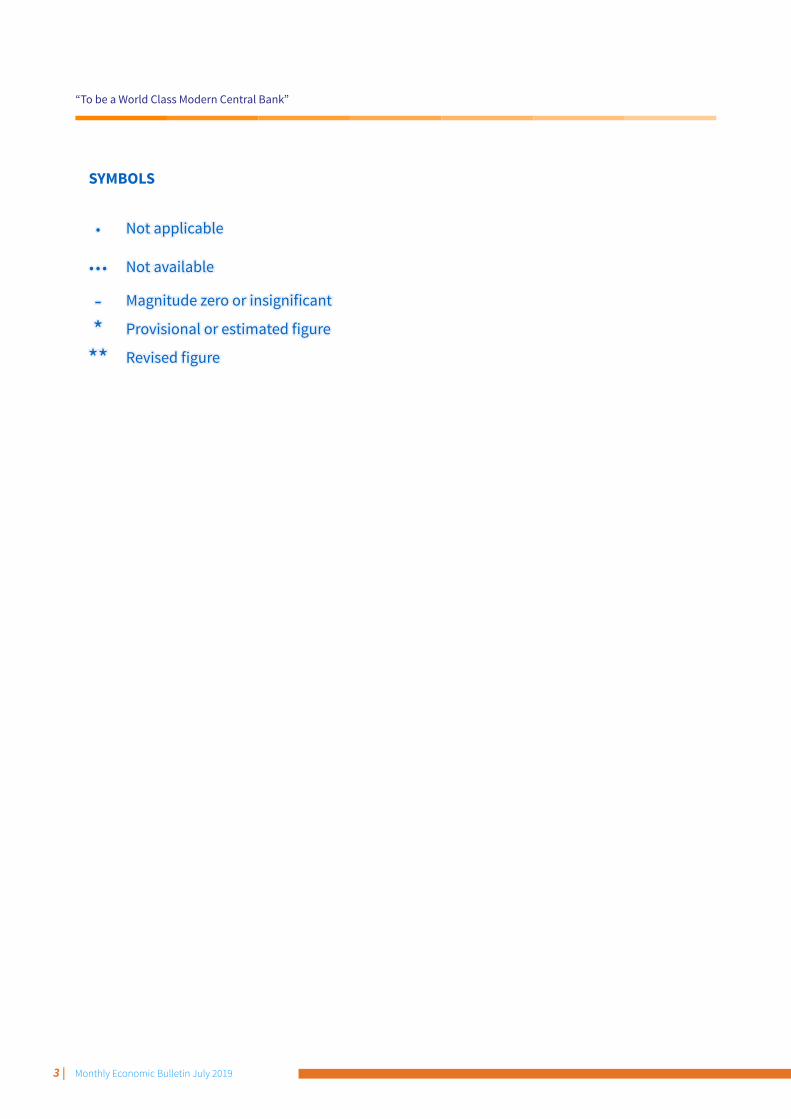
SYMBOLS
. Not applicable
... Not available
- Magnitude zero or insignificant
* Provisional or estimated figure
** Revised figure
4 | Monthly Economic Bulletin July 2019
“To be a World Class Modern Central Bank”
Definitions
1. Inflation: Percentage change in the consumer price index (CPI)
2. Narrow Money M0: Currency outside the banking system excluding commemorative coins M1: M0 + demand deposits of banks (or depository corporations)
3. Broad Money M2: M1 + quasi (long term) money deposits i.e. time and savings deposits of banks.
4. Extended Broad Money M3: M2 + resident foreign currency deposits.
5. Overall Liquidity L: M3 + non-bank holdings of Government securities.
6. Net Foreign Assets (NFA): Gross foreign assets less gross foreign liabilities of depository corporations (DCs).
7. Net Domestic Assets (NDA) of Depository Corporations (DCs): the sum of: • Net credit to Government, which is the sum of net credit to government from the
central bank (CBK) and commercial banks. • Credit to other sectors, which is the sum of credit to other sectors (private and
other public entities) from central bank and from other depository corporations (ODCs).
• Other Items Net (Other assets less other liabilities) of central bank and ODCs after netting out positions between CBK and ODCs or consolidation adjustments.
8. NFA + NDA = Extended Broad Money
9. Credit to Private Sector: Credit facilities extended by DCs to the private sector.
10. Interest Rates: Covers the short term rates including: Repo rate (3 and 7 days), reverse repo, interbank rates, treasury bill rates and commercial banks’ weighted average lending and deposit rates.
11. Current Account Balance: Measures the flows of goods, services, primary income, and secondary income between residents and nonresidents.
12. Capital Account: Measures capital transfers receivable and payable; and acquisition and disposal of non-produced, non-financial assets, which include: marketing assets; contracts, leases, and licenses; and rights of natural resources such as land, minerals, water, air space between residents and nonresidents.

5 | Monthly Economic Bulletin July 2019
“To be a World Class Modern Central Bank”
13. Financial Account: Measures net acquisition of financial assets and incurrances of financial liabilities.
14. Exchange Rate: The price of Kenya Shilling relative to a foreign currency. The mean exchange rate is computed by a simple average of the mean buying and selling exchange rate prevailing on any trading day.
15. Foreign Exchange Reserves: External assets held by the CBK that are readily available for meeting balance of payments financing needs and for intervention in the foreign exchange market.
16. Government Revenue: Comprises tax and non-tax revenue. Tax revenue includes import duty, excise duty, income tax (including PAYE) and value added tax (VAT) while non-tax revenue comprises investment income, appropriation in aid (AIA) and other levies.
17. Grants: Non repayable funds received by the Government from other governments or international organizations.
18. Government Expenditures: Both recurrent and development expenditures. Recurrent expenditures refer to spending on current activities. It consists of interest payments on debt (domestic and foreign), salaries and wages, pensions and payments for maintenance and operations. Development expenditure refers to the expenditure incurred on projects.
19. Budget Deficit: the excess of expenditure over revenue and grants. The converse is a budget surplus.
20. Deficit financing: Comprising external borrowing, domestic borrowing and sales of Government shares in government agencies (privatisation).
21. Public and Publicly Guaranteed Debt: Comprises external and domestic debt.
6 | Monthly Economic Bulletin July 2019
“To be a World Class Modern Central Bank”
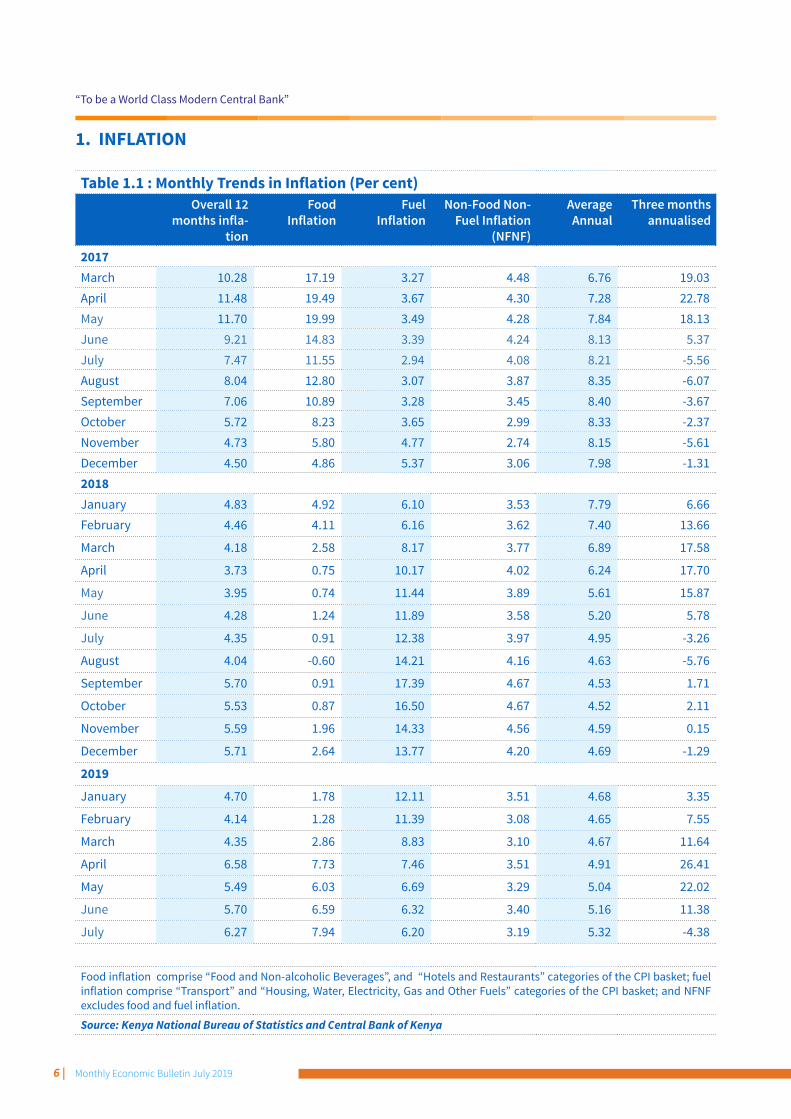
Table 1.1 : Monthly Trends in Inflation (Per cent)Overall 12
months infla-tion
Food Inflation
Fuel Inflation
Non-Food Non- Fuel Inflation
(NFNF)
Average Annual
Three months annualised
2017March 10.28 17.19 3.27 4.48 6.76 19.03April 11.48 19.49 3.67 4.30 7.28 22.78May 11.70 19.99 3.49 4.28 7.84 18.13June 9.21 14.83 3.39 4.24 8.13 5.37July 7.47 11.55 2.94 4.08 8.21 -5.56August 8.04 12.80 3.07 3.87 8.35 -6.07September 7.06 10.89 3.28 3.45 8.40 -3.67October 5.72 8.23 3.65 2.99 8.33 -2.37November 4.73 5.80 4.77 2.74 8.15 -5.61December 4.50 4.86 5.37 3.06 7.98 -1.312018January 4.83 4.92 6.10 3.53 7.79 6.66February 4.46 4.11 6.16 3.62 7.40 13.66
March 4.18 2.58 8.17 3.77 6.89 17.58
April 3.73 0.75 10.17 4.02 6.24 17.70
May 3.95 0.74 11.44 3.89 5.61 15.87
June 4.28 1.24 11.89 3.58 5.20 5.78
July 4.35 0.91 12.38 3.97 4.95 -3.26
August 4.04 -0.60 14.21 4.16 4.63 -5.76
September 5.70 0.91 17.39 4.67 4.53 1.71
October 5.53 0.87 16.50 4.67 4.52 2.11
November 5.59 1.96 14.33 4.56 4.59 0.15
December 5.71 2.64 13.77 4.20 4.69 -1.29
2019
January 4.70 1.78 12.11 3.51 4.68 3.35
February 4.14 1.28 11.39 3.08 4.65 7.55
March 4.35 2.86 8.83 3.10 4.67 11.64
April 6.58 7.73 7.46 3.51 4.91 26.41
May 5.49 6.03 6.69 3.29 5.04 22.02
June 5.70 6.59 6.32 3.40 5.16 11.38
July 6.27 7.94 6.20 3.19 5.32 -4.38
Food inflation comprise “Food and Non-alcoholic Beverages”, and “Hotels and Restaurants” categories of the CPI basket; fuel inflation comprise “Transport” and “Housing, Water, Electricity, Gas and Other Fuels” categories of the CPI basket; and NFNF excludes food and fuel inflation.
Source: Kenya National Bureau of Statistics and Central Bank of Kenya
1. INFLATION
7 | Monthly Economic Bulletin July 2019
“To be a World Class Modern Central Bank”
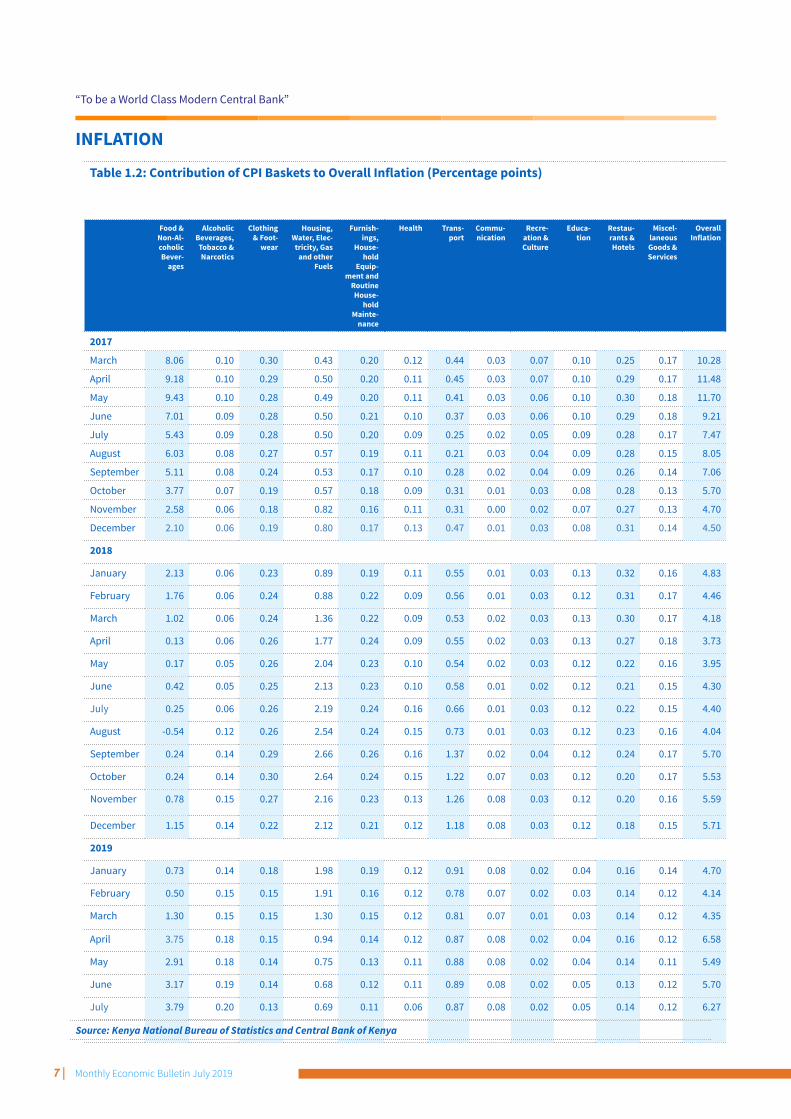
Table 1.2: Contribution of CPI Baskets to Overall Inflation (Percentage points)
Food & Non-Al-coholic Bever-
ages
Alcoholic Beverages, Tobacco & Narcotics
Clothing & Foot-
wear
Housing, Water, Elec-tricity, Gas
and other Fuels
Furnish-ings,
House-hold
Equip-ment and
Routine House-
hold Mainte-
nance
Health Trans-port
Commu-nication
Recre-ation & Culture
Educa-tion
Restau-rants & Hotels
Miscel-laneous Goods & Services
OverallInflation
2017
March 8.06 0.10 0.30 0.43 0.20 0.12 0.44 0.03 0.07 0.10 0.25 0.17 10.28
April 9.18 0.10 0.29 0.50 0.20 0.11 0.45 0.03 0.07 0.10 0.29 0.17 11.48
May 9.43 0.10 0.28 0.49 0.20 0.11 0.41 0.03 0.06 0.10 0.30 0.18 11.70
June 7.01 0.09 0.28 0.50 0.21 0.10 0.37 0.03 0.06 0.10 0.29 0.18 9.21
July 5.43 0.09 0.28 0.50 0.20 0.09 0.25 0.02 0.05 0.09 0.28 0.17 7.47
August 6.03 0.08 0.27 0.57 0.19 0.11 0.21 0.03 0.04 0.09 0.28 0.15 8.05
September 5.11 0.08 0.24 0.53 0.17 0.10 0.28 0.02 0.04 0.09 0.26 0.14 7.06
October 3.77 0.07 0.19 0.57 0.18 0.09 0.31 0.01 0.03 0.08 0.28 0.13 5.70
November 2.58 0.06 0.18 0.82 0.16 0.11 0.31 0.00 0.02 0.07 0.27 0.13 4.70
December 2.10 0.06 0.19 0.80 0.17 0.13 0.47 0.01 0.03 0.08 0.31 0.14 4.50
2018
January 2.13 0.06 0.23 0.89 0.19 0.11 0.55 0.01 0.03 0.13 0.32 0.16 4.83
February 1.76 0.06 0.24 0.88 0.22 0.09 0.56 0.01 0.03 0.12 0.31 0.17 4.46
March 1.02 0.06 0.24 1.36 0.22 0.09 0.53 0.02 0.03 0.13 0.30 0.17 4.18
April 0.13 0.06 0.26 1.77 0.24 0.09 0.55 0.02 0.03 0.13 0.27 0.18 3.73
May 0.17 0.05 0.26 2.04 0.23 0.10 0.54 0.02 0.03 0.12 0.22 0.16 3.95
June 0.42 0.05 0.25 2.13 0.23 0.10 0.58 0.01 0.02 0.12 0.21 0.15 4.30
July 0.25 0.06 0.26 2.19 0.24 0.16 0.66 0.01 0.03 0.12 0.22 0.15 4.40
August -0.54 0.12 0.26 2.54 0.24 0.15 0.73 0.01 0.03 0.12 0.23 0.16 4.04
September 0.24 0.14 0.29 2.66 0.26 0.16 1.37 0.02 0.04 0.12 0.24 0.17 5.70
October 0.24 0.14 0.30 2.64 0.24 0.15 1.22 0.07 0.03 0.12 0.20 0.17 5.53
November 0.78 0.15 0.27 2.16 0.23 0.13 1.26 0.08 0.03 0.12 0.20 0.16 5.59
December 1.15 0.14 0.22 2.12 0.21 0.12 1.18 0.08 0.03 0.12 0.18 0.15 5.71
2019
January 0.73 0.14 0.18 1.98 0.19 0.12 0.91 0.08 0.02 0.04 0.16 0.14 4.70
February 0.50 0.15 0.15 1.91 0.16 0.12 0.78 0.07 0.02 0.03 0.14 0.12 4.14
March 1.30 0.15 0.15 1.30 0.15 0.12 0.81 0.07 0.01 0.03 0.14 0.12 4.35
April 3.75 0.18 0.15 0.94 0.14 0.12 0.87 0.08 0.02 0.04 0.16 0.12 6.58
May 2.91 0.18 0.14 0.75 0.13 0.11 0.88 0.08 0.02 0.04 0.14 0.11 5.49
June 3.17 0.19 0.14 0.68 0.12 0.11 0.89 0.08 0.02 0.05 0.13 0.12 5.70
July 3.79 0.20 0.13 0.69 0.11 0.06 0.87 0.08 0.02 0.05 0.14 0.12 6.27
INFLATION
Source: Kenya National Bureau of Statistics and Central Bank of Kenya
8 | Monthly Economic Bulletin July 2019
“To be a World Class Modern Central Bank”
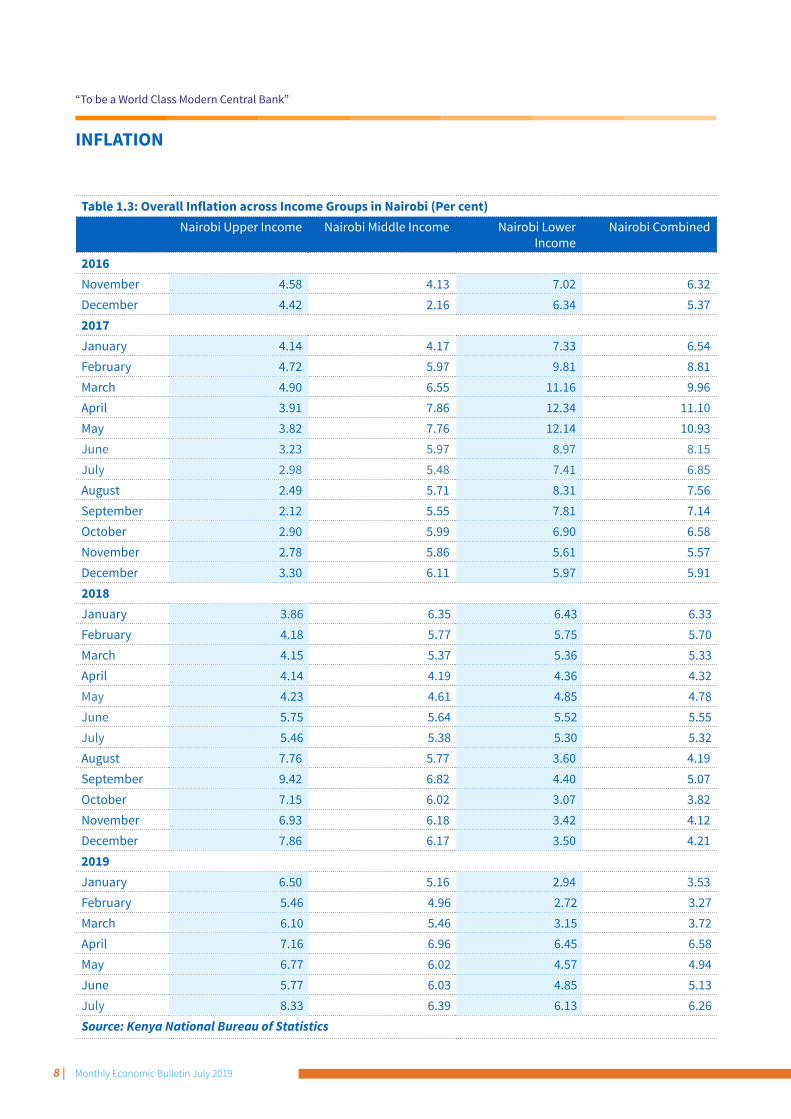
Table 1.3: Overall Inflation across Income Groups in Nairobi (Per cent)Nairobi Upper Income Nairobi Middle Income Nairobi Lower
IncomeNairobi Combined
2016November 4.58 4.13 7.02 6.32December 4.42 2.16 6.34 5.372017January 4.14 4.17 7.33 6.54February 4.72 5.97 9.81 8.81March 4.90 6.55 11.16 9.96April 3.91 7.86 12.34 11.10May 3.82 7.76 12.14 10.93June 3.23 5.97 8.97 8.15July 2.98 5.48 7.41 6.85August 2.49 5.71 8.31 7.56September 2.12 5.55 7.81 7.14October 2.90 5.99 6.90 6.58November 2.78 5.86 5.61 5.57December 3.30 6.11 5.97 5.912018January 3.86 6.35 6.43 6.33February 4.18 5.77 5.75 5.70March 4.15 5.37 5.36 5.33April 4.14 4.19 4.36 4.32May 4.23 4.61 4.85 4.78June 5.75 5.64 5.52 5.55July 5.46 5.38 5.30 5.32August 7.76 5.77 3.60 4.19September 9.42 6.82 4.40 5.07October 7.15 6.02 3.07 3.82November 6.93 6.18 3.42 4.12December 7.86 6.17 3.50 4.212019January 6.50 5.16 2.94 3.53February 5.46 4.96 2.72 3.27March 6.10 5.46 3.15 3.72April 7.16 6.96 6.45 6.58May 6.77 6.02 4.57 4.94June 5.77 6.03 4.85 5.13July 8.33 6.39 6.13 6.26Source: Kenya National Bureau of Statistics
INFLATION

9 | Monthly Economic Bulletin July 2019
“To be a World Class Modern Central Bank”
Table 1.4: Overall Inflation by Region (Per cent)
Nairobi Rest of Kenya Kenya2016September 6.17 6.45 6.34October 6.32 6.57 6.47November 6.32 6.92 6.68December 5.37 7.01 6.352017January 6.54 7.33 6.99February 8.81 9.19 9.04March 9.96 10.50 10.28April 11.10 11.73 11.48May 10.93 12.21 11.70June 8.15 9.92 9.21July 6.85 7.88 7.47August 7.56 8.37 8.04September 7.14 7.00 7.06October 6.58 5.15 5.72November 5.57 4.17 4.73December 5.91 3.55 4.502018January 6.33 3.80 4.83February 5.70 3.62 4.46March 5.33 3.40 4.18April 4.32 3.33 3.73May 4.78 3.40 3.95June 5.55 3.43 4.28July 5.32 3.71 4.35August 4.19 3.94 4.04September 5.07 6.13 5.70October 3.82 6.69 5.53November 4.12 6.59 5.59December 4.21 6.73 5.712018January 3.53 5.50 4.70February 3.27 4.73 4.14March 3.72 4.78 4.35April 6.58 6.59 6.58May 4.94 5.87 5.49June 5.13 6.10 5.70July 6.26 6.29 6.27Source: Kenya National Bureau of Statistics
INFLATION

10 | Monthly Economic Bulletin July 2019
“To be a World Class Modern Central Bank”
Table 2.1: Money Supply and its Sources (KSh Billion)
COMPONENTS OF M3 July-18** Aug-18** Sept-18** Oct-18** Nov-18** Dec-18* Jan-19* Feb-19** Mar-19** Apr-19* May-19* June-19* July-19*1. Money supply, M1 (1.1+1.2+1.3) 1,434.6 1,393.1 1,379.5 1,436.4 1,409.6 1,477.5 1,464.6 1,461.0 1,520.3 1,501.7 1,495.7 1,575.5 1,510.8
1.1 Currency outside banks 220.7 218.7 214.4 221.1 224.0 230.3 214.1 216.4 225.2 222.0 222.0 196.9 188.41.2 Demand deposits 1,123.0 1,103.5 1,094.4 1,150.9 1,117.3 1,175.5 1,155.7 1,159.8 1,208.9 1,184.1 1,190.4 1,212.7 1,233.51.3 Other deposits at CBK\1 90.8 70.9 70.8 64.4 68.3 71.7 94.7 84.8 86.2 95.6 83.4 165.8 88.9
2. Money supply, M2 (1+2.1) 2,705.2 2,698.8 2,684.9 2,719.8 2,699.4 2,756.0 2,757.6 2,748.6 2,838.4 2,825.5 2,838.3 2,943.7 2,892.62.1 Time and saving deposits 1,269.5 1,305.1 1,304.8 1,282.9 1,289.4 1,278.0 1,292.7 1,287.5 1,318.1 1,323.8 1,342.5 1,368.2 1,381.8
3. Money supply, M3 (2+3.1) 3,278.8 3,259.7 3,261.1 3,273.0 3,269.0 3,337.8 3,344.3 3,333.5 3,415.3 3,404.4 3,416.2 3,564.2 3,509.43.1 Foreign Currency Deposits 573.6 561.0 576.2 553.2 569.6 581.9 586.6 584.9 576.9 578.9 577.9 620.5 616.8
SOURCES OF M31. Net foreign assets \2 756.0 731.5 742.1 683.9 691.8 714.1 706.6 711.1 720.0 744.1 934.4 939.9 900.7
1.1. Central Bank 798.1 774.1 768.3 748.9 731.5 739.5 749.3 745.6 747.5 742.6 953.3 941.0 925.51.2 Banking Institutions -42.1 -42.6 -26.2 -65.0 -39.8 -25.4 -42.6 -34.6 -27.5 1.5 -18.9 -1.1 -24.8
2. Net domestic assets (2.1+2.2) 2,522.8 2,528.2 2,519.0 2,589.1 2,577.3 2,623.7 2,637.6 2,622.4 2,695.3 2,660.3 2,481.8 2,624.3 2,608.82.1 Domestic credit 3,258.5 3,278.8 3,282.5 3,368.7 3,358.9 3,381.1 3,414.8 3,400.7 3,508.1 3,506.7 3,353.1 3,491.0 3,500.5
2.1.1 Government (net) 766.7 780.5 770.2 840.7 828.6 858.2 892.7 872.8 964.2 943.1 775.3 890.5 875.62.1.2 Private sector 2,383.1 2,389.9 2,404.0 2,422.4 2,423.3 2,422.0 2,421.7 2,426.7 2,444.2 2,463.7 2,476.2 2,504.0 2,528.72.1.3 Other public sector 108.7 108.4 108.3 105.6 107.0 100.9 100.4 101.2 99.7 99.9 101.6 96.4 96.2
2.2 Other items net -735.7 -750.5 -763.5 -779.6 -781.6 -757.3 -777.1 -778.3 -812.8 -846.4 -871.2 -866.7 -891.7Memorandum items1. Reserve money 428.4 450.5 449.9 447.6 455.0 492.0 457.8 439.6 456.5 453.9 485.5 439.8 423.2
Bank reserves 207.7 231.8 235.5 226.4 231.1 261.7 243.7 223.2 231.3 231.8 263.6 242.8 234.82. Overall liquidity, L (3+2.1.0) 4,454.9 4,438.5 4,465.9 4,478.0 4,502.0 4,557.1 4,595.4 4,625.2 4,696.9 4,711.4 4,749.9 4,896.0 4,864.4
2.1.0 Non-bank holdings of
government securities
1,176.1 1,178.8 1,204.8 1,205.0 1,232.9 1,219.3 1,251.1 1,291.7 1,281.6 1,307.0 1,333.7 1,331.7 1,354.9
ANNUAL GROWTH RATE (Per cent)COMPONENTS OF M3 July-18 Aug-18 Sept-18 Oct-18 Nov-18 Dec-18 Jan-19 Feb-18 Mar-19 Apr-19 May-19 June-19 July-191. Money supply, M1 (1.1+1.2+1.3) 4.6 2.9 0.6 3.7 2.4 6.6 7.4 5.6 11.7 6.8 6.8 10.5 5.3
1.1 Currency outside banks 5.2 5.3 2.5 4.8 3.1 2.2 1.6 2.5 5.0 4.6 4.8 -9.8 -14.61.2 Demand deposits 3.0 1.5 -0.8 2.6 1.4 5.0 4.5 3.4 11.7 4.9 5.0 7.7 9.81.3 Other deposits at CBK\1 28.5 22.2 18.5 24.9 17.9 73.2 100.1 67.5 33.5 46.7 51.8 104.2 -2.1
2. Money supply, M2 (1+2.1) 7.8 7.2 6.2 7.6 6.5 8.0 8.4 7.3 10.8 8.7 8.3 9.8 6.92.1 Time and saving deposits 11.6 12.2 12.8 12.2 11.4 9.7 9.6 9.4 9.9 11.0 10.0 8.9 8.8
3. Money supply, M3 (2+3.1) 10.1 9.1 8.5 9.1 8.4 10.1 10.5 10.3 12.5 10.7 8.7 9.2 7.03.1 Foreign Currency Deposits 22.6 19.4 20.7 17.4 18.6 21.5 21.6 26.5 21.6 21.6 10.9 6.8 7.5
SOURCES OF M3
1. Net foreign assets \2 23.0 20.8 21.6 22.3 29.4 38.3 35.0 38.3 3.2 3.1 29.3 24.2 19.11.1 Central Bank 13.1 13.1 10.6 15.3 15.1 17.9 18.0 17.2 -7.0 -9.9 16.9 20.1 16.01.2 Banking Institutions -53.8 -46.1 -69.0 -28.0 -60.7 -77.1 -61.7 -71.7 -74.0 -101.5 -79.6 -95.9 -41.1
2. Net domestic assets (2.1+2.2) 6.7 6.2 5.1 6.1 3.9 4.4 5.4 4.5 15.3 13.0 2.6 4.7 3.42.1 Domestic credit 5.7 5.8 5.8 7.0 4.8 4.6 5.4 4.6 13.9 11.7 6.3 7.8 7.42.1.1 Government (net) 11.5 12.5 14.2 17.4 11.9 13.6 15.7 10.2 54.3 39.4 15.8 19.5 14.22.1.2 Private sector 4.3 4.3 3.8 4.4 3.0 2.4 3.0 3.4 4.3 4.9 4.4 5.2 6.12.1.3 Other public sector -2.1 -2.7 -4.7 -6.3 -4.8 -10.2 -12.7 -10.8 -11.5 -11.3 -10.2 -13.8 -11.5
2.2 Other items net 2.1 4.8 7.9 10.1 7.7 5.4 5.5 4.8 9.4 7.7 18.6 18.5 21.2Memorandum items1. Reserve money 2.1 6.6 6.0 7.4 9.0 12.1 5.4 4.7 9.1 8.3 12.1 2.5 -1.2 Bank reserves -1.0 7.9 9.4 10.0 15.4 22.7 8.9 6.9 13.5 12.0 19.1 15.1 13.12. Overall liquidity, L (3+2.1.0) 12.0 11.0 10.8 10.5 10.1 11.0 11.6 12.0 12.9 11.5 10.5 10.4 9.2
2.1.0 Non-bank holdings of
government securities
17.6 16.5 17.5 14.8 13.4 12.9 14.8 16.7 14.0 13.7 15.5 13.7 15.1
Absolute and percentage changes may not necessarily add up due to rounding\1 Includes county deposits and special projects deposit\2 Net Foreign Assets of CBK excludes Government accounts with IMFSource: Central Bank of Kenya
2. MONEY, CREDIT AND INTEREST RATES
11 | Monthly Economic Bulletin July 2019
“To be a World Class Modern Central Bank”
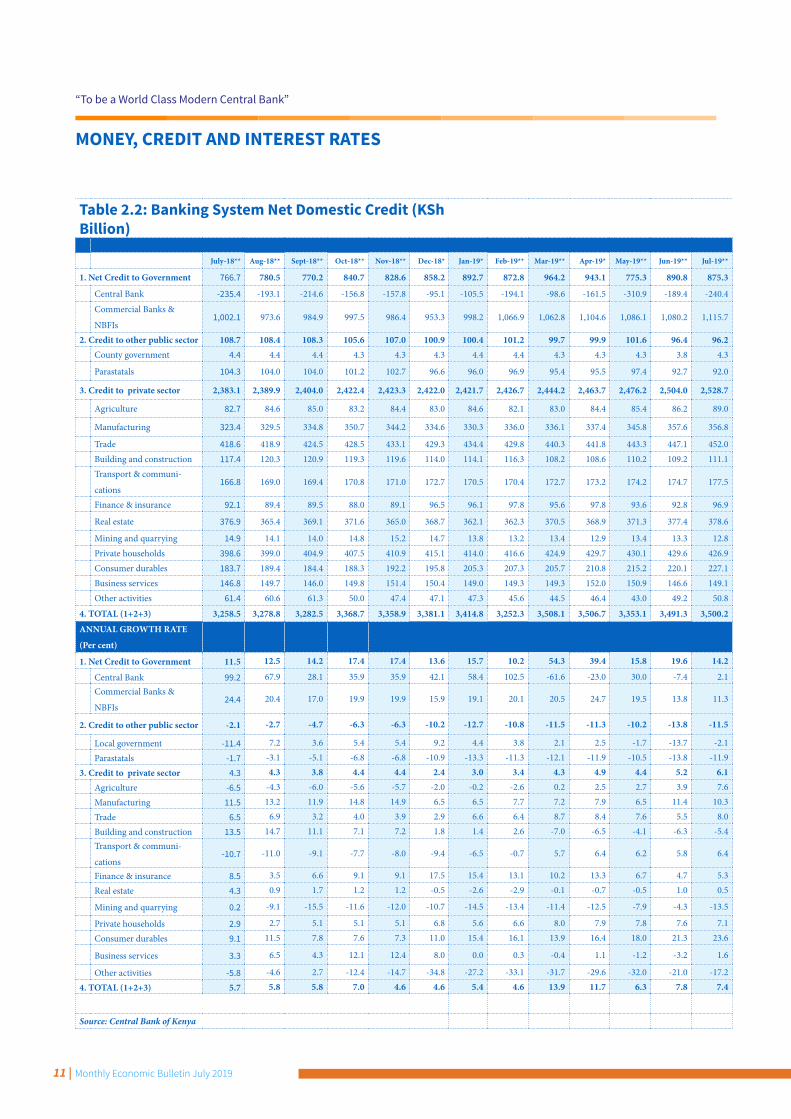
Table 2.2: Banking System Net Domestic Credit (KSh Billion)
July-18** Aug-18** Sept-18** Oct-18** Nov-18** Dec-18* Jan-19* Feb-19** Mar-19** Apr-19* May-19** Jun-19** Jul-19**
1. Net Credit to Government 766.7 780.5 770.2 840.7 828.6 858.2 892.7 872.8 964.2 943.1 775.3 890.8 875.3
Central Bank -235.4 -193.1 -214.6 -156.8 -157.8 -95.1 -105.5 -194.1 -98.6 -161.5 -310.9 -189.4 -240.4
Commercial Banks &
NBFIs1,002.1 973.6 984.9 997.5 986.4 953.3 998.2 1,066.9 1,062.8 1,104.6 1,086.1 1,080.2 1,115.7
2. Credit to other public sector 108.7 108.4 108.3 105.6 107.0 100.9 100.4 101.2 99.7 99.9 101.6 96.4 96.2County government 4.4 4.4 4.4 4.3 4.3 4.3 4.4 4.4 4.3 4.3 4.3 3.8 4.3
Parastatals 104.3 104.0 104.0 101.2 102.7 96.6 96.0 96.9 95.4 95.5 97.4 92.7 92.0
3. Credit to private sector 2,383.1 2,389.9 2,404.0 2,422.4 2,423.3 2,422.0 2,421.7 2,426.7 2,444.2 2,463.7 2,476.2 2,504.0 2,528.7
Agriculture 82.7 84.6 85.0 83.2 84.4 83.0 84.6 82.1 83.0 84.4 85.4 86.2 89.0
Manufacturing 323.4 329.5 334.8 350.7 344.2 334.6 330.3 336.0 336.1 337.4 345.8 357.6 356.8
Trade 418.6 418.9 424.5 428.5 433.1 429.3 434.4 429.8 440.3 441.8 443.3 447.1 452.0Building and construction 117.4 120.3 120.9 119.3 119.6 114.0 114.1 116.3 108.2 108.6 110.2 109.2 111.1Transport & communi-
cations166.8 169.0 169.4 170.8 171.0 172.7 170.5 170.4 172.7 173.2 174.2 174.7 177.5
Finance & insurance 92.1 89.4 89.5 88.0 89.1 96.5 96.1 97.8 95.6 97.8 93.6 92.8 96.9
Real estate 376.9 365.4 369.1 371.6 365.0 368.7 362.1 362.3 370.5 368.9 371.3 377.4 378.6
Mining and quarrying 14.9 14.1 14.0 14.8 15.2 14.7 13.8 13.2 13.4 12.9 13.4 13.3 12.8Private households 398.6 399.0 404.9 407.5 410.9 415.1 414.0 416.6 424.9 429.7 430.1 429.6 426.9Consumer durables 183.7 189.4 184.4 188.3 192.2 195.8 205.3 207.3 205.7 210.8 215.2 220.1 227.1Business services 146.8 149.7 146.0 149.8 151.4 150.4 149.0 149.3 149.3 152.0 150.9 146.6 149.1Other activities 61.4 60.6 61.3 50.0 47.4 47.1 47.3 45.6 44.5 46.4 43.0 49.2 50.8
4. TOTAL (1+2+3) 3,258.5 3,278.8 3,282.5 3,368.7 3,358.9 3,381.1 3,414.8 3,252.3 3,508.1 3,506.7 3,353.1 3,491.3 3,500.2
ANNUAL GROWTH RATE
(Per cent)
1. Net Credit to Government 11.5 12.5 14.2 17.4 17.4 13.6 15.7 10.2 54.3 39.4 15.8 19.6 14.2
Central Bank 99.2 67.9 28.1 35.9 35.9 42.1 58.4 102.5 -61.6 -23.0 30.0 -7.4 2.1Commercial Banks &
NBFIs24.4 20.4 17.0 19.9 19.9 15.9 19.1 20.1 20.5 24.7 19.5 13.8 11.3
2. Credit to other public sector -2.1 -2.7 -4.7 -6.3 -6.3 -10.2 -12.7 -10.8 -11.5 -11.3 -10.2 -13.8 -11.5
Local government -11.4 7.2 3.6 5.4 5.4 9.2 4.4 3.8 2.1 2.5 -1.7 -13.7 -2.1
Parastatals -1.7 -3.1 -5.1 -6.8 -6.8 -10.9 -13.3 -11.3 -12.1 -11.9 -10.5 -13.8 -11.9
3. Credit to private sector 4.3 4.3 3.8 4.4 4.4 2.4 3.0 3.4 4.3 4.9 4.4 5.2 6.1
Agriculture -6.5 -4.3 -6.0 -5.6 -5.7 -2.0 -0.2 -2.6 0.2 2.5 2.7 3.9 7.6
Manufacturing 11.5 13.2 11.9 14.8 14.9 6.5 6.5 7.7 7.2 7.9 6.5 11.4 10.3
Trade 6.5 6.9 3.2 4.0 3.9 2.9 6.6 6.4 8.7 8.4 7.6 5.5 8.0
Building and construction 13.5 14.7 11.1 7.1 7.2 1.8 1.4 2.6 -7.0 -6.5 -4.1 -6.3 -5.4Transport & communi-
cations-10.7 -11.0 -9.1 -7.7 -8.0 -9.4 -6.5 -0.7 5.7 6.4 6.2 5.8 6.4
Finance & insurance 8.5 3.5 6.6 9.1 9.1 17.5 15.4 13.1 10.2 13.3 6.7 4.7 5.3
Real estate 4.3 0.9 1.7 1.2 1.2 -0.5 -2.6 -2.9 -0.1 -0.7 -0.5 1.0 0.5
Mining and quarrying 0.2 -9.1 -15.5 -11.6 -12.0 -10.7 -14.5 -13.4 -11.4 -12.5 -7.9 -4.3 -13.5
Private households 2.9 2.7 5.1 5.1 5.1 6.8 5.6 6.6 8.0 7.9 7.8 7.6 7.1
Consumer durables 9.1 11.5 7.8 7.6 7.3 11.0 15.4 16.1 13.9 16.4 18.0 21.3 23.6
Business services 3.3 6.5 4.3 12.1 12.4 8.0 0.0 0.3 -0.4 1.1 -1.2 -3.2 1.6
Other activities -5.8 -4.6 2.7 -12.4 -14.7 -34.8 -27.2 -33.1 -31.7 -29.6 -32.0 -21.0 -17.2
4. TOTAL (1+2+3) 5.7 5.8 5.8 7.0 4.6 4.6 5.4 4.6 13.9 11.7 6.3 7.8 7.4
Source: Central Bank of Kenya
MONEY, CREDIT AND INTEREST RATES
12 | Monthly Economic Bulletin July 2019
“To be a World Class Modern Central Bank”
MONEY, CREDIT AND INTEREST RATES
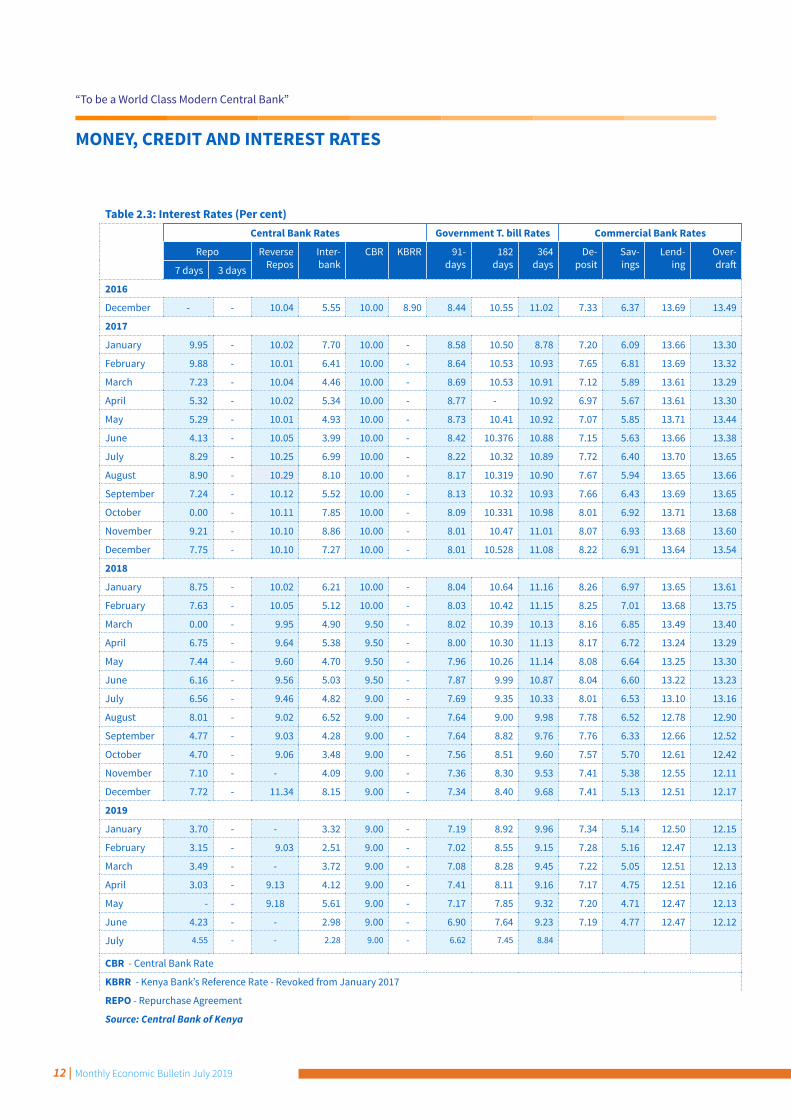
Table 2.3: Interest Rates (Per cent) Central Bank Rates Government T. bill Rates Commercial Bank Rates
Repo Reverse Repos
Inter-bank
CBR KBRR 91-days
182 days
364 days
De-posit
Sav-ings
Lend-ing
Over-draft7 days 3 days
2016
December - - 10.04 5.55 10.00 8.90 8.44 10.55 11.02 7.33 6.37 13.69 13.49
2017
January 9.95 - 10.02 7.70 10.00 - 8.58 10.50 8.78 7.20 6.09 13.66 13.30
February 9.88 - 10.01 6.41 10.00 - 8.64 10.53 10.93 7.65 6.81 13.69 13.32
March 7.23 - 10.04 4.46 10.00 - 8.69 10.53 10.91 7.12 5.89 13.61 13.29
April 5.32 - 10.02 5.34 10.00 - 8.77 - 10.92 6.97 5.67 13.61 13.30
May 5.29 - 10.01 4.93 10.00 - 8.73 10.41 10.92 7.07 5.85 13.71 13.44
June 4.13 - 10.05 3.99 10.00 - 8.42 10.376 10.88 7.15 5.63 13.66 13.38
July 8.29 - 10.25 6.99 10.00 - 8.22 10.32 10.89 7.72 6.40 13.70 13.65
August 8.90 - 10.29 8.10 10.00 - 8.17 10.319 10.90 7.67 5.94 13.65 13.66
September 7.24 - 10.12 5.52 10.00 - 8.13 10.32 10.93 7.66 6.43 13.69 13.65
October 0.00 - 10.11 7.85 10.00 - 8.09 10.331 10.98 8.01 6.92 13.71 13.68
November 9.21 - 10.10 8.86 10.00 - 8.01 10.47 11.01 8.07 6.93 13.68 13.60
December 7.75 - 10.10 7.27 10.00 - 8.01 10.528 11.08 8.22 6.91 13.64 13.54
2018
January 8.75 - 10.02 6.21 10.00 - 8.04 10.64 11.16 8.26 6.97 13.65 13.61
February 7.63 - 10.05 5.12 10.00 - 8.03 10.42 11.15 8.25 7.01 13.68 13.75
March 0.00 - 9.95 4.90 9.50 - 8.02 10.39 10.13 8.16 6.85 13.49 13.40
April 6.75 - 9.64 5.38 9.50 - 8.00 10.30 11.13 8.17 6.72 13.24 13.29
May 7.44 - 9.60 4.70 9.50 - 7.96 10.26 11.14 8.08 6.64 13.25 13.30
June 6.16 - 9.56 5.03 9.50 - 7.87 9.99 10.87 8.04 6.60 13.22 13.23
July 6.56 - 9.46 4.82 9.00 - 7.69 9.35 10.33 8.01 6.53 13.10 13.16
August 8.01 - 9.02 6.52 9.00 - 7.64 9.00 9.98 7.78 6.52 12.78 12.90
September 4.77 - 9.03 4.28 9.00 - 7.64 8.82 9.76 7.76 6.33 12.66 12.52
October 4.70 - 9.06 3.48 9.00 - 7.56 8.51 9.60 7.57 5.70 12.61 12.42
November 7.10 - - 4.09 9.00 - 7.36 8.30 9.53 7.41 5.38 12.55 12.11
December 7.72 - 11.34 8.15 9.00 - 7.34 8.40 9.68 7.41 5.13 12.51 12.17
2019
January 3.70 - - 3.32 9.00 - 7.19 8.92 9.96 7.34 5.14 12.50 12.15
February 3.15 - 9.03 2.51 9.00 - 7.02 8.55 9.15 7.28 5.16 12.47 12.13
March 3.49 - - 3.72 9.00 - 7.08 8.28 9.45 7.22 5.05 12.51 12.13
April 3.03 - 9.13 4.12 9.00 - 7.41 8.11 9.16 7.17 4.75 12.51 12.16
May - - 9.18 5.61 9.00 - 7.17 7.85 9.32 7.20 4.71 12.47 12.13
June 4.23 - - 2.98 9.00 - 6.90 7.64 9.23 7.19 4.77 12.47 12.12
July 4.55 - - 2.28 9.00 - 6.62 7.45 8.84
CBR - Central Bank Rate
KBRR - Kenya Bank’s Reference Rate - Revoked from January 2017
REPO - Repurchase Agreement
Source: Central Bank of Kenya
13 | Monthly Economic Bulletin July 2019
“To be a World Class Modern Central Bank”
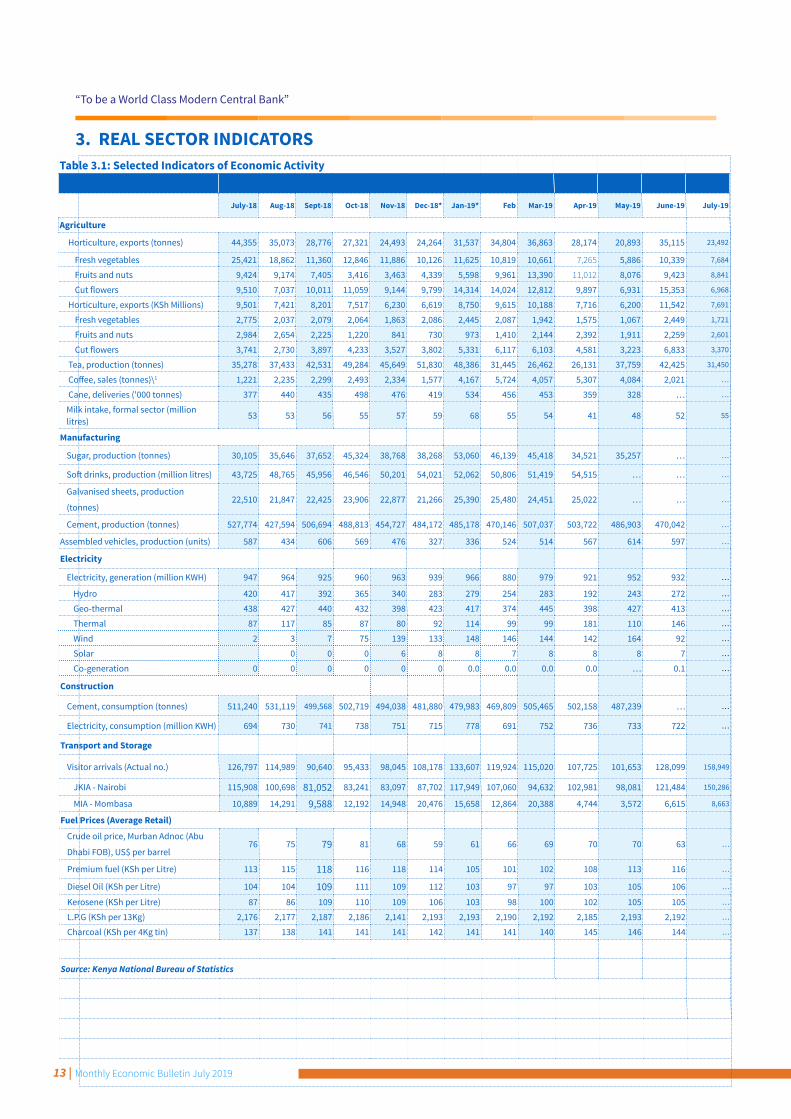
Table 3.1: Selected Indicators of Economic Activity
July-18 Aug-18 Sept-18 Oct-18 Nov-18 Dec-18* Jan-19* Feb Mar-19 Apr-19 May-19 June-19 July-19
Agriculture
Horticulture, exports (tonnes) 44,355 35,073 28,776 27,321 24,493 24,264 31,537 34,804 36,863 28,174 20,893 35,115 23,492
Fresh vegetables 25,421 18,862 11,360 12,846 11,886 10,126 11,625 10,819 10,661 7,265 5,886 10,339 7,684
Fruits and nuts 9,424 9,174 7,405 3,416 3,463 4,339 5,598 9,961 13,390 11,012 8,076 9,423 8,841
Cut flowers 9,510 7,037 10,011 11,059 9,144 9,799 14,314 14,024 12,812 9,897 6,931 15,353 6,968
Horticulture, exports (KSh Millions) 9,501 7,421 8,201 7,517 6,230 6,619 8,750 9,615 10,188 7,716 6,200 11,542 7,691
Fresh vegetables 2,775 2,037 2,079 2,064 1,863 2,086 2,445 2,087 1,942 1,575 1,067 2,449 1,721
Fruits and nuts 2,984 2,654 2,225 1,220 841 730 973 1,410 2,144 2,392 1,911 2,259 2,601
Cut flowers 3,741 2,730 3,897 4,233 3,527 3,802 5,331 6,117 6,103 4,581 3,223 6,833 3,370
Tea, production (tonnes) 35,278 37,433 42,531 49,284 45,649 51,830 48,386 31,445 26,462 26,131 37,759 42,425 31,450
Coffee, sales (tonnes)\1 1,221 2,235 2,299 2,493 2,334 1,577 4,167 5,724 4,057 5,307 4,084 2,021 …
Cane, deliveries ('000 tonnes) 377 440 435 498 476 419 534 456 453 359 328 … …
Milk intake, formal sector (million litres)
53 53 56 55 57 59 68 55 54 41 48 52 55
Manufacturing
Sugar, production (tonnes) 30,105 35,646 37,652 45,324 38,768 38,268 53,060 46,139 45,418 34,521 35,257 … …
Soft drinks, production (million litres) 43,725 48,765 45,956 46,546 50,201 54,021 52,062 50,806 51,419 54,515 … … …
Galvanised sheets, production
(tonnes) 22,510 21,847 22,425 23,906 22,877 21,266 25,390 25,480 24,451 25,022 … … …
Cement, production (tonnes) 527,774 427,594 506,694 488,813 454,727 484,172 485,178 470,146 507,037 503,722 486,903 470,042 …
Assembled vehicles, production (units) 587 434 606 569 476 327 336 524 514 567 614 597 …
Electricity Electricity, generation (million KWH) 947 964 925 960 963 939 966 880 979 921 952 932 …
Hydro 420 417 392 365 340 283 279 254 283 192 243 272 …
Geo-thermal 438 427 440 432 398 423 417 374 445 398 427 413 …
Thermal 87 117 85 87 80 92 114 99 99 181 110 146 …
Wind 2 3 7 75 139 133 148 146 144 142 164 92 …
Solar 0 0 0 6 8 8 7 8 8 8 7 …
Co-generation 0 0 0 0 0 0 0.0 0.0 0.0 0.0 … 0.1 …
Construction
Cement, consumption (tonnes) 511,240 531,119 499,568 502,719 494,038 481,880 479,983 469,809 505,465 502,158 487,239 … …
Electricity, consumption (million KWH) 694 730 741 738 751 715 778 691 752 736 733 722 …
Transport and Storage
Visitor arrivals (Actual no.) 126,797 114,989 90,640 95,433 98,045 108,178 133,607 119,924 115,020 107,725 101,653 128,099 158,949
JKIA - Nairobi 115,908 100,698 81,052 83,241 83,097 87,702 117,949 107,060 94,632 102,981 98,081 121,484 150,286
MIA - Mombasa 10,889 14,291 9,588 12,192 14,948 20,476 15,658 12,864 20,388 4,744 3,572 6,615 8,663
Fuel Prices (Average Retail)
Crude oil price, Murban Adnoc (Abu
Dhabi FOB), US$ per barrel 76 75 79 81 68 59 61 66 69 70 70 63 …
Premium fuel (KSh per Litre) 113 115 118 116 118 114 105 101 102 108 113 116 …
Diesel Oil (KSh per Litre) 104 104 109 111 109 112 103 97 97 103 105 106 …
Kerosene (KSh per Litre) 87 86 109 110 109 106 103 98 100 102 105 105 …
L.P.G (KSh per 13Kg) 2,176 2,177 2,187 2,186 2,141 2,193 2,193 2,190 2,192 2,185 2,193 2,192 …
Charcoal (KSh per 4Kg tin) 137 138 141 141 141 142 141 141 140 145 146 144 …
Source: Kenya National Bureau of Statistics
3. REAL SECTOR INDICATORS
14 | Monthly Economic Bulletin July 2019
“To be a World Class Modern Central Bank”
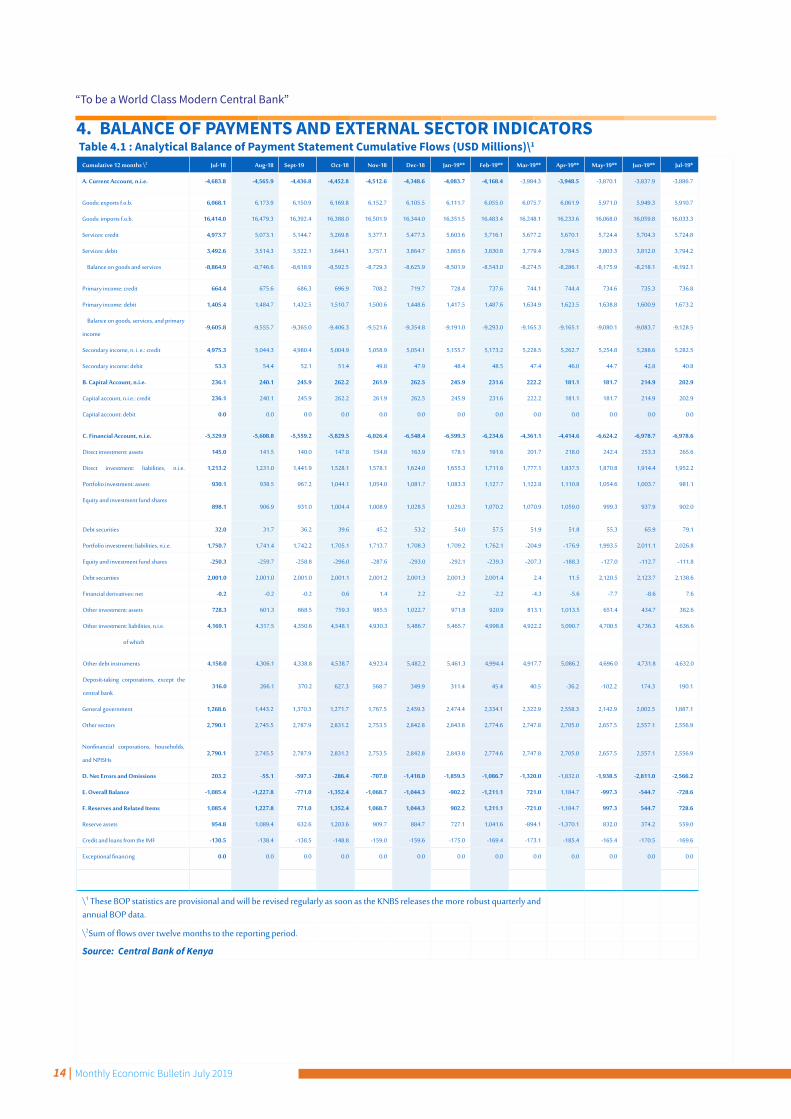
4. BALANCE OF PAYMENTS AND EXTERNAL SECTOR INDICATORS Table 4.1 : Analytical Balance of Payment Statement Cumulative Flows (USD Millions)\1
Cumulative 12 months \2 Jul-18 Aug-18 Sept-19 Oct-18 Nov-18 Dec-18 Jan-19** Feb-19** Mar-19** Apr-19** May-19** Jun-19** Jul-19*
A. Current Account, n.i.e. -4,683.8 -4,565.9 -4,436.8 -4,452.8 -4,512.6 -4,348.6 -4,083.7 -4,168.4 -3,984.3 -3,948.5 -3,870.1 -3,837.9 -3,886.7
Goods: exports f.o.b. 6,068.1 6,173.9 6,150.9 6,169.8 6,152.7 6,105.5 6,111.7 6,055.0 6,075.7 6,061.9 5,971.0 5,949.3 5,910.7
Goods: imports f.o.b. 16,414.0 16,479.3 16,392.4 16,388.0 16,501.9 16,344.0 16,351.5 16,483.4 16,248.1 16,233.6 16,068.0 16,059.8 16,033.3
Services: credit 4,973.7 5,073.1 5,144.7 5,269.8 5,377.1 5,477.3 5,603.6 5,716.1 5,677.2 5,670.1 5,724.4 5,704.3 5,724.8
Services: debit 3,492.6 3,514.3 3,522.1 3,644.1 3,757.1 3,864.7 3,865.6 3,830.8 3,779.4 3,784.5 3,803.3 3,812.0 3,794.2
Balance on goods and services -8,864.9 -8,746.6 -8,618.9 -8,592.5 -8,729.3 -8,625.9 -8,501.9 -8,543.0 -8,274.5 -8,286.1 -8,175.9 -8,218.1 -8,192.1
Primary income: credit 664.4 675.6 686.3 696.9 708.2 719.7 728.4 737.6 744.1 744.4 734.6 735.3 736.8
Primary income: debit 1,405.4 1,484.7 1,432.5 1,510.7 1,500.6 1,448.6 1,417.5 1,487.6 1,634.9 1,623.5 1,638.8 1,600.9 1,673.2
Balance on goods, services, and primary
income-9,605.8 -9,555.7 -9,365.0 -9,406.3 -9,521.6 -9,354.8 -9,191.0 -9,293.0 -9,165.3 -9,165.1 -9,080.1 -9,083.7 -9,128.5
Secondary income, n. i. e.: credit 4,975.3 5,044.3 4,980.4 5,004.9 5,058.9 5,054.1 5,155.7 5,173.2 5,228.5 5,262.7 5,254.8 5,288.6 5,282.5
Secondary income: debit 53.3 54.4 52.1 51.4 49.8 47.9 48.4 48.5 47.4 46.0 44.7 42.8 40.8
B. Capital Account, n.i.e. 236.1 240.1 245.9 262.2 261.9 262.5 245.9 231.6 222.2 181.1 181.7 214.9 202.9
Capital account, n.i.e.: credit 236.1 240.1 245.9 262.2 261.9 262.5 245.9 231.6 222.2 181.1 181.7 214.9 202.9
Capital account: debit 0.0 0.0 0.0 0.0 0.0 0.0 0.0 0.0 0.0 0.0 0.0 0.0 0.0
C. Financial Account, n.i.e. -5,329.9 -5,608.8 -5,559.2 -5,829.5 -6,026.4 -6,548.4 -6,599.3 -6,234.6 -4,361.1 -4,414.6 -6,624.2 -6,978.7 -6,978.6
Direct investment: assets 145.0 141.5 140.0 147.8 154.8 163.9 178.1 191.6 201.7 218.0 242.4 253.3 265.6
Direct investment: liabilities, n.i.e. 1,213.2 1,231.0 1,441.9 1,528.1 1,578.1 1,624.0 1,655.3 1,711.6 1,777.1 1,837.5 1,870.8 1,914.4 1,952.2
Portfolio investment: assets 930.1 938.5 967.2 1,044.1 1,054.0 1,081.7 1,083.3 1,127.7 1,122.8 1,110.8 1,054.6 1,003.7 981.1
Equity and investment fund shares898.1 906.9 931.0 1,004.4 1,008.9 1,028.5 1,029.3 1,070.2 1,070.9 1,059.0 999.3 937.9 902.0
Debt securities 32.0 31.7 36.2 39.6 45.2 53.2 54.0 57.5 51.9 51.8 55.3 65.9 79.1
Portfolio investment: liabilities, n.i.e. 1,750.7 1,741.4 1,742.2 1,705.1 1,713.7 1,708.3 1,709.2 1,762.1 -204.9 -176.9 1,993.5 2,011.1 2,026.8
Equity and investment fund shares -250.3 -259.7 -258.8 -296.0 -287.6 -293.0 -292.1 -239.3 -207.3 -188.3 -127.0 -112.7 -111.8
Debt securities 2,001.0 2,001.0 2,001.0 2,001.1 2,001.2 2,001.3 2,001.3 2,001.4 2.4 11.5 2,120.5 2,123.7 2,138.6
Financial derivatives: net -0.2 -0.2 -0.2 0.6 1.4 2.2 -2.2 -2.2 -4.3 -5.6 -7.7 -8.6 7.6
Other investment: assets 728.3 601.3 868.5 759.3 985.5 1,022.7 971.8 920.9 813.1 1,013.5 651.4 434.7 382.6
Other investment: liabilities, n.i.e. 4,169.1 4,317.5 4,350.6 4,548.1 4,930.3 5,486.7 5,465.7 4,998.8 4,922.2 5,090.7 4,700.5 4,736.3 4,636.6
of which
Other debt instruments 4,158.0 4,306.1 4,338.8 4,538.7 4,923.4 5,482.2 5,461.3 4,994.4 4,917.7 5,086.2 4,696.0 4,731.8 4,632.0
Deposit-taking corporations, except the
central bank316.0 266.1 370.2 627.3 568.7 349.9 311.4 45.4 40.5 -36.2 -102.2 174.3 190.1
General government 1,268.6 1,443.2 1,370.3 1,271.7 1,767.5 2,459.3 2,474.4 2,334.1 2,322.9 2,558.3 2,142.9 2,002.5 1,887.1
Other sectors 2,790.1 2,745.5 2,787.9 2,831.2 2,753.5 2,842.8 2,843.8 2,774.6 2,747.8 2,705.0 2,657.5 2,557.1 2,556.9
Nonfinancial corporations, households,
and NPISHs2,790.1 2,745.5 2,787.9 2,831.2 2,753.5 2,842.8 2,843.8 2,774.6 2,747.8 2,705.0 2,657.5 2,557.1 2,556.9
D. Net Errors and Omissions 203.2 -55.1 -597.3 -286.4 -707.0 -1,418.0 -1,859.3 -1,086.7 -1,320.0 -1,832.0 -1,938.5 -2,811.0 -2,566.2
E. Overall Balance -1,085.4 -1,227.8 -771.0 -1,352.4 -1,068.7 -1,044.3 -902.2 -1,211.1 721.0 1,184.7 -997.3 -544.7 -728.6
F. Reserves and Related Items 1,085.4 1,227.8 771.0 1,352.4 1,068.7 1,044.3 902.2 1,211.1 -721.0 -1,184.7 997.3 544.7 728.6
Reserve assets 954.8 1,089.4 632.6 1,203.6 909.7 884.7 727.1 1,041.6 -894.1 -1,370.1 832.0 374.2 559.0
Credit and loans from the IMF -130.5 -138.4 -138.5 -148.8 -159.0 -159.6 -175.0 -169.4 -173.1 -185.4 -165.4 -170.5 -169.6
Exceptional financing 0.0 0.0 0.0 0.0 0.0 0.0 0.0 0.0 0.0 0.0 0.0 0.0 0.0
\1 These BOP statistics are provisional and will be revised regularly as soon as the KNBS releases the more robust quarterly and annual BOP data.
\2Sum of flows over twelve months to the reporting period.
Source: Central Bank of Kenya

15 | Monthly Economic Bulletin July 2019
“To be a World Class Modern Central Bank”
Table 4.2: Monthly Average Exchange Rates MONTH CURRENCY
USD UK POUND EURO SA RAND USHS TSHS RWF BIF
KENYA SHILLINGS PER UNIT OF CURRENCY\1 UNITS OF CURRENCY PER KENYA SHILLING\2
2017
May 103.26 133.46 114.05 7.79 35.10 21.65 8.04 16.54
Jun 103.49 132.47 116.18 8.03 34.69 21.62 8.03 16.66
July 103.88 134.86 119.40 7.90 34.67 21.55 7.97 16.66
August 103.56 134.24 122.24 7.82 34.82 21.62 8.01 16.79
September 103.12 137.09 122.86 7.85 34.91 21.75 8.07 16.92
October 103.39 136.44 121.59 7.58 35.16 21.71 8.09 16.94
November 103.57 136.78 121.42 7.34 35.14 21.66 8.16 16.95
December 103.10 138.24 121.97 7.81 35.14 21.73 8.22 17.08
2018
January 102.92 141.95 125.37 8.42 35.37 21.81 8.23 17.13
February 101.40 141.72 125.29 8.57 35.87 22.20 8.44 17.40
March 101.18 141.24 124.68 8.54 36.16 22.31 8.49 17.45
April 100.61 141.86 123.65 8.33 36.73 22.58 8.61 17.52
May 100.67 135.68 118.96 8.02 37.00 22.67 8.62 17.52
June 101.00 134.24 117.97 7.62 38.05 22.54 8.63 17.45
July 100.67 132.58 117.60 7.50 37.41 22.61 8.69 17.52
August 100.61 129.68 116.25 7.18 37.06 22.71 8.72 17.58
September 100.83 131.65 117.66 6.81 37.70 22.67 8.72 17.60
October 101.08 131.60 116.20 7.00 37.40 22.66 8.74 17.60
November 102.36 132.08 116.35 7.24 36.54 22.46 8.68 17.41
December 102.29 129.74 116.45 7.22 36.32 22.49 8.72 17.48
2019
January 101.58 130.76 115.95 7.29 36.45 22.72 8.80 17.68
February 100.23 130.29 113.81 7.27 36.64 23.23 8.94 17.96
March 100.36 132.29 113.51 6.99 36.92 23.36 8.97 18.01
April 101.07 131.77 113.58 7.13 36.97 22.88 8.93 18.10
May 101.15 130.06 113.17 7.01 37.22 22.74 8.95 18.12
June 101.69 128.82 114.73 6.96 36.72 22.61 8.94 18.07
July 103.16 128.92 115.83 7.35 35.84 22.30 8.86 17.83
USD - United States Dollar
SA RAND - South African Rand
USHS - Uganda Shilling
TSHS - Tanzania Shilling
RWF- Rwanda Franc
BIF - Burundi Franc
\1Kenya Shillings per unit of currency e.g 91.36 KShs=1 USD
\2Units of currency per Kenya Shilling e.g 31.29 USHS= 1 KShs
Source: Central Bank of Kenya
BALANCE OF PAYMENTS AND EXTERNAL SECTOR INDICATORS

16 | Monthly Economic Bulletin July 2019
“To be a World Class Modern Central Bank”
Table 4.3 Foreign Exchange Reserves (End of Period USD Million)
Jul-18 Aug-18 Sept-18 Oct-18 Nov-18 Dec-18 Jan-19 Feb-19 Mar-19 Apr-19** May-19** Jun-19** Jul-19*
Gross Reserves 12,261.8 12,096.7 11,860.7 11,667.9 11,531.1 11,516.2 11,387.2 11,737.7 11,772.1 11,653.6 13,368.6 13,187.3 13,088.8
of which
Official Reserves 9,103.1 9,012.9 8,544.8 8,553.9 8,280.7 8,230.3 8,241.6 8,573.5 8,467.7 8,090.2 10,122.2 9,655.9 9,661.6
Months of import cover\1 6.0 5.9 5.6 5.6 5.4 5.3 5.3 5.5 5.4 5.1 6.4 6.0 6.0
Commercial Banks 3,158.8 3,083.8 3,315.9 3,114.0 3,250.4 3,285.9 3,145.6 3,164.1 3,304.3 3,563.4 3,246.4 3,531.4 3,427.1
\1Based on 36 month average of imports of goods and services
Source: Central Bank of Kenya
Chart 1: Official Reserves and Months of Import Cover
BALANCE OF PAYMENTS AND EXTERNAL SECTOR INDICATORS
Source: Central Bank of Kenya
6,500
7,000
7,500
8,000
8,500
9,000
9,500
10,000
10,500
11,000
4.9
5.1
5.3
5.5
5.7
5.9
6.1
6.3
6.5
No
v-1
6
De
c-1
6
Ja
n-1
7
Fe
b-1
7
Ma
r-1
7
Ap
r-1
7
Ma
y-1
7
Ju
n-1
7
Ju
l-1
7
Au
g-1
7
Se
p-1
7
Oc
t-1
7
No
v-1
7
De
c-1
7
Ja
n-1
8
Fe
b-1
8
Ma
r-1
8
Ap
r-1
8
Ma
y-1
8
Ju
n-1
8
Ju
l-1
8
Au
g-1
8
Se
p-1
8
Oc
t-1
8
No
v-1
8
De
c-1
8
Ja
n-1
9
Fe
b-1
9
Ma
r-1
9
Ap
r-1
9
Ma
y-1
9
Ju
n-1
9
Ju
l-1
9
Mo
nth
s o
f Im
po
rt C
ov
er
Months of Import Cover Official Reserves(RHS)

17 | Monthly Economic Bulletin July 2019
“To be a World Class Modern Central Bank”
Total Assets Shareholders Funds
Gross Loans Gross Non-Per-forming Loans
Gross Deposits
Total Liquidity Ratio (%) (Average)
Profit Before Tax
2017March 3,841.5 619.2 2,381.3 226.6 2,741.2 43.8 34.4
April 3,920.1 615.3 2,397.5 230.6 2,813.5 44.4 45.3
May 3,903.3 614.3 2,354.1 233.8 2,832.2 55.7 55.6
June 3,946.4 622.9 2,366.1 234.6 2,854.3 44.7 69.4
July 3,988.6 631.9 2,370.3 245.1 2,885.6 45.6 80.1
August 3,978.3 641.0 2,367.4 253.8 2,893.9 45.6 92.9
September 4,030.3 640.3 2,390.4 249.7 2,898.5 45.4 99.0
October 4,036.4 643.4 2,413.7 256.5 2,909.5 44.7 113.6
November 4,020.7 649.7 2,441.0 257.3 2,901.9 44.2 123.7
December 4,051.8 650.5 2,452.7 259.2 2,946.7 43.8 135.5
2018January 4,046.8 653.0 2,442.5 272.2 2,949.8 44.4 12.1
February 4,072.4 659.1 2,434.9 277.7 2,954.8 44.6 22.8
March 4,081.9 629.7 2,432.2 287.2 2,979.5 45.0 37.7
April 4,131.3 643.5 2,448.3 302.5 3,036.9 47.2 49.4
May 4,225.4 630.5 2,495.4 302.7 3,106.6 47.6 62.5 June 4,266.7 642.0 2,492.7 298.4 3,161.5 48.0 76.2
July 4,280.2 652.1 2,474.3 308.8 3,169.3 48.3 87.9
August 4,395.2 662.0 2,563.8 324.5 3,240.4 48.4 100.1
September 4,414.7 672.2 2,538.7 317.9 3,241.2 49.3 115.2
October 4,448.2 676.5 2,590.1 319.7 3,268.0 48.9 127.6
November 4,392.9 678.1 2,562.3 313.9 3,258.9 48.7 142.6
December 4,446.1 676.9 2,567.3 308.8 3,332.4 48.6 152.3
2019
January 4,462.6 688.7 2,553.7 319.1 3,322.2 49.1 13.4
February 4,510.5 703.7 2,558.5 327.9 3,314.2 49.8 25.3
March 4,571.6 715.2 2,583.9 330.3 3,400.1 50.8 44.0
April 4,600.7 722.3 2,602.6 335.8 3,373.2 51.0 56.8
April 4,600.7 722.3 2,602.6 335.8 3,373.2 51.0 56.8
May 4,592.9 705.6 2,617.8 337.2 3,401.0 50.4 70.0
June 4,719.7 720.3 2,653.8 335.9 3,506.0 50.6 85.8
July 4,751.2 729.3 2,707.1 336.4 3,476.2 51.0 99.1
Note: From December 2015, data in this table excludes data for Charterhouse Bank, Chase Bank and Imperial Bank which were under receivership
Unaudited
Source: Central Bank of Kenya
Table 5.1: Kenyan Banking Sector Performance Indicators (KSh Billion)
5. DEVELOPMENTS IN THE BANKING SECTOR
18 | Monthly Economic Bulletin July 2019
“To be a World Class Modern Central Bank”
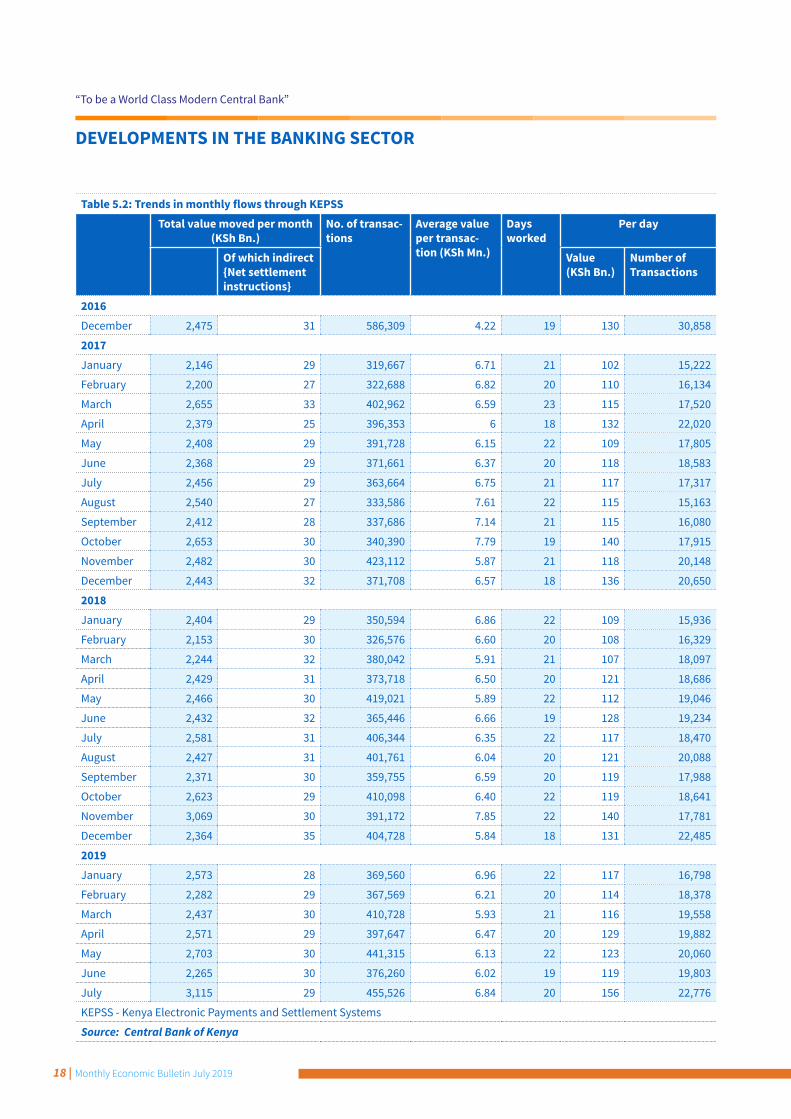
DEVELOPMENTS IN THE BANKING SECTOR
Table 5.2: Trends in monthly flows through KEPSSTotal value moved per month
(KSh Bn.)No. of transac-tions
Average value per transac-tion (KSh Mn.)
Days worked
Per day
Of which indirect {Net settlement instructions}
Value (KSh Bn.)
Number of Transactions
2016December 2,475 31 586,309 4.22 19 130 30,858
2017January 2,146 29 319,667 6.71 21 102 15,222
February 2,200 27 322,688 6.82 20 110 16,134
March 2,655 33 402,962 6.59 23 115 17,520
April 2,379 25 396,353 6 18 132 22,020
May 2,408 29 391,728 6.15 22 109 17,805
June 2,368 29 371,661 6.37 20 118 18,583
July 2,456 29 363,664 6.75 21 117 17,317
August 2,540 27 333,586 7.61 22 115 15,163
September 2,412 28 337,686 7.14 21 115 16,080
October 2,653 30 340,390 7.79 19 140 17,915
November 2,482 30 423,112 5.87 21 118 20,148
December 2,443 32 371,708 6.57 18 136 20,650
2018January 2,404 29 350,594 6.86 22 109 15,936
February 2,153 30 326,576 6.60 20 108 16,329
March 2,244 32 380,042 5.91 21 107 18,097
April 2,429 31 373,718 6.50 20 121 18,686
May 2,466 30 419,021 5.89 22 112 19,046
June 2,432 32 365,446 6.66 19 128 19,234
July 2,581 31 406,344 6.35 22 117 18,470
August 2,427 31 401,761 6.04 20 121 20,088
September 2,371 30 359,755 6.59 20 119 17,988
October 2,623 29 410,098 6.40 22 119 18,641
November 3,069 30 391,172 7.85 22 140 17,781
December 2,364 35 404,728 5.84 18 131 22,485
2019January 2,573 28 369,560 6.96 22 117 16,798
February 2,282 29 367,569 6.21 20 114 18,378
March 2,437 30 410,728 5.93 21 116 19,558
April 2,571 29 397,647 6.47 20 129 19,882
May 2,703 30 441,315 6.13 22 123 20,060
June 2,265 30 376,260 6.02 19 119 19,803
July 3,115 29 455,526 6.84 20 156 22,776
KEPSS - Kenya Electronic Payments and Settlement Systems
Source: Central Bank of Kenya
19 | Monthly Economic Bulletin July 2019
“To be a World Class Modern Central Bank”
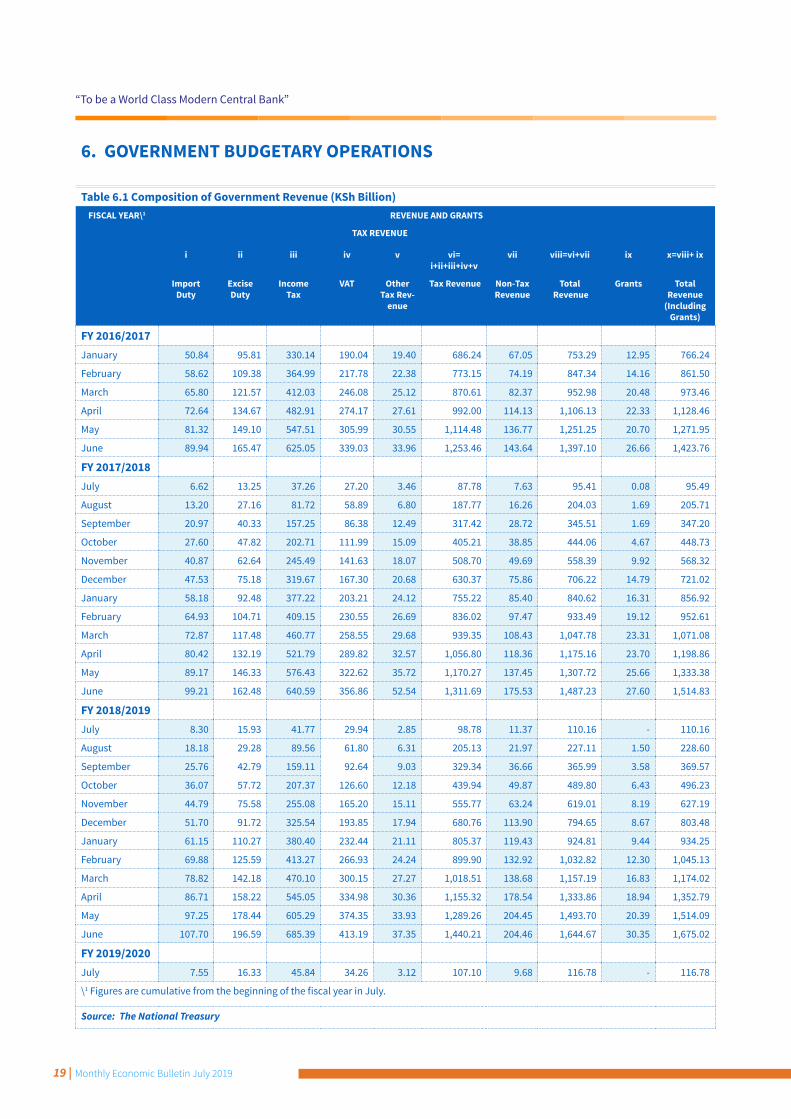
6. GOVERNMENT BUDGETARY OPERATIONS
Table 6.1 Composition of Government Revenue (KSh Billion)FISCAL YEAR\1 REVENUE AND GRANTS
TAX REVENUE
i ii iii iv v vi= i+ii+iii+iv+v
vii viii=vi+vii ix x=viii+ ix
Import Duty
Excise Duty
Income Tax
VAT Other Tax Rev-
enue
Tax Revenue Non-Tax Revenue
Total Revenue
Grants Total Revenue
(Including Grants)
FY 2016/2017January 50.84 95.81 330.14 190.04 19.40 686.24 67.05 753.29 12.95 766.24
February 58.62 109.38 364.99 217.78 22.38 773.15 74.19 847.34 14.16 861.50
March 65.80 121.57 412.03 246.08 25.12 870.61 82.37 952.98 20.48 973.46
April 72.64 134.67 482.91 274.17 27.61 992.00 114.13 1,106.13 22.33 1,128.46
May 81.32 149.10 547.51 305.99 30.55 1,114.48 136.77 1,251.25 20.70 1,271.95
June 89.94 165.47 625.05 339.03 33.96 1,253.46 143.64 1,397.10 26.66 1,423.76
FY 2017/2018July 6.62 13.25 37.26 27.20 3.46 87.78 7.63 95.41 0.08 95.49
August 13.20 27.16 81.72 58.89 6.80 187.77 16.26 204.03 1.69 205.71
September 20.97 40.33 157.25 86.38 12.49 317.42 28.72 345.51 1.69 347.20
October 27.60 47.82 202.71 111.99 15.09 405.21 38.85 444.06 4.67 448.73
November 40.87 62.64 245.49 141.63 18.07 508.70 49.69 558.39 9.92 568.32
December 47.53 75.18 319.67 167.30 20.68 630.37 75.86 706.22 14.79 721.02
January 58.18 92.48 377.22 203.21 24.12 755.22 85.40 840.62 16.31 856.92
February 64.93 104.71 409.15 230.55 26.69 836.02 97.47 933.49 19.12 952.61
March 72.87 117.48 460.77 258.55 29.68 939.35 108.43 1,047.78 23.31 1,071.08
April 80.42 132.19 521.79 289.82 32.57 1,056.80 118.36 1,175.16 23.70 1,198.86
May 89.17 146.33 576.43 322.62 35.72 1,170.27 137.45 1,307.72 25.66 1,333.38
June 99.21 162.48 640.59 356.86 52.54 1,311.69 175.53 1,487.23 27.60 1,514.83
FY 2018/2019
July 8.30 15.93 41.77 29.94 2.85 98.78 11.37 110.16 - 110.16
August 18.18 29.28 89.56 61.80 6.31 205.13 21.97 227.11 1.50 228.60
September 25.76 42.79 159.11 92.64 9.03 329.34 36.66 365.99 3.58 369.57
October 36.07 57.72 207.37 126.60 12.18 439.94 49.87 489.80 6.43 496.23
November 44.79 75.58 255.08 165.20 15.11 555.77 63.24 619.01 8.19 627.19
December 51.70 91.72 325.54 193.85 17.94 680.76 113.90 794.65 8.67 803.48
January 61.15 110.27 380.40 232.44 21.11 805.37 119.43 924.81 9.44 934.25
February 69.88 125.59 413.27 266.93 24.24 899.90 132.92 1,032.82 12.30 1,045.13
March 78.82 142.18 470.10 300.15 27.27 1,018.51 138.68 1,157.19 16.83 1,174.02
April 86.71 158.22 545.05 334.98 30.36 1,155.32 178.54 1,333.86 18.94 1,352.79
May 97.25 178.44 605.29 374.35 33.93 1,289.26 204.45 1,493.70 20.39 1,514.09
June 107.70 196.59 685.39 413.19 37.35 1,440.21 204.46 1,644.67 30.35 1,675.02
FY 2019/2020
July 7.55 16.33 45.84 34.26 3.12 107.10 9.68 116.78 - 116.78
\1 Figures are cumulative from the beginning of the fiscal year in July.
Source: The National Treasury

20 | Monthly Economic Bulletin July 2019
“To be a World Class Modern Central Bank”
GOVERNMENT BUDGETARY OPERATIONS
Table 6.2 Composition of Government Expenditure (KSh Billion)FISCAL YEAR\1 EXPENDITURE (COMMITMENT BASIS)
RECURRENT EXPENDITURE i ii iii iv=i+ii+iii
Domestic Interest
Foreign Interest
Wages & Salaries
Pensions Other Total Recurrent
Expendi-ture
Devel-opment
Expendi-ture\2
County Transfer
Total Expendi-
ture
FY 2016/2017
April 164.13 38.51 300.65 50.72 362.33 916.34 530.71 210.18 1,657.23
May 188.58 44.32 307.42 52.52 435.15 1,027.99 559.40 245.50 1,832.89
June 212.87 58.37 336.64 62.93 507.67 1,178.47 645.77 284.71 2,108.95
FY 2017/2018
July 11.71 7.10 32.60 0.25 24.08 75.50 5.75 8.79 90.04
August 29.52 7.76 65.21 7.55 10.71 120.75 24.28 17.90 162.93
September 49.87 17.28 91.50 13.95 87.76 299.91 90.67 21.69 412.27
October 70.24 19.43 122.00 16.32 133.31 361.30 121.80 35.37 518.47
November 89.41 25.13 163.02 22.17 174.61 474.35 143.30 65.45 683.10
December 114.63 41.28 195.63 27.91 605.70 633.61 209.80 84.67 928.08
January 125.89 50.34 228.23 31.74 320.97 757.17 209.85 107.52 1,074.54
February 140.77 51.06 260.84 37.52 363.81 854.00 277.07 126.94 1,258.02
March 164.59 55.59 293.44 47.04 408.40 973.06 341.08 174.52 1,488.66
April 189.92 62.79 326.05 52.75 456.18 1,087.69 366.07 193.06 1,646.81
May 214.08 66.46 358.65 54.67 509.23 1,203.08 392.98 239.79 1,835.85
June 239.47 84.42 383.95 65.10 546.65 1,319.59 485.67 306.20 2,111.46
FY 2018/2019
July 17.31 10.46 37.01 3.30 21.39 89.47 2.20 - 91.68
August 34.00 19.08 74.03 7.69 78.03 212.83 36.08 4.03 252.94
September 61.12 22.98 94.98 13.12 153.17 345.37 83.55 23.53 452.46
October 82.89 32.38 148.05 18.28 163.26 444.87 130.30 44.70 619.87
November 105.51 32.38 185.07 22.93 196.78 542.67 234.87 74.49 852.03
December 131.53 46.10 201.62 38.17 346.17 643.90 311.88 119.67 1,075.46
January 146.77 52.48 247.96 37.39 478.46 812.80 303.28 150.26 1,266.34
February 165.63 61.12 283.38 43.88 547.61 924.31 364.47 177.31 1,466.10
March 193.34 80.05 318.06 50.73 617.29 1,053.84 384.92 205.63 1,644.39
April 220.09 86.27 354.23 55.60 721.28 1,203.19 419.13 234.29 1,856.60
May 245.96 90.45 389.65 60.24 542.75 1,329.05 477.43 263.35 2,069.82
June 264.83 103.72 427.95 84.61 618.89 1,500.00 529.20 360.33 2,389.53
FY 2019/2020
July 28.75 15.12 38.34 3.15 22.89 108.24 4.73 - 112.97
\1 Figures are cumulative from the beginning of the fiscal year in July.
\2Includes Equalization fund
Source: The National Treasury
21 | Monthly Economic Bulletin July 2019
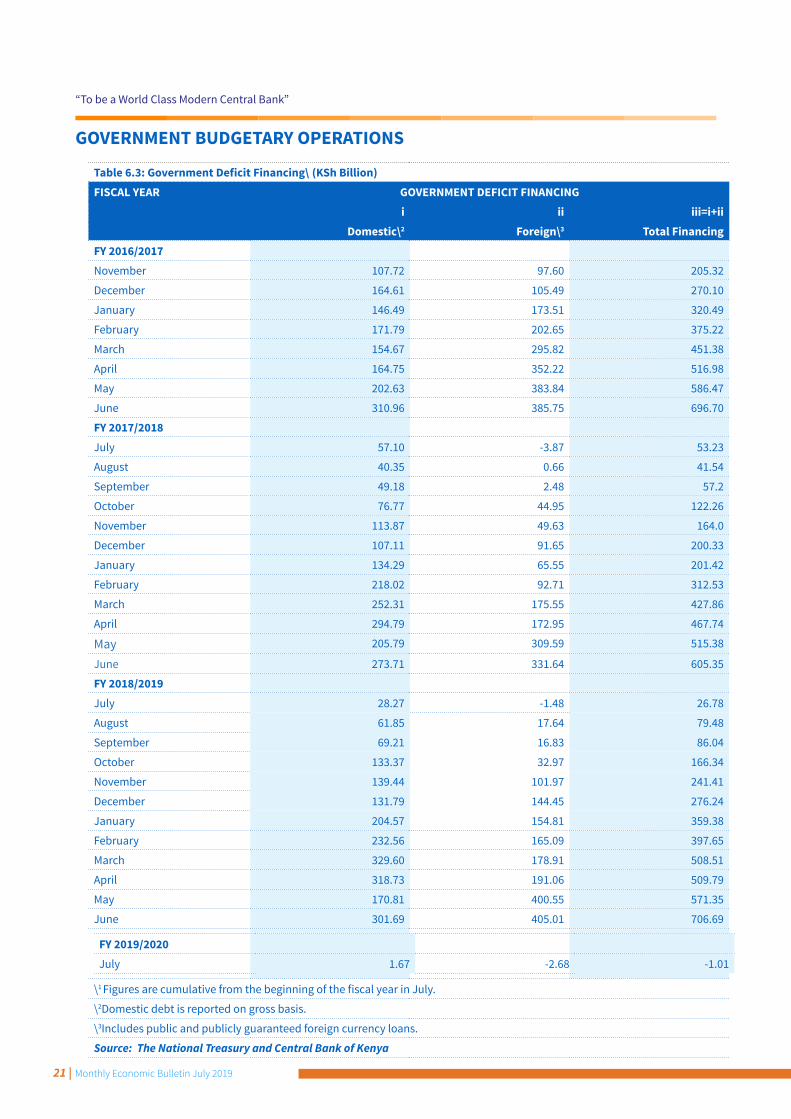
“To be a World Class Modern Central Bank”
Table 6.3: Government Deficit Financing\ (KSh Billion)FISCAL YEAR GOVERNMENT DEFICIT FINANCING
i ii iii=i+iiDomestic\2 Foreign\3 Total Financing
FY 2016/2017November 107.72 97.60 205.32
December 164.61 105.49 270.10
January 146.49 173.51 320.49
February 171.79 202.65 375.22
March 154.67 295.82 451.38
April 164.75 352.22 516.98
May 202.63 383.84 586.47
June 310.96 385.75 696.70
FY 2017/2018July 57.10 -3.87 53.23
August 40.35 0.66 41.54
September 49.18 2.48 57.2
October 76.77 44.95 122.26
November 113.87 49.63 164.0
December 107.11 91.65 200.33
January 134.29 65.55 201.42
February 218.02 92.71 312.53
March 252.31 175.55 427.86
April 294.79 172.95 467.74
May 205.79 309.59 515.38
June 273.71 331.64 605.35
FY 2018/2019July 28.27 -1.48 26.78
August 61.85 17.64 79.48
September 69.21 16.83 86.04
October 133.37 32.97 166.34
November 139.44 101.97 241.41
December 131.79 144.45 276.24
January 204.57 154.81 359.38
February 232.56 165.09 397.65
March 329.60 178.91 508.51
April 318.73 191.06 509.79
May 170.81 400.55 571.35
June 301.69 405.01 706.69
FY 2019/2020July 1.67 -2.68 -1.01
\1 Figures are cumulative from the beginning of the fiscal year in July.
\2Domestic debt is reported on gross basis.
\3Includes public and publicly guaranteed foreign currency loans.
Source: The National Treasury and Central Bank of Kenya
GOVERNMENT BUDGETARY OPERATIONS
22 | Monthly Economic Bulletin July 2019
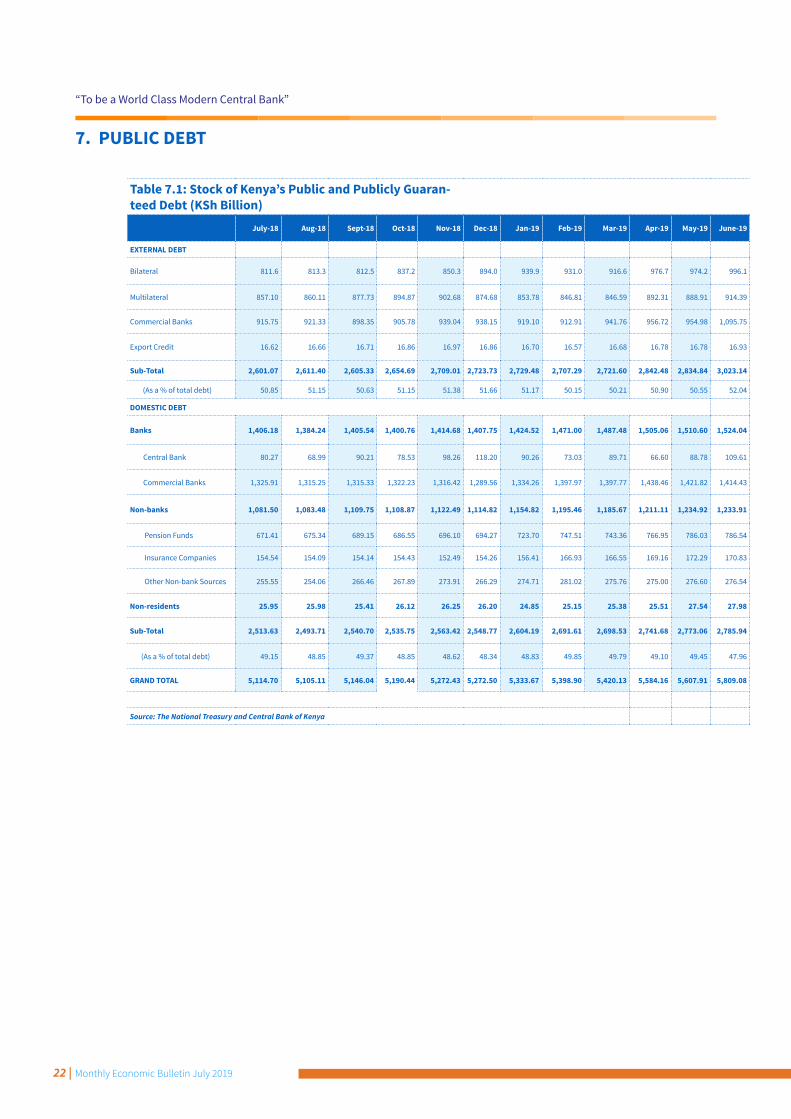
“To be a World Class Modern Central Bank”
Table 7.1: Stock of Kenya’s Public and Publicly Guaran-teed Debt (KSh Billion)
July-18 Aug-18 Sept-18 Oct-18 Nov-18 Dec-18 Jan-19 Feb-19 Mar-19 Apr-19 May-19 June-19
EXTERNAL DEBT
Bilateral 811.6 813.3 812.5 837.2 850.3 894.0 939.9 931.0 916.6 976.7 974.2 996.1
Multilateral 857.10 860.11 877.73 894.87 902.68 874.68 853.78 846.81 846.59 892.31 888.91 914.39
Commercial Banks 915.75 921.33 898.35 905.78 939.04 938.15 919.10 912.91 941.76 956.72 954.98 1,095.75
Export Credit 16.62 16.66 16.71 16.86 16.97 16.86 16.70 16.57 16.68 16.78 16.78 16.93
Sub-Total 2,601.07 2,611.40 2,605.33 2,654.69 2,709.01 2,723.73 2,729.48 2,707.29 2,721.60 2,842.48 2,834.84 3,023.14
(As a % of total debt) 50.85 51.15 50.63 51.15 51.38 51.66 51.17 50.15 50.21 50.90 50.55 52.04
DOMESTIC DEBT
Banks 1,406.18 1,384.24 1,405.54 1,400.76 1,414.68 1,407.75 1,424.52 1,471.00 1,487.48 1,505.06 1,510.60 1,524.04
Central Bank 80.27 68.99 90.21 78.53 98.26 118.20 90.26 73.03 89.71 66.60 88.78 109.61
Commercial Banks 1,325.91 1,315.25 1,315.33 1,322.23 1,316.42 1,289.56 1,334.26 1,397.97 1,397.77 1,438.46 1,421.82 1,414.43
Non-banks 1,081.50 1,083.48 1,109.75 1,108.87 1,122.49 1,114.82 1,154.82 1,195.46 1,185.67 1,211.11 1,234.92 1,233.91
Pension Funds 671.41 675.34 689.15 686.55 696.10 694.27 723.70 747.51 743.36 766.95 786.03 786.54
Insurance Companies 154.54 154.09 154.14 154.43 152.49 154.26 156.41 166.93 166.55 169.16 172.29 170.83
Other Non-bank Sources 255.55 254.06 266.46 267.89 273.91 266.29 274.71 281.02 275.76 275.00 276.60 276.54
Non-residents 25.95 25.98 25.41 26.12 26.25 26.20 24.85 25.15 25.38 25.51 27.54 27.98
Sub-Total 2,513.63 2,493.71 2,540.70 2,535.75 2,563.42 2,548.77 2,604.19 2,691.61 2,698.53 2,741.68 2,773.06 2,785.94
(As a % of total debt) 49.15 48.85 49.37 48.85 48.62 48.34 48.83 49.85 49.79 49.10 49.45 47.96
GRAND TOTAL 5,114.70 5,105.11 5,146.04 5,190.44 5,272.43 5,272.50 5,333.67 5,398.90 5,420.13 5,584.16 5,607.91 5,809.08
Source: The National Treasury and Central Bank of Kenya
7. PUBLIC DEBT

23 | Monthly Economic Bulletin July 2019
“To be a World Class Modern Central Bank”
Table 7.2: Composition of Government Gross Domestic Debt by Instrument (KSh Billion)
July-18 Aug-18 Sept-18 Oct-18 Nov-18 Dec-18 Jan-19 Feb-19 Mar-19 Apr-19 May-19 Jun-19 Jul-19
Treasury Bills\1 969.5 945.8 967.4 974.7 972.9 922.2 967.3 994.3 971.3 1,025.2 987.2 975.3 974.6
Treasury Bonds 1,509.0 1,524.5 1,528.8 1,527.6 1,536.8 1,552.9 1,591.3 1,668.6 1,685.7 1,692.9 1,746.2 1,748.6 1,799.2
Overdraft at Central Bank
26.3 15.1 36.3 25.2 44.9 64.8 36.9 19.7 36.9 13.8 36.0 57.3 66.0
Advances from Commercial Banks
8.1 7.7 7.6 7.6 8.2 8.2 8.0 8.4 3.5 8.6 2.4 3.4 3.1
Other Domestic Debt\2 ( TRCs and uncleared effects)
0.7 0.7 0.7 0.7 0.7 0.7 0.7 0.7 1.2 1.3 1.2 1.3 1.5
Total Domestic Debt\3 2,513.63 2,493.71 2,540.70 2,535.75 2,563.42 2,548.77 2,604.19 2,691.6 2,698.5 2,741.7 2,773.1 2,785.9 2,844.3
\1The stock of Treasury bills includes Repo Treasury bills.
\2 Other domestic debt includes Items in transit,securities re-discounted and Tax Reserve Certificates (TRCs) .
\3 Gross domestic debt excludes IMF funds on-lent by CBK to Government, which are accounted for under External Debt.
Source: Central Bank of Kenya
PUBLIC DEBT
24 | Monthly Economic Bulletin July 2019
“To be a World Class Modern Central Bank”
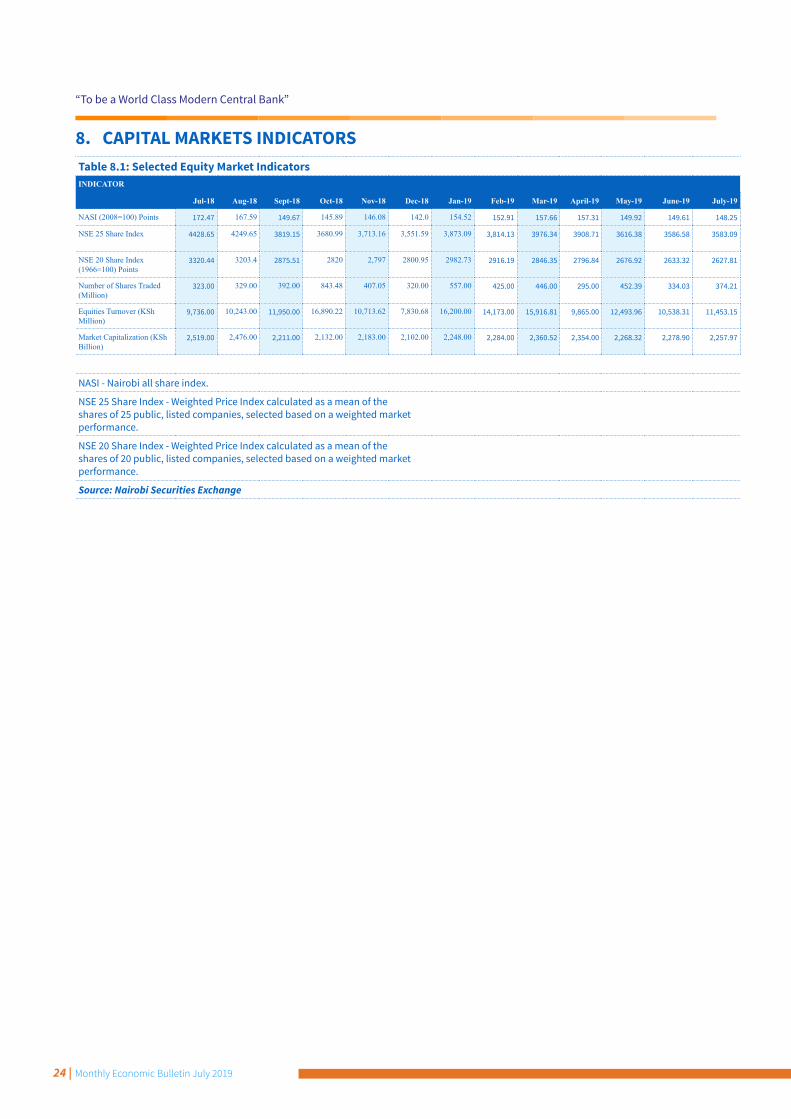
8. CAPITAL MARKETS INDICATORSTable 8.1: Selected Equity Market IndicatorsINDICATOR
Jul-18 Aug-18 Sept-18 Oct-18 Nov-18 Dec-18 Jan-19 Feb-19 Mar-19 April-19 May-19 June-19 July-19
NASI (2008=100) Points 172.47 167.59 149.67 145.89 146.08 142.0 154.52 152.91 157.66 157.31 149.92 149.61 148.25
NSE 25 Share Index 4428.65 4249.65 3819.15 3680.99 3,713.16 3,551.59 3,873.09 3,814.13 3976.34 3908.71 3616.38 3586.58 3583.09
NSE 20 Share Index (1966=100) Points
3320.44 3203.4 2875.51 2820 2,797 2800.95 2982.73 2916.19 2846.35 2796.84 2676.92 2633.32 2627.81
Number of Shares Traded (Million)
323.00 329.00 392.00 843.48 407.05 320.00 557.00 425.00 446.00 295.00 452.39 334.03 374.21
Equities Turnover (KSh Million)
9,736.00 10,243.00 11,950.00 16,890.22 10,713.62 7,830.68 16,200.00 14,173.00 15,916.81 9,865.00 12,493.96 10,538.31 11,453.15
Market Capitalization (KSh Billion)
2,519.00 2,476.00 2,211.00 2,132.00 2,183.00 2,102.00 2,248.00 2,284.00 2,360.52 2,354.00 2,268.32 2,278.90 2,257.97
NASI - Nairobi all share index.
NSE 25 Share Index - Weighted Price Index calculated as a mean of the shares of 25 public, listed companies, selected based on a weighted market performance.
NSE 20 Share Index - Weighted Price Index calculated as a mean of the shares of 20 public, listed companies, selected based on a weighted market performance.
Source: Nairobi Securities Exchange

25 | Monthly Economic Bulletin July 2019
“To be a World Class Modern Central Bank”
Table 8.2: Selected Bond Market IndicatorsPeriod (Month)
Secondary Market Primary Market
FTSE NSE Kenya Govt. Bond Index
Bond Volume (KSh Million)
Number of Deals
7-Year Eurobond Yield (%)
10-Year Eurobond Yield (%)
10-Year Euro-bond (2028) Yield (%)
12-Year Euro-bond Yield (%)
30-Year Euro-bond Yield (%)
Most Traded
End Month Govt Bonds Turnover Ratio (Percent)
Bond Offer (KSh Million)
Subscrip-tion Rate (Percent)
2017
October 91.37 27,752.99 589 3.89 6.10 ... ... IFB1/2016/009 1.98 FXD 2/2017/5 & FXD2/2017/5 (Tap)
46,500.00 66.92
November 91.41 31,045.74 424 3.87 5.85 ... ... IFB1/2016/015 2.14 IFB1/2017/7 30,000.00 153.04
December 92.80 19,249.94 499 3.76 5.67 ... ... IFB1/2017/007 1.32 FXD 1/2008/15 & FXD 1/2017/10 (Reopen)
30,000.00 72.97
2018
January 93.24 38,755.56 568 3.83 5.83 ... ... IFB1/2017/007 2.68 IFB1/2018/15 40,000.00 139.39
February 93.37 64814.57 1276 3.82 6.27 7.05 8.02 IFB1/2018/15 4.36 FXD1/2010/15 & FXD2/2013/15 (Reopen)
40,000.00 60.35
March 93.58 48768.22 762 3.67 5.99 6.55 7.61 IFB1/2018/015 3.20 FXD1/2018/5 & FXD1/2018/20
40,000.00 128.46
April 93.85 42464.81 646 4.46 6.13 6.85 7.99 IFB1/2018/015 2.74 FXD 1/2008/15 & FXD 1/2018/20
40,000.00 81.92
May 94.23 57312.58 877 5.14 6.62 7.19 8.31 IFB1/2017/007 1.20 FXD1/2018/15 40,000.00 50.54
June 95.00 58746.02 881 5.74 7.18 7.89 8.90 IFB1/2017/007 3.90 FXD1/2018/25 40,000.00 25.33
July 94.58 48550.46 653 4.29 6.50 7.12 8.16 IFB1/2017/007 3.37 FXD2/2018/20 40,000.00 34.65
August 94.48 44797.66 691 5.22 7.27 7.93 8.90 FXD2/2018/020 3.07 FXD1/2018/010 40,000.00 74.56
September 94.85 40228.50 536 4.63 6.86 7.65 8.59 FXD2/2018/020 1.71 FXD1/2018/010 40,000.00 81.17
October 95.42 53748.47 817 5.07 7.48 8.13 9.12 FXD1/2018/010 2.27 FXD2/2018/15 40,000.00 67.61
November 95.38 42,001.63 987 6.10 8.29 9.01 9.70 FXD1/2018/010 2.73 IFB1/2018/20 50,000.00 80.79
December 95.40 22,421.23 422 5.87 8.35 9.00 9.75 IFB1/2018/020 1.45
IFB1/2018/20 (Tap Sale) 22,410.00
72.15 FXD2/2018/10 40,000.00
FXD2/2018/10 (Tap sale) 13,840.00
2019
January 95.58 50,984.96 699 4.90 6.99 7.66 8.70 IFB1/2018/020 3.21 FXD 1/2019/2 & FXD 1/2019/15
40,000.00 254.93
February 96.00 48,264.42 770 4.96 6.26 7.02 8.14 IFB1/2018/020 2.89 FXD 1/2019/2 (Reopen) & FXD 1/2019/15
12,000.00 555.03
FXD 1/2019/15 & FXD 1/2019/10
50,000.00 156.52
March 96.48 62,377.93 947 5.26 6.28 7.11 8.15 FXD1/2019/010 3.71 IFB1/2019/25 50,000.00 58.75
April 97.05 70,461.44 890 5.75 6.41 7.40 8.36 IFB1/2019/025 4.18 FXD2/2019/10 & FXD1/2019/20
50,000.00 171.23
May 97.13 57,350 1,115 7.27 6.43 7.75 8.28 8.84 FXD2/2019/010 3.29 FXD2/2019/5 & FXD2/2019/15
50,000 141.68
June 97.31 73,719 943 5.48 6.78 7.42 7.89 8.55 IFB1/2018/020 4.23 FXD1/2012/15 & FXD1/2018/15
40,000 214.04
July 98.27 91,666 927 6.10 5.07 6.46 7.10 7.88 FXD1/2012/015 4.99 FXD3/2019/15 40,000 216.69
FXD - Fixed Rate/Coupon Treasury Bond
Reopened Bond - Issued and outstanding bond re-offered to the primary market at the current market yields
Bonds Turnover (Percent) - Volume of bonds traded as a ratio of the total outstanding volume of tradeable bonds
Tap Sale - Issued at their original face value, maturity and coupon rate, and sold at the weighted average yield in the last auction of the same bond
Source: Nairobi Securities Exchange and Central Bank of Kenya
CAPITAL MARKETS INDICATORS

26 | Monthly Economic Bulletin July 2019
“To be a World Class Modern Central Bank”
Table 8.3: Foreign Investors Participation (KSh Millions)A B C D=A/C E=B/C F=(D+E)/2
Period (Month)
Foreign Purchases (FP)
Foreign Sales (FS) Equity Market Turnover (ET)
FP to ET in Percent
FS to ET in Percent
Average Foreign Participation to
Equity Turnover in Percent
2016
August 14,183 10,480 17,655 80.33 59.36 69.85
September 14,669 13,326 16,872 86.94 78.98 82.96
October 5,200 5,325 7,846 66.28 67.87 67.07
November 6,878 6,419 10,439 65.89 61.49 63.69
December 5,574 4,959 7,107 78.43 69.78 74.10
2017
January 10,424 8,816 12,054 86.48 73.14 79.81
February 9,447 9,012 12,579 75.10 71.64 73.37
March 9,551 9,601 12,461 76.65 77.05 76.85
April 8,478 8,045 11,409 74.31 70.51 72.41
May 9,420 11,308 16,348 57.62 69.17 63.40
June 9,526 10,339 17,144 55.56 60.31 57.94
July 9,442 11,496 21,304 44.32 53.96 49.14
August 7,508 10,776 16,024 46.85 67.25 57.05
September 6,149 11,947 16,248 37.84 73.53 55.69
October 7,042 6,556 9,390 74.99 69.82 72.41
November 8,142 8,592 14,760 55.16 58.21 56.69
December 7,575 7,793 11,867 63.83 65.67 64.75
2018
January 13,813 15,277 20,340 67.91 75.11 71.51
February 6,324 11,462 17,920 35.29 63.96 49.63
March 10,927 12,410 22,890 47.74 54.22 50.98
April 8,673 10,488 15,076 57.53 69.57 63.55
May 7,700 11,722 18,377 41.90 63.79 52.84
June 8,244 10,583 13,688 60.23 77.32 68.77
July 5,535 7,646 9,736 56.85 78.53 67.69
August 5,571 7,136 10,243 54.39 69.67 62.03
September 6,229 9,258 11,950 52.13 77.47 64.80
October 10,547 14,834 16,890 62.45 87.83 75.14
November 7,900 8,499 10,713 73.74 79.33 76.54
December 4,876 6,661 7,830 62.27 85.07 73.67
2019
January 12,532 13,889 16,200 77.36 85.73 81.55
February 10,366 10,150 14,173 73.14 71.62 72.38
March 12,141 10,399 15,917 76.28 65.33 70.81
April 7,524 7,431 9,865 76.27 75.33 75.80
May 9,008 6,843 12,494 72.10 54.77 63.43
June 7,364 8,265 10,538 69.88 78.42 74.15
July 6,625 8,698 11,453 57.84 75.94 66.89
Source: Nairobi Securities Exchange
CAPITAL MARKETS INDICATORS

27 | Monthly Economic Bulletin July 2019
“To be a World Class Modern Central Bank”
Haile Selassie Avenue P. O. Box 60000 - 00200 Nairobi Tel: 20 - 2860000/2861000/ 2863000
www.centralbank.go.ke | www.facebook.com/CentralBankKenya | @CbkKenya