MOLECULAR GENETIC STUDIES OF SENESCENCE …...4.4 Confocal microscopy of anthurium protoplasts...
167
MOLECULAR GENETIC STUDIES OF SENESCENCE IN ANTHURIUM A DISSERTATION SUBMITTED TO THE GRADUATE DIVISION OF THE UNIVERSITY OF HAWAI‘I AT MĀNOA IN PARTIAL FULFILLMENT OF THE REQUIREMENTS FOR THE DEGREE OF DOCTOR OF PHILOSOPHY IN MOLECULAR BIOSCIENCES AND BIOENGINEERING AUGUST 2012 By Pierriden Azucena Perez Dissertation Committee: David Christopher, Chairperson Anne Alvarez Richard Criley John Hu Gernot Presting Keywords: Anthurium senescence, Agrobacterium-mediated transformation
Transcript of MOLECULAR GENETIC STUDIES OF SENESCENCE …...4.4 Confocal microscopy of anthurium protoplasts...

MOLECULAR GENETIC STUDIES OF SENESCENCE IN ANTHURIUM
A DISSERTATION SUBMITTED TO THE GRADUATE DIVISION OF THE
UNIVERSITY OF HAWAI‘I AT MĀNOA IN PARTIAL FULFILLMENT OF THE REQUIREMENTS FOR THE DEGREE OF
DOCTOR OF PHILOSOPHY
IN
MOLECULAR BIOSCIENCES AND BIOENGINEERING
AUGUST 2012
By
Pierriden Azucena Perez
Dissertation Committee:
David Christopher, Chairperson
Anne Alvarez Richard Criley
John Hu
Gernot Presting
Keywords: Anthurium senescence, Agrobacterium-mediated transformation
ii
ABSTRACT
Senescence is a complex physiological process and has become an
attractive area of research in plant molecular biology. The autoregulated
production of cytokinin in plants transformed with the PrSAG12-IPT gene
construct significantly delayed leaf senescence, and created plants that lived
longer, produced more flowers with improved vase life, and an overall
increased productivity. The promoter region of an arabidopsis cysteine
protease served as the senescence-activated switch for the cytokinin gene
IPT, and the discovery of a homolog in anthurium (ANTH17) made possible
the cloning and isolation of its promoter. The sequence contained motifs and
cis-elements characteristic of senescence response, and transformation of
arabidopsis with PrANTH17-IPT showed similar traits with those transformed
with PrSAG12-IPT. Agrobacterium-mediated transformation of anthurium with
the senescence-activated gene constructs proved challenging, and stable
transformation of plants was confirmed by screening for the reporter gene
GFP using molecular methods. An effort to establish a protoplast transient
expression system in anthurium was initiated in order to study protein
subcellular signaling and localization, and is still in the process of
optimization. Transcriptomic analysis of senescing leaf and spathe identified
proteins involved in tissue-specific development, and provided an enormous
collection of over 17,000 gene sequences that are differentially expressed.
An examination of the major anthurium seed development proteins provided
initial results in understanding the connection between senescence and
embryo development, two very similar molecular processes in plants.

iii
TABLE OF CONTENTS
ABSTRACT ...................................................................................... ii
LIST OF TABLES ........................................................................... vii
LIST OF FIGURES ......................................................................... viii
CHAPTER I. INTRODUCTION AND LITERATURE REVIEW...................................................................................... 1
Biochemical changes during senescence ................................... 2
Changes in gene expression associated with senescence ........................................................................... 5
Role of hormones and plant growth regulators .......................... 6
Cytokinin & isopentenyl transferase ......................................... 8
Transgenic expression of cytokinin in plants ............................. 9 A system to regulate cytokinin production in
transgenic plants ................................................................. 10
Anthurium andreanum ......................................................... 12 Anthurium breeding and genetic transformation ...................... 13
Green Fluorescent Protein as a useful reporter
gene .................................................................................. 14 Seed development and senescence ........................................ 15
CHAPTER II. HYPOTHESES, SIGNIFICANCE OF
RESEARCH AND OBJECTIVES ............................................ 17 Hypotheses ........................................................................ 17
Significance of Research ....................................................... 18
Objectives .......................................................................... 21

iv
CHAPTER III. PLANT TRANSFORMATION USING SENESCENCE REGULATED IPT CONSTRUCTS ..................... 23
Introduction ..................................................................... 23
Materials and Methods ..................................................... 24
Isolation of the promoter region of anth17 .................... 24
Generation of IPT constructs ........................................ 26 Anthurium plants, culture and transformation ................ 29
Arabidopsis transformation .......................................... 31
Screening of transformants by Western blot .................. 32
Results ............................................................................. 33
Isolation of the anth17 promoter region ........................ 33
Anthurium transformation ........................................... 39 Arabidopsis transformation .......................................... 43
Discussion ........................................................................ 50
Isolation of the promoter region ................................... 50
Anthurium transformation ........................................... 55
Arabidopsis transformation .......................................... 59 Conclusion ........................................................................ 60
Future studies .................................................................. 61
CHAPTER IV. EXPRESSION OF GFP IN ANTHURIUM PROTOPLASTS .................................................................. 62
Introduction ..................................................................... 62
Materials and Methods ..................................................... 63
Isolation of protoplasts ............................................... 63

v
Protoplast transfection and GFP expression ................... 64
Results ............................................................................. 65
Isolation of protoplasts and transfection ........................ 66
Discussion ........................................................................ 68
Conclusion ........................................................................ 69 Future research ................................................................ 70
CHAPTER V. CHARACTERIZATION OF SENESCENCE RELATED GENE TRANSCRIPTS IN ANTHURIUM SPATHE AND LEAVES ........................................................ 71
Introduction ..................................................................... 71
Materials and Methods ..................................................... 73
Spathe and leaf RNA extraction,
transcriptome sequencing and annotation ..................... 73
Sequence selection, primer design and
transcript expression levels ......................................... 75 Results ............................................................................. 76
RNA isolation from leaf and spathe ............................... 76
Transcriptome sequencing and annotation ..................... 77
Sequence selection, primer design and transcript expression levels ......................................... 78
Discussion ........................................................................ 88
Transcriptome sequencing, annotation and sequence selection ..................................................... 88
Transcript expression levels ......................................... 91
Conclusion ........................................................................ 93
Future studies .................................................................. 93

vi
CHAPTER VI. ANTHURIUM SEED DEVELOPMENT .......................... 95
Introduction ..................................................................... 95
Materials and Methods ..................................................... 96 Pollination of flowers, seed development and
harvesting ................................................................. 96
Protein extraction, analysis and mass mapping ................................................................... 97
Results ............................................................................. 99
Pollination, seed development & harvesting ................... 99 Total protein from seeds ........................................... 100
Protein types based on solubility ................................ 101
Peptide sequencing results ........................................ 103
Discussion ...................................................................... 104
Pollination of flowers, seed development and harvesting ............................................................... 104
SDS-PAGE analysis of seed proteins ........................... 105
Protein extraction, analysis and mass mapping ................................................................. 107
Conclusion ...................................................................... 108
Future studies ................................................................ 109
Appendix A – PlantCARE Database search results ............................. 110 Appendix B – RT-PCR primers designed for the selected
sequences ........................................................................ 119
CHAPTER VII. LITERATURE CITED ............................................. 120

vii
LIST OF TABLES
TABLE PAGE
3.1 Media composition used for in vitro culture of
anthurium .......................................................................... 29
3.2 A search of the PlantCARE database using the PrANTH17 and PrSAG12 sequences revealed the presence of regions involved in transcription
regulation common in both ................................................... 38
5.1 Illumina RNA sequencing showed differential expression of 15 selected sequences in samples AL and AS. ......................................................................... 80
5.2a Differential expression of selected genes as
determined by qRT-PCR analysis of synthesized cDNA from leaf and spathe samples ....................................... 83
5.2b Comparison of fold changes in selected genes using Illumina, RT-PCR and qPCR results ................................ 84
A1 A database search of the PrANTH17 sequence
using PlantCARE revealed the presence of
regions involved in transcription regulation. (Complete list). ................................................................. 110
B1 Forward & reverse primers used in RT-PCR & qPCR
to amplify a fragment of the selected sequences ................... 119

viii
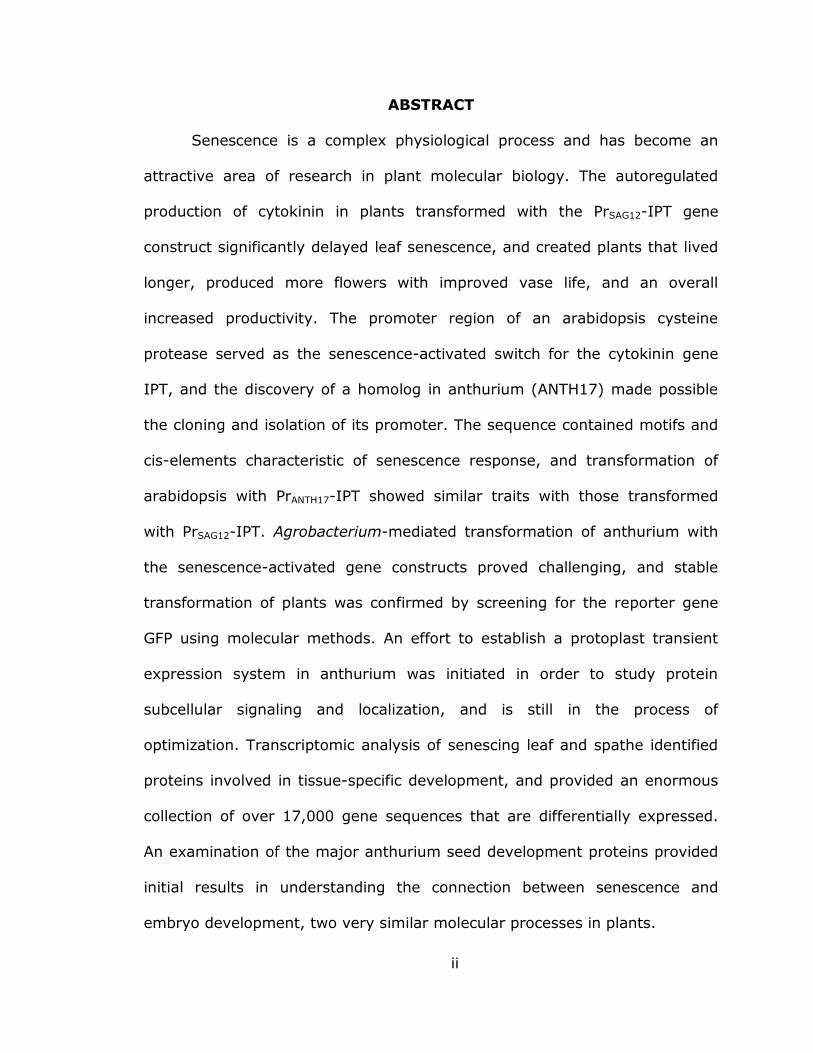
LIST OF FIGURES
FIGURE PAGE
3.1 The PrSAG12-IPT construct was excised from
pSG516 using the SpeI site and ligated into the
XbaI site in the lacZ/mcs of pCAMBIA 1303. ........................... 27
3.2 PrANTH17 was used to replace the CaMV35S promoter in pCAMBIA1302 and the SAG12 promoter in pSG516 to generate two different constructs. ......................................... 27
3.3 Gene constructs made using senescence-regulated
promoters (PrSAG12 or PrANTH17) controlling either the IPT gene or the GFP reporter gene ........................................ 28
3.4 Hygromycin sensitivity response of anthurium etiolated shoot explants after 100 days of culture .................... 30
3.5 Construction of an anthurium genomic library ......................... 33
3.6 Screening the anthurium genomic library for ANTH17 recombinant clones ................................................. 34
3.7 Restriction map of the ANTH17 recombinant clone ................... 34
3.8 The 1885 bp nucleic acid sequence of the promoter region isolated from ANTH17, a cysteine protease
from anthurium ................................................................... 35 3.9 Comparison of promoter sequences from two
cysteine proteases (ANTH17 & SAG12) .................................. 36
3.10 The 1.88 kb Anthurium andreanum cysteine protease (ANTH17) promoter region (PrANTH17) showing cis-acting elements in common with the
SAG12 cysteine protease ...................................................... 37
3.11 Screening of anthurium putative lines by PCR showed amplification of the hygromycin
resistance gene, gfp reporter gene and PrSAG12-IPT gene construct .............................................................. 39
3.12 Untransformed and putatively transformed anthurium shoots and roots viewed in white
light and under Dark Reader Lamp illumination showing expression of GFP in tissues ..................................... 40
ix
3.13 Putatively transformed anthurium shoots viewed
under white light and dark reader lamp illumination showing partial fluorescence in
some shoots ....................................................................... 40 3.14 Fluorescence measurements on crude protein
extracts from callus tissue .................................................... 41
3.15 Growth of excised leaf sections from putatively transformed and untransformed plantlets on media containing hygromycin B............................................. 42
3.16 Arabidopsis Col-1 untransformed WT and Col-1
transformed with the empty vector pCAMBIA1302 served as negative controls. Plants transformed with PrSAG12-IPT exhibited two phenotypes ............................... 44
3.17 Morphological differences between arabidopsis Col-
1 WT, Col-1 transformed with empty vector pCAMBIA 1302 and Col-1 transformed with PrSAG12-
IPT .................................................................................... 45 3.18 Arabidopsis Col-1 transformed with PrANTH17-IPT
exhibited a variety of phenotypes .......................................... 47
3.19 Screening by PCR of transformed arabidopsis lines showed amplification of the gfp reporter gene, PrSAG12-IPT gene construct and hygromycin
resistance gene ................................................................... 48
3.20a Western blot to detect expression of GFP in arabidopsis and anthurium ................................................... 49
3.20b Western blot to detect expression of GFP in anthurium .......................................................................... 50
4.1 GFP constructs used in protoplast transfection ........................ 65
4.2 Protoplasts isolated from arabidopsis and anthurium leaf mesophyll ..................................................... 66
4.3 Protoplasts isolated from anthurium etiolated
shoots transfected with GFP constructs .................................. 67
4.4 Confocal microscopy of anthurium protoplasts
transfected with GFP constructs ............................................ 68

x
5.1 RNA samples electrophoresed on a 1.2% agarose
formaldehyde gel showing the 28S and 18S rRNAs extracted from leaf and spathe ............................................. 76
5.2 Results of Illumina sequencing were annotated and
classified into 22 protein classes based on
biological function ............................................................... 77
5.3 Illumina sequencing coverage of 15 selected genes in leaf and spathe samples ................................................... 79
5.4 RT-PCR of selected genes using cDNA synthesized from RNA samples from leaf and spathe ................................. 81
5.5 Relative expression levels of selected genes
between leaf and spathe samples quantified using
RT-PCR .............................................................................. 82
5.6 Differential expression of selected genes between leaf and spathe samples ....................................................... 85
5.7 Diagram showing distribution of genes unique to
leaf and spathe ................................................................... 86
6.1 Anthurium cultivar ‘Rising Sun’ crossed with
anthurium cultivar ‘Nitta Orange’ produced yellowish to brown berries .................................................... 99
6.2 Comparative protein profiles on a 12% SDS-PAGE gel of total protein extracted from anthurium, rice
and maize ........................................................................ 100 6.3a SDS-PAGE of seed proteins from anthurium, rice
and maize extracted based on solubility in dilute saline buffer (globulin) ....................................................... 101
6.3b SDS-PAGE of seed proteins from anthurium, rice
and maize extracted based on solubility in dilute
acid extraction buffer (glutelin) ........................................... 102
6.3c SDS-PAGE of seed proteins from anthurium, rice and maize extracted based on solubility in alcohol extraction buffer (prolamin) ................................................ 103

1
CHAPTER I
INTRODUCTION & LITERATURE REVIEW
Plant senescence
Senescence is a natural process in the development of a plant and is
the final stage of development for a particular plant organ or tissue. It
involves cellular disassembly in tissues and the recycling and mobilization of
the breakdown products before cell death (Nelson 1988, Nooden et al. 1997,
Quirino et al. 2000, Thomas & Stoddart 1980). It is almost always
intertwined with aging, but they are different. Senescence is a process that
leads to the death of a cell, an organ, or a whole plant occurring at the final
stage of development, while aging occurs throughout development – from
leaf primordium initiation throughout senescence and death (Lim et al. 2003).
The post reproductive death in monocarps, tracheary xylem cells and the
withering of petals after pollination, are cases of senescence (Nooden &
Leopold 1988), while the loss of viability or death of seeds and spores under
air dry conditions is a good example of aging (Roberts 1988). Aging therefore,
is more of a systemic process occurring in the plant as a whole, whereas
senescence is limited only to organs, cells or certain parts of the plant.
During senescence there is a marked increase in the amounts of
degradative enzymes such as nucleases, glycolases and proteases (Brady
1988). They break down subcellular molecules into simpler compounds for
translocation to other parts for the purpose of either recycling nutrients or
disposal. In addition, other catabolic enzymes (e.g. lipases, esterases, etc.)

2
and degradative pathways (ubiquitin) are also expressed in higher amounts
during this time for the same purpose of converting molecules into simpler
forms for transport to other plant organs (Zhu et al. 2009, Hajlaouia et al.
2010, Abreu & Munné-Bosch 2008).
The triggering mechanisms in senescence are not yet well understood.
Aside from being a component of normal plant growth and development,
senescence could also be occurring in response to stresses. External factors
such as shading (from light), temperature changes, mineral and nutrient
deficiency, water stress (drought), and pathogen attack are known elicitors
of the senescence program (Nooden et al. 1997, Weaver & Amasino 2001).
Whether man-made or naturally occurring, these stresses can be utilized to
study senescence in plants.
Senescence in plants is also a form of adaptation for survival. Some
examples include senescence of fruits to attract animals for seed dispersion,
senescence in perennials and monocarps before the start of winter,
senescence in rice before the drought season begins, and self-pruning or
natural abscission when there is competition for light are some examples
(Leopold 1980).
Biochemical changes during senescence
The gradual disappearance of chlorophyll and concomitant yellowing is
one of the most overt manifestations of senescence (Leshem 1986). The loss
of chlorophyll leads to decline in photosynthesis, which is a result of
reduction in light harvesting and electron transport activity (Nooden &

3
Leopold 1988, Schellenberg et al. 1993, Jenkins & Woolhouse 1981, Misr &
Mina 1986, Thomas & Stoddart 1980, Thomas & Matile 1988, Woolhouse
1984, 1987). The decrease in the level of chlorophyll is not a triggering
process since senescence has already started way before the breakdown of
chlorophyll, but rather a result of the progression of senescence.
Phytohormones, cytokinin, gibberellins, ethylene and abscisic acid influence
the degradation of chlorophyll (Aharoni & Richmond 1978, Lipton 1987). The
breakdown products of chlorophyll are lipofuscin-like compounds that have
blue fluorescence (Düggelin et al. 1988) and non-fluorescent catabolites that
are transported from the chloroplast to the vacuole (Matile 1992). The
removal of Mg by Mg-dechelatase or by oxidation by peroxidase (Gassmann
& Ramanujam 1986, Matile 1992, Ziegler et al. 1988) and the removal of the
phytol tail chain by senescence-activated chlorophyllase (Amir-Shapira et al.
1987) are the proposed mechanisms for chlorophyll catabolism.
Toxic triplet chlorophyll and singlet oxygen induced by the photo-
oxidation of chlorophyll damages apoproteins and membranes of the
photosynthetic apparatus (Melis 1991, Aro et al. 1993). Chloroplast
proteases in the stroma and thylakoids (Thayer et al. 1987, Thayer et al.
1988, Weiss-Wichert et al. 1995) disassemble the photosynthetic apparatus,
most particularly the photosystems (Makino et al. 1983, Matile 1992, Morita
1980, Peterson & Huffaker 1975, Roberts et al. 1987, Sodmergen 1989,
Thomas & Hilditch 1987, Thomas & Matile 1988, Wardlaw et al. 1984).
Thylakoid proteases remove the photodamaged D1 and D2 core subunits of
the photosystem II reaction center (Aro et al. 1993, Christopher & Mullet

4
1994, Matoo et al. 1989) and are found to be light-modulated (Christopher &
Mullet 1994, Matoo et al. 1989, Melis 1991) while stromal proteases are
homologs of prokaryotic Clp proteases (Shanklin et al. 1995). There is a
reduction in the amounts of photosynthetic proteins (e.g. the antenna and
cytochrome b6/f complex, the ATP synthase, subunits of Rubisco) during
senescence (Crafts-Brandner et al. 1990, Droillard et al. 1992, Lalonde &
Dhindsa 1990, Wittenbach et al. 1980) and a decrease in expression of
chloroplast genomes (Krupinska & Falk 1994, Mayfield et al. 1995, Mullet
1993, Roberts et al. 1987). The photosynthetic apparatus provides an
important source of recyclable nitrogen since up to 80% of the total
chloroplast nitrogen is comprised of the apoproteins of the photosystems and
antenna, and Rubisco (Smart 1994).
The breakdown of the cell membrane occurs in the initial stages of
plant senescence. The catabolic “phosphatidyl-linoleyl(-enyl) cascade”
provides substrate for lipoxygenase, the action of which generates a series of
oxy-free radicals, ethylene, endogenous Ca2+ ionophores, malondealdehyde
and jasmonic acid (Leshem 1992).
The ubiquitin pathway also plays a role in plant senescence. Within the
cell, ubiquitin covalently links to substrate proteins and facilitates bulk
protein degradation for nitrogen recycling, and may also have a role in the
wound response (Belknap & Garbarino 1996). Ubiquitin ligase is also
responsible in preventing premature senescence from occurring (Raab 2009).

5
Changes in gene expression associated with senescence
A class of proteins highly up-regulated during senescence and are
senescence-specific are called senescence-associated genes (SAGs) (Lohman
et al. 1994). Over the years, increasing amounts of SAGs are being
discovered in agriculturally important crops such as barley (Ay et al. 2008)
and rice (Lee et al. 2001). Among the first SAGs isolated and characterized is
SAG12, a protein in arabidopsis that code for a cysteine proteinase. Also
called thiol protease, this protein product is involved in both anabolic and
catabolic processes in plants. Current information shows that cysteine
proteinases participate in the degradation of storage proteins, protein
turnover in response to biotic and abiotic stresses and in programmed cell
death (PCD) following pathogen attack, tracheary element differentiation and
organ senescence (Grudowska & Zagdanska 2004). Genes encoding cysteine
proteinase have been isolated and characterized from a variety of crops such
as pea (Cercos et al. 1999), sweet potato (Chen et al. 2002, Chen et al.
2009), tobacco (Ueda 2000) and arabidopsis (Buchanan-Wollaston et al.
2003).
Among the SAGs upregulated during senescence are genes that
encode proteins such as RNases, proteases, lipases, proteins involved in the
mobilization of nutrients and minerals, transporters, transcription factors,
proteins related to translation and antioxidant enzymes, among others
(Quirino et al. 2000, Espinoza 2007). In dark-induced leaf senescence in rice,
upregulated genes are involved in amino acid metabolism, fatty acid
metabolism, protein degradation, and stress response, suggesting a probable
6
overlap in the plant defense response and leaf senescence programmes (Lee
et al. 2001). This overlap between the plant defense response and the leaf
senescence program has been proposed before (Lim & Nam 2005) and
indeed several virus-induced genes are expressed at elevated levels during
natural senescence (Espinoza 2007).
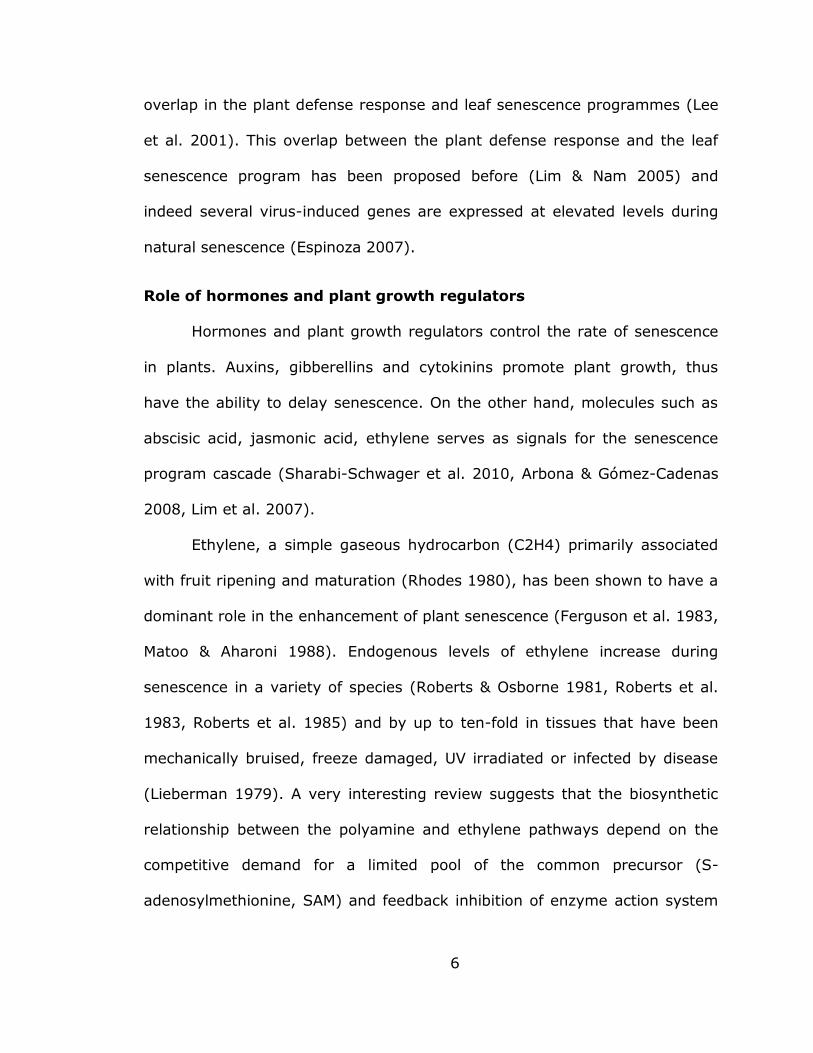
Role of hormones and plant growth regulators
Hormones and plant growth regulators control the rate of senescence
in plants. Auxins, gibberellins and cytokinins promote plant growth, thus
have the ability to delay senescence. On the other hand, molecules such as
abscisic acid, jasmonic acid, ethylene serves as signals for the senescence
program cascade (Sharabi-Schwager et al. 2010, Arbona & Gómez-Cadenas
2008, Lim et al. 2007).
Ethylene, a simple gaseous hydrocarbon (C2H4) primarily associated
with fruit ripening and maturation (Rhodes 1980), has been shown to have a
dominant role in the enhancement of plant senescence (Ferguson et al. 1983,
Matoo & Aharoni 1988). Endogenous levels of ethylene increase during
senescence in a variety of species (Roberts & Osborne 1981, Roberts et al.
1983, Roberts et al. 1985) and by up to ten-fold in tissues that have been
mechanically bruised, freeze damaged, UV irradiated or infected by disease
(Lieberman 1979). A very interesting review suggests that the biosynthetic
relationship between the polyamine and ethylene pathways depend on the
competitive demand for a limited pool of the common precursor (S-
adenosylmethionine, SAM) and feedback inhibition of enzyme action system

7
in one pathway by the products of the other pathway (Pandey et al. 2000). It
was hypothesized by the author that since polyamines and ethylene have
opposite effects in relation to senescence, the two pathways are in a constant
“tug of war”, with the precursor SAM as the mediator or regulator.
Perhaps the second most important elicitor of senescence in plants
after ethylene is the hormone abscisic acid (ABA), a hormone that down
regulates photosynthetic enzymes. A sharp increase in endogenous ABA
concentration during the later stages is typical during flower senescence in
rose petals (Kumar 2008). The senescence-promoting effect of ABA could be
possibly mediated via increase in the proline content in leaves coupled with a
decrease in both IAA and kinetin levels (Ali & Bano 2008). ABA has an
essential role in adaptive stress responses and regulates the expression of
numerous stress-responsive genes (Kang et al. 2002). It has been called the
stress hormone (Mauch-Mani & Mauch 2005, Chandler & Robertson 1994).
Auxin, another phytohormone, generally functions to retard
senescence but in some species it promotes senescence. In poinsettia flowers,
endogenous auxin level decreased with age and the application of auxin
delayed senescence and abscission (Gilbart & Sink 1971). In other flowers
however, auxin promotes senescence and the production of ethylene
(Leshem et al. 1986, Halevy & Mayak 1981, Nichols 1984, Nooden 1988).
Gibberellin A3 (GA3) applied as a spray on mature leaves of the
perennial Paris polyphylla significantly impeded the senescence of aerial parts
of the plant (Yu et al. 2009). Jasmonic acid (JA) and abscisic acid are
regulators that mediate plant responses to abiotic stresses and it was found

8
out that both compounds ameliorate the adverse effects of drought stress in
soybeans (Hassanein et al. 2009). Salicylic acid (SA) has also been shown to
have a role in senescence. Arabidopsis plants mutant for the SA signaling
pathway had altered senescence programs and maximal expression of
several senescence-enhanced genes are dependent on the presence of SA
(Morris et al. 2000). But SA seem to have a role only in developmental
senescence, since the process is delayed in plants defective in the SA
pathway but not in dark-induced senescing plants (Buchanan-Wollaston
2005).
Cytokinin & isopentenyl transferase
Cytokinins are phytohormones that stimulate cell division. A crystalline
compound, later named kinetin (isolated by Carlos Miller from commercial
herring sperm DNA produced after heating in weakly acid solution) was the
very first cytokinin isolated and identified (Skoog 1994). This groundbreaking
research led to the discovery of more compounds that promote cell division –
kinetin analogs, 6-benzylaminopurine and eventually the naturally occurring
cytokinins and cytokinin-metabolites (Skoog 1994, McGaw 1987). Cytokinins
function as regulators of shoot and root meristem activity (Werner et al.
2003) and are key hormones in regulating root gravitropism (Aloni et al.
2004). Isopentenyl transferase, a protein encoded by the IPT gene involved
in crown gall formation in Agrobacterium tumefaciens infection, is the
enzyme in the rate-limiting step in cytokinin biosynthesis (Barry et al. 1984).

9
Cytokinins play a major role in the control of senescence in plants. In
mature or senescing leaves, a major property in common with flowers is that
it strongly delays senescence by inhibiting oxygen uptake thereby repressing
rise in respiration (Tetley & Thimann 1974, Thimann 1987). Exogenous
application of Benzyladenine, a form of cytokinin, increased the vase life of
anthurium to up to 2.5 fold (Paull and Chantrachit 2001). Although cytokinins
have the ability to slow down the onset of senescence, if added at high
dosages could induce PCD and accelerate senescence (Carimi et al. 2004).
Transgenic expression of cytokinin in plants
Over-expression of cytokinin in transformed plants resulted in
morphological and physiological alterations. Tissue- and organ-specific
overproduction of cytokinin in plants exhibited a variety of morphological
aberrations such as inhibition of primary root elongation and lateral root
formation (Medford et al.1989, Li et al. 2006, Kuderova et al. 2008), stunting,
loss of apical dominance, reduction in root initiation and growth, variations in
the delay of senescence in leaves depending on the growth conditions,
adventitious shoot formation from unwounded leaf veins and petioles, altered
nutrient distribution, and abnormal tissue development in stems (Yi et al.
1992, Hewelt et al. 1994, Smigocki 1991). Cytokinin overproducing
transgenic tobacco grown in vitro demonstrated increased accumulation of
phenolic compounds, synthesis of pathogenesis related proteins and increase
in peroxidase activities, all of which are plant responses to stress

10
(Schnablova 2006). In vivo elevated cytokinin levels resulted in enlarged and
retarded growth phenotypes (Guo et al. 2005).
A system to regulate cytokinin production in transgenic plants
An autoregulatory senescence inhibition system in plants was
developed by Gan and Amasino (1995). This technique involved the use of a
senescence-induced promoter (PrSAG12) from Arabidopsis thaliana controlling
the expression of a cytokinin gene (IPT) from Agrobacterium tumefaciens.
The onset of senescence activates PrSAG12 and transcribes IPT transcripts
which are readily translated into isopentenyl transferase; the rate-limiting
enzyme in cytokinin biosynthesis. The production of cytokinins inhibits the
progression of senescence, and increase in the levels of cytokinin attenuates
the senescence signal thus turning the PrSAG12 off. Tobacco plants
transformed with the construct have senescence-retarded leaves and
exhibited prolonged photosynthetically active life span (Gan and Amasino
1995). A number of plant species (Hildebrand et al. 1998, Schroeder et al.
2001, McCabe et al. 2001, Chen et al. 2001, Cao 2001, Lin et al. 2002,
Gapper et al. 2002, Chang et al. 2003, Clark et al. 2004, Huynh et al. 2005,
Calderini et al. 2007, Sýkorová et al. 2008, Xu et al. 2009, Merewitz et al.
2010, Zhang et al. 2010) have been transformed with the SAG12:IPT gene
construct. The most noticeable attribute of these transgenic plants is the
ability to delay the onset of natural senescence and the capacity to retain
chlorophyll in leaves thus maximizing and extending the photosynthetic
capability of the plant. Modified plants also had increased production of

11
flowers as a result of transgene expression (Schroeder et al. 2001) and
overall longevity (Gan & Amasino 1995; McCabe et al. 2001).
A senescence-activated cysteine protease, ANTH17, homologous to
SAG12 in arabidopsis was discovered in anthurium (Hayden & Christopher
2004). Transient expression assays had shown that this gene was activated
in senescing leaf tissues, and that expression was repressed by both
cytokinin and sucrose treatments. Isolation and use of the promoter region of
ANTH17 would be a useful endogenous senescence-responsive promoter for
genetic studies.
Although the delay in leaf senescence has been remarkable in plants
that possess the autoregulated senescence inhibition system, unexpected
phenotypes like delayed bolting/flowering and premature leaf senescence in
PrSAG12-IPT homozygous plants (McCabe et al. 2001), reduced plant stature
(Gapper et al. 2002) and affected reproductive strategy (Sýkorová et al.
2008) have also been observed in some transgenic lines. These
inconsistencies could be attributed to transgene expression variability or
positional effect (Peach & Velten 1991), or could also be due to inexact
senescence control programs, since PrSAG12 was from arabidopsis and is not a
native promoter. The latter may enhance the correct regulation of the IPT
gene. It would be interesting to examine the similarities or differences
between gene expressions by promoters of homologous genes from different
plant species.

12
Molecular breeding of crops with altered cytokinin metabolism
combined with the transgenic approach shows very promising potential for
application to agriculture (Ma 2008).
Anthurium andreanum
Anthurium is a widely cultivated tropical ornamental monocot plant
belonging to the family Araceae, composed of about 1500 species from 100
genera (Higaki et al. 1995). Anthurium is the largest genus composed of
about 900 varieties. Among the members of this family are some of the more
common ornamental tropical plants Philodendron, Monstera, Taro (Colocasia),
Calla lily (Zantedeschia) and Caladium. It is a perennial herbaceous plant
cultivated for its attractive flowers which is composed of the colorful modified
leaf (spathe) and hundreds of small flowers on the pencil-like protrusion
(spadix) rising from the base of the spathe (Higaki et al. 1985). The plant is
a native of Central and South America. The very first anthurium plant was
brought to Hawaii from London in 1889 by S.M. Damon (Neal 1965). The
plants were initially grown on the Damon Estate on the island of Oahu and by
the 1930s had spread to other estates, nurseries and hobbyists (Kamemoto
& Kuehnle 1996).
Anthurium thrives best under 60% to 80% shade, 18 to 24 °C and
relative humidity of 60% to 80% (Higaki et al. 1984). The climate in Hawaii
provide the ambient conditions for growing the plants with day temperatures
of about 80 °F and night temperatures of 65 °F. Growth and development of
an anthurium plant occurs in two phases. The first phase is termed the

13
monopodial phase that corresponds to the juvenile and vegetative growth
stage, and a sympodial phase wherein a flower is produced for each leaf
(Dufour & Guerin 2003). It was discovered that the young, developing
subtending leaf acts as a storage sink and slows down the growth rate of the
immature flower depriving it of nutrients, and removal of this leaf accelerates
flower emergence (Dai & Paull 1990). In the Hawaii floriculture industry (cut
flower), the crop is ranked third in terms of value of sales accounting to
almost 3.4 million US dollars, and third in out-of-state sales bringing in over
4.5 million US dollars in 2010 (NASS-Hawaii 2011).
Anthurium breeding and genetic transformation
Molecular biotechnology has been proven as a very effective tool for
the improvement of crops. In anthurium breeding, new cultivars and hybrids
are difficult to produce. The plant has a long life cycle and development of a
new hybrid takes from 8 to 10 years (Kuehnle et al. 2001). Moreover,
propagation from seed is a lengthy process, and may take up to 3 years from
seed to flowering (Higaki et al. 1995). Biotechnological methods, therefore
offer an opportunity to speed up the rate of anthurium improvement.
Four papers have reported successful stable genetic transformation of
anthurium. A DNA segment coding for the attacin gene that expresses an
antibiotic was engineered into the plant for bacterial blight (Xanthomonas
campestris pv. dieffenbachiae) resistance (Chen & Kuehnle 1996). A modified
oryza cysteine proteinase inhibitor was used to transform plants for
resistance to nematodes (Khaithong 2007, Khaithong et al. 2007) and GFP

14
was successfully used as a reporter gene in optimizing Agrobacterium-
mediated transformation of anthurium callus explants (Zhao et al. 2010). An
improved transformation method introduced genes for bacterial blight
resistance and nematode resistance in different explant tissues using
Agrobacterium (Fitch et al. 2011).
Expression of β-glucuronidase (GUS) in transgenic anthurium was not
observed, although the uidA gene that codes for GUS was detected by PCR
(Chen & Kuehnle 1996). It was also shown that GUS was expressed in
arabidopsis control tissue but not in anthurium leaf tissues bombarded with
the uidA gene construct (Hayden & Christopher 2004). Therefore, a useful
reporter gene for anthurium is needed for molecular studies, such as
promoter identification. Transient expression of GFP was obtained in
anthurium bombarded with a GFP4 construct (Hayden & Christopher 2004).
This suggests that GFP can be a good reporter gene in anthurium molecular
studies.
Green Fluorescent Protein as a useful reporter gene
The green fluorescent protein from the jellyfish Aequoria victoria has
been widely used as a reporter gene in plant transformation experiments
(Stewart 2001, Shiva Prakash et al. 2008, Wakasa et al. 2007, Zhu et al.
2004, Zottini et al. 2008). Sugarcane, maize, lettuce and tobacco plants
transformed with modified versions of GFP either through Agrobacterium-
mediated or particle bombardment-mediated transformation were readily
distinguished using a dissecting microscope with appropriate filters (Elliott et

15
al. 1999). Several variants of the gene have been developed that have
improved fluorescence output and expression in plants (Mankin & Thompson
2001) and improved constructs have been created (Orbovic et al. 2007, Vain
et al. 2003, Vickers et al. 2007). Over the years, other monocot species such
as barley and rice have also been transformed with constructs containing GFP
as the reporter gene (Wakasa et al. 2007, Murray et al. 2004) and just
recently a report was published that used GFP as a reporter gene in the
optimization of Agrobacterium-mediated expression of anthurium callus
(Zhao et al. 2010). Although the authors were able to show expression of
GFP in callus tissues and stem cells using fluorescence microscopy, no data
was presented for expression in other differentiated tissues (e.g. leaf, shoot,
whole plant). Green autofluorescence has been shown to be exhibited by
phenolics and phenolic metabolites at 488 nm excitation (Hutzler et al. 1998)
and by other secondary metabolites such as anthocyanins and flavonoids
(Grotewold et al. 1998). Green autofluorescence has also been observed in
vascular tissues (Flores et al. 1993) and other organs (Chytilova et al. 1999,
Lu et al. 2008). GFP can serve as a reporter gene in the initial screening of
transformants in anthurium transgenic studies but in the cases mentioned
above, additional molecular screening methods such as Western blotting
and/or RT-PCR are needed in order to confirm stable protein expression.
Seed development and senescence
A multitude of genes play important roles in seed development,
maturation, and maintenance of viability. A gene in arabidopsis (ABI3) was

16
found to be essential for the synthesis of seed storage proteins and for the
protection of the embryo during desiccation (Nambara et al. 1992). Genes
involved in senescence are also expressed during seed formation and
germination (Cercos et al. 1999), and are seen as very similar processes in
terms of macromolecular metabolism. During seed germination in rice,
storage proteins and seed maturation proteins were down-regulated while
alpha-amylase and enzymes involved in glycolysis were up-regulated (Yang
et al. 2007). A vacuolar processing enzyme (a cysteine protease) was found
to play an important role in the maturation of seed proteins from castor bean
(Hara-Nishimura et al. 1995). A protein disulfide isomerase, PDI5, was
discovered to function as a chaperone and regulator of a cysteine protease
during programmed cell death (PCD) of endothelial cells in arabidopsis seeds
(Ondzighi et al. 2008).

17
CHAPTER II
HYPOTHESES
1. The promoter from the anthurium cysteine protease ANTH17 (PrANTH17)
will have similar cis-acting regulatory elements and motifs as the
SAG12 promoter (PrSAG12) from arabidopsis.
2. GFP can be expressed at sufficiently high levels in anthurium so that it
can be used as a reporter gene.
3. Transcriptomic analysis will identify genes needed for spathe and leaf
development, and reveal wide differences in the expression of many
genes.
4. Analysis of transcript levels will help identify promoters for tissue-
specific control of transgenes in anthurium.
5. Proteomic profiling of anthurium seeds will provide insight into seed
biogenesis and storage proteins, identify new proteins, and contribute

18
to evolutionary studies. It will determine if this monocot shares seed
protein species with other monocots.
6. Insight into seed storage proteomics will serve as an initial screen to
investigate seed viability loss in anthurium during long storage.
SIGNIFICANCE OF RESEARCH
Anthurium and arabidopsis share similar senescence induction
systems (Hayden & Christopher 2004) and plants transformed with
promoters from orthologous genes can have similar gene expression
programs.
ANTH17 is a cysteine protease in anthurium homologous to the
arabidopsis cysteine protease SAG12, and was shown to be transiently
expressed during the senescent stages of leaf development (Hayden &
Christopher 2004). It was shown that similar to the arabidopsis SAG12,
ANTH17 is repressed by cytokinin treatment, and its expression is reduced by
sucrose. The expression pattern of ANTH17 was opposite to known
senescence down-regulated genes such as cab (chlorophyll-a,b-binding
protein) and psbA (D1 protein of PSII). Isolation of the promoter region of
ANTH17 (PrANTH17) would allow comparative analysis of sequences of the
promoter from the two orthologs, and expression studies in whole
arabidopsis plants using fusion proteins. The resulting transformed plants

19
expressing a reporter gene (e.g. GFP) under the control of PrANTH17 can be
studied for senescence induction experiments.
Plants transformed with the IPT gene will exhibit typical
physiological responses to expression of the autoregulatory
senescene inhibition system as observed in tobacco.
A number of plant species have been transformed with a construct
carrying the IPT gene, involved in the rate-limiting step in cytokinin
biosynthesis, conferring an autoregulated senescence inhibition system that
significantly delays aging in leaves and flowers (Calderini et al. 2007, Chang
et al. 2003). This also increases photosynthetic capacity of plants, with
leaves staying longer on the stem due to delayed aging. Cytokinin dips have
been routinely used by florists and horticulturists to lengthen the vase life of
anthurium flowers (Mayak & Halevy 1970, Paull & Chantrachit 2001). Stable
expression of the senescence-regulated IPT gene construct in anthurium
plants would eliminate the need for the post harvest treatment as well as
create a more superior crop for the industry, having flowers that possess
tolerance to senescence induced by stress and injury especially during
shipping and handling. This will provide stability of product quality for
customers. And since the spathe is essentially a modified leaf, the delay in
leaf senescence in anthurium can increase flower profitability for farmers in
Hawaii.

20
Expression of GFP in anthurium plants and protoplasts will be a
useful tool to study cellular gene functions, subcellular sorting of
proteins and promoter acitivites in anthurium for crop improvement.
The development of a plant protoplast transient expression system has
been an important step towards understanding of gene functions and cellular
processes at the molecular level (Sheen 2001; Yoo et al. 2007). This
technique is now routinely used in the model plant arabidopsis and in other
systems as well.
Transcriptomic analysis of senescent anthurium leaf and spathe can
generate information on genes involved in development and they can
be used for genetic improvement of anthurium.
Analysis of gene expression data has led to the discovery of regulation
mechanisms by proteins. Abundant and rare transcripts are a sign the gene’s
promoter is either very active or repressed, respectively.
Proteomic profiling of anthurium seed proteins can contribute
towards the understanding of seed development and seed viability
loss in anthurium.
The major proteins in seed are the source of nitrogen for protein
assimilation by the developing embryo during germination. The type of
proteins present has a significant aspect to evolutionary studies. Globulins
and albumins were found to be the main seed proteins in dicots, while in
monocots glutelins and prolamins predominate.

21
OBJECTIVES
The overall objective of this research is to gain more understanding of
the senescence program in anthurium through stable transgenic expression
of a senescence-regulated cytokinin biosynthesis gene in whole plants,
differential gene expression analysis of senescent leaf and spathe, transient
gene expression studies in protoplasts, and proteomic profiling of anthurium
seed development proteins. The autoregulated production of cytokinin in
plants is expected to decrease the rate of leaf senescence thereby improving
the value of anthurium as a cutflower crop for farmers in Hawaii.
The specific objectives for this research:
1. A senescence-activated promoter from an endogenous cysteine
protease will be isolated, cloned, characterized and used to develop
anthurium plants that have an autoregulated senescence-inhibition
system.
2. Anthurium leaf, callus and shoot tissues will be used in the isolation
and transfection of protoplasts using GFP as a reporter gene for the
development of an efficient transient reporter expression system.

22
3. Transcriptome profiling, Illumina deep-sequencing and bioinformatics
will be used to identify and analyze differentially expressed
senescence-related genes in anthurium leaf and spathe tissues.
4. Major seed proteins and senescence-related proteins expressed during
seed development will be identified by extracting and subjecting total
cell proteins from rarely produced anthurium seeds to SDS-PAGE
analysis, proteomic analysis and sequence identification.

23
CHAPTER III
PLANT TRANSFORMATION USING SENESCENCE REGULATED IPT
CONSTRUCTS
Introduction
The development of an autoregulated senescence inhibition system by
Gan and Amasino in 1995 paved the way for creating plants that have the
ability to retard leaf aging and thus possess a “stay-green” phenotype. This
involved genetic transformation of plants with a construct consisting of a
senescence up-regulated gene promoter from sag12 of Arabidopsis thaliana
(PrSAG12) fused to the isopentenyl transferase gene (IPT) for cytokinin
biosynthesis from Agrobacterium tumefaciens. Shortly thereafter, other dicot
species such as Nicotiana alata (Schroeder et al. 2001), lettuce (McCabe et al.
2001), broccoli (Chen et al. 2001; Gapper et al. 2002), petunia (Chang et al.
2003, Clark et al. 2004), tomato (Swartzberg et al. 2006), Medicago sativa
(Calderini et al. 2007) and Arabidopsis thaliana (Huynh et al. 2005) have
been transformed with the PrSAG12-IPT construct, as well as monocots namely
rice (Hildebrand et al. 1998; Cao 2001; Lin et al. 2002) bentgrass (Xu et al.
2009; Merewitz et al. 2010, Zhang et al. 2010) and wheat (Sýkorová et al.
2008).
In studies aimed at establishing plant gene function, arabidopsis has
become the model system of choice mainly due to its ease of genetic
transformation, self fertilization, a short life cycle and a small genome size,
which made possible its complete sequencing (Bressan et al. 2001). A sag12
24
homolog, termed anth17 exists in anthurium and is upregulated during
senescence (Hayden & Christopher 2004). The expression of anth17
increased during senescence of mature leaves. Treatment with cytokinin
repressed anth17 expression, and presence of sucrose moderately inhibited
mRNA accumulation. It has also been shown through transient assays that
the arabidopsis PrSAG12 is activated during senescence in anthurium. Using the
PrANTH17 to show senescence-activation of a reporter gene in arabidopsis
would confirm the presence of a similar or identical senescence signaling
pathway.
In this study, the ANTH17 promoter was isolated from an anthurium
genomic library. Senescence promoters from homologous senescence-
induced cysteine protease genes from the dicot arabidopsis (sag12) and the
monocot anthurium (anth17) were then used in Agrobacterium-mediated
transformation of anthurium etiolated shoot explants. Stable integration of
the gene constructs was confirmed and expression of the reporter gene GFP
was verified. The senescence promoter-IPT constructs (PrSAG12-IPT and
PrANTH17-IPT) were also used to transform arabidopsis to compare the
expression of the IPT gene on resulting transgenic plants.
Materials and Methods
Isolation of the promoter region of anth17
The anth17 promoter (PrANTH17) was isolated from an anthurium
genomic library that was constructed using a Lambda DASH II / EcoRI vector
kit (Stratagene Cloning Systems, La Jolla CA, USA). Anthurium genomic DNA

25
was isolated following a procedure for orchid (Champagne & Kuehnle 2000)
with some modifications. Anthurium tissue ground in liquid nitrogen (1 gram)
was added to 15 mL of a pre-incubated (15 minutes at room temperature)
Extraction buffer (150 mM LiCl, 5 mM EDTA, 5% SDS, 80 mM Tris-HCl pH 9,
supplemented with 0.45 g PVP 40,000 + 450 µL β-mercaptoethanol) in an
oakridge tube. The mixture was mixed by vigorously shaking for 5 minutes
and centrifuged for 15 minutes at room temperature. All centrifugations were
carried out at 10K rpm in a Sorvall SS-34 rotor. The supernatant was
transferred to a new tube and another clearance spin was performed. An
organic solvent extraction was done by adding an equal volume of chloroform
and vigorously shaking the solution for 5 minutes. The chloroform extraction
was performed again after which the supernatant was solvent-extracted
twice with an equal volume of phenol:chloroform. A final chloroform solvent
extraction on the supernatant was done before addition of 0.1 volume of 3 M
sodium acetate (pH 5.2) and an equal volume of isopropanol in a 30 mL
Corex tube. The solution was mixed well by inversion and incubated
overnight at -20 °C. The crude extract was spun at 4 °C for 30 minutes,
washed with cold 70% ethanol, and spun again at 4 °C for 10 minutes before
the ethanol was decanted. The pellet was allowed to air dry for 15 minutes,
resuspended in 500 µL of sterile water and treated with RNase A. The DNA
solution was extracted with phenol:chloroform, precipitated with sodium
acetate and isopropanol as above and resuspended in sterile water. The
quality and quantity of isolated DNA was assessed using a Beckman Coulter
DU730 UV/Vis spectrophotometer and visualized by agarose gel
26
electrophoresis using Gel Red nucleic acid stain (Biotium, Hayward CA, USA)
in 1X Tris acetate EDTA (TAE) buffer. Anthurium genomic DNA pre-digested
with EcoRI was ligated into the Lambda/EcoRI vector arms, packaged and
incubated in Escherichia coli XL-1 blue MRA(P2) host cells according to the kit
instructions. The genomic library was screened by Southern Hybridization
using a 1.3 Kb anth17 cDNA clone from a previous experiment (Hayden &
Christopher 2004) and the resulting anth17-positive Lambda clones were
used for phage DNA extraction using a Lambda Mini Kit (QIAGEN, Valencia
CA, USA). The promoter region upstream of the anth17 gene was amplified
by PCR using a high fidelity PfuUltra polymerase (Agilent Technologies, Sta.
Clara CA, USA) and cloned in pBluescript II SK (Stratagene Cloning Systems,
La Jolla CA, USA). The isolated putative anthurium senescence-regulated
promoter was sequenced and analyzed for transcription/regulatory binding
regions by comparing with sequences in a plant transcription factor database
– PlantCARE: Plant cis-acting regulatory elements (PlantCARE). The same
search was performed using the PrSAG12 sequence, and the results were
compared with the PrANTH17 sequence database search results.
Generation of IPT constructs
The PrSAG12-IPT construct was excised from the plasmid pSG516 (Gan
& Amasino 1995) by SpeI digestion and ligated into the XbaI site of
pCAMBIA1303 (Figure 3.1). The resulting binary vector was maintained in E.
coli XL-1 blue and used in subsequent experiments.

27
The cloned anth17 promoter was used to replace a segment (the
CaMV35S promoter and part of the lacZ/MCS) upstream of mgfp5 in
pCAMBIA1302; and the SAG12 promoter in pSG516 to generate the PrANTH17-
mgfp5 and PrANTH17-IPT constructs, respectively (Figures 3.2A & 3.2B).

28
The PrANTH17-IPT construct was further sub-cloned into the lacZ/mcs of
pCAMBIA1302 for use in Agrobacterium-mediated transformation.
The cloned PrANTH17 was also ligated into the control plasmids pBIN19
35S-mGFP4 and pBIN19 35S-mGFP5er (Jim Haseloff, MRC Laboratory of
Molecular Biology, Cambridge, UK) upstream of the GFP coding sequence by
replacing the 35S promoter in each, creating PrANTH17-GFP4 and –GFP5er,
respectively. A diagram of all the constructs made and their corresponding
vector backbone and derivatives shown in Figure 3.3.

29
Anthurium plants, culture and transformation
Anthurium andreanum cultivar ‘Marian Seefurth’ was acquired from
Pacific Floral Exchange, Keaau, Big Island of Hawaii and grown in pots under
12-hour fluorescent lights in a growth room at ambient temperature. Callus
cultures were initiated from leaf lamina sections grown on H3 medium (Table
3.1) incubated in the dark at room temperature for 4 to 6 weeks. Cultures
were maintained in Cmod medium (Table 3.1) and transferred to fresh media
every four weeks. Etiolated shoots were allowed to develop by transferring
cultures to H1 medium (Table 3.1).
Table 3.1. Media composition used for in vitro culture of anthurium.
components H1 Cmod* H3†
MS macronutrients ½ X ½ X see footnote
MS micronutrients 1 X see footnote see footnote
MS vitamins 1 X 1 X see footnote
sucrose 2% 3% 3%
NaFe-EDTA 36.7 mg/L 43 mg/L 24.7 mg/L
myo-inositol 0.01% - -
benzyladenine 0.2 mg/L 1 mg/L 0.2 mg/L
2,4-D - 0.08 mg/L 0.4 mg/L
thiamine-HCl - 0.3 mg/L 0.2 mg/L
pH 5.7 to 5.8
* Cmod uses modified MS micronutrients (½ H3BO3 & ½ MnSO4)
† H3 uses ½ X Linsmaier & Skoog macronutrients, micronutrients and vitamins
The resulting etiolated shoots were used in Agrobacterium-mediated
transformation as described (Chen & Kuehnle 1996). IPT constructs
containing either PrSAG12 or PrANTH17 were introduced into Agrobacterium strain

30
LBA4404 (Invitrogen, Grand Island NY, USA) using the freeze thaw method
(Holsters et al. 1978) and used in transformation experiments, with
pCAMBIA1303 and pCAMBIA1302 as control plasmids. Etiolated shoot
explants co-cultivated with Agrobacterium carrying the binary plasmid were
incubated at room temperature in the dark and selected on Cmod containing
25 to 50 mg/L hygromycin B (Sigma-Aldrich, St. Louis MO, USA), as
determined from a hygromycin sensitivity curve (Figure 3.4).
Agrobacteria were eliminated from culture by addition of antibiotics
(250 mg/L Cefotaxime, 250 mg/L vancomycin). Tissues were transferred to
fresh media every two weeks and hygromycin selection was performed for 8
to 12 months. Putatively transformed calli were screened by PCR using
specific primers that amplify a 752 bp fragment of the hygromycin resistance

31
gene, hph, (Forward primer: 5’-CCTGAACTCACCGCGACGTCT-3’ & Reverse
primer: 5’-CTCCGGATGCCTCCGCTCGAAGT-3’), a 654 bp fragment of the GFP
reporter gene (Forward primer: 5’-GAACTTTTCACTGGAGTTGTCCC-3’ &
Reverse primer: 5’-CAAACTCAAGAAGGACCATGTGG-3’), and an 808 bp
fragment of PrSAG12-IPT construct (Forward primer: 5’-
AACCCCATCTCAGTACCCTTC-3’ & Reverse primer: 5’-
GGAGCTCAGGGCTGGCGTAACC-3’). Anthurium genomic DNA extraction was
performed as above and the resulting DNA extract was used as template in
PCR. Untransformed anthurium tissue was used as the negative control while
the transformation vector (PrSAG12-IPT in pCAMBIA 1303) was used as a
positive control, as well as anthurium calli spiked with 0.1, 0.5 and 1 µg of
transformation vector (per gram of tissue) before undergoing total genomic
DNA extraction. A Dark Reader Hand Lamp (Clare Chemical Research,
Dolores CO, USA) was used to visualize expression of GFP in etiolated shoots.
Plantlets were regenerated by growing on H1 medium and exposure to 14h
photoperiod in a growth chamber at room temperature. A hygromycin leaf
assay was performed by culturing excised leaf lamina on solid medium
containing 25, 50 and 100 mg/L hygromycin B for 14 weeks.
Arabidopsis transformation
Arabidopsis ecotype Columbia (Col-1) seeds were sterilized in 70%
ethanol for 2 minutes followed by incubation on a platform with gentle
shaking (50 rpm) in 25% commercial bleach solution (Chlorox) + 0.2%
Tween20 for 10 minutes. Disinfected seeds were washed five times in sterile

32
distilled water, resuspended in 0.1% agar solution and plated on germination
medium (0.8% agar, 2% sucrose, 1X MS salts, pH 5.7). Plated seeds were
cold treated (4 °C) for two days and placed at room temperature in a growth
chamber with a 16h photoperiod. Germinated seedlings were transplanted to
soil media, grown to flowering stage and transformed following the floral-dip
method (Clough & Bent 1998) using Agrobacterium strain GV3101
generously provided by Stanton B. Gelvin, Purdue University. Dipped plants
were incubated in a growth room under 16 hour photoperiod to seed
maturity. Transformed seeds were harvested and selected on germination
media containing 50 mg/L hygromycin. Screening was done by PCR using the
same primers to screen for the hygromycin resistance gene and gfp reporter
gene in anthurium, and an additional primer pair that amplifies a 747 bp
fragment of the IPT gene (Forward primer: 5’-ACCCATGGACCTGCATCTA-3’ &
Reverse primer: 5’-GGAGCTCAGGGCTGGCGTAACC-3’). The transformation
vector PrSAG12-IPT in pCAMBIA 1303 was used as the positive control and total
DNA from untransformed Col-1 WT was used as the negative control. A
reaction with no DNA template served as the internal control.
Screening of transformants by Western blot for GFP expression
Successful transformation of plants with the Agrobacterium-based
constructs was confirmed by Western blot to detect the expression of GFP.
Total protein was extracted from tissues (either as callus or whole plants)
using an extraction buffer (50 mM Tris pH 8, 250 mM sucrose, 2 mM DTT, 2
mM EDTA, 1 mM PMSF, protease inhibitor cocktail set III-EMD Biosciences)

33
and ran on a standard sodium dodecyl sulfate-polyacrylamide gel
electrophoresis (SDS-PAGE) following the protocol by Laemmli (1970). The
electrophoresed proteins were transferred onto a Protran® nitrocellulose
membrane (Whatman Inc., Piscataway NJ, USA) and probed with an anti-GFP
rabbit IgG antibody (Molecular Probes-Invitrogen Corp, Carlsbad CA, USA).
Detection was done using an Amersham ECL Western blotting analysis
system (GE Healthcare, Piscataway NJ, USA).
Results
Isolation of the anth17 promoter region

34

35

36

37
Cloning and sequencing isolated a 1.88 Kb DNA fragment upstream of
the anth17 gene from a genomic library (Figure 3.8). Pairwise alignment with
the PrSAG12 sequence showed 46.1% similarity between the two promoter
regions (Figure 3.9).

38
Table 3.2. A search of the PlantCARE database using the PrANTH17 sequence
revealed the presence of regions (cis elements) involved in transcription regulation common in both PrANTH17 and PrSAG12. (Complete list in Appendix B).
motif species position (strand)
sequence function PrSAG12 PrANTH17
5UTR Py-rich stretch
Lycopersicon esculentum
222 (+) 1722 (+) TTTCTTCTCT cis-acting element conferring high transcription levels
AAGAA-motif
Avena sativa 748 (+) 1051 (+) GAAAGAA
ACE Petroselinum crispum
585 (-) 102 (-) 890 (+)
ACTACGTTGG
cis-acting element
involved in light
responsiveness
Box 4 Petroselinum crispum
297 (+) 1735 (+) 1745 (+)
1225 (+) ATTAAT
part of a conserved DNA module involved in light
responsiveness
Box I Pisum sativum
1702 (-)
194 (+) 531 (-) 559 (-)
615 (+)
TTTCAAA light responsive element
CAAT-box Arabidopsis thaliana
616 (-) 1314 (-)
40 (+) 256 (+) 703 (-) 799 (-)
1280 (-)
CCAAT
common cis-acting element in promoter and enhancer regions
circadian Lycopersicon esculentum
33 (-) 675 (-) 1308 (-)
2083 (+)
1060 (+) CAAAGATATC
cis-acting regulatory element involved in
circadian control
ERE Dianthus caryophyllus
1702 (-) 559 (-) 614 (+)
ATTTCAAA ethylene-responsive element
GARE-motif
Brassica oleracea
76 (-) 633 ((+) 1507 (+)
1443 (+) 1718 (-)
AAACAGA gibberellin-responsive element
HD-Zip 3 Arabidopsis
thaliana 2020 (+) 1142 (+)
GTAAT(G/C)ATT
AC protein binding site
O2-site Zea mays 494 (+) 85 (-) 217 (-)
GATGACATGG/A
cis-acting regulatory element involved in zein
metabolism
regulation
Skn-1_motif
Oryza sativa
495 (-) 1276 (-) 1410 (-)
2023 (+) 2158 (+)
1332 (+) GTCAT
cis-acting regulatory element required for
endosperm expression
Unnamed_1
Zea mays 62 (+) 878 (+)
1350 (+) CGTGG

39
A database search (PlantCARE) using the cloned sequence identified
motifs, transcription factors, and binding regions present in other plant
species (complete result listed in Appendix A). Further analysis and a
comparison of the database search results of the PrANTH17 sequence with that
of the PrSAG12 sequence showed similar motifs common in both promoter
sequences (Table 3.2).
Anthurium transformation
Hygromycin resistant anthurium calli growing on selection media were
used for DNA extraction. Using specific primers, PCR on total DNA from
putatively transformed tissues amplified fragments of 752 bp, 654 bp, and
808 bp corresponding to the hygromycin resistance gene, gfp reporter gene
and PrSAG12-IPT construct, respectively (Figure 3.11).

40
Amplification of the targets were also successful in the two types of
positive controls included in the experiment, the plasmid construct used in
transformation experiments and the untransformed tissue spiked with the
plasmid construct before DNA extraction. The negative control (gDNA from
untransformed anthurium) had no amplified fragments.
PCR-positive, hygromycin resistant calli were grown and allowed to
develop shoots in the dark. Illumination using a handheld dark reader lamp
showed varying levels of fluorescence in transformed etiolated shoots and
roots, as compared to untransformed controls (Figure 3.12).

41
It was also observed that fluorescence in some tissues was partial and
not throughout the entire shoot (Figure 3.12F, Figure 3.13) or root (Figure
3.12H).
Fluorescence of crude total protein extracted from hygromycin
resistant callus tissues were compared with arabidopsis expressing GFP-2SC
(Figure 3.14).
One transformant line was found to have fluorescence twice as that in
untransformed anthurium (Figure 3.14 T3), but more than half the FSU of
the GFP-2SC expressing control.

42
Hygromycin resistant, PCR-positive shoots incubated in light and
allowed to regenerate leaves were tested for expression of the hygromycin
resistance gene (hph).
Leaf sections excised and grown in different levels of hygromycin
showed signs of callus growth in the first four weeks of incubation in media
containing 25, 50 and 100 mg/L hygromycin B (Figure 3.15) and continued

43
on up to the termination of the experiment after 14 weeks. Leaf sections
excised from untransformed control plants placed on the right half of each
petri plate showed visible signs of necrosis after 4 weeks in 25 mg/L
hygromycin (Figure 3.15C first photo from left) and after 3 weeks in both 25
and 50 mg/L hygromycin (Figure 3.15B second and third photos from left,
respectively). Callus formation in excised leaves was 10 out of 10 explants
(100%) in both 25 and 100 mg/L hygromycin plates, and 9 out of 10 (90%)
in 50 mg/L hygromycin plate after 14 weeks of culture.
Arabidopsis transformation
Arabidopsis transformed with the binary plasmids produced antibiotic
resistant seedlings when germinated on 50 mg/L hygromycin B selection
medium. Two types of controls were used in this experiment –
untransformed Col-1 WT and Arabidopsis transformed with the empty vector
pCAMBIA 1302 (Figures 3.16A & 3.16B). Aside from the WT-looking normal
phenotype, two off-phenotypes from the hygromycin resistant PrSAG12IPT
transformants were observed. The first off-phenotype was a plant that had a
bunched leaf whorl, slightly deformed, larger than normal leaves, and
increased number of roots (Figures 3.16C & 3. 16D, right half of photo). The
second observed off-phenotype was a plant that was generally smaller in size,
had darker green colored compacted leaves with serrate leaf edges, and with
decreased root formation (Figures 3.16E & 3.16F, right half of photo).

44

45
The IPT plants looked greener and had less yellowing in the bottom
leaves (Figures 3.17G, 3.17H) compared to the control plants.

46
It was also observed that the IPT-transformed plants had increased
lateral florets and lengthened floral spikes (Figure 3.17I), and stayed green
compared to the untransformed WT control that already turned brown 115
days after germination, DAG (Figures 3.17L, 3.17M). Plants transformed with
the empty vector pCAMBIA 1302 were morphologically similar to the
untransformed Col-1 WT control, and had completely browned (not shown)
115 DAG, the same time as the WT plants. Transformants that exhibited
normal WT phenotypes and those that had smaller, serrate leaves developed
seeds while plants with the bunched-leaf-whorl phenotype never developed
flowers when planted on soil. Watering was discontinued and the seeds were
harvested 90 days after plating on germination media.
Transformation of arabidopsis Col-1 with the PrANTH17-IPT construct had
similar results as the PrSAG12-IPT experiment. Aside from normal WT-looking
plants (Figure 3.18A), the off types: bunched-leaf-whorl (Figure 3.18 G, H, &
K) and compact-serrate-leaf (Figure 3.18 B to F, I) phenotypes were also
observed, as well as morphological deformities that fall in between the two
off-phenotypes (Figures 3.18 I, J & L). Yellowing of leaves (Figures 3.18 B &
L) as well as accumulation of pigments (Figures 3.18 C to F) in leaves of
some plants was also noted. Callus growth was noticed in at least three
individual hygromycin resistant plantlets that had the bunched-leaf-whorl
phenotype (not shown).

47
Gene specific primers showed amplification of the GFP reporter,
hygromycin resistance, and IPT gene fragments in plants transformed with
the senescence promoter-IPT constructs (Figure 3.19). GFP-specific primers
amplified a 654 bp fragment in plants transformed with the empty vector
pCAMBIA 1302, PrSAG12-IPT construct, PrANTH17-IPT construct, and the positive
control (transformation vector PrSAG12-IPT in pCAMBIA 1303). Primers specific
for the hygromycin gene (hph) also amplified the 752 bp target in empty
vector pCAMBIA 1302, PrSAG12-IPT construct, PrANTH17-IPT construct, and the

48
positive control transformants. PCR using gene-specific primers amplified the
747 bp IPT gene in plants transformed with the senescence-promoter
constructs PrSAG12-IPT and PrANTH17-IPT, as well as the positive control. For all
three primer pairs, no amplicons were detected in the negative controls
(untransformed Col-1 WT & no template reaction tubes).
Western blot on selected plants using anti-GFP antibody detected
expression of the 26.5 kDa protein in arabidopsis expressing GFP-2SC
positive control (Figure 3.20a). The 28.4 kDa expected protein size was
confirmed in arabidopsis Col-1 transformed with GFP5 (Figure 3.20a, lane
AtGFP5), anthurium transformed with pCAMBIA 1302 vector only control

49
(lane 1302) and anthurium transformed with PrANTH17-IPT cloned in pCAMBIA
1302 (lane A17IPT). A faint band at the 26 – 28 kDa mark was detected in
anthurium transformed with pCAMBIA 1303 (GUS-GFP5 fusion) vector only
control (Figure 3.20a, lane 1303). The protein was not detected in
untransformed arabidopsis Col-1 WT, untransformed anthurium, and
anthurium transformed with PrANTH17-GFP5 and PrSAG12-IPT construct in
pCAMBIA 1303 (Figure 3.20a lanes AtUT, AaUT, A17GFP5 & S2IPT,
respectively).
A high MW protein band of around 200 kD was also detected by
Western blot using anti-GFP antibody in PrSAG12-IPT transformed anthurium

50
callus (Figure 20b, lane T3). The expected 26.5 kD band for the positive
control GFP-2SC was observed (Figure 3.20b, lane At-2SC). No bands were
detected in untransformed anthurium WT control, and other transformed
lines tested (lanes Aa UT, T1, T2, T4 & T5, respectively).
Discussion
Isolation of the promoter region
An anthurium genomic library was created in Lambda DASH II, a
bacteriophage replacement vector used for cloning large DNA fragments and
could accept foreign DNA with sizes ranging from 9 to 23 kb (Stratagene
Cloning Systems, La Jolla CA, USA). The Lambda DASH II vector contains

51
active red and gam genes located in the stuffer fragment making it unable to
grow in host strains containing P2 phage lysogens. Replacement of the
stuffer fragment with the foreign DNA of interest renders the phage red—
/gam— thereby giving it the ability to grow in the E. coli host XL-1 Blue
MRA(P2) used in the library construction. This ensured that only recombinant
phages were recovered during screening of plaques.
A 1.28 kb Not I fragment of a senescence-regulated anthurium
cysteine protease (anth17) isolated from a cDNA library (Hayden &
Christopher 2004) was used as a probe to screen the genomic library.
Hybridization was performed under high stringency, thus increasing the
probability of the single stranded probe to bind to nearly exact matches.
Decreasing the stringency of hybridization conditions resulted to non-specific
hybridization to DNA (Leary et al. 1983). The strength of the hybridization
signal is proportional to the specific activity and inversely proportional to the
probe length (Sambrook & Russell 2001). The use of a 1280 bp cDNA probe
made possible a strong hybridization signal, and increased the probability of
hybridizing to the target.
Restriction enzyme single and double digestions performed on the
isolated recombinant clone carrying anth17 enabled generation of a
profile/fingerprint unique to that particular DNA segment from the genomic
library. Analysis of the digested fragments generated a hypothetical map of
the recombinant clone (Figure 3.7) including the promoter region for anth17.
Cloning by PCR using a high fidelity enzyme ensured that the copied segment
was accurate. Pfu polymerase, unlike Taq polymerase, has a 3'-5'

52
exonuclease activity that is usually associated with proofreading (Lundberg et
al. 1991), and increases the efficiency in cloning DNA fragments (Costa &
Weiner 1994). Subsequent sequencing identified an 1885 bp sequence
(Figure 3.8). The accuracy of the hypothetical map showing the restriction
sites was verified by running the 1.88 kb promoter sequence through
Webcutter (Heiman 1997), an online sequence analysis program that checks
for restriction endonuclease sites in a nucleotide sequence.
Pairwise alignment of PrANTH17 with PrSAG12 showed 46.1% similarity
(Figure 3.9) which was fairly low. This was consistent with the findings of
Noh & Amasino (1999) in SAG12s in arabidopsis (AtSAG12) and Brassica
napus (BnSAG12) wherein there was no sequence conservation except for
two regions. The -747 to -570 region confers senescence-specificity in
AtSAG12 & BnSAG12 promoters (Noh & Amasino 1999). A pairwise
alignment of this 313 nt sequence with PrANTH17 showed a 64% identity in 86
nt overlap with nt 1159 to 1235 (1345 to 1440 nt in Figure 3.9), and a 55%
identity in 294 nt overlap with nt 873 to 1157 (1040 to 1340 nt in Figure 3.9).
The low similarity between PrANTH17 and PrSAG12 could be due to the fact that
Anthurium and Arabidopsis are less evolutionarily related than Arabidopsis
and Brassica. At the amino acid level, AtSAG12 and BnSAG12 share an 84%
identity (Noh & Amasino 1999), while SAG12 homolog in anthurium (ANTH17)
share 58% and 67% identity with AtSAG12 and BnSAG12, respectively
(Hayden & Christopher 2004).
A transcription factor database query (PlantCARE) using the 1.88 kb
promoter sequence revealed 36 different motifs, belonging to 18 different

53
plant species, involved in transcription regulation of the ANTH17 gene
(Appendix A, complete list). Among those, 13 were in common with the
PrSAG12 (Table 3.2). The most abundant motifs present were the CAAT box
and TATA box motifs. The CAAT-box (CCAAT) is a proximal promoter element,
the binding site for CAAT binding protein and CAAT/enhancer binding protein
(Allison 2007), while the TATA box (TAATA) is a core promoter element
usually found around -30 of the transcription start site. Both are almost
always present in promoter regions and have important roles in transcription.
These two motifs along with the cap site are the components of the initiator
element which lines up the transcription apparatus thus deciding the start
point of transcription, and comprise the general promoter the absence of
which does not allow transcription to occur (Kelly & Darlington 1985).
The Skn-1_motif (GTCAT) is a cis-acting regulatory element required
for endosperm expression. This regulator of transcription is present in the
promoter region of Lysophosphatidyl acyltransferase (LPAAT) of coconut
(Cocos nucifera L.) together with several other types of promoter-related
elements including TATA-box and CAAT-box (Xu et al. 2010).
A 5’-UTR Py-rich stretch (TTTCTTCTCT), was found 89 bases upstream
of the ANTH17 coding region. This cis-acting element is involved in conferring
high transcription levels and has also been found to be present in promoter
regions of stress related proteins (Timotijevic et al. 2010; Kumar et al. 2009).
The AAGAA-motif (GAAAGAA) ‘AAGAA motif’ and ‘Opaque-2’ binding
site are regulatory sequences present in the seed specific legumin promoter
(Jaiswal et al. 2007) and are also found in promoters of other genes

54
expressed in seeds (Vincentz et al. 1997; Wu et al. 1998). The O2 site
(GATGACATGG) is a cis-acting regulatory element involved in zein
metabolism regulation. The maize (Zea mays L.) endosperm specific
transcription factor, encoded by the Opaque-2(O2) locus, functions in vivo to
activate transcription from its target promoters. O2 regulates the expression
of a major storage protein class, the 22 kDa zeins, and of a type I ribosome
inactivating protein, b-32, during maturation phase endosperm development
(Schmitz et al. 1997). The O2 site seems to play an important role in seed
development. 5' Promoter deletions of the be2S1 gene showed that the
domain containing the O2 target sites F1 and F2 is required for detectable
reporter gene expression in transgenic tobacco seeds (Vincentz et al. 1997).
The ACE- (ACTACGTTGG), for ACGT-containing element, is a light
responsive promoter element involved in both UV response and pathogen
responsiveness (Logemann & Hahlbrock 2002). Box 4- (ATTAAT) and Box I-
(TTTCAAA) motifs are cis-acting elements also involved in light
responsiveness and have been found to be present in promoter regions of
genes involved in response to biotic and abiotic stresses (Yang et al. 2011,
Shen et al. 2011).
Circadian (CAAAGATATC) is a cis-acting regulatory element involved in
circadian control. This motif is present in the promoter region of a cysteine
protease associated with senescence in tobacco (Ueda et al. 2000) and was
also found in a transcription factor similar to activators of the
phenylpropanoid pathway for lignin production in bamboo (Wang et al. 2012).
55
ERE (ATTTCAAA), an ethylene-responsive element is found to be
involved in the senescence-regulated expression of GST1 (Itzhaki et al. 1994)
and CEBP (Iordachescu et al. 2009) in carnation, and found in bean chitinase
(Broglie et al. 1989) and fruit ripening gene in tomato (Deikman & Fischer
1988, Montgomery et al. 1993).
GARE-motif (AAACAGA), a gibberellin-responsive element is one of the
hormone responsive elements found in a strawberry β-xylosidase gene
probably associated to hemicellulose degradation (Bustamante et al. 2009).
The motif is also implicated in arabidopsis stress response (Nogueira et al.
2011) and in the GA-mediated cold response of pineapple polyphenol oxidase
(Zhou et al. 2003). The motif HD-Zip 3(GTAAT(G/C)ATTAC) has been shown
to interact with auxin (Ilegems et al. 2010) and belongs to a class of
transcription factors that are required for the formation of a functional root
and shoot apical meristem (Hawker & Bowman 2004).
The G-box motif is a G-box binding domain found in Solanum
melongena cysteine protease (SmCP) and enhances transcription of the gene
during senescence (Xu et al. 2003).
Anthurium transformation
Integration of the PrSAG12-IPT in putatively transformed anthurium calli
was confirmed by the PCR amplification of the targets (Figure 3.11 lanes T1
to T6). The hph gene that confers hygromycin resistance (hygR) is the plant
selectable marker in pCAMBIA 1303 binary vector, while mGFP5 is the
reporter gene and are located closer to the left and right T-DNA borders,
56
respectively. The PrSAG12-IPT construct, cloned in between the hph and gfp5
genes, was also detected by PCR. This indicated that the whole T-DNA was
successfully transferred and integrated by Agrobacterium to the genome of
the transformed lines tested. If there was no T-DNA transfer, there would be
no amplification of the target genes, as in the case of the untransformed
control (Figure 3.11 lane N).
The choice of hygromycin resistance as the plant selectable marker
was warranted. The expression of the hph gene product, hygromycin
phosphotransferase, allowed for direct selection for resistance to hygromycin
B of eukaryotic cells not naturally resistant to the antibiotic (Blochlinger &
Diggelmann 1984). The use of kanamycin resistance (nptII), glufosinate
resistance (bar) and glyphosate resistance (epsp) resulted to incomplete
selection and high incidence of chimerism (Di et al. 1996) and escapes
(Hinchee et al. 1988) even of up to 95% in soybeans selected using PPT
(Olhoft & Somers 2001). The efficiency of transformation in soybeans was
increased from an average of 0.7% to 16.4% in a selection protocol based on
hygromycin B (Olhoft et al. 2003). It was discovered that the concentration
of hygromycin B that completely inhibited callus formation in etiolated shoots
was 20 mg/L (Figure 3.4). A minimum of 40 mg/L hygromycin was used in
selection media to eliminate the possibility of escape transformants. Excised
leaf sections from putatively transformed plantlets (Figure 3.15) showed
visible callus formation after 6 weeks of culture on media containing from 25
to 50 mg/L hygromycin B. This confirmed the expression of the enzyme

57
hygromycin phosphotransferase and supported the evidence of stable
integration of the gene construct.
Putatively transformed etiolated shoots exposed to blue light using a
handheld Dark Reader displayed fluorescence under blue light (Figure 3.12)
and confirmed GFP expression. Wild type GFP excites at two wavelengths,
the maximal at 395 nm and at 475 nm blue light, and emits green light at a
wavelength of 508 nm (Haseloff et al. 1999) and versions have been
modified to have a maximum peak at 475 (Haseloff 1999) . The Dark Reader
handheld lamp is a non-UV blue light source generating maximum light
output between 400 and 500 nm, and uses two filters to reveal fluorescence
(Clare Chemical Research, Dolores CO). The non-UV nature and versatility of
the equipment made possible its use in a number of applications involving
fluorophore visualization (Seville 2001) including GFP in transgenic tobacco
(Halweg et al. 2005, Peckham et al. 2006), arabidopsis (Brosnan et al. 2007),
grape (De Beer & Vivier 2008) and soybean (Klink et al. 2009). It was
observed in some etiolated shoots and roots that GFP expression was partial
(Figure 3.12H, Figure 3.13). This indicated the presence of chimerism and
insufficient selection pressure.
Crude protein extracts from anthurium callus tissues exhibited green
fluorescence when illuminated with the Handheld Dark Reader (Figure 3.14,
middle photo). Fluorometer measurements indicated elevated levels of
fluorescence in both transformed tissues compared to the untransformed
control, but of varying degrees. This is probably due to differential expression
of the transgene. The untransformed control had a measureable amount of

58
fluorescence in tissue, due to pigments, secondary metabolites and phenolics
produced by the plant (Hutzler et al. 1998, Grotewold et al. 1998). The
expression of GFP was corroborated by results of Western blotting that
detected the 28.4 kDa expressed in anthurium calli transformed with the
constructs PrANTH17-IPT and the vector only pCAMBIA 1302 control (Figure
3.19). A higher-MW band (96.8 kDa) was expected in anthurium transformed
with the gene construct PrSAG12-IPT and vector only control pCAMBIA 1303,
but the GUS-GFP fusion protein was not detected. A faint band with a size of
28.4 kDa was observed in the latter though, and could be GFP that was post-
translationally processed. Interruption during T-DNA integration could have
resulted to truncation of the T-strand and would explain the absence of the
96.8 kDa band in lane S12 IPT (Figure 3.19). During T-DNA transfer, a linear,
single stranded free T-DNA termed T-strand, corresponding to the bottom
strand so that the 5’ and 3’ ends map from the right to the left border repeat,
is produced (Stachel et al. 1986, Gheysen et al. 1987). The T-DNA is nicked
by the VirD2 endonuclease and attaches to the 5’ end of the T-strand, then is
introduced into a double stranded break in the plant chromosomal DNA by
ligation of the 3’ end (Gelvin 2008). Since the GUS-GFP reporter gene fusion
is closer to the right border (RB), interruption during integration into the
plant chromosome could have resulted to truncation of the T-strand segment,
closer to the RB (5’ end where the VirD is attached), where the GUS-GFP
reporter gene was located.

59
Arabidopsis transformation
The simplicity and ease of the floral dip method in transforming
arabidopsis has become the standard protocol in producing transgenic
arabidopsis lines. As with vacuum infiltration and other in planta
transformation methods, the targets of heritable transformation are the
gametophyte-progenitor tissues, mature gametophytes, or recently fertilized
embryos (Clough & Bent 1998). Hygromycin concentration from 20 to 50
mg/L hygromycin has been shown to be effective in selecting transformed
seedlings (Nakazawa & Matsui 2003, McNellis et al. 1998, Boisson et al.
2001). Seeds that germinated on medium containing 50 mg/L hygromycin
were stably transformed, and carried the hptII gene for hygromycin
resistance. Transformation using PrSAG12-IPT and PrANTH17-IPT gene constructs
produced plants that have similar phenotypes, and fall into three general
categories. Normal-phenotype plants morphologically similar to the controls
(untransformed Col-1 WT & pCAMBIA 1302 vector only control), bunched-
leaf-whorl phenotype (Figures 3.15C & 3.15D; Figures 3.17G, 3.17H &
3.17K), and compact-serrate-leaf phenotype (Figures 3.15E & 3.15F; Figures
3.17B to 3.17F). Additional phenotypes that are combinations of the off-
types were also observed in PrANTH17-IPT plants (Figures 3.17I, 3.17J & 3.17L).
These phenotypic variations could be attributed to position effect (Wilson et
al. 1990, Matzke & Matzke 1998) or transgene expression variability.
Changes in T-DNA methylation were associated with phenotypic variation
(Amasino et al. 1984). “The vast differences observed among transgenics can
be attributed to two broad causes, namely, those due to methods employed

60
to generate transgenics and those resulting from breeding” (Bhat &
Srinivasan 2002). Hypermethylation of the 35S promoter caused the
transgene expression variation in transgenic petunia (Meyer et al. 1992). IPT
constructs used in stable transformation can be further tested for
senescence-responsiveness by measuring IPT levels in the transformed plant
as it undergoes normal development, compared to an untransformed WT.
PCR screening on the transformed lines resistant to hygromycin
confirmed the integration of the senescence-regulated IPT constructs PrSAG12-
IPT and PrANTH17-IPT (Figure 3.18). This was shown by the amplification of
three different regions (GFP reporter gene, hygromycin resistance gene and
IPT gene) that were carried by the T-DNA. PCR using total DNA from a plant
transformed with the empty vector pCAMBIA 1302 amplified only the GFP
reporter gene and the hygromycin resistance gene fragments (Figure 3.18,
labeled 1302). The IPT gene was not amplified since the empty vector control
did not contain the IPT gene construct (PrSAG12-IPT or PrANTH17-IPT).
Conclusion
The 1.88 kb ANTH17 promoter region contained motifs and cis-acting
elements similar to those found in AtSAG12 and other senescence-regulated
and/or stress-responsive genes. Stable transformation of the IPT gene
construct was achieved in anthurium, and GFP was expressed at sufficiently
high levels allowing visual observation of transformed tissues, thus
successfully serving as a reporter gene. Arabidopsis transformed with IPT
using a homologous gene promoter (PrANTH17) exhibited similar phenotypes as
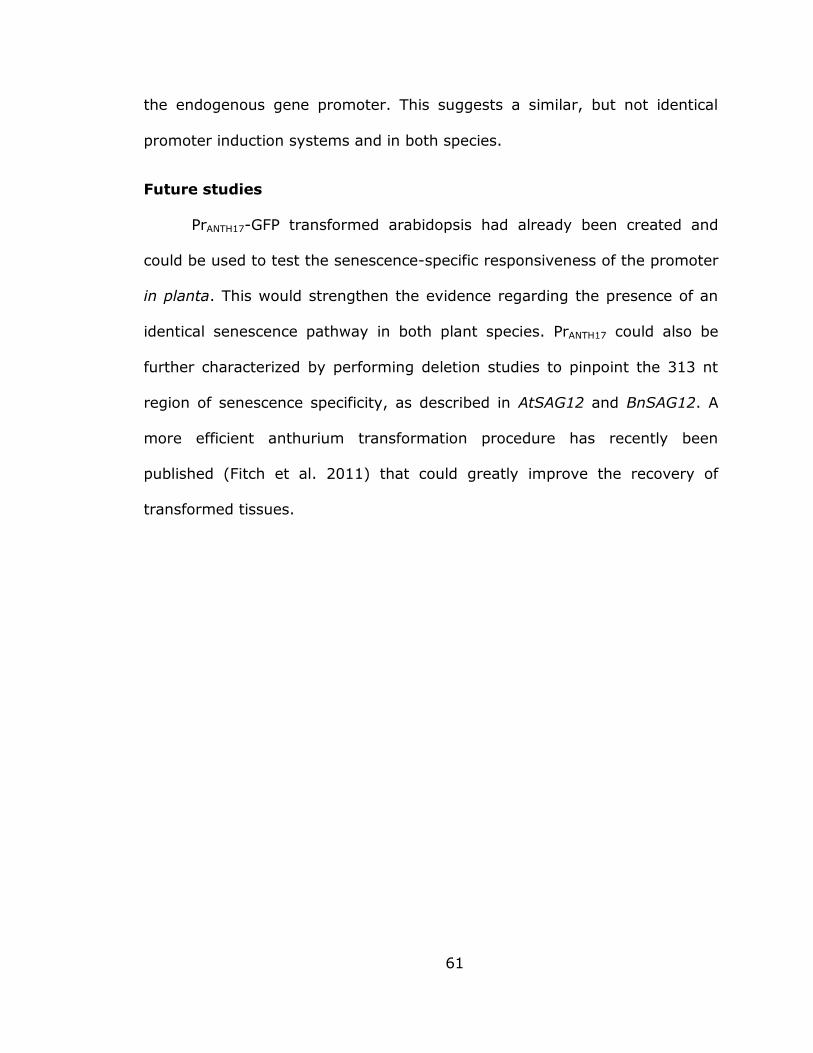
61
the endogenous gene promoter. This suggests a similar, but not identical
promoter induction systems and in both species.
Future studies
PrANTH17-GFP transformed arabidopsis had already been created and
could be used to test the senescence-specific responsiveness of the promoter
in planta. This would strengthen the evidence regarding the presence of an
identical senescence pathway in both plant species. PrANTH17 could also be
further characterized by performing deletion studies to pinpoint the 313 nt
region of senescence specificity, as described in AtSAG12 and BnSAG12. A
more efficient anthurium transformation procedure has recently been
published (Fitch et al. 2011) that could greatly improve the recovery of
transformed tissues.

62
CHAPTER IV
EXPRESSION OF GFP IN ANTHURIUM PROTOPLASTS
Introduction
Protoplasts are cells obtained from plants that were treated with cell
wall degrading enzymes such as cellulase (Cocking 1960, 1972). The ability
to isolate intact and viable protoplasts (Larkin 1976) has led to its use as a
physiological tool in plant studies (Galun 1981) and in stable transformation
using Agrobacterium (Krens et al. 1982). The versatility in using protoplasts
is that they can be isolated from a variety of tissues and can be used to
compare physiological processes in a wide range of plant species.
A transient expression system was developed to study signal
transduction in maize and arabidopsis mesophyll protoplasts (Sheen 2001).
The isolation procedure is simple; plant material can be obtained from
germinated seeds and does not require sterile conditions for protoplast
recovery. It is also relatively short and expression in transfected protoplasts
can be viewed within hours, depending on the type of experiment. Despite
this, several limitations have been presented. Isolation of active protoplasts
seems to be cell-type and age specific. Etiolated true leaves can be obtained
from monocots such as maize and barley, but not from dicots like arabidopsis
and tobacco, and etiolated/greening maize leaves provide the best sources of
protoplasts for photosynthetic gene studies (Sheen 2001). It is therefore
necessary to tailor and optimize the transient expression system based on
the plant being studied and the type of concept being investigated.

63
One of the challenges in working with anthuriums is the limited
amount of information on the plant at the molecular level. The long
generation time for the plant is one of the factors that must be considered in
designing experiments in transgenic anthurium explorations. The use of a
consistent and dependable system in performing molecular studies would be
useful before moving on to stable transgenic approaches. This section
presents initial results of the development of a transient expression assay
using GFP as a reporter gene to study subcellular signaling and protein
localization in anthurium protoplasts.
Materials and Methods
Isolation of protoplasts from anthurium leaf, etiolated shoots and callus
Protoplast isolation from leaf, etiolated shoot and callus cultures of
‘Marian Seefurth’ was carried out using a combination and modification of the
protocols for arabidopsis (Yoo, Cho & Sheen 2007) and the monocots
Spathiphyllum and Anthurium (Duquenne et al. 2007). Half a gram (0.5
gram) of tissue (etiolated shoots or calli) from in vitro cultured anthurium
were cut into 0.5 to 1 mm thin sections using a razor blade and pre-
incubated for 30 minutes in 5 mL 0.5 M mannitol. The solution was replaced
with 4 mL enzyme solution composed of 1.5% cellulase Onozuka R10 (RPI
Corp., Mount Prospect IL, USA), 1% macerozyme R10 (RPI Corp., Mt.
Prospect IL, USA), 0.5% macerase pectinase (Calbiochem™-EMD Biosciences,
San Diego CA, USA), 0.5% driselase® (Sigma Life Sciences, St. Louis MO,

64
USA), 0.5% pectolyase Y23 (PhytoTechnology Lab, Shawnee Mission KS,
USA), 0.5 M mannitol, 20 mM KCl, 20 mM MES pH 6 and vacuum infiltrated
until bubbling. The mixture was incubated in the dark at room temperature
(23 °C) for 30 minutes, followed with gentle agitation (40 rpm) for 5 hours.
An equal amount (4 mL) of W5 solution (154 mM NaCl, 125 mM CaCl2, 5 mM
KCl, 2 mM MES pH 6) was added to the digestion mix, passed through a 75
µm stainless steel mesh filter (RON-VIK, Inc., Minneapolis MN, USA) and
centrifuged at 200 g for 6 minutes (all centrifugations were performed at
18 °C, unless stated). The protoplasts were resuspended in 4 mL flotation
medium (0.6 M sucrose, 3 mM MES pH 6) and 1 mL of rinse medium (0.5 M
sorbitol, 10 mM CaCl2, 3 mM MES pH 6) was layered on top. Protoplasts were
floated onto the rinse medium by density gradient centrifugation (200 g for 6
minutes), transferred gently into a new tube and washed with 10 mL of rinse
medium. The protoplasts were collected by centrifugation, resuspended in 1
mL MMg solution (0.5 M mannitol, 15 mM MgCl2, 4 mM MES pH 6) and kept
on ice for transfection experiments.
Protoplast transfection and GFP expression
Isolated protoplasts were transfected with the pBIN35S-GFP5
construct (Hayden, PhD thesis). Ten microliters of plasmid DNA (2 µg/µL)
were pipetted into a 2-mL microcentrifuge tube followed by the addition of
100 µL of protoplasts (2 X 10⁵ protoplasts/mL) and gently mixed by inversion.
Transfection was initiated by addition of 110 µL PEG solution (30% PEG 4000,
0.25 M mannitol, 100 mM CaCl2) and mixed by gentle tapping of the tube.
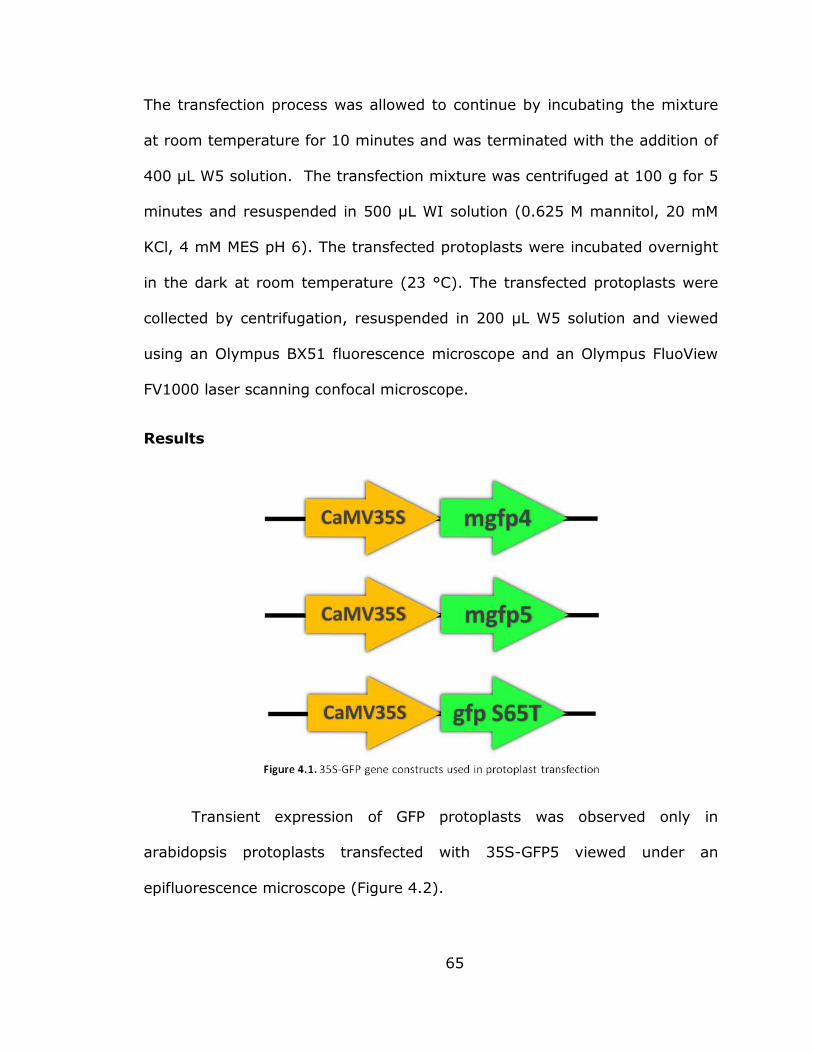
65
The transfection process was allowed to continue by incubating the mixture
at room temperature for 10 minutes and was terminated with the addition of
400 µL W5 solution. The transfection mixture was centrifuged at 100 g for 5
minutes and resuspended in 500 µL WI solution (0.625 M mannitol, 20 mM
KCl, 4 mM MES pH 6). The transfected protoplasts were incubated overnight
in the dark at room temperature (23 °C). The transfected protoplasts were
collected by centrifugation, resuspended in 200 µL W5 solution and viewed
using an Olympus BX51 fluorescence microscope and an Olympus FluoView
FV1000 laser scanning confocal microscope.
Results
Transient expression of GFP protoplasts was observed only in
arabidopsis protoplasts transfected with 35S-GFP5 viewed under an
epifluorescence microscope (Figure 4.2).

66
Isolation of protoplasts and transfection
The standard procedure for arabidopsis protoplast isolation was not
effective for anthurium. Enzymatic digestion of cell wall was not fully
achieved in most cells even after 12 hours of incubation (Figure 4.2 C & D).
Red autofluoresence was observed in both arabidopsis and anthurium leaf
mesophyll protoplasts, but green autofluorescence was emitted only in
anthurium leaf mesophyll protoplasts (Figure 4.2 A to D lower photos).
The quality of protoplasts isolated from leaf mesophyll improved after
addition of other cell wall degrading enzymes (Figure 4.3 A to G). Protoplasts
isolated from etiolated shoots also have more uniformity in size compared to
those isolated from leaf mesophyll.

67

68
Discussion
Protoplast quality and yield was low when standard isolation procedure
for arabidopsis was used on anthurium. Incomplete enzymatic digestion was
observed probably due to anthurium having a more complex cell wall than
arabidopsis. Commercial preparations of cellulase and macerase/pectinase
enzymes did not have enough activity to hydrolyze the amount of complex
carbohydrate present in anthurium leaf mesophyll cell walls. This was

69
confirmed after addition of other cell wall degrading enzymes (macerozyme,
driselase, pectolyase Y23) in the enzyme solution. Although recovery was
improved, there were still cells whose walls were not completely digested. It
has been reported that calcium oxalate crystals are commonly found in
anthurium tissue (Samuels 1923), in other members of the Araceae (Genua
& Hillson 1985) and in monocots where it is a useful taxonomic trait in
systematics (Prychid & Rudall 1999). The formation of these crystals
(raphides) was evident even in a developing embryo, along with yellowish,
tannin-like deposits (Matsumoto et al. 1998).
Red chlorophyll autofluorescence was observed in leaf mesophyll
protoplasts. Chlorophyll fluoresces red in the spectrum used (450-480 nm
excitation, 515 emission) and was expected in the tissue type. Green
autofluorescence in leaf protoplasts was also observed, and believed to be
caused by pigments such as flavonoids and anthocyanins (Grotewold et al.
1998) and phenolics and phenolic metabolites (Hutzler et al. 1998) which are
produced in high amounts in this species.
Conclusion
The use of additional cell wall degrading enzymes such as macerozyme,
pectolyase Y23 and driselase, in addition to cellulase and macerase/pectinase,
improved the quality of isolated protoplasts. Yield was higher in etiolated
shoots compared to leaf and callus. Green autofluorescence was evident in
some samples. The study was unable to provide a conclusive result with
regards to successful transfection of anthurium protoplasts using GFP.

70
Repeated experiments are still needed in order to verify whether the
procedure developed for anthurium protoplasts is an efficient transient
reporter expression system.
Future research
Electroporation can be used in cases where transfection efficiency is
low. Autofluorescence can be overcome by counterstaining and the use of
other fluorescent dyes. It would also be worth comparing protoplast yield in
etiolated leaves versus the tissues used (leaf, etiolated shoot, dark-grown
callus). Expression of GFP in protoplasts can also be verified by western blot.

71
CHAPTER V
CHARACTERIZATION OF SENESCENCE RELATED GENE TRANSCRIPTS
IN ANTHURIUM SPATHE AND LEAVES
Introduction
A transcriptome is a representation that conveys the identity of each
expressed gene and its level of expression for a defined population of cells
(Velculescu et al. 1997). In contrast to the genome which is fixed, the
transcriptome constantly changes and is continuously being altered
depending on internal and external factors. In simpler terms, it is the
collection of genes being expressed by the organism at a particular moment
in a given state. And because it is constantly changing, transcriptome studies
are a bit more challenging.
Analysis of gene expression requires large amounts of good quality
RNA. It is important that mRNA preparations have segments that contain the
entire nucleotide sequence in order to attain a high cloning efficiency
(Okayama & Berg 1982). The gold standard for determining the
transcriptome structure is full-length cDNA sequencing (Forrest & Carninci
2009) but this technique is tedious and expensive. Microarray technology, a
high-capacity system to monitor expression of many genes in parallel, uses
complementary DNAs printed by a high-speed robotic machine on glass
slides (Schena 1995). Although the use of arrays is still the dominant gene
expression profiling technology, it is still limited by factors such as the

72
number of features available for assay, the dependence on the need for
information on gene structure, and the inadequate ability to discriminate
alternative transcript isoforms (Forrest & Carninci 2009). Tag-based
expression profiling techniques, such as SAGE (Velculescu et al. 1995) allows
for a complete quantitative transcript analysis of a specific cell or tissue type
even at low transcript abundance (Peters et al. 1999).
Transcriptome sequencing (RNA-Seq) is one of the latest innovations
being utilized by researchers to study differential gene expression in model
organisms as well as in specialized systems. The introduction of instruments
capable of producing millions of DNA sequence reads in a single run allowed
for the development of high-throughput next generation sequencing, NGS
(Mardis 2008). This allowed sequencing of cDNA fragments at massive scales
(Ozsolak & Milos 2011) and has opened new doors for improvement of
transcriptomic analysis. The use of deep-sequencing technologies provides a
more precise measurement of transcript levels and their isoforms compared
to other methods (Wang et al. 2009).
The objective of this study is to identify and analyze differentially
expressed senescence-related genes in anthurium leaf and spathe tissues. A
survey of anthurium leaf and spathe transcriptome over different
developmental stages was done using RNA-seq. An overview of the different
types of genes and proteins identified from the sequences from mRNA from
the tissues was presented, and the differential expression of several genes in
anthurium leaf and spathe was compared. Transcript levels were quantified.
Genes upregulated and specific to spathe tissues were identified. The large

73
amount of sequence data generated can provide a platform for further
inquiries into the transcriptome of senescing anthurium leaf and spathe, and
an opportunity for anthurium biotechnology and crop improvement. For
example, genes unique to spathes are probably involved in spathe
development, and can be used as sources of promoters to bioengineer
changes in flower color or post-harvest life.
Materials and Methods
Spathe and leaf RNA extraction, transcriptome sequencing and annotation
RNA was isolated from spathe and leaf tissues following the same
protocol used for DNA isolation (Chapter III – Isolation of promoter region)
but instead of RNase treatment following resuspension of the pellet (500 µL
sterile water) after a -20 °C overnight incubation, RNA was selectively
precipitated by adding 8 M LiCl to give a 3 M final concentration. The solution
was mixed well and precipitated at 4 °C overnight. The tube was spun at 14K
rpm (Beckman GS-15R centrifuge) at 4 °C for 30 minutes and washed twice
with 70% ethanol. The pellet was air-dried and resuspended in either 250 µL
(healthy tissues) or 100 µL (senescent/stressed tissues) sterile RNase free-
water. Quality and quantity assessments were done by spectrophotometry
(Beckman Coulter DU730 UV/Vis spectrophotometer) and formaldehyde
denaturing gel electrophoresis of RNA. A formaldehyde agarose gel was
made by adding 1.5 mL 37% formaldehyde to cooled down melted agarose
(1.2 grams) in 90 mL distilled water + 10 mL 10X MOPS buffer (0.2 M N-

74
morpholinopropanesulfonic acid, 50 mM sodium acetate, 10 mM EDTA, pH 7).
Isolated RNA mixed in 2 parts of loading buffer (750 µL formamide, 150 µL
10X MOPS, 180 µL 37% formaldehyde, 200 µL 50% glycerol, 20 µL 10%
bromophenol blue, 100 µL RNase-free water) was heated to 65 °C for 10
minutes and loaded onto the formaldehyde gel pre-stained with Gel Red. RNA
samples for transcriptome sequencing (RNA-seq by Cofactor Genomics, St.
Louis MO, USA) were prepared by pooling RNA isolated from different stages
of tissue development and sent as dried pellet. Anthurium leaf samples (AL)
were composed of 0.34 µg RNA from young green leaf, 3.78 µg RNA from
mature green leaf, 4.27 µg RNA from stage1 (S1) senescent leaf, 5.25 µg
RNA from stage2 (S2) senescent leaf, and 5.04 µg RNA from stage3 (S3)
senescent leaf for a total of 18.68 µg RNA. Stages of leaf development were
determined based on Hayden & Christopher (2004). Anthurium spathe
samples (AS) were composed of 3.71 µg RNA from mature spathe, 1.29 µg
RNA from senescent spathe, and 5 µg RNA from highly senescent spathe for
a total of 10 µg RNA. Stages of spathe development were determined visually;
mature spathe characterized as fully expanded with spadix color change
about halfway from yellow to white, senescent spathe characterized by
browning of at least half of spadix, and highly senescent spathe characterized
as complete browning of spadix. The results of the transcriptome sequencing
were annotated using BLAST (http://blast.ncbi.nlm.nih.gov/) and DoBlast
(http://bioinfo3.noble.org/doblast/) to identify the protein names. Online
searches were done to further annotate the sequences and group the
proteins according to classes based on biological process.

75
Sequence selection, primer design and transcript expression levels
A set of 15 genes was selected to verify differential expression using
RT-PCR and qPCR (Table 5.1). Primer sets were designed using PrimerQuest,
an internet-based primer design tool from Integrated DNA Technologies
(www.idtdna.com). Complementary DNA (cDNA) for each RNA sample AL &
AS was synthesized in a reverse transcription reaction with DNase treatment.
A 20 µL reaction mixture (1X RT buffer, 0.5 unit DNase, 2.5 mM dNTPs, 2.5
µM oligo-dT15, 500 ng RNA) was incubated at 37 °C for 10 minutes, followed
by 5 minutes at 70 °C, and quenched on ice. The reaction was incubated at
42 °C for 1 hour after addition of 1 µL MMLV reverse transcriptase followed
by 5 minutes at 95 °C. A “no RT” control tube was also set-up with the
addition of distilled water instead of the reverse transcriptase. The
synthesized cDNA mix was diluted to 50 µL and used as template for PCR.
A RT-PCR was performed by setting up a 25 µL reaction (1X KCl buffer
with MgCl2, 0.8 mM dNTP mix, 0.2 µM each forward and reverse primer, 0.04
units Taq polymerase) using 1 µL of the synthesized cDNA as template. To
test the designed qRT-PCR primers, a 25 µL reaction (1X KCl buffer with
MgCl2, 0.8 mM dNTP mix, 0.6 µM each forward & reverse primers, 0.06 units
Taq polymerase) was set up using 2 µL of the synthesized cDNA as template.
The mixture was heated to 95 °C for 3 minutes followed by 50 cycles of
95 °C for 10 seconds and 58 °C for 30 seconds. PCR products were resolved
in a 2% agarose gel in 1X TAE (pre-stained with Gel Red) using Hyperladders
IV and V as DNA size markers. Samples for qRT-PCR analysis was prepared
by mixing 5 µL cDNA template and 1.5 µL of each forward and reverse

76
primers (10 µM stock) in a 25 µL reaction mix that was sent to Biotech Core
Facility (University of Hawaii at Manoa) equipped with a BioRad iCycler IQ for
qRT-PCR with SYBR green chemistry. Differential gene expression between
leaf (AL) and spathe (AS) samples was determined by analyzing data for
qRT-PCR (3 independent replicates) using the Livak method (Livak &
Schmittgen 2001), also known as the 2-ΔΔCT, with sample AL as the calibrator,
and glutathione peroxidase (a1111) as the reference gene.
Results
RNA isolation from leaf and spathe
Formaldehyde gel electrophoresis of pooled samples extracted from
anthurium leaf and spathe revealed good quality, intact 28S and 18S rRNA
(Figure 5.1).

77
Transcriptome sequencing and annotation
A total of 267,415 contig assemblies were generated from the Illumina
sequencing experiment performed by Cofactor Genomics. A BLAST search of
the NCBI nr database identified 17,004 sequences generated from RNA-seq
uniquely similar to Arabidopsis proteins. These were further annotated using
online searches and grouped into 22 protein classes based on biological
function (Figure 5.2).
Almost half of all unique sequences were unknown proteins (47%),
while 16% of the sequences have not yet been classified. Proteins involved in
transport/trafficking/vesicle biogenesis and those related to transcription
accounted for 6% each, while proteins related to transcriptional processes
(including ribosomal proteins) and those involved in protein degradation
comprised 3% each of the total. Stress response proteins, complex

78
carbohydrate metabolism proteins, proteins involved in respiration, and
proteins that were classified as vague (those belonging to families, domain-
containing proteins, and proteins that have multiple functions) accounted for
2% each of the total. The remaining classes; those involved in
photosynthesis, lipid metabolism, morphogenesis, DNA processes, nucleic
acid metabolism, amino acid metabolism, cytoskeleton, protein
folding/chaperones, natural compounds biosynthesis, heat-shock proteins,
hormone metabolism, and post-translational processing, each accounted for
1% or less to the total number of sequences annotated.
Sequence selection, primer design and transcript expression levels
Fifteen genes were selected from the annotated Illumina sequencing
results based on their diverse representative coverage value (number of
times the sequence was covered during the sequencing experiment). The
selected genes represented proteins that were relatively expressed in various
levels in either leaf (AL) or spathe (AS) samples (Figure 5.3).
Four proteins were more highly expressed in leaf than in spathe (a175,
a675, a1199 & a3211), while six were expressed more highly in spathe than
in leaf (a41, a415, a650, a1073, a9173 & a9943). Five proteins were
expressed at relatively the same amounts in both leaf and spathe (a218,
a489, a717, a719 & a1111).

79

80
BLAST and online searches revealed the identities of proteins the
sequences are most similar to (Table 5.1).
Table 5.1. Illumina RNA sequencing by Cofactor Genomics showed varying relative
expression levels of 15 selected sequences as reflected by coverage between leaf (AL)
and spathe (AS) samples.
Sequence
identifier Protein name*
Illumina seq coverage Fold
difference†
Relative amount
AL AS
a41 ACC oxidase, ACO1, ACO2 106.55 5421.96 50.89 higher in spathe
a175 ERD9 (EARLY-RESPONSIVE TO DEHYDRATION 9)
5962.62 79.13 -75.35 higher in leaf
a218 callus protein P23 (translationally-controlled tumor protein-like protein)
2776.73 2626.34 0.95 no change
a415 chitinase; glycoside hydrolase family 19 protein
72.3 3970.09 54.91 higher in spathe
a489 dormancy/auxin associated protein 1323.26 1185.58 0.90 no change
a650 glutamate dehydrogenase 33.19 1696.42 51.11 higher in spathe
a675 fructose-bisphosphate aldolase 2514.89 84.82 -29.65 higher in leaf
a717 light-harvesting complex I chlorophyll a/b binding protein
1138.99 1145.4 1.01 no change
a719 protein translation factor SUI1 1293.76 1224 0.95 no change
a1073 TONOPLAST DICARBOXYLATE TRANSPORTER (TDT)
81.91 2094.48 25.57 higher in spathe
a1111 glutathione peroxidase 818.65 889.22 1.09 no change
a1199 PSBP-1 (PHOTOSYSTEM II SUBUNIT P-1)
1404.77 94.34 -14.89 higher in leaf
a3211 ubiquitin 13 27.2 10.93 -2.49 higher in leaf
a9173 xyloglucan endotransglucosylase/hydrolase
protein 0.63 288.86 458.51
higher in spathe
a9943 phospholipase C 0.75 146.39 195.19 higher in spathe
* Protein name from sequence annotation using BLAST † Fold difference of 1 or -1 means no change in expression level
Specific primers for the 15 selected sequences were designed
(Appendix B) and used for RT-PCR.

81
Measurement of band intensity using Image J software revealed
differences in expression levels of the 15 selected genes following RT-PCR
(Figure 5.5). Six genes were expressed higher in leaf than in spathe (a489,
82
a675, a719, a1111, a1199 and a3211), seven genes were expressed higher
in spathe than in leaf (a41, a175, a650, a717, a1073, a9173 & a9943), and
two genes were expressed at relatively the same levels (a218 & a415).
Relative quantification of gene expression by the selected genes was
also measured using quantitative RT-PCR (qPCR). Results (Table 5.2a) show
eight genes to have higher expression in leaf (a175, a218, a489, a675, a717,
a719, a1199 & a3211), while six genes were expressed higher in spathe (a41,
a415, a650, a1073, a9173 & a9943). Only sequence a1111 was shown to be
expressed at the same levels in both tissues.

83
Table 5.2a. Differential expression of selected genes as determined by qRT-PCR analysis of synthesized cDNA from leaf (AL) and spathe (AS) samples.
Sequence
identifier Protein name* Ct Fold
change†
Relative
amount AL AS
a41 ACC oxidase, ACO1, ACO2 25.2 ±1.01 18.6 ±0.56 78.79 higher in
spathe
a175 ERD9 (EARLY-RESPONSIVE TO DEHYDRATION 9)
19.2 ±0.61 24.3 ±0.57 -42.22 higher in
leaf
a218 callus protein P23
(translationally-controlled tumor protein-like protein)
17.7 ±0.70 18.4 ±0.61 -1.95 higher in
leaf
a415 chitinase; glycoside hydrolase family 19 protein
25.6 ±1.07 23.8 ±0.35 2.83 higher in
spathe
a489 dormancy/auxin associated protein
24 ±0.75 26.5 ±0.68 -6.65 higher in
leaf
a650 glutamate dehydrogenase 26.7 ±0.85 20.6 ±0.53 54.443 higher in
spathe
a675 fructose-bisphosphate aldolase 20.8 ±0.95 29.5 ±0.55 -536.21 higher in
leaf
a717 light-harvesting complex I chlorophyll a/b binding protein
20.1 ±0.87 22 ±0.60 -4.70 higher in
leaf
a719 protein translation factor SUI1 19.6 ±0.40 20.9 ±0.26 -2.96 higher in
leaf
a1073 TONOPLAST DICARBOXYLATE TRANSPORTER (TDT)
25.6 ±0.87 20.9 ±0.31 22.11 higher in
spathe
a1111 glutathione peroxidase 21.9 ±0.25 21.6 ±0.31 1 same
a1199 PSBP-1 (PHOTOSYSTEM II SUBUNIT P-1)
18.7 ±0.64 24.4 ±0.26 -65.50 higher in
leaf
a3211 ubiquitin 13 29.7 ±0.93 34.1 ±2.51 -24.82 higher in
leaf
a9173 xyloglucan
endotransglucosylase/hydrolase protein
33.1 ±2.00 23.7 ±0.51 536.215 higher in
spathe
a9943 phospholipase C 35.6 ±2.06 28.8 ±1.05 92.625 higher in
spathe
* Protein name from sequence annotation using BLAST † Fold change in expression relative to sample AL calculated using the Livak method (ΔΔCT) using a1111 as reference gene and AL as calibrator.

84
Table 5.2b. Comparison of fold changes in selected genes using Illumina, RT-PCR & qPCR results.
Sequence identifier Protein name* Illumina RT-PCR qPCR
a41 ACC oxidase, ACO1, ACO2 50.89 1.56 78.79
a175 ERD9 (EARLY-RESPONSIVE
TO DEHYDRATION 9) -75.35 1.18 -42.22
a218
callus protein P23
(translationally-controlled
tumor protein-like protein)
0.95 0.99 -1.95
a415 chitinase; glycoside hydrolase
family 19 protein 54.91 1.05 2.83
a489 dormancy/auxin associated
protein 0.90 -50.22 -6.65
a650 glutamate dehydrogenase 51.11 3.49 54.443
a675 fructose-bisphosphate
aldolase -29.65 -2.57 -536.21
a717
light-harvesting complex I
chlorophyll a/b binding
protein
1.01 1.21 -4.70
a719 protein translation factor
SUI1 0.95 -1.47 -2.96
a1073 TONOPLAST DICARBOXYLATE
TRANSPORTER (TDT) 25.57 1.38 22.11
a1111 glutathione peroxidase 1.09 -1.16 1
a1199 PSBP-1 (PHOTOSYSTEM II
SUBUNIT P-1) -14.89 -2.03 -65.50
a3211 ubiquitin 13 -2.49 -53.98 -24.82
a9173
xyloglucan
endotransglucosylase/hydrola
se protein
458.51 17.01 536.215
a9943 phospholipase C 195.19 13.90 92.625
* Protein name from sequence annotation using BLAST

85
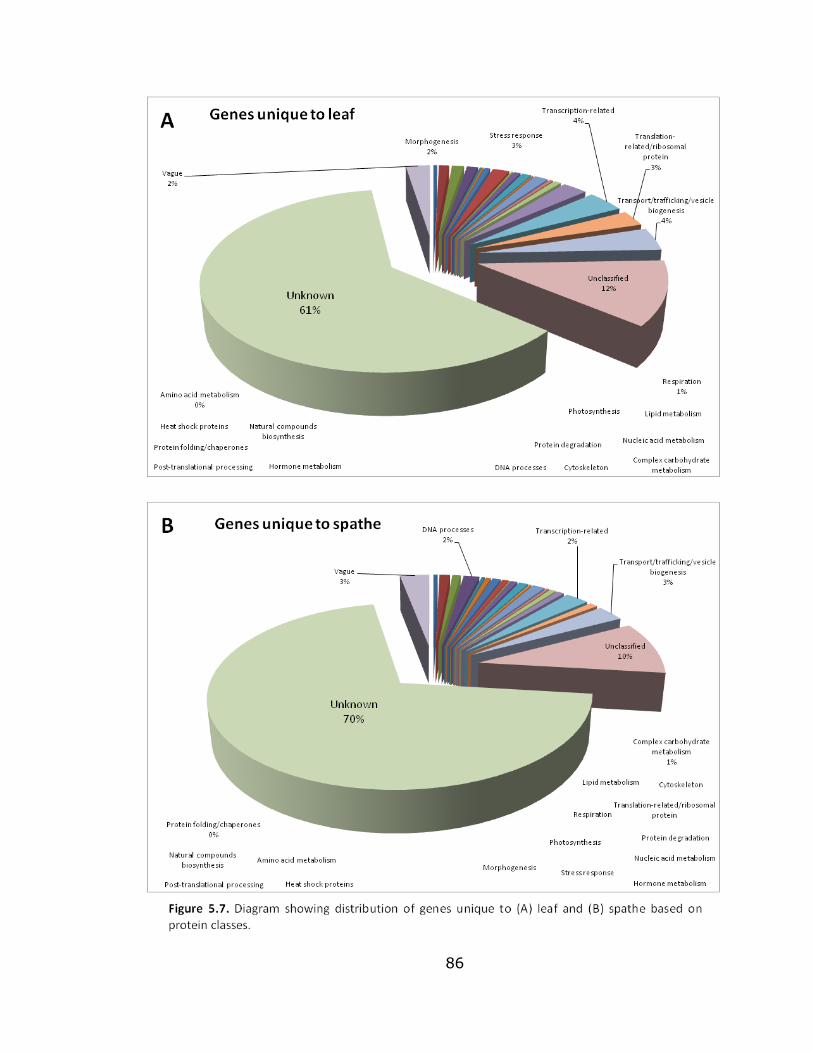
86

87
A total of 942 sequences were discovered to be expressed only in
spathe, while 1053 were unique to leaf (Figure 5.7). Over half of those were
unknown proteins (61% in leaf, 70% in spathe). In all three methods for
expression measurements, Illumina sequencing, RT-PCR & qPCR, five genes
were consistently expressed higher in spathe tissue: a41, a650, a1073,
a9173 & a9943, while three were consistently expressed in leaves: a675,
a1199 & a3211. No sequences having the same levels in both tissues were
measured consistently by the three methods.
In Illumina and RT-PCR measurements, sequence a218 was similarly
measured at having the same levels in both tissues. Sequence a175 was
measured differently though, and was shown to be higher in leaf using
Illumina sequencing, but was shown to be the opposite (higher in spathe)
using RT-PCR. The other sequences were either measured having the same
levels or higher in either leaf or spathe.
All sequences that were measured by Illumina sequencing to be
expressed high in leaf (a175, a675, a1199 & a3211) were also measured the
same by qPCR, although additional genes (a218, a489, a717, a719) were
measured by qPCR to be higher in leaf, while in Illumina they were measured
to have the same level of expression in both tissues. Sets of genes that were
expressed higher in spathe tissue were the same for both methods (a41,
a415, a650, a1073, a9173 & a9943). Sequence a1111 was measured by
both Illumina and qPCR to have the same level of expression in both leaf and
spathe.

88
Comparison of measurements between RT-PCR & qPCR revealed that
almost all genes measured by RT-PCR to be highly expressed in leaf (a489,
a675, a719, a1199, a3211) were measured similarly by both methods,
except for a1111 where RT-PCR scored it to be high in leaf but qPCR scored it
as having the same level of expression in both leaf and spathe. Sequences
a175 and a717 were both scored by RT-PCR to be higher in spathe but was
scored higher in leaf by qPCR. RT-PCR scored a415 to be the same in both
leaf and spathe but in qPCR it was measured to be highly expressed in
spathe.
Discussion
Transcriptome sequencing, annotation and sequence selection
Further annotations (using BLAST and online searches) of the results
identified the selected sequences to be proteins associated with different
biological functions. Almost half (47%) of the identified sequences
corresponded to proteins classified as unknown. Aside from proteins with
unknown biological function, this group is also comprised of hypothetical
proteins, predicted proteins, putative proteins, uncharacterized proteins, and
unnamed proteins. Hypothetical proteins are predicted proteins from nucleic
acid sequences that have not been shown to exist by experimental chemical
evidence, and may represent up to half of the potential protein coding
regions of a genome (Lubec et al. 2005).
A total of 15 nucleotide sequences that code for 15 different genes
were selected and used for expression studies. One of these is sequence a41,

89
a gene that codes for ACC oxidase. This protein, grouped in the class of
hormone metabolism, is an enzyme involved in fruit ripening (Moyaleon &
John 1994) and catalyzes the last step in ethylene biosynthesis (Kende 1993).
The gene has been used in antisense gene technology to inhibit fruit ripening
(Ayub et al. 1996). Three sequences were classified as stress proteins.
Sequence a175 was annotated to have the highest similarity to ERD9 (EARLY
RESPONSIVE TO DEHYDRATION 9) protein, most probably a member of a
group of ERDs that are preferentially responsive to dehydration stress
(Kiyosue et al. 1994). Another member protein, ERD15, is rapidly induced in
response to biotic and abiotic stresses and has been shown to negatively
regulate abscisic acid (ABA) responses in arabidopsis (Kariola et al. 2006).
Sequence a415 was discovered to be a chitinase, an enzyme that hydrolyzes
chitin. Plant chitinases play a role in pathogen resistance, and are
upregulated by both biotic and abiotic stresses, and by phytohormones such
as ethylene, jasmonic acid and salicylic acid (Kasprzewska 2003). The third
stress response protein is sequence a1111, a glutathione peroxidase. This
enzyme protects cells from oxidative damage generated by reactive oxygen
species, is highly expressed in most developmental tissues but showed the
strongest responses under most abiotic stresses (Milla et al. 2003).
A gene sequence (a218) classified as belonging to morphogenesis
proteins, codes for callus protein P23. The gene for this protein has been
cloned in pea (Pisum sativum L.), and the expression was correlated with
mitosis and cell division in root caps (Woo & Hawes 1997). Sequence a650
corresponds to glutamate dehydrogenase, an enzyme that catabolizes

90
glutamate and has an important regulatory function in carbon and nitrogen
metabolism (Robinson et al. 1991). A sequence grouped with respiration
proteins (a675) was annotated to be fructose-bisphosphate aldolase. This
was found to be a constituent of both the glycolytic/gluconeogenic pathway
and the pentose phosphate cycle, and responds to gibberellin in rice roots
(Konishi et al. 2004).
Two sequences coded for proteins involved in photosynthesis. The first
was a717, the light-harvesting complex I chlorophyll a/b binding protein, a
component of the light-harvesting antenna system responsible for
photoprotection (Umate 2010), and the second was a1199, the
PHOTOSYSTEM II SUBUNIT P-1 protein, a part of a multisubunit pigment-
protein complex that catalyzes the light-driven water oxidation and reduction
of plastoquinone (Peng et al. 2006). The TONOPLAST DICARBOXYLATE
TRANSPORTER, TDT (sequence a1073) is a malate transporter and is also
involved in the regulation of pH homeostasis under certain conditions (Hurth
et al. 2005). Sequence a9173 was annotated to be a xyloglucan
endotransglucosylase/hydrolase protein, a cell wall modifying enzyme that
has a high specificity for xyloglucan, the most abundant hemicellulose in the
primary cell walls of non-graminaceous plants (Saladie et al. 2006). Ubiquitin
13, coded for by sequence a3211, is a highly conserved eukaryotic protein
that covalently links to substrate proteins thereby tagging them for
degradation via the ubiquitin pathway (Belknap & Garbarino 1996).
Phospholipase C (sequence a9943) hydrolyzes phosphatidylinositol
bisphosphate, a membrane-associated lipid, into the signaling molecules

91
inositol phosphate and diacylglycerol, and was found to be inhibited by
profilin, an actin-binding protein (Drøbak et al. 1994). Sequence a719, the
protein translation factor SUI1, was found to be present in high amounts in
yellow fruit library of pineapple and was strongly upregulated during fruit
ripening (Moyle et al. 2005). A protein of unknown function (sequence a489)
was a dormancy/auxin associated protein also found to be expressed in
shade-induced apple abscission (Zhou et al. 2008) and during seed
maturation in Brassica napus (Fei et al. 2007).
Transcript expression levels
Five genes namely a41, a650, a1073, a9173 & a9943 were highly
expressed in spathe tissues. These genes correspond to ACC oxidase,
glutamate dehydrogenase, TONOPLAST DICARBOXYLATE TRANSPORTER,
xyloglucan endotransglucosylase/hydrolase protein & phospholipase C,
respectively. ACC oxidase is involved in ethylene biosynthesis, and is mostly
associated with programmed senescence such as fruit ripening and petal
senescence. Although the true flowers in anthurium are borne on the spadix,
it was not included in the RNA extraction performed. The increased level of
expression of ACC oxidase in spathe suggests increased ethylene production
in spathe compared to that in leaves. Higher expression of glutamate
dehydrogenase implies higher concentration of its substrate glutamic acid.
The results in spathe expression data suggest that these five proteins are
required for spathe development and senescence.

92
The genes required for leaf development are a675, a1199 & a3211.
These sequences correspond to fructose-bisphosphate aldolase,
PHOTOSYSTEM II SUBUNIT P-1 (PSBP-1) & ubiquitin 13, respectively.
Fructose-bisphosphate aldolase is involved in the pentose phosphate pathway
and would be expressed higher in leaves since there is a higher amount of
chloroplasts in the leaf than in spathe. The same for PSBP-1, a component of
Photosystem II actively expressed during photosynthesis, and expected to
have higher expression in leaf. Since ubiquitin was expected to be present in
both tissues, this particular protein (ubiquitin 13) could be a leaf-specific
isoform of ubiquitin.
Genes expressed at relatively the same levels, a218 & a1111
corresponding to callus protein P23 & glutathione peroxidase, respectively,
are proteins commonly involved in developmental processes in both tissues
and are good candidates for controls. Callus protein P23 was grouped with
morphogenesis proteins and was shown to be involved in mitosis and cell
division, a process common in all tissue types. Glutathione peroxidase was
previously mentioned to be involved in oxidative stress protection and since
both leaf and spathe tissues were senescent, this gene would be expressed in
both. The same level of expression by glutathione peroxidase in both tissues
would also be consistent with the report that it is expressed in all
developmental tissues (Milla et al. 2003). Both of these are most probably
maintenance genes.
Genes expressed in higher levels in a specific tissue type indicate the
importance of the protein in the developmental processes occurring at that

93
particular moment. Since the pooled RNA used in RNA-seq analysis were
mostly from senescent tissues (78% in leaf and 64% in spathe), a majority
of the genes resulting from Illumina sequencing were expected to be
senescence-related genes. These genes perform specific functions during
senescence.
Conclusion
Illumina sequencing, transcriptome profiling and bioinformatic
analyses identified fifteen differentially expressed senescence-related genes
involved in leaf and spathe development. More than half of the unique
sequences, whether overall (17,004 sequences) or specific to leaf (1,053
sequences) or spathe (942 sequences), were found to be proteins of
unknown function. This gives a picture of how much work needs to be
invested in gene isolation and characterization. Differential expression
experiments identified genes that are specific for leaf and spathe tissues
undergoing senescence, as well as genes specific to either spathe or leaf.
Quantification of fold-change (the increase or decrease in transcript levels) in
gene expression is relative and measurements are not exact. RNA
sequencing provides an abundance of sequences for gene analysis, but
requires validation using RT-PCR and/or qPCR.
Future studies
A sequence similarity search could be performed on the contig
assembly data using the ANTH17 sequence to verify expression of the
senescence-activated cysteine protease. The availability of sequences would

94
allow cloning and characterization of genes that could be of interest to
anthurium crop improvement. Expression data unique to either leaf or spathe
could be used in mining for tissue-specific genes for promoter isolation.
Accuracy of the contig assemblies could also be validated by performing long
strand PCR followed by sequencing. The availability of a collection of
sequences, all 17,000 of them, opens new frontiers for further molecular
studies in anthurium.

95
CHAPTER VI
ANTHURIUM SEED DEVELOPMENT
Introduction
The biogenesis of a seed and associated dehydration is an end point in
development, involving senescence of tissues. One example of senescing
tissue in the seed is the endothelium and integuments, components of the
seed coat that function in the promotion of dormancy, protection and
dispersal (Haughn & Chaudhury 2005). Similar to senescence in leaves, a set
of genes are involved and are upregulated during this process. An example is
a protein disulfide isomerase (PDI5) that has been shown to localize in
protein storage vacuoles in seeds, and is produced in high amounts just
before senescence of the seed endothelium (Ondzighi et al. 2008).
Seed storage proteins play an essential role in seed development, and
are mostly found in protein bodies. In all seeds, one or two groups of protein
are usually present in high amounts and serve as storage of amino acids for
use in germination and seedling growth (Shewry et al. 1995). These proteins
are mobilized during these processes and are the primary nitrogen source for
the developing embryo. Seed storage proteins of dicots are mostly albumins
and globulins while those of monocots are mostly prolamins and glutelins
(Derbyshire et al., 1976). Glutelin, the major seed protein in rice, accounts
for 80% of the total protein in the endosperm and is used as a nitrogen
source for germination (Takaiwa and Oono 1991).

96
Anthurium is a broadleaf monocot which has a complete flower, but
cannot self pollinate due to difference in timing of pollen production and
stigma receptivity. In successful pollinations, resulting seeds have to be
germinated right away. Compared to other monocots, such as the cereal
grains, seeds of anthurium cannot be stored for prolonged periods due to
loss of viability, a form of aging. In some plant species, it has been known
that loss of moisture is associated with loss of viability in seeds (Hendry et al.
1992; Chaitanya and Naithani 1994).
It would be interesting from an evolutionary perspective to compare
the protein profile of the seed storage proteins of the monocot, anthurium,
with rice and maize, which are two widely studied members of the grass
subfamily of the Monocotyledonae. Additionally, it would also be notable to
observe the similarities and differences in the proteins, namely globulin,
glutelin and prolamin seed storage proteins present in the seeds. This
experiment serves as an initial study in the examination of anthurium seed
proteins and storage proteins, and the possibilities of identifying genes
involved in the loss of viability in anthurium seeds during prolonged storage.
Materials and Methods
Pollination of flowers, seed development and harvesting
Anthurium andreanum cultivar ‘Rising Sun’ inflorescence was
mechanically pollinated by dusting receptive, nectar-secreting stigma with
pollen collected from A. andreanum cultivar ‘Nitta Orange’. The plant bearing

97
the pollinated flower was grown in normal conditions in the growth room (70%
shade, 27 °C, 60-70 % relative humidity, 12 hour light cycle) and allowed to
develop seeds. The inflorescence (spathe and spadix) was harvested and
seeds were collected by pressing the berries lightly until the seeds (2-3 per
berry) separated from the pulp. The seeds were cleaned and stored overnight.
The cleaned up seeds were surface sterilized in a 10% Chlorox™ solution
(0.53% NaOCl) + 0.2% Tween 20 for 20 minutes, washed for another 20
minutes in a 5% Chlorox™ solution (0.27% NaOCl) + 0.2% Tween 20, and
finally rinsed five times in sterile distilled water. The disinfected seeds were
germinated in vitro (on filter paper and water in a petri plate under sterile
conditions) at room temperature with a 12 hour photoperiod.
Protein extraction, analysis and mass mapping
Seed protein profiles for anthurium (A. andreanum), rice (Oryza sativa)
and maize (Zea mays) were generated using SDS-PAGE followed by
coomassie brilliant blue staining. The procedure for protein extraction from
seeds/grains was adapted from the paper by Tian et al. (2004). Total seed
protein was extracted by grinding 2 to 3 seeds in SDS sample buffer (pH 6.8)
composed of 5% (v/v) β-mercaptoethanol, 4% (w/v) SDS, 4 M urea, 0.125 M
Tris-HCl in a mortar and pestle. Furthermore, seed protein extraction based
on solubility was also performed using extraction buffers for globulins (0.5 M
NaCl, 10 mM Tris-HCl pH 6.8), glutelins (1% v/v lactic acid), and prolamins
(60% n-propanol, 5% β-mercaptoethanol). Protein extracts were loaded onto
a 12% SDS-PAGE gel alongside a Full range Rainbow Protein Marker
98
(Amersham-GE Healthcare, Piscataway NJ, USA) and stained with Coomassie
Brilliant Blue (50% methanol, 0.05% Coomassie R-250, 10% acetic acid).
Gels were dried and selected bands were sent for protein identification.
Samples from dried gels were sent to two facilities for protein
identification by mass spectrometry. Midwest Bio Services, LLC (Overland
Park KS, USA) performed tandem mass spectrometry using nano-LC/MS/MS
technique on five different protein bands cut out from dried SDS-PAGE gel of
total seed protein. The mass mapping services offered by Stanford PAN
Facility (Stanford CA, USA) for identifying proteins from two bands cut out
from dried SDS-PAGE gels involved tryptic digestion followed by mass
analysis of the resulting peptide mixture on an AB 4700 Proteomics Analyzer
(MALDI mass spectrometer). Mass spectrometry data generated from the two
samples were used to identify the protein from primary sequence database
using Mascot search (www.matrixscience.com).

99
Results
Pollination, seed development & harvesting
Mechanical pollination of flowers produced ripe berries borne on the
spadix after 8 months (Figures 6.1a, 6.1b). The spadix noticeably resembled
a corn cob after the yellowish, plump berries were removed (Figure 6.1c).
Two seeds were encased within each berry in gelatinous, jelly-like mucilage
that had a characteristic scent similar to that of corn kernels (Figure 6.1d).
Surface-sterilized seeds germinated after 8 to 10 days in vitro (not shown).

100
Total protein from seeds
Total protein (extracted by grinding fresh seeds and sample buffer in a
mortar and pestle) from anthurium, rice and maize whole seeds (embryo,
endosperm & seed coat) generated different protein profiles (Figure 6.2).
Three major bands with MW sizes of 65-, 18- and 11-kilodaltons (kD) were
observed in anthurium, while six major bands with MW sizes of 35-, 32-, 20-,
19-, 13- and 11-kD were seen in rice. In maize, multiple higher MW sized
bands between 55- and 70-kD can be hardly distinguished except for a band
with a MW of 65-kD. However, six lower MW sized bands smaller than 30-kD
were easily resolved by the gel and had corresponding sizes of 28-, 23-, 20-,
17-, 15- and 8-kD.

101
A closer look at the total protein SDS-PAGE gel showed the presence of
similar sized protein bands in all three samples. Proteins bands having MW
sizes of 65-, 55- and 8-kD were seen in protein profiles for all three samples,
while bands sized 50-, 43-, 40-, and 18-kD were unique to anthurium only.
Three bands having sizes of 77-, 35- and 11-kD were shared by anthurium
and rice, while a 28-kD band was present in anthurium and maize. Two
bands (19- & 13-kD) were unique to rice, and a 23-kD band was unique to
maize. A 32- and a 20-kD band was present in both rice and maize.
Protein types based on solubility
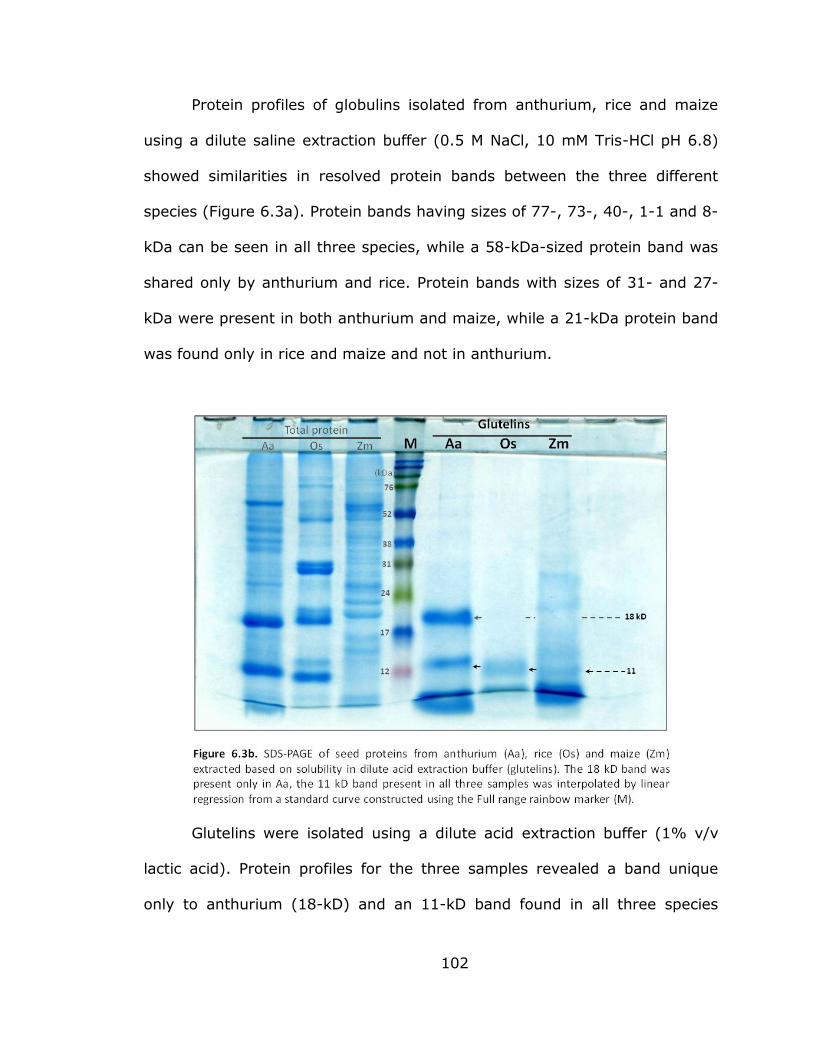
102
Protein profiles of globulins isolated from anthurium, rice and maize
using a dilute saline extraction buffer (0.5 M NaCl, 10 mM Tris-HCl pH 6.8)
showed similarities in resolved protein bands between the three different
species (Figure 6.3a). Protein bands having sizes of 77-, 73-, 40-, 1-1 and 8-
kDa can be seen in all three species, while a 58-kDa-sized protein band was
shared only by anthurium and rice. Protein bands with sizes of 31- and 27-
kDa were present in both anthurium and maize, while a 21-kDa protein band
was found only in rice and maize and not in anthurium.
Glutelins were isolated using a dilute acid extraction buffer (1% v/v
lactic acid). Protein profiles for the three samples revealed a band unique
only to anthurium (18-kD) and an 11-kD band found in all three species

103
(Figure 6.3b). The 8-kD band observed in the two previous gels (total protein
& globulin) was also visible at the bottom, just above the dye front.
SDS-PAGE analysis of prolamins, extracted based on their solubility in
alcohol solution (60% n-propanol, 5% β-mercaptoethanol), from the three
samples showed a band (22-kD) unique only to maize (Figure 6.3c). Two
bands were shared by anthurium and maize (18- & 13-kD) while an 11-kD
band was unique only to rice.
Peptide sequencing results
There were no protein matches in the NIH nr database on the five
samples sent to Midwest Bio Services for tandem mass spectrometry. Mascot
database search (NCBI nr) using mass spectrometry data for the two

104
samples submitted to Stanford PAN Facility returned one match. Sample B
(Figure 6.2, 11 kD band) had sequence identity to ShlA/HecA/FhaA exofamily
protein from Escherichia coli CFT073.
Discussion
Pollination of flowers, seed development and harvesting
Pollination was successful, as evidenced by the development of mature
seeds encased within berries on the spadix. In its natural habitat, anthurium
is pollinated by insects. The inflorescence produces aromatic substances
collected by various bees and wasps to use as scent attractants in courtship
or as waterproofing for their nests (Bown 2000). Although the plant has a
complete flower, self pollination is impossible because the plants are
protogynous; the stigma is receptive before the pollen is shed (Higaki et al.
1984). Receptive stigma is evidenced by the secretion of sticky, translucent
stigmatic fluid on the tip of each flower on the spadix that provides a suitable
medium for pollen germination (Higaki et al. 1984). There have been reports
of failures in sexual propagation attributed to species incompatibility resulting
in non-viable seeds (Sheffer & Kamemoto 1976). In this experiment, the
harvested seeds were able to germinate in sterile conditions, although
germination in pots was not tested.
Anthurium berries resembled corn kernels, having a mucilaginous pulp
encased in a shiny, waxy coating (hardened carpel wall), while the seeds
(endosperm & embryo) resembled the grains of cereals. This is not surprising
since all three species are monocots. The mucilage had a characteristic scent,

105
similar to that of corn, to make it attractive to animals. Birds and mammals
were presumed to be the dispersal agents of the brightly colored berries of
Araceae in its natural environment (Judd et al. 2002). It was suggested that
because anthurium seeds have a very sticky coating, the birds that feed on
the pulp wipe the seeds off on branches when cleaning their beaks thus
leaving the seeds well-placed for germination (Bown 2000).
Seeds developed to maturity, as evidenced by the ability to germinate
after one week incubation in vitro. A seed that does not develop properly, or
do not mature properly does not have the ability to germinate. This is most
probably due to loss of moisture, since loss in viability of seeds is due to
disorganization of metabolism leading to the loss of stability of subcellular
structures, including membranes resulting from loss of structured water
(Farrant et al. 1988; Chaitanya & Naithani 1994).
SDS-PAGE analysis of seed proteins
The 77-kD band (common to anthurium & rice) and the 55-kD band
(common to all three species) seen in the total protein gel (Figure 6.2) are
the 76- and 57-kD polypeptides of glutelin. The 76-kD glutelin peptide
belongs to albumin component and localizes in the starch granules in rice
(Yamagata et al. 1982).The 57-kD glutelin is composed of two polypeptide
groups, 22 to 23 and 37 to 39 kilodalton complexes. Glutelin is the major
storage protein in rice seed and the expression levels of the 76- and 57-kD
polypeptides are fairly constant throughout seed development (Yamagata et
al. 1982). The 57-kD polypeptide is salt soluble but not the mature subunits

106
(Yamagata et al. 1982) thus, the 55-kD band can be seen in Figures 6.2
(total protein) and 6.3a (dilute salt soluble globulins) but not in Figures 6.3b
(acid- soluble glutelins) and 6.3c (alcohol-soluble prolamins). Glutelin in rice
is post-translationally cleaved to give acidic (28- to 31-kD) and basic (20- to
22-kD) polypeptides (Takaiwa et al. 1999). These mature peptides were not
observed in the globulin extracts (Figure 6.3a, Os), which are expected since
they are not readily salt soluble, although a 21-kD band can be seen.
Interestingly, anthurium and maize contained the 27- to 31-kD bands, and
are possible rice glutelin homologs. The major bands seen in rice (Figure 6.2,
lane Os) are the major groups of polypeptides when glutelin is reduced.
Three size classes of polypeptides are detected in SDS-PAGE of rice glutelin
fraction; 51 kD, 34 to 37 kD, and 21 to 22 kD, and a contaminating
prolamine polypeptide of 14 kD (Villareal & Juliano 1978; Krishnan & Okita
1986; Kim & Okita 1988).
Zeins are maize prolamins and consist of two major subclasses, the 22
kD and the 19 kD (Shewry & Halford 2002), and these are the major proteins
seen in Figure 6.3c (22-kD & 18kD). The 28-kD band common to both
anthurium and maize is most probably the 27 kD HS-7 zein of maize.
Inconsistencies in calculating MW sizes are possible, due to differences
in the extraction buffers used in isolating the different protein types based on
solubility. The differences in the buffer composition affected migration
patterns of peptides.

107
Protein extraction, analysis and mass mapping
Tandem mass spectrometry performed on the five samples sent to
Midwest Bio Services did not correspond to any protein when ran through a
peptide mass spectrometry database. In order for a particular sequence to be
considered an identity, the spectrometry data should match to at least two
peptides belonging to the same protein. More matches to peptides from a
particular protein increase the likelihood of a complete match. This is not the
case for the five samples, since there were only single hits to a particular
peptide from proteins contained in the database for each of the samples
submitted. This is unusual, since there should be higher similarity at the
protein level than at the nucleotide level, especially for proteins belonging to
the same family, and even for proteins that descended from the same
ancestor. Although unusual, inability to find significant matches is highly
possible, especially for proteins from species that are not widely studied, and
therefore absence of protein sequences in the mass spectrometry database.
The mascot search using mass spectrometry data generated from the
tryptic digestion of the two samples submitted to Stanford PAN Facility
returned one match for Sample B (11 kDa). This short tryptic peptide of
947.46 Daltons corresponds to the amino acid sequence AGGNLSVSSR. A
quick BLAST search revealed it to be a hemagglutinin repeat protein or a
protein belonging to the hemagglutinin family from Escherichia coli. The
closest match to a plant protein is an E3 ubiquitin-protein ligase At1g12760-
like protein from Glycine max (soybean), which is involved in protein
degradation. The closest match to a monocot was to an uncharacterized

108
protein LOC100192085 from Zea mays. This protein (NP_001130980.1)
contains four ACT domains which are commonly involved in amino acid
binding or small ligand binding that leads to enzyme regulation (BLAST). The
14 kD peptide from anthurium could be a part of a larger protein involved in
protein degradation during seed germination.
Conclusion
Anthurium andreanum ‘Marian Seefurth’ and ‘Nitta Orange’ are
compatible cultivars that produce mature and viable seeds that successfully
geminate in vitro. The major high MW seed proteins are most similar to
glutelins found in rice, and the major low MW proteins are prolamins most
similar to zeins. Protein profiles generated by SDS-PAGE provided limited
information on the major anthurium seed proteins. Identification of peptides
by mass spectrometry is a necessity in order to generate a complete
proteomic profile, although the technique is dependent on the sequences
available in a database. It is believed that anthurium lacks typical monocot
grain storage proteins, such as those found in rice and corn. This may have
implications in embryo development, and subsequently affect seed viability.
However, several new seed or embryo proteins were identified. The
information generated by this study, albeit limited, serves as preliminary
work for investigating seed viability loss in anthurium during prolonged
storage.

109
Future studies
It is recommended to try 2D gel electrophoresis as the next step in
characterizing the major seed proteins in anthurium. The identification of
peptides using mass spectrometry is especially challenging for species that
are less studied, mainly due to limitations in database information. The
upside to the procedure though is that the mass spectrometry data
generated from the samples can be used to do another search in the future,
when newer and more updated versions of databases become available. A
more conventional molecular approach could prove to be a better step
towards identifying the major seed proteins of anthurium and facilitate
inquiry into the function of these proteins, as well as the possibility of
involvement in seed development and viability.

110
Appendix A - PlantCARE Database search results (complete)
Table A1. A database search of the PrAnth17 sequence using PlantCARE revealed the
presence of regions involved in transcription regulation. (Rows highlighted in blue
indicate sequences also found in PrSAG12 sequence).
motif species position Strand sequence function
4cl-CMA2a Petroselinum crispum 111 - TCATCACCTAACAC light responsive element
5UTR Py-rich stretch
Lycopersicon esculentum 222 + TTTCTTCTCT
cis-acting element conferring high transcription levels
AAGAA-motif Avena sativa 1051 + GAAAGAA
A-box Petroselinum crispum 299 + CCGTCC
cis-acting regulatory element
ABRE Arabidopsis thaliana 1005 + TACGTG
cis-acting element involved in the abscisic acid responsiveness
ABRE Hordeum vulgare 1303 - CCGCGTAGGC
cis-acting element involved in the abscisic acid responsiveness
ACE Petroselinum crispum 101 - ACTACGTTGG
cis-acting element involved in light responsiveness
ACE Petroselinum crispum 889 + AAAACGTTTA
cis-acting element involved in light responsiveness
ARE Zea mays 395 + TGGTTT
cis-acting regulatory element essential for the anaerobic induction
ARE Zea mays 813 - TGGTTT
cis-acting regulatory element essential for the anaerobic induction
ARE Zea mays 639 - TGGTTT
cis-acting regulatory element essential for the anaerobic induction
ATCT-motif Arabidopsis thaliana 252 + AATCTAATCT
part of a conserved DNA module involved in light responsiveness
ATGCAAAT motif Oryza sativa 693 - ATACAAAT
cis-acting regulatory element associated to the TGAGTCA motif
Box 4 Petroselinum crispum 1224 + ATTAAT
part of a conserved DNA module involved in light responsiveness
Box I Pisum sativum 193 + TTTCAAA light responsive element
Box I Pisum sativum 558 - TTTCAAA light responsive element
Box I Pisum sativum 530 - TTTCAAA light responsive element
Box I Pisum sativum 614 + TTTCAAA light responsive element
CAAT-box Arabidopsis thaliana 39 + gGCAAT
common cis-acting element in promoter and enhancer regions
CAAT-box Arabidopsis thaliana 255 + CCAAT
common cis-acting element in promoter and enhancer regions
CAAT-box Arabidopsis thaliana 702 - CCAAT
common cis-acting element in promoter and enhancer regions

111
Table A1. (continued) A database search of the PrAnth17 sequence using PlantCARE
revealed the presence of regions involved in transcription regulation. (Rows
highlighted in blue indicate sequences also found in PrSAG12 sequence).
CAAT-box Arabidopsis thaliana 798 - CCAAT
common cis-acting element in promoter and enhancer regions
CAAT-box Arabidopsis thaliana 1279 - CCAAT
common cis-acting element in promoter and enhancer regions
CAAT-box Brassica rapa 8 - CAAAT
common cis-acting element in promoter and
enhancer regions
CAAT-box Brassica rapa 230 + CAAAT
common cis-acting element in promoter and enhancer regions
CAAT-box Brassica rapa 313 + CAAAT
common cis-acting element in promoter and enhancer regions
CAAT-box Brassica rapa 426 - CAAAT
common cis-acting element in promoter and enhancer regions
CAAT-box Brassica rapa 529 - CAAAT
common cis-acting element in promoter and enhancer regions
CAAT-box Brassica rapa 643 + CAAAT
common cis-acting element in promoter and enhancer regions
CAAT-box Brassica rapa 693 - CAAAT
common cis-acting element in promoter and enhancer regions
CAAT-box Brassica rapa 976 - CAAAT
common cis-acting element in promoter and enhancer regions
CAAT-box Brassica rapa 1164 - CAAAT
common cis-acting element in promoter and enhancer regions
CAAT-box Brassica rapa 1252 + CAAAT
common cis-acting element in promoter and enhancer regions
CAAT-box Glycine max 6 + CAATT
common cis-acting element in promoter and enhancer regions
CAAT-box Glycine max 245 + CAATT
common cis-acting element in promoter and enhancer regions
CAAT-box Glycine max 246 - CAATT
common cis-acting element in promoter and enhancer regions
CAAT-box Glycine max 328 + CAATT
common cis-acting
element in promoter and enhancer regions
CAAT-box Glycine max 592 + CAATT
common cis-acting element in promoter and enhancer regions
CAAT-box Glycine max 909 + CAATT
common cis-acting element in promoter and enhancer regions
CAAT-box Glycine max 998 - CAATT
common cis-acting element in promoter and enhancer regions

112
Table A1. (continued) A database search of the PrAnth17 sequence using PlantCARE
revealed the presence of regions involved in transcription regulation. (Rows
highlighted in blue indicate sequences also found in PrSAG12 sequence).
CAAT-box Hordeum vulgare 41 + CAAT
common cis-acting element in promoter and enhancer regions
CAAT-box Hordeum vulgare 160 - CAAT
common cis-acting element in promoter and enhancer regions
CAAT-box Hordeum vulgare 247 - CAAT
common cis-acting element in promoter and
enhancer regions
CAAT-box Hordeum vulgare 256 + CAAT
common cis-acting element in promoter and enhancer regions
CAAT-box Hordeum vulgare 409 - CAAT
common cis-acting element in promoter and enhancer regions
CAAT-box Hordeum vulgare 450 + CAAT
common cis-acting element in promoter and enhancer regions
CAAT-box Hordeum vulgare 467 + CAAT
common cis-acting element in promoter and enhancer regions
CAAT-box Hordeum vulgare 567 - CAAT
common cis-acting element in promoter and enhancer regions
CAAT-box Hordeum vulgare 786 - CAAT
common cis-acting element in promoter and enhancer regions
CAAT-box Hordeum vulgare 950 + CAAT
common cis-acting element in promoter and enhancer regions
CAAT-box Hordeum vulgare 999 - CAAT
common cis-acting element in promoter and enhancer regions
CAAT-box Hordeum vulgare 1068 + CAAT
common cis-acting element in promoter and enhancer regions
CAAT-box Hordeum vulgare 1138 - CAAT
common cis-acting element in promoter and enhancer regions
CAAT-box Hordeum vulgare 1401 - CAAT
common cis-acting element in promoter and enhancer regions
CAT-box Arabidopsis thaliana 103 + GCCACT
cis-acting regulatory element related to meristem expression
CATT-motif Zea mays 673 + GCATTC
part of a light responsive
element
CCGTCC-box
Arabidopsis thaliana 299 + CCGTCC
cis-acting regulatory element related to meristem specific activation
chs-Unit 1 m1
Arabidopsis thaliana 109 - ACCTACCACAC
part of a light responsive element
circadian Lycopersicon esculentum 1059 + CAAAGATATC
cis-acting regulatory element involved in circadian control
CTAG-motif Avena sativa 228 - ACTAGCAGAA
ERE Dianthus caryophyllus 558 - ATTTCAAA
ethylene-responsive element

113
Table A1. (continued) A database search of the PrAnth17 sequence using PlantCARE
revealed the presence of regions involved in transcription regulation. (Rows
highlighted in blue indicate sequences also found in PrSAG12 sequence).
ERE Dianthus caryophyllus 613 + ATTTCAAA
ethylene-responsive element
GA-motif Arabidopsis thaliana 146 - ATAGATAA
part of a light responsive element
GARE-motif Brassica oleracea 218 - AAACAGA gibberellin-responsive element
GARE-motif Brassica oleracea 1442 + AAACAGA gibberellin-responsive element
G-Box Antirrhinum majus 1005 - CACGTA
cis-acting regulatory element involved in light responsiveness
G-box Daucus carota 1005 + TACGTG
cis-acting regulatory element involved in light responsiveness
GCC box Arabidopsis thaliana 1108 - AGCCGCC
ethylene-responsive element
GC-motif Zea mays 288 + CCCCCG
enhancer-like element involved in anoxic specific inducibility
GC-motif Zea mays 332 + CCCCCG
enhancer-like element involved in anoxic specific inducibility
HD-Zip 3 Arabidopsis thaliana 1141 + GTAAT(G/C)ATTAC protein binding site
HSE Brassica oleracea 1352 - AGAAAATTCG
cis-acting element involved in heat stress responsiveness
I-box Flaveria trinervia 84 - GATATGG part of a light responsive element
I-box Flaveria trinervia 1074 + GATATGG part of a light responsive element
I-box Flaveria trinervia 1070 - cCATATCCAAT part of a light responsive element
LTR Hordeum vulgare 189 + CCGAAA
cis-acting element involved in low-temperature responsiveness
O2-site Zea mays 84 - GATGATATGG
cis-acting regulatory element involved in zein metabolism regulation
O2-site Zea mays 216 - GATGACATGG
cis-acting regulatory element involved in zein metabolism regulation
Skn-1_motif Oryza sativa 1331 + GTCAT
cis-acting regulatory element required for endosperm expression
Sp1 Zea mays 48 + CC(G/A)CCC light responsive element
Sp1 Zea mays 295 + CC(G/A)CCC light responsive element
Sp1 Zea mays 121 + CC(G/A)CCC light responsive element
Sp1 Zea mays 374 - CC(G/A)CCC light responsive element
TATA-box Arabidopsis thaliana 54 + TATA
core promoter element around -30 of transcription start
TATA-box Arabidopsis thaliana 70 + TATAAA
core promoter element around -30 of transcription start

114
Table A1. (continued) A database search of the PrAnth17 sequence using PlantCARE
revealed the presence of regions involved in transcription regulation. (Rows
highlighted in blue indicate sequences also found in PrSAG12 sequence).
TATA-box Arabidopsis thaliana 263 - TATAA
core promoter element around -30 of transcription start
TATA-box Arabidopsis thaliana 264 + TATA
core promoter element around -30 of transcription start
TATA-box
Arabidopsis
thaliana 271 - TATAAA
core promoter element around -30 of
transcription start
TATA-box Arabidopsis thaliana 272 + TATA
core promoter element around -30 of transcription start
TATA-box Arabidopsis thaliana 272 - TATAA
core promoter element around -30 of transcription start
TATA-box Arabidopsis thaliana 273 + TATA
core promoter element around -30 of transcription start
TATA-box Arabidopsis thaliana 623 + TATA
core promoter element around -30 of transcription start
TATA-box Arabidopsis thaliana 628 + TATA
core promoter element around -30 of transcription start
TATA-box Arabidopsis thaliana 709 + TATA
core promoter element around -30 of transcription start
TATA-box Arabidopsis thaliana 810 + TATAAA
core promoter element around -30 of transcription start
TATA-box Arabidopsis thaliana 819 - TATAA
core promoter element around -30 of transcription start
TATA-box Arabidopsis thaliana 820 + TATA
core promoter element around -30 of transcription start
TATA-box Arabidopsis thaliana 834 - TATAAAA
core promoter element around -30 of transcription start
TATA-box Arabidopsis thaliana 835 - TATAAA
core promoter element around -30 of transcription start
TATA-box Arabidopsis thaliana 836 - TATAA
core promoter element around -30 of transcription start
TATA-box Arabidopsis thaliana 837 + TATA
core promoter element
around -30 of transcription start
TATA-box Arabidopsis thaliana 895 - TATAAA
core promoter element around -30 of transcription start
TATA-box Arabidopsis thaliana 896 - TATAA
core promoter element around -30 of transcription start
TATA-box Arabidopsis thaliana 897 + TATA
core promoter element around -30 of transcription start

115
Table A1. (continued) A database search of the PrAnth17 sequence using PlantCARE
revealed the presence of regions involved in transcription regulation. (Rows
highlighted in blue indicate sequences also found in PrSAG12 sequence).
TATA-box Arabidopsis thaliana 1013 - TAAAGATT
core promoter element around -30 of transcription start
TATA-box Arabidopsis thaliana 1122 - TATAA
core promoter element around -30 of transcription start
TATA-box
Arabidopsis
thaliana 1123 + TATAAA
core promoter element around -30 of
transcription start
TATA-box Arabidopsis thaliana 1148 - TAAAAATAA
core promoter element around -30 of transcription start
TATA-box Arabidopsis thaliana 1190 + TATTTAAA
core promoter element around -30 of transcription start
TATA-box Brassica napus 818 + ATTATA
core promoter element around -30 of transcription start
TATA-box Brassica oleracea 622 + ATATAAT
core promoter element around -30 of transcription start
TATA-box Brassica oleracea 69 + ATATAA
core promoter element around -30 of transcription start
TATA-box Glycine max 14 - TAATA
core promoter element around -30 of transcription start
TATA-box Glycine max 144 - TAATA
core promoter element around -30 of transcription start
TATA-box Glycine max 166 - TAATA
core promoter element around -30 of transcription start
TATA-box Glycine max 173 + TAATA
core promoter element around -30 of transcription start
TATA-box Glycine max 185 + TAATA
core promoter element around -30 of transcription start
TATA-box Glycine max 235 - TAATA
core promoter element around -30 of transcription start
TATA-box Glycine max 275 + TAATA
core promoter element around -30 of transcription start
TATA-box Glycine max 625 + TAATA
core promoter element
around -30 of transcription start
TATA-box Glycine max 899 + TAATA
core promoter element around -30 of transcription start
TATA-box Glycine max 928 - TAATA
core promoter element around -30 of transcription start
TATA-box Glycine max 1187 + TAATA
core promoter element around -30 of transcription start

116
Table A1. (continued) A database search of the PrAnth17 sequence using PlantCARE
revealed the presence of regions involved in transcription regulation. (Rows
highlighted in blue indicate sequences also found in PrSAG12 sequence).
TATA-box Lycopersicon esculentum 11 + TTTTA
core promoter element around -30 of transcription start
TATA-box Lycopersicon esculentum 63 - TTTTA
core promoter element around -30 of transcription start
TATA-box
Lycopersicon
esculentum 72 - TTTTA
core promoter element around -30 of
transcription start
TATA-box Lycopersicon esculentum 141 + TTTTA
core promoter element around -30 of transcription start
TATA-box Lycopersicon esculentum 153 + TTTTA
core promoter element around -30 of transcription start
TATA-box Lycopersicon esculentum 169 - TTTTA
core promoter element around -30 of transcription start
TATA-box Lycopersicon esculentum 182 + TTTTA
core promoter element around -30 of transcription start
TATA-box Lycopersicon esculentum 358 - TTTTA
core promoter element around -30 of transcription start
TATA-box Lycopersicon esculentum 398 + TTTTA
core promoter element around -30 of transcription start
TATA-box Lycopersicon esculentum 401 - TTTTA
core promoter element around -30 of transcription start
TATA-box Lycopersicon esculentum 440 + TTTTA
core promoter element around -30 of transcription start
TATA-box Lycopersicon esculentum 443 - TTTTA
core promoter element around -30 of transcription start
TATA-box Lycopersicon esculentum 480 + TTTTA
core promoter element around -30 of transcription start
TATA-box Lycopersicon esculentum 483 - TTTTA
core promoter element around -30 of transcription start
TATA-box Lycopersicon esculentum 495 - TTTTA
core promoter element around -30 of transcription start
TATA-box Lycopersicon esculentum 506 - TTTTA
core promoter element
around -30 of transcription start
TATA-box Lycopersicon esculentum 661 - TTTTA
core promoter element around -30 of transcription start
TATA-box Lycopersicon esculentum 714 + TTTTA
core promoter element around -30 of transcription start
TATA-box Lycopersicon esculentum 717 - TTTTA
core promoter element around -30 of transcription start
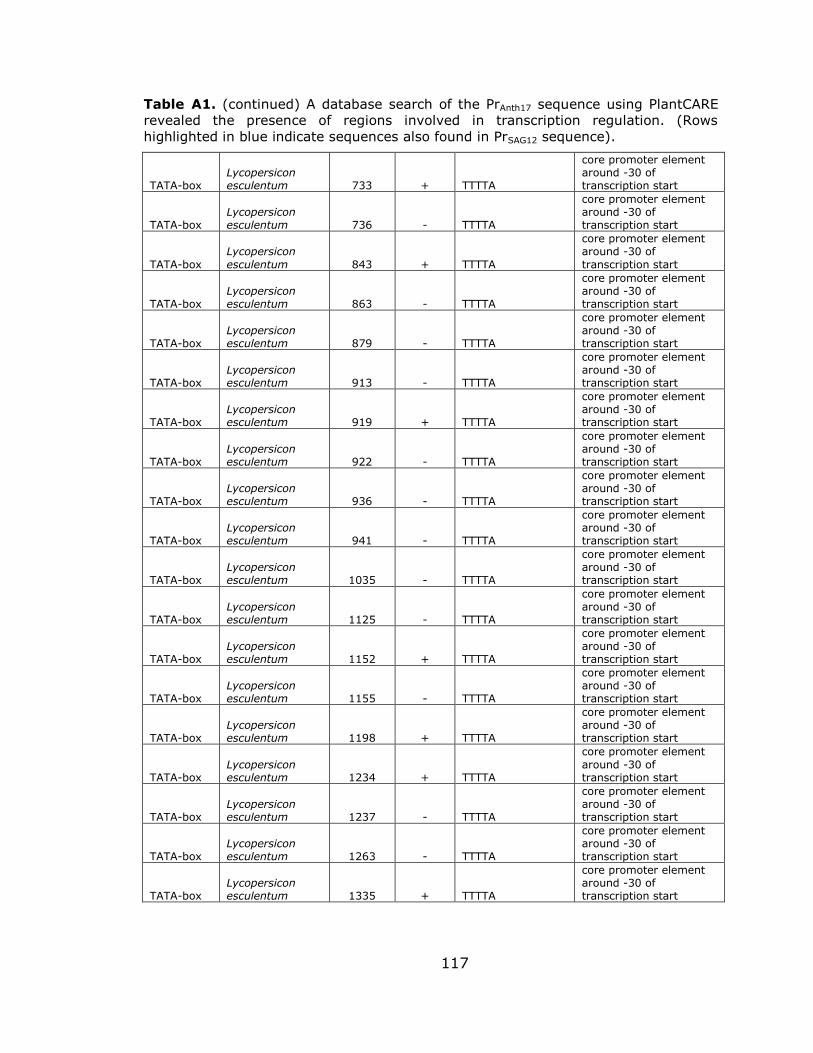
117
Table A1. (continued) A database search of the PrAnth17 sequence using PlantCARE
revealed the presence of regions involved in transcription regulation. (Rows
highlighted in blue indicate sequences also found in PrSAG12 sequence).
TATA-box Lycopersicon esculentum 733 + TTTTA
core promoter element around -30 of transcription start
TATA-box Lycopersicon esculentum 736 - TTTTA
core promoter element around -30 of transcription start
TATA-box
Lycopersicon
esculentum 843 + TTTTA
core promoter element around -30 of
transcription start
TATA-box Lycopersicon esculentum 863 - TTTTA
core promoter element around -30 of transcription start
TATA-box Lycopersicon esculentum 879 - TTTTA
core promoter element around -30 of transcription start
TATA-box Lycopersicon esculentum 913 - TTTTA
core promoter element around -30 of transcription start
TATA-box Lycopersicon esculentum 919 + TTTTA
core promoter element around -30 of transcription start
TATA-box Lycopersicon esculentum 922 - TTTTA
core promoter element around -30 of transcription start
TATA-box Lycopersicon esculentum 936 - TTTTA
core promoter element around -30 of transcription start
TATA-box Lycopersicon esculentum 941 - TTTTA
core promoter element around -30 of transcription start
TATA-box Lycopersicon esculentum 1035 - TTTTA
core promoter element around -30 of transcription start
TATA-box Lycopersicon esculentum 1125 - TTTTA
core promoter element around -30 of transcription start
TATA-box Lycopersicon esculentum 1152 + TTTTA
core promoter element around -30 of transcription start
TATA-box Lycopersicon esculentum 1155 - TTTTA
core promoter element around -30 of transcription start
TATA-box Lycopersicon esculentum 1198 + TTTTA
core promoter element around -30 of transcription start
TATA-box Lycopersicon esculentum 1234 + TTTTA
core promoter element
around -30 of transcription start
TATA-box Lycopersicon esculentum 1237 - TTTTA
core promoter element around -30 of transcription start
TATA-box Lycopersicon esculentum 1263 - TTTTA
core promoter element around -30 of transcription start
TATA-box Lycopersicon esculentum 1335 + TTTTA
core promoter element around -30 of transcription start

118
Table A1. (continued) A database search of the PrAnth17 sequence using PlantCARE
revealed the presence of regions involved in transcription regulation. (Rows
highlighted in blue indicate sequences also found in PrSAG12 sequence).
TATA-box Lycopersicon esculentum 1387 - TTTTA
core promoter element around -30 of transcription start
TATA-box Pisum sativum 833 - TATAAAAT
core promoter element around -30 of transcription start
TATA-box Zea mays 1151 - TTTAAAAA
core promoter element around -30 of
transcription start
TATA-box Zea mays 1233 - TTTAAAAA
core promoter element around -30 of transcription start
TATC-box Oryza sativa 704 - TATCCCA
cis-acting element involved in gibberellin-responsiveness
TCA-element
Nicotiana tabacum 287 - CCATCTTTTT
cis-acting element involved in salicylic acid responsiveness
Unnamed__1 Zea mays 1349 + CGTGG
Unnamed__2 Zea mays 289 + CCCCGG
Unnamed__2 Zea mays 333 + CCCCGG
Unnamed__3 Zea mays 1349 + CGTGG
Unnamed__4
Petroselinum hortense 1084 + CTCC
Unnamed__4
Petroselinum hortense 1462 - CTCC
Unnamed__4
Petroselinum hortense 1411 - CTCC
Unnamed__4
Petroselinum hortense 1473 + CTCC
Unnamed__4
Petroselinum hortense 24 + CTCC
Unnamed__4
Petroselinum hortense 296 + CTCC
Unnamed__4
Petroselinum hortense 230 + CTCC
Unnamed__4
Petroselinum hortense 375 - CTCC
Unnamed__4
Petroselinum hortense 107 + CTCC
Unnamed__4
Petroselinum hortense 304 + CTCC
Unnamed__4
Petroselinum hortense 256 + CTCC
Unnamed__4
Petroselinum hortense 49 + CTCC
Unnamed__4
Petroselinum hortense 126 + CTCC

119
Appendix B – Specific qPCR primers designed for the selected sequences
Table B1. qRT-PCR forward & reverse primers designed to amplify a
fragment of the selected sequences.
sequence identifier
protein name forward primer (5’-3’) reverse primer (5’-3’)
a41 ACC oxidase, ACO1, ACO2
TGCAGTTGCTCAAGGACGGAGAAT
AGGCGATGGACATTCTGTTACCGT
a175 ERD9 (EARLY-RESPONSIVE TO DEHYDRATION 9)
AGCATGGCTTGCTTGCTAAGAT
CG
TGAAAGGAGACCGCAGGA
GTTTCA
a218 callus protein P23 (translationally-controlled tumor protein-like protein)
AATGCAAACACCAAGCTCCCATCG
TGACTCCCAAGTTGGATGCTGAGA
a415 chitinase; glycoside hydrolase family 19 protein
CGGGCCGTAGTTGAAGTTGTATGA
TTCAAAGAAGAGCAAGGCAACCCG
a489 dormancy/auxin associated protein
AGATCTGCGAAACCCTTGCTCAGT
AAGGTGGAGTACTTGCGGAGCTTT
a650 glutamate dehydrogenase
AACCCAAGTGGCCTGGATATTCCT
CTTGGCCTTCACATCAGCAGCATT
a675 fructose-bisphosphate aldolase
AGAGAGGAACATGATGCCAGGAAC
TCTACATGGCCGAGAACAACGTGA
a717 light-harvesting complex I chlorophyll a/b binding
protein
ATGTTGGACCCAAGTCCTGCTA
CT
TGTCAGAAGAGCTGACTG
CTGCAT
a719 protein translation factor SUI1
TGCGCACATGCACATACTCTTTGG
TCAGCACTCGAGCAACTGATTGGA
a1073 TONOPLAST DICARBOXYLATE TRANSPORTER (TDT)
AACATTGGCGATTCTGATGCCCAC
AGTCTGATGGCACCGTAGACGAAA
a1111 glutathione peroxidase
ACCCGATTCAAGGCTGAATACCCT
GCATAGCGATCCACAACATTGCCT
a1199 PSBP-1 (PHOTOSYSTEM II SUBUNIT P-1)
AAGCTCTACATCTGCAAAGCGCAG
TGGCAGTCCTGGCATGTAACT
a3211 ubiquitin 13
GTTCTGTCATCATCCAGCTGCTTC
AAGGAGTCCACCCTCCATCTTGTT
a7025 esterase/lipase
TGGCAATAACGTGCTTGTGTGT
GG
AACCGATTCGACCCGATCT
AAGCA
a9173 xyloglucan endotransglucosylase/hydrolase protein
TGTGTTCTCGGTGGATGCGGT
AAT
TGTCGAAGTCCTTGTAGTA
GGCGT
a9943 phospholipase C
AGGTATGACGTGCCATCGTGAGAA
AAAGGCCACTGTAAGCAACTCGTG

120
LITERATURE CITED
Abreu E. & Munné-Bosch S. (2008). Salicylic acid may be involved in the regulation
of drought-induced leaf senescence in perennials: A case study in field-grown
Salvia officinalis L. plants. Environmental and Experimental Botany 64(2),
105–112.
Aharoni N. & Richmond A. (1978). Endogenous gibberellin and abscisic acid content
as related to senescence of detached lettuce leaves. Plant Physiol. 62(2),
224-228.
Ali S. & Bano A. (2008). Leaf and nodule senescence in chickpea (Cicer arietinum L.)
and the role of plant growth regulators. Pakistan Journal of Botany 40(6),
2841-2492.
Allison L.A. (2007). Fundamental Molecular Biology. John Wiley & Sons.
Aloni R., Langhans M., Aloni E. & Ullrich C. (2004). Role of cytokinin in the
regulation of root gravitropism. Planta 220, 177-182.
Amasino R., Powell A. & Gordon M. (1984). Changes in T-DNA methylation and
expression are associated with phenotypic variation and plant regeneration in
a crown gall tumor line. Molecular and General Genetics MGG 197(3), 437-
446.
Amir-Shapira D., Goldschmidt E. & Altman A. (1987). Chlorophyll catabolism in
senescing plant tissues; In vivo breakdown intermediates suggest different
degradative pathways for Citrus fruit and parsley leaves. Proc. Natl. Acad. Sci.
USA 84, 1901-1905.

121
Arbona V. & Gómez-Cadenas A. (2008). Hormonal modulation of citrus responses to
flooding. Journal of Plant Growth Regulation 27(3), 241-250.
Aro E-M., Virgin I. & Andersson B. (1993). Photoinhibition of photosystem II.
Inactivation, protein damage and turnover. Biochim. Biophys. Acta 1143,
113-134.
Ay N., Clauss K., Barth O. & Humbeck K. (2008). Identification and characterization
of novel senescence-associated genes from barley (Hordeum vulgare) primary
leaves. Plant Biology 10(s1), 121-135.
Ayub R., Guis M., Ben Amor M., Gillot L., Roustan J-P., Latché A., Bouzayen M. &
Pech J-C. (1996). Expression of ACC oxidase antisense gene inhibits ripening
of cantaloupe melon fruits. Nature Biotechnology 14, 862-866.
Barry G.F., Rogers S.G., Fraley R.T. & Brand L. (1984). Identification of a cloned
cytokinin biosynthetic gene. Proc. Natl. Acad. Sci. USA 81, 4776-4780.
Belknap W.R. & Garbarino J.E. (1996). The role of ubiquitin in plant senescence and
stress responses. Trends in Plant Science 1(10), 331-335.
Bewley D.J. (1997). Seed germination and dormancy. Plant Cell 9(7), 1055–1066.
Bhat S. & Srinivasan S. (2002). Molecular and genetic analyses of transgenic plants:
considerations and approaches. Plant Science 163, 673-681.
Blochlinger K. & Diggelmann H. (1984). Hygromycin B phosphotransferase as a
selectable marker for DNA transfer experiments with higher eucaryotic cells.
Mol. Cell. Biol. 4(12), 2929-2931.

122
Boisson M., Gomord V., Audran C., Berger N., Dubreucq B., Granier F., Lerouge P.,
Faye L., Caboche M. & Lepiniec L. (2001). Arabidopsis glucosidase I mutants
reveal a critical role of N-glycan trimming in seed development. The EMBO
Journal 20, 1010 – 1019.
Bown D. (2000). Aroids: Plants of the Arum Family 2nd edition. Portland OR, Timber
Press, Inc.
Brady C.J. (1988). Nucleic acid and protein synthesis. Senescence and Aging in
Plants. L. Nooden and A. Leopold. San Diego CA, Academic Press, 147-179.
Bressan R.A., Zhang C., Zhang H., Hasegawa P.M., Bohnert H. J. & Zhu J.K. (2001).
Learning from the Arabidopsis experience: the next gene search paradigm.
Plant Physiology 127, 1354–1360.
Broglie K., Biddle P., Cressman R. & Broglie R. (1989). Functional analysis of DNA
sequences responsible for ethylene regulation of a bean chitinase gene in
tobacco. Plant Cell 1, 599-607.
Brosnan C.A., Mitter N., Christie M., Smith N.A., Waterhouse P.M. & Carroll B.J.
(2007). Nuclear gene silencing directs reception of long-distance mRNA
silencing in Arabidopsis. PNAS 104, 14741–14746.
Buchanan-Wollaston V., Earl S., Harrison E., Mathas E., Navabpour S., Page T. &
Pink D. (2003). The molecular analysis of leaf senescence – a genomics
approach. Plant Biotechnology Journal 1, 3–22.
Buchanan-Wollaston V., Page T., Harrison E., Breeze E., Lim P.O., Nam H.G., Lin
J.F., Wu S.H., Swidzinski J., Ishizaki K., & Leaver C.J. (2005). Comparative
transcriptome analysis reveals significant differences in gene expression and

123
signalling pathways between developmental and dark/starvation-induced
senescence in Arabidopsis. The Plant Journal 42, 567-585.
Bustamante C., Civello P. & Martínez G. (2009). Cloning of the promoter region of β-
xylosidase (FaXyl1) gene and effect of plant growth regulators on the
expression of FaXyl1 in strawberry fruit. Plant Science 177(1), 49–56.
Calderini O., Bovone T., Scotti C., Pupilli F., Piano E. & Arcioni S. (2007). Delay of
leaf senescence in Medicago sativa transformed with the ipt gene controlled
by the senescence-specific promoter SAG12. Plant Cell Reports 26(5), 611-
615.
Carimi F., Terzi M., De Michele R., Zottini M. & Lo Schiavo F. (2004). High levels of
the cytokinin BAP induce PCD by accelerating senescence. Plant Science 166,
963-969.
Cercos M., Santamaria S. & Carbonell J. (1999). Cloning and characterization of
TPE4A, a thiol-protease gene induced during ovary senescence and seed
germination in pea. Plant Physiology 119, 1341-1348.
Chaitanya K.S.K. & Naithani S.C. (1994). Role of superoxide, lipid peroxidation and
superoxide dismutase in membrane perturbation during loss of viability in
seeds of Shorea robusta Gaertn.f. New Phytologist 126, 623–627.
doi: 10.1111/j.1469-8137.1994.tb02957.x
Champagne M.M. & Kuehnle A.R. (2000). An effective method for isolating RNA from
tissues of Dendrobium. Lindleyana 15, 165-168.
124
Chandler P. & Robertson M. (1994). Gene expression regulated by abscisic acid and
its relation to stress tolerance. Annual Review of Plant Physiology and Plant
Molecular Biology 45, 113-141.
Chang H., Jones M.L., Banowetz G.M. & Clark D.G. (2003). Overproduction of
cytokinins in petunia flowers transformed with P(SAG12)-IPT delays corolla
senescence and decreases sensitivity to ethylene. Plant Physiol 132(4), 2174-
83.
Chen F.C. & Kuehnle A.R. (1996). Obtaining transgenic Anthurium through
Agrobacterium-mediated transformation of etiolated internodes. Journal of
the American Society of Horticultural Science 121, 47-51.
Chen G.H., Huang L.T., Yap M.N., Lee R.H., Huang Y.J., Cheng M.C. & Chen, S.C.G.
(2002). Molecular characterization of a senescence-associated gene encoding
cysteine proteinase and its gene expression during leaf senescence in sweet
potato. Plant and Cell Physiology 43(9), 984-991.
Chen H.J., Huang G.J., Chen W.S., Su C.T., Hou W.C. & Lin Y.H. (2009). Molecular
cloning and expression of a sweet potato cysteine protease SPCP1 from
senescent leaves. Botanical Studies 50(2), 159-170.
Chen L.F.O., Hwang J.Y., Charng Y.Y., Sun C.W. & Yang S.F. (2001). Transformation
of broccoli (Brassica oleracea var. italica) with isopentenyltransferase gene
via Agrobacterium tumefaciens for post-harvest yellowing retardation.
Molecular Breeding: new strategies in plant improvement 7(3), 243-257.

125
Chi G., Goh H.K.L., Hoo K. & Legavre T. (1998). Gus gene expression in Anthurium
andreanum, Oncidium Gower Ramsey and Brassolaeliocattleya Orange Glory
Empress after particle bombardment. Acta Hort. (ISHS) 461, 379-384.
Christopher D.A. & Mullet J.E. (1994). Separate photosensory pathways co-regulate
blue light/ultraviolet-A-activated psbD-psbC transcription and light-induced
D2 and CP43 degradation in barley (Hordeum vulgare) chloroplasts. Plant
Physiol. 104, 1119-1129.
Chytilova E., Macas J. & Galbraith D. (1999). Green fluorescent protein targeted to
the nucleus, a transgenic phenotype useful for studies in plant biology. Annals
of Botany 83, 645-654.
Clark D., Dervinis C., Barrett J., Klee H. & Jones M. (2004). Drought-induced leaf
senescence and horticultural performance of transgenic PSAG12-IPT petunias. J.
Amer. Soc. Hort. Sci. 129(1), 93-99.
Clough S. J. & Bent A. F. (1998). Floral dip: a simplified method for Agrobacterium-
mediated transformation of Arabidopsis thaliana. The Plant Journal 16, 735–
743.
Cocking E.C. (1960). A Method for the isolation of plant protoplasts and vacuoles.
Nature 187, 962 – 963.
Cocking E.C. (1972). Plant cell protoplasts-isolation and development. Annual Review
of Plant Physiology (23), 29-50.
Costa G. & Weiner M. (1994). Polishing with T4 or Pfu polymerase increases the
efficiency of cloning of PCR fragments. Nucleic Acids Research 22(12), 2423.

126
Costa V., Angelini C., De Feis I. & Ciccodicola A. (2010). Uncovering the complexity
of transcriptomes with RNA-Seq. Journal of Biomedicine and Biotechnology.
Hindawi Publishing Corporation, Volume 2010, Article ID 853916, 19 pages.
doi:10.1155/2010/853916
Crafts-Brandner S.J., Salvucci M.E. & Egli D.B. (1990). Changes in ribulose
bisphosphate carboxylase/oxygenase and ribulose 5-phosphate kinase
abundances and photosynthetic capacty during leaf senescence. Photosyn.
Res. 23, 223-230.
Dai J. & Paull R. (1990). The role of leaf development on Anthurium flower growth. J.
Amer. Soc. Hort. Sci. 115(6), 901-905.
Daum H. & Seville M. (2002). The ToolBox: Cutting back on UV damage. Modern
Drug Discovery 5, 18-24.
De Beer A. & Vivier M.A. (2008). Vv-AMP1, a ripening induced peptide from Vitis
vinifera shows strong antifungal activity. Plant Biology 8, 75.
Dean C., Jones J., Favreau M., Dunsmuir P. & Bedbrook J. (1988). Influence of
flanking sequences on variability in expression levels of an introduced gene in
transgenic tobacco plants. Nucleic Acids Research 16 (19), 9267-9283.
Deikman J. & Fischer R. (1988). Interaction of a DNA binding factor with the 5'-
flanking region of an ethylene-responsive fruit ripening gene from tomato.
EMBO Journal 7, 3315-3320.
Derbyshire E., Wright D.J. & Boulter D. (1976). Legumin and vicilin, storage proteins
of legume seeds. Phytochemistry 15, 3–24.

127
Di R., Purcell V., Collins G.B. & Ghabrial S.A. (1996). Production of transgenic
soybean lines expressing the bean pod mottle virus coat protein precursor
gene. Plant Cell Rep 15, 746-750.
Drøbak B. K., Watkins P. A.C., Valenta R., Dove S. K., Lloyd C. W. & Staiger, C. J.
(1994). Inhibition of plant plasma membrane phosphoinositide phospholipase
C by the actin-binding protein, profilin. The Plant Journal, 6: 389–400.
Droillard M.J., Bate N.J., Rothstein S.J. & Thompson J.E. (1992). Active translation of
the D1 protein of photosystem II in senescing leaves. Plant Physiology 99,
589-594.
Dufour L. & Guerin V. (2003). Growth, developmental features and flower production
of Anthurium andreanum Lind. in tropical conditions. Scientia Horticulturae 98,
25–35.
Düggelin M.J., Bortlik K., Gut H., Matile P. & Thomas H. (1988). Leaf senescence in
Festuca pratensis: accumulation of lipofuscin-like compounds. Physiolog. Plant.
74, 131-136.
Elliott A.R., Campbell J.A., Dugdale B., Brettell R.I.S. & Grof C.P.L. (1999). Green-
fluorescent protein facilitates rapid in vivo detection of genetically
transformed plant cells. Plant cell reports 18(9), 707-714.
Espinoza C., Medina C., Somerville S. & Arce-Johnson P. (2007). Senescence-
associated genes induced during compatible viral interactions with grapevine
and Arabidopsis. Journal of Experimental Botany 58(12), 3197-3212.

128
Fang R-X., Nagy F., Sivasubramaniam S., & Chua N-H. (1989). Multiple cis
regulatory elements for maximal expression of the cauliflower mosaic virus
35S promoter in transgenic plants. The Plant Cell 1, 141-150.
Farrant J.M., Pammenter N.W. & Berjak P. (1988). Recalcitrance - a current
assessment. Seed Science & Technology 16, 155-156.
Ferguson I.B., Watkins C.B. & Harman J.R. (1983). Inhibition by calcium of
senescence of detached cucumber cotyledons. Plant Physiology 71, 182-186.
Fei H., Tsang E. & Cutler A. (2007). Gene expression during seed maturation in
Brassica napus in relation to the induction of secondary dormancy. Genomics
89(3), 419–428.
Fitch M., Leong T., He X., McCafferty H., Zhu Y., Moore P., Gonsalves D., Aldwinckle
H. & Atkinson H. (2011). Improved transformation of Anthurium. HortScience
46(3), 358–364.
Flores H., Dai Y-R., Cuello J., Maldonado-Mendoza I. & Loyola-Vargas V. (1993).
Green roots: photosynthesis and photoautotrophy in an underground plant
organ. Plant Physiol. 101, 363-371.
Fu Y., Ding Y., Liu X., Sun C., Cao S., Wang D., He S., Wang X., Li L. & Tian W.
(1998). Rice transformation with a senescence-inhibition chimeric gene.
Chinese Science Bulletin 43, 1810-1815.
Galun E. (1981). Plant protoplasts as physiological tools. Annual Review of Plant
Physiology 32, 237-266.
Gan S. & Amasino R. (1995). Inhibition of leaf senescence by autoregulated
production of cytokinin. Science 270, 1986-1988.

129
Gapper N.E., McKenzie M.J., Christey M.C., Braun R.H., Coupe S.A., Lill R.E. &
Jameson P.E. (2002). Agrobacterium tumefaciens-mediated transformation to
alter ethylene and cytokinin biosynthesis in broccoli. Plant Cell, Tissue and
Organ Culture 70, 41–50.
Gassmann M. & Ramanujam P. (1986). Relation between destruction of magnesium
porphyrins and chloroplast development. Akoyuniglou G. & Senger H.
Regulation of Chloroplast Differentiation. New York, AL. Liss, p. 115-123.
Gelvin S. (2008). Agrobacterium-mediated DNA transfer, and then some. Nature
Biotechnology 26(9), 998-1000.
Genua J. & Hillson C. (1985). The occurrence, type and location of calcium oxalate
crystals in the leaves of fourteen species of Araceae. Ann Bot 56(3), 351-361.
Gheysen G., Van Montagu M. & Zambryski P. (1987). Integration of Agrobacterium
tumefaciens transfer DNA (T-DNA) involves rearrangements of target plant
DNA sequences. Proc. Nadl. Acad. Sci. USA 84, 6169-6173.
Gilbart D. & Sink K. (1971). Regulation of endogenous indoleacetic acid and keeping
quality of poinsettia. Journal of American Society of Horticultural Science 96,
3-7.
Guo J., Hu X. & Duan R. (2005). Interactive effects of cytokinins, light and sucrose
on the phenotypes and the syntheses of anthocynanins and lignins in
cytokinin overproducing transgenic Arabidopsis. Journal of Plant Growth
Regulation 24, 93-101.

130
Grotewold E., Chamberlin M., Snook M., Siame B., Butler L., Swenson J., Maddock S.,
St. Clair G. & Bowen B. (1998). Engineering secondary metabolism in maize
cells by ectopic expression of transcription factors. The Plant Cell 10, 721–740.
Grudkowska M. & Zagdanska B. (2004). Multifunctional role of plant cysteine
proteinases. Acta Biochimica Polonica 51(3), 609-624.
Hajlaouia H., El Ayebb N., Garrecc J. & Denden M. (2010). Differential effects of salt
stress on osmotic adjustment and solutes allocation on the basis of root and
leaf tissue senescence of two silage maize (Zea mays L.) varieties. Industrial
Crops and Products 31(1), 122–130.
Halevy A. & Mayak S. (1981). Senescence and postharvest physiology of cut flowers.
Horticultural Review 3, 59-143.
Halweg C., Thompson W.F. & Spiker S. (2005). The Rb7 matrix attachment region
increases the likelihood and magnitude of transgene expression in tobacco
cells: a flow cytometric study. The Plant Cell 17, 418-429.
Hara-Nishimura I., Shimada T., Hiraiwa N. & Nishimura M. (1995). Vacuolar
processing enzyme responsible for maturation of seed proteins. J. Plant
Physiol. 145, 632-640.
Haseloff J., Siemering K.R., Prasher D.C. & Hodge S. (1997). Removal of a cryptic
intron and subcellular localization of green fluorescent protein are required to
mark transgenic Arabidopsis plants brightly. Proc. Natl. Acad. Sci. USA 94,
2122–2127.
Haseloff J. (1999). GFP variants for multispectral imaging of living cells. Methods Cell
Biol. 58, 139-51.

131
Haseloff J., Dormand E.L. & Brand A.H. (1999). Live imaging with green fluorescent
protein. Methods Mol Biol 122, 241–259.
Hassanein R.A., El-din A.B., Salama M. & Hashem H. (2009). Role of jasmonic acid
and abscisic acid treatments in alleviating the adverse effects of drought
stress and regulating trypsin inhibitor production in soybean plant. Australian
Journal of Basic and Applied Sciences 3(2), 904-919.
Haughn G. & Chaudhury A. (2005). Genetic analysis of seed coat development in
Arabidopsis. TRENDS in Plant Science 10(10), 472-477.
Hawker N.P. & Bowman J.L. (2004). Roles for class III HD-Zip and KANADI genes in
Arabidopsis root development. Plant Physiology 135(4), 261-2270.
Hayden D. (2003). Characterization of senescence regulated gene expression in
anthurium. Ph.D. Thesis. University of Hawaii at Manoa, USA.
Hayden D. & Christopher D. (2004). Characterization of senescence-associated gene
expression and senescence-dependent and –independent cysteine proteases
differing in microsomal processing in Anthurium. Plant Science 166, 779-790.
Heiman M. (1997). "Webcutter 2.0." Webcutter 2.0. Web.
<http://rna.lundberg.gu.se/cutter2/>.
Hellens R. & Mullineaux P. (2000). A guide to Agrobacterium binary Ti vectors.
Trends in Plant Science 5(10), 446-451.
Hendry G.A.F., Finch-Savage W.E., Thorpe P.C., Atherton N.M., Buckland S. M.,
Nilsson K.A. & Seel W.E. (1992). Free radical processes and loss of seed
viability during desiccation in the recalcitrant species Quercus robur L. New
Phytologist 122, 273–279. doi: 10.1111/j.1469-8137.1992.tb04231.x

132
Hewelt A., Prinsen E., Schell J., Van Onckelen H. & Schmulling T. (1994). Promoter
tagging with a promoterless ipt gene leads to cytokinininduced phenotypic
variability in transgenic tobacco plants: implications of gene dosage effects.
Plant Journal 6, 879–891.
Higaki T., Rasmussen H.P. & Carpenter W.J. (1984). A study of some morphological
and anatomical aspects of Anthurium andreanum Lind. Hawaii Institute of
Tropical Agriculture and Human Resources Research series 30, College of
Tropical Agriculture and Human Resources, University of Hawaii.
Higaki T., Watson D. & Leonhardt K. (1985). Anthurium culture in Hawaii.
C.T.A.H.R.-U.H. Manoa.
Higaki T., Lichty J. & Moniz D. (1995). Anthurium culture in Hawaii. Research
extension series 152, HITAHR, CTAHR, UH Manoa.
Hinchee M.A.W., Connor-Ward D.V., Newell C.A., McDonnell R.E., Sato S.J., Gasser
C.S., Fischhoff D.A., Re D.B., Fraley R.T. & Horsch R.B. (1988). Production of
transgenic soybean plants using Agrobacterium-mediated DNA transfer.
Bio/Technology 6, 915–922.
Holsters M., Waele D., Depicker A., Montagu M. & Schell J. (1978). Transfection and
transformation of Agrobacterium tumefaciens. Molecular and General Genetics
163, 181-187.
Hurth M., Suh S-J., Kretzschmar T., Geis T., Bregante M., Gambale F., Martinoia E.,
and Neuhaus H.E. (2005). Impaired pH homeostasis in Arabidopsis lacking
the vacuolar dicarboxylate transporter and analysis of carboxylic acid
transport across the tonoplast. Plant Physiology 137, 901–910.
133
Hutzler P., Fischbach R., Heller W., Jungblut T., Reuber S., Schmitz R., Veit M.,
Weissenbock G. & Schnitzler J. (1998). Tissue localization of phenolic
compounds in plants by confocal laser scanning microscopy. Journal of
Experimental Botany 49(323), 953–965.
Huynh L.N., VanToai T., Streeter J. & Banowetz G. (2005). Regulation of flooding
tolerance of SAG12:ipt Arabidopsis plants by cytokinin. J. Exp. Bot. 56(415),
1397-1407.
Ilegems M., Douet V., Meylan-Bettex M., Uyttewaal M., Brand L., Bowman J.L.
& Stieger P.A. (2010). Interplay of auxin, KANADI and Class III HD-ZIP
transcription factors in vascular tissue formation. Development 137(6), 975-
84.
Iordachescu M., Bowman H., Sasaki K., Imai R., Satoh S. & Verlinden S. (2009).
Subcellular localization and changes in mRNA abundance of CEBP, a nuclear-
encoded chloroplast protein, during flower development and senescence.
Journal of Plant Biology 52(5), 365-373.
Itzhaki H., Maxson J. & Woodson W. (1994). An ethylene-responsive enhancer
element is involved in the senescence-related expression of the carnation
glutathione-Stransferase (GSTI) gene. Proc. Nadl. Acad. Sci. USA 91, 8925-
8929.
Jaiswal R., Nain V., Abdin M. & Kumar P. (2007). Isolation of pigeon pea (Cajanus
cajan L.) legumin gene promoter and identification of conserved regulatory
elements using tools of bioinformatics. Indian Journal of Biotechnology 6,
495-503.
134
Jenkins G. & Woolhouse H.W. (1981). Photosynthetic electron transport during
senescence of the primary leaves of Phaseolus vulgaris L. J. Exp. Bot. 32,
467-478.
Jones M.L. & Banowetz G.M. (2003). Elevated cytokinin levels in SAG12-IPT petunias
delay flower senescence and decrease sensitivity to ethylene. American
Society for Horticultural Science (Abstract only submission).
Judd W.S., Campbell C.S., Kellog E.A., Stevens P.F. & Donoghue M.J. (2002). Plant
Systematics: A Phylogenetic Approach, 2nd Edition. Sunderland MA, Sinauer
Associates Inc., 244.
Jyothishwaran G., Kotresha D., Selvaraj T., Srideshika, S.M., Rajvanshi P.K. &
Jayabaskaran C. (2007). A modified freeze-thaw method for efficient
transformation of Agrobacterium tumefaciens. Current Science 93(6), 770-
772.
Kamemoto H. & Kuehnle A. (1996). Breeding anthuriums in Hawaii. Honolulu HI,
University of Hawaiʻi Press.
Kang J., Choi H., Im M. & Kim S.Y. (2002). Arabidopsis basic leucine zipper proteins
that mediate stress-responsive abscisic acid signaling. The Plant Cell 14, 343-
357.
Kariola T., Brader G., Helenius E., Li J., Heino P. & Palva E.T. (2006). EARLY
RESPONSIVE TO DEHYDRATION 15, a negative regulator of abscisic acid
responses in arabidopsis. Plant Physiology 142(4), 1559-1573.
Kasprzewska A. (2003). Plant chitinases – regulation and function. Cellular &
Molecular Biology Letters 8, 809 – 824.

135
Kelly J. & Darlington G. (1987). Hybrid genes: molecular approaches to tissue-
specific gene regulation. Ann. Rev. Genet. 19, 273-96.
Kende H. (1993). Ethylene biosynthesis. Annual Review of Plant Physiology and Plant
Molecular Biology 44, 283-307.
Khaithong T., Sipes B.S. & Kuehnle A.R. (2007) Transgenic Anthurium andraeanum
expressing modified rice cysteine protease inhibitor and resistance to
Radopholus similis. In: Society of Nematologists 46th Annual Meeting, San
Diego, California, July 28-August 1, 2007. Journal of Nematology 39(1), 99-
100.
Khaithong T. (2007). Transgenic expression of proteinase inhibitors and resistance to
migratory endoparasitic nematodes. Ph.D.Thesis. University of Hawai'i at
Manoa, USA.
Kim W. & Okita T. (1988). Structure, expression, and heterogeneity of the rice seed
prolamines. Plant Physiol. 88, 649-655.
Kiyosue T., Yamaguchi-Shinozaki K. & Shinozaki K. (1994). Cloning of cDNAs for
genes that are early-responsive to dehydration stress (ERDs) in Arabidopsis
thaliana L.: identification of three ERDs as HSP cognate genes. Plant
Molecular Biology 25(5), 791-798.
Klink V.P., Kim K.H., Martins V., MacDonald M.H., Beard H.S., Alkharouf N.W., Lee
S.K., Park S.C., Matthews B.F. (2009) A correlation between host-mediated
expression of parasite genes as tandem inverted repeats and abrogation of
development of female Heterodera glycines cyst formation during infection of
Glycine max. Planta 230(1), 53-71.

136
Konishi H., Yamane H., Maeshima M. & Komatsu S. (2004). Characterization of
fructose-bisphosphate aldolase regulated by gibberellin in roots of rice
seedling. Plant Molecular Biology 56(6), 839-848.
Krishnan H. & Okita T. (1986). Structural relationship among the rice glutelin
polypeptides. Plant Physiol 81: 748-753.
Krupinska K. & Falk J. (1994). Changes in RNA polymerase activity during
biogenesis, maturation and senescence of barley chloroplasts. Comparative
analysis of transcripts synthesized either in run-on assays or by
transcriptionally active chromosomes. J of Plant Physiol 143:298-305.
Kuderova A., Urbankova I., Valkova M., Malbeck J., Brzobohaty B., Nemethova D. &
Hejatko J. (2008). Effects of conditional IPT-dependent cytokinin
overproduction on root architecture of arabidopsis seedlings. Plant Cell Physiol.
49(4), 570–582.
Kuehnle A.R., Chen F.C. & Sugii N.C. (2001). Transgenic Anthurium. Y. Bajaj.
Biotechnology in Agriculture and Forestry. Berlin, Springer-Verlag, 379.
Kumar N., Srivastava G.C. & Dixit K. (2008). Hormonal regulation of flower
senescence in roses (Rosa hybrida L.). Plant Growth Regulation 55, 65-71.
Kumar G., Mamidala P. & Podile A. (2009). Regulation of Polygalacturonase-
inhibitory proteins in plants is highly dependent on stress and light responsive
elements. Plant Omics Journal 2(6), 238-249.
Laemmli U.K. (1970). Cleavage of structural proteins during the assembly of the
head of bacteriophage T4. Nature 227, 680 – 685.

137
Lalonde L. & Dhindsa R.S. (1990). Altered protein synthesis during in situ oat leaf
senescence. Physiol. Plant 80, 619-623.
Larkin P.J. (1976). Purification and viability determinations of plant protoplasts.
Planta 128(3), 213-216.
Leary J., Brigati D. & Ward D. (1983). Rapid and sensitive colorimetric method for
visualizing biotinlabeled DNA probes hybridized to DNA or RNA immobilized on
nitrocellulose: Bio-blots. Proc. Natl Acad. Sci. USA 80, 4045-4049.
Lee R.H., Wang C.H., Huang L.T. & Chen S.C.G. (2001). Leaf senescence in rice
plants: cloning and characterization of senescence up-regulated genes.
Journal of Experimental Botany 52(358), 1117-1121.
Leshem Y., Halevy A. & Frenkel C. (1986). Processes and Control of Plant
Senescence. Vol. 8. Elsevier Science Publishers.
Leshem Y. (1992). Plant membranes: a biophysical approach to structure,
development and senescence. Dordrecht, The Netherlands, Kluwer Academic
Publishers, 266.
Li X., Mo X., Shou H. & Wu P. (2006). Cytokinin-mediated cell cycling arrest of
pericycle founder cells in lateral root initiation of Arabidopsis. Plant Cell
Physiol 47, 1112–1123.
Lieberman M. (1979). Biosynthesis and action of ethylene. Ann Rev Plant Physiol 30,
533-591.
Lim P.O., Woo H.R. & Nam H.G. (2003). Molecular genetics of leaf senescence in
Arabidopsis. TRENDS in Plant Science 8(6), 272-278.

138
Lim P.O. & Nam H.G. (2005). The molecular and genetic control of leaf senescence
and longevity in Arabidopsis. Current Topics in Developmental Biology 67, 49-
83.
Lim P-O., Kim H-J., & Nam H-G. (2007). Leaf Senescence. Annu. Rev. Plant Biol. 58,
115–36.
Lin Y.J., Cao M.L., Xu C.G., Chen H., Wei J. & Zhang Q.F. (2002). Cultivating rice
with delaying leaf- senescence by PSAG12-ipt gene transformation. Acta Bot
Sin 44, 1333–1338.
Lipton W.J. (1987). Senescence of leafy vegetables. HortSci. 22(5), 854-859.
Livak K. & Schmittgen T. (2001). Analysis of relative gene expression data using
real-time quantitative PCR and the 2−ΔΔCT method. Methods 25(4), 402–408.
Logemann E. & Hahlbrock K. (2002). Crosstalk among stress responses in plants:
Pathogen defense overrides UV protection through an inversely regulated
ACEACE type of light-responsive gene promoter unit. PNAS 99(4), 2428 –
2432.
Lohman K., Gan S., John M. & Amasino R. (1994). Molecular analysis of natural leaf
senescence in Arabidopsis thaliana. Physiol Plantarum 92, 322-328.
Lu J., Sivamani E., Li X. & Qu R. (2008). Activity of the 5' regulatory regions of the
rice polyubiquitin rubi3 gene in transgenic rice plants as analyzed by both
GUS and GFP reporter genes. Plant Cell Rep 27, 1587–1600.
Lubec G., Afjehi-Sadat L., Yang J-W. & John J.P.P. (2005).Searching for hypothetical
proteins: Theory and practice based upon original data and literature.
Progress in Neurobiology 77, 90–127.

139
Lundberg K., Shoemaker D., Adams M., Short J., Sorge J. & Mathur E. (1991). High-
fidelity amplification using a thermostable DNApolymerase isolated from
Pyrococcus furiosus. Gene 108(1), 1–6
Ma Q.H. (2008). Genetic engineering of cytokinins and their application to agriculture.
Critical Reviews in Biotechnology 28: 213-232.
Makino A., Mae T. & Ohira K. (1983). Photosynthesis and ribulose-1,5-bisphosphate
carboxylase in rice leaves. Changes in photosynthesis and enzymes involved
in carbon assimilation from leaf development through senescence. Plant
Physiol. 73: 1002-1007.
Mankin S.L. & Thompson W.F. (2001). New green fluorescent protein genes for plant
transformation: intron-containing, ER-localized, and soluble-modified. Plant
Molecular Biology Reporter 19(1), 13-26.
Mardis E. (2008). The impact of next-generationsequencing technology on genetics.
Trends in Genetics 24(3), 133–141.
Matile P. (1992). Chloroplast senescence. Baker N & Thomas H. Crop photosynthesis
spatial and temporal determinants. Amsterdam, Elsevier, 413-440.
Matsumoto T., Kuehnle A. & Webb D. (1998). Zygotic embryogenesis in Anthurium
(Araceae). American Journal of Botany 85(11), 1560–1568.
Mattoo A.K. & Aharoni N. (1988). Ethylene and plant senescence. L. Nooden & A.
Leopold. Senescence and aging in plants. San Diego CA, Academic Press, Inc.,
241-280.
Mattoo A.K., Marder J.B. & Edelman M. (1989). Dynamics of the photosystem II
reaction center. Cell 56, 241-246.

140
Mauch-Mani B. & Mauch F. (2005). The role of abscisic acid in plant–pathogen
interactions. Current Opinion in Plant Biology 8(4), 409–414.
Mayak S. & Halevy A. (1970). Cytokinin activity in rose petals and its relation to
senescence. Plant Physiol. 46(4), 497–499.
Mayfield S.P., Yohn C.B., Cohen A. & Danon A. (1995). Regulation of chloroplast
gene expression. Annu Rev Plant Physiol Plant Mol Biol 46, 147-166.
McCabe M., Garratt L., Schepers F., Jordi W., Stoopen G., Davelaar E., van Rhijn J.H.,
Power J.B. & Davey M. (2001). Effects of PSAG12-IPT gene expression on
development and senescence in transgenic lettuce. Plant Physiology 127,
505-516.
McGaw B,A. (1987). “Cytokinin metabolism”. R. Horgan & B. Jeffcoat. Cytokinins –
Plant hormones in search of a role, Monograph 14. Bristol, British Plant
Growth Regulator Group, 9-17.
McNellis T., Mudgett M., Li K., Aoyama T., Horvath D., Chua N-H. & Staskawicz B.
(1998). Glucocorticoid-inducible expression of a bacterial avirulence gene in
transgenic Arabidopsis induces hypersensitive cell death. The Plant Journal
14(2), 247-257.
Medford J.I., Horgan R.H., El-Sawi Z. & Klee, H.J. (1989). Alterations of endogenous
cytokinins in transgenic plants using a chimeric isopentenyl transferase gene.
Plant Cell 1, 403–413.
Melis A. (1991). Dynamics of photosynthetic membrane composition and function.
Biochim. Biophys. Acta. 1058, 87-106.

141
Merewitz B., Gianfagna T. & Huang B. (2010). Effects of SAG12-ipt and HSP18.2-ipt
expression on cytokinin production, root growth, and leaf senescence in
creeping bentgrass exposed to drought stress. J. Amer. Soc. Hort. Sci. 135(3),
230–239.
Meyer P., Linn F., Heidmann I., Meyer H., Niedenhof I. & Saedler H. (1992).
Endogenous and environmental factors influence 35S promoter methylation of
a maize A1 gene construct in transgenic petunia and its colour phenotype.
Molecular and General Genetics MGG 231(3), 345-352.
Milla M. A. R., Maurer A., Huete A. R. & Gustafson J. P. (2003). Glutathione
peroxidase genes in Arabidopsis are ubiquitous and regulated by abiotic
stresses through diverse signaling pathways. The Plant Journal 36(5), 602–
615.
Misr A. & Meena M. (1986). Effect of temperature on senescing detached rice leaves:
I. photoelectron transport activity of chloroplasts. Plant Science 46, 1-4.
Montgomery J., Goldman S., Deikman J., Margossian L. & Fischer R. (1993).
Identification of an ethylene-responsive region in the promoter of a fruit
ripening gene. PNAS 90, 5939-5943.
Morita K. (1980). Release of nitrogen from chloroplasts during leaf senescence in rice
(Oryza sativa L.). Annal. Botany 46, 297-302.
Morris K., MacKerness S.A., Page T., John C.F., Murphy A.M., Carr J.P. & Buchanan-
Wollaston V. (2000). Salicylic acid has a role in regulating gene expression
during leaf senescence. Plant Journal 23(5), 677-685.

142
Moyaleon M. & John P. (1994). Activity of 1-aminocyclopropane-1-carboxylate (ACC)
oxidase (ethylene-forming enzyme) in the pulp and peel of ripening bananas.
Journal Of Horticultural Science 69(2), 243-250.
Moyle R., Fairbairn D., Ripi J., Crowe M. & Botella R. (2005). Developing pineapple
fruit has a small transcriptome dominated by metallothionein. Journal of
Experimental Botany 56(409), 101–112.
Mullet J.E. (1993). Dynamic regulation of chloroplast transcription. Plant Physiol 103,
309-313.
Murray F., Brettell R., Matthews P., Bishop D. & Jacobsen J. (2004). Comparison of
Agrobacterium-mediated transformation of four barley cultivars using the GFP
and GUS reporter genes. Plant Cell Reports 22, 397-402.
Nakazawa M. & Matsui M. (2003). Selection of hygromycin-resistant Arabidopsis
seedlings. Biotechniques 34(1), 28-30.
Nambara E., Naito S. & McCourt P. (1992). A mutant of Arabidopsis which is
defective in seed development and storage protein accumulation is a new abi3
allele. The Plant Journal 2, 435–441. doi: 10.1111/j.1365-313X.1992.00435.x
NASS-Hawaii. (2011). Hawaii Flowers and Nursery Products Annual Summary.
Honolulu HI, NASS, USDA. http://www.nass.usda.gov/hi
Neal M.C. (1965). In Gardens of Hawaii. Honolulu HI, Bishop Museum Press.
Nelson C.J. (1988). Genetic associations between photosynthetic characteristics and
yield: review of evidence. Plant Physiol. Biochem 26, 543-554.

143
Nichols R. (1984). Ethylene and flower senescence. Y. Fuchs & E. Chalutz. Ethylene,
Biochemical, Physiological and Applied Aspects. : The Hague, Nijhoff/Dr. W.
Junk, 101-110.
Nogueira F., Sassaki F. & Maia I. (2011). Arabidopsis thaliana Uncoupling Proteins
(AtUCPs): insights into gene expression during development and stress
response and epigenetic regulation. J Bioenerg Biomembr 43, 71–79.
Noh Y.-S. & Amasino R.M. (1999). Regulation of a developmental senescence is
conserved between Arabidopsis and Brassica napus. Plant Mol. Biol. 41, 195–
206.
Noh Y-S. & Amasino R. (1999). Identification of a promoter region responsible for
the senescence-specific expression of SAG12. Plant Molecular Biology 41,
181–194.
Nooden L.D. (1988). The phenomena of senescence and aging. L.D. Nooden & A.C.
Leopold. Senescence and Aging in Plants. San Diego CA, Academic Press Inc.,
1-50.
Nooden L.D. (1988). Abscisic acid, auxin, and other regulators of senescence. L.D.
Nooden & A.C. Leopold. Senescence and Aging in Plants. San Diego CA,
Academic Press Inc., 330-368.
Nooden L.D., Guiamet J.J. & John I. (1997). Senescence mechanisms. Physiol Plant
101, 746-753.
Nooden L. & Leopold A. (1988). Senescence and Aging in Plants. San Diego CA,
Academic Press Inc.

144
Okayama H. & Berg P. (1982). High-efficiency cloning of full-length cDNA. Mol. Cell.
Biol. 2(2), 161-170.
Olhoft P.M. & Somers D.A. (2001). L-Cysteine increases Agrobacterium-mediated T-
DNA delivery into soybean cotyledonary-node cells. Plant Cell Rep 20, 706–
711.
Olhoft P., Flagel L., Donovan C. & Somers D. (2003). Efficient soybean
transformation using hygromycin B selection in the cotyledonary-node
method. Planta 216, 723–735.
Orbovic V., Pasquali G. & Grosser J.W. (2007). A GFP-containing binary vector for
Agrobacterium tumefaciens-mediated plant transformation. Acta horticulturae
(ISHS) 738, 245-253. http://www.actahort.org/books/738/738_24.htm
Ozsolak F. & Milos M. (2011). RNA sequencing: advances, challenges and
opportunities. Nature Reviews Genetics 12, 87-98.
Pandey S., Ranade S.A., Nagar P.K. & Kumar N. (2000). Role of polyamines and
ethylene as modulators of plant senescence. Journal of Biosciences 25(3),
291-299.
Pant D.R., Bhattarai T., Beck E. & Fettig S. (2009). Genetic transformation of
Nepalese Spring Wheat (Triticum aestivum L.) cultivars with ipt gene under
the regulation of a senescence enhanced promoter from maize. Pakistan J of
Biol Sci 12, 101-109.
Paull R. & Chantrachit T.(2001). Benzyladenine and the vase life of tropical
ornamentals. Postharvest Biology and Technology 21, 303-310.

145
Peach C. & Velten J. (1991). Transgene expression variability (position effect) of CAT
and GUS reporter genes driven by linked divergent T-DNA promoters. Plant
Molecular Biology 17(1), 49-60.
Peckham G.D., Bugos R.C. & Su W.W. (2006). Purification of GFP fusion proteins
from transgenic plant cell cultures. Protein Expression and Purifcation 49,
183–189.
Peng L., Ma J., Chi W., Guo J., Zhu S., Lu Q., Lu C. & Zhang L. (2006). LOW PSII
ACCUMULATION1 is involved in efficient assembly of Photosystem II in
Arabidopsis thaliana. The Plant Cell 18, 955-969.
Peters D., Kassam A., Yonas H., O’Hare E., Ferrell R. & Brufsky A. (1999).
Comprehensive transcript analysis in small quantities of mRNA by SAGE-Lite.
Nucleic Acids Research 27(24), e39-e44.
Peterson L.W. & Huffaker R.C. (1975). Loss of RuBPCase and increase in proteolytic
activity during senescence of detached primary barley leaves. Plant Physiol.
55, 1009-1015.
Prychid C. & Rudall P. (1999). Calcium oxalate crystals in monocotyledons: a review
of their structure and systematics. Ann Bot 84(6), 725-739.
Qin F., Wang C-R., Wang R., Ma G., Xu H-L. (2009). Regulation of endogenous
hormones on post-harvest senescence in transgenic broccoli carrying an
antisense or a sense BO-ACO 2 gene. Journal of Food, Agriculture &
Environment 7(2), 594-598.
Quirino B.F., Noh Y-S., Himelblau E. & Amasino R. (2000). Molecular aspects of leaf
senescence. Trends Plant Sci. 5, 278-282.

146
Raab S., Drechsel G., Zarepour M., Hartung W., Koshiba T., Bittner F. & Hoth S.
(2009). Identification of a novel E3 ubiquitin ligase that is required for
suppression of premature senescence in Arabidopsis. Plant Journal 59(1), 39-
51.
Rhodes M.J.C. (1980). The maturation and ripening of fruits. K.V. Thimann.
Senescence in Plants. Boca Raton FL, CRC Press, 158-205.
Roberts J. & Osborne D. (1981). Auxin and the control of ethylene production during
the development and senescence of leaves and fruits. J Exp Bot 32, 875-887.
Roberts D.R., Walker M.A., Thompson J.E. & Dumbroff E.B. (1983). The effects of
inhibitors of polyamine and ethylene biosynthesis on senescence, ethylene
production and polyamines levels in cut carnation flowers. Plant Cell
Physiology 25, 315-322.
Roberts J., Tucker G. & Maunders M. (1985). Ethylene and foliar senescence. J.
Roberts & G. Tucker. Ethylene and Plant Development. London, Butterworths,
267-275.
Roberts D.R., Thompson J.E., Dumbroff E.B., Gepstein S. & Mattoo A.K. (1987).
Differential changes in the synthesis and steady-state levels of thylakoid
proteins during bean leaf senescence. Plant Molec. Biol. 9, 343-353.
Roberts E.H. (1988). Seed aging: the genome and its expression. L.D. Nooden & A.C.
Leopold. Senescence and Aging in Plants. San Diego CA, Academic Press Inc.,
465-498.

147
Robinson S., Slade A., Fox G., Phillips R., Ratcliffe R-G. & Stewart G. (1991).The role
of glutamate dehydrogenase in plant nitrogen metabolism. Plant Physiol.
95(2), 509–516.
Saladié M., Rose J., Cosgrove D. & Catalá C. (2006). Characterization of a new
xyloglucan endotransglucosylase/hydrolase (XTH) from ripening tomato fruit
and implications for the diverse modes of enzymic action. The Plant Journal
47(2), 282–295.
Samuels J. (1923). A pathological anatomical study of crystal cyst formation in
parenchymatous tissue in the genus Anthurium. Ann Bot 2, 159.181.
Schellenberg M., Matile P. & Thomas H. (1993). Breakdown of chlorophyll in
chloroplasts of senescent barley leaves depends on ATP. Journal of Plant
Physiology 136, 564-568.
Schena M., Shalon D., Davis R.W. & Brown P.O. (1995). Quantitative monitoring of
gene expression patterns with a complementary DNA microarray. Science 270,
467-70.
Schmitz D., Lohmer S., Salamini F. & Thompson, R.D. (1997). The activation domain
of the maize transcription factor Opaque-2 resides in a single acidic region.
Nucleic Acids Res. 25(4), 756–763.
Schnablova R., Synkova H., Vicankova A., Burketova L., Eder J. & Cvikrova M.
(2006). Transgenic ipt tobacco overproducing cytokinins overaccumulates
phenolic compounds during in vitro growth. Plant Physiology and Biochemistry
44, 526-534.

148
Seville M. (2001). A whole new way of looking at things: The use of Dark Reader
technology to detect fluorophors. Electrophoresis 22, 814–828.
Shanklin J., DeWitt N.D. & Flanagan J.M. (1995). The stroma of higher plant plastids
contain ClpP and ClpC, functional homologs of Escherichia coli ClpP and ClpA:
An archetypal two-component ATP-dependent protease. Plant Cell 7, 1713-
1722.
Sharabi-Schwager M., Samach A. & Porat R. (2010). Overexpression of the CBF2
transcriptional activator in Arabidopsis counteracts hormone activation of leaf
senescence. Plant Signaling & Behavior 5(3), 296-299.
Sheen J. (2001). Signal transduction in maize and arabidopsis mesophyll protoplasts.
Plant Physiology 127, 1466–1475.
Sheffer R. D. & Kamemoto H. (1976). Cross compatibility in the genus Anthurium.
Journal of the American Society for Horticultural Science 101, 709–713.
Shen Q., Jiang M., Li H., Che L. & Yang Z-M. (2011). Expression of a Brassica napus
heme oxygenase confers plant tolerance to mercury toxicity. Plant, Cell and
Environment 34, 752–763.
Shewry P.R., Napier J.A. & Tatham A.S. (1995). Seed storage proteins: structures
and biosynthesis. Plant Cell 7(7), 945–956.
Shewry P. & Halford N. (2002). Cereal seed storage proteins: structures, properties
and role in grain utilization. Journal of Experimental Botany 53(370), 947–
958.
Shiva Prakash N., Prasad V., Chidambram T.P., Cherian S., Jayaprakash T.L.,
Dasgupta S., Wang Q., Mann M.T., Spencer T.M. & Boddupalli R.S. (2008).

149
Effect of promoter driving selectable marker on corn transformation.
Transgenic Research 17, 695-704.
Shotwell M. A., Boyer S.K., Chesnut R.S. & Larkins B.A. (1990) Analysis of seed
storage protein genes of oats. The Journal of Biological Chemistry 265, 9652-
9658.
Singh K., Foley R. & Oñate-Sánchez L. (2002). Transcription factors in plant defense
and stress responses. Current Opinion in Plant Biology 5(5), 430–436.
Skoog F. (1994). A personal history of cytokinin and plant horomone research.
D.W.S. Mok & M.C. Mok. “Cytokinins: chemistry, activity and function”. Boca
Raton, Florida, CRC Press Inc., 1-14.
Smart C.M. (1994). Gene expression during leaf senescence. New Phytologist 126(3),
419-448.
Smigocki A.C. (1991). Cytokinin content and tissue distribution in plants transformed
by a reconstructed isopentenyl transferase gene. Plant Mol. Biol 16, 105–115.
Sodmergen K.S., Tano S. & Kuroiwa T. (1989). Preferential digestion of chloroplast
nuclei (nucleoids) during senescence of the coleoptile of Oryza sativa.
Protoplasma 152, 65-68.
Stachel S. E., Timmerman B. & Zambryski P. (1986). Generation of single-stranded
T-DNA molecules during the initial stages of T-DNA transfer from
Agrobacterium tumefaciens to plant cells. Nature 322, 706-712.
Stewart C.N. Jr. (2001). The utility of green fluorescent protein in transgenic plants.
Plant Cell Reports 20(5), 376-382.

150
Stratagene. Lambda DASH II/Eco RI Vector Kit Instruction Manual. Print.
Swartzberg D., Dai N., Gan S., Amasino R. & Granot D. (2006). Effects of cytokinin
production under two SAG promoters on senescence and development of
tomato plants. Plant Biology 8, 579–586.
Sýkorová B., Kurešová G., Daskalova S., Trčková M., Hoyerová K., Raimanová I.,
Motyka V., Trávníčková A., Elliott M.C. & Kamínek M. (2008). Senescence-
induced ectopic expression of the A. tumefaciens ipt gene in wheat delays leaf
senescence, increases cytokinins content, nitrate influx, and nitrate reductase
activity, but does not affect grain yield. J Exp Bot 59, 377–387.
Takaiwa F. & Oono K. (1991). Genomic DNA sequences of two new genes for new
storage protein glutelin in rice. Jpn J Genet 66, 161-171.
Takaiwa F, Ogawa M. & Okita TW. (1999). Rice glutelins. Shewry P.R. & Casey R.
Seed Proteins. Dordrecht, Kluwer Academic Publishers, 401–425.
Tetley R.M. & Thimann K.V. (1974). The metabolism of oat leaves during senescence.
Plant Physiol. 54, 294-303.
Thayer S., Choe H., Tang A. & Huffaker R. (1987). Protein turnover during
senescence. Thomson W., Nothnagel E. & Huffaker R. Plant Senescence: Its
Biochemistry and Physiology. The American Society of Plant Physiologists, 71-
80.
Thayer S., Choe H., S. Rausser & Huffaker R. (1988). Characterization and
subcellular localization of aminopeptidase in senescing barley leaves. Plant
Physiol. 87, 894-897.

151
Thimann K. (1987). Plant senescence: a proposed integration of the constituent
processes. W. Thomson, E. Nothnagel, & R. Huffaker. Plant Senescence: Its
biochemistry and physiology. The American Society of Plant Physiologists, 1-
19.
Thomas H. & Hilditch P. (1987). Metabolism of thylakoid membrane proteins during
foliar senescence. Thomson W., Nothnagel E. & Huffaker R. Plant Senescence:
Its Biochemistry and Physiology. The American Society of Plant Physiologists,
114-122.
Thomas H. & Matile P. (1988). Photobleaching of chloroplast pigments in leaves of a
non-yellowing mutant genotype of Festuca pratensis. Phytochem 27, 345-348.
Thomas H. & Stoddart J. (1980). Leaf senescence. Ann Rev Plant Physiol 31, 83-111.
Tian H.D., Satoh H. & Takemoto Y. (2004). Inheritance of novel 57H mutations in
rice and their effect on compartmentation of endosperm storage proteins.
International Journal of Plant Science 165(4), 537-544.
Timotijevic G., Milisavljevic M., Radovic S., Konstantinovic M. & Maksimovic V.
(2010).Ubiquitous aspartic proteinase as an actor in the stress response in
buckwheat. Journal of Plant Physiology 167, 61–68.
Ueda T., Seo S., Ohashi Y. & Hashimoto J. (2000). Circadian and senescence-
enhanced expression of a tobacco cysteine protease gene. Plant Molecular
Biology 44, 649-657.
Umate P. (2010). Genome-wide analysis of the family of light-harvesting chlorophyll
a/b-binding proteins in Arabidopsis and rice. Plant Signal Behav. 5(12), 1537-
42.

152
Vain P., Afolabi A.S., Worland B. & Snape J. W. (2003). Transgene behaviour in
populations of rice plants transformed using a new dual binary vector system:
pGreen/pSoup. Theoretical and Applied Genetics 107(2), 210-217.
Velculescu V.E., Zhang L., Vogelstein B. & Kinzler K.W. (1995). Serial analysis of
gene expression. Science 270, 484–487.
Velculescu V., Zhang L., Zhou W., Vogelstein J., Basrai M., Bassett Jr. D., Hieter P.,
Vogelstein B. & Kinzler K. (1997). Characterization of the yeast transcriptome.
Cell 88, 243–251.
Vickers C.E., Schenk P.M., Li D., Mullineaux P.M. & Gresshoff P.M. (2007). pGFPGUS
Plus, a new binary vector for gene expression studies and optimising
transformation systems in plants. Biotechnology Letters 29, 1793-1796.
Villareal R. & Juliano B. (1978). Properties of glutelin from mature and developing
rice grain. Phytochemistry 17, 177-182.
Vincentz M., Leite A., Neshich G., Vriend G., Mattar C., Barros L., Weinberg D., de
Almeida E.R., de Carvalho M.P., Aragão F. & Gander E.S. (1997). ACGT and
vicilin core sequences in a promoter domain required for seed-specific
expression of a 2S storage protein gene are recognized by the opaque-2
regulatory protein. Plant Mol Biol 34, 879-889.
Wakasa Y., Ozawa K. & Takaiwa F. (2007). Agrobacterium-mediated transformation
of a low glutelin mutant of 'Koshihikari' rice variety using the mutated-
acetolactate synthase gene derived from rice genome as a selectable marker.
Plant Cell Reports 26, 1567-1573.

153
Wang Z., Gerstein M. & Snyder M. (2009). RNA-Seq: a revolutionary tool for
transcriptomics. Nature Reviews Genetics 10, 57-63.
Wang J., Wang J., Zhang H., Yang Y. & Davies K. (2012). Isolation and partial
characterization of an R2R3MYB transcription factor from the bamboo species
Fargesia fungosa. Plant Mol Biol Rep 30, 131–138.
Wardlaw T.M., Bhalla P.L. & Dalling M.J. (1984). Changes in the number and
composition of chloroplasts during senescence of mesophyll cells of attached
and detached primary leaves (Triticum aestivum L.). Plant Physiol. 75, 421-
424.
Weaver L.M. & Amasino R.M. (2001). Senescence is induced in individually
darkened Arabidopsis leaves, but inhibited in whole darkened plants. Plant
Physiol. 127, 876-886.
Weiss-Wichert C., Altenfeld U. & Johanningmeier U. (1995). Detection of P-subunit of
the Clp-protease in chloroplasts. Xth Int. Photosyn. Cong. Photosyn.
Montpellier, France, p. 156.
Werner T., Motyka V., Laucou V., Smets R., Van Onckelen H. & Schmüllin T. (2003).
Cytokinin-deficient transgenic arabidopsis plants show multiple developmental
alterations indicating opposite functions of cytokinins in the regulation of
shoot and root meristem activity. The Plant Cell 15, 2532-2550
Wilhelm B. & Landry J.R. (2009). RNA-Seq—quantitative measurement of expression
through massively parallel RNA-sequencing. Methods 48, 249–257.
Wilson C., Bellen H. & Gehring W. (1990). Position effects on eukaryotic gene
expression. Annu. Rev. Cell Bio. 6, 679-714.

154
Wittenbach V.A., Ackerson R.C., Giaquinta F.T. & Herbert R.R. (1980). Changes in
photosynthesis, ribulose bisphosphate carboxylase, proteolytic activity, and
ultrastructure of soybean leaves during senescence. Crop Sci. 20, 225-231.
Woo H-H. & Hawes M. (1997). Cloning of genes whose expression is correlated with
mitosis and localized in dividing cells in root caps of Pisum sativum L. Plant
Molecular Biology 35, 1045–1051.
Woolhouse H. (1984). The biochemistry and regulation of senescence in chloroplasts.
Can. J. Bot. 62, 2934-2942.
Woolhouse H. (1987). Regulation of senescence in the chloroplast. W. Thomson, E.
Nothnagel, & R. Huffaker. Plant Senescence: Its Biochemistry and Physiology.
Rockville MD, Amer. Soc. Plant Physiol, 132-145.
Wu C., Suzuki A., Washida H. & Takaiwa F. (1998). The GCN4 motif in a rice glutelin
gene is essential for endosperm-specific gene expression and is activated by
Opaque-2 in transgenic rice plants. The Plant Journal 14(6), 673-683.
Xu L., Ye R., Zheng Y., Wang Z., Zhou P., Lin Y. & Li D. (2010). Isolation of the
endosperm-specific LPAAT gene promoter from coconut (Cocos nucifera L.)
and its functional analysis in transgenic rice plants. Plant Cell Reports 29(9),
1061-1068.
Xu Z.F., Chye M.L., Li H.Y., Xu F.X. & Yao K.M. (2003). G-box binding coincides with
increased Solanum melongena cysteine protease expression in senescent
fruits and circadian-regulated leaves. Plant Molecular Biology 51(1), 9-19.
155
Xu Y., Tian J., Gianfagna T. & Huang B. (2009). Effects of SAG12-ipt expression on
cytokinin production, growth and senescence of creeping bentgrass (Agrostis
stolonifera L.) under heat stress. Plant Growth Regulation 57(3), 281-291.
Yakandawala G., Peiris S.E. & Yakandawala Y.L.N. (2000). Transient expression of
uidA reporter gene in regenerable callus tissues of Anthurium andraeanum
Lind. by Agrobacterium mediated transformation. Tropical Agricultural
Research 12, 50-55.
Yamagata H., Sugimoto T., Tanaka K. & Kasai Z. (1982). Biosynthesis of storage
proteins in developing rice seeds. Plant Physiol. 70, 1094-1100.
Yang H., Wang M., Gao Z., Zhu C. & Guo X. (2011). Isolation of a novel RNA-
dependent RNA polymerase 6 from Nicotiana glutinosa, NgRDR6, and analysis
of its response to biotic and abiotic stresses. Mol Biol Rep 38, 929–937.
Yang P., Li X., Wang X., Chen H., Chen F. & Shen S. (2007). Proteomic analysis of
rice (Oryza sativa) seeds during germination. Proteomics 7, 3358–3368.
doi: 10.1002/pmic.200700207
Yi L., Hagen G. & Guilfoyle T.J. (1992). Altered morphology in transgenic tobacco
plants that overproduce cytokinins in specific tissues and organs.
Developmental Biology 153, 386-395.
Yoo S-D., Cho Y-H. & Sheen J. (2007). Arabidopsis mesophyll protoplasts: a versatile
cell system for transient gene expression analysis. Nature Protocols 2(7),
1565-1572.

156
Yu K., Wei J., Ma Q., Yu D. & Li J. (2009). Senescence of aerial parts is impeded by
exogenous gibberellic acid in herbaceous perennial Paris polyphylla. Journal of
Plant Physiology 166(8), 819-830.
Zhang J., Van Toai T., Huynh L. & Preiszner J. (2000).Development of flooding-
tolerant Arabidopsis thaliana by autoregulated cytokinin production. Molecular
Breeding 6(2), 135-144.
Zhang Y., Liang C., Xu Y., Gianfagna T. & Huang B. (2010).Effects of ipt gene
expression on leaf senescence induced by nitrogen or phosphorus deficiency
in creeping bentgrass. J. Amer. Soc. Hort. Sci. 135(2), 108–115.
Zhou C., Lakso A., Robinson T. & Gan S. (2008). Isolation and characterization of
genes associated with shade-induced apple abscission. Molecular Genetics
and Genomics 280(1), 83-92.
Zhou Y., O'Hare T., Jobin-Decor M., Underhill S., Wills R. & Graham M. (2003).
Transcriptional regulation of a pineapple polyphenol oxidase gene and its
relationship to blackheart. Plant Biotechnology Journal 1(6), 463–478.
Zhu C., Zhu J., Zeng Q., Liu G., Xie Z., Tang H., Cao J. & Zhao X. (2009). Elevated
CO2 accelerates flag leaf senescence in wheat due to ear photosynthesis
which causes greater ear nitrogen sink capacity and ear carbon sink limitation.
Functional Plant Biology 36(4), 291–299
Zhu Y.J., Agbayani R. & Moore P.H. (2004). Green fluorescent protein as a visual
selection marker for papaya (Carica papaya L.) transformation. Plant Cell
Reports 22, 660-667.

157
Ziegler R., Blaheta A., Guha N. & Schönegge B. (1988). Enzymatic formation of
pheophorbide and pyropheophorbide during chllorophyll degradation in a
mutant of Chlorella fusca Shiharet Kraus. J. Plant Physiol. 132, 327-333.
Zottini M., Barizza E., Costa A., Formentin E., Ruberti C., Carimi F. & Lo Schiavo F.
(2008). Agroinfiltration of grapevine leaves for fast transient assays of gene
expression and for long-term production of stable transformed cells. Plant Cell
Reports 27, 845-853.