Molecular Epidemiology of Mycobacterium leprae as Determined by
12
JOURNAL OF CLINICAL MICROBIOLOGY, June 2010, p. 1997–2008 Vol. 48, No. 6 0095-1137/10/$12.00 doi:10.1128/JCM.00149-10 Copyright © 2010, American Society for Microbiology. All Rights Reserved. Molecular Epidemiology of Mycobacterium leprae as Determined by Structure-Neighbor Clustering † Barry G. Hall 1 * and Stephen J. Salipante 1,2 Bellingham Research Institute, Bellingham, Washington, 1 and University of Washington School of Medicine, Seattle, Washington 2 Received 22 January 2010/Returned for modification 16 March 2010/Accepted 22 March 2010 It has proven challenging to investigate the molecular epidemiology of Mycobacterium leprae, the causative agent of leprosy, due to difficulties with culturing of the organism and a lack of genetic heterogeneity between strains. Recently, a cost-effective panel of variable-number tandem-repeat (VNTR) markers has been devel- oped. Use of this panel allows some of those limitations to be overcome and has allowed the genotyping of 475 M. leprae strains from six different countries. In the present report, we provide a comprehensive analysis of the relationships among the strains in order to investigate the patterns of transmission and migration of M. leprae. We find phylogenetic analysis to be inadequate and have developed an alternative method, structure-neighbor clustering, which assigns isolates with the most similar genotypes to the same groups and, subsequently, subgroups, without inferring how the strains descended from a common ancestor. We validate the approach by using simulated data and detecting expected epidemiological relationships from experimental data. Our results suggest that most M. leprae strains from a given country cluster together and that the occasional isolates assigned to different clusters are a consequence of migration. We found three genetically distinguishable populations among isolates from the Philippines, as well as evidence for the significant influx of strains to that nation from India. We also report that reference strain TN originated from the Philippines and not from India, as was previously believed. Lastly, analysis of isolates from the same families and villages suggests that most community infections originate from a common source or person-to-person transmission but that infection from independent sources does occur with measurable frequency. Leprosy is a chronic disease caused by the bacterium Myco- bacterium leprae and is characterized by disfiguring bacterial inclusions in the skin, peripheral nerves, and respiratory mu- cosa. Despite the success of multidrug therapy, leprosy remains prevalent in several developing countries, and in some regions, the incidence of new cases remains relatively unchanged (3). The World Health Organization (WHO) presently estimates the global prevalence to be over 210,000 cases, but it also estimates that more than 240,000 new cases are detected annually, un- derlining a considerable deficit in the understanding of basic aspects of disease contraction and prevention (8). Fundamen- tal information about the epidemiology of M. leprae remains unknown, including the potential sources of infection, the or- ganism’s exact mode of transmission, and the potential impor- tance of person-to-person contact (8). A basic understanding of the pathogenesis of M. leprae is also wanting, including the number of organisms required to produce a successful infec- tion and the time between infection and the first onset of symptoms. This lack of knowledge is a consequence of two primary factors: (i) the difficulty in obtaining samples of M. leprae in sufficient quantities for even the most basic molecular studies and (ii) the failure of national and international grant- ing agencies to provide support for basic research on M. leprae. M. leprae cannot be cultured in vitro on artificial media and must be grown either in armadillos or in the footpads of mice. Because the doubling time of the organism is on the order of 14 days, weeks or even months are required to grow material in amounts sufficient for genomic studies. Samples for molecular analyses have largely been restricted to those obtained directly from patients by biopsy or as slit skin smears, in which suffi- cient numbers of bacteria can be ensured. Regardless of the approach used to obtain the sample, however, it cannot be ensured that the end material represents a pure culture. Throughout the 1970s and 1980s, the WHO provided mate- rials, research leadership, and financial support for investigat- ing basic aspects of M. leprae biology and for the development of vaccines against that organism. Under that initiative, signif- icant advances were made in generating monoclonal antibody banks, developing seroepidemiological tools, and investigating the cellular basis of immunity and the role of T cells in leprosy lesions (2). Yet, because of the success of multidrug therapy, in the 1990s, the WHO gradually turned its attention away from basic leprosy research and toward the goal of eradicating lep- rosy through drug treatment, with the stated goal of reducing leprosy to 1 case per 10,000 individuals (2). Although the NIH has continued to provide grants for basic leprosy re- search, many leprosy researchers have transitioned to more highly funded studies of the related organism Mycobacterium tuberculosis, the causative agent of tuberculosis (2). Understanding of the fundamental aspects of leprosy, such as transmission patterns, infectivity, and incubation time, re- mains important and increasingly depends upon the existence of robust molecular tools for investigating the epidemiology of M. leprae. Microbial epidemiology, in general, requires both the ability to distinguish isolates from each other and the ability to estimate the relationships among those isolates. Re- cent resequencing of four M. leprae strains has revealed that * Corresponding author. Mailing address: Bellingham Research In- stitute, 218 Chuckanut Point Rd., Bellingham, WA 98229. E-mail: [email protected]. † Supplemental material for this article may be found at http://jcm .asm.org/. Published ahead of print on 29 March 2010. 1997 Downloaded from https://journals.asm.org/journal/jcm on 17 October 2021 by 223.18.44.31.
Transcript of Molecular Epidemiology of Mycobacterium leprae as Determined by

JOURNAL OF CLINICAL MICROBIOLOGY, June 2010, p. 1997–2008 Vol. 48, No. 60095-1137/10/$12.00 doi:10.1128/JCM.00149-10Copyright © 2010, American Society for Microbiology. All Rights Reserved.
Molecular Epidemiology of Mycobacterium leprae as Determined byStructure-Neighbor Clustering�†
Barry G. Hall1* and Stephen J. Salipante1,2
Bellingham Research Institute, Bellingham, Washington,1 and University of Washington School of Medicine, Seattle, Washington2
Received 22 January 2010/Returned for modification 16 March 2010/Accepted 22 March 2010
It has proven challenging to investigate the molecular epidemiology of Mycobacterium leprae, the causativeagent of leprosy, due to difficulties with culturing of the organism and a lack of genetic heterogeneity betweenstrains. Recently, a cost-effective panel of variable-number tandem-repeat (VNTR) markers has been devel-oped. Use of this panel allows some of those limitations to be overcome and has allowed the genotyping of 475M. leprae strains from six different countries. In the present report, we provide a comprehensive analysis of therelationships among the strains in order to investigate the patterns of transmission and migration of M. leprae.We find phylogenetic analysis to be inadequate and have developed an alternative method, structure-neighborclustering, which assigns isolates with the most similar genotypes to the same groups and, subsequently,subgroups, without inferring how the strains descended from a common ancestor. We validate the approach byusing simulated data and detecting expected epidemiological relationships from experimental data. Ourresults suggest that most M. leprae strains from a given country cluster together and that the occasional isolatesassigned to different clusters are a consequence of migration. We found three genetically distinguishablepopulations among isolates from the Philippines, as well as evidence for the significant influx of strains to thatnation from India. We also report that reference strain TN originated from the Philippines and not from India,as was previously believed. Lastly, analysis of isolates from the same families and villages suggests that mostcommunity infections originate from a common source or person-to-person transmission but that infectionfrom independent sources does occur with measurable frequency.
Leprosy is a chronic disease caused by the bacterium Myco-bacterium leprae and is characterized by disfiguring bacterialinclusions in the skin, peripheral nerves, and respiratory mu-cosa. Despite the success of multidrug therapy, leprosy remainsprevalent in several developing countries, and in some regions,the incidence of new cases remains relatively unchanged (3). TheWorld Health Organization (WHO) presently estimates theglobal prevalence to be over 210,000 cases, but it also estimatesthat more than 240,000 new cases are detected annually, un-derlining a considerable deficit in the understanding of basicaspects of disease contraction and prevention (8). Fundamen-tal information about the epidemiology of M. leprae remainsunknown, including the potential sources of infection, the or-ganism’s exact mode of transmission, and the potential impor-tance of person-to-person contact (8). A basic understandingof the pathogenesis of M. leprae is also wanting, including thenumber of organisms required to produce a successful infec-tion and the time between infection and the first onset ofsymptoms. This lack of knowledge is a consequence of twoprimary factors: (i) the difficulty in obtaining samples of M.leprae in sufficient quantities for even the most basic molecularstudies and (ii) the failure of national and international grant-ing agencies to provide support for basic research on M. leprae.
M. leprae cannot be cultured in vitro on artificial media andmust be grown either in armadillos or in the footpads of mice.
Because the doubling time of the organism is on the order of14 days, weeks or even months are required to grow material inamounts sufficient for genomic studies. Samples for molecularanalyses have largely been restricted to those obtained directlyfrom patients by biopsy or as slit skin smears, in which suffi-cient numbers of bacteria can be ensured. Regardless of theapproach used to obtain the sample, however, it cannot beensured that the end material represents a pure culture.
Throughout the 1970s and 1980s, the WHO provided mate-rials, research leadership, and financial support for investigat-ing basic aspects of M. leprae biology and for the developmentof vaccines against that organism. Under that initiative, signif-icant advances were made in generating monoclonal antibodybanks, developing seroepidemiological tools, and investigatingthe cellular basis of immunity and the role of T cells in leprosylesions (2). Yet, because of the success of multidrug therapy, inthe 1990s, the WHO gradually turned its attention away frombasic leprosy research and toward the goal of eradicating lep-rosy through drug treatment, with the stated goal of reducingleprosy to �1 case per 10,000 individuals (2). Although theNIH has continued to provide grants for basic leprosy re-search, many leprosy researchers have transitioned to morehighly funded studies of the related organism Mycobacteriumtuberculosis, the causative agent of tuberculosis (2).
Understanding of the fundamental aspects of leprosy, suchas transmission patterns, infectivity, and incubation time, re-mains important and increasingly depends upon the existenceof robust molecular tools for investigating the epidemiology ofM. leprae. Microbial epidemiology, in general, requires boththe ability to distinguish isolates from each other and theability to estimate the relationships among those isolates. Re-cent resequencing of four M. leprae strains has revealed that
* Corresponding author. Mailing address: Bellingham Research In-stitute, 218 Chuckanut Point Rd., Bellingham, WA 98229. E-mail:[email protected].
† Supplemental material for this article may be found at http://jcm.asm.org/.
� Published ahead of print on 29 March 2010.
1997
Dow
nloa
ded
from
http
s://j
ourn
als.
asm
.org
/jour
nal/j
cm o
n 17
Oct
ober
202
1 by
223
.18.
44.3
1.

the level of genetic variation for that organism is unusually low,about one single nucleotide polymorphism (SNP) per 28 kb(14). The paucity of SNPs does not provide sufficient geneticheterogeneity to permit inferences of the population structureto be made at a resolution sufficient to fully explore the epi-demiological relationships between strains and, additionally,requires methods which incur high costs and a high level oftechnical expertise (14). This has led investigators to insteadutilize cost-effective variable-number tandem repeats (VNTRs; alsoknown as microsatellite and minisatellite loci), which are shorttandemly repeated DNA motifs that are useful as molecularmarkers because they are highly polymorphic in populationsand much more polymorphic than SNPs (12). Polymorphismsconsist of differences in the numbers of repeat sequences con-tained by a VNTR and arise when subunits are inserted ordeleted during mitosis (26). The availability of complete M.leprae genome sequences has permitted the identification ofover 50 potentially useful VNTR loci, from which a panel of 16was recently characterized in great detail (8). To date, those 16VNTR loci have been used in six independent survey studies inBrazil, China, Colombia, India, the Philippines, and Thailand(3, 7, 18, 21, 25, 28). However, because the data were reportedindependently, there has been no analysis of the results takenas a whole.
Here, we integrate the VNTR genotype data from all sixstudies, plus those from two additional studies of isolates fromthe Philippines (13, 19), in order to provide a comprehensivestudy of the microbial epidemiology of Mycobacterium leprae.We find that conventional phylogenetic analysis is inadequatefor estimation of the relationships among those strains. There-fore, we have developed a novel two-step approach, structure-neighbor clustering, to reliably assign M. leprae isolates to ahierarchy of closely related groups and subgroups. We use datasimulation studies to evaluate the accuracy of our approachand find that isolates are arranged into appropriate clustersand subclusters with an accuracy exceeding 90% under a vari-ety of different conditions.
MATERIALS AND METHODS
Phylogenetic analysis. Neighbor-joining (NJ) trees were estimated by usingthe PAUP* (version 4.10-beta) program (27). A Perl script, FormatVNTR2, wasused to encode repeat numbers as standard characters. The source code anddocumentation for all programs used in the study are available in the supple-mental material. Majority-rule bootstrap trees were estimated from 1,000 boot-strap pseudoreplicates. Trees were visualized by using the FigTree (version 1.2.3)program (http://tree.bio.ed.ac.uk/software/figtree/).
Data simulation of VNTR evolution. VNTR data sets were simulated by usingthe EvolveVNTR3 program, a modification of the EvolveAGene3 sequenceevolution simulation program (10). Briefly, the user specifies (i) the number oftaxa, (ii) whether the tree will be symmetric or random (in the sense that eachbranch has an equal probability of leading to a terminal or an interior node), and(iii) the average number of changes per site along each branch (branch length).The EvolveVNTR3 program generates a tree topology for the specified numberof taxa and then assigns to each branch a length that is randomly drawn from auniform distribution between zero and twice the mean branch length. The userprovides a VNTR profile (the repeat number at each locus) that serves as theroot sequence that initiates the simulation. At each change, a random locus ischosen, and the repeat number at that locus is changed by 1 unit 75% of the timeand by 2 units 25% of the time. Changes increase and decrease the repeatnumber with equal probabilities. The VNTR profile at each node is recorded,and the true tree is saved in the Newick format. The output data file includes theVNTR profile of each tip of the tree, and in addition, the VNTR profile of theinterior nodes with a probability of 0.2 is included. The inclusion of some interior
nodes mimics the situation in most natural microbial populations, some ances-tors of which survive to the present.
Structure-neighbor clustering. All steps of the structure-neighbor clusteringapproach have been automated by using a Perl script, RunStructure, and ancil-lary scripts, FormatVNTR2, MissingData, and StructureBack.
The FormatVNTR2 Perl script formats input files for use by the Structure andPAUP* programs and writes a file consisting of the pairwise distances among allindividuals. For each pair of isolates, that distance is calculated as the meannumber of repeat differences per site, averaged over all of the loci for whichneither individual had missing data.
(i) Stage 1: clustering by the structure program. The Structure (version 2.3.1)Bayesian population structure inference program (17) was used to cluster strainsaccording to their VNTR profiles, as described in the Structure program manual.The no-admixture model was used for simulated data because the simulationdoes not involve any recombination. For the M. leprae data, the no-admixturemodel was also used because (i) there is no evidence of recombination within M.leprae populations and (ii) the log likelihood (lnL) of the data was higher underthe no-admixture model than under the admixture model (data not shown). Eachrun included a burn-in of 30,000 generations and proceeded for 100,000 gener-ations after the burn-in. The execution of the Structure program for structure-neighbor clustering is mediated by the script RunStructure. Prior to analysis, thescript excludes isolates that contain 40% or greater missing data. The user nextspecifies the maximum number of clusters (K) to be considered. The RunStructureprogram progressively executes the Structure program for values of K rangingfrom 1 to the maximum value chosen by the user and for each run considers thelog likelihood of the data given that number of clusters. The RunStructureprogram determines which value of K achieves the highest log likelihood corre-sponding to the most likely number of clusters and uses that run for all subse-quent operations. The Structure program reports for each individual the poste-rior probability that it belongs to each of the K populations. In order to assign anindividual to a cluster, the RunStructure program requires that the posteriorprobability that the individual belongs to its most likely population be �0.8;otherwise, the individual is not assigned to a cluster and is reported to be“unclustered.” The RunStructure program produces a summary file that lists thecomposition of each cluster and of the unclustered set and reports for eachindividual the probability that it belongs to its assigned cluster.
(ii) Stage 2: subclustering by nearest neighbors. The RunStructure programuses the distance matrix file generated by the FormatVNTR2 script and thesummary file written by the RunStructure program to calculate for each isolatein a cluster the nearest neighbor(s) within the cluster. An isolate may have morethan one nearest neighbor if there are equidistant nearest neighbors. This pro-cess defines the nearest-neighbor networks that join subsets of the isolates withina larger cluster.
(iii) Data visualization. The RunStructure program produces output files thatdiagram the groups defined in stages 1 and 2, which can be visualized with theGraphViz (version 2.24) program. The GraphViz program is authored by AT&Tand is made freely available under the common public license at http://www.graphviz.org/About.php.
RESULTS
Phylogenetic analysis. The VNTR profiles of 475 M. lepraeisolates were considered for our analysis (3, 7, 13, 18, 19, 21, 25,28), but 14 of those isolates were excluded because missing orambiguous data represented 7 or more of the 16 loci (�44%).We initially estimated a neighbor-joining phylogeny for thoseisolates and estimated the confidence in that tree by the stan-dard approach of bootstrapping with 1,000 pseudoreplicates.The resulting tree is essentially a “star phylogeny”: only 1.5%of the clades had bootstrap confidences of �70%, the generallyaccepted cutoff for taking an inference seriously, and the vastmajority of isolates emanated directly from a common centralnode. Thus, there is little internal structure to the phylogenythat defines relationships among various isolates, and nearly allof the few relationships inferred are unreliable. This findingsuggests that there is insufficient information contained in the16 VNTR loci to permit the confident estimation of relation-
1998 HALL AND SALIPANTE J. CLIN. MICROBIOL.
Dow
nloa
ded
from
http
s://j
ourn
als.
asm
.org
/jour
nal/j
cm o
n 17
Oct
ober
202
1 by
223
.18.
44.3
1.
ships among isolates by the conventional method of phyloge-netic analysis.
Structure-neighbor clustering. Given the limitations of phy-logenetic analysis, we developed a more generalized clusteringapproach in order to identify functional groups of geneticallysimilar M. leprae strains, without determining the precise hier-archy of how individual isolates are related to each other. Thistwo-stage method, structure-neighbor clustering, first assignsisolates to generalized populations sharing similar genotypes,and in the second stage, the individuals in each cluster arefurther subdivided into subclusters of the most genetically sim-ilar isolates by using nearest-neighbor networks. We have au-tomated this process using a Perl script, RunStructure.
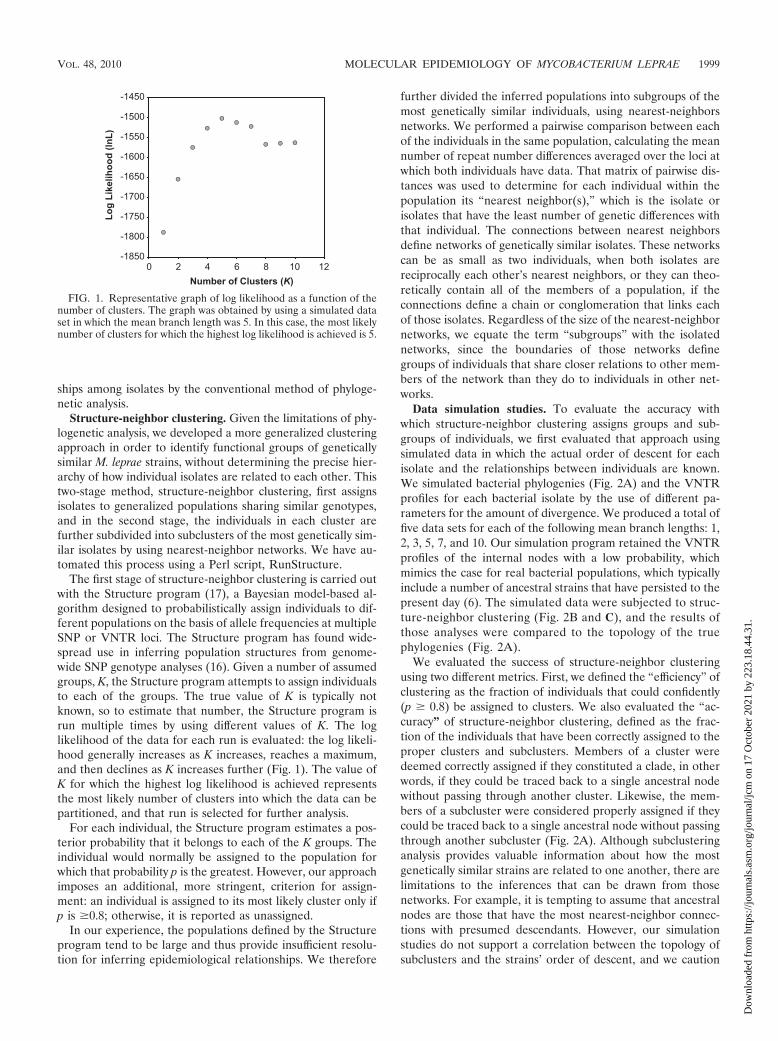
The first stage of structure-neighbor clustering is carried outwith the Structure program (17), a Bayesian model-based al-gorithm designed to probabilistically assign individuals to dif-ferent populations on the basis of allele frequencies at multipleSNP or VNTR loci. The Structure program has found wide-spread use in inferring population structures from genome-wide SNP genotype analyses (16). Given a number of assumedgroups, K, the Structure program attempts to assign individualsto each of the groups. The true value of K is typically notknown, so to estimate that number, the Structure program isrun multiple times by using different values of K. The loglikelihood of the data for each run is evaluated: the log likeli-hood generally increases as K increases, reaches a maximum,and then declines as K increases further (Fig. 1). The value ofK for which the highest log likelihood is achieved representsthe most likely number of clusters into which the data can bepartitioned, and that run is selected for further analysis.
For each individual, the Structure program estimates a pos-terior probability that it belongs to each of the K groups. Theindividual would normally be assigned to the population forwhich that probability p is the greatest. However, our approachimposes an additional, more stringent, criterion for assign-ment: an individual is assigned to its most likely cluster only ifp is �0.8; otherwise, it is reported as unassigned.
In our experience, the populations defined by the Structureprogram tend to be large and thus provide insufficient resolu-tion for inferring epidemiological relationships. We therefore
further divided the inferred populations into subgroups of themost genetically similar individuals, using nearest-neighborsnetworks. We performed a pairwise comparison between eachof the individuals in the same population, calculating the meannumber of repeat number differences averaged over the loci atwhich both individuals have data. That matrix of pairwise dis-tances was used to determine for each individual within thepopulation its “nearest neighbor(s),” which is the isolate orisolates that have the least number of genetic differences withthat individual. The connections between nearest neighborsdefine networks of genetically similar isolates. These networkscan be as small as two individuals, when both isolates arereciprocally each other’s nearest neighbors, or they can theo-retically contain all of the members of a population, if theconnections define a chain or conglomeration that links eachof those isolates. Regardless of the size of the nearest-neighbornetworks, we equate the term “subgroups” with the isolatednetworks, since the boundaries of those networks definegroups of individuals that share closer relations to other mem-bers of the network than they do to individuals in other net-works.
Data simulation studies. To evaluate the accuracy withwhich structure-neighbor clustering assigns groups and sub-groups of individuals, we first evaluated that approach usingsimulated data in which the actual order of descent for eachisolate and the relationships between individuals are known.We simulated bacterial phylogenies (Fig. 2A) and the VNTRprofiles for each bacterial isolate by the use of different pa-rameters for the amount of divergence. We produced a total offive data sets for each of the following mean branch lengths: 1,2, 3, 5, 7, and 10. Our simulation program retained the VNTRprofiles of the internal nodes with a low probability, whichmimics the case for real bacterial populations, which typicallyinclude a number of ancestral strains that have persisted to thepresent day (6). The simulated data were subjected to struc-ture-neighbor clustering (Fig. 2B and C), and the results ofthose analyses were compared to the topology of the truephylogenies (Fig. 2A).
We evaluated the success of structure-neighbor clusteringusing two different metrics. First, we defined the “efficiency” ofclustering as the fraction of individuals that could confidently(p � 0.8) be assigned to clusters. We also evaluated the “ac-curacy” of structure-neighbor clustering, defined as the frac-tion of the individuals that have been correctly assigned to theproper clusters and subclusters. Members of a cluster weredeemed correctly assigned if they constituted a clade, in otherwords, if they could be traced back to a single ancestral nodewithout passing through another cluster. Likewise, the mem-bers of a subcluster were considered properly assigned if theycould be traced back to a single ancestral node without passingthrough another subcluster (Fig. 2A). Although subclusteringanalysis provides valuable information about how the mostgenetically similar strains are related to one another, there arelimitations to the inferences that can be drawn from thosenetworks. For example, it is tempting to assume that ancestralnodes are those that have the most nearest-neighbor connec-tions with presumed descendants. However, our simulationstudies do not support a correlation between the topology ofsubclusters and the strains’ order of descent, and we caution
FIG. 1. Representative graph of log likelihood as a function of thenumber of clusters. The graph was obtained by using a simulated dataset in which the mean branch length was 5. In this case, the most likelynumber of clusters for which the highest log likelihood is achieved is 5.
VOL. 48, 2010 MOLECULAR EPIDEMIOLOGY OF MYCOBACTERIUM LEPRAE 1999
Dow
nloa
ded
from
http
s://j
ourn
als.
asm
.org
/jour
nal/j
cm o
n 17
Oct
ober
202
1 by
223
.18.
44.3
1.

that no such inferences should be derived from the topology ofthe nearest-neighbor networks.
We evaluated each of the five simulations, spanning a totalof six mean branch lengths, for both efficiency and accuracy(Table 1). While efficiency decreases sharply as the meanbranch lengths increase, accuracy remains well above 0.9 underall conditions. In an analogous fashion, we evaluated the ac-curacy of neighbor-joining phylogenetic reconstructions of the
simulated data by computing the degree of topological agree-ment between those estimations and the simulated phylogeniesthat they are meant to reflect (15). (It is not necessary tocompute an efficiency score for the neighbor-joining trees,since all isolates are necessarily included in the reconstruc-tion.) The accuracy for neighbor-joining reconstructions aver-aged about 0.73 for all branch lengths considered, considerablyless than that obtained by structure-neighbor clustering. These
FIG. 2. Simulated data and structure-neighbor clustering results. (A) Representative phylogeny of simulated data for an average branch lengthof 5 and for 75 individuals. The labels for terminal nodes begin with “A,” and those of ancestral nodes begin with “B.” The locations of ancestralnodes are indicated by a dot. For comparison, the clusters (solid lines) and subclusters (dashed lines) defined by structure-neighbor clustering areindicated. Two isolates are misassigned to subclusters (A51 and A55 of cluster 3) and are shown in white text with a black background. (B) Stage1 clustering of the simulated data by use of the Structure program. Each cluster reports the number of individuals in the cluster, the meanprobability that the individuals belong to that cluster (p), and the mean number of loci with missing data (here, this number is 0). Arrows pointfrom each cluster to its nearest neighbor and are labeled with the distances between those clusters estimated by the Structure program. Threeindividuals are left unassigned to clusters, indicating that they cannot be assigned with a probability of �0.8; the mean probability that thoseindividuals could have been assigned to their most likely clusters is 0.655. Sixty-two terminal nodes and 10 ancestral nodes were successfullyclustered. (C) Stage 2 clustering of simulated data by use of nearest-neighbor networks. The subclusters of cluster 3 are depicted. Individuals areconnected to their nearest neighbors by lines that are labeled with the calculated distance between those individuals. The boundaries of thesubclusters (dashed lines) have been drawn for clarity.
TABLE 1. Reconstruction of simulated data by structure-neighbor clustering and neighbor-joining phylogenetic analysis
Method and run no.
Result for BLa of:
1 2 3 5 7 10
Effb Accc Eff Acc Eff Acc Eff Acc Eff Acc Eff Acc
Structure-neighbor clustering1 0.96 0.97 0.95 1.00 0.96 0.99 0.96 0.99 0.80 0.91 0.52 0.952 0.94 1.00 0.94 1.00 0.90 0.97 0.88 0.96 0.82 0.93 0.85 0.823 0.99 1.00 0.96 0.99 0.95 0.99 0.95 0.99 0.89 0.91 0.90 0.954 0.99 1.00 0.96 0.99 0.94 0.97 0.80 1.00 0.94 0.88 0.62 1.005 0.94 1.00 0.97 0.99 0.96 0.90 0.62 0.85 0.96 0.93 0.82 0.97
Mean 0.96 0.99 0.96 0.99 0.94 0.96 0.84 0.96 0.88 0.91 0.74 0.94SEMd 0.01 0.01 0.01 0.00 0.01 0.02 0.06 0.03 0.03 0.01 0.07 0.03
Neighbor-joining phylogenetic reconstruction1 0.79 0.55 0.57 0.83 0.75 0.692 0.83 0.87 0.82 0.75 0.76 0.743 0.80 0.54 0.76 0.83 0.74 0.754 0.82 0.56 0.81 0.76 0.77 0.805 0.81 0.60 0.82 0.74 0.72 0.75
Mean 0.81 0.62 0.75 0.78 0.75 0.75SEM 0.01 0.06 0.05 0.02 0.01 0.02
a BL, mean branch length.b Eff, efficiency.c Acc, accuracy.d SEM, standard error of the mean.
2000 HALL AND SALIPANTE J. CLIN. MICROBIOL.
Dow
nloa
ded
from
http
s://j
ourn
als.
asm
.org
/jour
nal/j
cm o
n 17
Oct
ober
202
1 by
223
.18.
44.3
1.

results suggest that relationships among isolates can be esti-mated from VNTR profiles much more reliably by structure-neighbor clustering than is possible by estimating those rela-tionships from neighbor-joining phylogenetic trees.
Because the experimental data for M. leprae do not includeinformation about the length of every VNTR for every isolate,we modified the simulated data in order to examine the effectsof missing data on structure-neighbor clustering. For simula-tions with branch lengths of 5 and 10, we randomly replacedsimulated VNTR loci with missing data either with a frequencyequal to that observed for the experimental data set (“averagemissing data”) or at twice that probability (“high missingdata”). Once again, we performed structure-neighbor cluster-ing and neighbor-joining phylogenetic reconstruction of thosedata and evaluated the accuracy and efficiency of the resultscompared to the known phylogeny (Table 2). Missing datasomewhat decreased the efficiency of structure-neighbor clus-tering but did not influence the accuracy of either neighbor-joining phylogenetic reconstruction or structure-neighbor clus-tering. For the results typically obtained by M. lepraegenotyping, it appears that the amount of missing data shouldnot be a limiting factor with respect to the accuracy of struc-ture-neighbor clustering.
Structure-neighbor analysis of M. leprae VNTR data. Thecomplete VNTR profiles for all 475 M. leprae strains weresubjected to structure-neighbor clustering. The most probablenumber of clusters (K) was 10, for which the log likelihood ofthe data was �7,705.
(i) Identifying which loci should be included. The study thatoriginally characterized the M. leprae VNTR loci utilized here(8) considered the reliability of each locus by requiring that, foras many as three experimental replicates, the number of re-peats was read independently by two different individuals.
Concordance was calculated as the fraction of instances inwhich the two readers agreed on the repeat number, withconcordance being considered directly proportional to reliabil-ity. By this metric, two loci, AT(15) and TA(18), ranked un-usually poorly, demonstrating concordances of 0% and 50%,respectively. Similarly, it was noted that locus 18-8 produced alarge degree of nonspecific amplification products that com-plicated genotype interpretation, especially when the locus wastested by using higher concentrations of the DNA template.We therefore analyzed the M. leprae VNTR data set afterexcluding those three potentially unreliable loci singly, in pairs,or all together (Table 3). The effects of those changes weremonitored by determining the lnL of the data given for themost likely number of clusters, in which a higher lnL representsa more probable interpretation of the data. The absolute valueof the log likelihood is affected by the amount of data, i.e., thenumber of loci used. The appropriate comparisons are there-fore between data sets that include the same number of loci.Since the stochastic nature of the Bayesian Structure programmeans that independent runs of the same data set do not yieldidentical lnL values, Table 3 reports the mean � standarderror of the lnL from three independent analyses, unless oth-erwise indicated.
When each of three randomly chosen loci [(AC)8a,(GRA)9, and 12-5] were excluded, the log likelihoods weresomewhat reduced and ranged from �7,155 to �7,721 witha mean of �7,397 � 86 (average � standard error of themean). Excluding either the (AT)15 or the (TA)18 locus in-creased lnL by factors of e365 and e446, respectively, relative tothe value obtained by excluding a randomly selected locus,while excluding the 18-8 locus reduced lnL by a factor of e278.The gains in lnL suggest that removing either (AT)15 or(TA)18 does result in the more reliable interpretation of the
TABLE 2. Effect of missing data on reconstruction by structure-neighbor clustering and neighbor-joining phylogenetic analysis
Method and run no.
Result for BLa of:
5 10
No missingdata
Avg missingdata
High missingdata
No missingdata
Averagemissing data
High missingdata
Effb Accc Eff Acc Eff Acc Eff Acc Eff Acc Eff Acc
Structure-neighbor clustering1 0.96 0.99 0.92 0.97 0.29 1.00 0.52 0.95 0.51 0.97 0.12 1.002 0.88 0.96 0.88 1.00 0.47 1.00 0.85 0.82 0.66 0.85 0.64 0.853 0.95 0.99 0.97 0.97 0.93 0.93 0.90 0.95 0.67 1.00 0.90 0.944 0.80 1.00 0.84 0.95 0.80 0.97 0.62 1.00 0.83 0.99 0.50 0.975 0.62 0.85 0.62 0.96 0.93 0.94 0.82 0.97 0.86 0.91 0.73 0.96
Mean 0.84 0.96 0.85 0.97 0.69 0.97 0.74 0.94 0.71 0.94 0.58 0.95SEMd 0.06 0.03 0.06 0.01 0.13 0.01 0.07 0.03 0.06 0.03 0.13 0.03
Neighbor-joining phylogenetic reconstruction1 0.83 0.80 0.78 0.69 0.70 0.712 0.75 0.73 0.73 0.74 0.70 0.703 0.83 0.50 0.77 0.75 0.72 0.744 0.76 0.78 0.75 0.80 0.78 0.795 0.74 0.68 0.65 0.75 0.73 0.74
Mean 0.78 0.70 0.74 0.75 0.72 0.74SEM 0.02 0.05 0.02 0.02 0.02 0.02
a BL, mean branch length.b Eff, efficiency.c Acc, accuracy.d SEM, standard error of the mean.
VOL. 48, 2010 MOLECULAR EPIDEMIOLOGY OF MYCOBACTERIUM LEPRAE 2001
Dow
nloa
ded
from
http
s://j
ourn
als.
asm
.org
/jour
nal/j
cm o
n 17
Oct
ober
202
1 by
223
.18.
44.3
1.

data by structure-neighbor clustering. Data for both (AT)15and (TA)18 were missing for a significant fraction of the M.leprae isolates, so we considered the possibility that the im-provement in lnL is the result of excluding loci with missingdata. Locus (TA)10 is considered reliable, but a higher fractionof isolates were missing data for that locus than for any of thesuspect loci. However, excluding (TA)10 did not improve thelnL relative to that obtained by excluding a randomly selectedlocus (Table 3). We conclude that the gains in lnL achieved byremoving the unreliable loci are not solely the effect of elimi-nating missing data from the analysis.
When (AT)15 and (TA)18 were simultaneously excluded,lnL was increased by a factor of e529 relative to that achievedby excluding two randomly selected loci. Excluding either ofthose loci in conjunction with locus 18-8 again resulted in areduced lnL.
We next considered the possibility that the exclusion of locus18-8 might increase reliability only when (AT)15 and (TA)18were also excluded. Although the exclusion of all three lociincreased lnL by e371 relative to the value obtained by exclud-ing three random loci, the increase was no greater that thatachieved by excluding (AT)15 and (TA)18 in conjunction witha randomly chosen locus.
lnL is not, however, the only factor worth considering indeciding which loci to include in a structure-neighbor analysis.When (AT)15 and (TA)18 were excluded but 18-8 was in-cluded, the efficiency was only 0.61, whereas it was 0.70 when18-8 was additionally excluded. That reduction in clusteringefficiency reflects a decrease in the probability with which iso-lates can be assigned to a cluster. Indeed, when 18-8 wasincluded, the mean probability with which clusterable isolateswere assigned was 0.924 � 0.001, whereas the mean probabilitywas 0.936 � 0.002 when 18-8 was excluded. On that basis, wejudge that locus 18-8 contributes little but noise to the analysis
and that it may be resource effective to exclude it in futurestudies.
We conclude not only that loci (AT)15 and (TA)18 areunreliable in the laboratory, as reported by Gillis et al. (8), butalso, with consideration of the comprehensive data set, thatthose loci are unreliable in the field. Those VNTR markers areconfounding and should not be used in future studies of M.leprae.
(ii) Population structure of M. leprae. We repeated struc-ture-neighbor clustering of the 475 M. leprae strains using onlythe 13 loci deemed reliable (locus 18-8 was excluded) (Fig. 3).Ten isolates were automatically excluded because of excessiveamounts of missing data, leaving 465 strains in the final anal-ysis. During the first step of clustering, performed by the Struc-ture program, 101 of those isolates could not be assigned to acluster with a probability of �0.8 and were excluded fromfurther analysis (see Table S1 in the supplemental material).The efficiency of clustering was therefore 0.782, similar to thatobserved in data simulation studies when the mean branchlength of the simulated trees was 10. Although the cutoff prob-ability for assigning strains to clusters is 0.8, the mean proba-bilities for all clusters in this instance exceeded 0.92. We there-fore have considerable confidence in the assignment of strainsto their respective populations.
The eight populations defined at this step reflected thesource countries reasonably well. For example, all but one ofthe strains from China belonged to cluster 8, 85% of the strainsfrom Brazil belonged to cluster 5, and 88% of the strains fromIndia belonged to cluster 6. A few minority stains, typically oneor two from any given country, that were isolated from geo-graphically separate regions existed within most clusters andtherefore probably reflect immigration. Notable exceptions tothose trends are the strains isolated from the Philippines, themajority of which constituted three major populations, clusters
TABLE 3. Evaluation of potentially unreliable loci
No. of VNTRloci used Locus or loci excluded Comment lnL � SEMb Efficiency �
SEM
16 None Full data set �7,842 � 69 0.71 � 0.0515 (AC)8a Randomly selected locus �7,314 � 60 0.69 � 0.0315 (GTA)9 Randomly selected locus �7,155 � 3 0.66 � 0.0215 12-5 Randomly selected locus �7,721 � 5 0.73 � 0.0215 Average of (AC)8a, (GTA)9, and 12-5 Mean of one randomly selected locus (n � 9) �7,397 � 86 0.69 � 0.02
15 (AT)15 Worst concordance, 22.3% missing dataa �7,032 � 67 0.68 � 0.00215 (TA)18 Second-worst concordance, 18.2% missing dataa �6,951 � 68 0.78 � 0.0415 18-8 Multiple stutter bands, 30.2% missing dataa �7,675 � 72 0.62 � 0.0215 (TA)10 Most missing data (45.1%) �7,361 � 69 0.71 � 0.0214 (AT)17, 12-5 Two random loci �6,655 � 45 0.73 � 0.01
14 (AT)15, (TA)18 Combination of two suspect loci �6,126 � 9 0.61 � 0.0114 (AT)15, 18-8 Combination of two suspect loci �6,822 � 67 0.66 � 0.0214 (TA)18 18-8 Combination of two suspect loci �6,721 � 66 0.59 � 0.0213 (AT)17, 6-7, 12-5 Three randomly selected loci �6,268 � 37 0.76 � 0.02
13 (AT)15, (TA)18, 18-8 All three suspect loci �5,897 � 68 0.70 � 0.0513 (AT)15, (TA)18, (GGT)5 Two suspect loci plus a randomly selected locus �6,038 � 2 0.66 � 0.0113 (AT)15, (TA)18, (AC)8a Two suspect loci plus a randomly selected locus �5,580 � 6 0.62 � 0.0113 Average of two trials Mean of two suspect loci plus one randomly selected
locus (n � 6)�5,809 � 84 0.64 � 0.01
a Comment from reference 8.b SEM, standard error of the mean.
2002 HALL AND SALIPANTE J. CLIN. MICROBIOL.
Dow
nloa
ded
from
http
s://j
ourn
als.
asm
.org
/jour
nal/j
cm o
n 17
Oct
ober
202
1 by
223
.18.
44.3
1.

1, 3, and 4. It appears that the strains from the Philippines aregenetically diverse enough that they can be divided into twoclosely related but distinct groups (clusters 1 and 3), plus athird minority group (cluster 4) that is more closely related tostrains from India. This finding suggests a significant influx ofstrains to that nation from India. Clusters 2 and 7 each pri-marily consisted of strains isolated in Thailand, suggesting theexistence of two distinct populations from Thailand, but eachalso included a significant number of strains isolated in thePhilippines, suggesting immigrations from Thailand to thePhilippines.
Surprisingly, we also found that strain TN, the first M. lepraestrain to be sequenced (4), does not originate from India, asreported previously (14). The present analysis infers with ahigh degree of confidence (p � 1.0) that TN belongs to acluster of isolates almost exclusively from the Philippines (clus-ter 3). This result suggests that although TN was isolated froma source in India, it was genetically very similar to strainsendemic to the Philippines, suggesting the migration of the TNstrain.
Higher resolution is afforded by the second stage of struc-ture-neighbor clustering, which defines subgroups within largerpopulations. Figure 4 shows typical results of stage 2 structure-neighbor analyses. Depicted is cluster 1, in which six subclus-ters have been defined for the 42 strains by using nearest-neighbor networks. Although subcluster analysis providesvaluable insight into the genetic relationships between individ-ual strains, we again emphasize that no inferences about theorder of descent can be derived from the nearest-neighbortopologies of the subclusters. Diagrams of stage 2 structure-neighbor clustering for clusters 1 to 8 are available in thesupplemental material.
Recent studies conducted in the Philippines examined pairs(and one trio) of M. leprae strains isolated from each of eightdifferent families (18, 19) or, similarly, pairs of strains takenfrom each of eight different villages (19) (Table 4). Because oftheir tight geographical distribution, those paired strains maybe expected to be closely related and would thus fall within thesame clusters and subclusters defined by the structure-neigh-bor approach. Of the total of the 16 sets of paired strains, only
FIG. 3. Stage 1 clustering of M. leprae data by use of the Structure program. The mean probability that isolates belong to the cluster (p) andthe mean number of loci per individual for which data are missing (indicated by “missing”) are reported for each cluster. For example, the 42individuals in cluster 1 had missing data at an average of 0.60 loci. Individuals with an insufficient probability of being assigned to any cluster areindicated. Arrows are drawn from each cluster to its nearest neighbor.
VOL. 48, 2010 MOLECULAR EPIDEMIOLOGY OF MYCOBACTERIUM LEPRAE 2003
Dow
nloa
ded
from
http
s://j
ourn
als.
asm
.org
/jour
nal/j
cm o
n 17
Oct
ober
202
1 by
223
.18.
44.3
1.

1 had an unassigned member that precluded further analysis.Of the remaining 15 pairs of isolates, 14 pairs were within thesame cluster and 13 grouped both within the same cluster andwithin the same subcluster. For the 13 pairs contained in thesame subcluster, all but 1 pair of isolates was directly linked bya nearest-neighbor connection. These inferences suggest thatthe groups and subgroups identified by structure-neighborclustering, as well as the relationships between strains inferredthrough nearest-neighbor networks, correlate well with ex-pected epidemiological relationships determined with real-world data. At the same time, we found that for one multicasefamily (family F3), the isolates were confidently assigned toentirely different populations. We cannot rule out the possi-bility that the results from family F3 reflect reporting errors.Nevertheless, caution is warranted in assuming that multiple
infections within the same family always represent direct trans-mission from one family member to another, as it appears thatindependent infections from genetically dissimilar sources oc-cur with measurable frequency.
Finally, the structure-neighbor method identified 417 uniqueVNTR types (equivalent to genotypes) among the 465 strainsthat were clustered. This is in contrast to the 16 SNP types,again equivalent to genotypes, found for the 400 strains thatwere subjected to SNP analysis at 84 informative polymorphicsites (14). There were 31 sets of strains, ranging from 2 to 6members per set, in which the members within a set had in-distinguishable VNTR types. In some cases, the strains wereidentical at all 13 VNTR loci, and in others, some memberscontained missing data and were therefore identical only at theloci for which data were available. The most interesting pair
FIG. 4. Stage 2 clustering of the M. leprae strains within cluster 1. Nearest neighbors are connected by lines, and the genetic distance betweenisolates is indicated. Subclusters are equivalent to the individual nearest-neighbor networks within a cluster.
2004 HALL AND SALIPANTE J. CLIN. MICROBIOL.
Dow
nloa
ded
from
http
s://j
ourn
als.
asm
.org
/jour
nal/j
cm o
n 17
Oct
ober
202
1 by
223
.18.
44.3
1.

was CD236 from India and I40 from the Philippines, whichwere identical at all 13 VNTR loci. Except for reference strainTN (also supposedly from India), CD236 was the only memberof cluster 1 (Fig. 3) that was not from the Philippines. Thisexample represents another case of the very recent immigra-tion of a strain from the Philippines into India.
DISCUSSION
Understanding the most basic epidemiology of leprosy in-fection has been greatly hampered by the absence of inexpen-sive molecular strain typing methods capable of revealingenough genetic variation to, in turn, allow estimation of therelationships among isolates with a reasonable degree of con-fidence and accuracy. The method that can be used to typeMycobacterium leprae isolates by the use of 16 VNTR loci andas few as 10 cells as the starting material, which has recentlybeen developed and validated (8), largely meets the need foran inexpensive typing method. There are several reasons whyVNTR typing is superior to SNP typing for investigating theepidemiology of M. leprae. First, VNTR loci evolve much fasterthan SNPs, with the consequence being that VNTR typing
reveals considerably more genetic heterogeneity than exami-nation of an equivalent number of SNPs. For instance, in theirsurvey of 400 M. leprae strains using 84 informative SNP sites,Monot et al. (14) identified only 16 unique SNP types, whereasin the present study, 465 strains included 417 unique VNTRtypes. The higher resolution of VNTR typing is the result ofhaving an average of 9.5 alleles per locus, whereas none of theSNPs had more than 2 alleles per site. Second, the number ofpossible alleles per locus is another factor distinguishing SNPsand VNTRs. The VNTRs used in this study had an average of9.5 alleles per locus, but none of the SNPs had more than twoalleles, of a maximum of only four possible alleles, per site(14). It is therefore easier to distinguish between isolates onthe basis VNTR typing. Lastly, the cost of typing the fullVNTR panel is currently about 6.5 times lower than that ofamplifying and sequencing the 84 SNP loci identified by Monotet al. (14). This cost difference is especially significant forresearchers in the countries where leprosy is endemic. A totalof eight studies involving six countries have now used VNTRloci to type hundreds of M. leprae strains, making it clear thatuse of the VNTR panel for epidemiological surveys is practical.
TABLE 4. Multicase families and pairs from the same village
Group and case designation Strain Same cluster? Same subcluster? Nearest neighbors?
Multicase familyMCF-1a IDEAL50 Yes Yes YesMCF-1 IDEAL53 Cluster 1MCF-2a IDEAL68 (IDEAL68 unassigned) Yes YesMCF-2 IDEAL69 YesMCF-2 IDEAL70 Cluster 3F1b F1-L42 Yes Yes YesF1 F1-M20 Cluster 1F2b F2-M90 Yes No NoF2 F2-M91 Cluster 2F3b F3-L14 No No NoF3 F3-L29F4b F4-M26 (F4-M26 unassigned) ?d ?d
F4 F4-M85F5b F5-M46 Yes Yes YesF5 F5-M71 Cluster 3F6b F6-L55 Yes Yes YesF6 F6-L64 Cluster 4
Pairs from the same villageB1c B1-M11 Yes Yes YesB1 B1-M59 Cluster 1B2c B2-M50 Yes Yes YesB2 B2-M61 Cluster 1B3c B3-R34 Yes Yes YesB3 B3-L36 Cluster 3B4c B4-M71 Yes Yes NoB4 B4-M72 Cluster 3B5c B5-L03 Yes Yes YesB5 B5-L57 Cluster 2B6c B6-R19 Yes Yes YesB6 B6-M69 Cluster 4B7c B7-M81 Yes Yes YesB7 B7-M82 Cluster 4B8c B8-L60 Yes Yes YesB8 B8-L91 Cluster 7
a Case from Table 3 in reference 18.b Case from Table 3 in reference 19.c Case from Table 4 in reference 19.d Unable to assess.
VOL. 48, 2010 MOLECULAR EPIDEMIOLOGY OF MYCOBACTERIUM LEPRAE 2005
Dow
nloa
ded
from
http
s://j
ourn
als.
asm
.org
/jour
nal/j
cm o
n 17
Oct
ober
202
1 by
223
.18.
44.3
1.
The present study brings together the results of those surveysinto a single, comprehensive analysis of the molecular epide-miology of M. leprae.
Phylogenetic analysis, the study of evolutionary relatednessamong species, is typically used to infer how bacterial strainsare related to each other through a common ancestry (5, 11).Although such analyses can be enlightening, it has been rec-ognized that phylogenetic reconstructions can be inadequateor misleading when the amount of genetic diversity distinguish-ing individuals is small (6, 20). Our initial phylogenetic analysisof the M. leprae strains indicates that there is insufficient ge-netic polymorphism at the available VNTR loci to infer rela-tionships between isolates in any meaningful or reliable way. Inlight of this finding, caution should be used when inferencesfrom published phylogenies of M. leprae (3, 19) are drawn,unless metrics for those estimations can be provided with ahigh degree of confidence. Because of the practical constraintsposed by working with M. leprae, it is unlikely that significantlymore VNTR loci will become available in the near future, andthus, an alternative method to phylogenetic analysis is requiredto estimate such relationships.
An alternative method to phylogenetic analysis for inferringrelationships from limited VNTR loci, eBURST (6), has beenproposed, and we have previously suggested the use of thatapproach for the examination of M. leprae (9). Unfortunately,eBURST cannot be applied to samples for which data aremissing for any of the loci. For the available M. leprae strains,only 178 of the 461 VNTR profiles (38.6%) contained data forall 16 loci. Additionally, eBURST requires that strains differ atno more than a single locus in order to form connectionsbetween them, which is the case for only a small minority of M.leprae strains. Clearly, the constraints of eBURST make it animpractical tool for use for estimation of the relationshipsbetween M. leprae isolates.
We therefore developed a more generalized approach toenable the clustering of genetically similar strains into groupsand subgroups. We refer to this approach as structure-neigh-bor clustering. The approach requires two separate stages: inthe first stage, isolates are clustered into large populations ofgenetically similar strains by using the Structure populationstructure inference program (17), and in the second stage, theindividuals in each population are further grouped into sub-clusters, on the basis of nearest-neighbor networks. Using sim-ulated data for which the true relationships can be known, wehave found that the fraction of individuals that can reliably beassigned to clusters is a function of the genetic distances be-tween them and, to a lesser extent, the average amount ofmissing data. Under the conditions under which the isolateswere examined in the present study, 74% or more of theisolates could be successfully assigned to clusters (Table 1).The accuracy with which individuals are assigned to clustersand further assigned to subclusters averaged 95% across a widevariety of conditions, whereas the accuracy of neighbor-joiningphylogenetic reconstructions by use of the same data was 73%(Table 1). We found that the inclusion of missing data some-what decreased the number of individuals that could be as-signed to clusters, but for those individuals that could be as-signed, accuracy was not affected (Table 2).
Structure-neighbor clustering outperforms phylogeneticanalysis only because it provides fewer, but more reliable,
inferences about the population structure from the data. Phy-logenetic analysis attempts to infer the order of descent of eachindividual in the data set from hypothetical common ancestors.In contrast, structure-neighbor clustering merely assigns iso-lates with the most similar genotypes to the same groupsand/or subgroups, without making any attempt to infer howthey have descended from a common progenitor. Of course, itis assumed that the relatedness within any group (either acluster or a subcluster) is the consequence of descent from acommon ancestor, but our approach does not identify thoseancestors: indeed, we caution that no inferences about theorder of descent should be drawn from the topology of con-nections within subclusters. A secondary factor contributing tothe robustness of structure-neighbor clustering is that it doesnot attempt to analyze all of the individuals provided, whereasphylogenetic analysis does. Instead, it imposes requirementsfor the maximal amount of missing data permitted for anindividual (less than 40%) as well as minimum standards ofconfidence (Bayesian posterior probability � 0.8) for the clus-tering of individuals, the result of which is to include only thoseindividuals for which the data permit the strongest inferencesto be made.
Given that structure-neighbor clustering provides fewer in-ferences than phylogenetic analysis, is it actually useful forepidemiological purposes? We believe that it is. First, for mostepidemiological purposes, it is sufficient to be able to identifywhat strains are closely related without concern about theprecise order of descent from common ancestors. Structure-neighbor clustering reliably and accurately meets that need,whereas phylogenetic methods attempt to provide additionalinformation with inaccurate and misleading results. Althoughthe structure-neighbor approach cannot estimate relationshipsfor every isolate, those for which it can estimate relationshipsare assigned to groups with a high degree of reliability. Second,as more individuals are added to the available pool of data(especially if measures are taken to minimize missing data),progressively more reliable connections are likely to emergeand the efficiency of the structure-neighbor approach is likelyto increase beyond its present 77%. Additionally, future im-provements to the structure-neighbor program may improveaccuracy and resolution. The Structure program currently con-siders VNTR alleles either to be the same length or to havedifferent lengths. VNTR loci tend to mutate in units of onetandem repeat at a time (1), so the Structure program’s binarytreatment of data ignores the fact that alleles which have moresimilar numbers of repeats are more genetically similar thanalleles which have more pronounced differences in the numberof repeats. The inclusion of a parameter for ordered characterstates in the Structure program may therefore improve futureanalyses but was outside the scope of the present work.
In this study, the application of the structure-neighbormethod to the available M. leprae VNTR data pooled fromeight recent studies yields a number of valuable insights thatcould not have been obtained by considering each data setindependently. We have described a strategy to determinewhat VNTR loci are unreliable and have the potential to con-found analyses and have found that 13 of the 16 availableVNTR markers are suitable for use in molecular epidemiology.Examining relationships at the resolution of countries throughstage 1 analysis of those data (Fig. 3) reveals a general agree-
2006 HALL AND SALIPANTE J. CLIN. MICROBIOL.
Dow
nloa
ded
from
http
s://j
ourn
als.
asm
.org
/jour
nal/j
cm o
n 17
Oct
ober
202
1 by
223
.18.
44.3
1.

ment between clusters and the country of origin for the sam-ples assigned within. However, strains from the Philippinesgroup into three major populations, suggesting an unusualamount of genetic heterogeneity among the isolates from thatnation. Two of those populations are closely related but dis-tinct groups, while the third, smaller group is more closelyrelated to strains from India, suggesting a significant degree ofstrain migration from India to the Philippines. Another sur-prising result is the inferred origin of M. leprae strain TN, thefirst M. leprae strain to be sequenced (4). That isolate is pre-sumed to have come from India (14), but our analysis demon-strates with a high degree of confidence that it belongs to acluster otherwise composed entirely of strains from the Phil-ippines. TN may have been isolated in India, but if so, it wasclearly a recent immigrant from the Philippines. With that inmind, it is unfortunate that strain TN was used as an outgroupto root a phylogenetic tree of strains from the Philippines (19),because although the authors could not have known it at thetime, it now seems likely that TN is a member of the in-group.
Two recent studies (18, 19) isolated multiple M. lepraestrains from the same families or villages, permitting examina-tion of that organism’s epidemiology at a more local level. Asexpected, we found that most of the strains from the samevillages and families grouped closely together in the samecluster and/or subcluster in structure-neighbor analysis. How-ever, we identified one multicase family (family F3) in whichthe separate isolates were confidently assigned to geneticallydissimilar populations. This finding not only suggests that themajority of leprosy cases in those communities and families areeither laterally transferred between individuals or obtainedfrom the same natural source but also suggests that the inde-pendent infection of family members from different sourcesoccurs at a nonnegligible frequency.
It is clear that the quality of structure-neighbor clustering isdependent on the quality of the underlying data used for thoseanalyses, and we encourage all M. leprae investigators to em-ploy only the 14 reliable VNTR loci that we have identified,using appropriate quality checks, as described by Gillis et al.(8). Although locus 18-8 is reliable, it appears to contributelittle but noise to the clustering of the global sets of isolatesthat we have considered here; but it is possible that it maycontribute positively to strain resolution in more local compar-isons, e.g., those limited to a single country or a single regionwithin a country. A future study will specifically address thatissue and will further consider how best loci should be selectedfor inclusion in data sets. Furthermore, the value of the mo-lecular epidemiology of M. leprae increases with an increase inthe number of available strains, which improves the ability tomake connections among those data. With that in mind, theresearch community would benefit from a formally fundeddatabase for M. leprae VNTR data, developed and curated ata university or other institution. Until that time, the authorswill provide a Web-based, read-only version of that database,diagrams of the clusters and subclusters based on the mostcurrent M. leprae database, and detailed instructions for addinghigh-quality data to the database. That database can beaccessed at http://web.me.com/barryghall/Leprosy/Database/Database.html.
We also point out that structure-neighbor clustering mayhave application for inferring the population structures of
other organisms. For example, VNTR data from 12 loci havebeen used, in conjunction with spoligotyping data, to estimatephylogenetic trees for Mycobacterium tuberculosis (22–24).Bootstrap percentiles or other measures of clade confidencehave not been reported for those reconstructions, so it is notpossible to assess the accuracies of the phylogenies. However,a simulation study has suggested that at least 25 VNTR loci arerequired to produce NJ trees for bacteria that are 90% accu-rate (B. G. Hall, unpublished results). Given these observa-tions, structure-neighbor clustering might be considered analternative means to estimate the relationships among M. tu-berculosis isolates.
REFERENCES
1. Boyer, J. C., N. A. Yamada, C. N. Roques, S. B. Hatch, K. Riess, and R. A.Farber. 2002. Sequence dependent instability of mononucleotide microsat-ellites in cultured mismatch repair proficient and deficient mammalian cells.Hum. Mol. Genet. 11:707–713.
2. Brenan, P. J. 2009. IDEAL: in the footsteps of IMMLEP and THELEP.Lepr. Rev. 80:236–245.
3. Cardona-Castro, N., J. C. Beltran-Alzate, I. M. Romero-Montoya, E. Me-lendez, F. Torres, R. M. Sakamuri, W. Li, and V. Vissa. 2009. Identificationand comparison of Mycobacterium leprae genotypes in two geographicalregions of Colombia. Lepr. Rev. 80:316–321.
4. Cole, S. T., K. Eiglmeier, J. Parkhill, K. D. James, N. R. Thomson, P. R.Wheeler, N. Honore, T. Garnier, C. Churcher, D. Harris, K. Mungall, D.Basham, D. Brown, T. Chillingworth, R. Connor, R. M. Davies, K. Devlin, S.Duthoy, T. Feltwell, A. Fraser, N. Hamlin, S. Holroyd, T. Hornsby, K. Jagels,C. Lacroix, J. Maclean, S. Moule, L. Murphy, K. Oliver, M. A. Quail, M. A.Rajandream, K. M. Rutherford, S. Rutter, K. Seeger, S. Simon, M. Sim-monds, J. Skelton, R. Squares, S. Squares, K. Stevens, K. Taylor, S. White-head, J. R. Woodward, and B. G. Barrell. 2001. Massive gene decay in theleprosy bacillus. Nature 409:1007–1011.
5. Diamant, E., Y. Palti, R. Gur-Arie, H. Cohen, E. M. Hallerman, and Y.Kashi. 2004. Phylogeny and strain typing of Escherichia coli, inferred fromvariation at mononucleotide repeat loci. Appl. Environ. Microbiol. 70:2464–2473.
6. Feil, E. J., B. C. Li, D. M. Aanensen, W. P. Hanage, and B. G. Spratt. 2004.eBURST: inferring patterns of evolutionary descent among clusters of re-lated bacterial genotypes from multilocus sequence typing data. J. Bacteriol.186:1518–1530.
7. Fontes, A. N., R. M. Sakamuri, I. M. Baptista, S. Ura, M. O. Moraes, A. N.Martinez, E. N. Sarno, P. J. Brennan, V. D. Vissa, and P. N. Suffys. 2009.Genetic diversity of Mycobacterium leprae isolates from Brazilian leprosypatients. Lepr. Rev. 80:302–315.
8. Gillis, T., V. Vissa, M. Matsuoka, J. H. Richardus, R. Truman, B. G. Hall,and P. J. Brenan. 2009. Characterisation of short tandem repeats for geno-typing Mycobacterium leprae. Lepr. Rev. 80:250–260.
9. Hall, B. G. 2009. Molecular epidemiology of Mycobacterium leprae: a solidbeginning. Lepr. Rev. 80:246–249.
10. Hall, B. G. 2008. Simulating DNA coding sequence evolution withEvolveAGene 3. Mol. Biol. Evol. 25:688–695.
11. Hall, B. G., and M. Barlow. 2006. Phylogenetic analysis as a tool in molecularepidemiology of infectious diseases. Ann. Epidemiol. 16:157–169.
12. Hughes, C. R., and D. C. Queller. 1993. Detection of highly polymorphicmicrosatellite loci in a species with little allozyme polymorphism. Mol. Ecol.2:131–137.
13. Kimura, M., R. M. Sakamuri, N. A. Groathouse, B. L. Rivoire, D. Gingrich,S. Krueger-Koplin, S. N. Cho, P. J. Brennan, and V. Vissa. 2009. Rapidvariable-number tandem-repeat genotyping for Mycobacterium leprae clin-ical specimens. J. Clin. Microbiol. 47:1757–1766.
14. Monot, M., N. Honore, T. Garnier, N. Zidane, D. Sherafi, A. Paniz-Mondolfi,M. Matsuoka, G. M. Taylor, H. D. Donoghue, A. Bouwman, S. Mays, C.Watson, D. Lockwood, A. Khamispour, Y. Dowlati, S. Jianping, T. H. Rea, L.Vera-Cabrera, M. M. Stefani, S. Banu, M. Macdonald, B. R. Sapkota, J. S.Spencer, J. Thomas, K. Harshman, P. Singh, P. Busso, A. Gattiker, J.Rougemont, P. J. Brennan, and S. T. Cole. 2009. Comparative genomic andphylogeographic analysis of Mycobacterium leprae. Nat. Genet. 41:1282–1289.
15. Nye, T. M., P. Lio, and W. R. Gilks. 2006. A novel algorithm and web-basedtool for comparing two alternative phylogenetic trees. Bioinformatics 22:117–119.
16. Parker, H. G., L. V. Kim, N. B. Sutter, S. Carlson, T. D. Lorentzen, T. B.Malek, G. S. Johnson, H. B. DeFrance, E. A. Ostrander, and L. Kruglyak.2004. Genetic structure of the purebred domestic dog. Science 304:1160–1164.
VOL. 48, 2010 MOLECULAR EPIDEMIOLOGY OF MYCOBACTERIUM LEPRAE 2007
Dow
nloa
ded
from
http
s://j
ourn
als.
asm
.org
/jour
nal/j
cm o
n 17
Oct
ober
202
1 by
223
.18.
44.3
1.

17. Pritchard, J. K., M. Stephens, and P. Donnelly. 2000. Inference of popula-tion structure using multilocus genotype data. Genetics 155:945–959.
18. Sakamuri, R. M., J. Harrison, R. Gelber, P. Saunderson, P. J. Brennan, M.Balagon, and V. Vissa. 2009. A continuation: study and characterisation ofMycobacterium leprae short tandem repeat genotypes and transmission ofleprosy in Cebu, Philippines. Lepr. Rev. 80:272–279.
19. Sakamuri, R. M., M. Kimura, W. Li, H. C. Kim, H. Lee, M. D. Kiran, W. C.Black IV, M. Balagon, R. Gelber, S. N. Cho, P. J. Brennan, and V. Vissa.2009. Population-based molecular epidemiology of leprosy in Cebu, Philip-pines. J. Clin. Microbiol. 47:2844–2854.
20. Salipante, S. J., J. M. Thompson, and M. S. Horwitz. 2008. Phylogenetic fatemapping: theoretical and experimental studies applied to the development ofmouse fibroblasts. Genetics 178:967–977.
21. Shinde, V., H. Newton, R. M. Sakamuri, V. Reddy, S. Jain, A. Joseph, T.Gillis, I. Nath, G. Norman, and V. Vissa. 2009. VNTR typing of Mycobac-terium leprae in South Indian leprosy patients. Lepr. Rev. 80:290–301.
22. Sola, C., I. Filliol, M. C. Gutierrez, I. Mokrousov, V. Vincent, and N. Rastogi.2001. Spoligotype database of Mycobacterium tuberculosis: biogeographicdistribution of shared types and epidemiologic and phylogenetic perspec-tives. Emerg. Infect. Dis. 7:390–396.
23. Sola, C., I. Filliol, E. Legrand, S. Lesjean, C. Locht, P. Supply, and N.Rastogi. 2003. Genotyping of the Mycobacterium tuberculosis complex using
MIRUs: association with VNTR and spoligotyping for molecular epidemi-ology and evolutionary genetics. Infect. Genet. Evol. 3:125–133.
24. Sola, C., I. Filliol, E. Legrand, I. Mokrousov, and N. Rastogi. 2001. Myco-bacterium tuberculosis phylogeny reconstruction based on combined numer-ical analysis with IS1081, IS6110, VNTR, and DR-based spoligotyping sug-gests the existence of two new phylogeographical clades. J. Mol. Evol. 53:680–689.
25. Srisungnam, S., J. Rudeeaneksin, A. Lukebua, S. Wattanapokayakit, S.Pasadorn, K. Mahotarn, Ajincholapan, R. M. Sakamuri, M. Kimura, P. J.Brennan, B. Phetsuksiri, and V. Vissa. 2009. Molecular epidemiology ofleprosy based on VNTR typing in Thailand. Lepr. Rev. 80:280–289.
26. Streisinger, G., Y. Okada, J. Emrich, J. Newton, A. Tsugita, E. Terzaghi, andM. Inouye. 1966. Frameshift mutations and the genetic code. This paper isdedicated to Professor Theodosius Dobzhansky on the occasion of his 66thbirthday. Cold Spring Harb. Symp. Quant. Biol. 31:77–84.
27. Swofford, D. L. 2000. PAUP*. Phylogenetic analysis using parsimony (*andother methods). 4.0 ed. Sinauer Associates, Sunderland, MA.
28. Xing, Y., J. Liu, R. M. Sakamuri, Z. Wang, Y. Wen, V. Vissa, and X.Weng. 2009. VNTR typing studies of Mycobacterium leprae in China:assessment of methods and stability of markers during treatment. Lepr.Rev. 80:261–271.
2008 HALL AND SALIPANTE J. CLIN. MICROBIOL.
Dow
nloa
ded
from
http
s://j
ourn
als.
asm
.org
/jour
nal/j
cm o
n 17
Oct
ober
202
1 by
223
.18.
44.3
1.
![[Micro] mycobacterium leprae](https://static.fdocuments.net/doc/165x107/55d6fd2cbb61eb344d8b45f6/micro-mycobacterium-leprae.jpg)