Mohair Market Value Chain Profile 2016 - nda.agric.za Publications... · A PROFILE OF THE SOUTH...
33
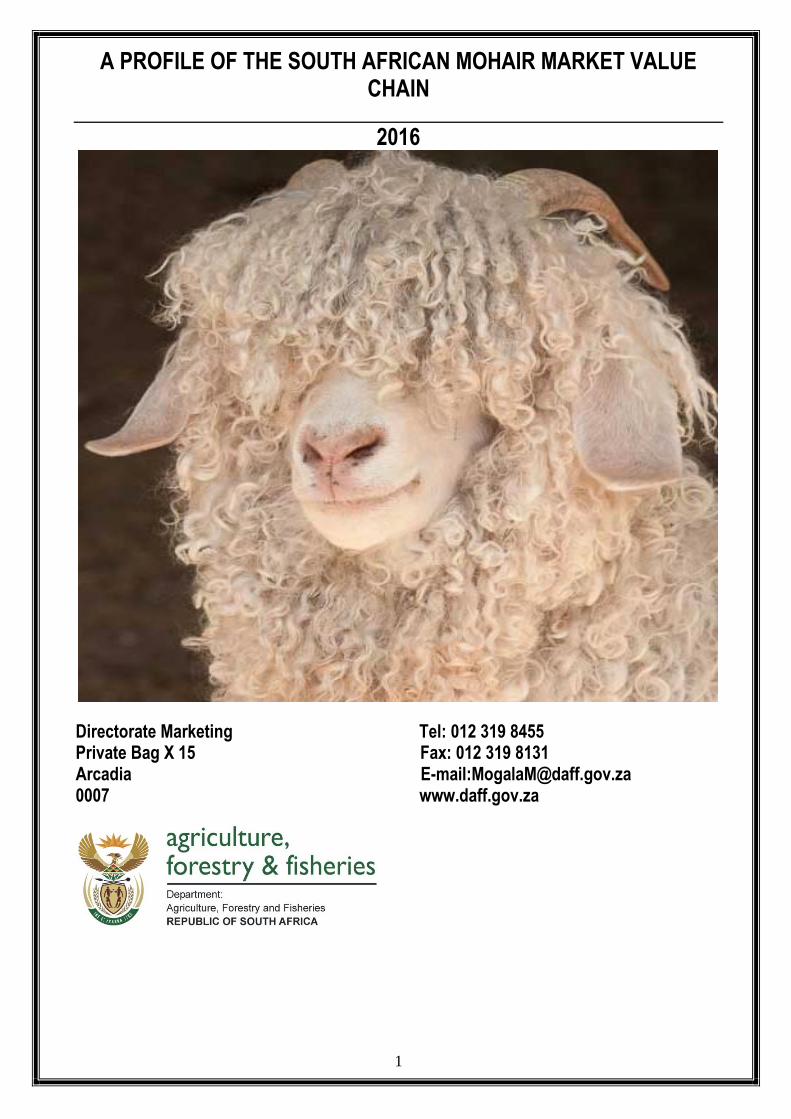
1 A PROFILE OF THE SOUTH AFRICAN MOHAIR MARKET VALUE CHAIN 2016 Directorate Marketing Tel: 012 319 8455 Private Bag X 15 Fax: 012 319 8131 Arcadia E-mail:[email protected] 0007 www.daff.gov.za
Transcript of Mohair Market Value Chain Profile 2016 - nda.agric.za Publications... · A PROFILE OF THE SOUTH...
1
A PROFILE OF THE SOUTH AFRICAN MOHAIR MARKET VALUE CHAIN
2016
Directorate Marketing Tel: 012 319 8455 Private Bag X 15 Fax: 012 319 8131 Arcadia E-mail:[email protected] 0007 www.daff.gov.za
2
TABLE OF CONTENTS
1. DESCRIPTION OF THE INDUSTRY. 3
2. PRODUCTION OF MOHAIR 4
3. MARKET STRUCTURE 5
3.1 Domestic market and prices 5
5. MAJOR EXPORT MARKETS FOR SOUTH AFRICAN MOHAIR (2012) 6
6. EXPORTS VOLUMES 7
7. SHARE ANALYSIS 12
8. IMPORTS VOLUMES 13
9. MOHAIR VALUE CHAIN 16
10. BARRIERS TO PARTICIPATION BY THE EMERGING SECTOR 17
11. BLACK ECONOMIC EMPOWERMENT INITIATIVES 17
11.1 Representation within the Empowerment Trust 17
12. MARKET ACCESS 18
12.1 Export tariffs for mohair 18
12.2 Import tariffs for mohair 19
13. MARKET INTELLIGENCE 21
14. COMPETITIVENESS OF SOUTH AFRICA’S MOHAIR IMPORT 27
15. ACKNOWLEDGEMENTS 33
3
RECENT DEVELOPMENTS The Hardwood Training Farm, located in Jansenville runs a three year certificate programme that trains youth in the area to farm with Angora goats. The curriculum also includes training on the basic running, management and financial implications of a farm. The students are assigned a mentor for the duration of their time spent at Hardwood. The mentor is a retired Angora goat farmer and member of the South African Mohair Growers Association. Once the students have graduated, it is the responsibility of the Department of Rural Development and Land Affairs to provide the graduates with land and other donors to provide Angora goats to farm with, with continued mentorship from the Industry. The farm has seen its first 5 students graduate. The graduates, of which three are men and two are women, have recently received their 5550 hectare farm, called “Uitkomst”, situated 33km north of Jansenville. Accompanied by a mentor for their first three years, the students will be farming with both Angora goats and Marino sheep. The mohair training initiative is a collaboration between local authorities, the Ikwezi Municipality, the Department of Agriculture and the mohair industry. The project plays an instrumental role in the development and upliftment of rural communities in the Eastern Cape, equipping individuals with the skills and knowledge to participate in one of South Africa’s most successful industries. The next five students moved into Hardwood this past September for their three year training period. 1. DESCRIPTION OF THE INDUSTRY.
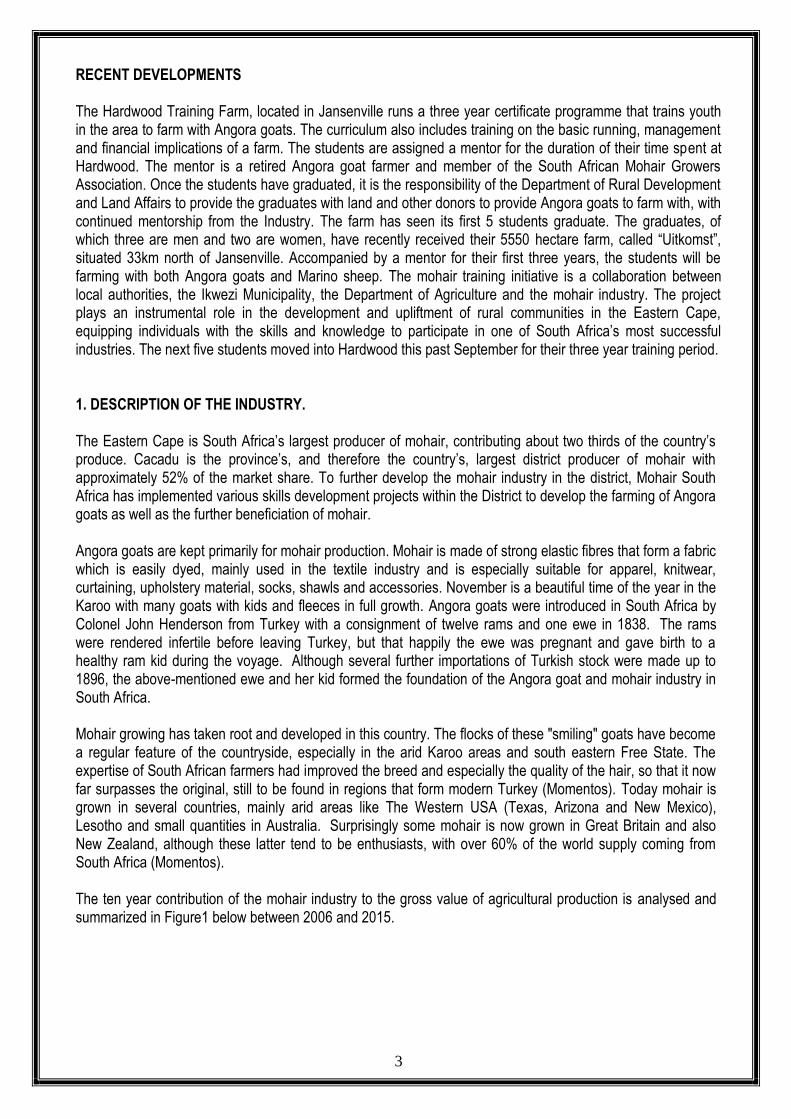
The Eastern Cape is South Africa’s largest producer of mohair, contributing about two thirds of the country’s produce. Cacadu is the province’s, and therefore the country’s, largest district producer of mohair with approximately 52% of the market share. To further develop the mohair industry in the district, Mohair South Africa has implemented various skills development projects within the District to develop the farming of Angora goats as well as the further beneficiation of mohair. Angora goats are kept primarily for mohair production. Mohair is made of strong elastic fibres that form a fabric which is easily dyed, mainly used in the textile industry and is especially suitable for apparel, knitwear, curtaining, upholstery material, socks, shawls and accessories. November is a beautiful time of the year in the Karoo with many goats with kids and fleeces in full growth. Angora goats were introduced in South Africa by Colonel John Henderson from Turkey with a consignment of twelve rams and one ewe in 1838. The rams were rendered infertile before leaving Turkey, but that happily the ewe was pregnant and gave birth to a healthy ram kid during the voyage. Although several further importations of Turkish stock were made up to 1896, the above-mentioned ewe and her kid formed the foundation of the Angora goat and mohair industry in South Africa. Mohair growing has taken root and developed in this country. The flocks of these "smiling" goats have become a regular feature of the countryside, especially in the arid Karoo areas and south eastern Free State. The expertise of South African farmers had improved the breed and especially the quality of the hair, so that it now far surpasses the original, still to be found in regions that form modern Turkey (Momentos). Today mohair is grown in several countries, mainly arid areas like The Western USA (Texas, Arizona and New Mexico), Lesotho and small quantities in Australia. Surprisingly some mohair is now grown in Great Britain and also New Zealand, although these latter tend to be enthusiasts, with over 60% of the world supply coming from South Africa (Momentos). The ten year contribution of the mohair industry to the gross value of agricultural production is analysed and summarized in Figure1 below between 2006 and 2015.
4
Source: Mohair South Africa
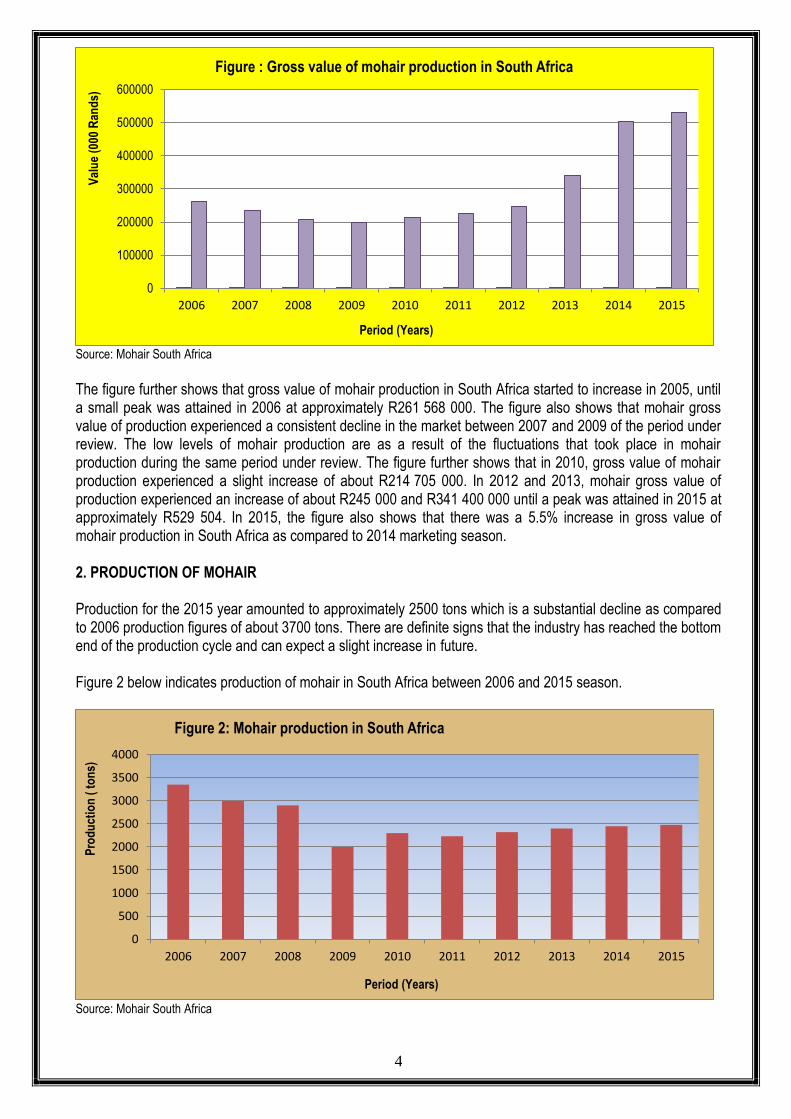
The figure further shows that gross value of mohair production in South Africa started to increase in 2005, until a small peak was attained in 2006 at approximately R261 568 000. The figure also shows that mohair gross value of production experienced a consistent decline in the market between 2007 and 2009 of the period under review. The low levels of mohair production are as a result of the fluctuations that took place in mohair production during the same period under review. The figure further shows that in 2010, gross value of mohair production experienced a slight increase of about R214 705 000. In 2012 and 2013, mohair gross value of production experienced an increase of about R245 000 and R341 400 000 until a peak was attained in 2015 at approximately R529 504. In 2015, the figure also shows that there was a 5.5% increase in gross value of mohair production in South Africa as compared to 2014 marketing season. 2. PRODUCTION OF MOHAIR Production for the 2015 year amounted to approximately 2500 tons which is a substantial decline as compared to 2006 production figures of about 3700 tons. There are definite signs that the industry has reached the bottom end of the production cycle and can expect a slight increase in future. Figure 2 below indicates production of mohair in South Africa between 2006 and 2015 season.
Source: Mohair South Africa
0
100000
200000
300000
400000
500000
600000
2006 2007 2008 2009 2010 2011 2012 2013 2014 2015
Val
ue
(000
Ran
ds)
Period (Years)
Figure : Gross value of mohair production in South Africa
0
500
1000
1500
2000
2500
3000
3500
4000
2006 2007 2008 2009 2010 2011 2012 2013 2014 2015
Pro
du
ctio
n (
to
ns)
Period (Years)
Figure 2: Mohair production in South Africa
5
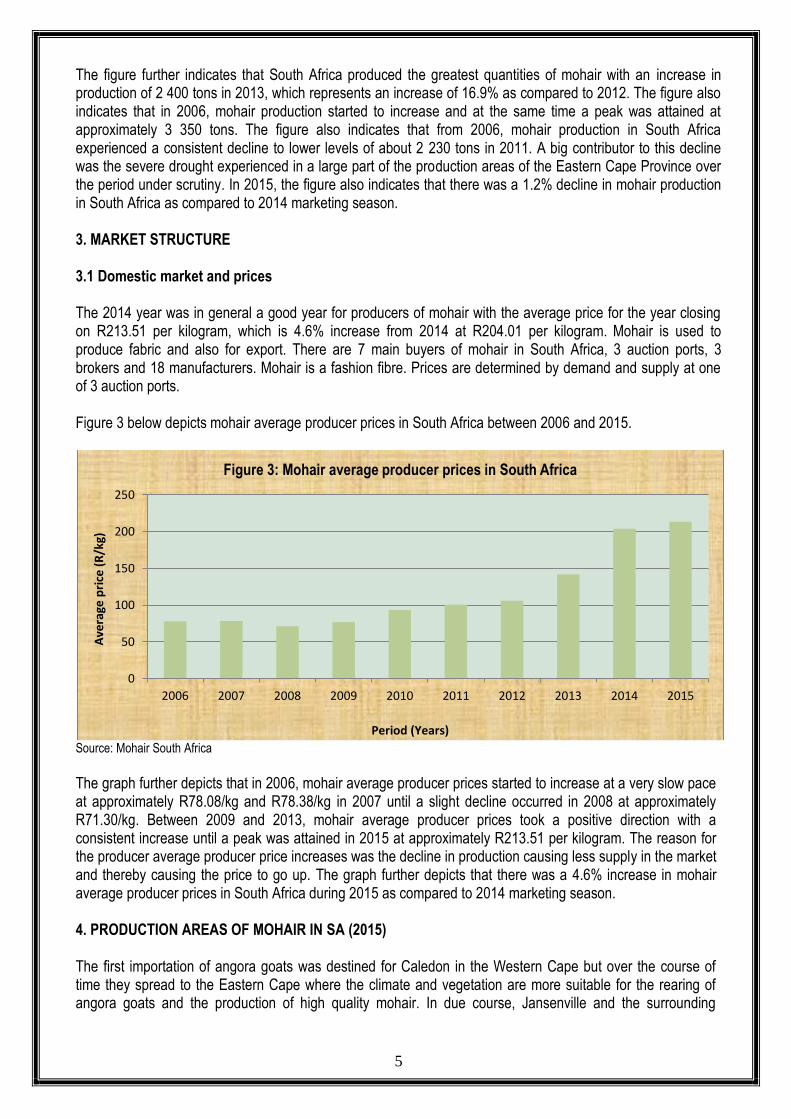
The figure further indicates that South Africa produced the greatest quantities of mohair with an increase in production of 2 400 tons in 2013, which represents an increase of 16.9% as compared to 2012. The figure also indicates that in 2006, mohair production started to increase and at the same time a peak was attained at approximately 3 350 tons. The figure also indicates that from 2006, mohair production in South Africa experienced a consistent decline to lower levels of about 2 230 tons in 2011. A big contributor to this decline was the severe drought experienced in a large part of the production areas of the Eastern Cape Province over the period under scrutiny. In 2015, the figure also indicates that there was a 1.2% decline in mohair production in South Africa as compared to 2014 marketing season. 3. MARKET STRUCTURE 3.1 Domestic market and prices The 2014 year was in general a good year for producers of mohair with the average price for the year closing on R213.51 per kilogram, which is 4.6% increase from 2014 at R204.01 per kilogram. Mohair is used to produce fabric and also for export. There are 7 main buyers of mohair in South Africa, 3 auction ports, 3 brokers and 18 manufacturers. Mohair is a fashion fibre. Prices are determined by demand and supply at one of 3 auction ports. Figure 3 below depicts mohair average producer prices in South Africa between 2006 and 2015.
Source: Mohair South Africa
The graph further depicts that in 2006, mohair average producer prices started to increase at a very slow pace at approximately R78.08/kg and R78.38/kg in 2007 until a slight decline occurred in 2008 at approximately R71.30/kg. Between 2009 and 2013, mohair average producer prices took a positive direction with a consistent increase until a peak was attained in 2015 at approximately R213.51 per kilogram. The reason for the producer average producer price increases was the decline in production causing less supply in the market and thereby causing the price to go up. The graph further depicts that there was a 4.6% increase in mohair average producer prices in South Africa during 2015 as compared to 2014 marketing season. 4. PRODUCTION AREAS OF MOHAIR IN SA (2015) The first importation of angora goats was destined for Caledon in the Western Cape but over the course of time they spread to the Eastern Cape where the climate and vegetation are more suitable for the rearing of angora goats and the production of high quality mohair. In due course, Jansenville and the surrounding
0
50
100
150
200
250
2006 2007 2008 2009 2010 2011 2012 2013 2014 2015
Ave
rage
pri
ce (
R/k
g)
Period (Years)
Figure 3: Mohair average producer prices in South Africa
6
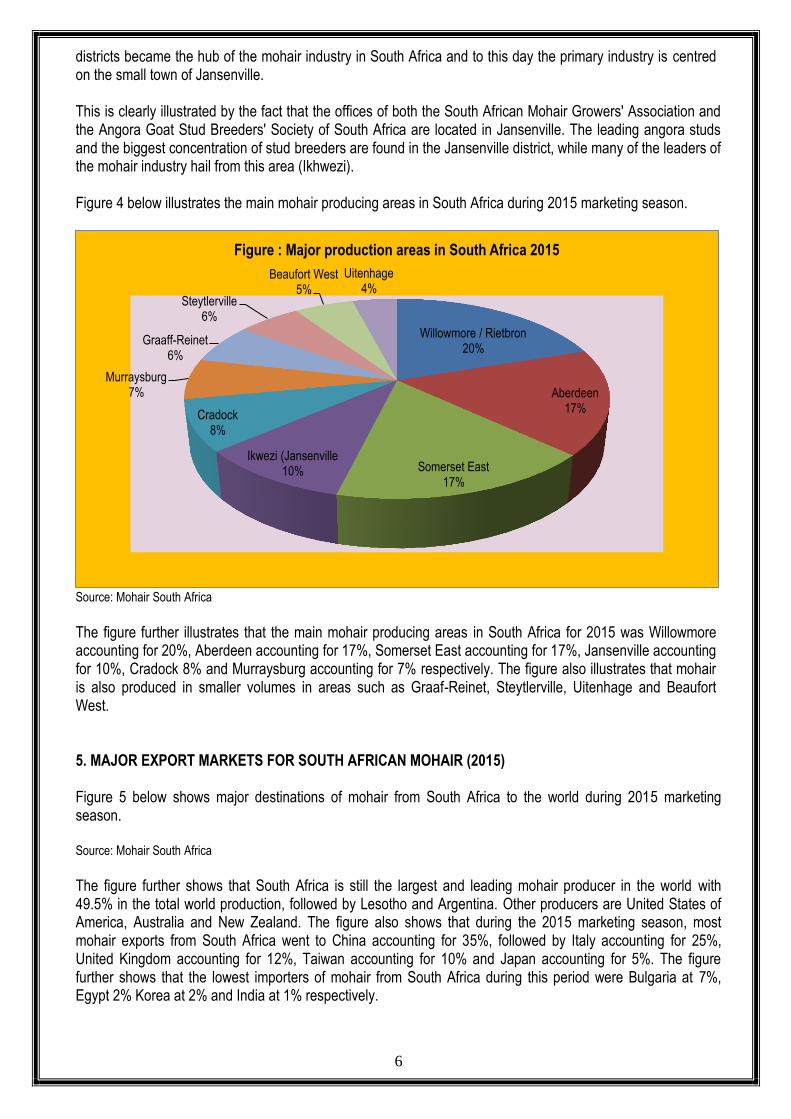
districts became the hub of the mohair industry in South Africa and to this day the primary industry is centred on the small town of Jansenville. This is clearly illustrated by the fact that the offices of both the South African Mohair Growers' Association and the Angora Goat Stud Breeders' Society of South Africa are located in Jansenville. The leading angora studs and the biggest concentration of stud breeders are found in the Jansenville district, while many of the leaders of the mohair industry hail from this area (Ikhwezi). Figure 4 below illustrates the main mohair producing areas in South Africa during 2015 marketing season.
Source: Mohair South Africa
The figure further illustrates that the main mohair producing areas in South Africa for 2015 was Willowmore accounting for 20%, Aberdeen accounting for 17%, Somerset East accounting for 17%, Jansenville accounting for 10%, Cradock 8% and Murraysburg accounting for 7% respectively. The figure also illustrates that mohair is also produced in smaller volumes in areas such as Graaf-Reinet, Steytlerville, Uitenhage and Beaufort West. 5. MAJOR EXPORT MARKETS FOR SOUTH AFRICAN MOHAIR (2015) Figure 5 below shows major destinations of mohair from South Africa to the world during 2015 marketing season. Source: Mohair South Africa
The figure further shows that South Africa is still the largest and leading mohair producer in the world with 49.5% in the total world production, followed by Lesotho and Argentina. Other producers are United States of America, Australia and New Zealand. The figure also shows that during the 2015 marketing season, most mohair exports from South Africa went to China accounting for 35%, followed by Italy accounting for 25%, United Kingdom accounting for 12%, Taiwan accounting for 10% and Japan accounting for 5%. The figure further shows that the lowest importers of mohair from South Africa during this period were Bulgaria at 7%, Egypt 2% Korea at 2% and India at 1% respectively.
Willowmore / Rietbron 20%
Aberdeen 17%
Somerset East 17%
Ikwezi (Jansenville 10%
Cradock 8%
Murraysburg 7%
Graaff-Reinet 6%
Steytlerville 6%
Beaufort West 5%
Uitenhage 4%
Figure : Major production areas in South Africa 2015
7
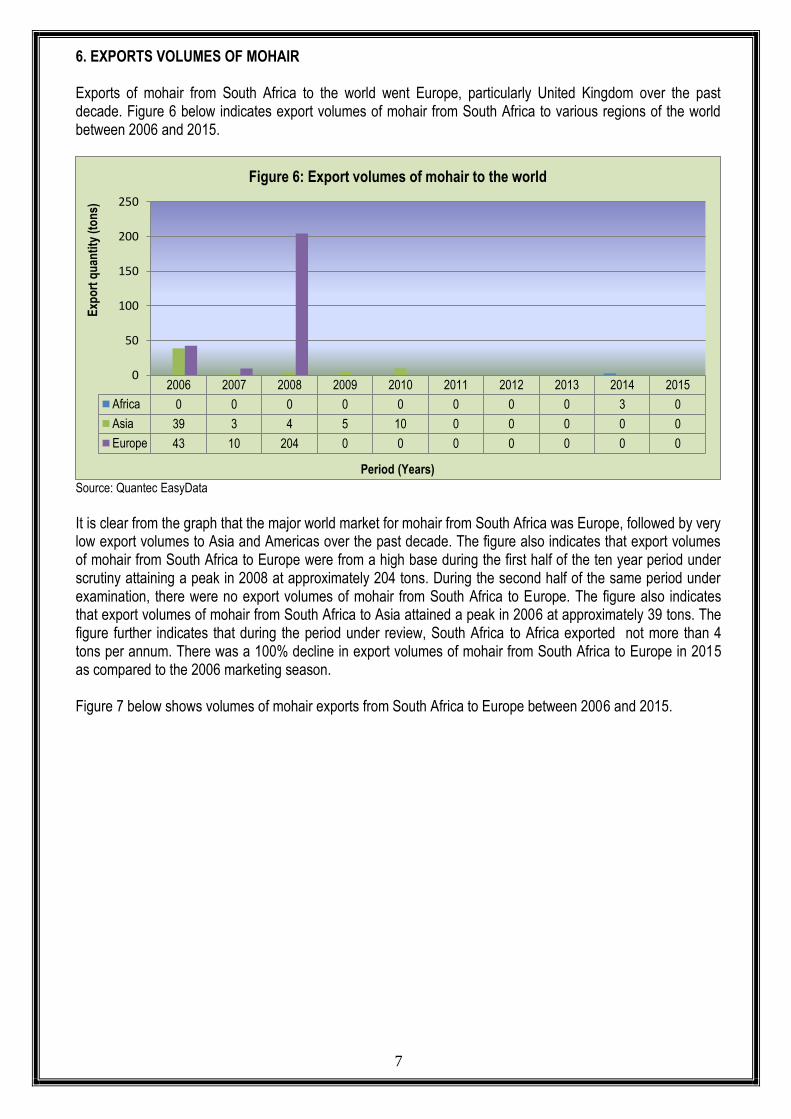
6. EXPORTS VOLUMES OF MOHAIR Exports of mohair from South Africa to the world went Europe, particularly United Kingdom over the past decade. Figure 6 below indicates export volumes of mohair from South Africa to various regions of the world between 2006 and 2015.
Source: Quantec EasyData
It is clear from the graph that the major world market for mohair from South Africa was Europe, followed by very low export volumes to Asia and Americas over the past decade. The figure also indicates that export volumes of mohair from South Africa to Europe were from a high base during the first half of the ten year period under scrutiny attaining a peak in 2008 at approximately 204 tons. During the second half of the same period under examination, there were no export volumes of mohair from South Africa to Europe. The figure also indicates that export volumes of mohair from South Africa to Asia attained a peak in 2006 at approximately 39 tons. The figure further indicates that during the period under review, South Africa to Africa exported not more than 4 tons per annum. There was a 100% decline in export volumes of mohair from South Africa to Europe in 2015 as compared to the 2006 marketing season. Figure 7 below shows volumes of mohair exports from South Africa to Europe between 2006 and 2015.
2006 2007 2008 2009 2010 2011 2012 2013 2014 2015
Africa 0 0 0 0 0 0 0 0 3 0
Asia 39 3 4 5 10 0 0 0 0 0
Europe 43 10 204 0 0 0 0 0 0 0
0
50
100
150
200
250
Exp
ort
qu
anti
ty (
ton
s)
Period (Years)
Figure 6: Export volumes of mohair to the world
8
Source: Quantec EasyData
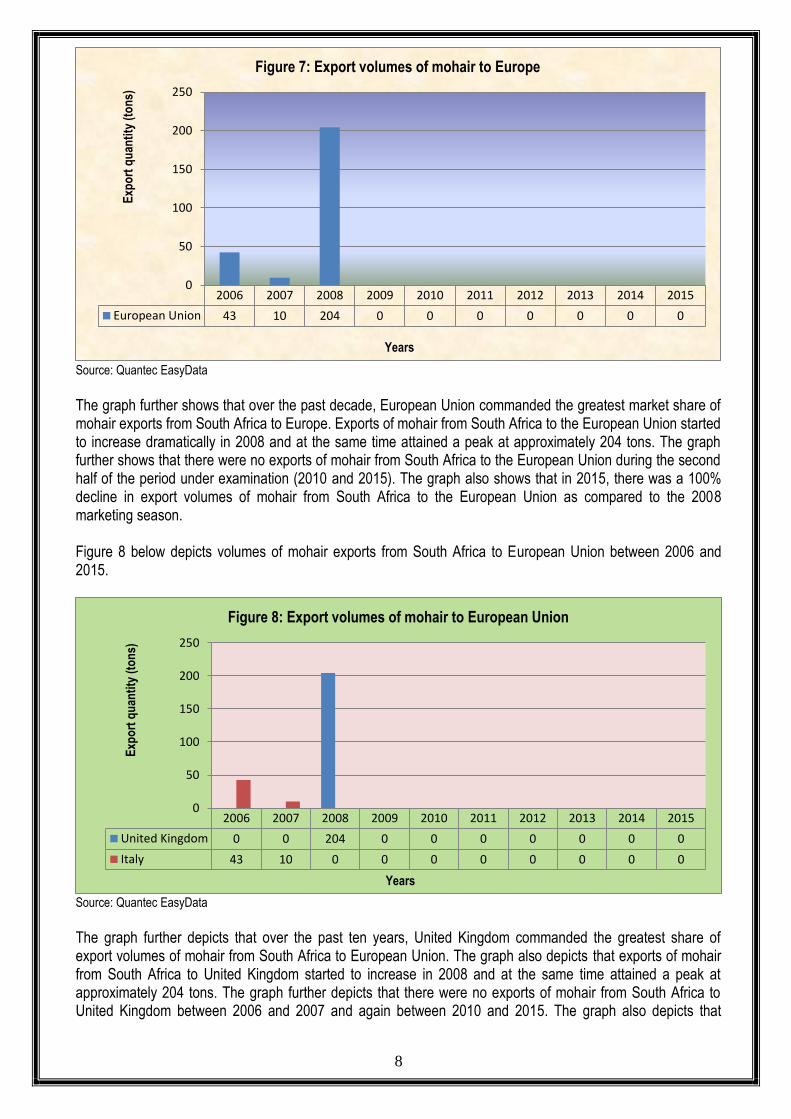
The graph further shows that over the past decade, European Union commanded the greatest market share of mohair exports from South Africa to Europe. Exports of mohair from South Africa to the European Union started to increase dramatically in 2008 and at the same time attained a peak at approximately 204 tons. The graph further shows that there were no exports of mohair from South Africa to the European Union during the second half of the period under examination (2010 and 2015). The graph also shows that in 2015, there was a 100% decline in export volumes of mohair from South Africa to the European Union as compared to the 2008 marketing season. Figure 8 below depicts volumes of mohair exports from South Africa to European Union between 2006 and 2015.
Source: Quantec EasyData
The graph further depicts that over the past ten years, United Kingdom commanded the greatest share of export volumes of mohair from South Africa to European Union. The graph also depicts that exports of mohair from South Africa to United Kingdom started to increase in 2008 and at the same time attained a peak at approximately 204 tons. The graph further depicts that there were no exports of mohair from South Africa to United Kingdom between 2006 and 2007 and again between 2010 and 2015. The graph also depicts that
2006 2007 2008 2009 2010 2011 2012 2013 2014 2015
European Union 43 10 204 0 0 0 0 0 0 0
0
50
100
150
200
250
Exp
ort
qu
anti
ty (
ton
s)
Years
Figure 7: Export volumes of mohair to Europe
2006 2007 2008 2009 2010 2011 2012 2013 2014 2015
United Kingdom 0 0 204 0 0 0 0 0 0 0
Italy 43 10 0 0 0 0 0 0 0 0
0
50
100
150
200
250
Exp
ort
qu
anti
ty (
ton
s)
Years
Figure 8: Export volumes of mohair to European Union

9
exports of mohair from South Africa to Italy attained a peak in 2006 at approximately 43 tons. South Africa did not export mohair to Italy between 2008 and 2015 marketing season. The graph also depicts that in 2015, there was 100% decline in export volumes of mohair from South Africa to United Kingdom as compared to the 2008 marketing season. Figure 9 below illustrates export volumes of mohair from South Africa to the Americas between 2006 and 2015.
Source: Quantec EasyData
The graph further illustrates that between 2006 and 2015, the major export market for mohair from South Africa to Americas was NAFTA with no competition from other Americas regions. The figure also illustrates that exports of mohair from South Africa to NAFTA started to increase in 2014, and at the same time attained a peak at an export volume of approximately 0.06 tons. The graph further illustrates that between 2006 and 2013 and 2015, there were no export volumes of mohair from South Africa to NAFTA. The graph also show that South Africa exported maximum of 0.12 tons South America in 2014. The graph also illustrates that there was 100% decline in the exports volumes of mohair from South Africa to NAFTA and South America in 2015 as compared to 2014 marketing season. Figure 9 below presents export volumes of mohair from South Africa to Asia between 2006 and 2015.
Source: Quantec EasyData
2006 2007 2008 2009 2010 2011 2012 2013 2014 2015
South America 0 0 0 0 0 0 0 0 0 0
NAFTA 0 0 0 0 0 0 0 0 0 0
0
0
0
0
0
0
0
0
Exp
ort
qu
anti
ty (
ton
s)
Period (Years)
Figure 9: Export volumes of mohair to Americas
2006 2007 2008 2009 2010 2011 2012 2013 2014 2015
Eastern Asia 39 3 4 5 10 0 0 0 0 0
0
5
10
15
20
25
30
35
40
45
Exp
ort
qu
anti
ty (
ton
s)
Years
Figure 9: Export volumes of mohair to Asia
10
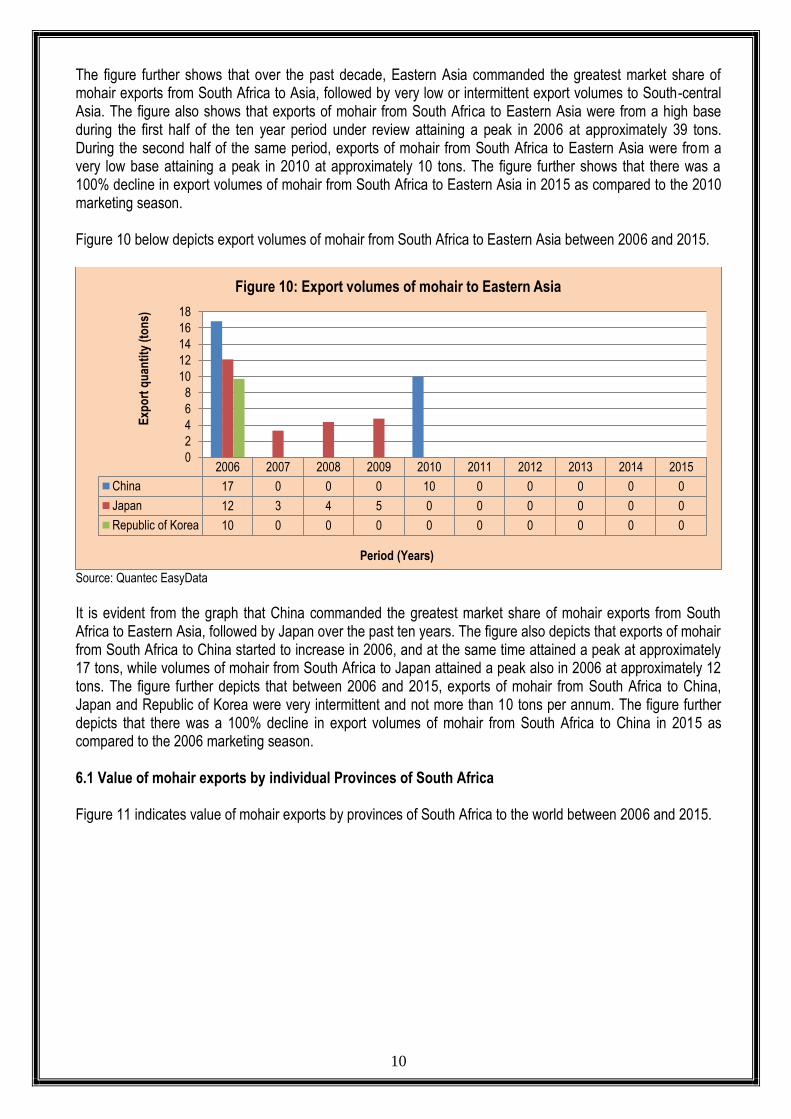
The figure further shows that over the past decade, Eastern Asia commanded the greatest market share of mohair exports from South Africa to Asia, followed by very low or intermittent export volumes to South-central Asia. The figure also shows that exports of mohair from South Africa to Eastern Asia were from a high base during the first half of the ten year period under review attaining a peak in 2006 at approximately 39 tons. During the second half of the same period, exports of mohair from South Africa to Eastern Asia were from a very low base attaining a peak in 2010 at approximately 10 tons. The figure further shows that there was a 100% decline in export volumes of mohair from South Africa to Eastern Asia in 2015 as compared to the 2010 marketing season. Figure 10 below depicts export volumes of mohair from South Africa to Eastern Asia between 2006 and 2015.
Source: Quantec EasyData
It is evident from the graph that China commanded the greatest market share of mohair exports from South Africa to Eastern Asia, followed by Japan over the past ten years. The figure also depicts that exports of mohair from South Africa to China started to increase in 2006, and at the same time attained a peak at approximately 17 tons, while volumes of mohair from South Africa to Japan attained a peak also in 2006 at approximately 12 tons. The figure further depicts that between 2006 and 2015, exports of mohair from South Africa to China, Japan and Republic of Korea were very intermittent and not more than 10 tons per annum. The figure further depicts that there was a 100% decline in export volumes of mohair from South Africa to China in 2015 as compared to the 2006 marketing season. 6.1 Value of mohair exports by individual Provinces of South Africa Figure 11 indicates value of mohair exports by provinces of South Africa to the world between 2006 and 2015.
2006 2007 2008 2009 2010 2011 2012 2013 2014 2015
China 17 0 0 0 10 0 0 0 0 0
Japan 12 3 4 5 0 0 0 0 0 0
Republic of Korea 10 0 0 0 0 0 0 0 0 0
0
2
4
6
8
10
12
14
16
18
Exp
ort
qu
anti
ty (
ton
s)
Period (Years)
Figure 10: Export volumes of mohair to Eastern Asia
11
Source: Quantec EasyData
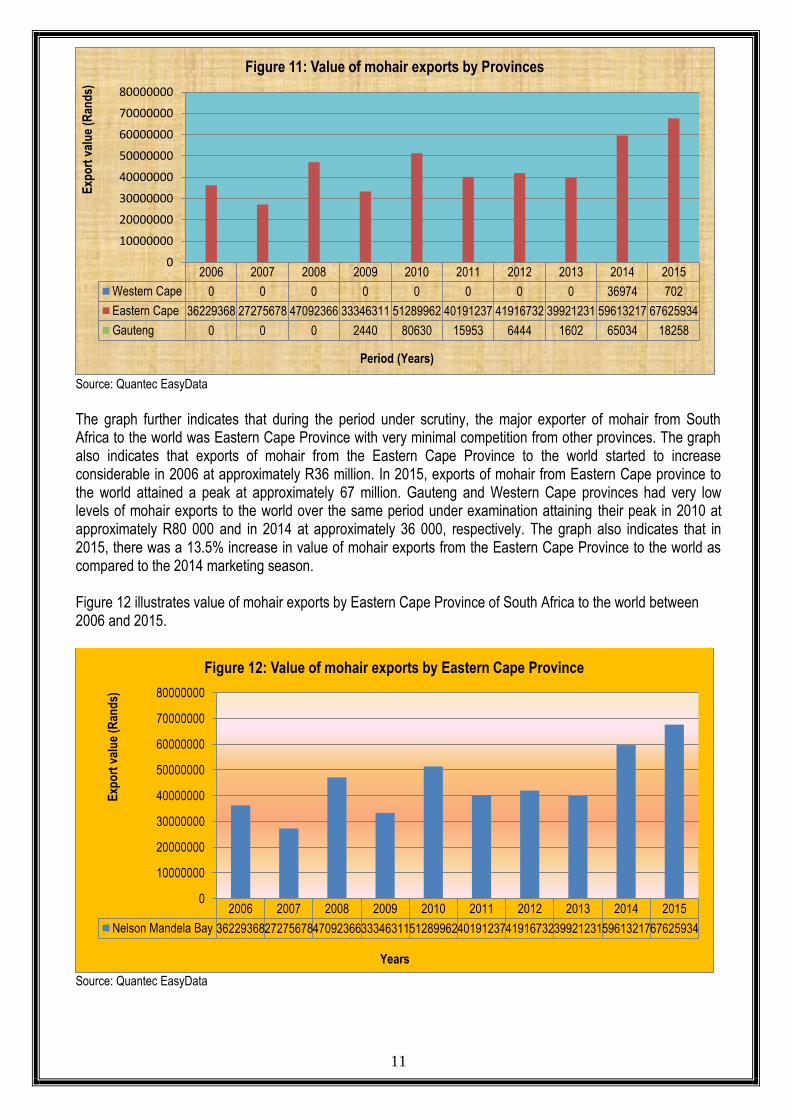
The graph further indicates that during the period under scrutiny, the major exporter of mohair from South Africa to the world was Eastern Cape Province with very minimal competition from other provinces. The graph also indicates that exports of mohair from the Eastern Cape Province to the world started to increase considerable in 2006 at approximately R36 million. In 2015, exports of mohair from Eastern Cape province to the world attained a peak at approximately 67 million. Gauteng and Western Cape provinces had very low levels of mohair exports to the world over the same period under examination attaining their peak in 2010 at approximately R80 000 and in 2014 at approximately 36 000, respectively. The graph also indicates that in 2015, there was a 13.5% increase in value of mohair exports from the Eastern Cape Province to the world as compared to the 2014 marketing season. Figure 12 illustrates value of mohair exports by Eastern Cape Province of South Africa to the world between 2006 and 2015.
Source: Quantec EasyData
2006 2007 2008 2009 2010 2011 2012 2013 2014 2015
Western Cape 0 0 0 0 0 0 0 0 36974 702
Eastern Cape 36229368 27275678 47092366 33346311 51289962 40191237 41916732 39921231 59613217 67625934
Gauteng 0 0 0 2440 80630 15953 6444 1602 65034 18258
0
10000000
20000000
30000000
40000000
50000000
60000000
70000000
80000000E
xpo
rt v
alu
e (R
and
s)
Period (Years)
Figure 11: Value of mohair exports by Provinces
2006 2007 2008 2009 2010 2011 2012 2013 2014 2015
Nelson Mandela Bay 36229368272756784709236633346311512899624019123741916732399212315961321767625934
0
10000000
20000000
30000000
40000000
50000000
60000000
70000000
80000000
Exp
ort
val
ue
(Ran
ds)
Years
Figure 12: Value of mohair exports by Eastern Cape Province
12
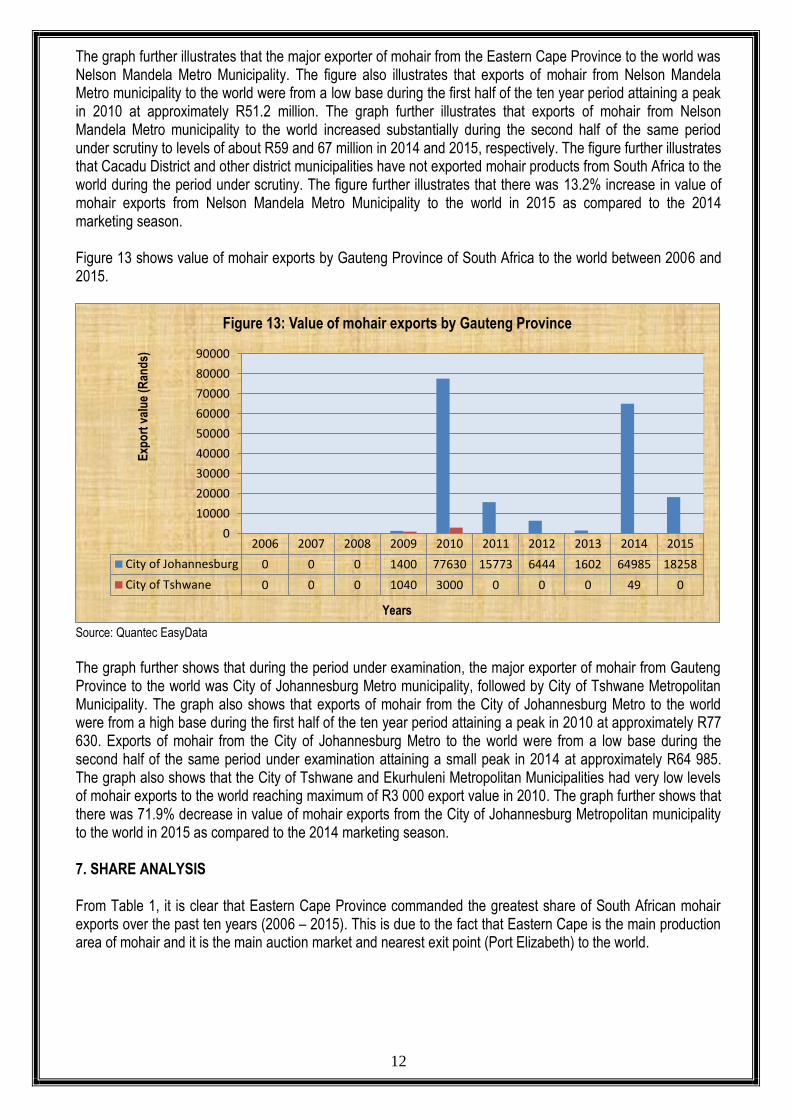
The graph further illustrates that the major exporter of mohair from the Eastern Cape Province to the world was Nelson Mandela Metro Municipality. The figure also illustrates that exports of mohair from Nelson Mandela Metro municipality to the world were from a low base during the first half of the ten year period attaining a peak in 2010 at approximately R51.2 million. The graph further illustrates that exports of mohair from Nelson Mandela Metro municipality to the world increased substantially during the second half of the same period under scrutiny to levels of about R59 and 67 million in 2014 and 2015, respectively. The figure further illustrates that Cacadu District and other district municipalities have not exported mohair products from South Africa to the world during the period under scrutiny. The figure further illustrates that there was 13.2% increase in value of mohair exports from Nelson Mandela Metro Municipality to the world in 2015 as compared to the 2014 marketing season. Figure 13 shows value of mohair exports by Gauteng Province of South Africa to the world between 2006 and 2015.
Source: Quantec EasyData
The graph further shows that during the period under examination, the major exporter of mohair from Gauteng Province to the world was City of Johannesburg Metro municipality, followed by City of Tshwane Metropolitan Municipality. The graph also shows that exports of mohair from the City of Johannesburg Metro to the world were from a high base during the first half of the ten year period attaining a peak in 2010 at approximately R77 630. Exports of mohair from the City of Johannesburg Metro to the world were from a low base during the second half of the same period under examination attaining a small peak in 2014 at approximately R64 985. The graph also shows that the City of Tshwane and Ekurhuleni Metropolitan Municipalities had very low levels of mohair exports to the world reaching maximum of R3 000 export value in 2010. The graph further shows that there was 71.9% decrease in value of mohair exports from the City of Johannesburg Metropolitan municipality to the world in 2015 as compared to the 2014 marketing season. 7. SHARE ANALYSIS From Table 1, it is clear that Eastern Cape Province commanded the greatest share of South African mohair exports over the past ten years (2006 – 2015). This is due to the fact that Eastern Cape is the main production area of mohair and it is the main auction market and nearest exit point (Port Elizabeth) to the world.
2006 2007 2008 2009 2010 2011 2012 2013 2014 2015
City of Johannesburg 0 0 0 1400 77630 15773 6444 1602 64985 18258
City of Tshwane 0 0 0 1040 3000 0 0 0 49 0
0
10000
20000
30000
40000
50000
60000
70000
80000
90000
Exp
ort
val
ue
(Ran
ds)
Years
Figure 13: Value of mohair exports by Gauteng Province
13
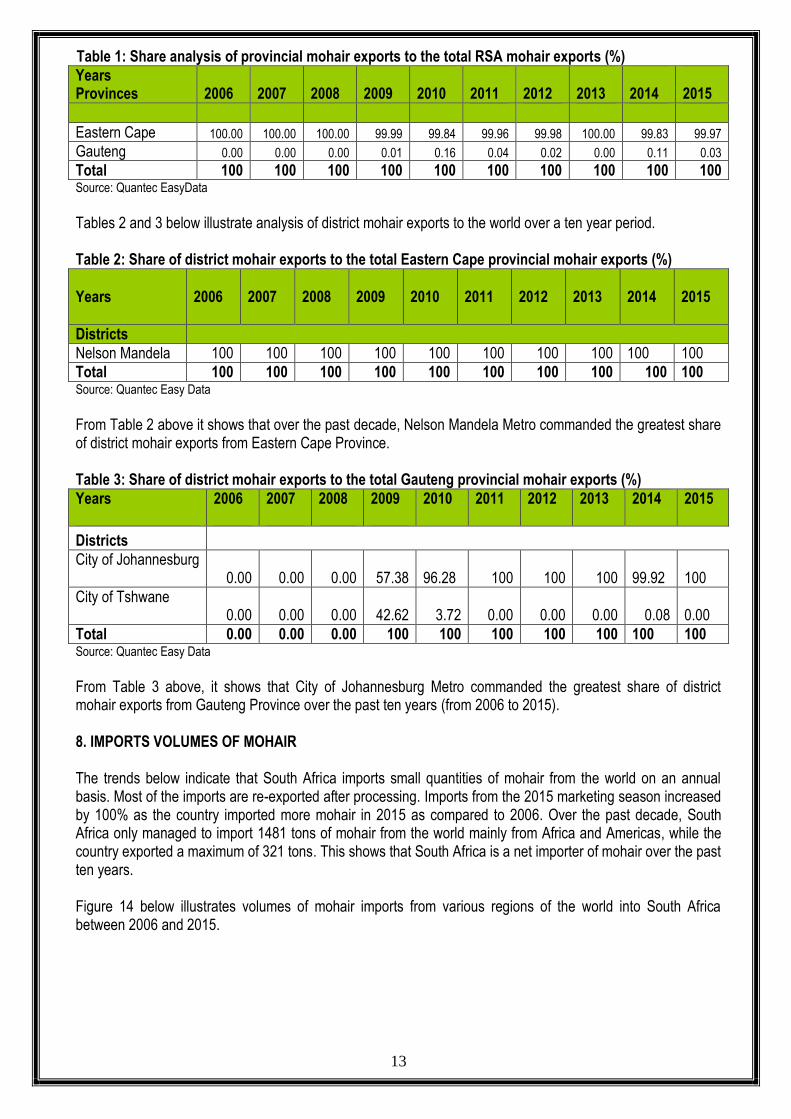
Table 1: Share analysis of provincial mohair exports to the total RSA mohair exports (%)
Years Provinces 2006 2007 2008 2009
2010
2011
2012
2013
2014
2015
Eastern Cape 100.00 100.00 100.00 99.99 99.84 99.96 99.98 100.00 99.83 99.97 Gauteng 0.00 0.00 0.00 0.01 0.16 0.04 0.02 0.00 0.11 0.03 Total 100 100 100 100 100 100 100 100 100 100 Source: Quantec EasyData
Tables 2 and 3 below illustrate analysis of district mohair exports to the world over a ten year period. Table 2: Share of district mohair exports to the total Eastern Cape provincial mohair exports (%)
Years
2006
2007
2008
2009
2010
2011
2012
2013
2014
2015
Districts
Nelson Mandela 100 100 100 100 100 100 100 100 100 100
Total 100 100 100 100 100 100 100 100 100 100 Source: Quantec Easy Data
From Table 2 above it shows that over the past decade, Nelson Mandela Metro commanded the greatest share of district mohair exports from Eastern Cape Province. Table 3: Share of district mohair exports to the total Gauteng provincial mohair exports (%)
Years
2006
2007
2008
2009
2010 2011 2012 2013 2014 2015
Districts
City of Johannesburg 0.00 0.00 0.00 57.38 96.28 100 100 100 99.92 100
City of Tshwane 0.00 0.00 0.00 42.62 3.72 0.00 0.00 0.00 0.08 0.00
Total 0.00 0.00 0.00 100 100 100 100 100 100 100 Source: Quantec Easy Data
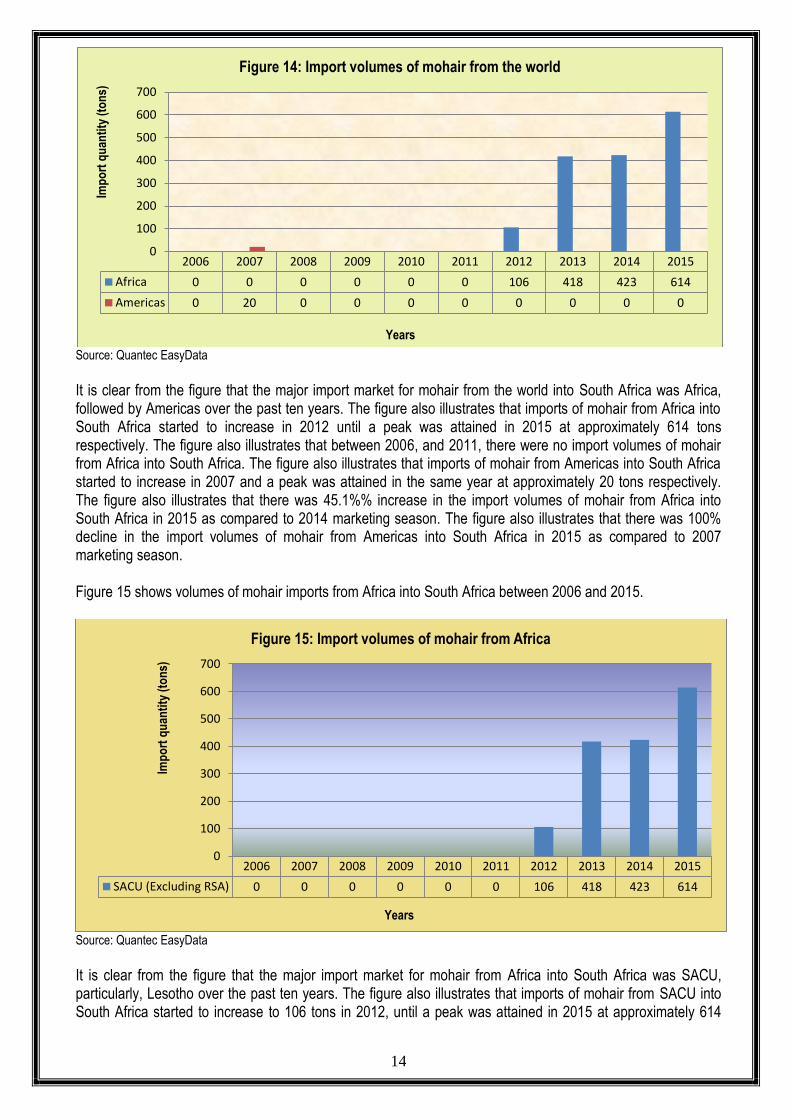
From Table 3 above, it shows that City of Johannesburg Metro commanded the greatest share of district mohair exports from Gauteng Province over the past ten years (from 2006 to 2015). 8. IMPORTS VOLUMES OF MOHAIR The trends below indicate that South Africa imports small quantities of mohair from the world on an annual basis. Most of the imports are re-exported after processing. Imports from the 2015 marketing season increased by 100% as the country imported more mohair in 2015 as compared to 2006. Over the past decade, South Africa only managed to import 1481 tons of mohair from the world mainly from Africa and Americas, while the country exported a maximum of 321 tons. This shows that South Africa is a net importer of mohair over the past ten years. Figure 14 below illustrates volumes of mohair imports from various regions of the world into South Africa between 2006 and 2015.
14
Source: Quantec EasyData
It is clear from the figure that the major import market for mohair from the world into South Africa was Africa, followed by Americas over the past ten years. The figure also illustrates that imports of mohair from Africa into South Africa started to increase in 2012 until a peak was attained in 2015 at approximately 614 tons respectively. The figure also illustrates that between 2006, and 2011, there were no import volumes of mohair from Africa into South Africa. The figure also illustrates that imports of mohair from Americas into South Africa started to increase in 2007 and a peak was attained in the same year at approximately 20 tons respectively. The figure also illustrates that there was 45.1%% increase in the import volumes of mohair from Africa into South Africa in 2015 as compared to 2014 marketing season. The figure also illustrates that there was 100% decline in the import volumes of mohair from Americas into South Africa in 2015 as compared to 2007 marketing season. Figure 15 shows volumes of mohair imports from Africa into South Africa between 2006 and 2015.
Source: Quantec EasyData
It is clear from the figure that the major import market for mohair from Africa into South Africa was SACU, particularly, Lesotho over the past ten years. The figure also illustrates that imports of mohair from SACU into South Africa started to increase to 106 tons in 2012, until a peak was attained in 2015 at approximately 614
2006 2007 2008 2009 2010 2011 2012 2013 2014 2015
Africa 0 0 0 0 0 0 106 418 423 614
Americas 0 20 0 0 0 0 0 0 0 0
0
100
200
300
400
500
600
700Im
po
rt q
uan
tity
(to
ns)
Years
Figure 14: Import volumes of mohair from the world
2006 2007 2008 2009 2010 2011 2012 2013 2014 2015
SACU (Excluding RSA) 0 0 0 0 0 0 106 418 423 614
0
100
200
300
400
500
600
700
Imp
ort
qu
anti
ty (
ton
s)
Years
Figure 15: Import volumes of mohair from Africa
15
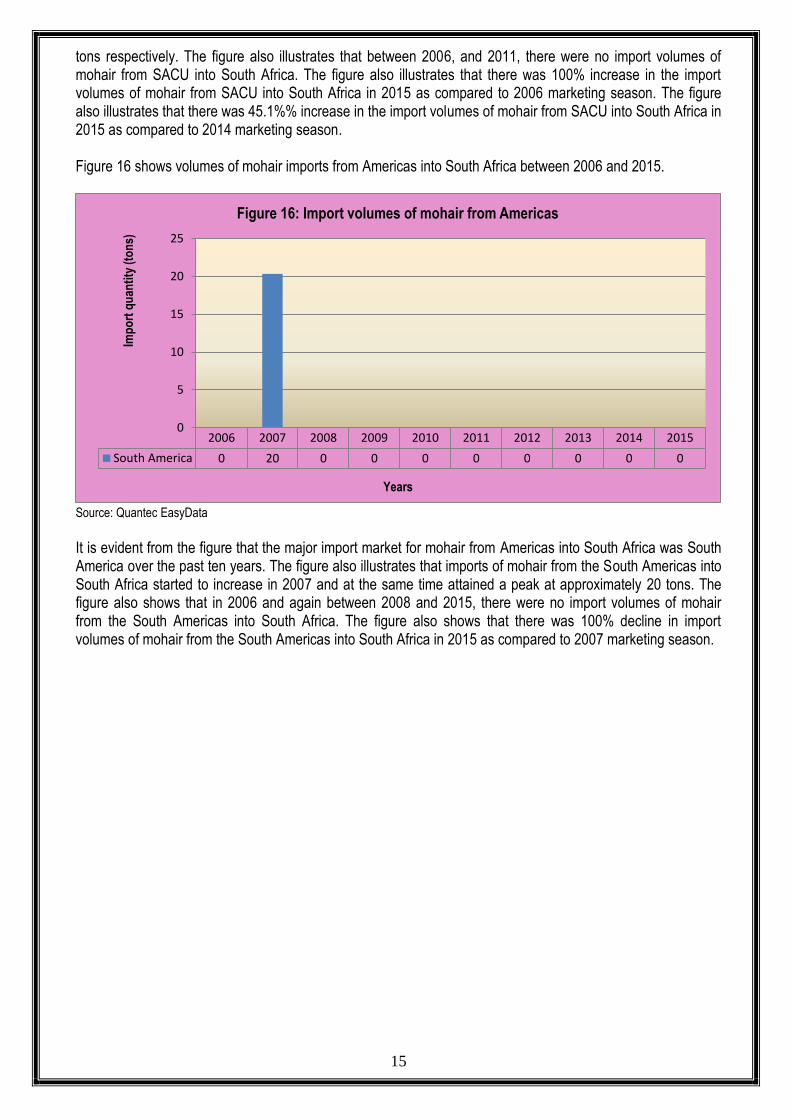
tons respectively. The figure also illustrates that between 2006, and 2011, there were no import volumes of mohair from SACU into South Africa. The figure also illustrates that there was 100% increase in the import volumes of mohair from SACU into South Africa in 2015 as compared to 2006 marketing season. The figure also illustrates that there was 45.1%% increase in the import volumes of mohair from SACU into South Africa in 2015 as compared to 2014 marketing season. Figure 16 shows volumes of mohair imports from Americas into South Africa between 2006 and 2015.
Source: Quantec EasyData
It is evident from the figure that the major import market for mohair from Americas into South Africa was South America over the past ten years. The figure also illustrates that imports of mohair from the South Americas into South Africa started to increase in 2007 and at the same time attained a peak at approximately 20 tons. The figure also shows that in 2006 and again between 2008 and 2015, there were no import volumes of mohair from the South Americas into South Africa. The figure also shows that there was 100% decline in import volumes of mohair from the South Americas into South Africa in 2015 as compared to 2007 marketing season.
2006 2007 2008 2009 2010 2011 2012 2013 2014 2015
South America 0 20 0 0 0 0 0 0 0 0
0
5
10
15
20
25
Imp
ort
qu
anti
ty (
ton
s)
Years
Figure 16: Import volumes of mohair from Americas
16
9. MOHAIR VALUE CHAIN Figure 17: Structure of the mohair industry.
50.00 Million Consumers (Estimate for 2015)
0.20 % of Agricultural Production
31 Retailers
18
Manufacturers
Import:
0.74 tons
Export: 3280,98 tons
2 GROWER MOHAIR ASSOCIATIONS
1. Camdeboo Mohair
2. South African Mohair Growers
Association
7 BUYERS
1. A Dewavrin Freres (Pty) Ltd.
2. Standard Wool
3. 3. Mosenthals Wool & Mohair SA (Pty)
Ltd
4. Samil (Pty) Ltd
5. Seal South Africa
6. Stucken & Company (Pty) Ltd
7. New England Wool SA
Production :
2.3 million kg
2 PROCESSORS
1. Border Combing Company
2. Gubb & Inggs
18 MANUFACTURERS
1. Abafazi
2. Annette Oelofse Mohair Products
3. Adele’s Mohair
4. Ali-Jean Fibre Design
5. Cape Mohair Limited
6. Coral Stephens
7. Elsa Barnard Mohair Carpets
8. Hinterveld
9. Jan Paul Barnard
10. Loubear Mohair
11. Mohair Weavers
12. Momento’s of Africa
13. Peta-Lee
14. Shuttleworth Weaving
15. The Scarf Initiative
16. Umsobomvu textiles
17. Wolskuur Spinners CC
18. Ingubo Weavers (Pty Ltd)
Angora Goat Numbers
718 000
Export of Raw
Mohair
Export of
mohair top or
scoureds
Export of
yarn and
fabric
Import of
Raw Mohair
Import of yarn
and fabric
3 Auction Ports
1. Port Elizabeth
2. Durban
3. Cape Town
3 Brokers
1. BKB
2. Cape Mohair &
Wool
3. Blue Crane
Wool & Mohair
17
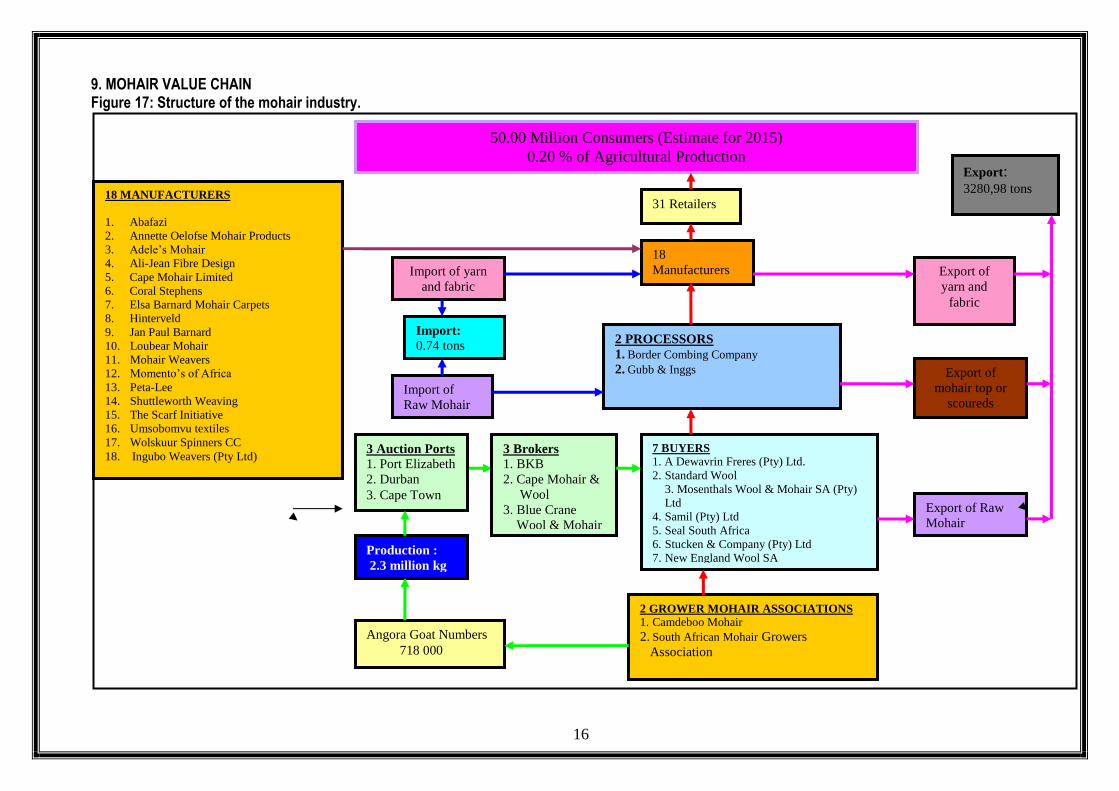
The value chain of mohair starts with 2 Grower Mohair Associations with members that owns 718 000 angora goats. Production in 2015 was estimated at 2500 tons of mohair that was traded through 3 auction ports managed by 3 brokers as compared to 3700 tons in 2006. Auctions are held every Wednesday during the production seasons and around 32 auctions took place throughout the year. There are 7 main buyers of mohair acting on behalf of local and international processors. Direct sales occur on a small scale. Processors process mohair into tops and scoureds and sent them to 18 manufacturers. Manufacturers produce products such as blankets, scarves, shawls, throws, plaids, bedcovers, cushions, yarn, fabric, etc. Import and export of mohair occurs in every stage of the value chain; from raw wool to yarn and fabric. Import of raw mohair is mainly to be processed and re-exported. Import volumes of mohair amounted to 614 tons of mohair while exports were estimated at 0.00 tons during 2015 marketing season. 10. BARRIERS TO PARTICIPATION BY THE EMERGING SECTOR The quantity and quality of mohair produced by small-scale producers vary from season to season due to:
Very difficult conditions under which they farm, which is according to the communal pastoral system, whereby the veld belongs to the community.
Breeding programmes are difficult and complicated to apply because all types of goats run together in the veld. This problem is aggravated during the mating season because the producer has to tend the goats day and night in order to avoid crossbreeding.
Small-scale mohair producers lack sufficient and easy accessible sheltering, this poses a problem because Angora goats are very sensitive to drastic weather changes, usually more than one large shelter has to be erected on different locations on the farm and this can be quite costly.
There is no sufficient shearing and mohair sorting equipment, applicable hair sorting and classing and classing knowledge of both farmer and labourers is minimal.
11. BLACK ECONOMIC EMPOWERMENT INITIATIVES The SA Mohair industry fully supports BEE policy of government since its initiation in 2006, and has accepted the responsibility for Black Economic Empowerment and it has established projects as follows:
a. The combined project with SAMIL and governmental organizations to establish training centres with the aim of training individuals in all aspects of mohair farming.
b. The Hardwood project at Klipplaat (Mentoring). c. The mentoring project at Prince Albert. d. The mentoring project at Pearston.
The industry latest focus is on the area around Matatiele in the north eastern part of the Eastern Cape Province. Most Angora goats owned by people of colour are found in this part of the country. Efforts will therefore to be made by the mohair industry to help the villagers obtain superior breeding material, especially rams. No classing of mohair is done in the area, once more the industry will have to step in and conduct classing demonstrations to teach the people the very basic principles of classing mohair.
11.1 Representation within the Empowerment Trust
The emerging farmers are represented in the Mohair Trust as well as in the Empowerment Trust;
The National agricultural Marketing Council also has two trustees in the empowerment Trust, which, it is accepted, will be ethnically representative of the demographic of the South African population.
The other trustees are:
18
The Chairman and Vice-Chairman of the Mohair Trust The Chairman of Mohair South Africa Limited. The President of SA Mohair Growers Association.
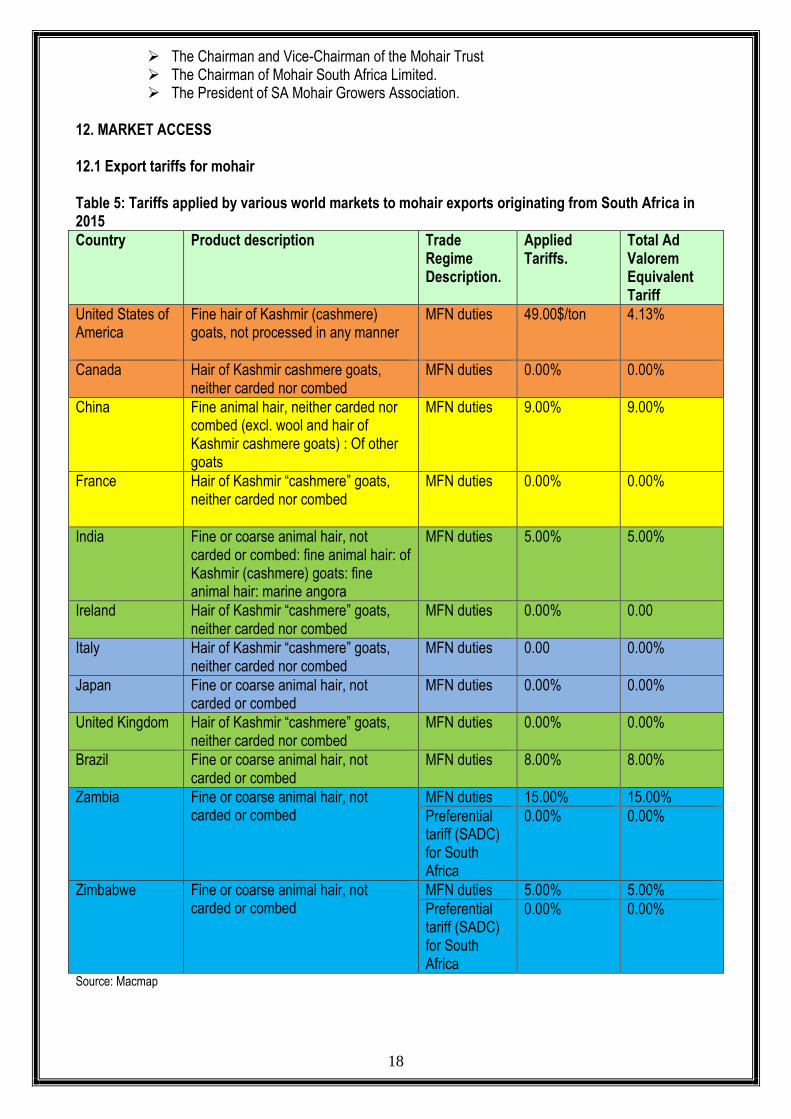
12. MARKET ACCESS 12.1 Export tariffs for mohair Table 5: Tariffs applied by various world markets to mohair exports originating from South Africa in 2015
Country Product description Trade Regime Description.
Applied Tariffs.
Total Ad Valorem Equivalent Tariff
United States of America
Fine hair of Kashmir (cashmere) goats, not processed in any manner
MFN duties 49.00$/ton 4.13%
Canada
Hair of Kashmir cashmere goats, neither carded nor combed
MFN duties 0.00% 0.00%
China Fine animal hair, neither carded nor combed (excl. wool and hair of Kashmir cashmere goats) : Of other goats
MFN duties 9.00% 9.00%
France
Hair of Kashmir “cashmere” goats, neither carded nor combed
MFN duties 0.00% 0.00%
India Fine or coarse animal hair, not carded or combed: fine animal hair: of Kashmir (cashmere) goats: fine animal hair: marine angora
MFN duties 5.00% 5.00%
Ireland Hair of Kashmir “cashmere” goats, neither carded nor combed
MFN duties 0.00% 0.00
Italy
Hair of Kashmir “cashmere” goats, neither carded nor combed
MFN duties 0.00 0.00%
Japan
Fine or coarse animal hair, not carded or combed
MFN duties 0.00% 0.00%
United Kingdom Hair of Kashmir “cashmere” goats, neither carded nor combed
MFN duties 0.00% 0.00%
Brazil Fine or coarse animal hair, not carded or combed
MFN duties 8.00% 8.00%
Zambia Fine or coarse animal hair, not carded or combed
MFN duties 15.00% 15.00%
Preferential tariff (SADC) for South Africa
0.00% 0.00%
Zimbabwe Fine or coarse animal hair, not carded or combed
MFN duties 5.00% 5.00%
Preferential tariff (SADC) for South Africa
0.00% 0.00%
Source: Macmap
19
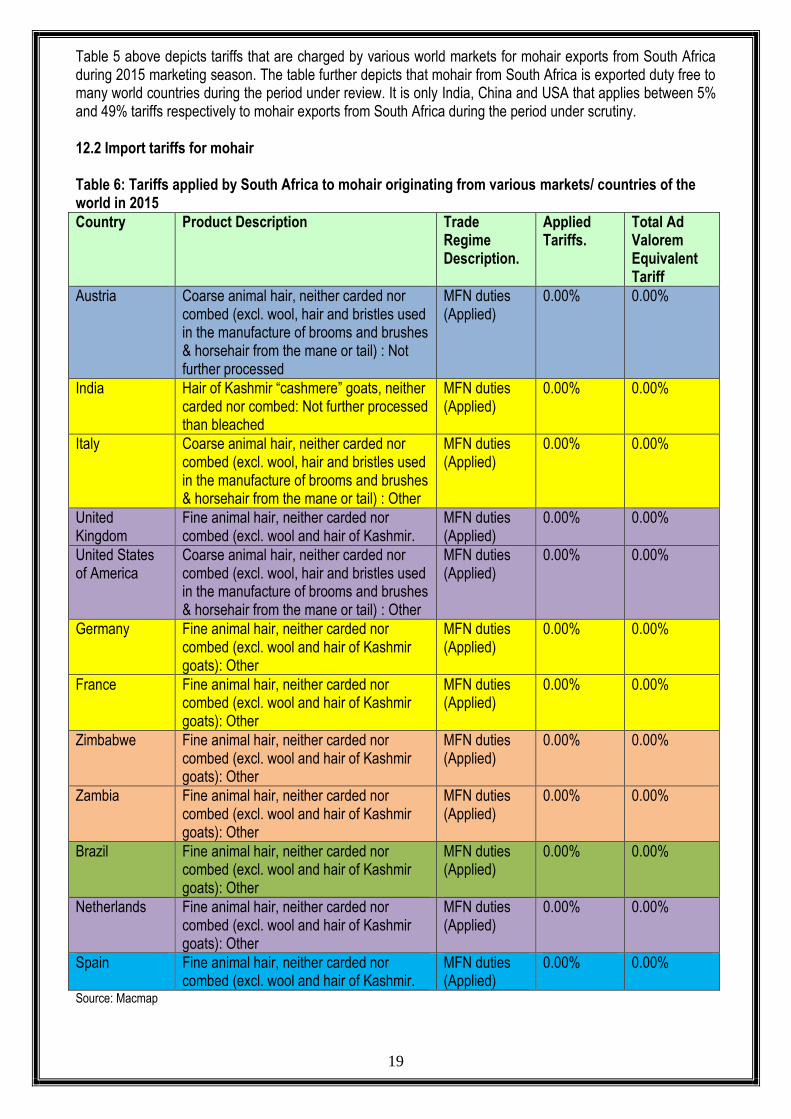
Table 5 above depicts tariffs that are charged by various world markets for mohair exports from South Africa during 2015 marketing season. The table further depicts that mohair from South Africa is exported duty free to many world countries during the period under review. It is only India, China and USA that applies between 5% and 49% tariffs respectively to mohair exports from South Africa during the period under scrutiny. 12.2 Import tariffs for mohair Table 6: Tariffs applied by South Africa to mohair originating from various markets/ countries of the world in 2015
Country Product Description Trade Regime Description.
Applied Tariffs.
Total Ad Valorem Equivalent Tariff
Austria Coarse animal hair, neither carded nor combed (excl. wool, hair and bristles used in the manufacture of brooms and brushes & horsehair from the mane or tail) : Not further processed
MFN duties (Applied)
0.00% 0.00%
India Hair of Kashmir “cashmere” goats, neither carded nor combed: Not further processed than bleached
MFN duties (Applied)
0.00% 0.00%
Italy Coarse animal hair, neither carded nor combed (excl. wool, hair and bristles used in the manufacture of brooms and brushes & horsehair from the mane or tail) : Other
MFN duties (Applied)
0.00% 0.00%
United Kingdom
Fine animal hair, neither carded nor combed (excl. wool and hair of Kashmir.
MFN duties (Applied)
0.00% 0.00%
United States of America
Coarse animal hair, neither carded nor combed (excl. wool, hair and bristles used in the manufacture of brooms and brushes & horsehair from the mane or tail) : Other
MFN duties (Applied)
0.00% 0.00%
Germany Fine animal hair, neither carded nor combed (excl. wool and hair of Kashmir goats): Other
MFN duties (Applied)
0.00% 0.00%
France Fine animal hair, neither carded nor combed (excl. wool and hair of Kashmir goats): Other
MFN duties (Applied)
0.00% 0.00%
Zimbabwe Fine animal hair, neither carded nor combed (excl. wool and hair of Kashmir goats): Other
MFN duties (Applied)
0.00% 0.00%
Zambia Fine animal hair, neither carded nor combed (excl. wool and hair of Kashmir goats): Other
MFN duties (Applied)
0.00% 0.00%
Brazil Fine animal hair, neither carded nor combed (excl. wool and hair of Kashmir goats): Other
MFN duties (Applied)
0.00% 0.00%
Netherlands Fine animal hair, neither carded nor combed (excl. wool and hair of Kashmir goats): Other
MFN duties (Applied)
0.00% 0.00%
Spain Fine animal hair, neither carded nor combed (excl. wool and hair of Kashmir.
MFN duties (Applied)
0.00% 0.00%
Source: Macmap
20
Table 6 above indicates tariffs that are charged by South Africa for imports of mohair from the world during 2015 marketing season. The table further indicates that mohair from the world countries/ markets to South Africa is imported duty free at 0.00% in 2015.
21
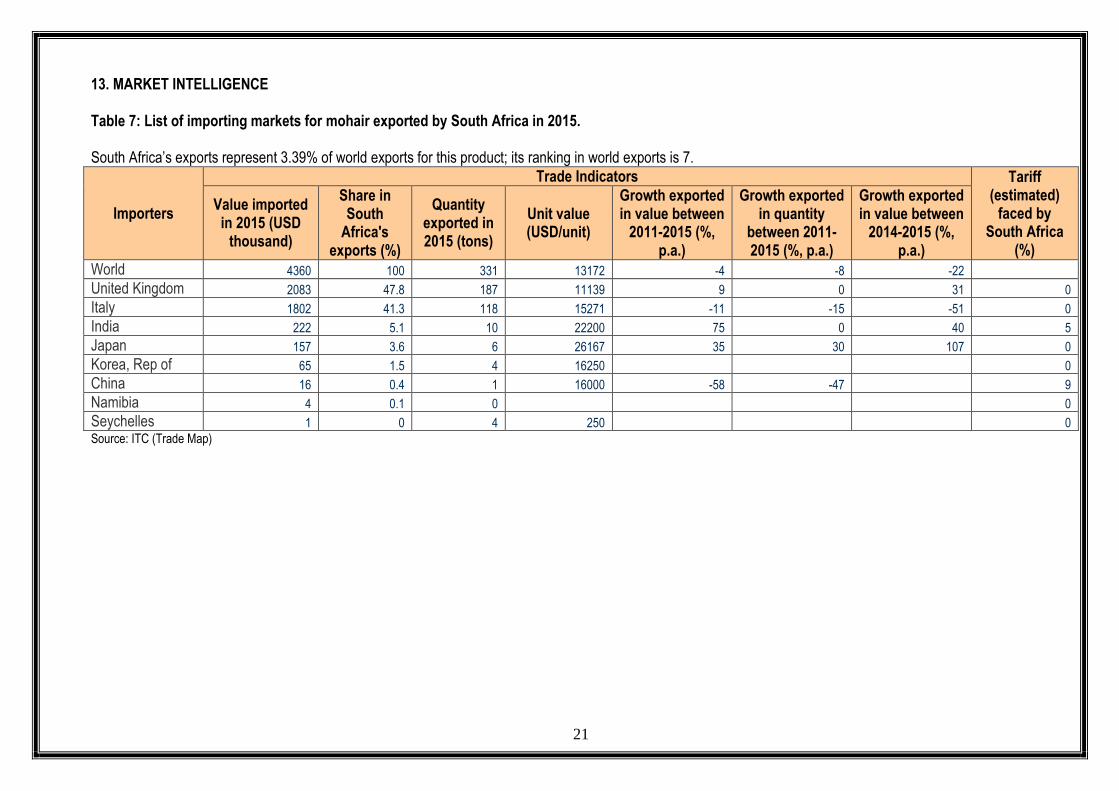
13. MARKET INTELLIGENCE Table 7: List of importing markets for mohair exported by South Africa in 2015. South Africa’s exports represent 3.39% of world exports for this product; its ranking in world exports is 7.
Importers
Trade Indicators Tariff (estimated)
faced by South Africa
(%)
Value imported in 2015 (USD
thousand)
Share in South
Africa's exports (%)
Quantity exported in 2015 (tons)
Unit value (USD/unit)
Growth exported in value between
2011-2015 (%, p.a.)
Growth exported in quantity
between 2011-2015 (%, p.a.)
Growth exported in value between
2014-2015 (%, p.a.)
World 4360 100 331 13172 -4 -8 -22
United Kingdom 2083 47.8 187 11139 9 0 31 0
Italy 1802 41.3 118 15271 -11 -15 -51 0
India 222 5.1 10 22200 75 0 40 5
Japan 157 3.6 6 26167 35 30 107 0
Korea, Rep of 65 1.5 4 16250 0
China 16 0.4 1 16000 -58 -47 9
Namibia 4 0.1 0 0
Seychelles 1 0 4 250 0
Source: ITC (Trade Map)
22
Table 7 shows the list of importing markets for fine or coarse animal hair (not carded or combed) exported by South Africa to the world in 2015. The table further shows that in 2015, South Africa exported a total of 331 tons of fine or coarse animal hair at an average value of US$ 13 172/unit. United Kingdom and Italy were the leading importers of fine or coarse animal hair, accounting for 47.8% share and 41.3% share respectively of South Africa’s export market. United Kingdom is the world’s 1st leading importer of this product while Italy is 2nd. Italy’s imports worldwide experienced a decline in value and quantity of 11% and 15% respectively. United Kingdom experienced an increase or value of 9% per annum over the period between 2011 and 2015, and the growth in value and quantity of the world market over the same period declined by 4% and 8% respectively.
23
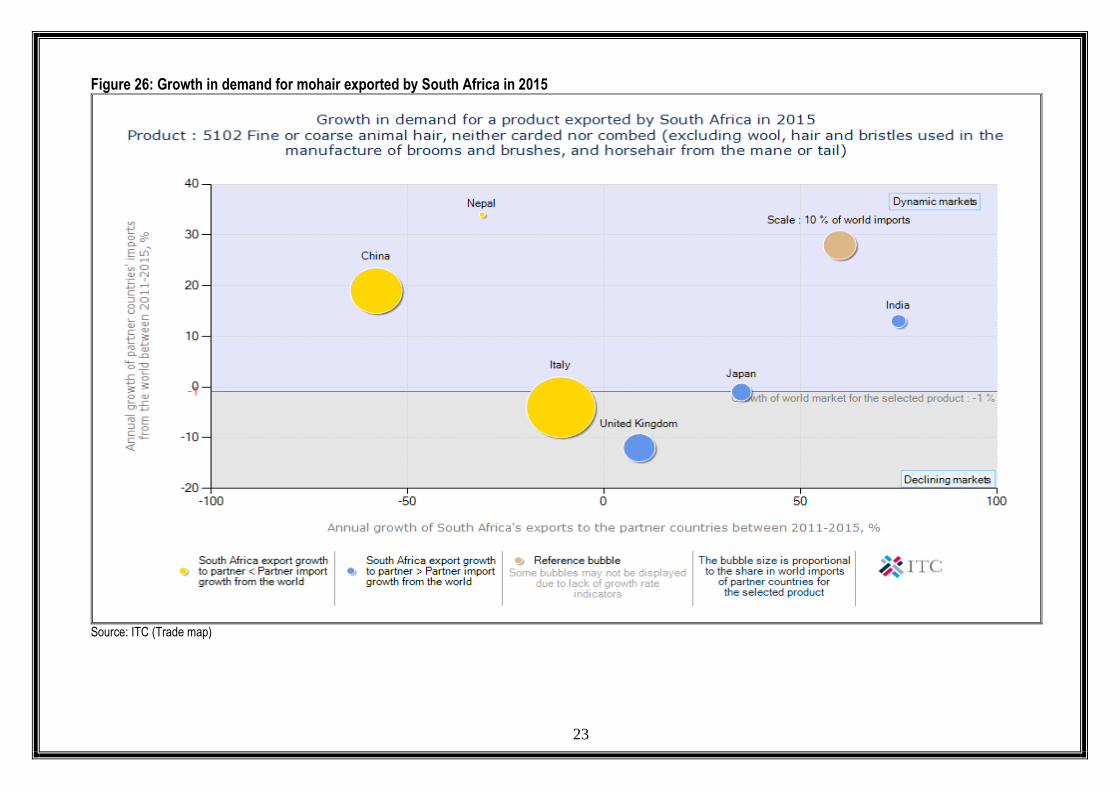
Figure 26: Growth in demand for mohair exported by South Africa in 2015
Source: ITC (Trade map)
24
Figure 26 indicates growth in demand for fine or coarse hair (not carded or combed) exported by South Africa in 2015. The graph further indicates that Italy, China and Nepal were the largest import markets for fine or coarse animal hair from South Africa during the period under scrutiny, with Italy being a declining market. However, South Africa’s exports of fine or coarse animal hair to Italy declined by 11% while Italy’s imports from the world also decreased by 15% between 2011 and 2015. Although United Kingdom is one of the biggest markets of fine or coarse animal hair from South Africa, its annual growth of South Africa exports increased by 9%, while China‘s imports from the world decreased by 58%. The bubble graph further indicates that the annual growth of South Africa’s exports to Italy decreased by 11% between 2011 and 2015. The graph also indicates that India was potential market for fine or coarse animal hair from South Africa between 2011 and 2015 at 75%. Although United Kingdom was in a declining market, its annual growth of South Africa’s exports to partner countries between 2010 and 2014 grew by approximately 9%.
25
Figure 27: Prospects for market diversification for mohair exported by South Africa in 2015
Source: ITC (Trade Map)
26
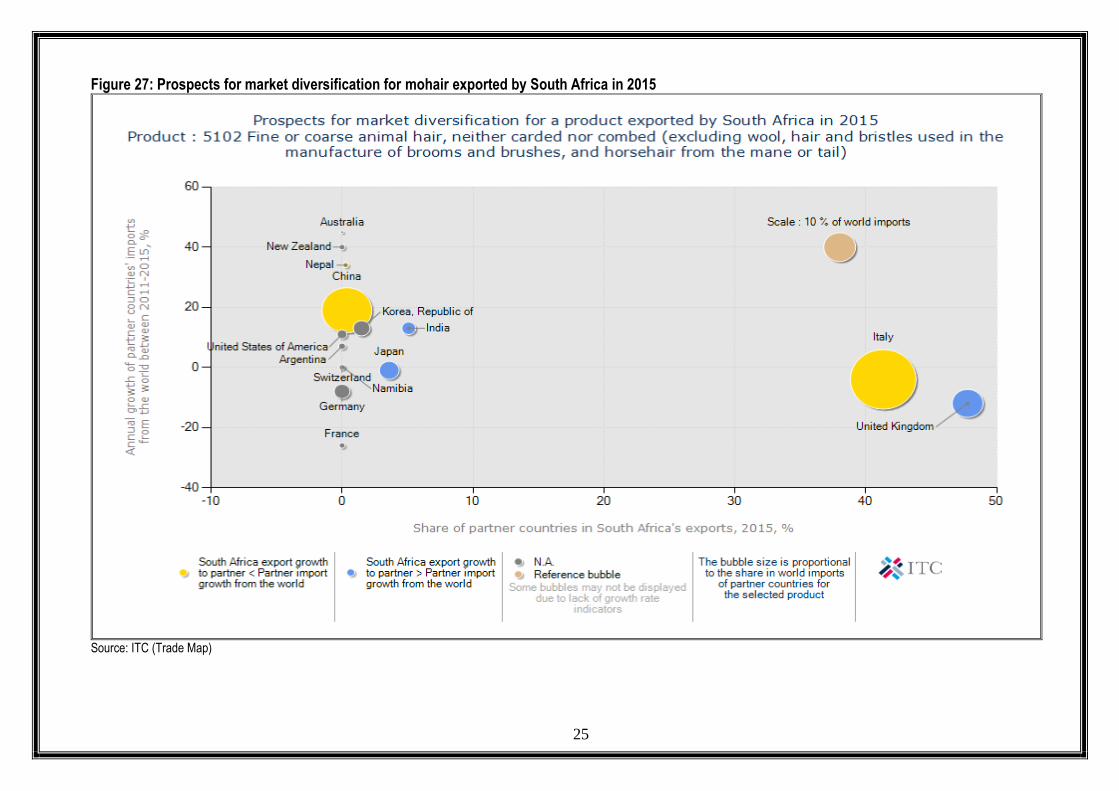
Figure 27 shows prospects for market diversification for fine or coarse animal hair (not carded or combed) exported by South Africa in 2015. The figure further shows that Italy and China were the biggest markets of fine or coarse animal hair from South Africa during 2015. The figure also shows that if South Africa has to diversify its exports of fine or coarse animal hair, the other markets exist in Japan and India. Between 2011 and 2015, South Africa’s fine or coarse animal hair exported to India and United Kingdom were growing at a rate that is more than their import growth from the rest of the world. During the same period, South Africa’s fine or coarse animal hair exports to United Kingdom were growing at a rate that is more than their exports to the rest of the world. By adding a horizontal line representing the world market growth and a vertical line representing the average growth of South Africa’s import of this product, the following conclusions can be made:
South Africa’s exports for fine or coarse animal hair to China were declining while world’s imports were growing at a faster pace than South Africa’s exports.
South Africa’s exports for fine or coarse animal hair to Italy and United Kingdom were growing faster than world’s imports.
South Africa’s exports for fine or coarse animal hair to Japan were growing at a slow pace than the world’s imports.
South Africa’s exports for fine or coarse animal hair to United Kingdom were growing faster than annual growth of partner countries’ imports from world.
27
14. COMPETITIVENESS OF SOUTH AFRICA’S MOHAIR IMPORTS
Table 8: List of supplying markets for mohair imported by South Africa in 2015
Exporters
Trade Indicators Tariff
(estimated) applied by
South Africa (%)
Value imported in 2015 (USD thousand)
Share in South Africa's imports
(%)
Quantity imported in 2015
(tons)
Unit value (USD/unit)
Imported growth in
value between
2011-2015 (%, p.a.)
Imported growth in quantity
between 2011-2015 (%, p.a.)
Imported growth in
value between
2014-2015 (%, p.a.)
World 3746 100 347 10795 -11 -9 -54
Australia 1411 37.7 108 13065 -3 -5 -31 0
USA 1091 29.1 76 14355 -22 -29 -77 0
Lesotho 590 15.8 107 5514 63 34 -31 0
Argentina 342 9.1 39 8769 -19 12 312 0
United Kingdom 170 4.5 6 28333 36 1 107 0
New Zealand 139 3.7 11 12636 -27 -25 -28 0
France 2 0.1 0 0
Switzerland 1 0 0 0
Source: ITC (Trade Map)
28
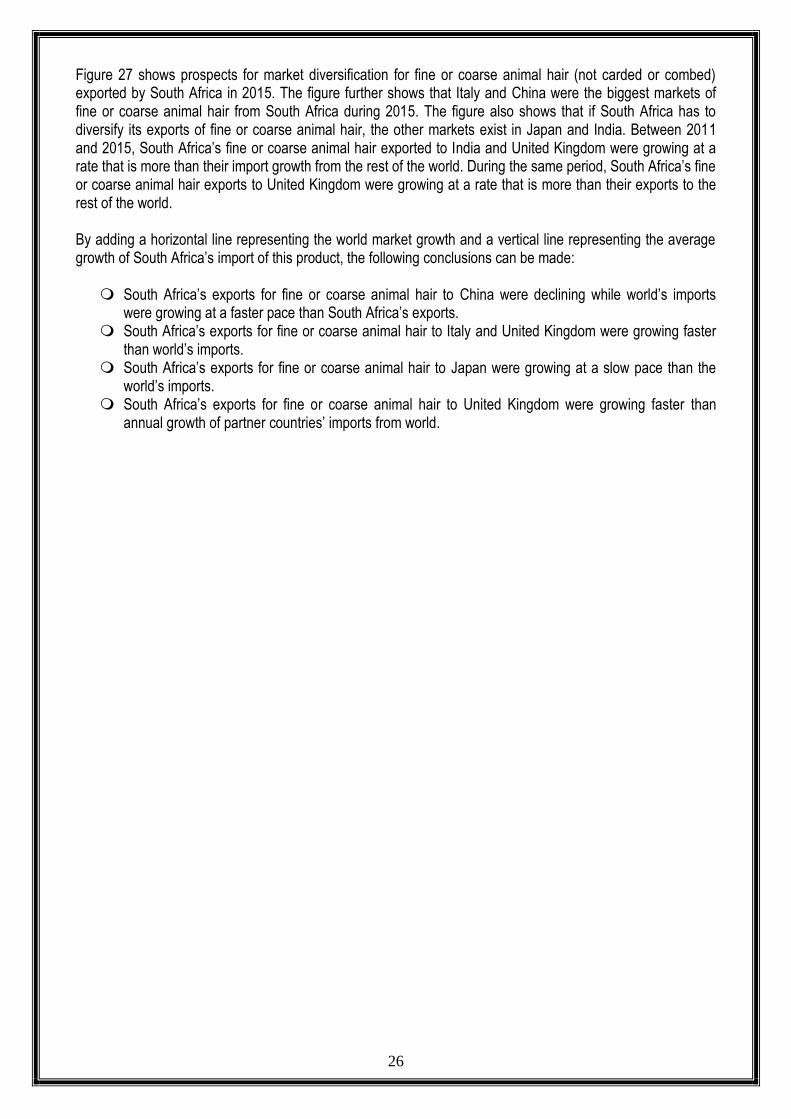
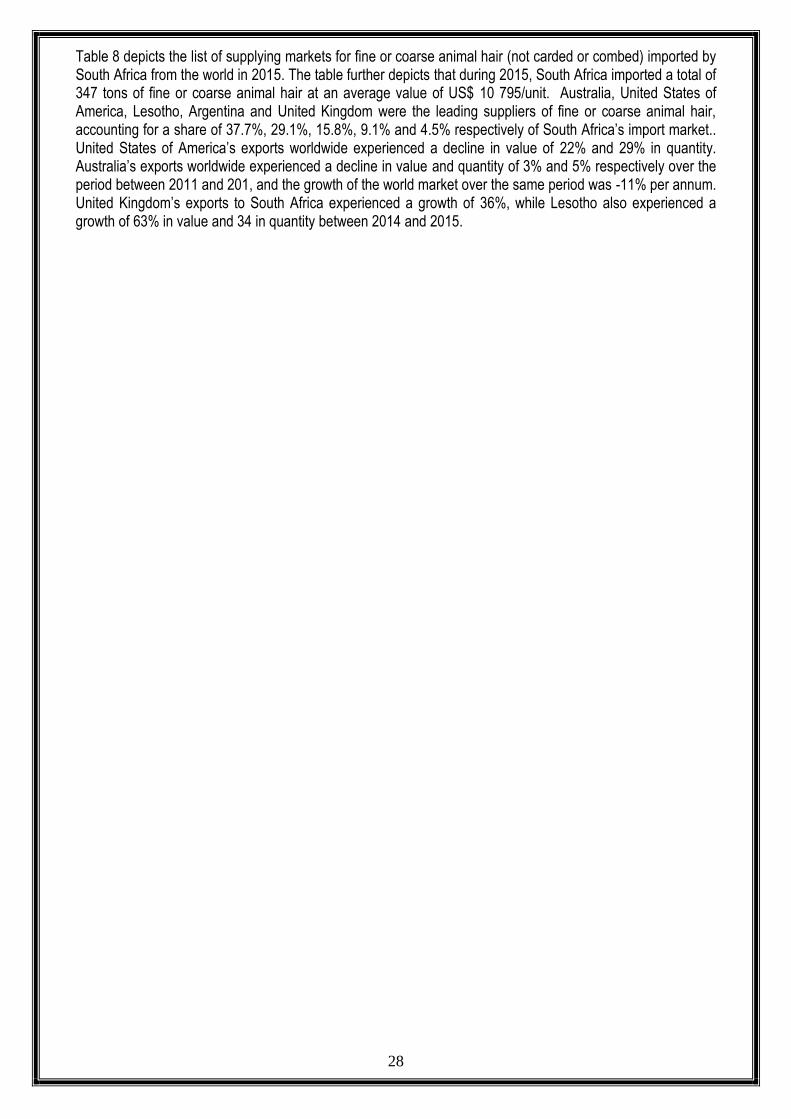
Table 8 depicts the list of supplying markets for fine or coarse animal hair (not carded or combed) imported by South Africa from the world in 2015. The table further depicts that during 2015, South Africa imported a total of 347 tons of fine or coarse animal hair at an average value of US$ 10 795/unit. Australia, United States of America, Lesotho, Argentina and United Kingdom were the leading suppliers of fine or coarse animal hair, accounting for a share of 37.7%, 29.1%, 15.8%, 9.1% and 4.5% respectively of South Africa’s import market.. United States of America’s exports worldwide experienced a decline in value of 22% and 29% in quantity. Australia’s exports worldwide experienced a decline in value and quantity of 3% and 5% respectively over the period between 2011 and 201, and the growth of the world market over the same period was -11% per annum. United Kingdom’s exports to South Africa experienced a growth of 36%, while Lesotho also experienced a growth of 63% in value and 34 in quantity between 2014 and 2015.
29
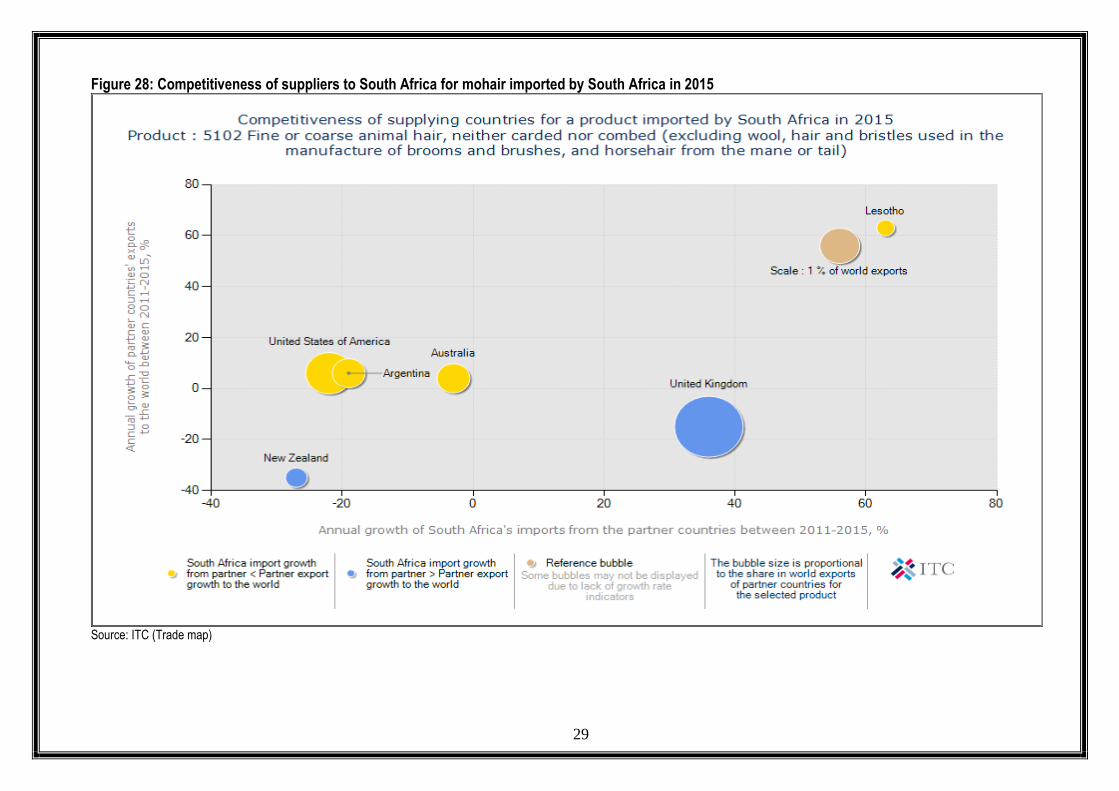
Figure 28: Competitiveness of suppliers to South Africa for mohair imported by South Africa in 2015
Source: ITC (Trade map)
30
Figure 28 illustrates competitiveness of suppliers to South Africa for fine or coarse animal hair (not carded or combed) imports from the world in 2015. The figure further illustrates that United States of America, Argentina and Australia were the biggest suppliers of fine or coarse animal hair (not carded or combed) to South Africa during the period under scrutiny. The figure also illustrates that United Kingdom and New Zealand were the most competitive supplier of mohair to South Africa with an annual growth of South Africa’s imports of approximately between 20% and 40% and between negative 20 and 40% between 2011 and 2015 respectively. South Africa’s fine or coarse animal hair imported from New Zealand was declining at 27% rate less than their export growth to the rest of the world (11%). During the same period, South Africa’s fine or coarse animal hair from United States of America and Australia were growing at a rate that is less than their exports to the rest of the world. By adding a horizontal line representing the world market growth and a vertical line representing the average growth of South Africa’s import of this product, the following conclusions can be made:
South Africa’s imports for fine or coarse animal hair from its supplier (United States of America) were decreasing almost at the slow pace as compared to the world’s exports between 2011 and 2015.
South Africa’s imports for fine or coarse animal hair from its supplier (Australia) were decreasing at the rate of 22% as compared to 11% rate to the world’s exports over the same period.
South Africa’s imports for fine or coarse animal hair from New Zealand were declining at the rate between 20% and 40% as compared to 11% rate to the world’s exports over the same period. .
31
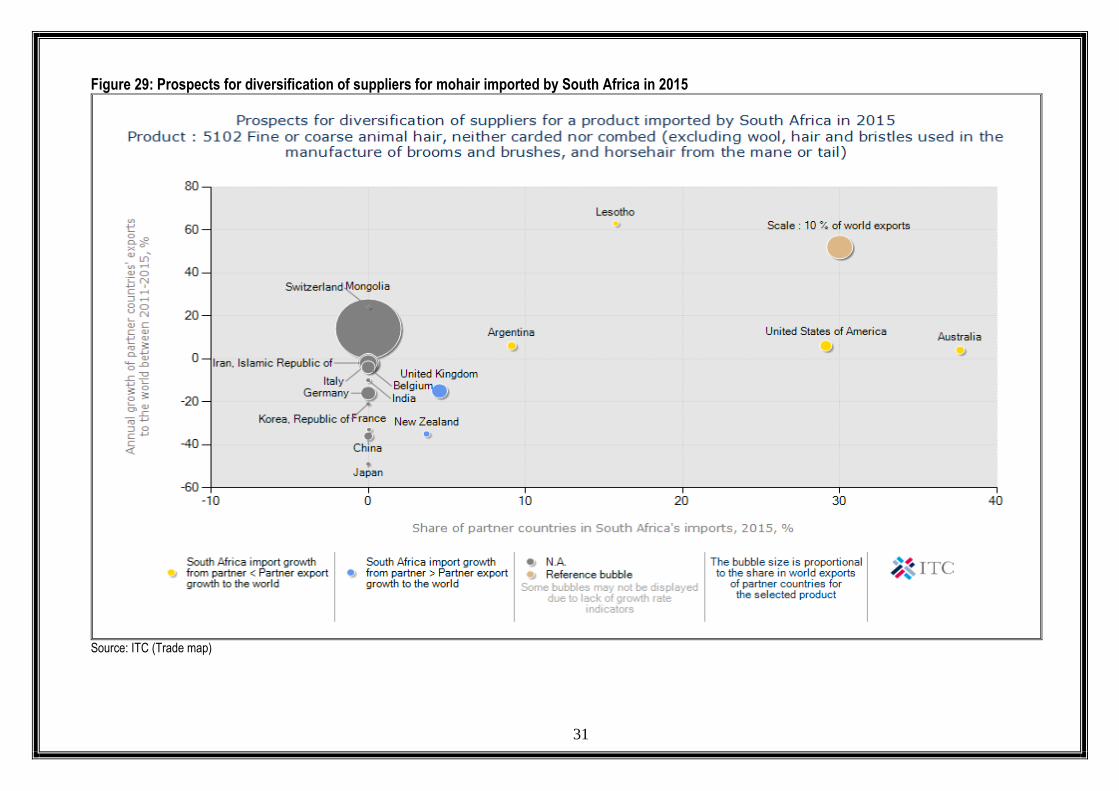
Figure 29: Prospects for diversification of suppliers for mohair imported by South Africa in 2015
Source: ITC (Trade map)
32
Figure 29 indicates prospects for diversification of suppliers for fine or coarse animal hair (not carded or combed) imported by South Africa in 2015. The graph further indicates that United States of America, Argentina and Australia were the biggest suppliers of fine or coarse animal hair (not carded or combed) to South Africa during 2015. The graph also indicates that if South Africa has to diversify its imports of fine or coarse animal hair, other markets except United States of America, Argentina and Australia, exist in New Zealand and United Kingdom. Between 2011 and 2015, South Africa’s fine or coarse animal hair imported from the United States of America was growing at a rate that is less than their export growth from the rest of the world. During the same period, South Africa’s fine or coarse animal hair imports from Lesotho were growing at a rate that is greater than their exports to the rest of the world. By adding a horizontal line representing the world market growth and a vertical line representing the average growth of South Africa’s export of this product, the following conclusions can be made:
South Africa’s imports of fine or coarse animal hair from United States of America and Australia were growing while world’s exports were growing at a very slow pace between 2011 and 2015 at a rate of between 0% and 40%.
South Africa’s imports for fine or coarse animal hair from Lesotho were growing at a faster pace (63 %) than world’s exports (-11 %).
South Africa’s imports of fine or coarse animal hair from New Zealand were also growing slower (-27%) and the world’s exports at --11% over the same period (2011 and 2015).
33
15. ACKNOWLEDGEMENTS The following information sources are acknowledged: D: Statistics and Economic Analysis www.daff.gov.za Fin24.com http://www.fin24.com Mohair South Africa http://www.mohair.co.za Momento’s of Africa. http://www.momentos.co.za Ikhwezi municipality http://www.ikwezi.gov.za Quantec www.quantec.co.za Trade Map www.trademap.org Absa Agri-Business (Mohair Outlook) www.absa.co.za Disclaimer: This document and its contents have been compiled by the Directorate: Marketing of the Department of Agriculture, Forestry and Fisheries for the purpose of detailing the Mohair industry. Anyone who uses the information as contained in this document does so at his/her own risk. The views expressed in this document are those of the Department of Agriculture, Forestry and Fisheries with regard to the industry, unless otherwise stated. The Department of Agriculture, Forestry and Fisheries, therefore accepts no liability that can be incurred resulting from the use of this information.