
Mike Courtney, Wind Energy Division, Risø DTU [email protected] · Mike Courtney, Wind Energy...
32
Wind lidars – Not the final answer i l t i! in complex terrain! Mike Courtney, Wind Energy Division, Risø DTU [email protected] I dR k 3 Ice and Rocks 3 Zadar, May 6th 2010
Transcript of Mike Courtney, Wind Energy Division, Risø DTU [email protected] · Mike Courtney, Wind Energy...
1
Wind lidars – Not the final answer i l t i !in complex terrain!
Mike Courtney, Wind Energy Division, Risø DTU
I d R k 3Ice and Rocks 3
Zadar, May 6th 2010
2
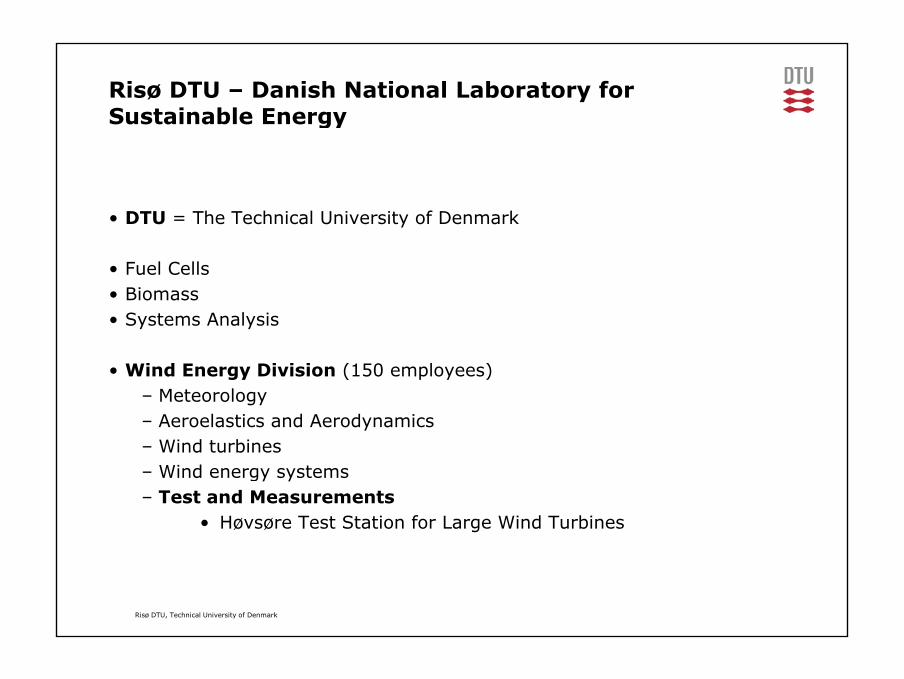
Risø DTU – Danish National Laboratory for Sustainable Energygy
DTU Th T h i l U i it f D k• DTU = The Technical University of Denmark
• Fuel Cells• Biomass• Biomass• Systems Analysis
• Wind Energy Division (150 employees)– Meteorology– Aeroelastics and Aerodynamics– Wind turbines
Wi d t– Wind energy systems– Test and Measurements
• Høvsøre Test Station for Large Wind Turbines
Risø DTU, Technical University of Denmark
3
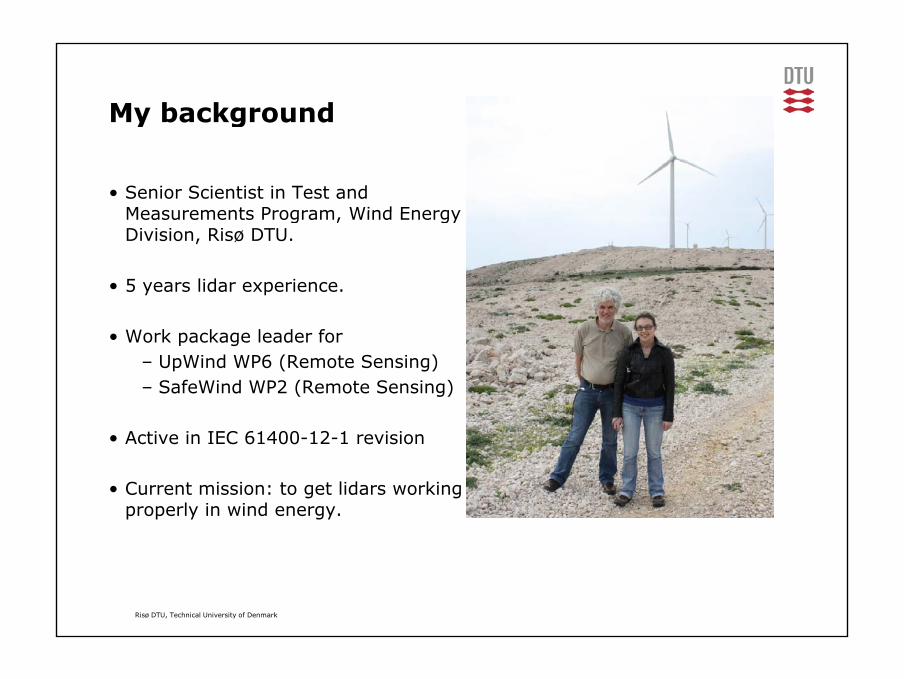
My backgroundy g
• Senior Scientist in Test and Measurements Program Wind Energy Measurements Program, Wind Energy Division, Risø DTU.
• 5 years lidar experience.
• Work package leader for– UpWind WP6 (Remote Sensing)
S f Wi d WP2 (R t S i )– SafeWind WP2 (Remote Sensing)
• Active in IEC 61400-12-1 revision
• Current mission: to get lidars working properly in wind energy.
Risø DTU, Technical University of Denmark
4
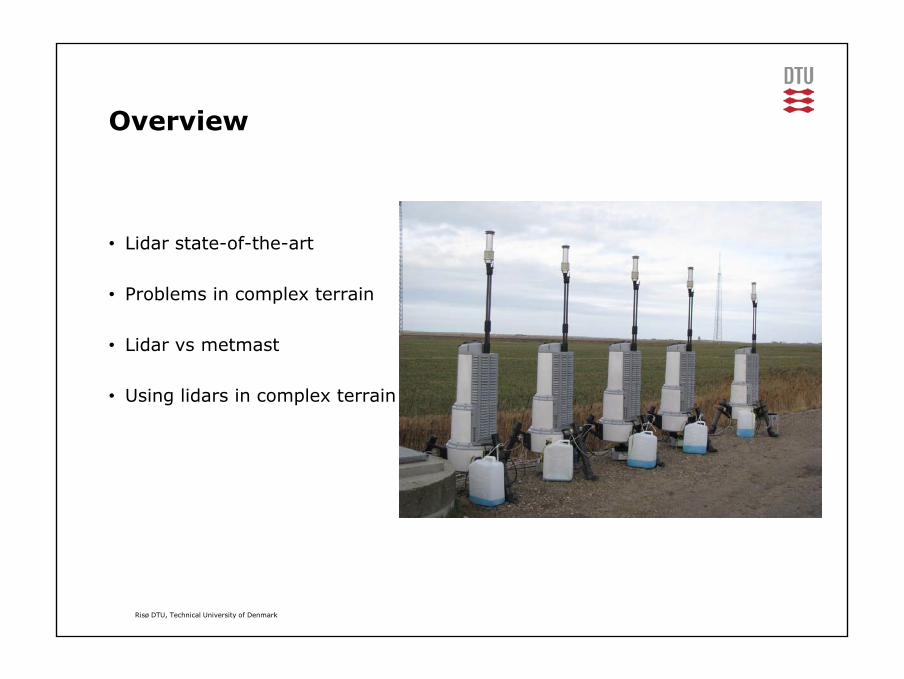
OverviewOverview
• Lidar state-of-the-art
• Problems in complex terrainProblems in complex terrain
• Lidar vs metmast
• Using lidars in complex terrain
Risø DTU, Technical University of Denmark
5
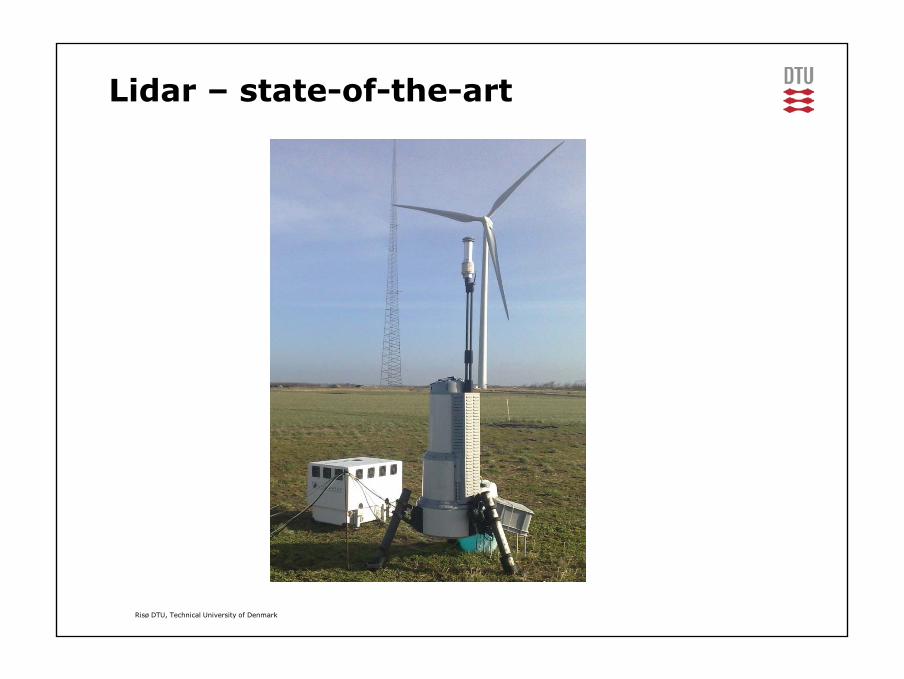
Lidar – state-of-the-art
Risø DTU, Technical University of Denmark
6
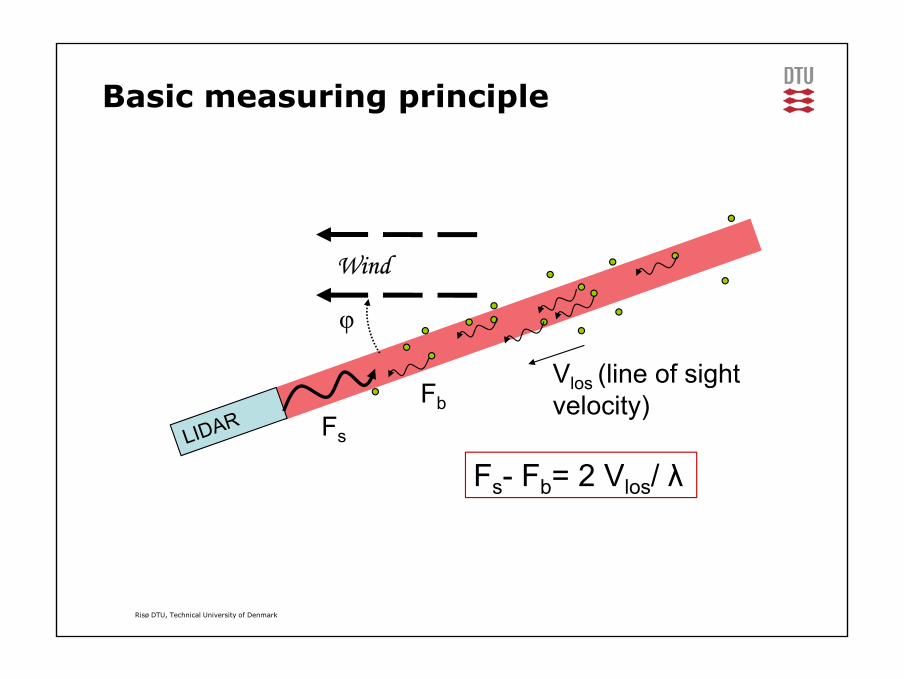
Basic measuring principle
Wind
φ
Vlos (line of sightVlos (line of sight velocity)Fb
Fs
F F 2 V / λFs- Fb= 2 Vlos/ λ
Risø DTU, Technical University of Denmark
7
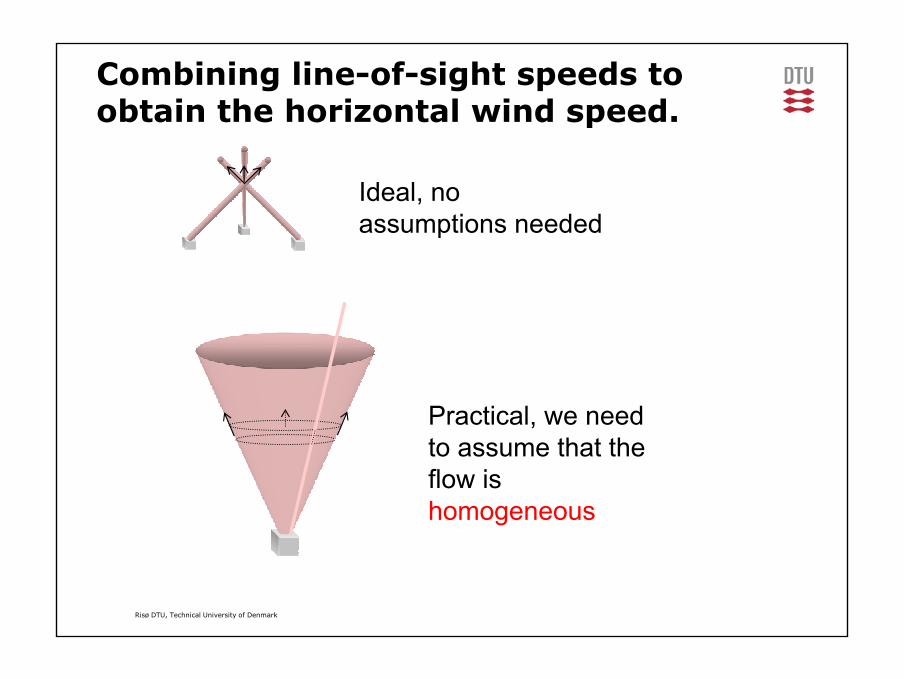
Combining line-of-sight speeds to obtain the horizontal wind speed.p
Ideal, no assumptions needed
Practical, we need to assume that the flow is homogeneous
Risø DTU, Technical University of Denmark
8
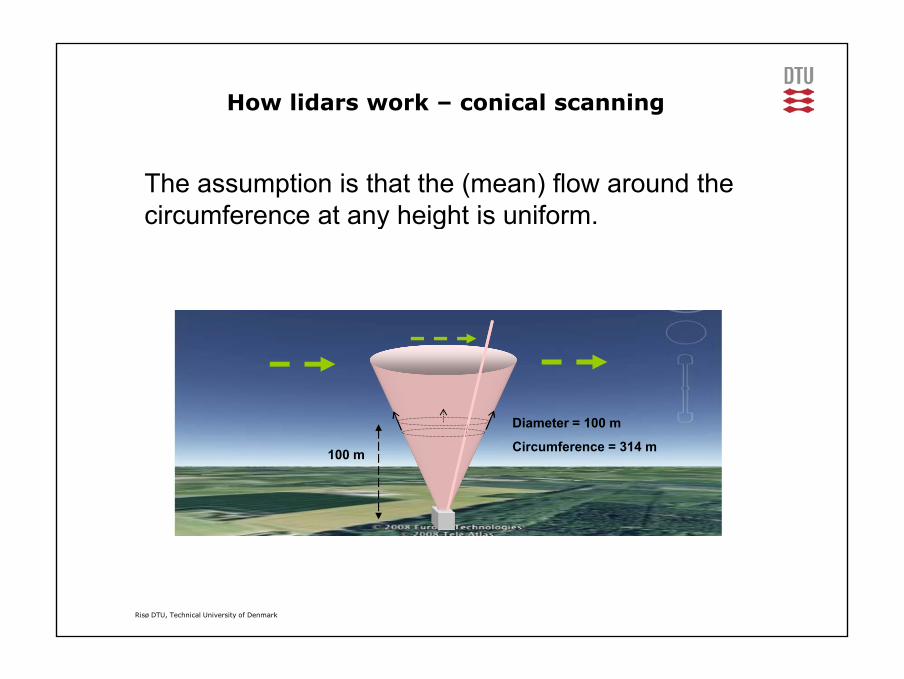
How lidars work – conical scanning
The assumption is that the (mean) flow around the circumference at any height is uniformcircumference at any height is uniform.
100 m
Diameter = 100 m
Circumference = 314 m
Risø DTU, Technical University of Denmark
9
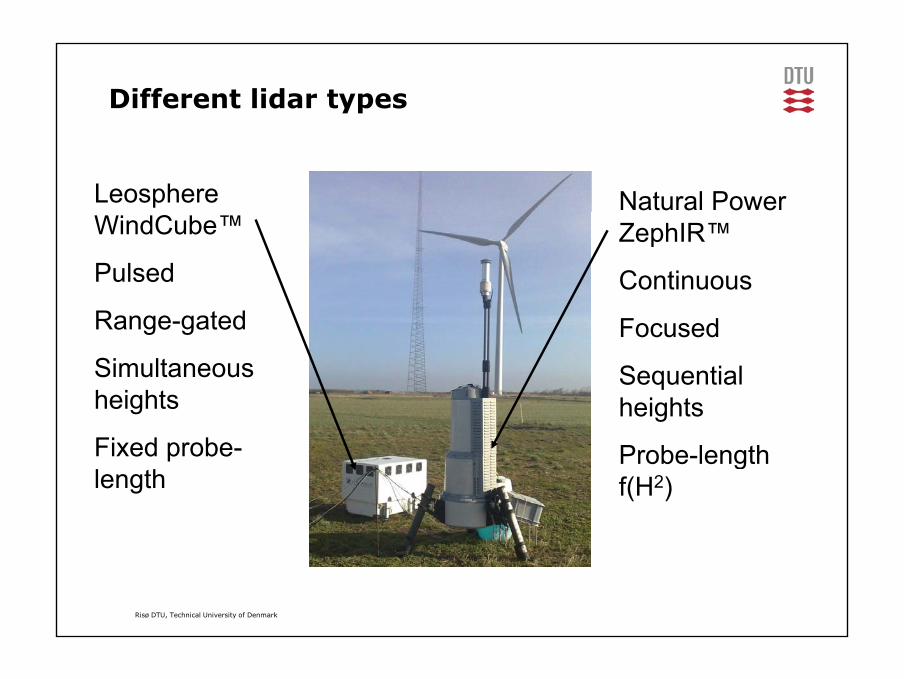
Different lidar types
Leosphere Natural Power WindCube™
Pulsed ZephIR™
ContinuousRange-gated
Simultaneous Focused
Sequentialheights
Fixed probe-
Sequential heights
Probe-length length
gf(H2)
Risø DTU, Technical University of Denmark
10
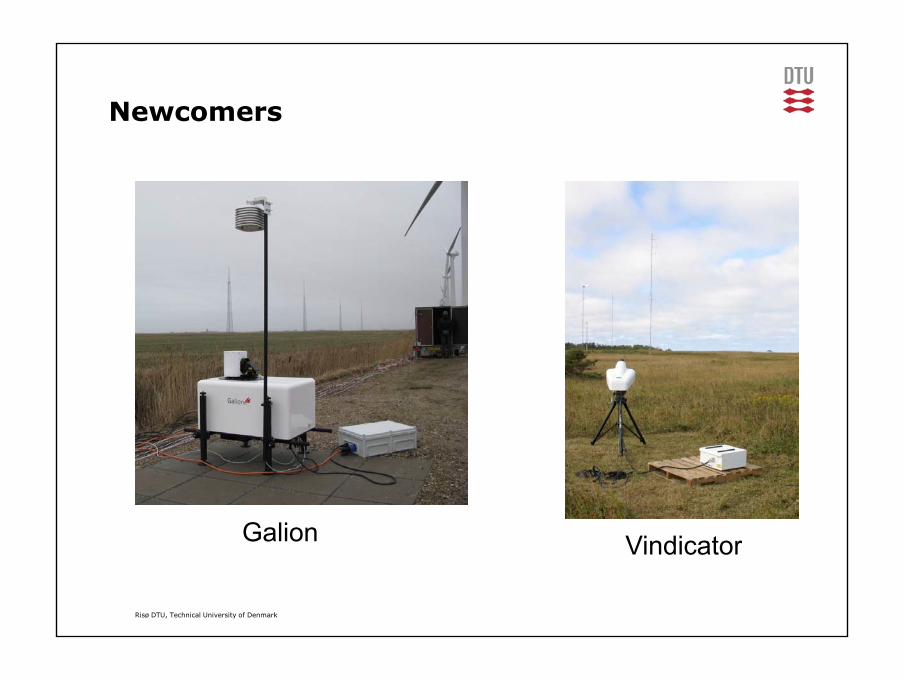
Newcomers
Galion Vindicator
Risø DTU, Technical University of Denmark
Vindicator
11
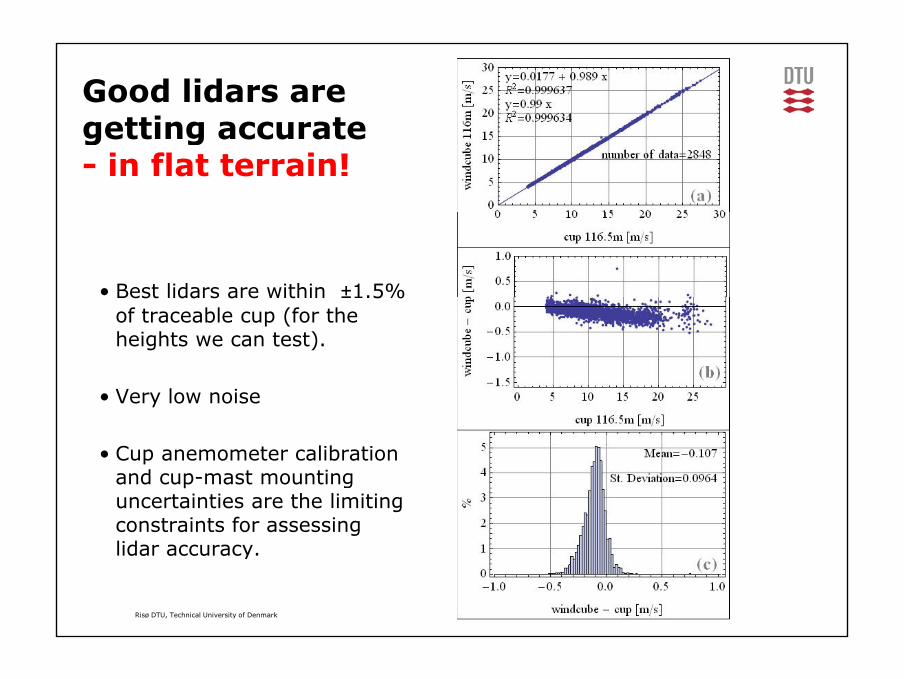
Good lidars aregetting accurategetting accurate- in flat terrain!
• Best lidars are within ±1.5% Best lidars are within ±1.5% of traceable cup (for the heights we can test).
• Very low noise
• Cup anemometer calibrationand cup-mast mountinguncertainties are the limitingconstraints for assessinglidar accuracy
Risø DTU, Technical University of Denmark
lidar accuracy.
12
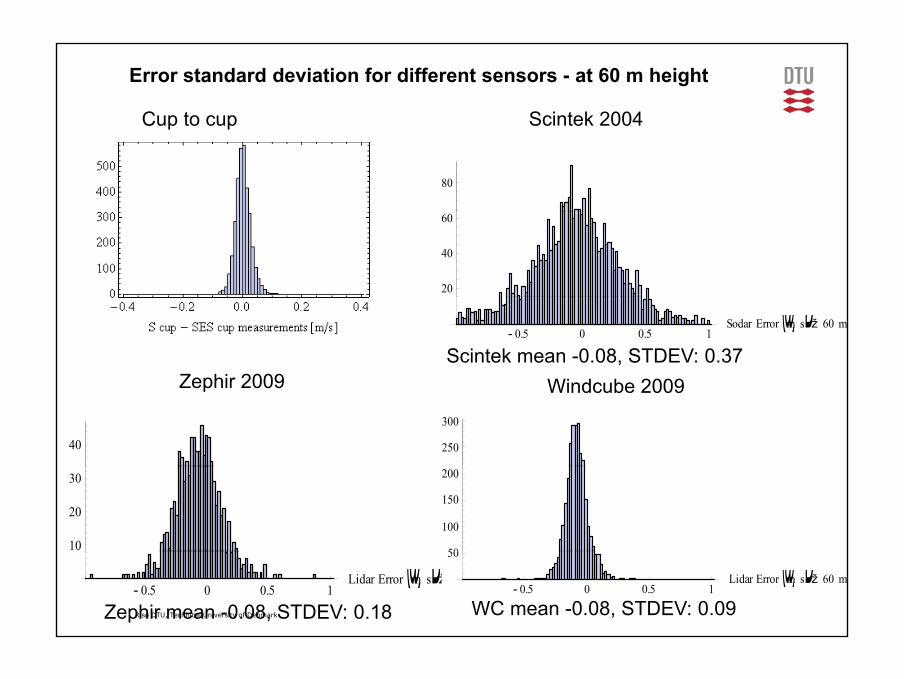
Error standard deviation for different sensors - at 60 m height
Scintek 2004Cup to cup
80
p p
20
40
60
- 0.5 0 0.5 1Sodar Error@m�sDž 60 m
Wi d b 2009Zephir 2009Scintek mean -0.08, STDEV: 0.37
40
Windcube 2009Zephir 2009
250
300
10
20
30
50
100
150
200
Risø DTU, Technical University of Denmark
- 0.5 0 0.5 1Lidar Error@m�sDž 60 m
Zephir mean -0.08, STDEV: 0.18- 0.5 0 0.5 1
Lidar Error@m�sDž 60 m
50
WC mean -0.08, STDEV: 0.09
13
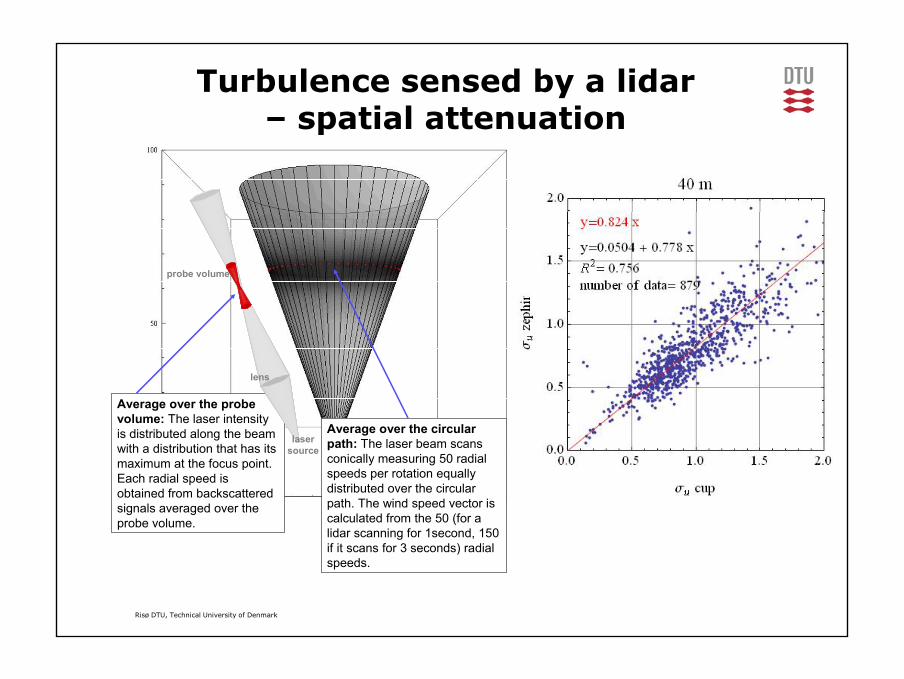
Turbulence sensed by a lidar – spatial attenuationspatial attenuation
probe volume
lens
Average over the probe volume: The laser intensity is distributed along the beam with a distribution that has its maximum at the focus point.
Average over the circular path: The laser beam scans conically measuring 50 radial
laser source
maximum at the focus point. Each radial speed is obtained from backscattered signals averaged over the probe volume.
speeds per rotation equally distributed over the circular path. The wind speed vector is calculated from the 50 (for a lidar scanning for 1second, 150 if it scans for 3 seconds) radial
Risø DTU, Technical University of Denmark
if it scans for 3 seconds) radial speeds.
14
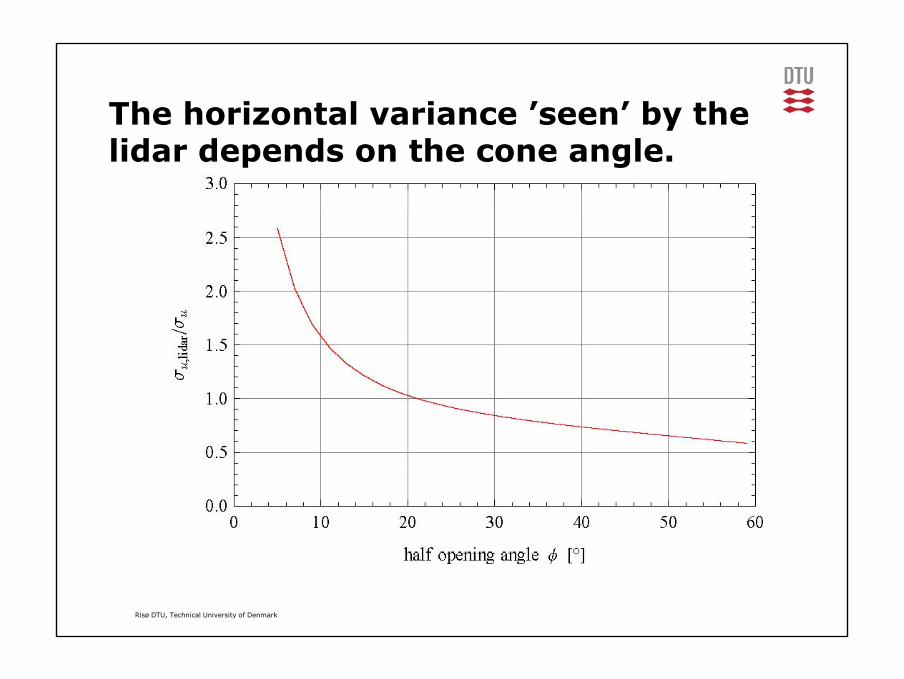
The horizontal variance ’seen’ by the ylidar depends on the cone angle.
Risø DTU, Technical University of Denmark
15
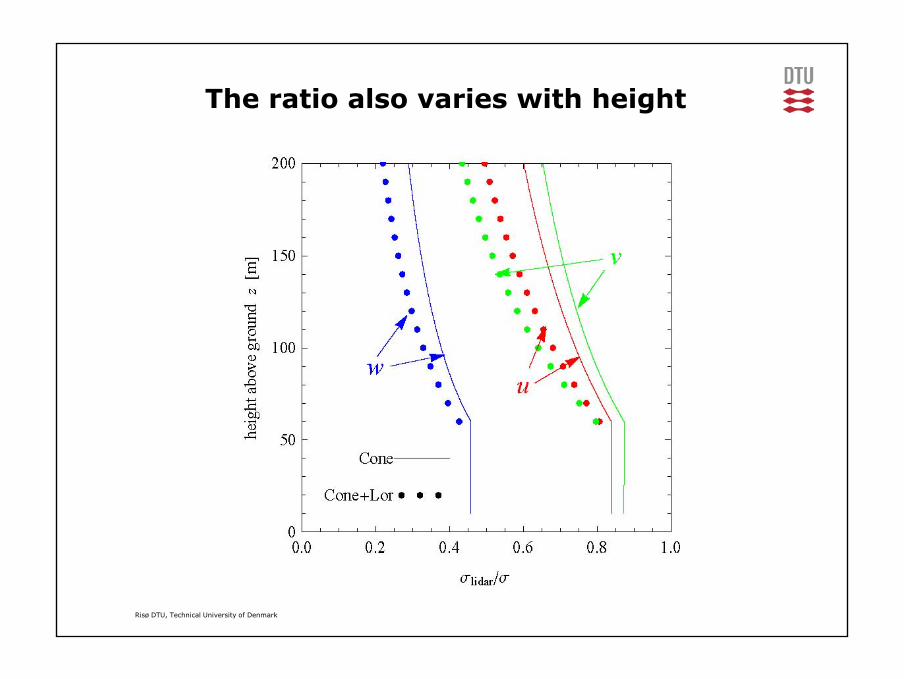
The ratio also varies with height
Risø DTU, Technical University of Denmark
16
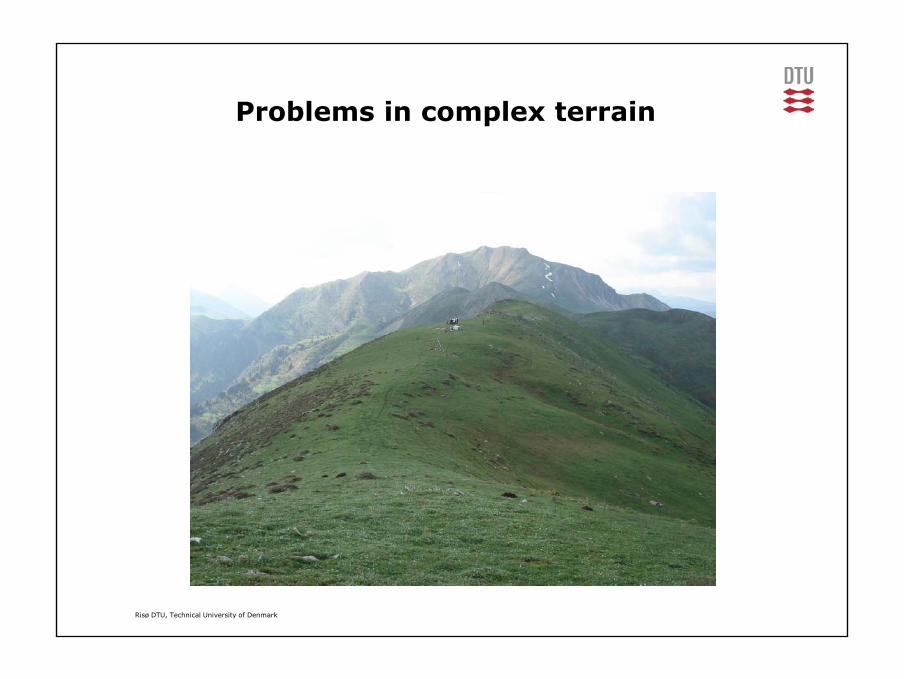
Problems in complex terrain
Risø DTU, Technical University of Denmark
17
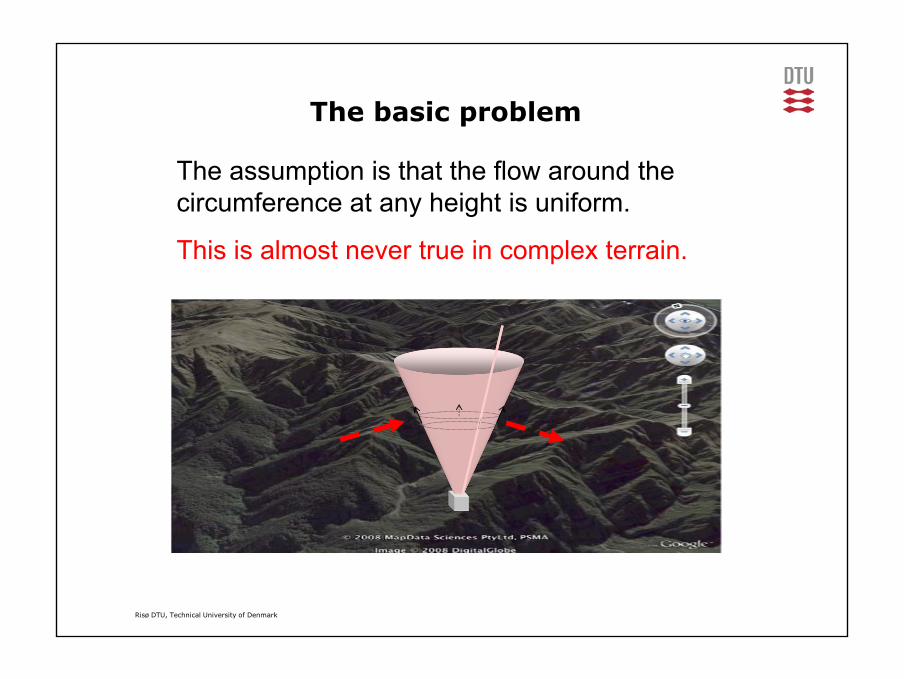
The basic problem
The assumption is that the flow around the circumference at any height is uniform. y g
This is almost never true in complex terrain.
Risø DTU, Technical University of Denmark
18
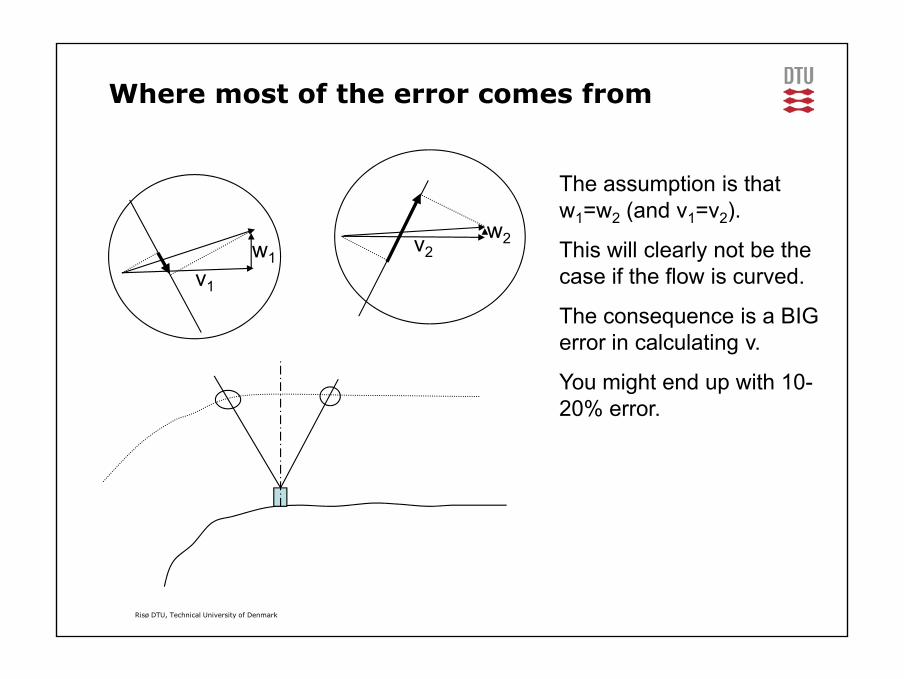
Where most of the error comes from
The assumption is that w =w (and v =v )
w1
w2
w1=w2 (and v1=v2).
This will clearly not be the case if the flow is curved.v1
v2
The consequence is a BIG error in calculating v.
You might end up with 10You might end up with 10-20% error.
Risø DTU, Technical University of Denmark
19
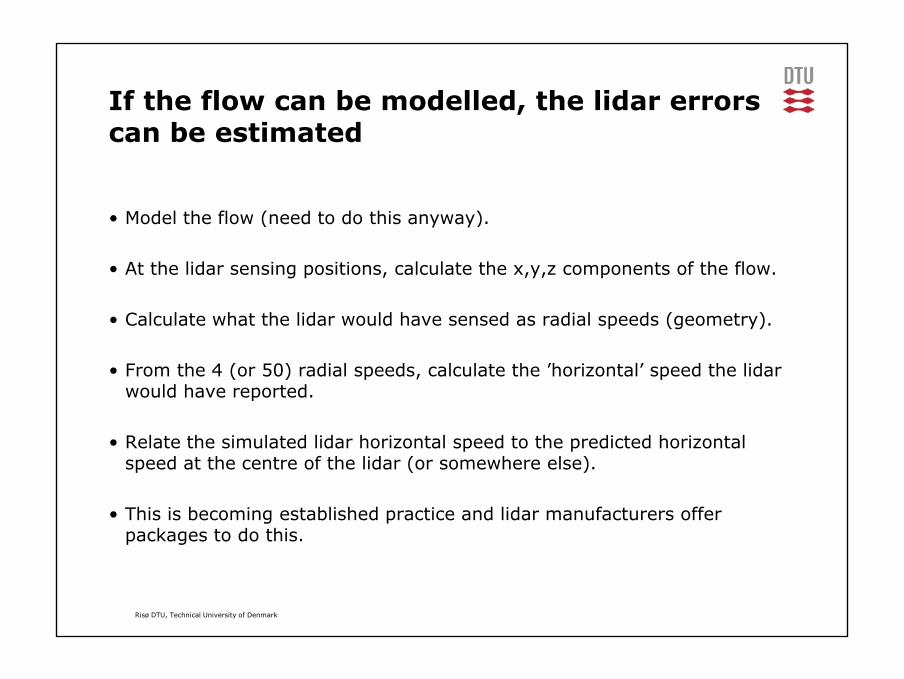
If the flow can be modelled, the lidar errorscan be estimatedcan be estimated
M d l th fl ( d t d thi )• Model the flow (need to do this anyway).
• At the lidar sensing positions, calculate the x,y,z components of the flow.
• Calculate what the lidar would have sensed as radial speeds (geometry).
• From the 4 (or 50) radial speeds, calculate the ’horizontal’ speed the lidar would have reported.
• Relate the simulated lidar horizontal speed to the predicted horizontalspeed at the centre of the lidar (or somewhere else)speed at the centre of the lidar (or somewhere else).
• This is becoming established practice and lidar manufacturers offer packages to do this.
Risø DTU, Technical University of Denmark
20
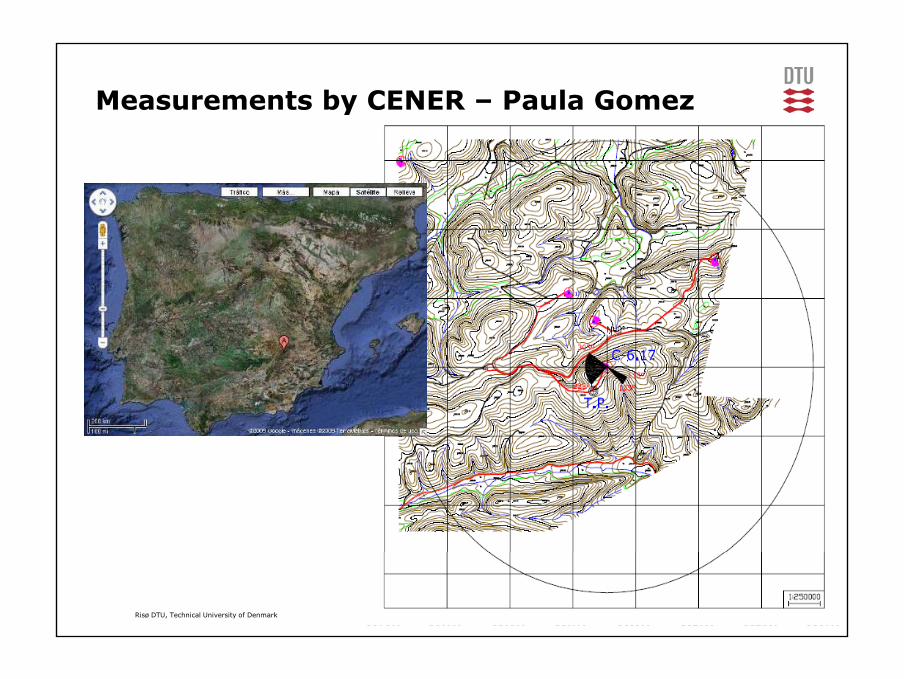
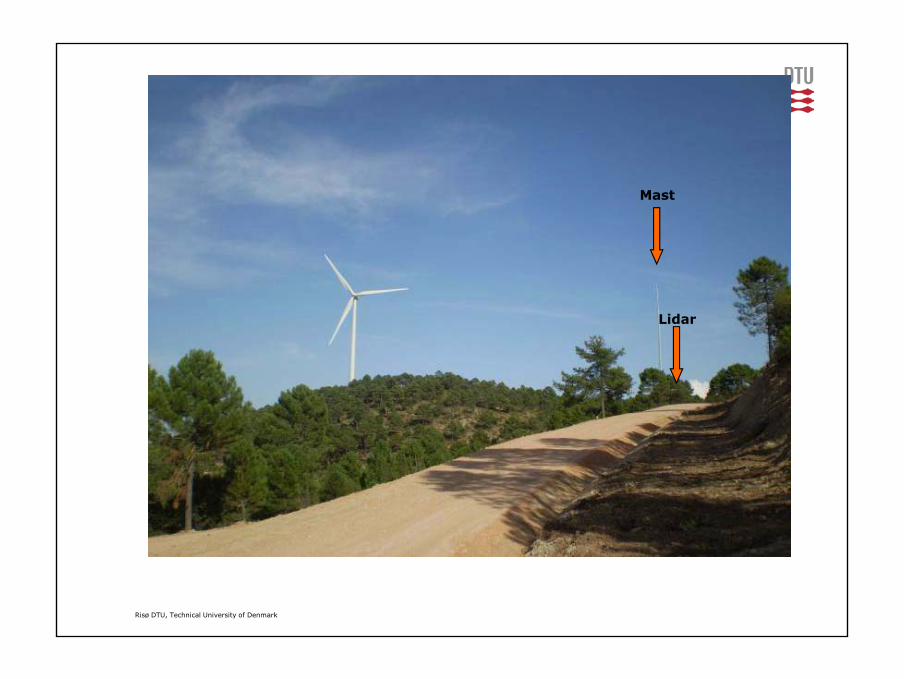
Measurements by CENER – Paula Gomez
Risø DTU, Technical University of Denmark
21
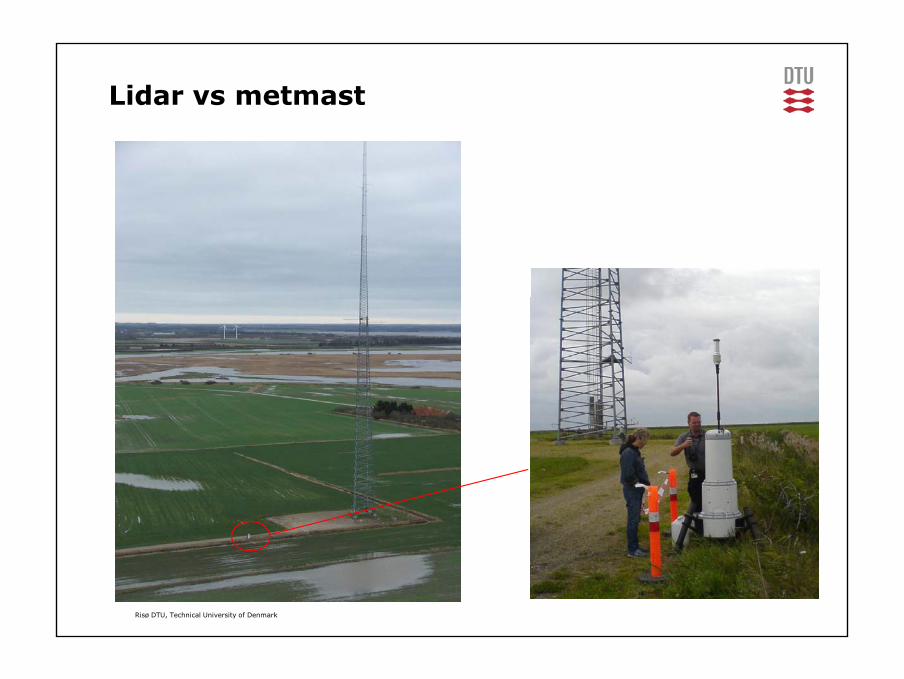
Mast
Lidar
Risø DTU, Technical University of Denmark
22
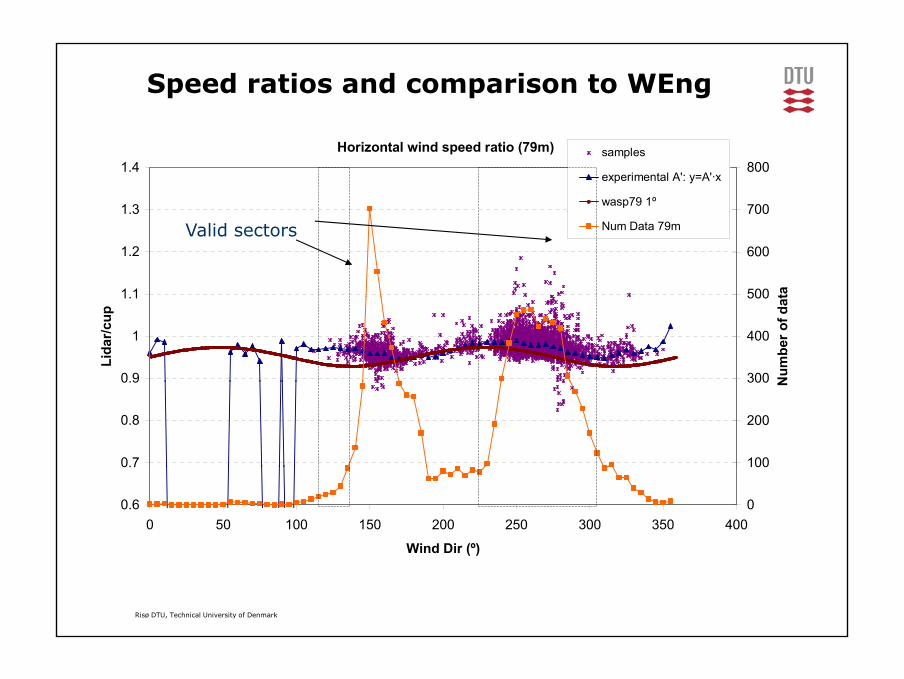
Speed ratios and comparison to WEng
Horizontal wind speed ratio (79m)
1 3
1.4
700
800samples
experimental A': y=A'·x
wasp79 1º
1.1
1.2
1.3
500
600
700
ta
Num Data 79mValid sectors
0.9
1
1.1
Lida
r/cup
300
400
500
Num
ber o
f dat
0.7
0.8
0.9
100
200
300 N
0.6
0.7
0 50 100 150 200 250 300 350 400
Wind Dir (º)
0
100
Risø DTU, Technical University of Denmark
Wind Dir ( )
23
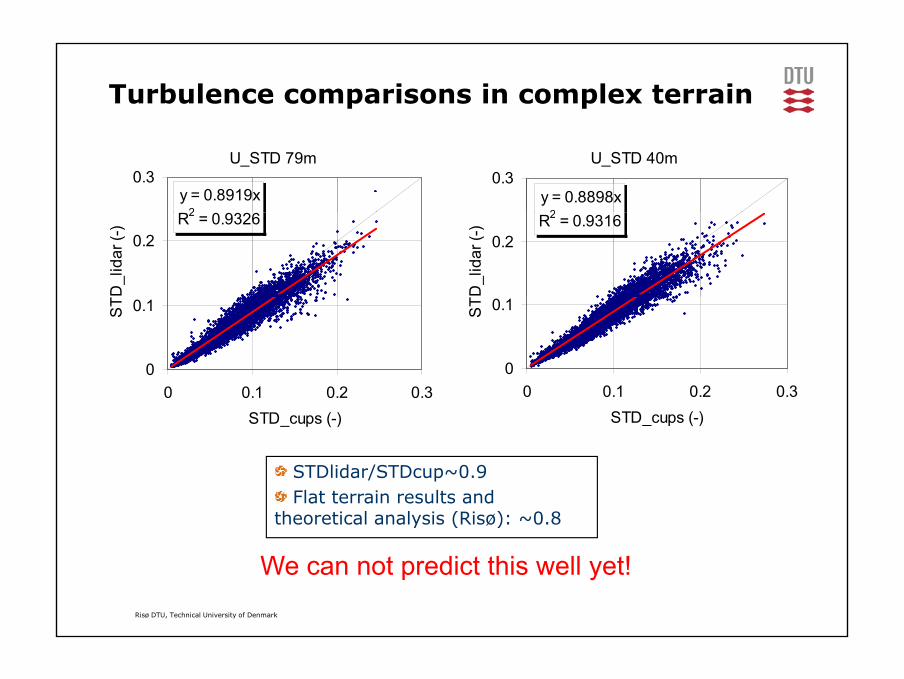
Turbulence comparisons in complex terrain
U_STD 79m
y = 0.8919x2
0.3U_STD 40m
y = 0.8898x2
0.3
R2 = 0.93260.2
D_l
idar
(-) R2 = 0.9316
0.2
D_l
idar
(-)
0
0.1ST
0
0.1ST
0 0.1 0.2 0.3STD_cups (-)
0 0.1 0.2 0.3STD_cups (-)
STDlid /STD 0 9STDlidar/STDcup~0.9Flat terrain results and
theoretical analysis (Risø): ~0.8
Risø DTU, Technical University of Denmark
We can not predict this well yet!
24
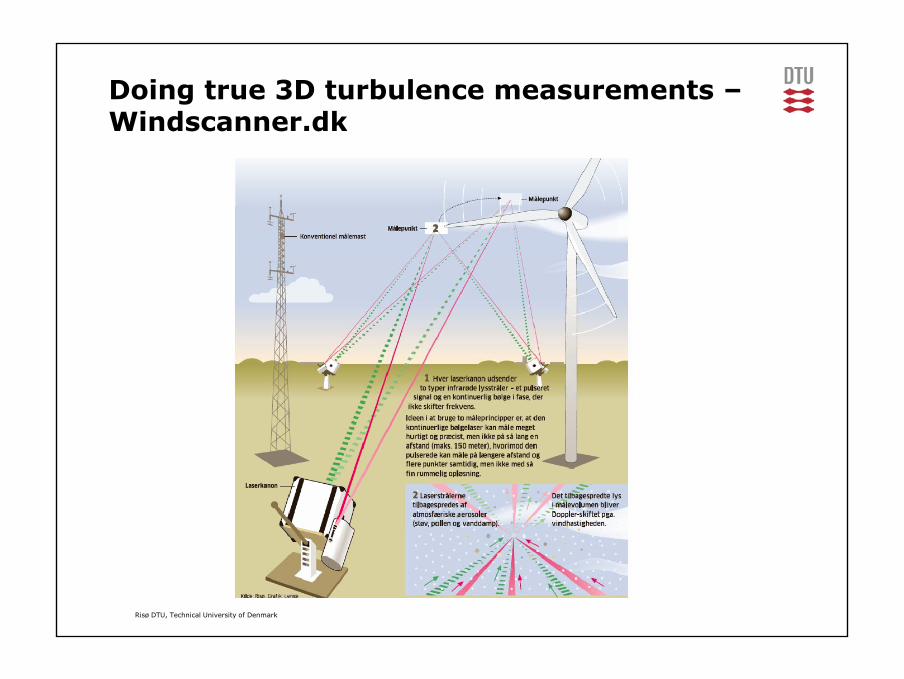
Doing true 3D turbulence measurements –Windscanner.dkWindscanner.dk
Risø DTU, Technical University of Denmark
25
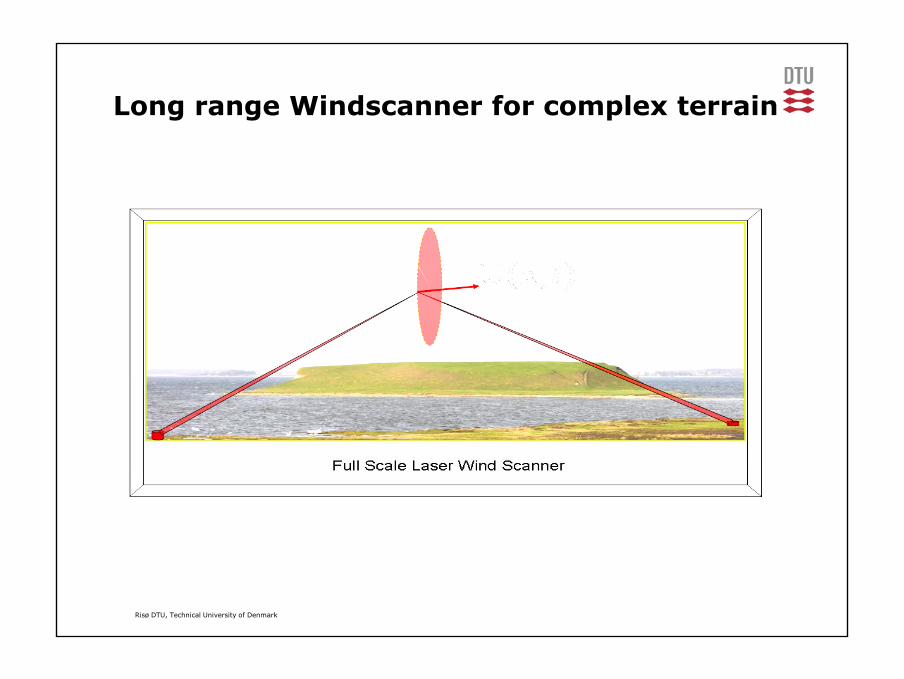
Long range Windscanner for complex terrain
Risø DTU, Technical University of Denmark
26
Lidar vs metmast
Risø DTU, Technical University of Denmark
27
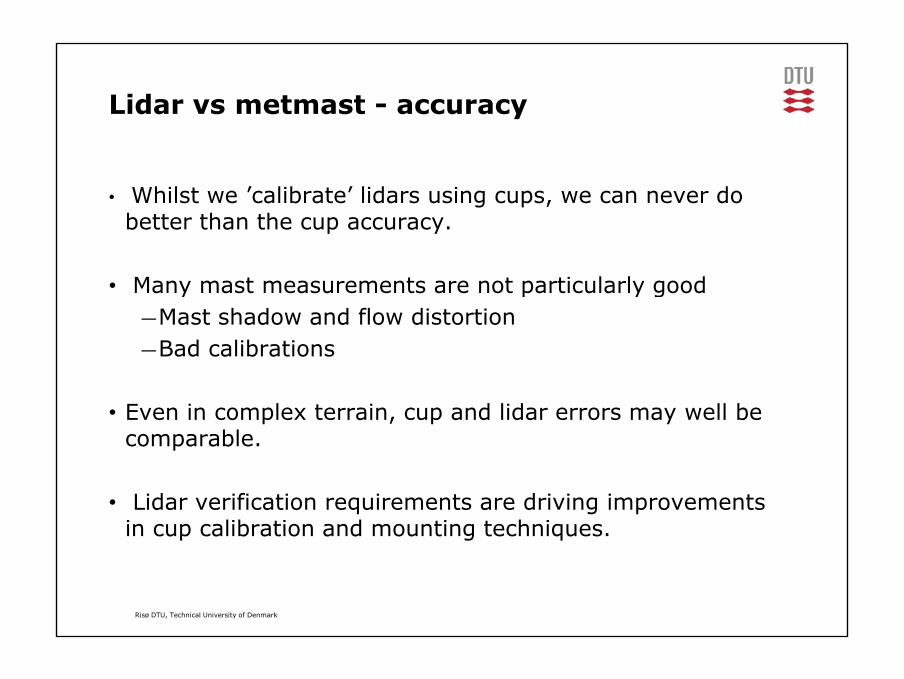
Lidar vs metmast - accuracy
• Whilst we ’calibrate’ lidars using cups, we can never do better than the cup accuracy.
• Many mast measurements are not particularly goody p y g―Mast shadow and flow distortion―Bad calibrations
• Even in complex terrain, cup and lidar errors may well becomparable.
• Lidar verification requirements are driving improvementsin cup calibration and mounting techniques.
Risø DTU, Technical University of Denmark
28
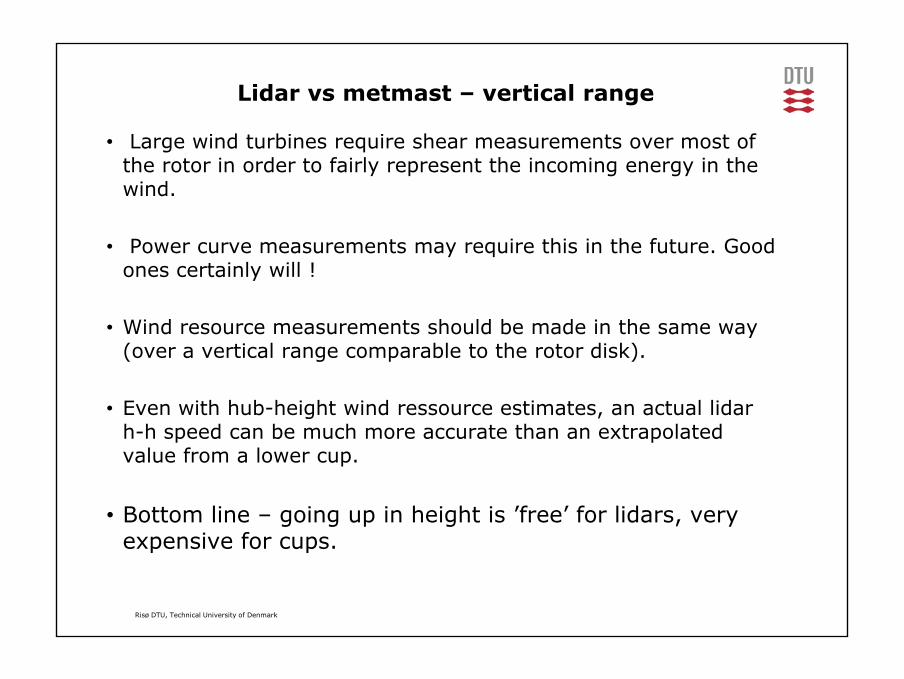
Lidar vs metmast – vertical range
• Large wind turbines require shear measurements over most of the rotor in order to fairly represent the incoming energy in the wind.
• Power curve measurements may require this in the future. Goodones certainly will !
• Wind resource measurements should be made in the same way(over a vertical range comparable to the rotor disk).
• Even with hub-height wind ressource estimates, an actual lidar h-h speed can be much more accurate than an extrapolatedvalue from a lower cup.
• Bottom line – going up in height is ’free’ for lidars, veryexpensive for cups.
Risø DTU, Technical University of Denmark
p p
29
Lidar vs metmast - priceLidar vs metmast price
• Assuming lidars can be used many times, their economicsappear promising, especially for replacing high masts.
• There are also ’hidden/forgotten’ lidar costsgPower supplyMaintenanceRepairs! (renting might be attractive)Repairs! (renting might be attractive)
• Well conducted lidar resource measurements shouldreduce the AEP uncertainty giving more subtle economicreduce the AEP uncertainty, giving more subtle economicbenefits.
Risø DTU, Technical University of Denmark
30
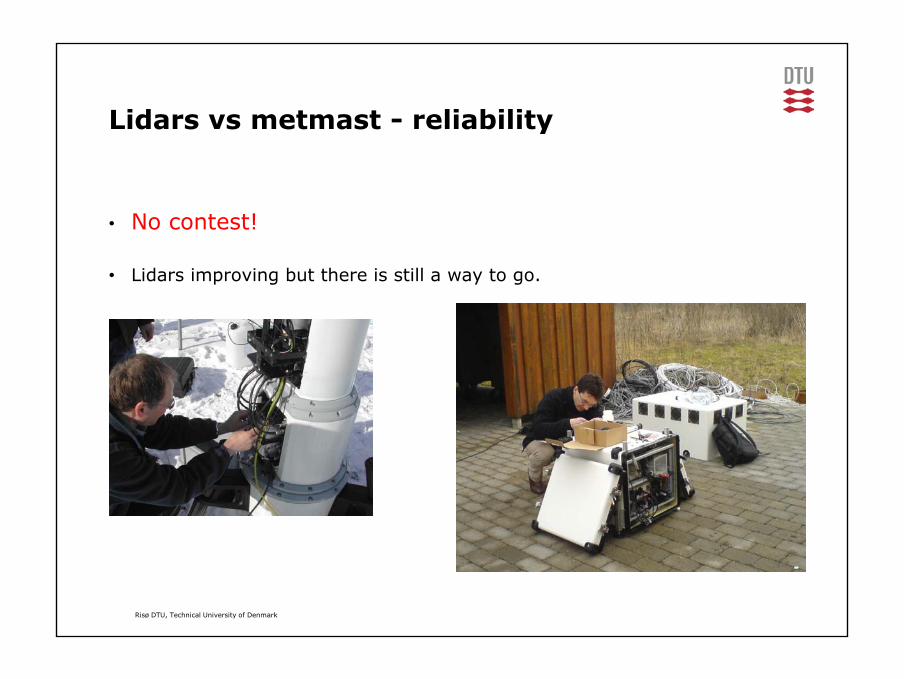
Lidars vs metmast - reliabilityLidars vs metmast reliability
• No contest!
• Lidars improving but there is still a way to go.
Risø DTU, Technical University of Denmark
31
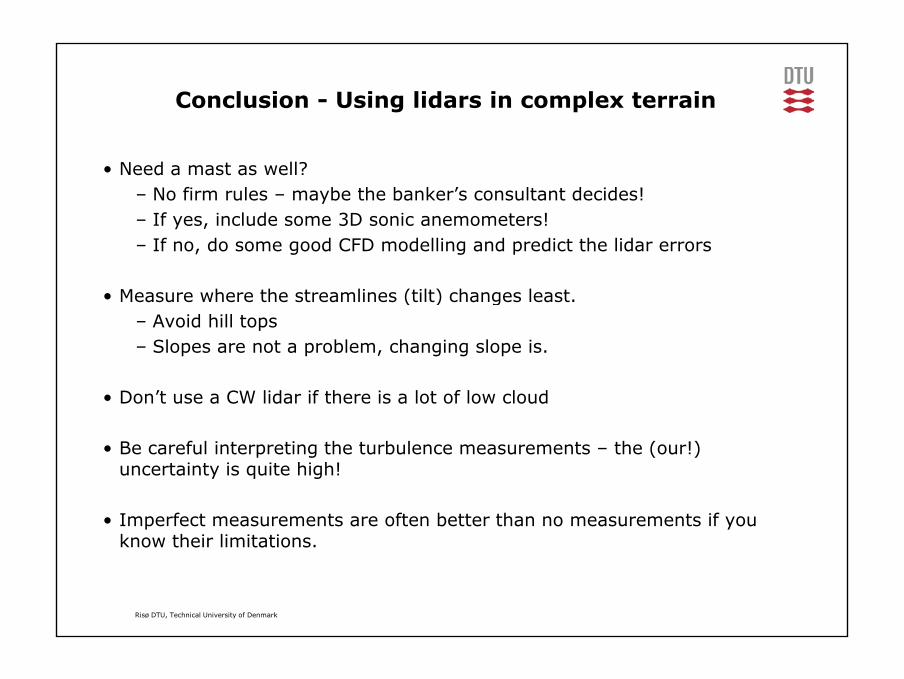
Conclusion - Using lidars in complex terrain
• Need a mast as well?– No firm rules – maybe the banker’s consultant decides!– If yes, include some 3D sonic anemometers!– If no, do some good CFD modelling and predict the lidar errors
• Measure where the streamlines (tilt) changes least• Measure where the streamlines (tilt) changes least.– Avoid hill tops– Slopes are not a problem, changing slope is.
• Don’t use a CW lidar if there is a lot of low cloud
• Be careful interpreting the turbulence measurements – the (our!) uncertainty is quite high!uncertainty is quite high!
• Imperfect measurements are often better than no measurements if youknow their limitations.
Risø DTU, Technical University of Denmark
32
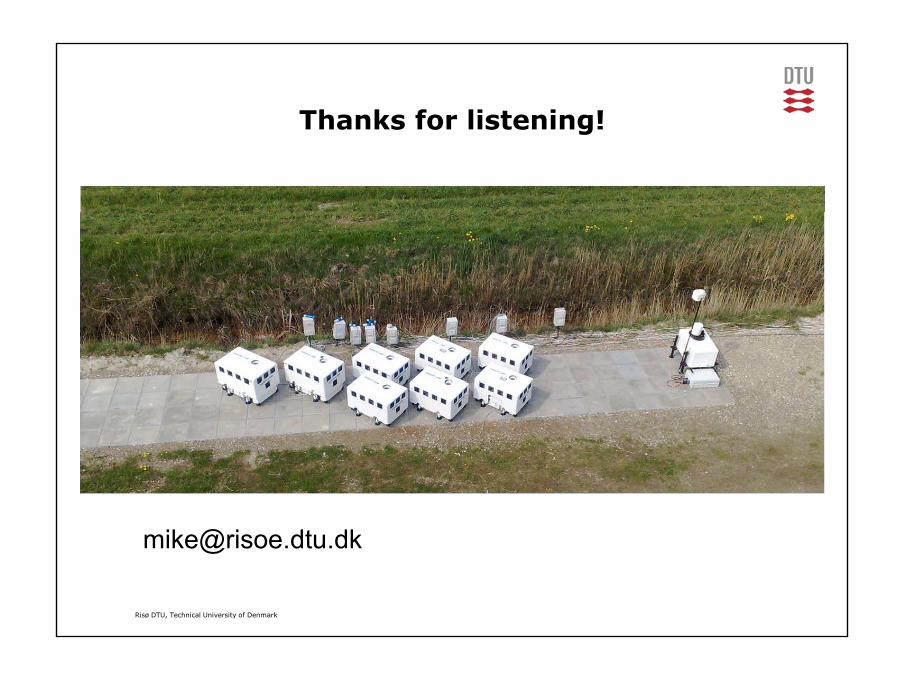
Thanks for listening!Thanks for listening!
Risø DTU, Technical University of Denmark
@


![ATP 08 Soeren Schmidt nsls2 rev [Read-Only] · Total: 165.263 99% matched Søren Schmidt, Risø DTU DAQ and user interface workshop, ... Søren Schmidt, Risø DTU DAQ and user interface](https://static.fdocuments.net/doc/165x107/5b384c6c7f8b9abd438d0c61/atp-08-soeren-schmidt-nsls2-rev-read-only-total-165263-99-matched-soren.jpg)