Microarray expression studies on bone marrow of patients ...
9
RESEARCH Open Access Microarray expression studies on bone marrow of patients with Shwachman- Diamond syndrome in relation to deletion of the long arm of chromosome 20, other chromosome anomalies or normal karyotype Abdul Waheed Khan 1 , Antonella Minelli 2 , Annalisa Frattini 1,3 , Giuseppe Montalbano 1 , Alessia Bogni 4 , Marco Fabbri 5 , Giovanni Porta 1 , Francesco Acquati 6 , Rita Maria Pinto 7 , Elena Bergami 8 , Rossella Mura 9 , Anna Pegoraro 10 , Simone Cesaro 10 , Marco Cipolli 11 , Marco Zecca 8 , Cesare Danesino 2 , Franco Locatelli 7 , Emanuela Maserati 1 , Francesco Pasquali 1 and Roberto Valli 1* Abstract Background: Clonal chromosome changes are often found in the bone marrow (BM) of patients with Shwachman- Diamond syndrome (SDS). The most frequent ones include an isochromosome of the long arm of chromosome 7, i (7)(q10), and an interstitial deletion of the long arm of chromosome 20, del (20)(q). These two imbalances are mechanisms of somatic genetic rescue. The literature offers few expression studies on SDS. Results: We report the expression analysis of bone marrow (BM) cells of patients with SDS in relation to normal karyotype or to the presence of clonal chromosome anomalies: del (20)(q) (five cases), i (7)(q10) (one case), and other anomalies (two cases). The study was performed using the microarray technique considering the whole transcriptome (WT) and three gene subsets selected as relevant in BM functions. The expression patterns of nine healthy controls and SDS patients with or without chromosome anomalies in the bone marrow showed clear differences. Conclusions: There is a significant difference between gene expression in the BM of SDS patients and healthy subjects, both at the WT level and in the selected gene sets. The deletion del (20)(q), with the EIF6 gene consistently lost, even in patients with the smallest losses of material, changes the transcription pattern: a low proportion of abnormal cells led to a pattern similar to SDS patients without acquired anomalies, whereas a high proportion yields a pattern similar to healthy subjects. Hence, the benign prognostic value of del (20)(q). The case of i (7)(q10) showed a transcription pattern similar to healthy subjects, paralleling the positive prognostic role of this anomaly as well. Keywords: Shwachman-diamond syndrome, Expression analysis, Clonal chromosome anomalies in bone marrow, EIF6 gene, Risk of MDS/AML, Somatic genetic rescue © The Author(s). 2019 Open Access This article is distributed under the terms of the Creative Commons Attribution 4.0 International License (http://creativecommons.org/licenses/by/4.0/), which permits unrestricted use, distribution, and reproduction in any medium, provided you give appropriate credit to the original author(s) and the source, provide a link to the Creative Commons license, and indicate if changes were made. The Creative Commons Public Domain Dedication waiver (http://creativecommons.org/publicdomain/zero/1.0/) applies to the data made available in this article, unless otherwise stated. * Correspondence: [email protected] 1 Genetica Umana e Medica, Dipartimento di Medicina e Chirurgia, Università dell’Insubria, Via J. H. Dunant, 5, 21100 Varese, Italy Full list of author information is available at the end of the article Khan et al. Molecular Cytogenetics (2020) 13:1 https://doi.org/10.1186/s13039-019-0466-9
Transcript of Microarray expression studies on bone marrow of patients ...

RESEARCH Open Access
Microarray expression studies on bonemarrow of patients with Shwachman-Diamond syndrome in relation to deletionof the long arm of chromosome 20, otherchromosome anomalies or normalkaryotypeAbdul Waheed Khan1, Antonella Minelli2, Annalisa Frattini1,3, Giuseppe Montalbano1, Alessia Bogni4, Marco Fabbri5,Giovanni Porta1, Francesco Acquati6, Rita Maria Pinto7, Elena Bergami8, Rossella Mura9, Anna Pegoraro10,Simone Cesaro10, Marco Cipolli11, Marco Zecca8, Cesare Danesino2, Franco Locatelli7, Emanuela Maserati1,Francesco Pasquali1 and Roberto Valli1*
Abstract
Background: Clonal chromosome changes are often found in the bone marrow (BM) of patients with Shwachman-Diamond syndrome (SDS). The most frequent ones include an isochromosome of the long arm of chromosome 7, i(7)(q10), and an interstitial deletion of the long arm of chromosome 20, del (20)(q). These two imbalances aremechanisms of somatic genetic rescue. The literature offers few expression studies on SDS.
Results: We report the expression analysis of bone marrow (BM) cells of patients with SDS in relation to normalkaryotype or to the presence of clonal chromosome anomalies: del (20)(q) (five cases), i (7)(q10) (one case), andother anomalies (two cases). The study was performed using the microarray technique considering the wholetranscriptome (WT) and three gene subsets selected as relevant in BM functions. The expression patterns of ninehealthy controls and SDS patients with or without chromosome anomalies in the bone marrow showed cleardifferences.
Conclusions: There is a significant difference between gene expression in the BM of SDS patients and healthysubjects, both at the WT level and in the selected gene sets. The deletion del (20)(q), with the EIF6 gene consistentlylost, even in patients with the smallest losses of material, changes the transcription pattern: a low proportion ofabnormal cells led to a pattern similar to SDS patients without acquired anomalies, whereas a high proportion yields apattern similar to healthy subjects. Hence, the benign prognostic value of del (20)(q). The case of i (7)(q10) showed atranscription pattern similar to healthy subjects, paralleling the positive prognostic role of this anomaly as well.
Keywords: Shwachman-diamond syndrome, Expression analysis, Clonal chromosome anomalies in bone marrow, EIF6gene, Risk of MDS/AML, Somatic genetic rescue
© The Author(s). 2019 Open Access This article is distributed under the terms of the Creative Commons Attribution 4.0International License (http://creativecommons.org/licenses/by/4.0/), which permits unrestricted use, distribution, andreproduction in any medium, provided you give appropriate credit to the original author(s) and the source, provide a link tothe Creative Commons license, and indicate if changes were made. The Creative Commons Public Domain Dedication waiver(http://creativecommons.org/publicdomain/zero/1.0/) applies to the data made available in this article, unless otherwise stated.
* Correspondence: [email protected] Umana e Medica, Dipartimento di Medicina e Chirurgia, Universitàdell’Insubria, Via J. H. Dunant, 5, 21100 Varese, ItalyFull list of author information is available at the end of the article
Khan et al. Molecular Cytogenetics (2020) 13:1 https://doi.org/10.1186/s13039-019-0466-9
BackgroundShwachman-Diamond syndrome (SDS) is an autosomalrecessive disorder (Online Mendelian Inheritance inMan #260400) characterized by bone marrow failure,peripheral cytopenias and an increased risk of develop-ing myelodysplastic syndrome (MDS) and acute myeloidleukaemia (AML). The patients exhibit several otheranomalies, including cognitive impairment [1]. SDS iscaused by mutations in the SBDS gene in at least 90% ofcases [1], but it is genetically heterogeneous. In additionto other functions, the SBDS protein has a pivotal rolein ribosome biogenesis [1]. Furthermore, biallelic muta-tions of two other genes involved in ribosome biogenesismay cause SDS or an SDS-like condition: DNAJC21 [2,3] and EFL1 [4]. Moreover, an SDS-like phenotype maybe caused by monoallelic mutations in the SRP54 gene,which produces a protein that is a key member of thecotranslation protein-targeting pathway [5]. Therefore,SDS may be considered a ribosomopathy.Clonal chromosome changes are often found in the
bone marrow (BM) of patients with SDS. Among them,the most frequent ones include an isochromosome ofthe long arm of chromosome 7, i (7)(q10), and an inter-stitial deletion of the long arm of chromosome 20, del(20)(q) [6]. We already postulated that the presence ofdel (20)(q), with the loss of the EIF6 gene, results inmore efficient ribosome biogenesis and implies both alower risk of MDS/AML [7] and a milder haemato-logical condition compared to SDS patients without del(20)(q) [8, 9].The literature offers quite a few expression studies on
SDS. Some of them concern the expression of specificgenes in SBDS knocked-down cell lines (HeLa, NIH3T3)or in BM cells of SDS patients. These studies reveal in-teresting results; however, the scope of the presentedwork is limited to a few sets of considered genes [10–12]. We also remark that in some cell lines, such asHeLa, the results of expression analysis might be altereddue to high variability of genomic instability and expres-sion profiling among different batches, to the point thatsome results may be not completely reliable [13]. Moreextensive expression studies on BM from SDS patientsand on other modified cell lines led to the detection of aseries of genes that are up- or downregulated. Amongthose gene sets, many are important in leukaemia patho-genesis or ribosome biogenesis and function [14, 15].Possible chromosome anomalies were not considered inall those studies.The benign prognostic role of del (20)(q) that is ac-
quired in BM prompted us to perform an expressionstudy on the BM of patients with del (20)(q) even at thelevel of the whole transcriptome. In these patients, wereport the expression analysis of the EIF6 gene, of thewhole genome, and of gene sets selected as relevant in
haematopoiesis, myeloid leukaemias, or myeloid differ-entiation. These results are compared with thoseobtained from patients who exhibit other clonalchromosome anomalies or show a normal karyotype inrelation to healthy controls.
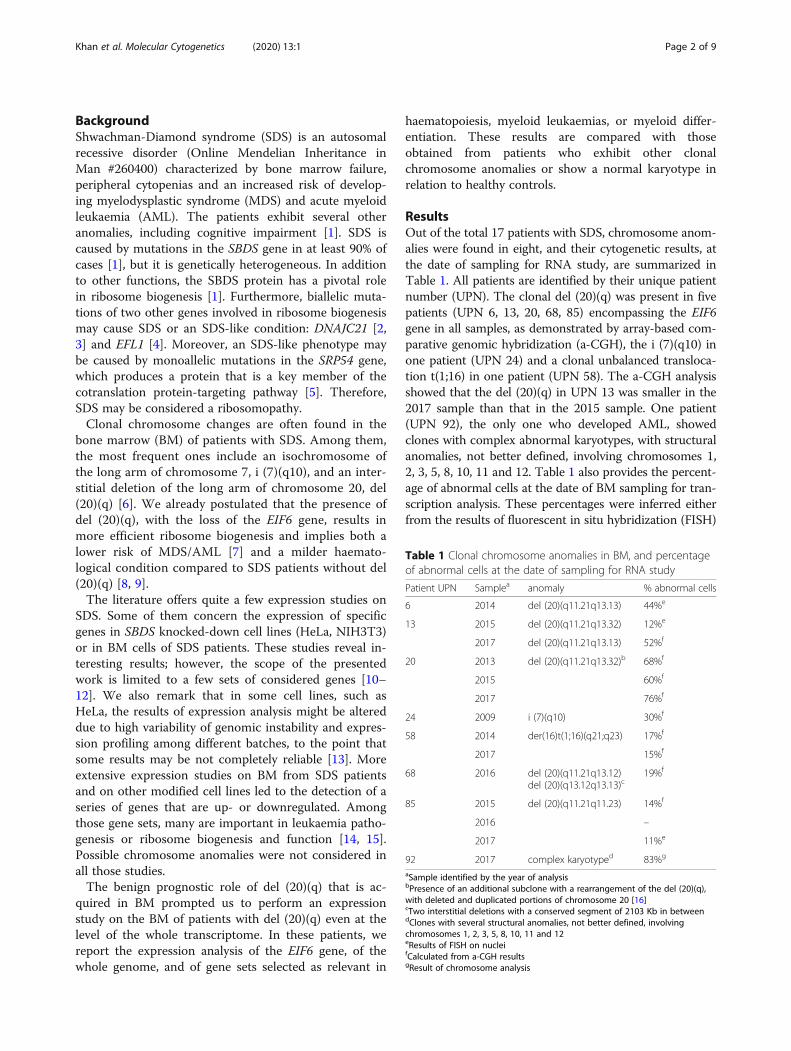
ResultsOut of the total 17 patients with SDS, chromosome anom-alies were found in eight, and their cytogenetic results, atthe date of sampling for RNA study, are summarized inTable 1. All patients are identified by their unique patientnumber (UPN). The clonal del (20)(q) was present in fivepatients (UPN 6, 13, 20, 68, 85) encompassing the EIF6gene in all samples, as demonstrated by array-based com-parative genomic hybridization (a-CGH), the i (7)(q10) inone patient (UPN 24) and a clonal unbalanced transloca-tion t(1;16) in one patient (UPN 58). The a-CGH analysisshowed that the del (20)(q) in UPN 13 was smaller in the2017 sample than that in the 2015 sample. One patient(UPN 92), the only one who developed AML, showedclones with complex abnormal karyotypes, with structuralanomalies, not better defined, involving chromosomes 1,2, 3, 5, 8, 10, 11 and 12. Table 1 also provides the percent-age of abnormal cells at the date of BM sampling for tran-scription analysis. These percentages were inferred eitherfrom the results of fluorescent in situ hybridization (FISH)
Table 1 Clonal chromosome anomalies in BM, and percentageof abnormal cells at the date of sampling for RNA study
Patient UPN Samplea anomaly % abnormal cells
6 2014 del (20)(q11.21q13.13) 44%e
13 2015 del (20)(q11.21q13.32) 12%e
2017 del (20)(q11.21q13.13) 52%f
20 2013 del (20)(q11.21q13.32)b 68%f
2015 60%f
2017 76%f
24 2009 i (7)(q10) 30%f
58 2014 der(16)t(1;16)(q21;q23) 17%f
2017 15%f
68 2016 del (20)(q11.21q13.12)del (20)(q13.12q13.13)c
19%f
85 2015 del (20)(q11.21q11.23) 14%f
2016 –
2017 11%e
92 2017 complex karyotyped 83%g
aSample identified by the year of analysisbPresence of an additional subclone with a rearrangement of the del (20)(q),with deleted and duplicated portions of chromosome 20 [16]cTwo interstitial deletions with a conserved segment of 2103 Kb in betweendClones with several structural anomalies, not better defined, involvingchromosomes 1, 2, 3, 5, 8, 10, 11 and 12eResults of FISH on nucleifCalculated from a-CGH resultsgResult of chromosome analysis
Khan et al. Molecular Cytogenetics (2020) 13:1 Page 2 of 9

on nuclei with informative probes or from the results of a-CGH with the appropriate formula [17] or from chromo-some analysis (in one patient).In nine patients, no anomalies were present in the BM
at the date of sampling for RNA study, according to theavailable results of chromosome analyses, FISH withprobes informative for i (7)(q10) and del (20)(q), and a-CGH (UPN 2, 26, 45, 51, 60, 70, 80, 81, 91). In thispaper, we designated these patients as SDS-NK (normalkaryotype) patients.In the context of expression studies, we extrapolated
the EIF6 RNA levels from the array raw data, and theyare shown in Fig. 1a. The mean and the standard errorfor the expression levels of the nine normal controls andthe nine SDS-NK patients are reported in black and greybars, respectively, whereas the other bars refer to singlepatient specimens. Figure 1b shows the log2 heatmap forEIF6 expression levels.Whole transcriptome (WT) results were analysed by
principal component analysis (PCA) from both SDS
patients (with and without chromosome anomalies) andcontrols. The graph showing PCA for all the subjectsunder study is shown in Fig. 2. A trend indicating thestratification of patients in groups is appreciable. WTcluster analysis led to the dendrogram shown in Fig. 3.We analysed some specific gene sets by PCA and
cluster analysis (Additional file 1: Figures S1, S2, S3,S4, S5 and S6), chosen as relevant in haemopoiesisand leukaemogenesis:
1) Gene set 1: KEGG Haematopoietic Cell Lineage(map 04640): this pathway is composed of 88 genes,the major portion belonging to cytokines, growthfactors and cell differentiation markers that drivethe differentiation process of the haematopoieticcell lineage [18].
2) Gene set 2: KEGG Acute Myeloid Leukemia(map 05221): this pathway is composed of 60 genesbelonging to oncogenes, protein kinases, tumoursuppressor genes, translocation cancer genes and
Fig. 1 EIF6 expression. a EIF6 normalized expression extrapolated from array raw data. The expression values for the single probe A_23_P210939,included in the array used have been extrapolated by the imported log2 raw data with baseline normalization. Values of each specimen has been2-power exponentially transformed in order to obtain the linear values. b The log2 heatmap for EIF6 expression. The patients’ samples areindicated at the bottom and their chromosome anomalies are inserted in the histogram bars, with the percentage of abnormal cells. The blackand grey bars refer to the average value of the nine controls and the nine SDS-NK patients; the standard error is indicated
Khan et al. Molecular Cytogenetics (2020) 13:1 Page 3 of 9

transcription factors that might be deregulated inacute myeloid leukaemia patients [19].
3) Gene set 3: Gene Ontology Myeloid LeukocyteDifferentiation (GO:0002573): this pathway iscomposed of 96 genes that drive a relativelyunspecialized myeloid precursor cell to acquire thespecialized features of any cell of the myeloidleukocyte lineage [20].
The analysis was performed with the same approachas WT for the three gene sets, and Table 2 summarizesa comparison among the results obtained in the patientswith chromosome changes with those of the groupsdefined by PCA and cluster analyses of WT.
DiscussionThe nine SDS-NK patients showed levels of EIF6 RNAslightly but significantly decreased in comparison to thenine healthy controls (Student’s t test: p = 0.02). All pa-tients carrying the del (20)(q) showed a more remarkabledecrease compared to the healthy controls, with a trendrelated to the proportion of cells containing the deletion(Table 1, Fig. 1a). We postulate that low RNA levels leadto decreased amounts of EIF6 protein, even if we did nothave enough material to prove it. The patient UPN 24,carrying i (7)(q10), exhibits normal EIF6 levels asexpected, as does UPN 58 (with another different
chromosome anomaly) (Fig. 1a). The patient with AMLand a complex karyotype, UPN 92, exhibited increasedlevels of EIF6 (Fig. 1a); it is worth noting that numerousstudies have demonstrated highly aberrant overexpres-sion of EIF6 in human cancer [21].In the WT study, the stratification of SDS patients
shown by PCA offers some relevant conclusions. In par-ticular (Fig. 2), the SDS-NK patients (light blue squares)group on the left, while the controls (red squares) aremore dispersed, and most of them are far from the SDS-NK group. We recall that we worked on RNA extractedfrom whole marrow samples containing heterogeneouspopulations of cells; this may explain the lack of strictlyhomogeneous results in controls. The result, however,indicates that the WT expression pattern of these twogroups is truly different. The difference from controls isin agreement with data already reported, but these re-ports were limited to leukaemia-related genes [14],apoptosis-related genes [10], ribosome biogenesis andRNA processing genes, and other specific genes relevantfor SDS phenotype [11, 12, 15] without any relation tothe presence of clonal chromosome anomalies.The patients carrying the del (20)(q), which encom-
passes the EIF6 gene in all cases, are indicated in Fig. 2by squares of other colours, and they are distributed inthe plot partially in agreement with the different per-centage of cells of the abnormal clone.
Fig. 2 Principal Component Analysis (PCA) plot for the whole transcriptome. Healthy controls are indicated by red squares. SDS-NK patients areindicated by light-blue squares. Patients with chromosomal anomalies are identified by their UPN number and the year of the sample near therelated colored squares. Component 1 and 2 percentages of variance are indicated in the two axes. The black ellipse indicates the 95%confidence interval
Khan et al. Molecular Cytogenetics (2020) 13:1 Page 4 of 9

Fig. 3 Dendrogram of cluster analysis for the whole transcriptome. Two groups (1 and 2) may be identified. Healthy controls are in red and SDS-NK patients are indicated in light blue with their UPN number. Patients with chromosome anomalies are in black with their UPN number andsample (year), followed by the chromosome anomaly and the percentage of abnormal cells
Table 2 Transcription study of the selected gene sets relevant in haematopoiesis, leukaemogenesis and myeloid differentiation,identified as 1, 2, and 3 and described in the Results Section: comparison of the results obtained in patients with clonal anomalies(Table 1), grouped here as A and B. Group A includes most healthy controls and Group B all SDS-NK patients. Patient UPN 92, withAML and complex karyotype is not included in the Table, because her expression profile was different from all other subjectsinvestigated and outside the groups identified
Samplea Anomaly – %b Gene Set 1 Gene Set 2 Gene set 3
Group Group Group
A B A B A B
UPN 6–2014 del (20) – 44% • • •
UPN 13–2015 del (20) – 12% • • •
UPN 13–2017 del (20) – 52% • • •
UPN 20–2013 del (20) – 68% • • •
UPN 20–2015 del (20) – 60% • • •
UPN 20–2017 del (20) – 76% • • •
UPN 24–2009 i (7)(q10) – 30% • • •
UPN 58–2014 der(16)t(1;16) – 17% • • •
UPN 58–2017 der(16)t(1;16) – 15% • • •
UPN 68–2016 del (20) – 19% • • •
UPN 85–2015 del (20) – 14% • • •
UPN 85–2016 del (20) • • •
UPN 85–2017 del (20) – 11% • • •aSee Table 1bClonal anomaly in short - % abnormal cells
Khan et al. Molecular Cytogenetics (2020) 13:1 Page 5 of 9

Among these patients, the percentage of abnormal BMcells of UPN 68 and UPN 85 was rather low (Table 1),EIF6 expression was only slightly reduced (Fig. 1a), andthe PCA plots these BM samples were near the SDS-NKgroup. Therefore, these two patients with a small num-ber of cells with del (20)(q) show a WT expression pat-tern similar to SDS-NK patients.In contrast, patients UPN 6 and UPN 20 (sample
2013), who carry a high proportion of cells with del(20)(q) in the BM (Table 1), with evident decreasedlevels of EIF6 transcript (Fig. 1a), are plotted in the PCAgraph rather distantly from SDS-NK patients. The othertwo specimens of UPN 20 (sampled in 2015 and 2017,with similar del (20)(q) cell proportions and EIF6hypoexpression patterns) are plotted closer to the SDS-NK group. This patient also carried a subclone with afurther rearrangement of the del (20)(q), with deletion ofthe short arm and portions of the chromosome dupli-cated and deleted [16]. The proportion of this subcloneincreased from 2013 to 2017, while neutropenia wors-ened: the difference in expression might be due to thissubclone. We postulate that the loss of EIF6 protein wasenough to give a transcription pattern similar to controlsin 2013 but was less effective in 2015 and 2017. Thiscould explain the different plots of the sample UPN 20–2013 from UPN 20–2015 and UPN 20–2017. The pa-tient UPN 13 exhibited an unexpected pattern for thetwo specimens from 2013 and 2015. In particular, theUPN 13–2015 sample has a low number of cells with del(20)(q) (Table 1), and EIF6 expression is only slightly re-duced (Fig. 1a). It is plotted in the PCA far from theSDS-NK group. In contrast, specimen UPN 13–2013,with a high proportion of cells with del (20)(q) and a re-markably low level of EIF6 transcript, is plotted closer tothe SDS-NK group. In fact, patient UPN 13 showed twodifferent extents of the deletion in these two differentspecimens (Table 1). This could explain the differencesin the PCA plots.In general, these data indicate that patients with a high
proportion of cells containing del (20)(q) show a WT ex-pression pattern similar to healthy controls in the ab-sence of further changes that may modify the pattern.The positive prognostic role of del (20)(q) would be aconsequence of this type of rescue mechanism [8, 9], al-though it would be limited to cases with a high propor-tion of abnormal cells [22].Patient UPN 24, with the i (7)(q) present in ~ 30% of
the cells (Table 1), is plotted by the PCA algorithm farfrom the SDS-NK group. In the isochromosome, theSBDS gene is present twice in the form of the mild mu-tation 258 + 2 T > C, and this fact leads to a differentform of rescue mechanism in ribosome biogenesis,impaired by SBDS mutations, thanks to some amount ofnormal SBDS protein [23]. UPN 58, with specimens in
2014 and 2017, carries an unbalanced complexrearrangement that involves chromosomes 1 and 16(Table 1). The two samples of this patient are plotteddifferently in the graph. We have no clear-cut explan-ation for this result, but in conditions different fromSDS, gene effects of unbalanced chromosome anomaliesmay be detected and cause specific pathologic features[24]. The only patient that developed AML (UPN 92)has a complex karyotype (Table 1) and is plotted in thePCA graph far from all the other patients and outsidethe 95% confidence interval (Fig. 2).The dendrogram shown in Fig. 3 resembles the PCA
plots of Fig. 2. The interconnection lines identify twogroups (1 and 2) with similar distribution to the PCAplot commented above.The transcription study of the selected groups of genes
relevant in haematopoiesis, leukaemogenesis and mye-loid differentiation defined in the Results section gaveresults in PCA largely similar to WT: SDS-NK constitutea well-defined group in all gene sets, while most healthycontrols do not constitute a real group and are more dis-persed in the plot (Additional file 1: Figures S1, S3 andS5). Cluster analysis based on dendrogram diagrams andrelated heatmaps confirmed this difference, with particu-lar evidence for gene sets 1 and 2 (Additional file 1:Figures S2, S4 and S6).Regarding patients carrying clonal chromosome
changes, Table 2 shows a comparison of their resultswith healthy donors and SDS-NK patients. Most pa-tients carrying del (20)(q) at low percentages fall in thegroup of SDS-NK patients for all gene sets (group B inTable 2), which is expected because EIF6 RNA in thesepatients is close to normal levels and cannot lead to arescue of the altered SBDS pathway. On the other hand,most of the patients with higher percentages of del(20)(q) fall closer to healthy controls (group A inTable 2), as expected by the rescue mechanism postu-lated when the level of EIF6 is reduced. Few exceptionsare present, and the explanation would be as for WT.Additionally, the only patient with i (7)(q10) falls in thegroup of the healthy controls, as expected, by the otherrescue mechanism described [23].The following points about the three gene sets ana-
lysed are worth highlighting.
Gene set 1: An interesting subset of genes, includingthe oncogene KIT, THPO (Thrombopoietin), EPO(erythropoietin), GP1BA (Glycoprotein 1b PlateletSubunit Alpha), and some cytokines, are upregulated incontrols and downregulated in SDS-NK patients(Additional file 1: Figure S2). Another group involvingmany cluster differentiation (CD) genes and othercytokines is upregulated in the SDS-NK group anddownregulated in controls.
Khan et al. Molecular Cytogenetics (2020) 13:1 Page 6 of 9

Gene set 2: The cluster analysis (Additional file 1:Figure S4) firmly indicates a group of genes, includingoncogenes and transcription factors, that areupregulated in controls and downregulated in SDS-NK.Gene set 3: The cluster analysis also showed that thegene ANXA2 is extremely downregulated in the healthycontrols, while it is expressed within the baseline levelin the SDS-NK group (Additional file 1: Figure S6).ANXA2 is frequently upregulated in many types ofcancers [25]. A group of genes (IL31RA, TNFSF11,TNFSF11A, KIT, CSF1, CSF2, CSF3, IL25, GPC3,FARP2, EFNA2, EPHA2, BMP4, CASP10) is upregulatedin healthy controls and, interestingly, in UPN 6, UPN13–2015, UPN 20–2013, with del (20)(q), in UPN 24,with i (7)(q10), and in UPN 58–2014, with the der(16)(t(1;16). These genes are transcription factors,oncogenes, cytokines, signal transduction genes,growing factors and apoptotic regulators; they play animportant role in many biological systems, includingleukocyte differentiation, bone morphogenesis, andmacrophage differentiation.
ConclusionsIn summary, our transcription study shows thefollowing:
– There is a difference between gene expression inBM of SDS patients and healthy subjects, both atthe level of WT and that of selected gene setsrelevant for BM functions;
– In SDS patients, the presence of clonal chromosomeanomalies also makes the difference at thetranscription level;
– The deletion del (20)(q), with the loss of EIF6 gene,present even in the smallest deletions, changes thetranscription pattern of BM: a low proportion ofabnormal cells led to a pattern similar to SDSpatients without acquired chromosome anomalies,whereas a high proportion exhibit a pattern similarto healthy subjects; hence, the benign prognosticvalue of the del (20)(q) which has already beendemonstrated in many patients [8];
– The single case of i (7)(q10) included in this studyshowed a benign transcription pattern, similar tohealthy subjects, paralleling the already establishedpositive prognostic role of this anomaly as well;
– Too little is known about other acquired clonalanomalies to reach any relevant conclusions forprognosis.
MethodsPatient selection and sample preparationThe materials for our study consisted of 23 BM samplesfrom 17 patients with SDS, as in four cases the analysis
was repeated at two different dates (two cases) or three(two other cases). The patients included three females and14 males, with an age range of 2–44 years at the time ofsampling for RNA analysis. All patients are part of the co-hort of 97 Italian patients who have been followed forcytogenetics since 1999. All patients had biallelic muta-tions in the SBDS gene, including 14/17 cases with thetwo most frequent mutations. Some analyses were re-peated at different dates in subsequent years, as the pro-portion of abnormal cells may vary considerably in time.A portion of the cytogenetic results has already been re-ported [16, 22, 26–28]. Table 1 gives the years of the cyto-genetic analyses performed at the time of sampling forexpression studies. All patients are identified by theirUPN, as in our previous publications. We reported anddiscussed the haematological parameters of the patientswith del (20)(q) [8], although the sampling date is oftennot the same as the present RNA study. Some additionalhaematological data of all the SDS patients reported hereare provided in Additional file 2: Table S1.Nine healthy subjects were used as controls, and their
BM was drawn because they were donors for haemato-poietic stem cell transplantation (HSCT).Informed consent for this study was obtained accord-
ing to the principles of the Declaration of Helsinki fromthe patients or the patients’ parents.Chromosome analyses were performed on BM with rou-
tine methods. FISH on BM nuclei was carried out bystandard techniques with the following bac probes, in-formative for the deletion del (20)(q) detected in each pa-tient: RP11-17F3 (UPN 6, 13, 20), CTD-2559C9 (UPN 13),XL Del(20q) probe (Metasystems, Altlussheim, Germany)(UPN 68), RP11-17F3 + RP11-29E13 (UPN 85).The a-CGH was performed on DNA from BM samples
with the 244 K genome-wide system (Agilent TechnologiesInc., Santa Clara, CA, USA) according to the manufac-turer’s instructions, as already described [29]. All DNA wasextracted from BM using a liquid-based Flexigene kit (Qia-gen, Hilden, Germany) as recommended by Nacheva et al.,2017 [30].For expression analysis of patients with SDS and con-
trols, 2 ml of BM material was immediately pipetted intoa PAXgene Bone Marrow RNA Tube (Qiagen, Hilden,Germany). The extraction was performed with the PAX-gene Bone Marrow RNA Kit (Qiagen, Hilden, Germany).RNA integrity was assessed by Agilent’s Bioanalyzer2100 instrument (Agilent Technologies, Santa Clara,USA) according to the manufacturer’s instructions. Allthe RNA samples used in this study exhibited an RNAIntegrity Number (RIN) [31] above 8.0.
Whole transcriptome microarray and bioinformatical analysisWe used the Agilent Microarray System (Agilent Tech-nologies, Santa Clara, USA) to perform microarray
Khan et al. Molecular Cytogenetics (2020) 13:1 Page 7 of 9

expression profiling according to Agilent’s One-ColorMicroarray-Based Gene Expression Analysis Low InputQuick Amp Labelling Protocol (Version 6.9.1) withAgilent’s Whole Transcriptome (WT) Oligo HumanMicroarray slides 8 × 60 K format (G4851A, AMADID#028004).Data analysis was performed using Agilent GeneSpring
14.9.1 software. Data from each sample were importedinto the software with the following parameters: Thresh-old: 1, Logbase: 2, Normalization: Shift to 75.0 percent-ile, Baseline Transformation: median of all samples.Clustering analysis was performed by hierarchical
analysis on normalized intensity values with EuclideanDistance Metrics and Ward’s linkage rules both on allgenes as well as on selected gene sets. PCA was per-formed by the internal software plugin both with allgenes as well as on selected gene sets.
Supplementary informationSupplementary information accompanies this paper at https://doi.org/10.1186/s13039-019-0466-9.
Additional file 1: Figures S1, S2, S3, S4, S5 and S6. PCA and clusteranalysis, with heatmaps and dendrograms, of the three gene sets chosenas relevant in haemopoiesis and leukaemogenesis and defined in theResults section.
Additional file 2: Table S1. Blood count and bone marrow cellularityof all the SDS patients here reported at the date of sampling for RNAexpression study.
Abbreviationsa-CGH: Array-based comparative genomic hybridization; AML: Acute myeloidleukaemia; BM: Bone marrow; DNA: Deoxyribonucleic acid; FISH: Fluorescentin situ hybridization; HSCT: Haematopoietic stem cell transplantation;MDS: Myelodysplastic syndrome; PCA: Principal component analysis;RIN: RNA integrity number; RNA: Ribonucleic acid; SDS: ShwachmanDiamond syndrome; SDS-NK: SDS with normal karyotype; UPN: Uniquepatient number; WT: Whole transcriptome
AcknowledgementsThe support of Associazione Italiana Sindrome di Shwachman (AISS) isgratefully acknowledged. The research leading to the microarray dataresulted also from access to the Nanobiotechnology Laboratory under theFramework for open access to the Joint Research Centre ResearchInfrastructures of the European Commission. The authors thank Pascal Colpo.Abdul Waheed Khan is a PhD student enrolled in the Life Sciences andBiotechnology program of the XXXIII cycle.
Authors’ contributionsAWK, AM, AF, GM, AB, MF, GP, FA, RV performed the research and analyzedthe data. RMP, EB, RM, AP, SC, MC, MZ, FL followed the patients andcontributed with all clinical data. RV, CD, EM, FP designed the research,analyzed the data and wrote the paper. All authors read and approved thefinal manuscript.
FundingThis work was supported by grants from the Associazione Italiana Sindromedi Shwachman (AISS). This research was supported by a Grant from theItalian Ministry of Education, University and Research (MIUR) to theDepartment of Molecular Medicine of the University of Pavia under theinitiative “Dipartimenti di Eccellenza (2018–2022)”.
Availability of data and materialsThe data used and analyzed in the current study are available from thecorresponding author on reasonable request.
Ethics approval and consent to participateInformed consent to this study was obtained according to the principles ofthe Declaration of Helsinki from the patients, the patients’ parents, and fromhealthy controls.
Consent for publicationInformed consent for publication was obtained from the patients, thepatients’ parents, and from healthy controls.
Competing interestsThe authors declare that they have no competing interests.
Author details1Genetica Umana e Medica, Dipartimento di Medicina e Chirurgia, Universitàdell’Insubria, Via J. H. Dunant, 5, 21100 Varese, Italy. 2Genetica Medica,Fondazione IRCCS Policlinico S. Matteo and Università di Pavia, Pavia, Italy.3UOS Milano IRGB, Consiglio Nazionale delle Ricerche, Milano, Italy.4European Commission, Joint Research Centre (JRC), Ispra, Italy.5Haematopathology Division, European Institute of Oncology, Milano, Italy.6Department of Biotechnology and Life Sciences, Università dell’Insubria,Varese, Italy. 7Department of Pediatric Hematology and Oncology, IRCCSOspedale Pediatrico Bambino Gesù, Università di Roma Sapienza, Roma, Italy.8Pediatric Hematology / Oncology, Fondazione IRCCS Policlinico S. Matteo,Pavia, Italy. 9SC Oncoematologia Pediatrica, Ospedale PediatricoMicrocitemico “Antonio Cao”, Azienda Ospedaliera Brotzu, Cagliari, Italy.10Pediatric Hematology Oncology, Ospedale Donna Bambino, AziendaOspedaliera Universitaria Integrata, Verona, Italy. 11Cystic Fibrosis Center,Azienda Ospedaliera Universitaria Integrata di Verona, Verona, Italy.
Received: 24 October 2019 Accepted: 13 December 2019
References1. Warren AJ. Molecular basis of the human ribosomopathy Shwachman-
diamond syndrome. Adv Biol Regul. 2018;67:109–27.2. Dhanraj S, Matveev A, Li H, et al. Biallelic mutations in DNAJC21 cause
Shwachman-diamond syndrome. Blood. 2017;129:1557–62.3. D’Amours G, Lopes F, Gauthier J, et al. Refining the phenotype associated
with biallelic DNAJC21 mutations. Clin Genet. 2018;94:252–8.4. Stepensky P, Chacón-Flores M, Kim KH, et al. Mutations in EFL1, an SBDS
partner, are associated with infantile pancytopenia, exocrine pancreaticinsufficiency and skeletal anomalies in a Shwachman-diamond likesyndrome. J Med Genet. 2017;54:558–66.
5. Carapito R, Konantz M, Paillard C, et al. Mutations in signal recognitionparticle SRP54 cause syndromic neutropenia with Shwachman-diamond-likefeatures. J Clin Invest. 2017;127:4090–103.
6. Myers KC, Davies SM, Shimamura A. Clinical and molecular pathophysiologyof Shwachman-diamond syndrome: an update. Hematol Oncol Clin NorthAm. 2013;27:117–28.
7. Pressato B, Valli R, Marletta C, et al. Deletion of chromosome 20 in bonemarrow of patients with Shwachman-diamond syndrome, loss of the EIF6gene and benign prognosis. Br J Haematol. 2012;157:503–5.
8. Valli R, Minelli A, Galbiati M, et al. Shwachman-diamond syndrome withclonal interstitial deletion of the long arm of chromosome 20 in bonemarrow: haematological features, prognosis and genomic instability. Br JHaematol. 2019;184:974–81.
9. Revy P, Kannengiesser C, Fischer A. Somatic genetic rescue in Mendelianhaematopoietic diseases. Nat Rev Genet. 2019;20:582–98.
10. Rujkijyanont P, Watanabe K, Ambekar C, et al. SBDS-deficient cells undergoaccelerated apoptosis through the Fas-pathway. Haematologica. 2008;93:363–71.
11. Nihrane A, Sezgin G, Dsilva S, et al. Depletion of the Shwachman-diamondsyndrome gene product, SBDS, leads to growth inhibition and increasedexpression of OPG and VEGF-A. Blood Cells Mol Dis. 2009;42:85–91.
12. In K, Zaini MA, Müller C, et al. Shwachman-Bodian-diamond syndrome(SBDS) protein deficiency impairs translation re-initiation from C/EBPα andC/EBPβ mRNAs. Nucleic Acids Res. 2016;44:4134–46.
Khan et al. Molecular Cytogenetics (2020) 13:1 Page 8 of 9
13. Frattini A, Fabbri M, Valli R, et al. High variability of genomic instability andgene expression profiling in different HeLa clones. Sci Rep. 2015;5:15377.https://doi.org/10.1038/srep15377.
14. Rujkijyanont P, Beyene J, Wei K, et al. Leukaemia-related gene expression inbone marrow cells from patients with the preleukaemic disorderShwachman-diamond syndrome. Br J Haematol. 2007;137:537–44.
15. Rujkijyanont P, Adams SL, Beyene J, et al. Bone marrow cells from patientswith Shwachman-diamond syndrome abnormally express genes involved inribosome biogenesis and RNA processing. Br J Haematol. 2009;145:806–15.
16. Valli R, De Paoli E, Nacci L, et al. Novel recurrent chromosome anomalies inShwachman-diamond syndrome. Pediatr Blood Cancer. 2017;64:e26454.
17. Valli R, Maserati E, Marletta C, et al. Evaluating chromosomal mosaicism byarray comparative genomic hybridization in haematological malignancies:the proposal of a formula. Cancer Gene Ther. 2011;204:216–8.
18. Kyoto Encyclopedia of Genes and Genomes (KEGG): map 04640Hematopoietic Cell lineage http://software.broadinstitute.org/gsea/msigdb/gene_families.jsp?geneSetName=KEGG_HEMATOPOIETIC_CELL_LINEAGEAccessed on 16 July 2019.
19. Kyoto Encyclopedia of Genes and Genomes (KEGG): map 05221 AcuteMyeloid Leukemia http://software.broadinstitute.org/gsea/msigdb/cards/KEGG_ACUTE_MYELOID_LEUKEMIA.html Accessed on 16 July 2019.
20. The Gene Ontology Resource Gene set 3: M10998 - GO Myeloid LeukocyteDifferentiation http://software.broadinstitute.org/gsea/msigdb/cards/GO_MYELOID_LEUKOCYTE_DIFFERENTIATION.htm Accessed on 16 July 2019.
21. Zhu W, Li GX, Chen HL, et al. The role of eukaryotic translation initiationfactor 6 in tumors (review). Oncol Lett. 2017;14:3–9.
22. Pressato B, Valli R, Marletta C, et al. Cytogenetic monitoring in Shwachman-diamond syndrome: a note on clonal progression and a practical warning. JPediatr Hematol Oncol. 2015;37:307–10.
23. Valli R, Frattini A, Minelli A. Shwachman-diamond syndrome: diagnosis,pathogenesis and prognosis. Expert Opin Orphan Drugs. 2017;5:753–67.
24. Noris P, Valli R, Pecci A, et al. Clonal chromosome anomalies affecting FLI1mimic inherited thrombocytopenia of the Paris-trousseau type. Eur JHaematol. 2012;89:345–9.
25. Wang CY, Lin CF. Annexin A2: its molecular regulation and cellularexpression in cancer development. Dis Markers. 2014:308976, e-pub aheadof print 23 January 2014. https://doi.org/10.1155/2014/308976.
26. Maserati E, Minelli A, Pressato B, et al. Shwachman syndrome as mutatorphenotype responsible for myeloid dysplasia/neoplasia through karyotypeinstability and chromosome 7 and 20 anomalies. Genes ChromosomCancer. 2006;45:375–82.
27. Maserati E, Pressato B, Valli R, et al. The route to development ofmyelodysplastic sindrome/acute myeloid leukaemia in Shwachman-diamond syndrome: the role of ageing, karyotype instability, and acquiredchromosome anomalies. Br J Haematol. 2009;145:190–7.
28. Valli R, Pressato B, Marletta C, et al. Different loss of material in recurrentchromosome 20 interstitial deletions in Shwachman-diamond syndromeand in myeloid neoplasms. Mol Cytogenet. 2013;6:56.
29. Valli R, De Bernardi F, Frattini A, et al. Comparative genomic hybridizationon microarray (a-CGH) in olfactory neuroblastoma: analysis of ten cases andreview of the literature. Genes Chromosom Cancer. 2015;54:771–5.
30. Nacheva E, Mokretar K, Soenmez A, et al. DNA isolation protocol effects onnuclear DNA analysis by microarrays, droplet digital PCR, and wholegenome sequencing, and on mitochondrial DNA copy number estimation.PLoS One. 2017;12:e0180467.
31. Schroeder A, Mueller O, Stocker S, et al. The RIN: an RNA integrity numberfor assigning integrity values to RNA measurements. BMC Mol Biol. 2006;7:3.
Publisher’s NoteSpringer Nature remains neutral with regard to jurisdictional claims inpublished maps and institutional affiliations.
Khan et al. Molecular Cytogenetics (2020) 13:1 Page 9 of 9