Michael D. Eriksen University of Cincinnati
21
October 26, 2021 FHFA Fall 2021 Econ Summit Michael D. Eriksen University of Cincinnati
Transcript of Michael D. Eriksen University of Cincinnati
October 26, 2021FHFA Fall 2021 Econ Summit
Michael D. EriksenUniversity of Cincinnati
FHFA Fall 2021 Econ Summit
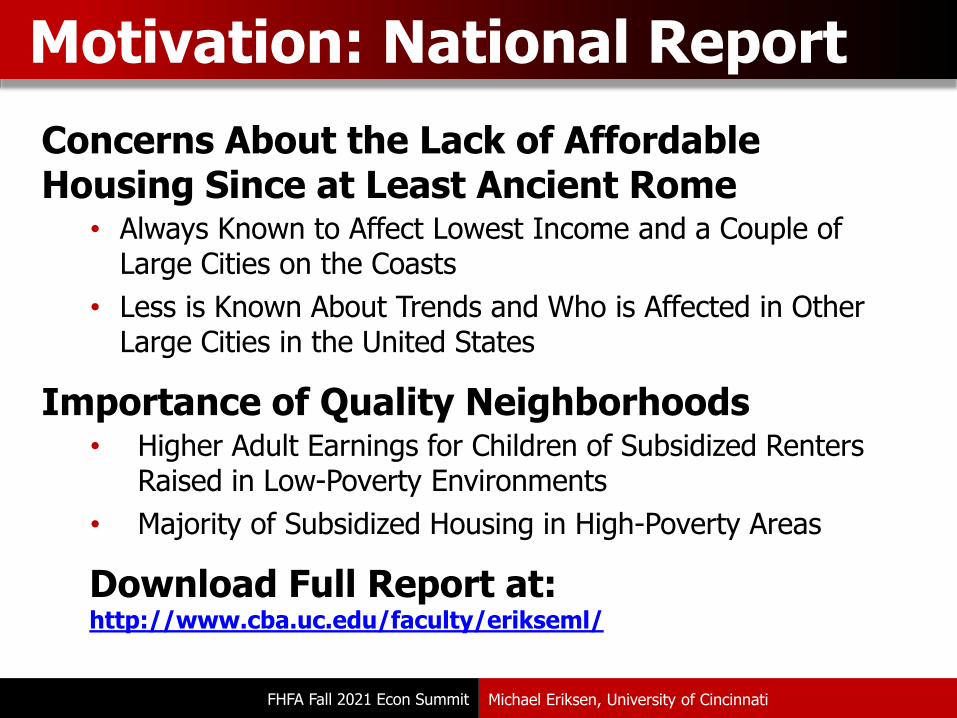
Concerns About the Lack of Affordable Housing Since at Least Ancient Rome
• Always Known to Affect Lowest Income and a Couple of Large Cities on the Coasts
• Less is Known About Trends and Who is Affected in Other Large Cities in the United States
Importance of Quality Neighborhoods• Higher Adult Earnings for Children of Subsidized Renters
Raised in Low-Poverty Environments• Majority of Subsidized Housing in High-Poverty Areas
Download Full Report at: http://www.cba.uc.edu/faculty/erikseml/
Motivation: National Report
Michael Eriksen, University of Cincinnati
FHFA Fall 2021 Econ Summit
1. Rental Housing Affordability Trends since ‘01• Use Publicly Available Data from HUD for 50 Largest Cities• Focus on Median Rents and Incomes since 2001• HUD Median 2-bedroom Rent Projections for 2022
2. Changing Rental Burdens of Low-and Moderate-Income (LMI) Households• Use HUD Definitions of 60% AMI as Low-Income
3. Availability of Subsidized Rental Housing• Location of Public Housing, Vouchers, and LIHTC
Goals for Today
Michael Eriksen, University of Cincinnati
FHFA Fall 2021 Econ Summit
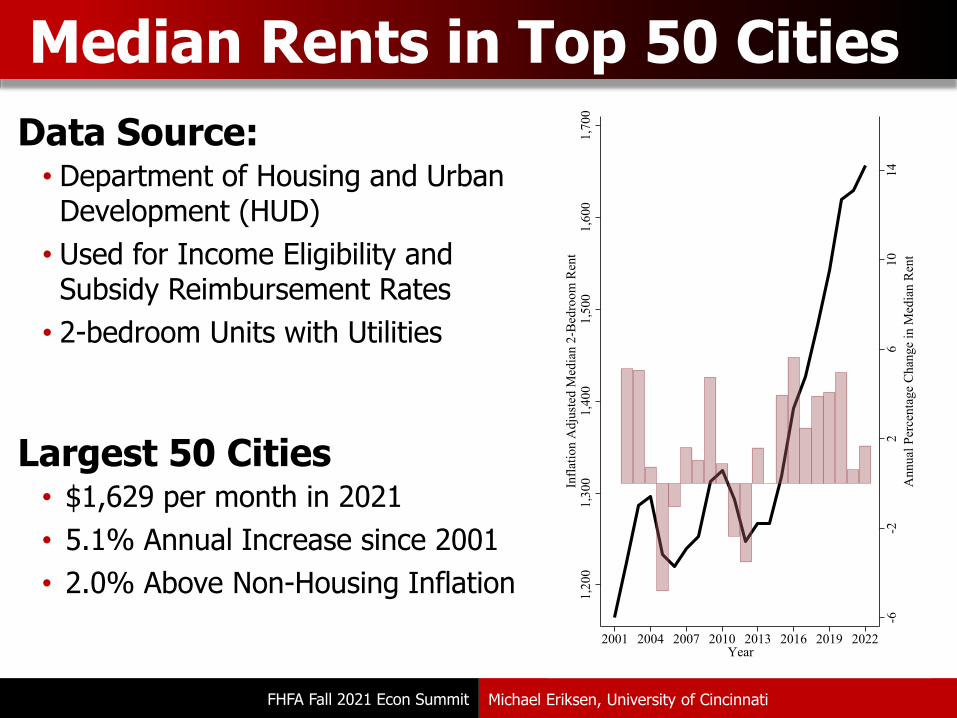
Data Source:• Department of Housing and Urban Development (HUD)
• Used for Income Eligibility and Subsidy Reimbursement Rates
• 2-bedroom Units with Utilities
Largest 50 Cities• $1,629 per month in 2021• 5.1% Annual Increase since 2001• 2.0% Above Non-Housing Inflation
Median Rents in Top 50 Cities
Michael Eriksen, University of Cincinnati
-6-2
26
1014
Ann
ual P
erce
ntag
e C
hang
e in
Med
ian
Ren
t
1,20
01,
300
1,40
01,
500
1,60
01,
700
Infla
tion
Adj
uste
d M
edia
n 2-
Bed
room
Ren
t
2001 2004 2007 2010 2013 2016 2019 2022Year
FHFA Fall 2021 Econ Summit
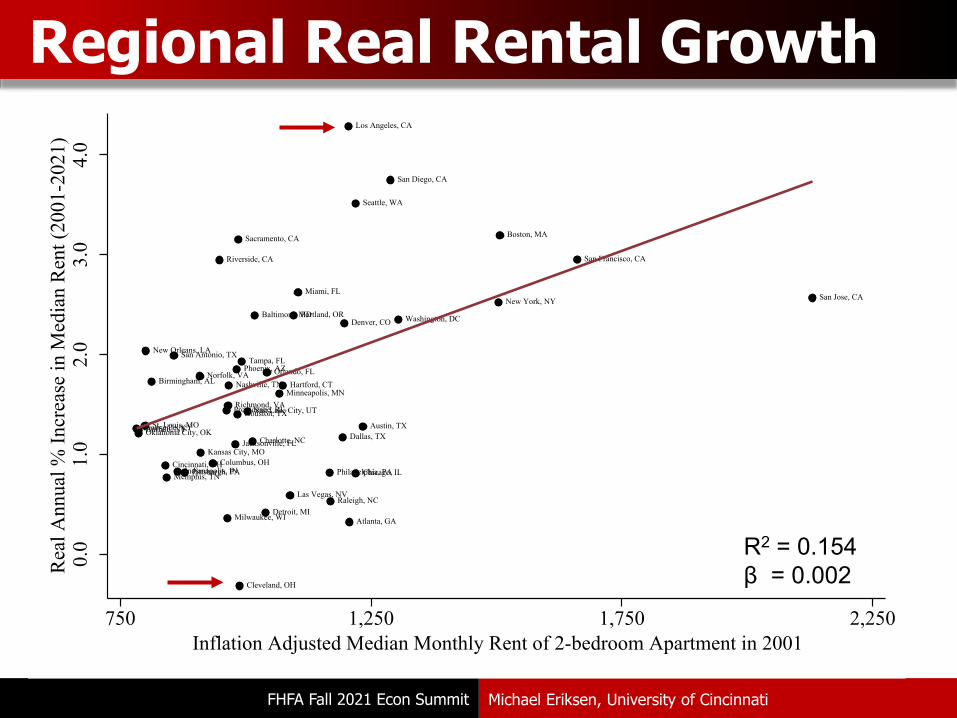
Regional Real Rental Growth
Michael Eriksen, University of Cincinnati
Atlanta, GA
Austin, TX
Baltimore, MD
Birmingham, AL
Boston, MA
Buffalo, NYCharlotte, NC
Chicago, ILCincinnati, OH
Cleveland, OH
Columbus, OH
Dallas, TX
Denver, CO
Detroit, MI
Hartford, CT
Houston, TX
Indianapolis, IN
Jacksonville, FLKansas City, MO
Las Vegas, NV
Los Angeles, CA
Louisville, KY
Memphis, TN
Miami, FL
Milwaukee, WI
Minneapolis, MNNashville, TN
New Orleans, LA
New York, NY
Norfolk, VA
Oklahoma City, OK
Orlando, FL
Philadelphia, PA
Phoenix, AZ
Pittsburgh, PA
Portland, OR
Providence, RI
Raleigh, NC
Richmond, VA
Riverside, CA
Sacramento, CA
Salt Lake City, UT
San Antonio, TX
San Diego, CA
San Francisco, CA
San Jose, CA
Seattle, WA
St. Louis, MO
Tampa, FL
Washington, DC
0.0
1.0
2.0
3.0
4.0
Rea
l Ann
ual %
Incr
ease
in M
edia
n R
ent (
2001
-202
1)
750 1,250 1,750 2,250Inflation Adjusted Median Monthly Rent of 2-bedroom Apartment in 2001
R2 = 0.154β = 0.002
FHFA Fall 2021 Econ Summit
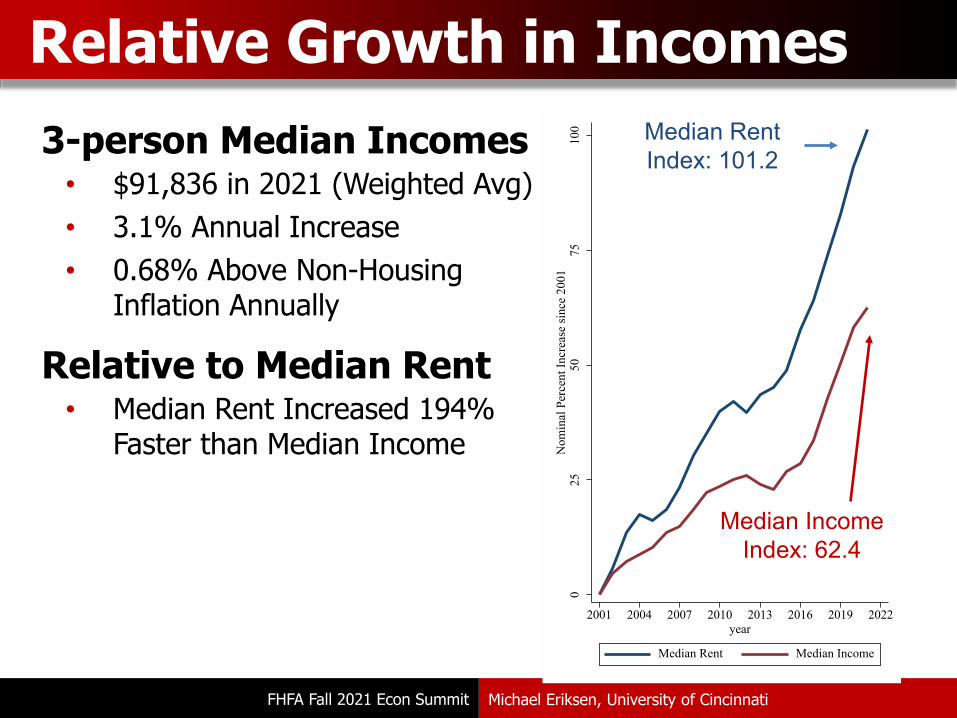
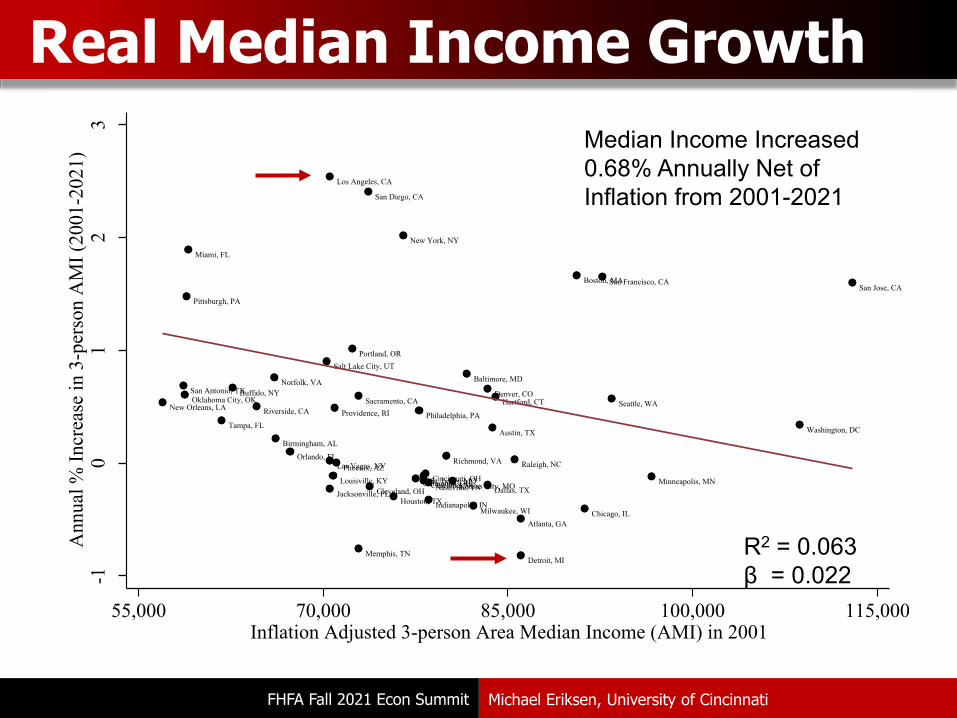
3-person Median Incomes• $91,836 in 2021 (Weighted Avg)• 3.1% Annual Increase• 0.68% Above Non-Housing
Inflation Annually
Relative to Median Rent• Median Rent Increased 194%
Faster than Median Income
Relative Growth in Incomes
Michael Eriksen, University of Cincinnati
025
5075
100
Nom
inal
Per
cent
Incr
ease
sinc
e 20
01
2001 2004 2007 2010 2013 2016 2019 2022year
Median Rent Median Income
Median Rent Index: 101.2
Median Income Index: 62.4
FHFA Fall 2021 Econ Summit
Real Median Income Growth
Michael Eriksen, University of Cincinnati
Atlanta, GA
Austin, TX
Baltimore, MD
Birmingham, AL
Boston, MA
Buffalo, NY
Charlotte, NC
Chicago, IL
Cincinnati, OHCleveland, OH
Columbus, OHDallas, TX
Denver, CO
Detroit, MI
Hartford, CT
Houston, TXIndianapolis, INJacksonville, FL
Kansas City, MO
Las Vegas, NV
Los Angeles, CA
Louisville, KY
Memphis, TN
Miami, FL
Milwaukee, WI
Minneapolis, MNNashville, TN
New Orleans, LA
New York, NY
Norfolk, VA
Oklahoma City, OK
Orlando, FL
Philadelphia, PA
Phoenix, AZ
Pittsburgh, PA
Portland, OR
Providence, RI
Raleigh, NCRichmond, VA
Riverside, CASacramento, CA
Salt Lake City, UT
San Antonio, TX
San Diego, CA
San Francisco, CASan Jose, CA
Seattle, WA
St. Louis, MO
Tampa, FL Washington, DC
-10
12
3A
nnua
l % In
crea
se in
3-p
erso
n A
MI (
2001
-202
1)
55,000 70,000 85,000 100,000 115,000Inflation Adjusted 3-person Area Median Income (AMI) in 2001
R2 = 0.063β = 0.022
Median Income Increased 0.68% Annually Net of Inflation from 2001-2021
FHFA Fall 2021 Econ Summit
Median Rent v. Income Growth
Michael Eriksen, University of Cincinnati
Seattle, WA
Miami, FL
New Orleans, LA
Indianapolis, IN
Norfolk, VA
Boston, MA
Baltimore, MD
Oklahoma City, OK
Cleveland, OH
Birmingham, AL
Dallas, TX
Portland, ORWashington, DC
San Jose, CA
Philadelphia, PA
Atlanta, GA
Denver, CO
Memphis, TN
Salt Lake City, UT
St. Louis, MO
Chicago, IL
Raleigh, NC
Columbus, OH
San Diego, CA
Kansas City, MOJacksonville, FL
Louisville, KY
Nashville, TN
Los Angeles, CA
San Antonio, TX
Milwaukee, WI
Las Vegas, NV
Pittsburgh, PA
Orlando, FL
New York, NY
Cincinnati, OH
Austin, TX
San Francisco, CA
Tampa, FLPhoenix, AZ
Houston, TX
Detroit, MI
Minneapolis, MN
Providence, RI
Riverside, CA
Charlotte, NC
Hartford, CT
Richmond, VA
Buffalo, NY
Sacramento, CA
0.0
1.0
2.0
3.0
4.0
Ann
ual %
Incr
ease
in M
edia
n 2-
Bed
room
Ren
t
-1.0 0.0 1.0 2.0 3.0Annual % Increase in Median 3-person Household Income (2001-2021)
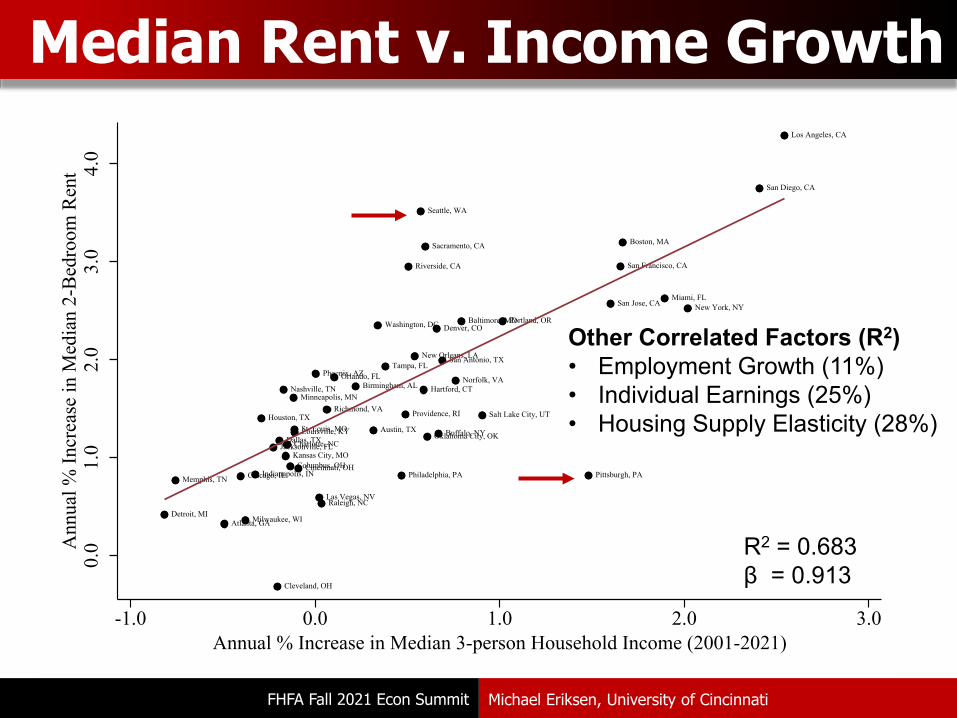
Other Correlated Factors (R2)• Employment Growth (11%)• Individual Earnings (25%)• Housing Supply Elasticity (28%)
R2 = 0.683β = 0.913
FHFA Fall 2021 Econ Summit
HUD Projected Rent Growth
Michael Eriksen, University of Cincinnati
Atlanta, GA
Austin, TX Baltimore, MD
Birmingham, AL
Boston, MA
Buffalo, NY
Charlotte, NC
Chicago, IL
Cincinnati, OH
Cleveland, OH
Columbus, OHDallas, TX
Denver, CODetroit, MI
Hartford, CT
Houston, TX
Indianapolis, IN
Jacksonville, FL
Kansas City, MO
Las Vegas, NV
Los Ang
Louisville, KY
Memphis, TN
Miami, FL
Milwaukee, WI
Minneapolis, MN
Nashville, TN
New Orleans, LA
New York, NY
Norfolk, VA
Oklahoma City, OK
Orlando, FL
Philadelphia, PA
Phoenix, AZ
Pittsburgh, PA
Portland, OR
Providence, RI
Raleigh, NC Richmond, VA
Riverside, CA
Sacramento, CA
Salt Lake City, UT
San Antonio, TX
San Diego, CA
San Francisco, CA
San Jose, CA
Seattle, WA
St. Louis, MO
Tampa, FL
Washington, DC
-5.0
0.0
5.0
10.0
Proj
ecte
d In
crea
se in
Med
ian
Ren
t in
2022
0.0 1.0 2.0 3.0 4.0Annual % Increase in Rent 2001-2021
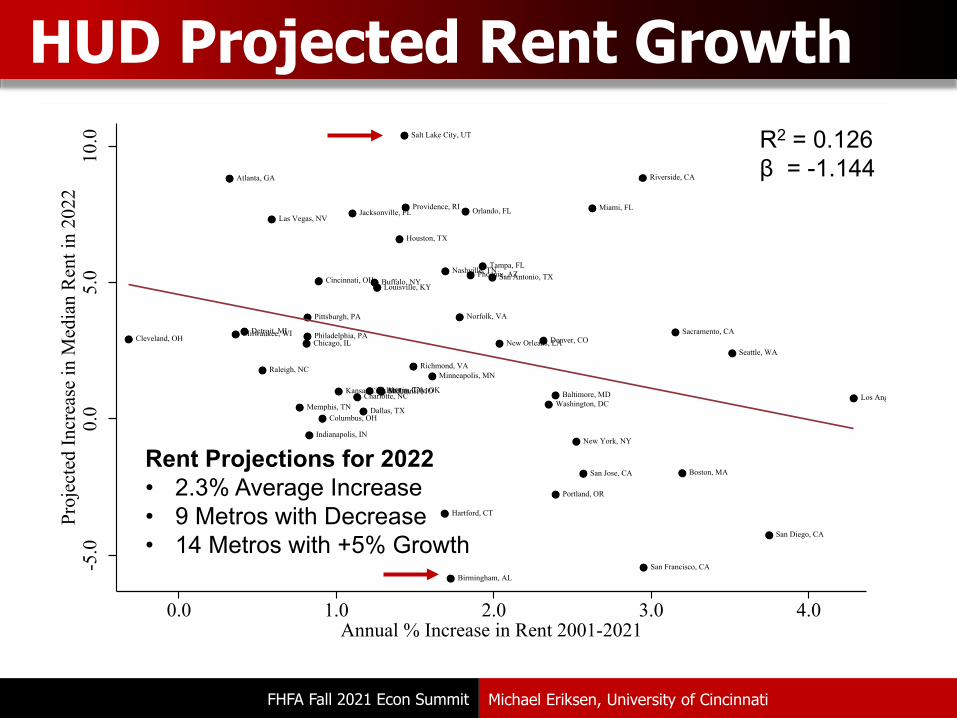
R2 = 0.126β = -1.144
Rent Projections for 2022• 2.3% Average Increase• 9 Metros with Decrease• 14 Metros with +5% Growth
FHFA Fall 2021 Econ Summit
Growth of L&MI Renters
Michael Eriksen, University of Cincinnati
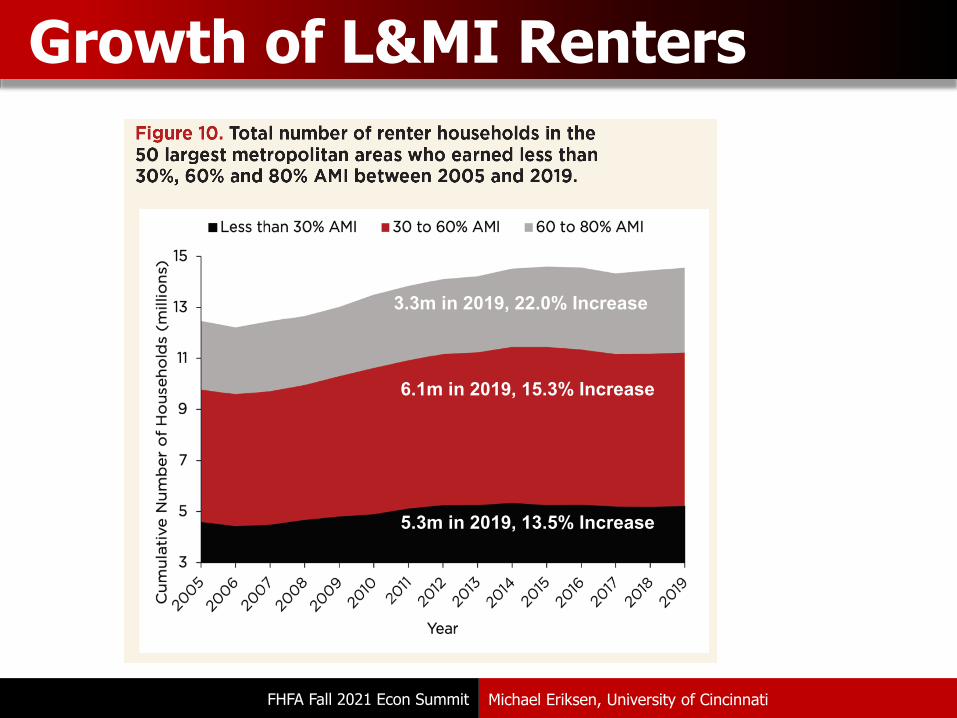
5.3m in 2019, 13.5% Increase
6.1m in 2019, 15.3% Increase
3.3m in 2019, 22.0% Increase
FHFA Fall 2021 Econ Summit
New Orleans, LA
Memphis, TN
Providence, RI Cleveland, OHDetroit, MIPittsburgh, PAChicago, ILLos Angeles, CAMilwaukee, WINew York, NY Louisville, KY
Boston, MASan Francisco, CABaltimore, MD San Jose, CAPortland, ORBuffalo, NY Seattle, WA
Phoenix, AZSan Diego, CAOklahoma City, OK Washington, DCNorfolk, VA Miami, FLSt. Louis, MO
Cincinnati, OH Riverside, CA Dallas, TXRichmond, VAHartford, CT Denver, COColumbus, OHPhiladelphia, PA Orlando, FL Nashville, TNAtlanta, GASacramento, CAKansas City, MOIndianapolis, INSalt Lake City, UTTampa, FLJacksonville, FL
San Antonio, TXHouston, TXMinneapolis, MN
Birmingham, AL
Austin, TX
Las Vegas, NVCharlotte, NC
Raleigh, NC
020
4060
80G
row
th o
f Low
-Inc
ome
Ren
ter H
ouse
hold
s
0 20 40 60 80Percentage Growth of Renter Households (2005-2019)
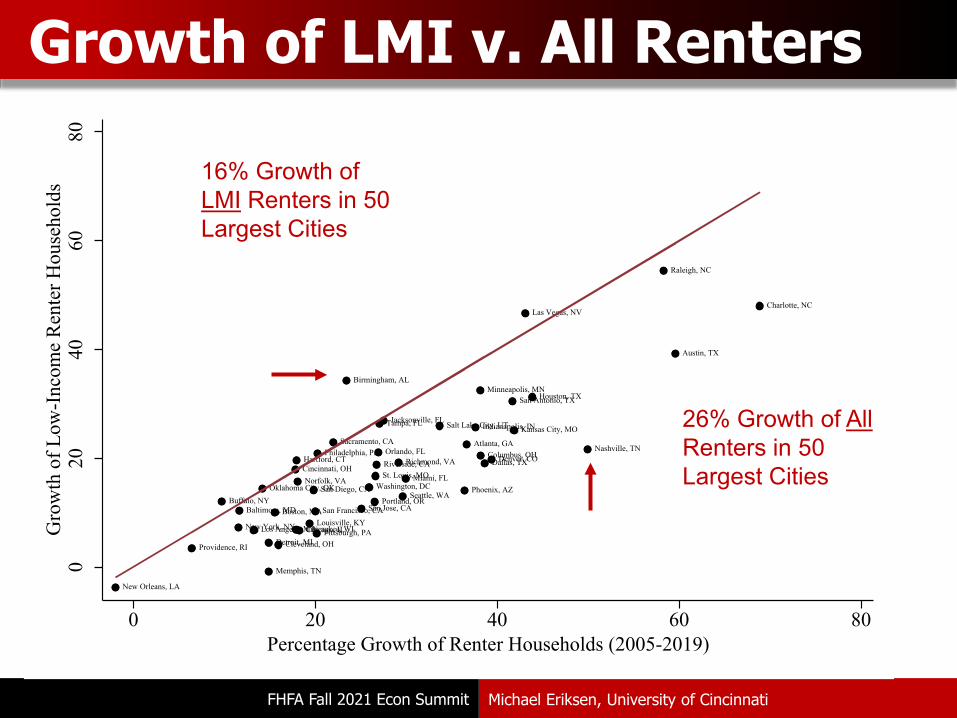
Growth of LMI v. All Renters
Michael Eriksen, University of Cincinnati
26% Growth of AllRenters in 50 Largest Cities
16% Growth of LMI Renters in 50Largest Cities
FHFA Fall 2021 Econ Summit
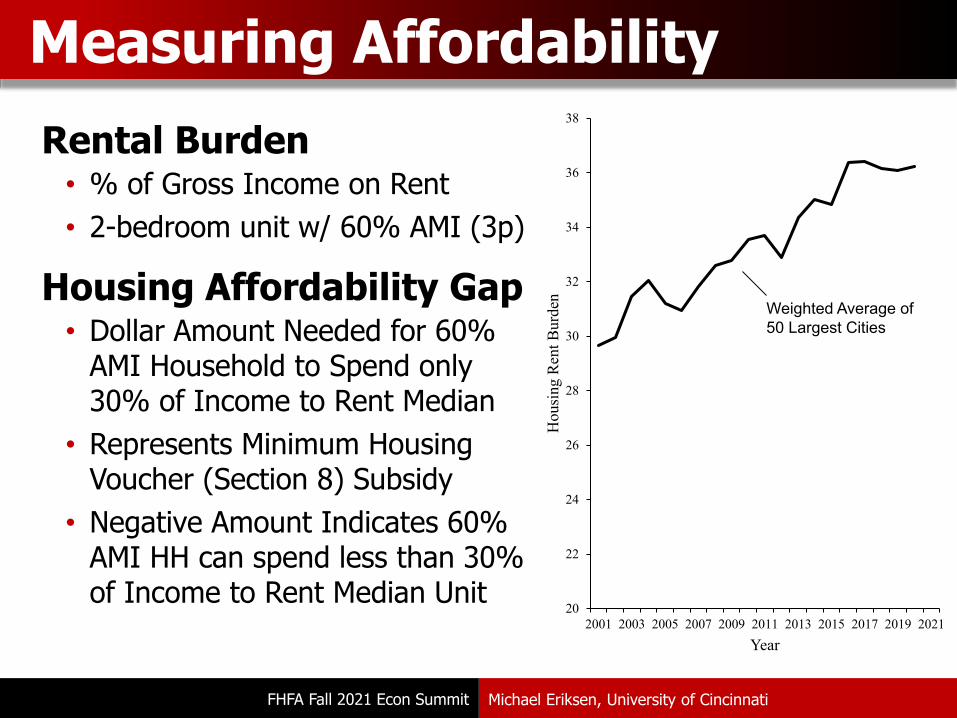
Rental Burden• % of Gross Income on Rent• 2-bedroom unit w/ 60% AMI (3p)
Housing Affordability Gap• Dollar Amount Needed for 60%
AMI Household to Spend only 30% of Income to Rent Median
• Represents Minimum Housing Voucher (Section 8) Subsidy
• Negative Amount Indicates 60% AMI HH can spend less than 30% of Income to Rent Median Unit
Measuring Affordability
Michael Eriksen, University of Cincinnati
20
22
24
26
28
30
32
34
36
38
2001 2003 2005 2007 2009 2011 2013 2015 2017 2019 2021
Hou
sing
Ren
t Bur
den
Year
Weighted Average of 50 Largest Cities
FHFA Fall 2021 Econ Summit
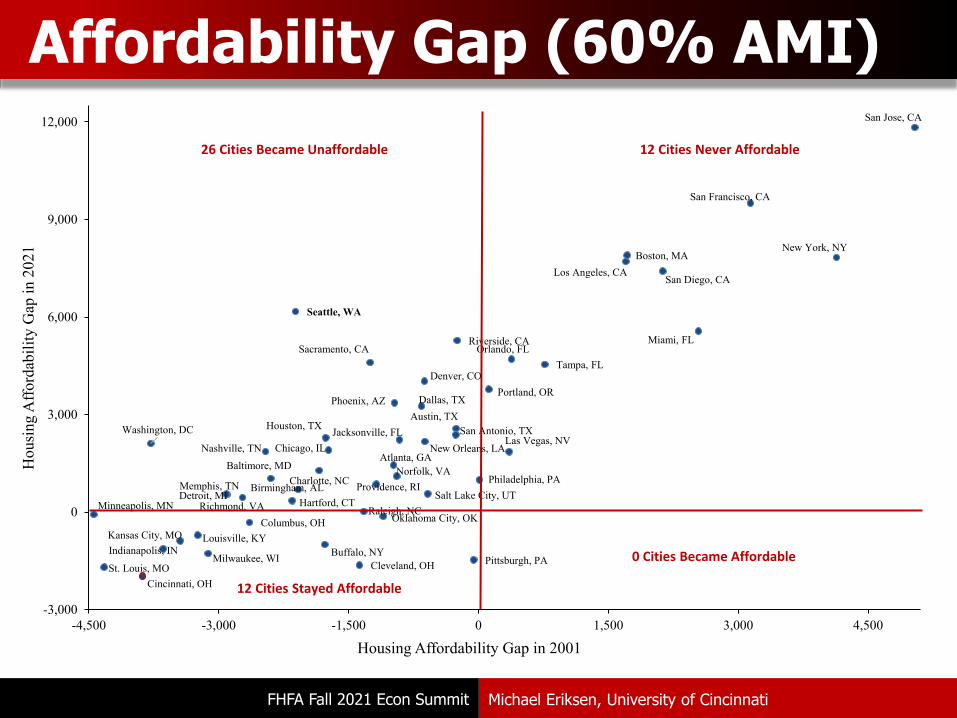
Affordability Gap (60% AMI)
Michael Eriksen, University of Cincinnati
San Jose, CA
San Francisco, CA
Boston, MA
Seattle, WA
San Diego, CANew York, NY
Los Angeles, CA
Miami, FLRiverside, CAOrlando, FL
Denver, COTampa, FL
Portland, OR
Sacramento, CA
Dallas, TXPhoenix, AZ
New Orleans, LA
Washington, DC San Antonio, TXAustin, TXChicago, IL
Las Vegas, NVAtlanta, GA
Jacksonville, FLHouston, TXNashville, TN
Norfolk, VA
Birmingham, AL
Baltimore, MD
Salt Lake City, UTMemphis, TN
Philadelphia, PA
Charlotte, NCDetroit, MI
Raleigh, NC
Providence, RI
Oklahoma City, OKRichmond, VA
Hartford, CT
Columbus, OH
Minneapolis, MN
Indianapolis, INKansas City, MO
Cleveland, OH
Louisville, KY
St. Louis, MOMilwaukee, WI Pittsburgh, PA
Buffalo, NY
Cincinnati, OH
-3,000
0
3,000
6,000
9,000
12,000
-4,500 -3,000 -1,500 0 1,500 3,000 4,500
Hou
sing
Affo
rdab
ility
Gap
in 2
021
Housing Affordability Gap in 2001
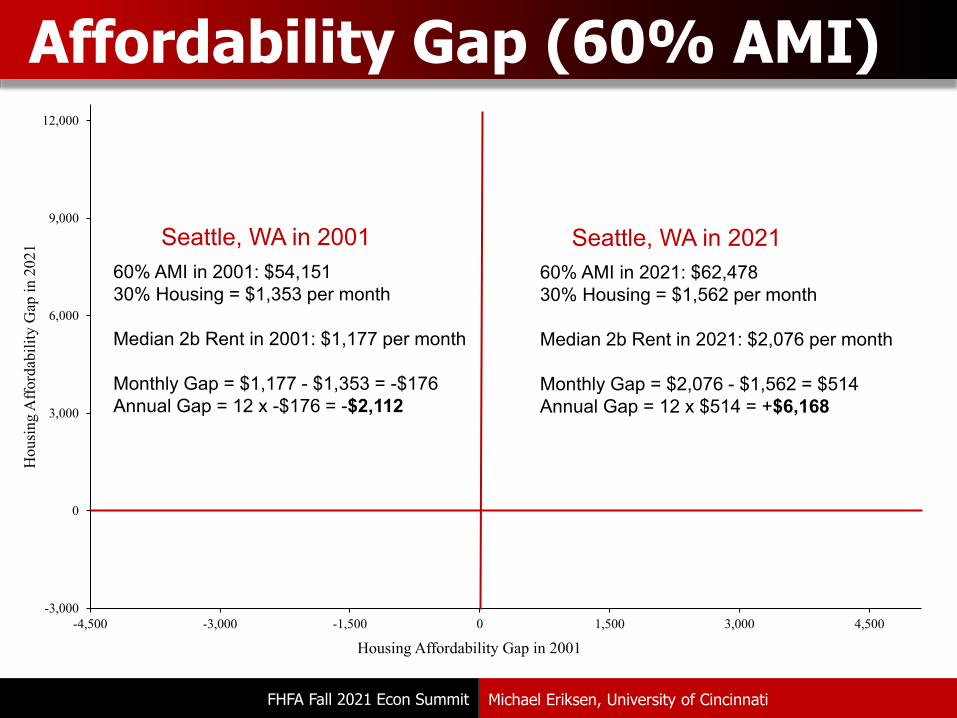
60% AMI in 2001: $54,15130% Housing = $1,353 per month
Median 2b Rent in 2001: $1,177 per month
Monthly Gap = $1,177 - $1,353 = -$176Annual Gap = 12 x -$176 = -$2,112
Seattle, WA in 2001 Seattle, WA in 202160% AMI in 2021: $62,47830% Housing = $1,562 per month
Median 2b Rent in 2021: $2,076 per month
Monthly Gap = $2,076 - $1,562 = $514Annual Gap = 12 x $514 = +$6,168
FHFA Fall 2021 Econ Summit
Affordability Gap (60% AMI)
Michael Eriksen, University of Cincinnati
San Jose, CA
San Francisco, CA
Boston, MA
Seattle, WA
San Diego, CA
New York, NY
Los Angeles, CA
Miami, FLRiverside, CAOrlando, FL
Denver, COTampa, FL
Portland, OR
Sacramento, CA
Dallas, TXPhoenix, AZ
New Orleans, LA
Washington, DC San Antonio, TXAustin, TX
Chicago, ILLas Vegas, NV
Atlanta, GA
Jacksonville, FLHouston, TX
Nashville, TN
Norfolk, VABirmingham, AL
Baltimore, MD
Salt Lake City, UTMemphis, TN Philadelphia, PACharlotte, NCDetroit, MI
Raleigh, NC
Providence, RI
Oklahoma City, OKRichmond, VA Hartford, CT
Columbus, OHMinneapolis, MN
Indianapolis, INKansas City, MO
Cleveland, OH
Louisville, KY
St. Louis, MOMilwaukee, WI Pittsburgh, PA
Buffalo, NY
Cincinnati, OH
-3,000
0
3,000
6,000
9,000
12,000
-4,500 -3,000 -1,500 0 1,500 3,000 4,500
Hou
sing
Affo
rdab
ility
Gap
in 2
021
Housing Affordability Gap in 2001
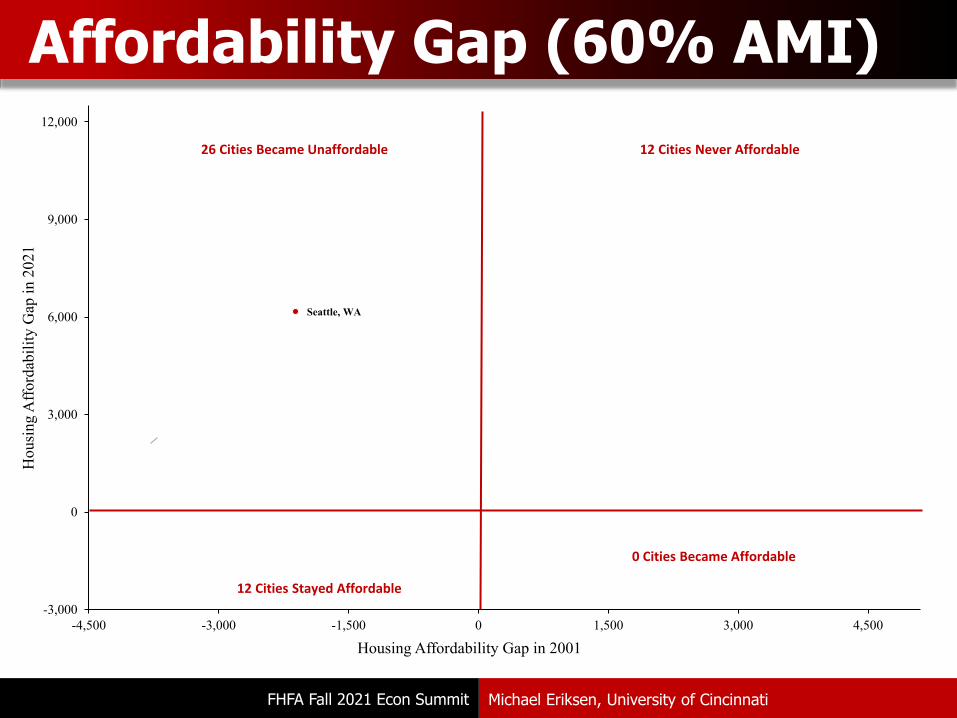
12 Cities Never Affordable
0 Cities Became Affordable
26 Cities Became Unaffordable
12 Cities Stayed Affordable
FHFA Fall 2021 Econ Summit
Affordability Gap (60% AMI)
Michael Eriksen, University of Cincinnati
San Jose, CA
San Francisco, CA
Boston, MA
Seattle, WA
San Diego, CA
New York, NY
Los Angeles, CA
Miami, FLRiverside, CAOrlando, FL
Denver, COTampa, FL
Portland, OR
Sacramento, CA
Dallas, TXPhoenix, AZ
New Orleans, LA
Washington, DC San Antonio, TXAustin, TX
Chicago, ILLas Vegas, NV
Atlanta, GA
Jacksonville, FLHouston, TX
Nashville, TN
Norfolk, VABirmingham, AL
Baltimore, MD
Salt Lake City, UTMemphis, TN Philadelphia, PACharlotte, NCDetroit, MI
Raleigh, NC
Providence, RI
Oklahoma City, OKRichmond, VA Hartford, CT
Columbus, OHMinneapolis, MN
Indianapolis, INKansas City, MO
Cleveland, OH
Louisville, KY
St. Louis, MOMilwaukee, WI Pittsburgh, PA
Buffalo, NY
Cincinnati, OH
-3,000
0
3,000
6,000
9,000
12,000
-4,500 -3,000 -1,500 0 1,500 3,000 4,500
Hou
sing
Affo
rdab
ility
Gap
in 2
021
Housing Affordability Gap in 2001
12 Cities Never Affordable
0 Cities Became Affordable
26 Cities Became Unaffordable
12 Cities Stayed Affordable
FHFA Fall 2021 Econ Summit
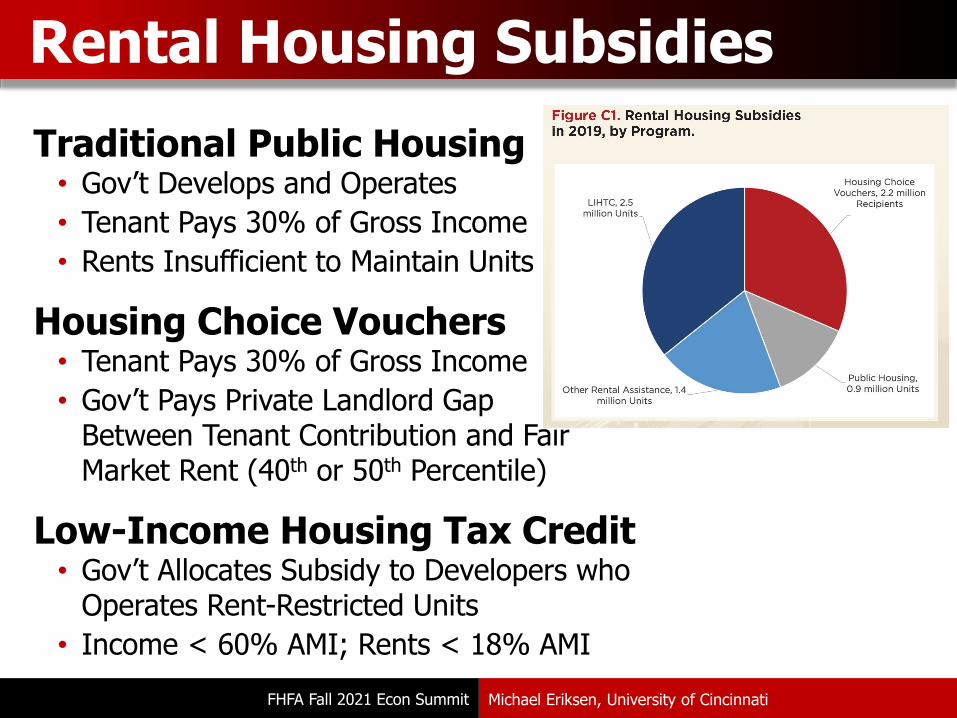
Traditional Public Housing• Gov’t Develops and Operates • Tenant Pays 30% of Gross Income• Rents Insufficient to Maintain Units
Housing Choice Vouchers• Tenant Pays 30% of Gross Income• Gov’t Pays Private Landlord Gap
Between Tenant Contribution and Fair Market Rent (40th or 50th Percentile)
Low-Income Housing Tax Credit• Gov’t Allocates Subsidy to Developers who
Operates Rent-Restricted Units• Income < 60% AMI; Rents < 18% AMI
Rental Housing Subsidies
Michael Eriksen, University of Cincinnati
FHFA Fall 2021 Econ Summit
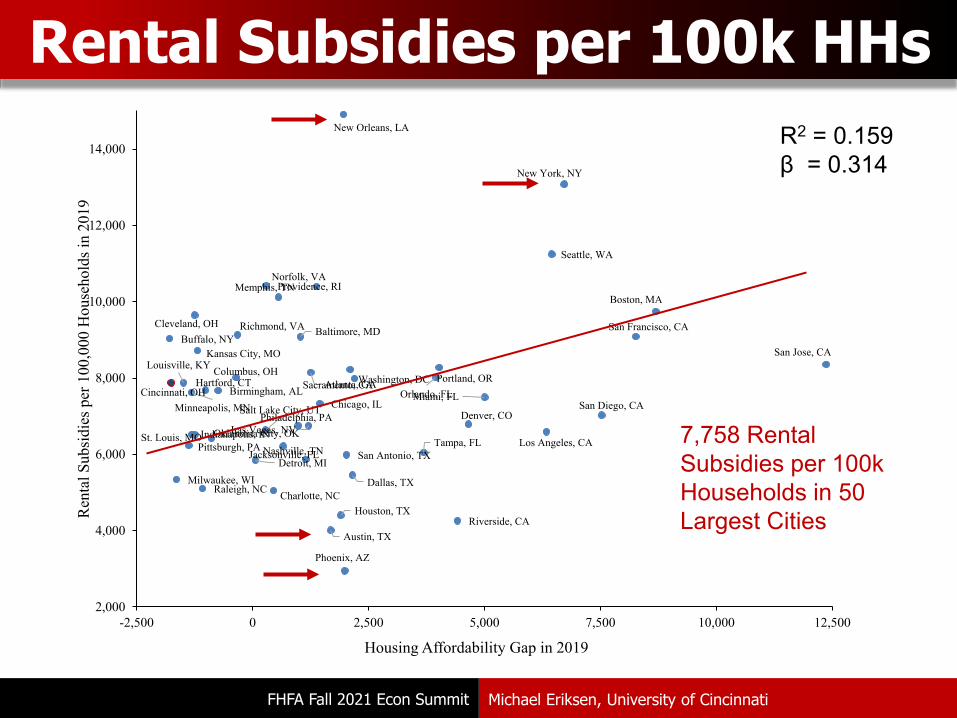
Rental Subsidies per 100k HHs
Michael Eriksen, University of Cincinnati
New Orleans, LA
New York, NY
Seattle, WA
Providence, RINorfolk, VA
Memphis, TNBoston, MA
Cleveland, OH Richmond, VA San Francisco, CABaltimore, MDBuffalo, NY
Kansas City, MO San Jose, CA
Portland, ORWashington, DCAtlanta, GAOrlando, FL
Columbus, OHSacramento, CA
Louisville, KY
Cincinnati, OHHartford, CT
Birmingham, ALMinneapolis, MN
Miami, FLChicago, IL San Diego, CA
Denver, COLas Vegas, NV
Philadelphia, PASalt Lake City, UT
Los Angeles, CASt. Louis, MOIndianapolis, INOklahoma City, OKPittsburgh, PA
Jacksonville, FLTampa, FL
San Antonio, TXNashville, TNDetroit, MI
Dallas, TXMilwaukee, WIRaleigh, NC Charlotte, NC
Houston, TXRiverside, CA
Austin, TX
Phoenix, AZ
2,000
4,000
6,000
8,000
10,000
12,000
14,000
-2,500 0 2,500 5,000 7,500 10,000 12,500
Ren
tal S
ubsi
dies
per
100
,000
Hou
seho
lds i
n 20
19
Housing Affordability Gap in 2019
7,758 Rental Subsidies per 100k Households in 50 Largest Cities
R2 = 0.159β = 0.314
FHFA Fall 2021 Econ Summit
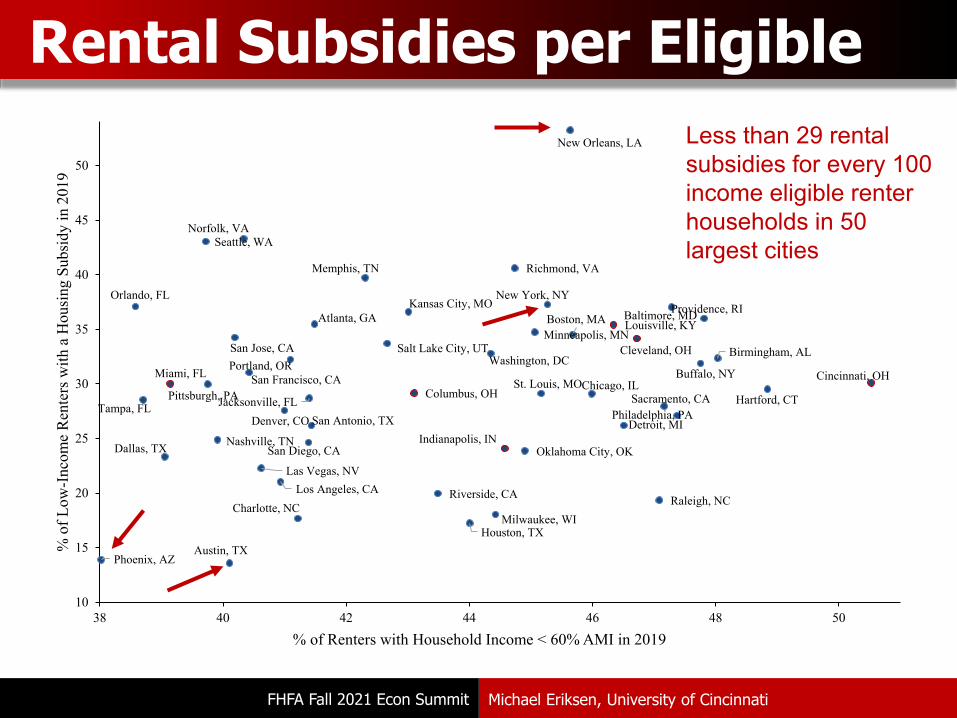
Rental Subsidies per Eligible
Michael Eriksen, University of Cincinnati
New Orleans, LA
Norfolk, VASeattle, WA
Richmond, VAMemphis, TN
New York, NYOrlando, FL
Baltimore, MDKansas City, MO Providence, RI
Atlanta, GA Louisville, KYMinneapolis, MNBoston, MA
San Jose, CA Cleveland, OHSalt Lake City, UTWashington, DC
Birmingham, ALPortland, OR
Buffalo, NYSan Francisco, CA Cincinnati, OHMiami, FL
Pittsburgh, PA Hartford, CTColumbus, OHSt. Louis, MOChicago, IL
Jacksonville, FLTampa, FLSacramento, CA
Denver, CO Philadelphia, PADetroit, MISan Antonio, TX
Nashville, TNSan Diego, CA
Indianapolis, INOklahoma City, OKDallas, TX
Las Vegas, NVLos Angeles, CA Riverside, CA Raleigh, NC
Milwaukee, WICharlotte, NC
Houston, TX
Phoenix, AZAustin, TX
10
15
20
25
30
35
40
45
50
38 40 42 44 46 48 50
% o
f Low
-Inc
ome
Ren
ters
with
a H
ousi
ng S
ubsi
dy in
201
9
% of Renters with Household Income < 60% AMI in 2019
Less than 29 rental subsidies for every 100 income eligible renter households in 50 largest cities
FHFA Fall 2021 Econ Summit
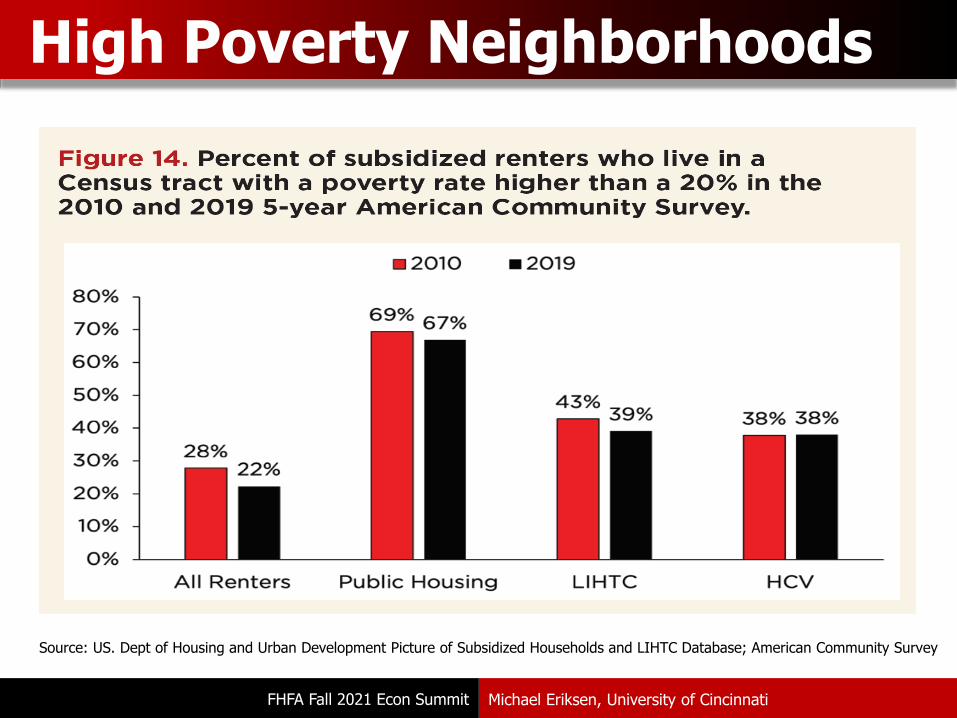
High Poverty Neighborhoods
Michael Eriksen, University of Cincinnati
Source: US. Dept of Housing and Urban Development Picture of Subsidized Households and LIHTC Database; American Community Survey
FHFA Fall 2021 Econ Summit
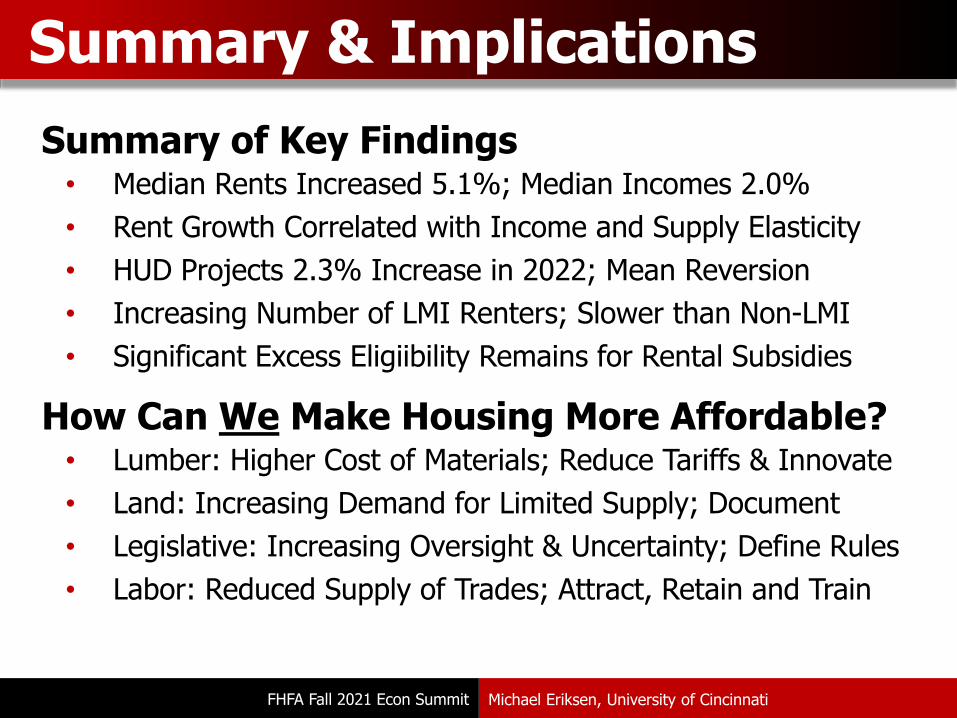
Summary of Key Findings• Median Rents Increased 5.1%; Median Incomes 2.0%• Rent Growth Correlated with Income and Supply Elasticity• HUD Projects 2.3% Increase in 2022; Mean Reversion• Increasing Number of LMI Renters; Slower than Non-LMI• Significant Excess Eligiibility Remains for Rental Subsidies
How Can We Make Housing More Affordable?• Lumber: Higher Cost of Materials; Reduce Tariffs & Innovate• Land: Increasing Demand for Limited Supply; Document• Legislative: Increasing Oversight & Uncertainty; Define Rules• Labor: Reduced Supply of Trades; Attract, Retain and Train
Summary & Implications
Michael Eriksen, University of Cincinnati
FHFA Fall 2021 Econ Summit
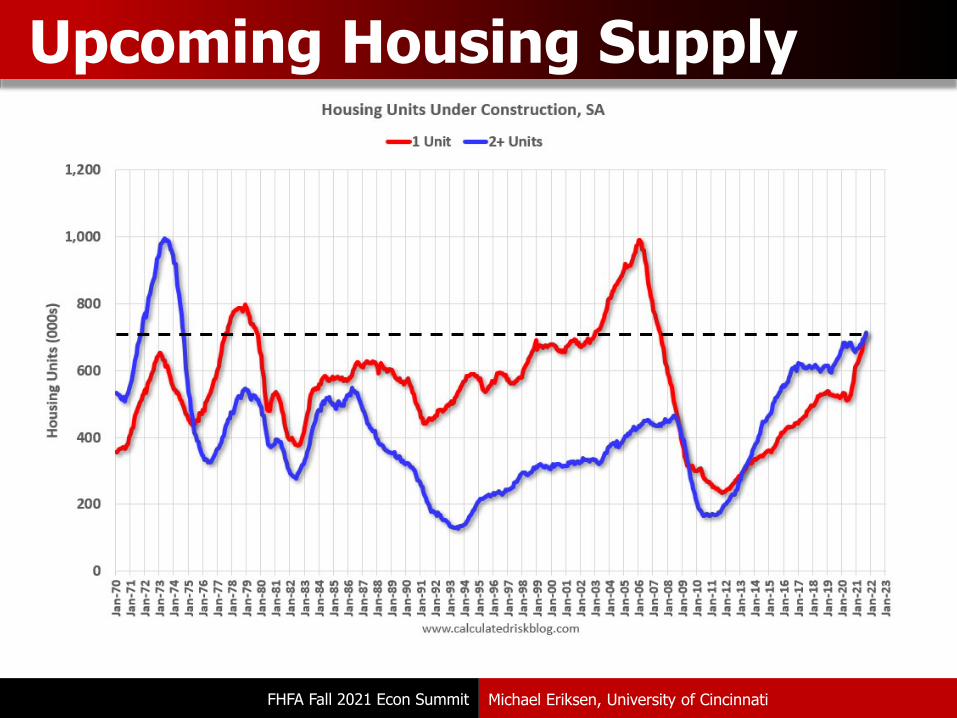
Upcoming Housing Supply
Michael Eriksen, University of Cincinnati