Metered Energy Efficiency Transaction Structure in …...Metered Energy Efficiency Transaction...
16
Metered Energy Efficiency Transaction Structure in Ultra-Efficient New Construction: Pay-For-Performance at the Bullitt Center in Seattle, WA Terry Egnor, EnergyRM; Denis Hayes, The Bullitt Foundation; John Jennings, Northwest Energy Efficiency Alliance; David Rodenhizer, Seattle City Light; Howard Reichmuth, EnergyRM; Kevin Van Den Wymelenberg, University of Oregon; Christopher Meek, University of Washington ABSTRACT The Metered Energy Efficiency Transaction Structure (MEETS) is a radical new approach designed to achieve deep energy efficiency improvements in commercial buildings. It protects utility revenues, eliminates utility risk, and provides strong financial returns for investors in deep (35% savings or greater) energy efficiency. The 35% threshold represents a level of savings below which there are currently numerous alternatives for financing. With MEETS, the utility sells energy services—heating, cooling, illumination, fresh air—not kilowatt hours (kWhs), to the building’s tenants. The utility initially receives the same gross revenue that it would have received had the building been built and operated to code (i.e., the tenants pay for the combined used energy plus the saved energy). Then the utility pays an amount based on metered energy saved back to the investors, valued at a negotiated rate at the time and adjusted over time for inflation, minus a portion to cover administrative expenses. In the SCL-Bullitt Center MEETS there is an additional efficiency incentive offered by the utility to the investors. The price the utility pays under the MEETS PPA ensures that over the life of the PPA the utility pays out less than the retail revenue received. MEETS is designed to work with, or without, incentives. Because the saved power follows the utility’s load curve, and because the utility pays only for actual savings after they have been achieved and measured against a baseline, the utility willingly pays a premium. The purchased savings are analogous to purchasing electricity from a load-following, non-polluting, risk-free independent power producer. Seattle City Light is experimenting with MEETS in a pilot program with the recently constructed Bullitt Center. Savings to date have been extraordinary. This paper explains how the program operates, how the baseline for a new building was modeled, and how the DeltaMeter® (which calculates savings) functions. It is expected that the primary use of MEETS will be in the existing building deep- energy retrofit market, however, as this paper describes, it can be applied to ultra-efficient new construction. Introduction Seattle City Light (SCL) has entered into a Metered Energy Efficiency Transaction Structure (MEETS) (MEETS Accelerator Coalition, 2016) pilot project with the Bullitt Center (Bullitt), a new construction Class A, six-story, 52,000 square-foot, net-positive-energy office building in Seattle. We describe the terms of the MEETS agreement, the development of the dynamic baseline to which Bullitt Center’s performance is compared, the operation of the cloud- based EnergyRM DeltaMeter® that is used to calculate savings, and the energy performance data for Bullitt Center’s first two years of operation. For the utility, the MEETS pilot presents an opportunity to investigate a different model that provides long-term efficiency-based cash flow, allocated appropriately amongst the involved parties. It is envisioned that this model could be structured to pay back the investor,
Transcript of Metered Energy Efficiency Transaction Structure in …...Metered Energy Efficiency Transaction...

Metered Energy Efficiency Transaction Structure in Ultra-Efficient New Construction: Pay-For-Performance at the Bullitt Center in Seattle, WA
Terry Egnor, EnergyRM; Denis Hayes, The Bullitt Foundation; John Jennings, Northwest
Energy Efficiency Alliance; David Rodenhizer, Seattle City Light; Howard Reichmuth, EnergyRM; Kevin Van Den Wymelenberg, University of Oregon; Christopher Meek,
University of Washington ABSTRACT The Metered Energy Efficiency Transaction Structure (MEETS) is a radical new approach designed to achieve deep energy efficiency improvements in commercial buildings. It protects utility revenues, eliminates utility risk, and provides strong financial returns for investors in deep (35% savings or greater) energy efficiency. The 35% threshold represents a level of savings below which there are currently numerous alternatives for financing. With MEETS, the utility sells energy services—heating, cooling, illumination, fresh air—not kilowatt hours (kWhs), to the building’s tenants. The utility initially receives the same gross revenue that it would have received had the building been built and operated to code (i.e., the tenants pay for the combined used energy plus the saved energy). Then the utility pays an amount based on metered energy saved back to the investors, valued at a negotiated rate at the time and adjusted over time for inflation, minus a portion to cover administrative expenses. In the SCL-Bullitt Center MEETS there is an additional efficiency incentive offered by the utility to the investors. The price the utility pays under the MEETS PPA ensures that over the life of the PPA the utility pays out less than the retail revenue received. MEETS is designed to work with, or without, incentives. Because the saved power follows the utility’s load curve, and because the utility pays only for actual savings after they have been achieved and measured against a baseline, the utility willingly pays a premium. The purchased savings are analogous to purchasing electricity from a load-following, non-polluting, risk-free independent power producer. Seattle City Light is experimenting with MEETS in a pilot program with the recently constructed Bullitt Center. Savings to date have been extraordinary. This paper explains how the program operates, how the baseline for a new building was modeled, and how the DeltaMeter® (which calculates savings) functions. It is expected that the primary use of MEETS will be in the existing building deep-energy retrofit market, however, as this paper describes, it can be applied to ultra-efficient new construction. Introduction
Seattle City Light (SCL) has entered into a Metered Energy Efficiency Transaction Structure (MEETS) (MEETS Accelerator Coalition, 2016)pilot project with the Bullitt Center (Bullitt), a new construction Class A, six-story, 52,000 square-foot, net-positive-energy office building in Seattle. We describe the terms of the MEETS agreement, the development of the dynamic baseline to which Bullitt Center’s performance is compared, the operation of the cloud-based EnergyRM DeltaMeter® that is used to calculate savings, and the energy performance data for Bullitt Center’s first two years of operation.
For the utility, the MEETS pilot presents an opportunity to investigate a different model that provides long-term efficiency-based cash flow, allocated appropriately amongst the involved parties. It is envisioned that this model could be structured to pay back the investor,

provide fair administrative compensation to the utility, and even provide modest incentive to the user.
By paying only for “metered saved energy” after it has been realized, utilities eliminate their principal risk of paying for unrealized savings. They should be willing to pay substantially more for actual performance than for deemed savings. However, MEETS can cost utilities less overall than with traditional energy efficiency where they pay an incentive and lose the revenue due to efficiency. This increased compensation, coupled with a 20-year contract for measured savings, enables owners or investors to make far deeper investments and to maintain them over time, thus ensuring persistence of the savings. Any change in ownership is subject to the contract (just as it is subject to existing leases.) Under SCL’s traditional incentive program, Bullitt would have received $84,000 up-front for several efficiency measures that may not have performed as expected. Under MEETS—if the Bullitt Center continues to perform as efficiently for the next 20 years as it did in the first two years—it will receive $1.2 million (in nominal dollars; $740,000 in discounted dollars). Meanwhile, SCL will receive the same initial flow of revenue it would have received if Bullitt Center had merely been built to code. SCL would then use most of that revenue to pay for the load-following (i.e. metered savings follows the utility’s demand curve almost exactly) “saved energy.”
Background
Conventional approaches to energy efficiency investment rely on a building owner to make the investment, while savings from lower energy bills flow mostly to the tenants. However, few owners will make investments in deep energy conservation (greater than 35% savings) if the financial returns all flow to someone else. And tenants are reluctant to make investments in buildings that they do not own. On top of that, gaining a level of accuracy and certainty about the savings usually requires costly detailed energy modeling during design followed after completion by costly Measurement and Verification (M&V). Typical utility conservation programs pay building owners up-front to invest in more efficient lights, fans, windows, or air handlers, for example, without regard to actual performance.
For these reasons, among others, energy efficiency programs administered by utilities in many parts of the country have, in general, fallen short of their potential. In part, this is also because utilities, based on their real-world experience, deeply discount the long-term effectiveness of the before-the-fact investments in “deemed savings.” This results in substantial under-investment in efficiency—even in cases where the marginal cost of the next saved kWh is a tiny fraction of the marginal cost of the next generated kWh. Moreover, except in areas with special legislation or regulation, utilities understandably have little enthusiasm for programs that are explicitly designed to reduce their primary revenue source, i.e. energy sales.
The MEETS model was created to overcome these problems. It is a pay-for-performance program in which the utility pays only for actual realized savings from a modified, super-efficient building. Moreover, the building’s tenants, who have made no investment in the enhanced efficiency, pay the same utility bill they would have paid had no efficiency investments been made. In the Bullitt Center, which was designed to deliver significant improvements in occupant comfort relative to a conventional building, tenants receive enhanced personal comfort, lighting and fresh air at no additional cost. In this sense, MEETS represents a return to Thomas Edison’s original proposal to sell lighting rather than electricity.
MEETS allows the utility to meter and bill the customer for both the actual energy used and energy saved. Thereby utilities are able to maintain their total retail revenues, and, on the
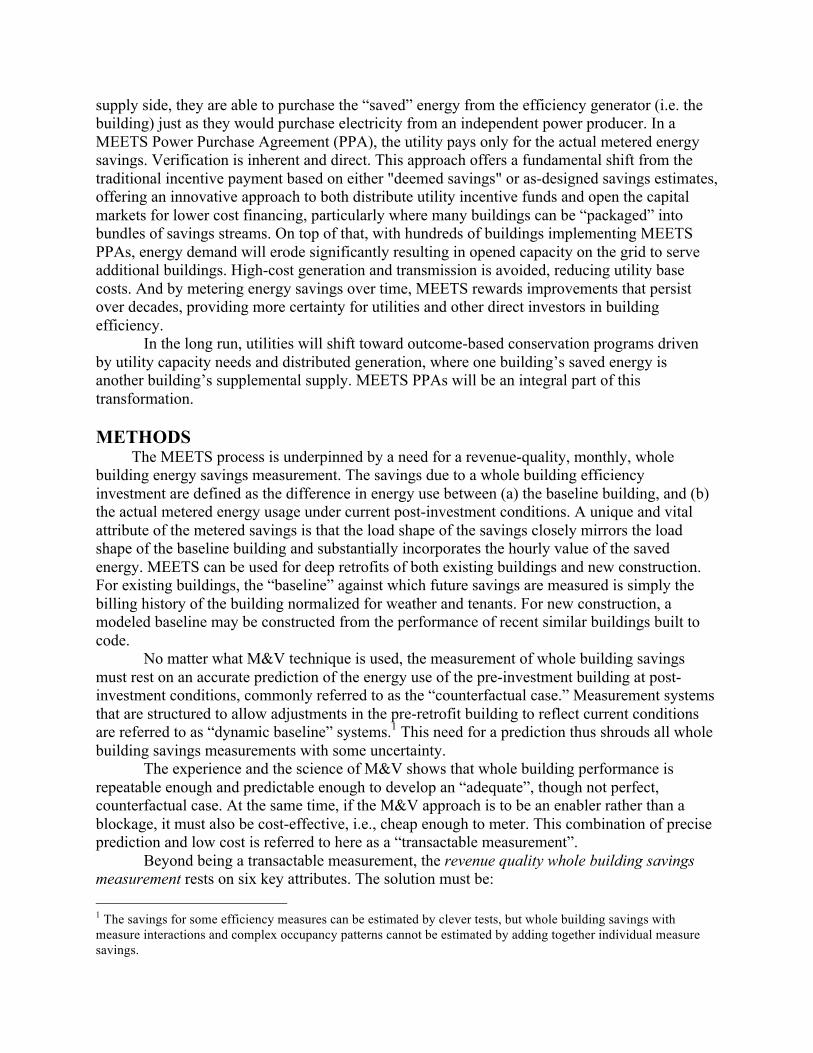
supply side, they are able to purchase the “saved” energy from the efficiency generator (i.e. the building) just as they would purchase electricity from an independent power producer. In a MEETS Power Purchase Agreement (PPA), the utility pays only for the actual metered energy savings. Verification is inherent and direct. This approach offers a fundamental shift from the traditional incentive payment based on either "deemed savings" or as-designed savings estimates, offering an innovative approach to both distribute utility incentive funds and open the capital markets for lower cost financing, particularly where many buildings can be “packaged” into bundles of savings streams. On top of that, with hundreds of buildings implementing MEETS PPAs, energy demand will erode significantly resulting in opened capacity on the grid to serve additional buildings. High-cost generation and transmission is avoided, reducing utility base costs. And by metering energy savings over time, MEETS rewards improvements that persist over decades, providing more certainty for utilities and other direct investors in building efficiency. In the long run, utilities will shift toward outcome-based conservation programs driven by utility capacity needs and distributed generation, where one building’s saved energy is another building’s supplemental supply. MEETS PPAs will be an integral part of this transformation. METHODS The MEETS process is underpinned by a need for a revenue-quality, monthly, whole building energy savings measurement. The savings due to a whole building efficiency investment are defined as the difference in energy use between (a) the baseline building, and (b) the actual metered energy usage under current post-investment conditions. A unique and vital attribute of the metered savings is that the load shape of the savings closely mirrors the load shape of the baseline building and substantially incorporates the hourly value of the saved energy. MEETS can be used for deep retrofits of both existing buildings and new construction. For existing buildings, the “baseline” against which future savings are measured is simply the billing history of the building normalized for weather and tenants. For new construction, a modeled baseline may be constructed from the performance of recent similar buildings built to code.
No matter what M&V technique is used, the measurement of whole building savings must rest on an accurate prediction of the energy use of the pre-investment building at post-investment conditions, commonly referred to as the “counterfactual case.” Measurement systems that are structured to allow adjustments in the pre-retrofit building to reflect current conditions are referred to as “dynamic baseline” systems.1 This need for a prediction thus shrouds all whole building savings measurements with some uncertainty.
The experience and the science of M&V shows that whole building performance is repeatable enough and predictable enough to develop an “adequate”, though not perfect, counterfactual case. At the same time, if the M&V approach is to be an enabler rather than a blockage, it must also be cost-effective, i.e., cheap enough to meter. This combination of precise prediction and low cost is referred to here as a “transactable measurement”.
Beyond being a transactable measurement, the revenue quality whole building savings measurement rests on six key attributes. The solution must be: 1 The savings for some efficiency measures can be estimated by clever tests, but whole building savings with measure interactions and complex occupancy patterns cannot be estimated by adding together individual measure savings.

1. Accurate, derived from calibrated meters. Estimates derived from utility meter data are sufficient.
2. Comprehensive, able to work with a wide range of building types and uses, as well as all fuel types commonly used in buildings, since whole building energy savings often include fuel interactions.
3. Transparent to be trustworthy. In addition to providing access to the key equations, a graphic signature format showing both the raw data and the counterfactual model, self-validates the process.
4. Able to render monthly energy savings estimates that incorporate the time-dependent value of the energy saved. The cadence of business is monthly, and any savings estimate intended to blend into the energy business cash flows must be monthly. Monthly output is also a key since annual-only estimates are opaque to checking for seasonality.
5. Analytically flexible enough to be able to accommodate both routine (e.g. weather) and non-routine (e.g. loss of tenant) changes to the building.
6. Affordable. Typical savings estimates can cost thousands of dollars in a research context. A transactable savings estimate must impose minimal overhead on the process.
These attributes are available in whole or part in many existing analytical tools. In the MEETS application used on the Bullitt Center these attributes are combined in the DeltaMeter®. In this process the savings are tallied monthly and defined as the difference between the counterfactual base case model at the observed post-retrofit temperature, occupancy levels and the actual utility meter read.2 In the MEETS process, the savings are considered to be negawatt-hours (nWh) relative to the base case. Conceptually, these nWhs have been “generated” by the efficiency measures in the building, and they can be valued by the building as if they were the retail energy serving the building.
From a utility perspective the nWhs are utility power that would have had to be purchased or generated to serve the building in the absence of a retrofit; or if a new building, built to code or beyond.3 Thus the nWhs are inherently related to the utility load planning process. In the case of new construction, the required load to serve is empirically based on a single, similarly sized prototype building model and derived from a sufficient sample of recent new construction projects.
In the case of the Bullitt Center, the reference load was derived from metered data from as many recent code-compliant buildings of similar occupancy as could be located at the time. Normally, the reference buildings would be derived from prototype energy simulation models.
In the MEETS process the nWh revenues are apportioned by contract partially to the building owner and mostly toward the return on investment. It is important to recognize that contracts between the utility, the building operator and the investor (if it is not the utility) play a key role in managing the process. It is envisioned that this model could provide a good rate of return to the investor, provide a new income stream for the building owner, hold the utility’s initial revenue constant, while presenting a lower price than the marginal cost of new generation for the saved electricity from building efficiency, and providing superior comfort and lighting to tenants without increased cost.
2 These are gross savings at the observed monthly temperature, (not normalized temperature). The use of the actual meter read is in the interest of transparency as well as minimizing errors. 3nWhs (negawatt-hours) are not exactly the same as purchased or generated kWhs because the utility does not have direct control of the nWh generator. But it should also be noted that the nWhs are usually approximately coincident with the utility load, which reduces the need for controlling this power. It also avoids associated line losses.

The unusual upshot here is that in the future, the utility kWh load loss caused by large scale efficiency improvements can be mostly counteracted by nWh increases from nWh “generators” in the building stock. In fact, the utility will be managing a larger package in terms of investments and actual load control.
The DeltaMeter®
The DeltaMeter® used in the Bullitt MEETS arrangement consists of three components: (1) a dynamic baseline model of the “unimproved” building; (2) a “tracker” model of the “improved” building, and; (3) a data set of current conditions that includes the building’s utility meter reading(s) and read dates for all fuels, the occupancy, operating levels for the building and the daily average temperature for that metered period. On a monthly basis, these three elements combine to deliver the savings performance of the building. It should be noted that the calculation of building energy consumption and savings is done independently of the on-site photovoltaics (PV) array output.
Each month the following process is applied: (1) Obtain the current data set; (2) Using the dynamic baseline and tracker models, determine the expected usage for both the unimproved and improved cases under current conditions (the “adjusted models”); (3) Compare the actual metered usage with the adjusted tracker model to determine whether the building is tracking expected performance levels (variance). This comparison assures persistence of the savings; (3a) If the two differ by less than +/-5% (i.e., are in relative agreement), then proceed to step 4; (3b) If they differ by more than +/-5% (approximately 500 kWh for the Bullitt case), then under the metering contract, any variance of greater than +/- 5% is analyzed and resolved in coordination with building operators. A determination is made as to whether any correction is needed in the dynamic baseline model and, if a correction is required, its magnitude, based on the terms of the metering agreement; (4) Subtract the actual meter value from the adjusted/corrected dynamic baseline to derive the certified monthly savings in kWh; (5) Publish and distribute the monthly Certified DeltaMeter® Statement (“Statement”); (6) The Statement serves as the basis for billings and payment amongst the parties.

Fig. 1. Bullitt Center MEETS data flow. Third-party reviewers include the University of Washington Integrated
Design Lab (UW IDL), The University of Oregon Energy Studies in Buildings Lab (UO ESBL), the Northwest Energy Efficiency Alliance (NEEA), Cadmus Group, and SBW Consulting (SBW). Image: EnergyRM.
Contracting
The Metered Energy Efficiency Purchase Agreement provides a mechanism by which the financial benefit of avoided energy expenditures resulting from conservation investments are redirected from the tenant to the investor. It defines the financial transactions and obligations between the Bullitt Foundation as owner, the master tenant, and Seattle City Light necessary for MEETS. The term is twenty years, with a three-year pilot phase. Although the power purchasing department in the utility has long-term budget authority for power contracts, for the Customer Energy Solutions department handling this contract,this term extends well beyond its budgeting authority, requiring an ordinance to passed by the Seattle City Council prior to implementation. All Parties recognize that this Agreement may need to be modified after and as a result of the information learned during the pilot phase.
Monthly estimates of consumption for a similar code-minimum facility, defined in the agreement as the “Standard Site Energy Consumption” (dynamic baseline) and governed under a separate agreement, are measured against the actual consumption at the site. The difference is termed the “Metered Energy Efficiency” and represents the energy savings over what could have been built.

Fig. 2. Rate relationship. Image: Seattle City Light.
Per the agreement, the master tenant is responsible for paying the retail electric cost of the dynamic baseline consumption. Effectively, the master tenant has agreed to pay for the energy use of a building without any efficiency improvements beyond code. If this had been a retrofit energy project, this would represent the energy bills that the tenant would have been accustomed to paying historically.
Seattle City Light then provides two payments to the Bullitt Foundation based on the Metered Energy Efficiency. The first is largely designed to be a pass-through to the Bullitt Foundation of the avoided cost (i.e. efficiency savings) that the tenant would have seen from the energy improvements. This payment is at the contract rate, designed to differ just enough from the retail electric rate to allow the utility to retain some compensation to cover the costs of administering MEETS. The second is a flat conservation incentive of 2.5¢ per kilowatt-hour. Pay-For-Performance Pay-for-Performance treats energy efficiency like a generation resource by providing performance-based payments for energy efficiency achieved over the course of the contract. A utility MEETS arrangement takes Pay-for-Performance one step further by re-directing the benefits of the savings from the tenant to the investor while covering the costs of the utility services. The utility accomplishes this by charging the tenant as if no improvements had been made (tenant pays actual plus savings), retaining a contractually agreed upon portion of the savings, and paying the remainder to the investor. Since there is so much riding on the calculated savings, a mathematically sound and robust model of facility performance (what would have been used) is critical.
MeteredEnergyEfficiency
a.k.a. "savings"
ActualConsumption
MasterTenantpaysSeattleCity Lightprevailing retail rateperkWh,
plusdemandandcustsvc charges
SeattleCityLightpaysBullittanagreedenergyrateperkWh,plus$0.025/kWhconservation incentive
DynamicBaselineEnergyConsumption

Fig. 3. MEETS energy and cash flow.
The Validation Process at the Bullitt Center The purpose of the first phase of the pilot deployment of EnergyRM’s DeltaMeter® at
the Bullitt Center is to provide rigorous testing of the DeltaMeter®’s performance in accurately tracking energy savings and test its application for Power Purchase Agreements (PPA) for energy efficiency. Since this is a new approach with broad implications, Seattle City Light (SCL) and the Northwest Energy Efficiency Alliance (NEEA) wanted an independent validation of the method and outputs of the DeltaMeter® and its application for the PPA between Bullitt Center and SCL. Summary results can be found in Table 1 below.
The best proxy for a starting baseline of a new building is the average energy usage of typical comparable existing buildings which meet all applicable codes and standards that applied to the Bullitt Center new construction project. Details of this “composite” baseline development are presented in the following section. With agreement on a common starting “composite” baseline, the basic validation procedure was to have a parallel but completely independent analysis done each month by the University of Oregon Energy Studies in Buildings Lab (ESBL) on contract to NEEA. ESBL generated two baseline energy models. ESBL constructed industry standard EnergyPlus simulations per American Society of Heating, Refrigerating, and Air-Conditioning Engineers (ASHRAE) 90.1 Appendix G, with the assumption that these models, being more detailed, would provide a state-of-the-art analysis that could be used as a standard for savings calculations comparison. One model was built to the 2009 Seattle Energy Code and one was calibrated to the composite baseline energy signature.

Table 1. DeltaMeter® monthly readings (April 2015-March 2016).
EnergyRM and the ESBL each independently ran a monthly analysis to determine the dynamic baseline and monthly savings. EnergyRM and ESBL received identical data monthly including monthly energy use from the utility meter, monthly sub-metering data, occupancy data and building operations events records, and appropriate weather data for use in analyses.
Once its analysis completed, EnergyRM first provided its results to SCL, Bullitt, NEEA, and ESBL. After receiving results from EnergyRM, ESBL then released its results to NEEA, EnergyRM, SCL and Bullitt for comparison. There was a subsequent conference between all parties no less than 30 days after the release of both analyses to discuss significant differences greater than +- 5%, and their causes. The primary focus was on whether the DeltaMeter® was accurate in its findings and, if not, what adjustments needed to be made to achieve better results.
Baselining With Models
Every DeltaMeter® building will have a unique counter-factual model derived from its own pre-retrofit performance or an appropriate planning prototype. The scalability of this approach depends on the DeltaMeter®’s auto-calibration and model derivation capability.
A sufficient sample of buildings similar to the Bullitt Center in size (20,000-120,000 SF), use type (office) and vintage (2009 Seattle Energy Code) were sought for use in establishing a comparable “typical” building energy use baseline, but none were found. Therefore, the “vintage” category was expanded to include buildings built to comply with previous Seattle Energy Code cycles and a process applied to “scale down” the energy code regulated components of these buildings to make them equivalent to the 2009 Code requirements. After a substantial search, SCL identified five buildings for use in this process.
EnergyPlus reference models for all five buildings were calibrated against energy consumption data from the real buildings. The calibration of each model began with the code year for which the real building was obligated to comply, as far back as the 2003 Seattle Energy Code. The calibration process included modification of the “unregulated” loads within the EnergyPlus model to ensure that the energy performance of the EnergyPlus model closely matched an "inverse modeling energy signature” (Kissock, et. al. 2002 and Haberl, et al. 2003) provided by SCL and EnergyRM for each of the five real buildings. On the whole, we believe the approach employed erred toward a somewhat conservative (lower) baseline for the “real” buildings because no “above code measures” known to exist in the five real buildings were “added back” to the relatively lower resultant baseline energy consumption values. The five

energy models were combined into a single gross square foot weighted average “composite” energy signature. Then, an EnergyPlus model with the geometry identical to the Bullitt Center was calibrated to this “composite” signature. This is referred to herein as the “Composite Baseline.” Rolling Occupancy/Tenant Operations Documentation Significant operational adjustments at the Bullitt Center are logged and tracked in a Building Operation Event Log. This includes both patterns and density of building occupancy and modifications to operations such as changes in thermostat set points and controls sequences. Since initial occupancy in April 2013, there have been significant changes in tenancy and a steady increase in occupant density. To document these changes, the property management company, UNICO, administers a monthly web-based survey to each tenant within the building that is used, when necessary, to make routine adjustments to the baseline, as-built, and “tracker” models. This survey aims to capture trends in building use, and to estimate the use of office equipment. A representative from each tenant reports the total number of full-time equivalent (FTE) employees that are regularly present within the space and the approximate number of laptop and desktop computers in use on a typical day within the suite. Further, the survey provides an input field for tenant events that could impact energy consumption such as extended office hours, special events, or major new office equipment. Bullitt Center tenants operate under a fixed tenant energy allowance established by the terms of their lease. Therefore, the occupancy data reported as part of this survey has no impact on tenant energy costs assessed by the landlord. Any changes that occur in leasing, tenant improvements, and reconfigurations of floors and suites are documented for each floor and suite with dates of initiation and occupancy. The Building Operation Event Log also captures modifications initiated by the building engineer to improve comfort or building performance (e.g. implementation of night ventilation). These events are listed with a description of the modification, the date implemented, the suites/tenants impacted, and any follow-up adjustments made. This log provides a basis for routine and non-routine adjustments in the dynamic baseline model, the “tracker” model, and as a basis for evaluating actual performance of the building. RESULTS
The DeltaMeter®’s savings for the first nine months of the pilot were calculated at 647,626 kWh while the EnergyPlus calculated savings totaled 647,297 kWh over the same period. The nine month difference is less than 1%, while higher differences were observed for individual monthly data. These results lend confidence to the simplified modeling afforded by the DeltaMeter®. However, the most sensitive element about this comparison and the savings calculation is the process of establishing the “worse than code” Composite Baseline (based upon the five real buildings discussed above). The EnergyPlus method meets standard best practices for calibration following International Performance Measurement and Verification Protocol (IPMVP) guidelines (DOE EERE, 2002), however, the signature-based calibration approach affords the opportunity for increased accuracy during calibration by minimizing offsetting errors (Djunaedy and Van Den Wymelenberg, 2014) not identified by IPMVP methods. Establishing these signature-based calibration guidelines requires further research and is out of the scope of the present pilot study.
The MEETS contract began on May 1st 2015. As of this writing, the most recent 12-months of energy data from the Bullitt Center are presented in Figure 1 and Tables 2 and 3. This

includes two billing periods prior to contract execution when all metering, models and calculations were active.
Two items from Figure 4 are readily apparent: (1) The Bullitt Center uses significantly less energy than a similar building built to code, as is evidenced by the separation of the solid (code) and dashed (Bullitt Center) energy trend lines, (2) The Bullitt Center is significantly better-than-net-zero, as evidenced by the balance of energy imported from the utility (red) versus the energy exported to the utility (gold).
Fig. 4. Bullitt Center Energy Accounting. Image: Seattle City Light
Based on this first performance year, an economic assessment of the value streams over the contract life can be performed. Assuming a 4%escalation of utility rates into the future and a 3% discount rate (standard for utility-side evaluations), the net-present values by party and category are presented in Figure 5.
Table 2. Seattle City Light metering to-date. Credit: Seattle City Light
SEATTLE CITY LIGHT METERING ENERGY RM
Meter Read Date
Days of Service
NET Meter kWh
SOLAR Production
kWh
Bullitt Center
UsekWh
SOLAR Used
On Site kWh
Utility Power to
Bullitt kWh
SOLAR Exported
to SCL kWh
DeltaMeter Baseline
kWh
Metered Energy
Efficiency kWh
3/4/2015 30 3,000 11,920 14,920 11,920 3,000 0 64,300 49,3804/2/2015 29 -3,900 16,960 13,060 13,060 0 -3,900 59,200 46,1405/1/2015 29 -13,800 26,720 12,920 12,920 0 -13,800 59,133 46,2136/1/2015 31 -18,900 31,040 12,140 12,140 0 -18,900 65,475 53,3356/30/2015 29 -31,200 41,600 10,400 10,400 0 -31,200 71,220 60,8207/30/2015 30 -27,300 38,560 11,260 11,260 0 -27,300 78,571 67,3118/27/2015 28 -21,900 32,480 10,580 10,580 0 -21,900 70,868 60,2889/28/2015 32 -12,900 24,800 11,900 11,900 0 -12,900 69,779 57,87910/27/2015 29 -2,100 13,680 11,580 11,580 0 -2,100 58,474 46,89411/30/2015 34 11,100 8,480 19,580 8,480 11,100 0 75,375 55,79512/30/2015 30 15,900 3,920 19,820 3,920 15,900 0 69,449 49,6292/1/2016 33 14,400 6,720 21,120 6,720 14,400 0 78,954 57,834ANNUAL 364 -87,600 256,880 169,280 124,880 44,400 -132,000 820,798 651,518

Table 3. MEETS cash-flow table. Credit: Seattle City Light
Fig. 5. Net Present Value of Projected 20-year value streams. Image: Seattle City Light.
Over the contract life, the MEETS charges redistribute the benefits of the energy improvements from the tenant to both the investor and the utility. The combined benefit to the investor of the MEETS contract payments and metered energy efficiency based conservation incentive is roughly equivalent to the MEETS-determined tenant charges. From the investor perspective, the energy benefits of the investment have been realized. The tenants, despite paying a charge that includes the value of energy that they did not use, are paying no more than they would have in a built to code building. The picture for the utility is more complicated. In addition to a payment stream independent of actual energy consumption, there are administrative costs to assess and track the MEETS charges. It may be possible that with adjustments, the model could be a step toward mitigating the effects of ultra-low energy or net-zero buildings on utility revenue forecasts, particularly where balanced with forecasted expenses for future power purchases to meet future load growth in the utility system.
The DeltaMeter® monthly readings over the 12 months of operation thus far show Bullitt functioning more or less as designed, producing over 645,000 nWh (exclusive of PV
TENANT MEETS BULLITT MEETS
Retail Electric
Rate $/kWh
Tenant Actual Meter
Charges
Tenant MEE
Charges
TOTAL Tenant
Charges
Bullitt MEETS
Contract $/kWh
Bullitt Contract MEETS
Payment
MEE Cons Incentive
$/kWh
Bullitt MEE
Incentive
TOTAL Bullitt
Payment$0.0634 $190 $3,131 $3,321 $0.0591 $2,918 $0.025 $1,235 $4,153$0.0634 $0 $2,925 $2,925 $0.0591 $2,727 $0.025 $1,154 $3,880$0.0634 $0 $2,930 $2,930 $0.0591 $2,731 $0.025 $1,155 $3,887$0.0634 $0 $3,381 $3,381 $0.0591 $3,152 $0.025 $1,333 $4,485$0.0634 $0 $3,856 $3,856 $0.0591 $3,594 $0.025 $1,521 $5,115$0.0634 $0 $4,268 $4,268 $0.0591 $3,978 $0.025 $1,683 $5,661$0.0634 $0 $3,822 $3,822 $0.0591 $3,563 $0.025 $1,507 $5,070$0.0634 $0 $3,670 $3,670 $0.0591 $3,421 $0.025 $1,447 $4,868$0.0641 $0 $3,008 $3,008 $0.0591 $2,771 $0.025 $1,172 $3,944$0.0642 $713 $3,582 $4,295 $0.0591 $3,297 $0.025 $1,395 $4,692$0.0642 $1,021 $3,186 $4,207 $0.0591 $2,933 $0.025 $1,241 $4,174$0.0674 $971 $3,898 $4,869 $0.0591 $3,418 $0.025 $1,446 $4,864$0.0640 $2,894 $41,657 $44,551 $0.0591 $38,505 $0.025 $16,288 $54,793

production) by operating at approximately 21% of the energy level of the comparative base case, an average reduction of nearly 80% before on-site renewables (See Table 1).
The building’s performance also demonstrated the value of the variance (the difference between the tracker prediction model and the actual metered usage) which shows any significant drift of the building from original design, i.e., it tracks persistence. In each case where the actual variance was more than +/-5%, an analysis was done to determine the cause and whether a change would be required in the baseline. Thanks to the high level of sub-metering and controls, each significant departure from the design could be identified. Table 1 shows that when corrected for operating issues, the net variance between the design model and the actual metered usage was less than 1% over the year, with the monthly highest being 4.5%. In only one month did the variance require a baseline change – April 2015. A change in occupancy occurred May 1, 2015 as Bullitt went from 85% to 100% occupancy, so the baseline followed suit.
The graph below is the standard DeltaMeter® projection of the data showing the building’s performance over time. The lower (green) line is the Bullitt Center’s tracker model. It is projecting the expected performance. The black stars are the actual monthly usage from the utility meter for comparison. If these two values are not within +/- 5%, it triggers an analysis of the data to determine whether a change is needed in the baseline. The top (red) line is charting the monthly baseline model energy use adjusted to current conditions (black triangles). The grey area between the two lines is the energy efficiency yield (savings). The bar graphs below show the savings (white for projected, maroon for actual). All energy units are in megawatt hours. Intervals are based on meter reading dates, not calendar months.
Fig. 4. DeltaMeter® showing dynamic modeled baseline and actual Bullitt Center electricity use.Image: EnergyRM
Calibrated Energy Model Baseline and As-built Model The monthly energy savings are calculated by subtracting the consumption of an EnergyPlus model (calibrated to the actual Bullitt Center consumption) from the EnergyPlus

Composite Baseline consumption. It is considered best practice to subtract modeled consumption from a modeled baseline, but other methods can be implemented for comparison such as ASHRAE 90.1 Appendix G or the 2009 Seattle Energy Code (Van Den Wymelenberg et. al. 2012). Billing Mechanics Integrating the MEETS model into the existing utility billing and accounting infrastructure has revealed several significant gaps in the utility process. Assessing charges to the tenant account currently involves manual energy savings calculations external to the billing system with monetary adjustments made to the account. Likewise, payments to the investor are externally calculated and processed. Full-scale integration of MEETS into the billing system will require virtual meters, metered efficiency rates to allow for the segregation of real and virtual energy for taxation and accounting purposes, an automated means of exporting credits for routine investor payments, and the discrete assessment of administrative charges by the utility. While none of the gaps above is insurmountable, they push the boundaries of current practice in utility billing systems. LESSONS LEARNED
A key lesson from the pilot is that the contractual arrangements are critical, particularly if a 20-year horizon is used. It is important to recognize the contracts among the utility, the building owner, the investor, the operator, and the tenants play a key role in managing the process. Office leases must assure that the tenants are responsible for paying the retail electric cost of the dynamic baseline consumption, the equivalent energy use of a building without any efficiency improvements beyond code. Also, a mechanism is needed to adjust for non-routine changes that occur over time like the DeltaMeter® process does. In particular, it is important to understand that lower occupancy (loss of a tenant) does not result in increased savings because it is included in the variance adjustments to the dynamic baseline. Overall, this initial experience has revealed the following significant items:
Base case definition – As new construction, Bullitt Center has no historical base case condition, requiring a modeled base case centered on the then-current 2009 code. It was necessary to define an empirical base case from the most similar recently constructed buildings. There were only five such buildings in SCL territory, providing only a limited statistical basis for the pilot and required a substantial analytical effort. An EnergyPlus model with the geometry identical to the Bullitt Center was calibrated to this “composite” signature. It is also necessary to log and track significant operational adjustments including patterns and density of building occupancy. This log provides a basis for routine and non-routine adjustments in the dynamic baseline model and the “tracker” (as built) model. This initial and on-going analysis would become part of the infrastructure investment for this new power resource system-wide. Since the efficiency purchased is lower cost than the marginal power alternative, this could result in lower electricity rates in the long run.
Utility internal processing – Even though the MEETS process is conceptually simple, the procedural aspects of including a virtual energy measure such as negawatts has proved very challenging within the data flow inside the utility. This is mostly due to the new nature of the arrangement and it is assumed over time this will become more streamlined as more buildings use this option.

Empirical Modeling – The DeltaMeter® empirical modeling uses mean monthly temperature as the principal independent variable. This modeling approach proved to be manageable and accurate enough to identify operational irregularities. Monthly operation supports persistence of savings. In this initial year of operation, only adjustments for temperature and one adjustment for occupancy were necessary. Hopefully the next two years of this pilot will provide broader tests of the DeltaMeter® modeling capability
Contractual relationships – In this initial operational test, these contracts proved workable, though there were no unusual circumstances to test the contractual extremes. This initial application of the MEETS process did not reveal any significant contradictions in the first year of operation. However it is important to recognize that the MEETS process is intended to operate for 20 years. Since the counterfactual base case involves a 20 year prediction of operation, the MEETS process relies on an accurate initial measurement of the savings, continuous persistence checks, and occasional, contractually specified adjustments to the base case. The MEETS process is not strictly a measurement exercise; it is a utility valuation exercise, and like other utility valuation measurements, such as demand, the measurement uses an actual physical measurement combined with contractual specifications to provide a reasonable valuation. CONCLUSIONS
A MEETS transaction has been operated for the first year of a three year pilot. The pilot has included whole building end use metering, enhanced review and occupancy logging. While not strictly necessary to the MEETS process, they are used here to explore and validate the process. For Seattle City Light, the MEETS Power Purchase Agreement pilot at the Bullitt Center using EnergyRM’s DeltaMeter® presents an opportunity to investigate a model that could provide long-term efficiency-based cash flow, allocated appropriately amongst the involved parties. It is envisioned that this model could be structured to pay back the investor, provide fair compensation to the utility, and provide benefits to the user. Seattle City Light wanted to test the concept that by paying for “metered saved energy” only after it has been realized, the utility can eliminate the risk of paying for unrealized savings. The purchased savings are analogous to purchasing electricity from a load-following (i.e. metered savings follows the utility’s demand curve almost exactly), non-polluting, risk-free independent power producer. The increased compensation from pay-for-performance, coupled with a 20-year contract for measured savings, should make it possible for owners or investors to make far deeper investments and to maintain them over time, thus ensuring a level of persistence the utility can rely on.
Full-scale integration of MEETS into the billing system will require virtual meters, metered efficiency rates to allow for the segregation of real and virtual energy for taxation and accounting purposes, an automated means of exporting credits for routine investor payments, and the discrete assessment of administrative charges by the utility.
For the MEETS PPA to work, there is a need for an affordable, revenue quality, monthly, whole building energy savings measurement. The pilot and related independent validation at Bullitt Center shows that this “transactable measurement” is possible because DeltaMeter®’s inverse engineering model has accurately predicted baseline future use as well as identified reductions in performance relative to design. The validation effort found that savings at the Bullitt Center to date relative to a comparable building have been extraordinary— over 70% in all months except April 2015 when occupancy was at 85%.

REFERENCES Djunaedy, E., & Van Den Wymelenberg, K. G. (2014). Targeted Calibration of Energy Model.
In ASHRAE Annual Conference. Seattle, WA. DOE EERE IPMVP Committee. (2002). International Performance Measurement and
Verification Protocol: Concepts and Options for Determining Energy and Water Savings (No. DOE/GO-102002-1554). Retrieved from www.ipmvp.org
Haberl, J., Sreshthaputra, A., Claridge, D. E., & Kissock, K. (2003). Inverse Modeling Toolkit
(1050RP): Application and Testing. In ASHRAE Transactions (Vol. 109, p. Part 2).
H. Reichmuth and C. Turner, "A Tool for Efficient First Views of Commercial Building Energy Performance," in Proceedings of ACEEE Summer Study on Energy Efficiency in Buildings, 2010, p. 14.
H. Reichmuth and C. Turner, "Building Performance Insights: Proof-of Concept-Report," New Buildings Institute, 2010.
J. S. Haberl and C. C. Culp, "Measurement and Verification of Energy Savings," in Energy Management Handbook, W. C. Turner and S. Doty, Eds., ed Lilburn, GA: Fairmont Press, 2009.
J. K. Kissock, J. S. Haberl and D.E. Claridge, “Inverse Modeling Toolkit: Numerical Algorithms,” ASHRAE Transactions, 109 Part 2.
Kissock, K., Haberl, J., & Claridge, D. E. (2002). Development of a Toolkit for Calculating Linear, Change-Point Linear and Multiple-Linear Inverse Building Energy Analysis Models (No. ASHRAE Research Project 1050-RP). Atlanta, GA, USA: American Society of Heating Refrigerating and Air Conditioning Engineers.
MEETS Accelerator Coalition, “Unlocking Deep Efficiency in Commercial Buildings: The Metered Energy Efficiency Transaction Structure”, May 2016, http://www.meetscoalition.org
Van Den Wymelenberg, K. G., Brown, G. Z., & Loveland, J. (2012). Measuring a Decade of Market Transformation: the Pacific Northwest Integrated Design Lab Network. In ACEEE Summer Study on Energy Efficiency in Buildings. Asilomar Conference Center, Pacific Grove, CA.
W.Koran, “A Description and Assessment of Energy Resource Management’s Enhanced
Measurement and Verification Process,” 2010.