mechanical properties and deformation mechanisms of a ...
16
MECHANICAL PROPERTIES AND DEFORMATION MECHANISMS OF A COMMERCIALLY PURE TITANIUM S. NEMAT-NASSER{, W. G. GUO and J. Y. CHENG Center of Excellence for Advanced Materials, Department of Applied Mechanics and Engineering Sciences, University of California, San Diego, La Jolla, CA 92093-0416, U.S.A. (Received 10 December 1998; accepted 10 June 1999) Abstract—The mechanical behavior of a commercially pure titanium (CP-Ti) is systematically investigated in quasi-static (Instron, servohydraulic) and dynamic (UCSD’s recovery Hopkinson) compression. Strains over 40% are achieved in these tests over a temperature range of 77–1000 K and strain rates of 10 3 –8000/s. At the macroscopic level, the flow stress of CP-Ti, within the plastic deformation regime, is strongly dependent on the temperature and strain rate, and displays complex variations with strain, strain rate, and temperature. In particular, there is a three-stage deformation pattern at a temperature range from 296 to 800 K, the specific range depending on the strain rate. In an eort to understand the under- lying mechanisms, a number of interrupted tests involving temperature jumps are performed, and the resulting microstructures are characterized using an optical microscope. Based on the experimental results and simple estimates, it is concluded that the three-stage pattern of deformation at temperatures from 296 to 800 K, is a result of dynamic strain aging, through the directional diusion of dislocation-core point defects with the moving dislocation at high strain rates, although the usual dynamic strain aging by point defects segregating outside the dislocation core through volume diusion is also observed at low strain rates and high temperatures. The microscopic analysis shows that there is substantial deformation twinning which cannot be neglected in modeling the plastic flow of CP-Ti. The density of twins increases markedly with increasing strain rate, strain, and decreasing temperature. Twin intersections occur, and become more pronounced at low temperatures or high strain rates. In sum, the true stress–true strain curves of CP-Ti show two stages of deformation pattern at low temperatures, three stages at temperatures above 296 K, and only one stage at temperatures exceeding 800 K, although all three stages may exist even at 1000 K for very high strain rates, e.g. 8000/s. While the dislocation motion is still the main deformation mechanism for plastic flow, the experimental results suggest that dynamic strain aging should be taken into account, as well as the eect of deformation twinning. # 1999 Acta Metallurgica Inc. Published by Elsevier Science Ltd. All rights reserved. Keywords: Titanium; Plastic; Aging; Dynamic phenomena; Microstructure 1. INTRODUCTION The h.c.p. titanium has an axial ratio of c=a 1:587, and is strongly plastically anisotropic. The most common slip modes, in the order of ease of operation, are the f10 10g-, f10 11g-, and {0001}- planes, with h11 20i as the slip direction. The three glide planes with the slip vector in the basal plane constitute a total of four independent slip systems [1]. However, five independent slip systems are necessary for the polycrystalline material to be able to undergo general homogeneous plastic defor- mation. Thus, twin systems are necessary in order to maintain the deformation compatibility [2]. Hence dislocation slip and twinning occur concomi- tantly during plastic deformation [3]. Which defor- mation mode is dominant is still an open question. In the past several decades, plastic flow of commer- cially pure titanium (CP-Ti) has been examined extensively. The single-crystal study is important, as it leads to a more fundamental understanding of the basic deformation phenomena. Experimental results of Akhtar and Teghtsoonian [4, 5] on single- crystal Ti, oriented favorably for prismatic slip at temperatures between 77 and 1120 K and a strain rate of about 10 4 /s, show that the stress–strain curves exhibit three stages of hardening. They con- clude that the rate of thermally activated prismatic slip below 250 K is controlled by an interaction involving dislocations and the interstitial impurity atoms. In terms of the angle between the basal plane and the tensile axis, their results show that, when the angle is close to 608 or less, the three-stage hardening becomes more pronounced and the deformation involves 10 12 or 11 21 twin- ning at low temperatures. But, at temperatures above 500 K, basal slip or prismatic slip, without twinning, is observed. Compared with single crystals, polycrystalline titanium has received greater attention. Recent a-Ti research of Chichili et al. [2] shows that, although dislocation motion accounted for the main part of plastic deformation, Acta mater. Vol. 47, No. 13, pp. 3705–3720, 1999 # 1999 Acta Metallurgica Inc. Published by Elsevier Science Ltd. All rights reserved. Printed in Great Britain 1359-6454/99 $20.00 + 0.00 PII: S1359-6454(99)00203-7 {To whom all correspondence should be addressed. 3705
Transcript of mechanical properties and deformation mechanisms of a ...
MECHANICAL PROPERTIES AND DEFORMATION
MECHANISMS OF A COMMERCIALLY PURE TITANIUM
S. NEMAT-NASSER{, W. G. GUO and J. Y. CHENG
Center of Excellence for Advanced Materials, Department of Applied Mechanics and EngineeringSciences, University of California, San Diego, La Jolla, CA 92093-0416, U.S.A.
(Received 10 December 1998; accepted 10 June 1999)
AbstractÐThe mechanical behavior of a commercially pure titanium (CP-Ti) is systematically investigatedin quasi-static (Instron, servohydraulic) and dynamic (UCSD's recovery Hopkinson) compression.Strains over 40% are achieved in these tests over a temperature range of 77±1000 K and strain rates of10ÿ3±8000/s. At the macroscopic level, the ¯ow stress of CP-Ti, within the plastic deformation regime, isstrongly dependent on the temperature and strain rate, and displays complex variations with strain, strainrate, and temperature. In particular, there is a three-stage deformation pattern at a temperature rangefrom 296 to 800 K, the speci®c range depending on the strain rate. In an e�ort to understand the under-lying mechanisms, a number of interrupted tests involving temperature jumps are performed, and theresulting microstructures are characterized using an optical microscope. Based on the experimental resultsand simple estimates, it is concluded that the three-stage pattern of deformation at temperatures from 296to 800 K, is a result of dynamic strain aging, through the directional di�usion of dislocation-core pointdefects with the moving dislocation at high strain rates, although the usual dynamic strain aging by pointdefects segregating outside the dislocation core through volume di�usion is also observed at low strainrates and high temperatures. The microscopic analysis shows that there is substantial deformation twinningwhich cannot be neglected in modeling the plastic ¯ow of CP-Ti. The density of twins increases markedlywith increasing strain rate, strain, and decreasing temperature. Twin intersections occur, and become morepronounced at low temperatures or high strain rates. In sum, the true stress±true strain curves of CP-Tishow two stages of deformation pattern at low temperatures, three stages at temperatures above 296 K,and only one stage at temperatures exceeding 800 K, although all three stages may exist even at 1000 K forvery high strain rates, e.g. 8000/s. While the dislocation motion is still the main deformation mechanismfor plastic ¯ow, the experimental results suggest that dynamic strain aging should be taken into account,as well as the e�ect of deformation twinning. # 1999 Acta Metallurgica Inc. Published by Elsevier ScienceLtd. All rights reserved.
Keywords: Titanium; Plastic; Aging; Dynamic phenomena; Microstructure
1. INTRODUCTION
The h.c.p. titanium has an axial ratio of
c=a � 1:587, and is strongly plastically anisotropic.
The most common slip modes, in the order of ease
of operation, are the f1010g-, f1011g-, and {0001}-
planes, with h1120i as the slip direction. The three
glide planes with the slip vector in the basal plane
constitute a total of four independent slip systems
[1]. However, ®ve independent slip systems are
necessary for the polycrystalline material to be able
to undergo general homogeneous plastic defor-
mation. Thus, twin systems are necessary in order
to maintain the deformation compatibility [2].
Hence dislocation slip and twinning occur concomi-
tantly during plastic deformation [3]. Which defor-
mation mode is dominant is still an open question.
In the past several decades, plastic ¯ow of commer-
cially pure titanium (CP-Ti) has been examined
extensively. The single-crystal study is important, as
it leads to a more fundamental understanding of
the basic deformation phenomena. Experimental
results of Akhtar and Teghtsoonian [4, 5] on single-
crystal Ti, oriented favorably for prismatic slip at
temperatures between 77 and 1120 K and a strain
rate of about 10ÿ4/s, show that the stress±strain
curves exhibit three stages of hardening. They con-
clude that the rate of thermally activated prismatic
slip below 250 K is controlled by an interaction
involving dislocations and the interstitial impurity
atoms. In terms of the angle between the basal
plane and the tensile axis, their results show that,
when the angle is close to 608 or less, the
three-stage hardening becomes more pronounced
and the deformation involves �1012� or �1121� twin-ning at low temperatures. But, at temperatures
above 500 K, basal slip or prismatic slip, without
twinning, is observed. Compared with single
crystals, polycrystalline titanium has received
greater attention. Recent a-Ti research of Chichili
et al. [2] shows that, although dislocation motion
accounted for the main part of plastic deformation,
Acta mater. Vol. 47, No. 13, pp. 3705±3720, 1999# 1999 Acta Metallurgica Inc.
Published by Elsevier Science Ltd. All rights reserved.Printed in Great Britain
1359-6454/99 $20.00+0.00PII: S1359-6454(99)00203-7
{To whom all correspondence should be addressed.
3705
twin-dislocation intersections play an important
role in the strain hardening at room temperature
and strain rates ranging from 10ÿ5 to 105/s.
Furthermore, Satish et al. [6, 7] show that the initial
texture is important in inducing ¯ow instabilities at
a particular strain ratio and temperature; in fact,
the observed higher intensity of adiabatic shear
bands in the rolling direction of specimens is due to
a preferred prismatic slip texture. The three-stage
stress±strain curves are obtained for temperatures
between 25 and 4008C and strain rates from 10ÿ3 to
102/s. Dynamic strain aging often occurred in the
temperature range of 600±850 K and strain rates of
3� 10ÿ5±3� 10ÿ2=s. As noted by Doner and
Conrad [8], mechanisms that have been proposed
for dynamic strain aging are based either on the
impurity-drag model or on the impurity-pinning
model. Garde and co-workers [9, 10] state that de-
formation twinning occurs signi®cantly, and is im-
portant in the low temperature deformation of
various grades of titanium of di�erent longitudinal
textures (basal plane parallel to the stress axis) over
a range of grain sizes.
As for the modeling, in contrast to f.c.c. and
b.c.c. metals, the constitutive modeling of h.c.p.
metals has received relatively little attention.
Sheikh-Ahmad and Bailey [11] use the torsion test
to obtain ¯ow-stress data for CP-Ti in the tempera-
ture range from ambient to 7508C and at shear
strain rates in the range of about 0.2±120/s, success-
fully ®tting the isothermal behavior of CP-Ti using
the Johnson±Cook model [12]; they [13] also study
the adiabatic ¯ow instability during torsion and
present a model to predict this process. Reed-Hill et
al. [14] have proposed a revised power-law model
for CP-Ti, which is in good agreement with the ex-
perimental data below 500 K at a strain rate of
about 3� 10ÿ4=s. The basic assumption of this
model is that the e�ective stress, in the absence of
dynamic strain aging, obeys the power law. It is
well known that the plastic ¯ow of h.c.p. metals is
very complex over broad temperature and strain
rate ranges. Therefore, constitutive modeling of
h.c.p. is of considerable current interest.
Based on available experimental results, it can be
concluded that dislocation activities and dynamic
strain aging play an important role in the plastic re-sponse of CP-Ti, with the role of deformation twin-ning being uncertain. The presence of a three-stage
deformation pattern in the stress±strain curvesmakes the deformation of CP-Ti even more com-plex. The aim of the present investigation is to
study the plastic ¯ow of CP-Ti at strain rates from10ÿ3 to 104/s, temperatures from 77 to 1000 K, withstrains exceeding 40%. The microstructural featuresare examined at various stages of deformation.
Some preliminary modeling is also performed.Dynamic strain aging is observed at both high andlow strain rates and suitable temperatures.
Preliminary calculations show that the high-strain-rate phenomenon of strain aging may occurthrough a directional di�usion of the dislocation-
core atmosphere, whereas the low-strain-rate eventoccurs through a bulk di�usion.
2. EXPERIMENTS
A 99.99% CP-Ti has been received as a 6.35 mmdiameter extruded rod. In general, the texture ofdrawn or swaged titanium wires or rods is such that
the h1010i-direction extends close to or along thewire- (or rod-) axis [2]. All experimental samplesare cut from such a CP-Ti rod. Thus, the initial
sample orientation most probably is in the h1010i-direction, parallel to the loading axis. The cylindri-cal specimens are 4.8 mm diameter and 4.8 mm
long. The specimens are ®rst annealed at 7048C for1 h in a vacuum of approximately 10ÿ5 Torr. Thenthey are cooled to room temperature.Metallographic examination of the annealed ma-
terial revealed an average grain size of approxi-mately 40 mm, as determined by the mean-linear-intercept method. The chemical composition and
the di�usion data of CP-Ti are given in Table 1.An Instron testing machine is used to conduct
compression experiments at strain rates of 10ÿ3 and
10ÿ1/s, temperatures of 77±800 K, with strainsexceeding 40%. Elevated temperatures are obtainedwith a high-intensity quartz-lamp, radiant-heating
furnace in an argon environment, measuring thetemperature using a thermocouple arrangement. Alltemperatures are maintained constant to within218C. The deformation of the specimen is
Table 1. Chemical composition and di�usion data of commercially pure titanium
Element Composition(p.p.m.)
Activation energy, volume di�usion, Q(kJ/mol)
Frequency factor, D0
(m2/s)Source
C 18 182.1 5:0!� 10ÿ4 [15]N 6 228.2 2:9!� 10ÿ5 [16]O 270 200.9 4:5!� 10ÿ5 [17]H 1 46.1 1:15!� 10ÿ6 [18]Fe 6 144.2a 6:4!� 10ÿ6a [19]
112.3b 4:7!� 10ÿ7b
S 2Ti balance 192.8 1:74!� 10ÿ8 [20]
a Perpendicular to the c-axis.b Along the c-axis.
NEMAT-NASSER et al.: DEFORMATION MECHANISM OF TITANIUM3706
measured by LVDT, mounted in the testing ma-chine, and is calibrated before the test. The low
temperature of 77 K is obtained by immersing thespecimen and the testing ®xture in a bath of liquidnitrogen.
Dynamic tests are performed at strain rates of2200 and 8000/s, temperatures of 77±1000 K, andstrains exceeding 40%, using UCSD's new
Hopkinson technique [21]. For the high-strain-ratetests at elevated temperatures, it is necessary to heatthe sample to the required temperature while keep-
ing the incident and transmission bars of theHopkinson device at a suitably low temperature. Todo this, Nemat-Nasser and Isaacs [21] have devel-oped a novel enhancement of the compression
recovery Hopkinson technique (Nemat-Nasser et al.[22]) for high-temperature tests, where a furnace isemployed to preheat the specimen, while keeping
the transmission and incident bars outside the fur-nace. These bars are then automatically broughtinto gentle contact with the specimen, just before
the stress pulse reaches the specimen end of theincident bar. The temperature of the specimen ismeasured by a thermocouple which also holds the
specimen inside the furnace. The deformed speci-mens are sectioned parallel to the compression axisand their microstructure is examined using an opti-cal microscope.
3. RESULTS
3.1. Mechanical properties
3.1.1. Constant strain rate tests. The true stress±true strain curves of CP-Ti are shown in Fig. 1, forindicated strain rates and temperatures, while thetrue stress vs temperature relations are displayed in
Fig. 2, for indicated strain rates and strains. Figuresdenoted by A and B are for the low strain rates of10ÿ3 and 10ÿ1/s, respectively, whereas those denoted
by C and D correspond to the high strain rates of2200 and 8000/s. The indicated temperatures forhigh-strain-rate tests shown in Figs 1(C) and (D),
denote the initial temperatures of the samples. Theactual temperature of a sample that is deforming ata high strain rate, increases with increasing strain.Examination of these ®gures reveals anomalous
three deformation stages within the plastic regime.As an illustration, consider the curve in Fig. 1(C),which corresponds to the 598 K temperature and
2200/s strain rate. The plastic ¯ow begins with asmall rate of workhardening (small slope); thisregime is identi®ed as Stage I. Once a certain strain
is attained, the workhardening rate increases sub-stantially, denoting the Stage II deformationregime. This is then followed by considerably
reduced, and possibly eventually negative, rates ofworkhardening, de®ning the Stage III deformation.Which deformation stage is dominant in a givencase, depends on the temperature and strain rate.
The unusual three-stage workhardening phenom-
enon occurs at a suitable combination of strain rateand temperature. It appeared at strain rates of 10ÿ3,10ÿ1, 2200, and 8000/s, and temperature ranges of
300±400, 400±500, 500±600, and 600±700 K, corre-sponding to each of the above strain rates. Outsidethe above ranges of loading conditions, only the
Stage I deformation is observed, which is the nor-mal behavior of metals. It can be seen that Stage II
hardening always follows Stage I and is followed byStage III. That is to say, a critical strain must bereached before the phenomenon of a sharp increase
in workhardening appears and, after a second criti-cal strain is achieved, it disappears. The appearanceof the Stage II hardening shifts from lower tem-
peratures to higher temperatures, as the strain rateis increased. At high temperatures and low strain
rates, only the Stage I deformation is observed. Forexample, in Fig. 1(C), Stage II begins close to 10%strain for the 598 K temperature, for 698 K at
slightly more than 10%, while for 798 K at about18%, and, ®nally, for temperatures greater than798 K, it disappears altogether.
The curves in Figs 2(A)±(D) suggest that the ¯owstress tends towards a limiting value, with increas-
ing temperature. This limiting value depends on thestrain rate, and may be estimated from these datato be about 60 MPa at 850 K for a 10ÿ3/s strain
rate, 75 MPa at 910 K for 10ÿ1/s, 75 MPa at1220 K for 2200/s, and 50 MPa at 1250 K for 8000/s.The average value is about 65 MPa and rep-
resents the limiting athermal stress at suitably hightemperatures. The local ascending ¯ow stress in
Stage II occurs at about 400 K for 10ÿ3/s, at 500 Kfor 10ÿ1/s, at 600 K for 2200/s, and at about 700 Kfor 8000/s.
At a strain rate of 10ÿ3/s and temperatures of 670and 770 K, serration is observed in the stress±strain
curves, Figs 1(A) and 3(A). A decrease in the tem-perature dependence of the ¯ow stress is alsoobserved in this temperature range, Fig. 2(A).
Accompanying serration in the stress±strain curves,samples undergo non-uniform deformations. Theydeform from the initial circular cross-section to a
®nal oval shape. It is interesting to note that thechanges to oval shape of the specimen cross-section
occurred only when serrations in the stress±straincurves appeared. The experimental results showthat the amplitude of the oscillation of the stress is
small, Fig. 3(A), which is in agreement with the ex-perimental results of others [23]. The amplitude ofthe oscillation may be used as a measure of the
strength of the drag force. It is only of second-order importance compared to the ¯ow stress that
is a measure of the total resistance force on movingdislocations.3.1.2. Reloading tests. To examine the e�ect of
thermal softening at a 2200/s strain rate, interruptedtests are performed, where upon attaining a givenstrain increment, the loading is ceased, the sample
NEMAT-NASSER et al.: DEFORMATION MECHANISM OF TITANIUM 3707
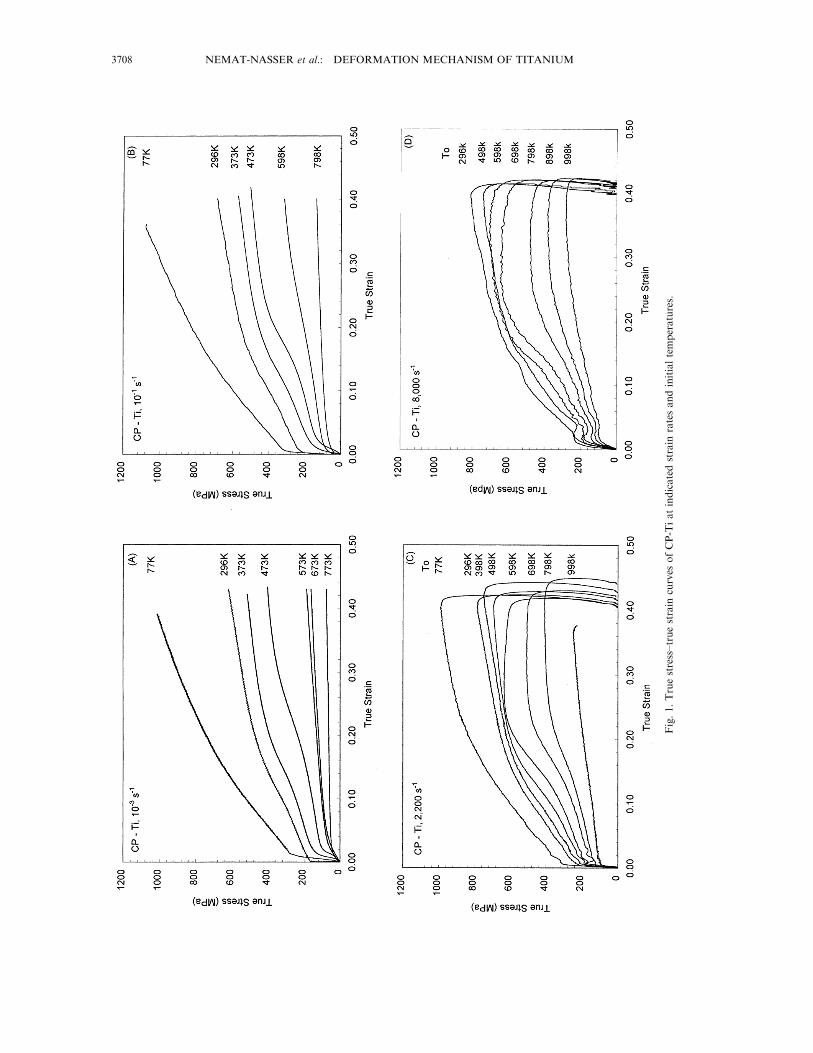
Fig.1.Truestress±truestrain
curves
ofCP-Tiatindicatedstrain
ratesandinitialtemperatures.
NEMAT-NASSER et al.: DEFORMATION MECHANISM OF TITANIUM3708
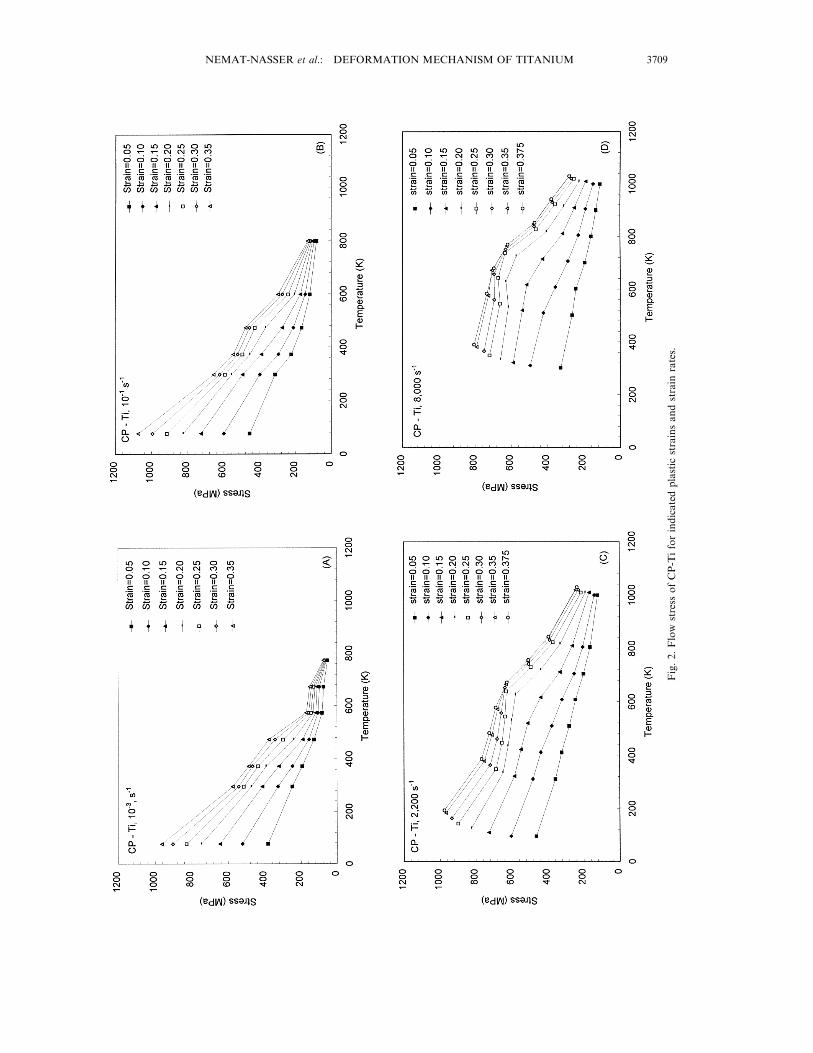
Fig.2.Flow
stress
ofCP-Tiforindicatedplastic
strainsandstrain
rates.
NEMAT-NASSER et al.: DEFORMATION MECHANISM OF TITANIUM 3709
Fig.3.(A
)BehaviorofDSA
athightemperatures.(B)Estim
atedtw
indensities
forindicatedstrain
rates.
NEMAT-NASSER et al.: DEFORMATION MECHANISM OF TITANIUM3710
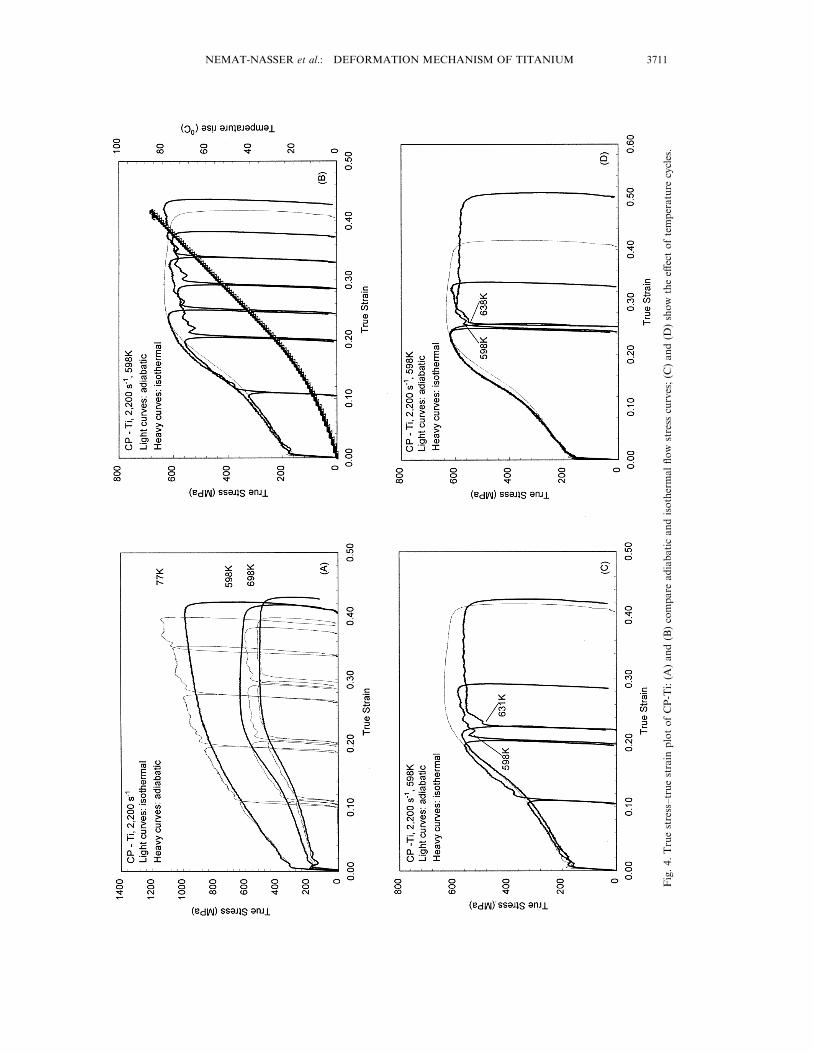
Fig.4.Truestress±truestrain
plotofCP-Ti:(A
)and(B)compare
adiabaticandisothermal¯ow
stress
curves;(C
)and(D
)show
thee�
ectoftemperature
cycles.
NEMAT-NASSER et al.: DEFORMATION MECHANISM OF TITANIUM 3711
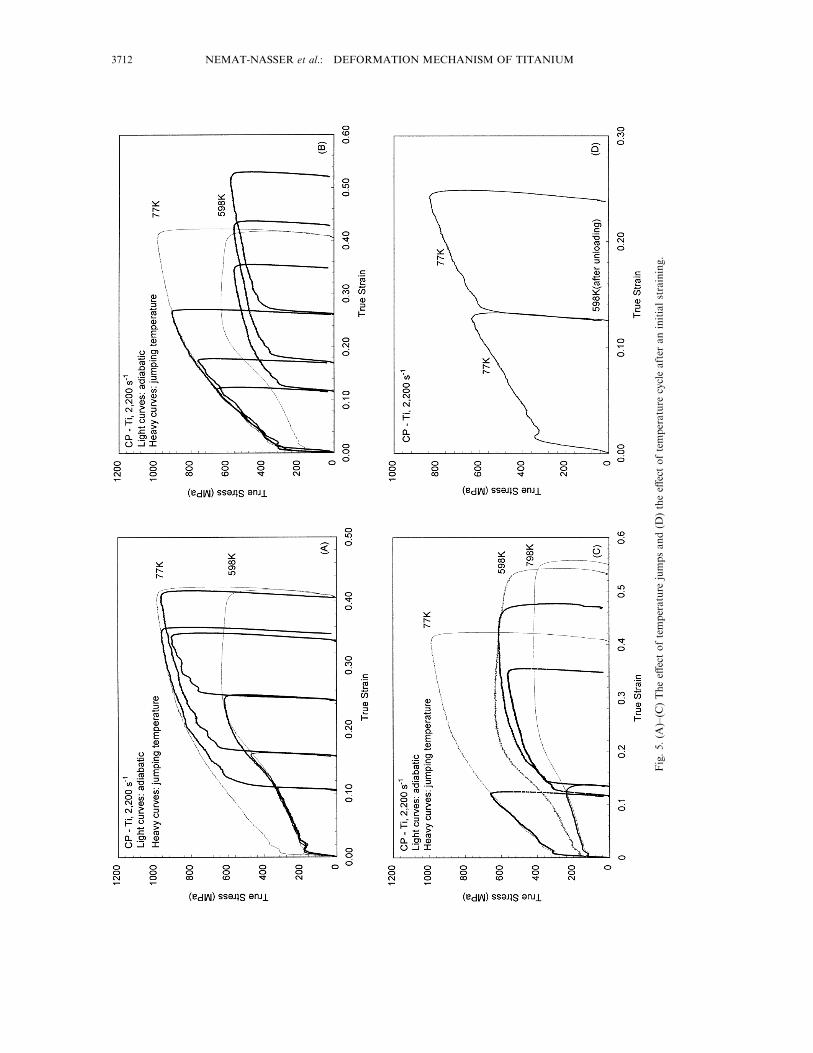
Fig.5.(A
)±(C
)Thee�
ectoftemperature
jumpsand(D
)thee�
ectoftemperature
cycleafter
aninitialstraining.
NEMAT-NASSER et al.: DEFORMATION MECHANISM OF TITANIUM3712
is allowed to return to room temperature, its dimen-
sions are measured, and then it is heated or cooledto its initial temperature in the furnace or liquidnitrogen container attached to the recovery Hopkin-
son bar [21, 22]. The sample is then reloaded at thesame strain rate. After the application of each loadincrement, the sample is unloaded without being
subjected to any additional stress pulses. Since con-tinued plastic deformation at high strain ratesincreases the sample temperature, an increase in the¯ow stress is usually observed for most materials,
upon reloading the sample at its initial temperature;see Nemat-Nasser and Isaacs [21] and Nemat-Nas-ser and Li [24]. This is not, however, the general re-
sponse of CP-Ti at all temperatures, as is shown inFigs 4 and 5, and discussed below.Figure 4(A) shows that the incremental defor-
mation at 77 and 698 K temperatures results inyield stresses greater than the corresponding adia-batic ¯ow stress which is obtained by continued de-formation of the sample at a strain rate of 2200/s.
For a 598 K initial temperature, however, this trendis no longer observed and the reloaded samplebegins to yield at a stress which is less than the cor-
responding adiabatic ¯ow stress.The temperature rise due to the plastic ¯ow is
shown in Fig. 4(B) for the test with an initial tem-
perature of 598 K. This temperature rise is calcu-lated using the following expression:
DT � bCVr
�g0
g dt �1�
where CV is the heat capacity, taken to be 0.523 J/
g K, r is the density, taken at 300 K to be 4.54 g/
cm3, g is the plastic strain, t is the ¯ow stress inMPa, and b is a constant, taken to be 1.0, as
suggested in Ref. [25].As is seen in Figs 4(A)±(D), when the sample is
unloaded within the Stage I deformation regime,
and then reloaded at its initial temperature of598 K, it yields at a stress slightly greater than the
adiabatic ¯ow stress. This is the usual response ofmost metals. In contrast, when the deformation is
interrupted within Stage II, and the sample is cooledto its initial (lower) temperature, then upon reload-
ing, it begins to yield at lower stress than the corre-
sponding adiabatic ¯ow stress. For the true strainsof 0.2 and 0.25, the increments in the temperature
of the adiabatically deformed samples, are about 33and 408C, respectively. When in the corresponding
interrupted test, the sample is heated to its associ-ated adiabatic temperature and then it is reloaded
at a strain rate of 2200/s, it yields at an even smal-
ler stress, as is seen in Figs 4(C) and (D).To examine the e�ect of microstructural evol-
ution on the ¯ow stress, additional interrupted testsare performed and the results are shown in Figs
5(A)±(C). In Fig. 5(A), in addition to the adiabatic
curves for 77 and 598 K initial temperatures, severalother test results are displayed. Starting with a tem-
perature of 598 K, samples are deformed to about10, 16 and 24%, respectively, then they are cooled
to 77 K and reloaded at the same strain rate of2200/s. All three samples began yielding at lower
50µm 50µm
50µm
0
200
400
600
800
1000
1200
0.00 0.10 0.20 0.30 0.40 0.50
True StrainT
rue
Str
ess
(MP
a) 77K
598K
CP - Ti, 2,200 s-1
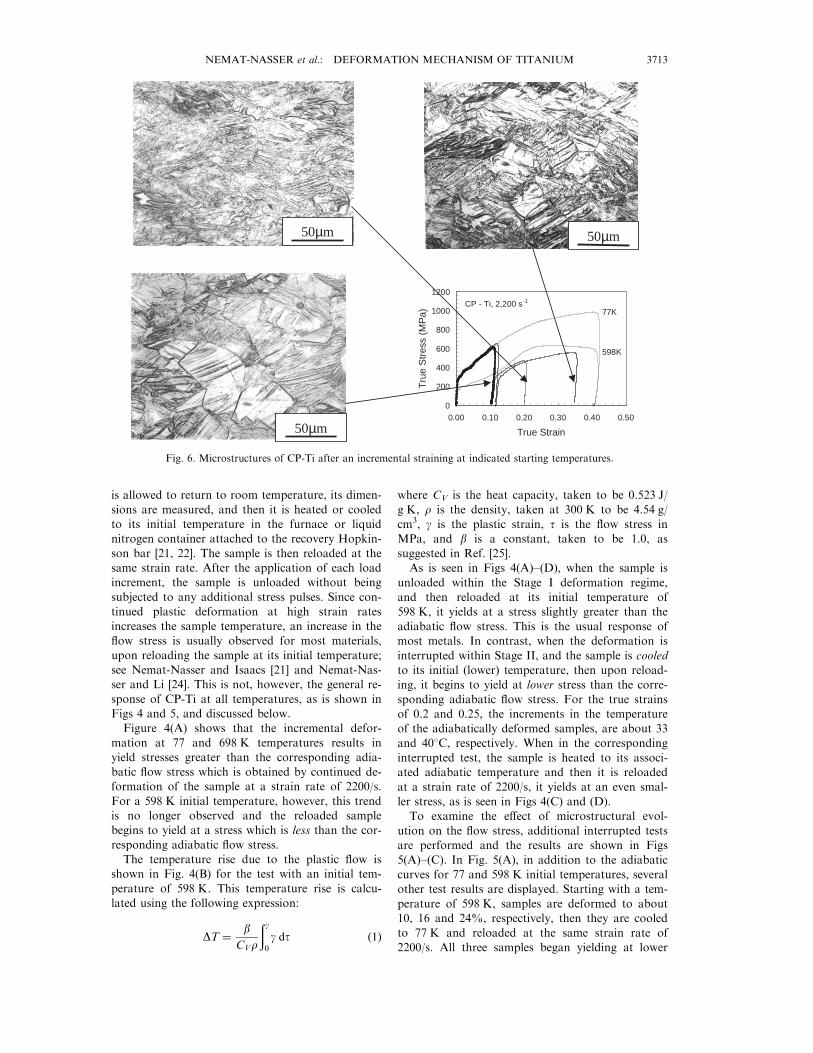
Fig. 6. Microstructures of CP-Ti after an incremental straining at indicated starting temperatures.
NEMAT-NASSER et al.: DEFORMATION MECHANISM OF TITANIUM 3713

stresses than the corresponding adiabatic curves for
the 77 K initial temperature. The results using areversed procedure are shown in Fig. 5(B). Here,
the samples are ®rst loaded incrementally at an in-
itial temperature of 77 K, then unloaded and heatedto a temperature of 598 K before reloading at the
same strain rate. Again the yield stress is seen tofall below the corresponding adiabatic curve for an
initial temperature of 598 K. Figure 5(C) alsoincludes the results of adiabatic and interrupted
tests at a 798 K initial temperature. One sample hasbeen deformed adiabatically to about 0.12 true
strain at a strain rate of 2200/s. It is then cooled to
room temperature, measured, and heated to only598 K before being reloaded at the same strain rate.
The yielding is seen to start essentially at the samevalue as the interrupted test with an initial tempera-
ture of 77 K and the reloaded temperature of598 K. This suggests that the temperature cycling
may have a dominant e�ect on the subsequent re-
sponse of this material. To examine this, a samplewhich has been deformed adiabatically at an initial
temperature of 77 K to about 12% strain, is ®rstbrought to room temperature, then heated to
598 K, and ®nally cooled back to 77 K andreloaded at a strain rate of 2200/s. The results are
shown in Fig. 5(D). As is seen, the yielding starts ata lower stress, and the subsequent plastic defor-
mation continues at essentially the same workhard-
ening slope, as observed before unloading. Thedecrement in the ¯ow stress induced by the thermalcycling, is similar to the one observed in Fig. 5(A).
The associated microstructure is shown in Fig. 6.
3.2. Microstructural characterization by opticalmicroscope
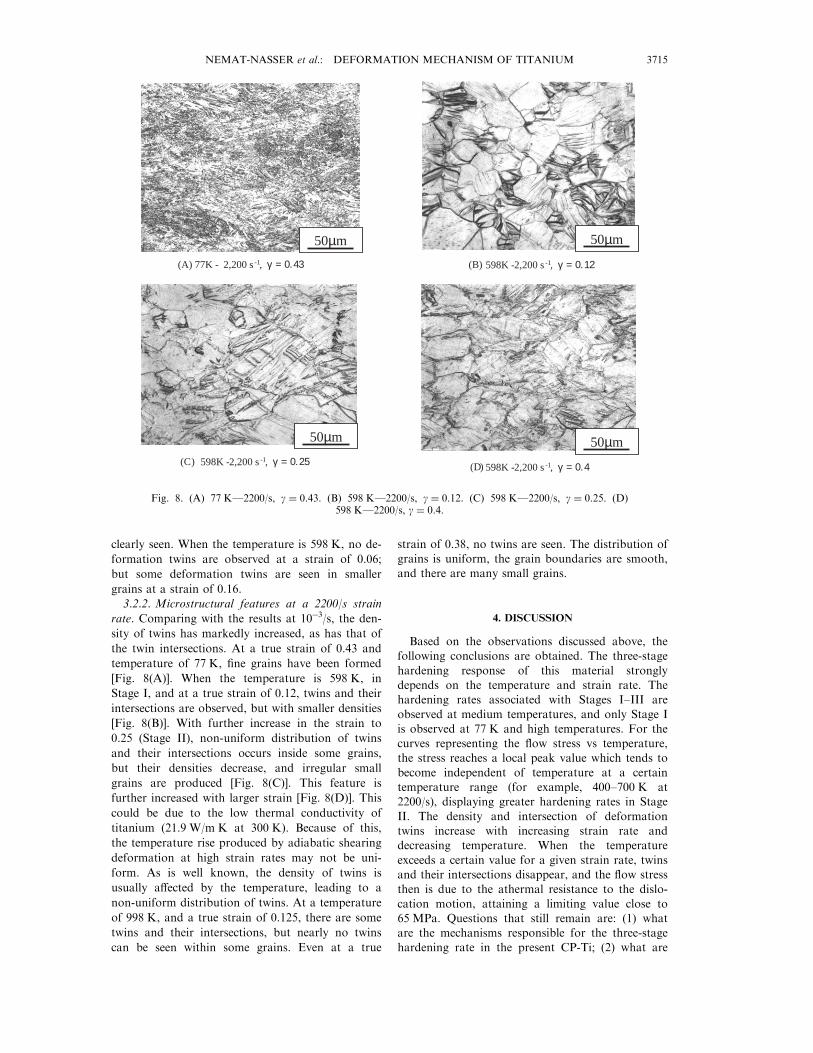
The microstructural features corresponding tovarious deformation regimes at di�erent tempera-tures and strain rates, are shown in Figs 7 and 8.
These are discussed in what follows.3.2.1. Microstructural features at a 10ÿ3/s strain
rate. Figure 7 displays the microstructure at di�er-ent temperatures and strains. At a temperature of
77 K and a true strain of 0.09, deformation twinsand some twin intersections are clearly displayed.Many twins cross the grain boundaries. At a true
strain of about 0.2 and the same temperature, thedensity and intersection of twins are furtherincreased. When the true strain reaches about 0.4,
small grains and subgrains are formed, possibly byintersecting deformation twins. Comparing with theresults at 77 K, the features at 296 K are similar,
but the density and intersection of twins aredecreased. For example, essentially no twin intersec-tions are seen at 0.09 strain for 296 K. As the strainreaches 0.22 in Stage II, twin intersections are
(A) 77K - 10 -3 s -1 , γ = 0. 09
77K - 10 -3 s -1 , γ = 0. 4 296K - 10 -3 s -1 , γ = 0. 22
77K - 10 -3 s -1 , γ = 0. 2(B)
50µm50µm
50µm 50µm
(C) (D)
Fig. 7. (A) 77 KÐ10ÿ3/s, g � 0:09. (B) 77 KÐ10ÿ3/s, g � 0:2. (C) 77 KÐ10ÿ3/s, g � 0:4. (D) 296 KÐ10ÿ3/s, g � 0:22.
NEMAT-NASSER et al.: DEFORMATION MECHANISM OF TITANIUM3714
clearly seen. When the temperature is 598 K, no de-
formation twins are observed at a strain of 0.06;
but some deformation twins are seen in smaller
grains at a strain of 0.16.
3.2.2. Microstructural features at a 2200/s strain
rate. Comparing with the results at 10ÿ3/s, the den-
sity of twins has markedly increased, as has that of
the twin intersections. At a true strain of 0.43 and
temperature of 77 K, ®ne grains have been formed
[Fig. 8(A)]. When the temperature is 598 K, in
Stage I, and at a true strain of 0.12, twins and their
intersections are observed, but with smaller densities
[Fig. 8(B)]. With further increase in the strain to
0.25 (Stage II), non-uniform distribution of twins
and their intersections occurs inside some grains,
but their densities decrease, and irregular small
grains are produced [Fig. 8(C)]. This feature is
further increased with larger strain [Fig. 8(D)]. This
could be due to the low thermal conductivity of
titanium (21.9 W/m K at 300 K). Because of this,
the temperature rise produced by adiabatic shearing
deformation at high strain rates may not be uni-
form. As is well known, the density of twins is
usually a�ected by the temperature, leading to a
non-uniform distribution of twins. At a temperature
of 998 K, and a true strain of 0.125, there are some
twins and their intersections, but nearly no twins
can be seen within some grains. Even at a true
strain of 0.38, no twins are seen. The distribution ofgrains is uniform, the grain boundaries are smooth,and there are many small grains.
4. DISCUSSION
Based on the observations discussed above, thefollowing conclusions are obtained. The three-stage
hardening response of this material stronglydepends on the temperature and strain rate. Thehardening rates associated with Stages I±III are
observed at medium temperatures, and only Stage Iis observed at 77 K and high temperatures. For thecurves representing the ¯ow stress vs temperature,the stress reaches a local peak value which tends to
become independent of temperature at a certaintemperature range (for example, 400±700 K at2200/s), displaying greater hardening rates in Stage
II. The density and intersection of deformationtwins increase with increasing strain rate anddecreasing temperature. When the temperature
exceeds a certain value for a given strain rate, twinsand their intersections disappear, and the ¯ow stressthen is due to the athermal resistance to the dislo-
cation motion, attaining a limiting value close to65 MPa. Questions that still remain are: (1) whatare the mechanisms responsible for the three-stagehardening rate in the present CP-Ti; (2) what are
(A) 77K - 2,200 s -1 , γ = 0. 43
598K - 2,200 s -1 , γ = 0. 25 598K - 2,200 s -1 , γ = 0. 4
598K - 2,200 s -1 , γ = 0. 12(B)
(D) (C)
50µm 50µm
50µm 50µm
Fig. 8. (A) 77 KÐ2200/s, g � 0:43. (B) 598 KÐ2200/s, g � 0:12. (C) 598 KÐ2200/s, g � 0:25. (D)598 KÐ2200/s, g � 0:4.
NEMAT-NASSER et al.: DEFORMATION MECHANISM OF TITANIUM 3715
the roles of the deformation twins; and (3) what arethe fundamental deformation mechanisms which de-
®ne the overall response of this material for theconsidered ranges of temperature, strain rate, andstrain? Some of these questions are addressed in the
following.
4.1. Deformation twinning
Deformation twins are observed at nearly all tem-peratures. Figure 3(B) provides an estimate of twindensity as a function of temperature for a true
strain of 0.1. It is seen that once the temperatureexceeds a limiting value (600 K at 10ÿ3/s), the twinsdisappear. The density of twins increases with
increasing strain rate to 2200/s, and rather sharplywhen the temperature is decreased to 77 K. Sincethe relative atomic movement is limited in defor-
mation twinning [26±28], the amount of gross de-formation produced by twins is rather small. Thus,most of the plastic ¯ow occurs by the motion of thedislocations. The presence of a great number of
twins and their intersections, as in Fig. 6, hindersthe motion of the dislocations. Hence, a high dislo-cation density always occurs at twin boundaries and
especially at their tips [1]. We have checked themicrostructure of the as-received material and com-pared it with the annealed samples, observing a
substantial decrease in the density of twins due toannealing.The high density of twins, however, does not
necessarily correlate with a higher ¯ow stress. This is
illustrated by the results of Figs 6 and 8. In Fig. 8samples are deformed to various indicated strains ata common initial temperature of 598 K and strain
rate of 2200/s. The observed microstructure at theend of each test is shown, indicating a decreasingtwin density with increasing strain and stress. In
Fig. 6 the samples are deformed at a common in-itial temperature of 77 K and strain rate of 2200/s,to about a 10% true strain. Their microstructure is
observed as shown. Then the samples are heated to598 K and deformed at 2200/s, one to 20%, and theother to 35% true strain. The corresponding micro-structure at the end of each test is shown. As is
seen, the ¯ow stress for these incremental defor-mations at the same temperature of 598 K fallsshort of that observed in Fig. 8. These results
suggest that the presence of twins does not necess-arily strongly a�ect plastic deformation. Chichili etal. [2] point out that plastic deformation due to
twins is less than 0.2% in their results. Garde et al.[10], however, suggest that about one-third of thetotal strain can be accounted for by twins whenh.c.p. titanium is deformed at 77 K. A quantitative
assessment of the twin e�ects on plastic ¯ow is yetto be made.
4.2. Dynamic strain aging
The appearance of the anomalous Stage II hard-ening and the associated phenomena strongly
suggest a relation to the dynamic strain-aginge�ects, caused by the interaction between moving
dislocations and mobile point defects, such asvacancies and solute atoms. A key feature of a ther-mally activated dislocation motion is that the dislo-
cations spend most of their time in the process ofinteractions with local obstacles, such as forests ofdislocations, vacancies, and solute atoms. This
period, tw, is called the waiting time. After the dis-location overcomes a set of obstacles, it movesrather fast until it is stopped at the next group of
obstacles. The average velocity of the dislocation isdetermined by the spacing between the obstaclesand the waiting time spent during the thermal acti-vation process. A dislocation moves in a jerky way.
Actually, dislocations move rather slowly duringthe process of thermal activation if both the waitingand the running times are included. The e�ect of
the drag of point defects becomes apparent whenthe time for point defects to di�use to the dislo-cations, is comparable to the dislocation waiting
time. For this reason, the dynamic strain aginge�ect appears at a certain suitable combination ofstrain rate and temperature.
It is well known that the plastic deformation ofcrystalline materials originates from the generationand motion of dislocations. The e�ective plasticstrain rate of the material may be related to the dis-
location motion by Orowan's equation
_g � abrm �n �2�where _g is the plastic strain rate, a is the orientation
factor, b is the magnitude of the Burgers vector ofthe dislocation, and rm is the density and �n is theaverage velocity of the mobile dislocations. From
Orowan's equation (2), assuming the average dis-tance between obstacles is l, and neglecting the run-ning time, the average waiting time tw for
dislocations to overcome their obstacles, may beestimated by
tw � armbl
_g: �3�
The relaxation time, td, for point defects to di�use
over the average width of the obstacles, a*, which isthe average activation distance of the dislocations,is
td � �a��2D
�4�
where D is the di�usion coe�cient
D � D0 exp
�ÿ Q
kT
��5�
where D0 is the di�usivity factor, k is Boltzmann's
constant, T is the absolute temperature, and Q isthe activation energy for di�usion. Taking the typi-cal values of the parameters in equations (3) and(4), we can estimate the average waiting time for
NEMAT-NASSER et al.: DEFORMATION MECHANISM OF TITANIUM3716
dislocations at di�erent strain rates. Assuming
a01, rm01010±1016 m2, l0100b, a�03b, andb � 2:95� 10ÿ10 m, the waiting times at strain ratesof 10ÿ3, 10ÿ1, 103 and 104 are 1, 10ÿ2, 10ÿ6 and
10ÿ7 s, respectively. Here, we take the density ofmobile dislocations to be 1013 m2, a typical value ata strain of 10% for well-annealed single crystals;
also a typical value for polycrystalline materials. Inorder that the point defects have enough time to
di�use over the distance a*, the corresponding dif-fusion coe�cients at the above strain rates shouldbe 2:6� 10ÿ20, 2:6� 10ÿ18, 2:6� 10ÿ14, and
2:6� 10ÿ13 m2=s, respectively. For oxygen to di�useat the above di�usion rates, the temperaturesshould be about 700, 790, 1140 and 1270 K, re-
spectively. Nitrogen and carbon have the same dif-fusion rates at similar temperatures, because theiractivation energies for di�usion are close to that for
oxygen di�usion. For the dynamic strain-agingphenomenon to be observed under the above strain
rates at lower temperatures of, 300±400, 400±500,500±600, and 600±700 K, the activation energy ofdi�usion should be around 100 kJ/mol, about half
for the value of volume di�usion of oxygen, nitro-gen, and carbon.
The mobility of point defects in titanium byvolume di�usion is relatively low. For the appear-ance of the dynamic strain aging due to the drag of
point defects through volume di�usion, the tempera-ture must be around 700 K under a quasi-staticloading condition. Actually, the dynamic strain-
aging e�ect due to the drag of the point defect at-mosphere by volume di�usion outside the dislo-cation core area, is observed in the temperature
range of 670±770 K at a strain rate of 10ÿ3/s in ourexperiments [see Fig. 3(A)], and in many other ex-
periments, under similar conditions [23].Di�erent impurities have di�erent di�usion coe�-
cients. Hence, the dynamic strain-aging phenom-
enon may be observed at di�erent temperatureranges for the same strain rate. In fact, under aquasi-static loading condition, three temperature
ranges, i.e. 200±300, 500±650, and 700±900 K, havebeen found within which dynamic strain aging took
place, each at its own activation energy, i.e. 42, 130,and 210 kJ/mol [8, 29]. These are associated withhydrogen, carbon, and oxygen di�usion, respect-
ively, as reported by Doner and Conrad [8].However, the activation energy of 130 kJ/mol forthe intermediate dynamic strain-aging range is
lower than that of 182 kJ/mol for carbon di�usion,but is closer to that of iron. It leads Senkov and
Jonas [23] to consider iron as the element respon-sible for the strain aging at the intermediate tem-perature. In the present case, the hydrogen and iron
contents are so low that they cannot make detect-able contributions to the dynamic strain-aging e�ectaround room temperature. Furthermore, the
required activation energy of di�usion for thedynamic strain-aging phenomenon we observed ex-
perimentally at lower temperatures is much greaterthan that of hydrogen and lower than that of iron.
Therefore, hydrogen and iron cannot be responsiblefor the observed unusual behavior.Owing to the interactions of point defects with
the elastic strain ®eld of dislocations, the pointdefects segregate to dislocations to form a pointdefect atmosphere around dislocations outside the
dislocation core area. Additionally, point defectscan be formed within the dislocation core. In fact,the dislocation core may attract point defects more
strongly than any site within the elastic ®eld.Both types of point defect distributions can intro-
duce drag on the moving dislocations under appro-priate conditions. For the former type of point
defect distributions, volume di�usion of point defectswithin the crystal lattice is needed to cause the drage�ects on dislocations. For the latter type, the drag
e�ects appear through the pipe di�usion of the pointdefects along the dislocation core, or, in the case ofinterstitial solute atoms, through the directional dif-
fusion of the core atmosphere along with the mov-ing dislocations under the aid of the stronginteraction force between dislocations and point
defects in the core area. Therefore, the dislocationcore atmosphere of point defects could di�use withthe dislocation much easier than the point defect at-mospheres which are outside the dislocation core
area. Hence, the temperature for the drag e�ect ofthe core atmosphere should be much lower thanthat for the atmospheres outside the core area. In
the present case, no solute atmosphere outside thedislocation core area seems to be responsible forthe observed dynamic strain-aging e�ect at lower
temperatures. The only possibility, therefore, is thedrag of the core atmosphere. We may thus concludethat the unusual dynamic strain-aging e�ect iscaused by the di�usion of the core atmosphere of
the interstitial atoms of oxygen, nitrogen, and car-bon along with the dislocations.It is remarkable to observe two totally di�erent
types of dynamic strain-aging e�ects in one ma-terial. To our knowledge, this may be the ®rst timethat the dynamic strain-aging e�ects due to the
drag of the core atmosphere, are documented exper-imentally in CP-Ti. Based on the mechanism of theinteraction of dislocations with the dislocation core
point defect atmosphere di�using along with thedislocations, the unusual workhardening rate andthe related phenomena for this CP-Ti, observed incertain ranges of temperatures, strain rates, and
strains, are understood.
5. PRELIMINARY MODELING
Based on our experimental results, the modeling
of the response of CP-Ti must include the e�ects ofdynamic strain aging and deformation twins, inaddition to that of the basic dislocation motion. Itwould be desirable to include the evolution of the
NEMAT-NASSER et al.: DEFORMATION MECHANISM OF TITANIUM 3717
microstructure, resulting from the complex defor-mation behavior of this material. Most continuum
models, however, do not address the evolution ofthe microstructure; see, e.g., Refs [12, 30, 31]. Amodel discussed by Follansbee and co-workers [32,
33] takes this e�ect into account, extending the ap-plication of the thermal activation theory to higherstrain rates and strains. Recently, based on the con-
cept of dislocation kinetics, paralleled with a sys-tematic experimental investigation, a physically-based model is developed by Nemat-Nasser and
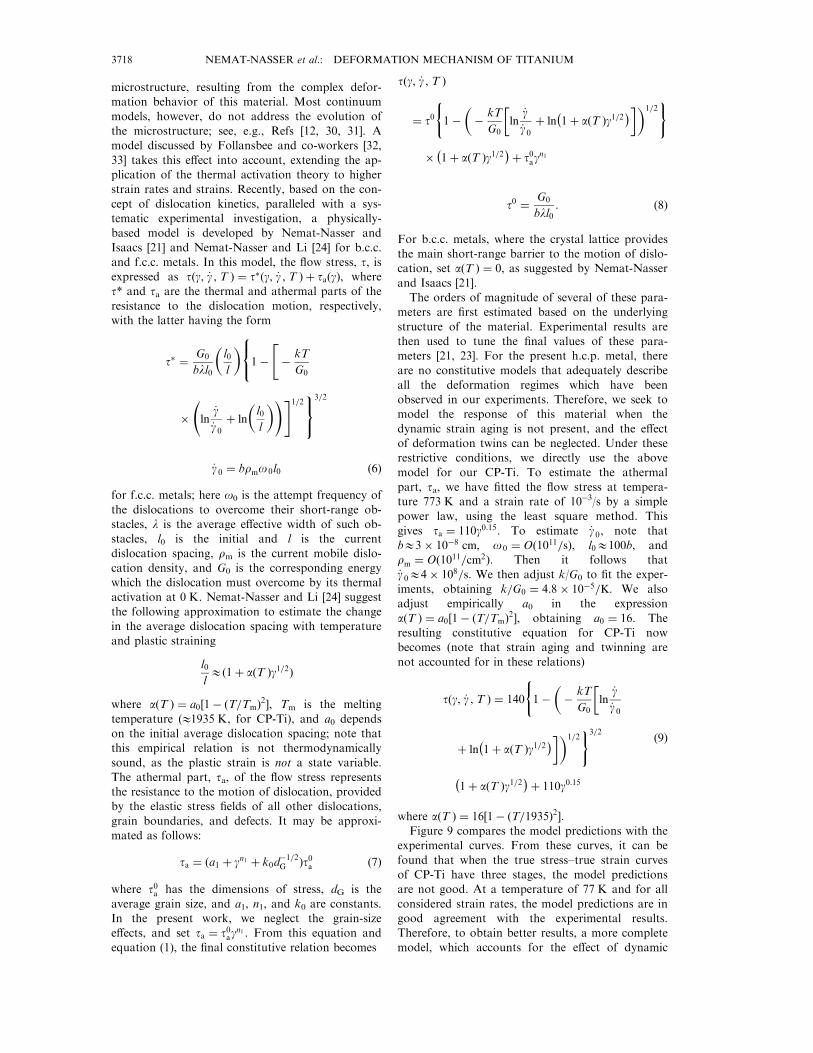
Isaacs [21] and Nemat-Nasser and Li [24] for b.c.c.and f.c.c. metals. In this model, the ¯ow stress, t, isexpressed as t�g, _g , T � � t��g, _g , T � � ta�g�, wheret* and ta are the thermal and athermal parts of the
resistance to the dislocation motion, respectively,with the latter having the form
t� � G0
bll0
�l0l
�8<:1ÿ"ÿ kT
G0
�
ln_g_g 0� ln
�l0l
�!#1=29=;
3=2
_g 0 � brmo 0l0 �6�
for f.c.c. metals; here o0 is the attempt frequency of
the dislocations to overcome their short-range ob-stacles, l is the average e�ective width of such ob-stacles, l0 is the initial and l is the current
dislocation spacing, rm is the current mobile dislo-cation density, and G0 is the corresponding energywhich the dislocation must overcome by its thermalactivation at 0 K. Nemat-Nasser and Li [24] suggest
the following approximation to estimate the changein the average dislocation spacing with temperatureand plastic straining
l0l1�1� a�T �g1=2�
where a�T � � a0�1ÿ �T=Tm�2�, Tm is the melting
temperature (11935 K, for CP-Ti), and a0 dependson the initial average dislocation spacing; note thatthis empirical relation is not thermodynamically
sound, as the plastic strain is not a state variable.The athermal part, ta, of the ¯ow stress representsthe resistance to the motion of dislocation, providedby the elastic stress ®elds of all other dislocations,
grain boundaries, and defects. It may be approxi-mated as follows:
ta � �a1 � gn1 � k0dÿ1=2G �t0a �7�
where t0a has the dimensions of stress, dG is the
average grain size, and a1, n1, and k0 are constants.In the present work, we neglect the grain-sizee�ects, and set ta � t0ag
n1 . From this equation andequation (1), the ®nal constitutive relation becomes
t�g, _g , T �
� t0(1ÿ
�ÿ kT
G0
�ln
_g_g 0� ln
ÿ1� a�T �g1=2
���1=2)
�ÿ1� a�T �g1=2
�� t0ag
n1
t0 � G0
bll0: �8�
For b.c.c. metals, where the crystal lattice providesthe main short-range barrier to the motion of dislo-cation, set a�T � � 0, as suggested by Nemat-Nasser
and Isaacs [21].The orders of magnitude of several of these para-
meters are ®rst estimated based on the underlying
structure of the material. Experimental results arethen used to tune the ®nal values of these para-meters [21, 23]. For the present h.c.p. metal, there
are no constitutive models that adequately describeall the deformation regimes which have beenobserved in our experiments. Therefore, we seek tomodel the response of this material when the
dynamic strain aging is not present, and the e�ectof deformation twins can be neglected. Under theserestrictive conditions, we directly use the above
model for our CP-Ti. To estimate the athermalpart, ta, we have ®tted the ¯ow stress at tempera-ture 773 K and a strain rate of 10ÿ3/s by a simple
power law, using the least square method. Thisgives ta � 110g0:15. To estimate _g 0, note thatb13� 10ÿ8 cm, o 0 � O�1011=s�, l01100b, andrm � O�1011=cm2�. Then it follows that_g 014� 108=s. We then adjust k/G0 to ®t the exper-iments, obtaining k=G0 � 4:8� 10ÿ5=K. We alsoadjust empirically a0 in the expression
a�T � � a0�1ÿ �T=Tm�2�, obtaining a0 � 16. Theresulting constitutive equation for CP-Ti nowbecomes (note that strain aging and twinning are
not accounted for in these relations)
t�g, _g , T � � 140
(1ÿ
�ÿ kT
G0
�ln
_g_g 0
� lnÿ1� a�T �g1=2
���1=2)3=2
ÿ1� a�T �g1=2
�� 110g0:15
�9�
where a�T � � 16�1ÿ �T=1935�2�.Figure 9 compares the model predictions with the
experimental curves. From these curves, it can be
found that when the true stress±true strain curvesof CP-Ti have three stages, the model predictionsare not good. At a temperature of 77 K and for all
considered strain rates, the model predictions are ingood agreement with the experimental results.Therefore, to obtain better results, a more completemodel, which accounts for the e�ect of dynamic
NEMAT-NASSER et al.: DEFORMATION MECHANISM OF TITANIUM3718
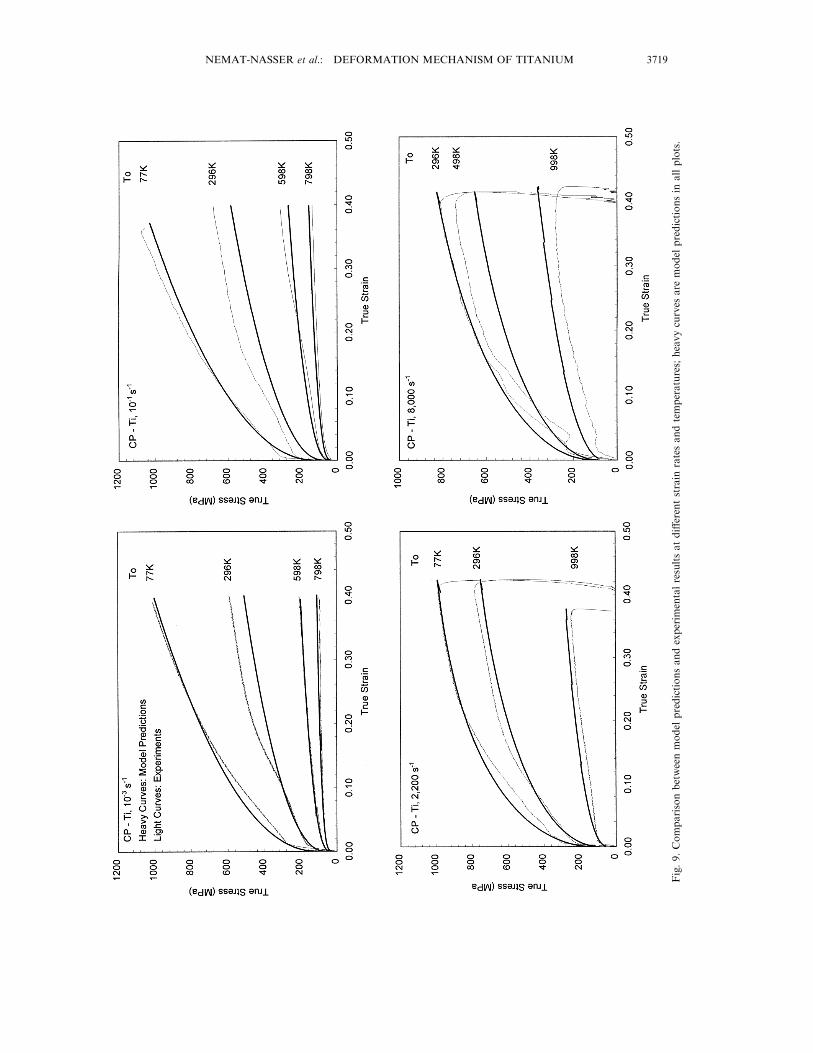
Fig.9.Comparisonbetweenmodel
predictionsandexperim
entalresultsatdi�erentstrain
ratesandtemperatures;heavycurves
are
model
predictionsin
allplots.
NEMAT-NASSER et al.: DEFORMATION MECHANISM OF TITANIUM 3719
strain aging must be developed. This is being cur-rently explored by the authors.
AcknowledgementsÐThe authors would like to thank JonIsaacs for his assistance in performing the experiments.The work reported here has been supported by the ArmyResearch O�ce under contract No. DAAH04-96-1-0376with the University of California, San Diego.
REFERENCES
1. Conrad, H., Prog. Mater. Sci., 1981, 26, 123.2. Chichili, D. R., Ramesh, K. T. and Hemker, K. T.,
Acta mater., 1998, 46(3), 1025.3. Leclercq, S., Nguy, C. and Bensussan, P., Int. Conf.
Mech. Prop. Materials at High Rate of Strain, Oxford,1989, p. 299.
4. Akhtar, A. and Teghtsoonian, E., Metall. Trans. A,1975, 6A, 2201.
5. Akhtar, A., Metall. Trans. A, 1975, 6A, 1105.6. Satish, V. K., Prasad, Y. V. R. K. and Biswas, S. K.,
Metall. Trans. A, 1993, 24A, 2513.7. Satish, V. K., Prasad, Y. V. R. K. and Biswas, S. K.,
Metall. Trans. A, 1994, 24A, 1425.8. Doner, M. and Conrad, H., Metall. Trans., 1973, 4,
2809.9. Garde, A. M. and Reed-Hill, R. E., Metall. Trans.,
1971, 2, 2885.10. Garde, A. M., Aigeltinger, E. and Reed-Hill, R. E.,
Metall. Trans., 1973, 4, 2461.11. Sheikh-Ahmad, J. Y. and Bailey, J. A., J. Engng
Mater. Technol., 1995, 117, 139.12. Johnson, G. R. and Cook, W. H., Proc. 7th Int.
Symp. on Ballistics, The Hague, The Netherlands,1983, p. 541.
13. Sheikh-Ahmad, J. Y. and Bailey, J. A., J. EngngMater. Technol., 1995, 117, 225.
14. Reed-Hill, R. E., Iswaran, C. V. and Kaufman, M. T.,Scripta metall. mater., 1995, 33, 157.
15. Wagner, F. C., Bucur, E. J. and Steinberg, M. A.,Trans. Am. Soc. Metals, 1956, 48, 742.
16. Anttila, A., Raisanen, J. and Keinonen, J., Appl.Phys. Lett., 1983, 42, 498.
17. David, D., Geranger, G. and Garcia, E. A., J. electro-chem. Soc., 1983, 130(6), 1423.
18. Kolachev, B. A., Nasimov, O. P. and Zhuravlev, L. N.,Izv. Uyssh. Ucheb. Zaved, Tsvet. Met., 1970, 12(4),104.
19. Nakajima, H., Koiwa, M. and Ono, S., Scriptametall., 1983, 17, 1431.
20. Herzig, C., Willecke, R. and Vieregge, K., Phil. Mag.A, 1991, 63, 949.
21. Nemat-Nasser, S. and Isaacs, J. B., Acta mater., 1997,45, 907.
22. Nemat-Nasser, S., Isaacs, J. B. and Starrett, J. E.,Proc. R. Soc., 1991, 435A, 371.
23. Senkov, N. and Jonas, J. J., Metall. Mater. Trans.,1996, 27A, 1877.
24. Nemat-Nasser, S. and Li, Y. L., Acta mater., 1998, 46,565.
25. Kapoor, R. and Nemat-Nasser, S., Mech. Mater.,1998, 27, 1.
26. Reed-Hill, R. E., Physical Metallurgy Principles, 2nded, in University series in Basic Engineering. A�liatedEast±West Press, New Delhi, 1973.
27. Dieter, G. E., Mechanical Metallurgy. McGraw-Hill,New York, 1976, p. 132.
28. Courtney, T. H., Mechanical Behavior of Materials.McGraw-Hill, New York, 1990, pp. 309±315.
29. Santhanam, A. T. and Read-Hill, R. E., Acta metall.,1971, 2, 2619.
30. Holmquist, T. J. and Johnson, G. R., Colloque C3,Suppl. to J. Physique III, 1991, 1, 853.
31. Meyer, L. W., in Shock-wave and High-strain-ratePhenomena in Materials, ed. M. A. Meyers, L. E.Murr and K. P. Staudhammer, 1992, pp. 49±68.
32. Follansbee, P. S. and Kocks, U. F., Acta metall.,1988, 36, 81.
33. Follansbee, P. S. and Gray III, G. T., Metall. Trans.A, 1989, 20A, 863.
NEMAT-NASSER et al.: DEFORMATION MECHANISM OF TITANIUM3720