Deformation mechanisms during severe plastic deformation of a … · 2017-12-03 · Deformation...
31
1 Deformation mechanisms during severe plastic deformation of a Cu-Ag composite Karoline S. Kormout, Pradipta Gosh, Verena Maier-Kiener, Reinhard Pippan Abstract A Cu-37at%Ag composite was produced by high-pressure torsion processing of elemental Cu and Ag powders at room temperature. The initial micrometer-sized powder particles were compressed directly in the high-pressure torsion tool and subsequently deformed to different strain levels. The microstructural evolution was studied in detail by scanning and transmission electron microscopy and synchrotron X-Ray measurements, and related to the mechanical properties by microhardness and nanoindentation measurements. The HPT process led to an alignment of Cu and Ag into a lamellar composite microstructure. With increasing applied strain the Cu and Ag lamellae were continuously thinned and simultaneously an ultrafine-grained microstructure was formed in the separate Cu and Ag lamellae. When the lamella spacing reached values lower than the respective grain sizes inside the lamellae, a further lamella thinning occurred causing a significant hardness increase of the composite. At lamella spacings below 50 nm deformation started to localize in 150-300 nm broad shear bands, which surprisingly exhibited no softening. Instead, the steady formation of new shear bands aided to transform the lamellar structure into a nanocrystalline equi-axed microstructure and additionally rotated the lamellar matrix towards the shear plane. This process led to an additional refinement of the alloy and a
Transcript of Deformation mechanisms during severe plastic deformation of a … · 2017-12-03 · Deformation...
1
Deformation mechanisms during severe plastic deformation of a Cu-Ag
composite
Karoline S. Kormout, Pradipta Gosh, Verena Maier-Kiener, Reinhard Pippan
Abstract
A Cu-37at%Ag composite was produced by high-pressure torsion processing of elemental
Cu and Ag powders at room temperature. The initial micrometer-sized powder particles were
compressed directly in the high-pressure torsion tool and subsequently deformed to different
strain levels. The microstructural evolution was studied in detail by scanning and
transmission electron microscopy and synchrotron X-Ray measurements, and related to the
mechanical properties by microhardness and nanoindentation measurements. The HPT
process led to an alignment of Cu and Ag into a lamellar composite microstructure. With
increasing applied strain the Cu and Ag lamellae were continuously thinned and
simultaneously an ultrafine-grained microstructure was formed in the separate Cu and Ag
lamellae. When the lamella spacing reached values lower than the respective grain sizes
inside the lamellae, a further lamella thinning occurred causing a significant hardness
increase of the composite. At lamella spacings below 50 nm deformation started to localize
in 150-300 nm broad shear bands, which surprisingly exhibited no softening. Instead, the
steady formation of new shear bands aided to transform the lamellar structure into a
nanocrystalline equi-axed microstructure and additionally rotated the lamellar matrix
towards the shear plane. This process led to an additional refinement of the alloy and a

2
hardness increase until a constant hardness level was obtained. Combined analyses by
synchrotron X-ray and transmission electron microscopy measurements revealed that, after
reaching the saturation microhardness level, mechanical mixing of Cu and Ag occurred in
the shear bands, which can be attributed to the enormous strains accommodated in the shear
bands. Due to the localized deformation by shear bands, structural and chemical
homogenization of the alloy was not achieved even at very high applied strains. The final
microstructure was composed of nanocrystalline single-phase supersaturated regions
embedded in a residual nano-lamellar matrix.
Key words: shear band; supersaturated solid solution; nanocrystalline; high-pressure torsion;
severe plastic deformation
1. Introduction
Nanocrystalline composites are a promising class of materials for technical applications
because of their high structural and thermal stability compared to single-phase materials. For
instance, the copper based metal matrix composites used as conductors for pulsed high field
magnets [1–4] require high thermal and electrical conductivity with simultaneous high
strength. These superior characteristics are attained with the introduction of phase
boundaries. Extraordinary mechanical and physical properties of Cu-Ag composites were
first reported in vapor-quenched [5] and wire drawn alloys [6]. The developments in wire
drawn Cu-based alloys have shown an extreme increase in tensile strength [2,4,7].
Several efforts were made in the past years to understand how interface structure and phase
spacing influence the mechanical properties [8–10]. The extensive studies on layered fcc-bcc
3
Cu-Nb composites showed that the fundamental nature of deformation mechanism changes
with decreasing layer thickness. For layer thicknesses larger than 100 nm conventional
dislocation pile-up model could explain the observed Hall-Petch strengthening; however, at
layer thicknesses of few tens of nanometer confined layer slip becomes important. Further
reduction in layer thickness to several nanometers promote the dislocations to cross the
interfaces, leading to strong strain localization [11]. Besides the phase spacing the
characteristics of the interfaces can also influence the mechanical properties [8,12]. Finite
element simulations have shown that the interface structure and associated texture evolution
can affect the deformation mechanisms, in particular the formation of shear bands [13–15],
which is a common feature in severe plastic deformation (SPD) processed Cu-Ag alloys
[16,17].
Another interesting aspect of immiscible material systems like Cu-Ag is the formation of
supersaturated solid solutions and amorphization during severe plastic deformation. Early
studies on the ball milling of Cu-Ag system have shown that supersaturated solid solutions
can be obtained over the whole composition range [18]. Although, several hypothesis were
proposed to explain the mechanism of supersaturation and amorphization [15-20], due to the
undefined applied strain a direct correlation between deformation-induced changes and the
material state remained unclear [19]. In order to overcome this constraint other SPD
processes like accumulative roll bonding and high pressure torsion (HPT) have been used in
recent years [17,20–23]. The HPT technique is especially attractive due to the possibilities
of better controlled processing parameters tunable in a wide range of temperature, pressure,
strain rate and applied strains.
4
The HPT deformation of cast Cu-Ag alloys have shown that the starting microstructure can
strongly influence the deformation behavior. For inhomogeneous cast structures, which are
composed of single phase Cu- or Ag-rich regions and eutectic phases, deformation leads to
inhomogeneous evolution of the microstructure and a strain hardening behavior different
from that of single-phase alloys [16]. In contrast to the cast microstructures, HPT deformation
of Cu and Ag powders provides more homogeneous initial microstructures over the complete
range of composition [24].
In the present study we address these issues by HPT deformation of Cu-37at%Ag elemental
powders. The initially micrometer-sized particles facilitated investigations on the
deformation processes over a wide range of structural length scales. Samples deformed to
different strain levels were used to study fundamental deformation mechanisms and their
corresponding influence on the microstructure and mechanical properties.
2. Experimental
The commercially pure powders of Cu and Ag (99.97%, 625 mesh and 99.99%, 500 mesh,
from Alfa Aesar), with a particle size of about 20 to 50 µm, were mixed to obtain a Cu-
37at%Ag composition. The powders were filled directly into the steel anvils and consolidated
in the HPT tool. The HPT processing was performed with an applied pressure of 7.5 GPa
and a rotational speed between 0.2 and 0.6 rotations/min at room temperature (RT). Samples
were deformed between 1 and 100 rotations, the corresponding applied shear strain γ is
calculated with
훾 = 푛, (1)
5
where r is the radius, t the thickness of the disk and n is the number of rotations. The resulting
disks were 8 mm in diameter with a thickness between 0.45 and 0.6 mm. Detailed
information on the HPT process used in this study can be found elsewhere [25]. During HPT
processing the specimen and the anvils were cooled with compressed air to avoid heating of
the sample. Due to uncertainties in the sample preparation process of samples (exact radius
and exact thickness of the sample of the investigated area), for the calculated shear strains
only approximate values can be given.
Microstructural investigations were performed with a Zeiss Leo 1525 scanning electron
microscope (SEM), a Philips CM12 operated with 120kV and an image-side CS-corrected
JEOL JEM-2100F operated with 200 kV transmission electron microscopes (TEM). The
SEM samples were prepared by conventional polishing with diamond paste and colloidal
silica and a final polishing with Buehler Vibromet. The TEM samples were prepared by
standard dimple grinding with subsequent ion milling. Special care was taken to avoid any
heating of the sample during preparation.
The local deformation processes were analyzed with a split HPT disk as shown in Figure 1
[26]. The HPT disks, previously deformed to 5, 10, 50 and 100 rotations, were cut at a radius
of about 2 mm as indicated in Figure 1a (which corresponds to applied shear strains of
γ~18, 125, 250, 1250 and 2500, respectively). The cross-section surface was polished and
100 × 100 µm grids were engraved into the polished surface by focused ion beam (FIB)
technique (see Figure 1b). At least three grids were made across the thickness of each disk.
After FIB cutting, a matching counterpart of an HPT disk made of pure Cu was put together
with the sample into the HPT tool and further deformed for 5 or 15°, corresponding to applied
6
shear strains of γ~0.33 or 1, respectively (see Figure 1c). Before and after these additional
HPT deformation steps the displacement of the FIB markers was analyzed with SEM.
Synchrotron X-ray diffraction (XRD) experiments were performed at the PETRA III P07
beamline at the DESY Photon Science facility (Hamburg). The diffraction measurement was
conducted on samples deformed to γ~190, 380, 1900 and 3800 using a beam energy of
111 keV. The primary and secondary slit of 0.5 × 0.5 mm2 and 0.7 × 0.7 mm2, respectively
were used to improve the microstructure statistics. The measured transmission diffraction
patterns were analyzed with FIT 2D software [27]. A single peak analysis of 111 peaks of
Cu, Ag and the supersaturated phase [28] was performed for estimation of coherent domain
size and root mean square (RMS) strain. The diffraction pattern of CeO2 (NIST standard
reference 674b) was used as reference for instrumental broadening.
Vickers hardness measurements were performed with a Buehler Micromet 5100 using a
maximum load of 500 gf along the cross section of the HPT disk in distances of 250 µm each.
Local mechanical properties at room and elevated temperatures were investigated by
nanoindentation testing carried out with a platform Nanoindenter G200 (Keysight Tec). All
indentations were performed with three-sided Berkovich pyramids (for room temperature
testing: diamond; for high temperature testing: sapphire), tip shape and frame stiffness
calibrations were performed with Fused Silica in a regular period of time according to the
Oliver Pharr method [29]. Further, a continuous stiffness measurement unit (CSM) was used
to collect depth dependent mechanical data (hardness and modulus), by measuring the contact
stiffness continuously over indentation depth by superimposing a sinusoidal load signal
(standard parameter: 45 Hz, 2 nm oscillation amplitude). Tests were performed in load
7
controlled mode (max. load: 1 mN; Loading Time: 5 s) for small scale mechanical properties
mapping as well as in constant strain-rate mode (max. indentation depth: 2500 nm; standard
indentation strain-rate: 0.05 s-1) for bulk properties of the different regions. Hardness and
Young’s Modulus (poisson ratio 0.32) were calculated according to Oliver-Pharr without
considering pile-up influences. A significant influence of an indentation size effect can be
excluded due to the nanocrystalline microstructure. In addition and for a further
understanding of the contributing thermally activated deformation processes,
nanoindentation strain rate jump test under ambient conditions (23-28 °C room temperature)
[30] and at elevated temperatures (100 – 300 °C) [31] were performed on a set of selected
samples. High temperature (HT) testing was realized by a Surface Tec (Hückelhoven,
Germany) laser heating unit, which allows the individual heating control of tip and sample.
In the case of HT testing, strain rate jump tests were performed at several temperatures during
heating to capture any effect on the deformation behavior due to the annealing. Abrupt strain
rate changes were applied every 500 nm indentation depth in a repetitive manner between
0.05, 0.005 and 0.001 s-1 for RT and between 0.05, 0.01 and 0.005 s-1 for HT testing.
3. Results
3.1 Microstructural and hardness evolution
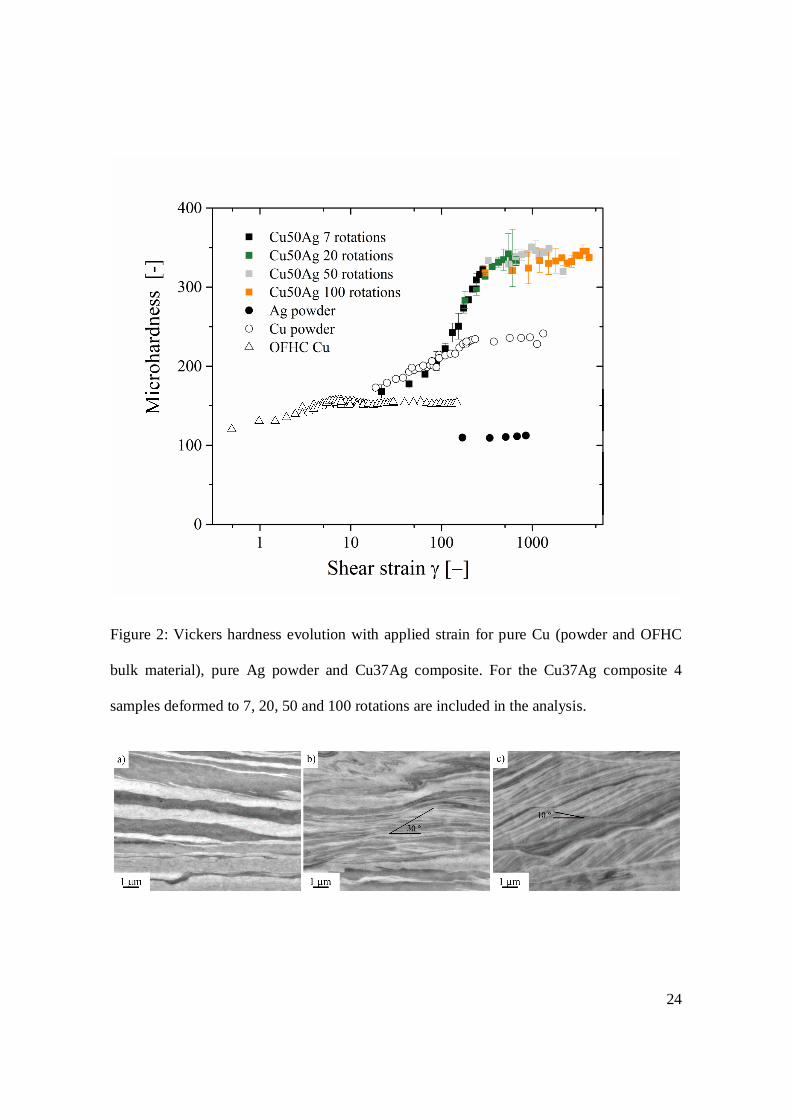
A comparison of the Vickers hardness evolution with applied strain, Figure 2, showed a
strong hardness increase in the Cu-37at%Ag (Cu37Ag) composite, compared to pure Cu
(powder and bulk oxygen-free high-conductivity (OFHC) Cu) and pure Ag (powder). The
hardness of samples deformed to 7, 20, 50 and 100 rotations were measured in order to cover
a wide range of applied strains. As the powders were directly compacted in the HPT tool, it
8
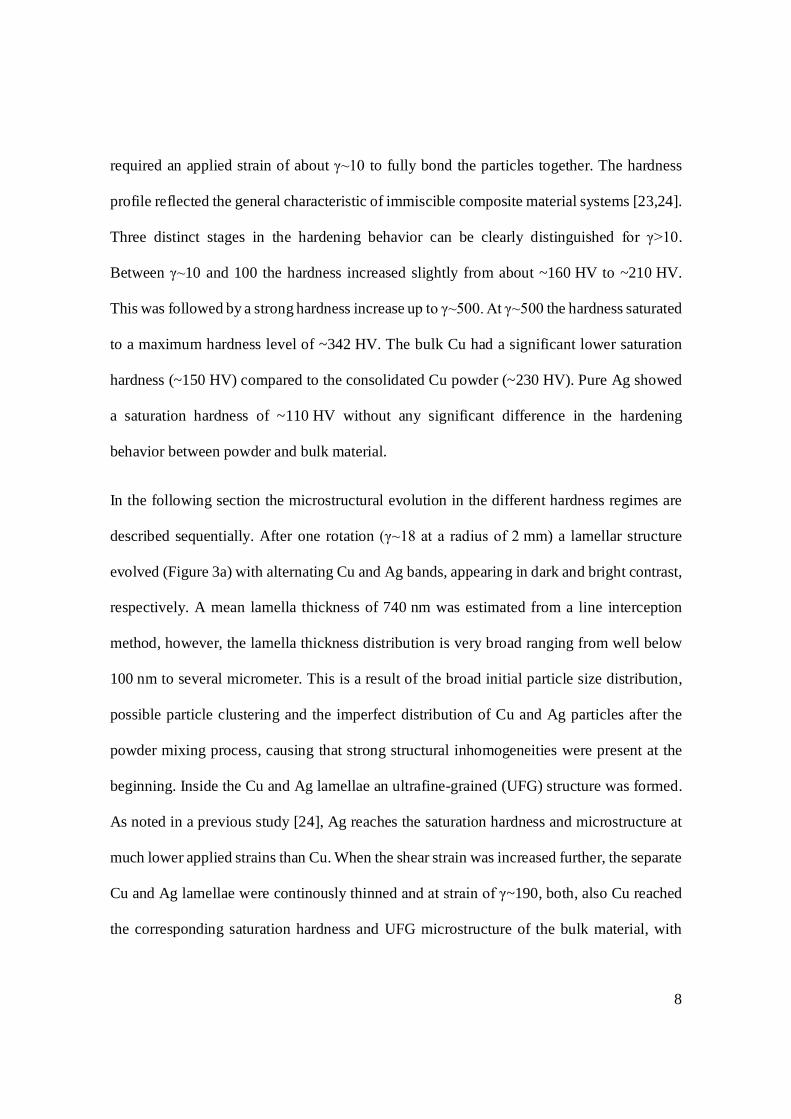
required an applied strain of about γ~10 to fully bond the particles together. The hardness
profile reflected the general characteristic of immiscible composite material systems [23,24].
Three distinct stages in the hardening behavior can be clearly distinguished for γ>10.
Between γ~10 and 100 the hardness increased slightly from about ~160 HV to ~210 HV.
This was followed by a strong hardness increase up to γ~500. At γ~500 the hardness saturated
to a maximum hardness level of ~342 HV. The bulk Cu had a significant lower saturation
hardness (~150 HV) compared to the consolidated Cu powder (~230 HV). Pure Ag showed
a saturation hardness of ~110 HV without any significant difference in the hardening
behavior between powder and bulk material.
In the following section the microstructural evolution in the different hardness regimes are
described sequentially. After one rotation (γ~18 at a radius of 2 mm) a lamellar structure
evolved (Figure 3a) with alternating Cu and Ag bands, appearing in dark and bright contrast,
respectively. A mean lamella thickness of 740 nm was estimated from a line interception
method, however, the lamella thickness distribution is very broad ranging from well below
100 nm to several micrometer. This is a result of the broad initial particle size distribution,
possible particle clustering and the imperfect distribution of Cu and Ag particles after the
powder mixing process, causing that strong structural inhomogeneities were present at the
beginning. Inside the Cu and Ag lamellae an ultrafine-grained (UFG) structure was formed.
As noted in a previous study [24], Ag reaches the saturation hardness and microstructure at
much lower applied strains than Cu. When the shear strain was increased further, the separate
Cu and Ag lamellae were continously thinned and at strain of γ~190, both, also Cu reached
the corresponding saturation hardness and UFG microstructure of the bulk material, with
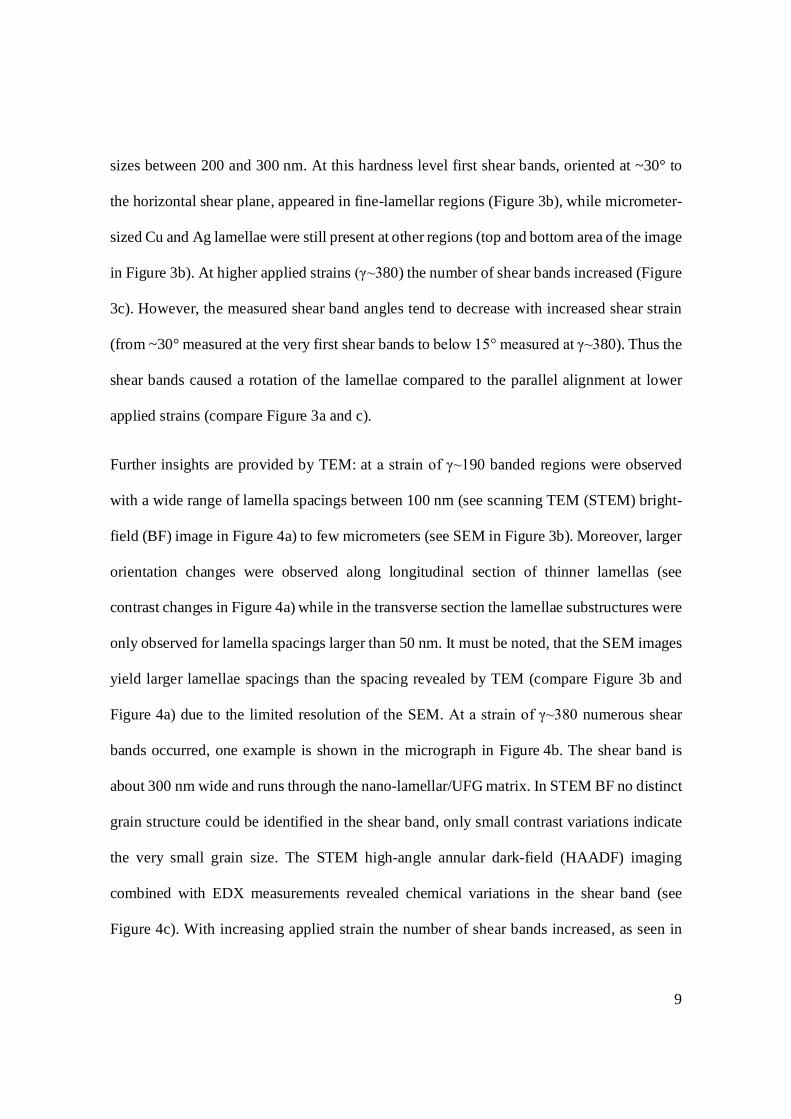
9
sizes between 200 and 300 nm. At this hardness level first shear bands, oriented at ~30° to
the horizontal shear plane, appeared in fine-lamellar regions (Figure 3b), while micrometer-
sized Cu and Ag lamellae were still present at other regions (top and bottom area of the image
in Figure 3b). At higher applied strains (γ~380) the number of shear bands increased (Figure
3c). However, the measured shear band angles tend to decrease with increased shear strain
(from ~30° measured at the very first shear bands to below 15° measured at γ~380). Thus the
shear bands caused a rotation of the lamellae compared to the parallel alignment at lower
applied strains (compare Figure 3a and c).
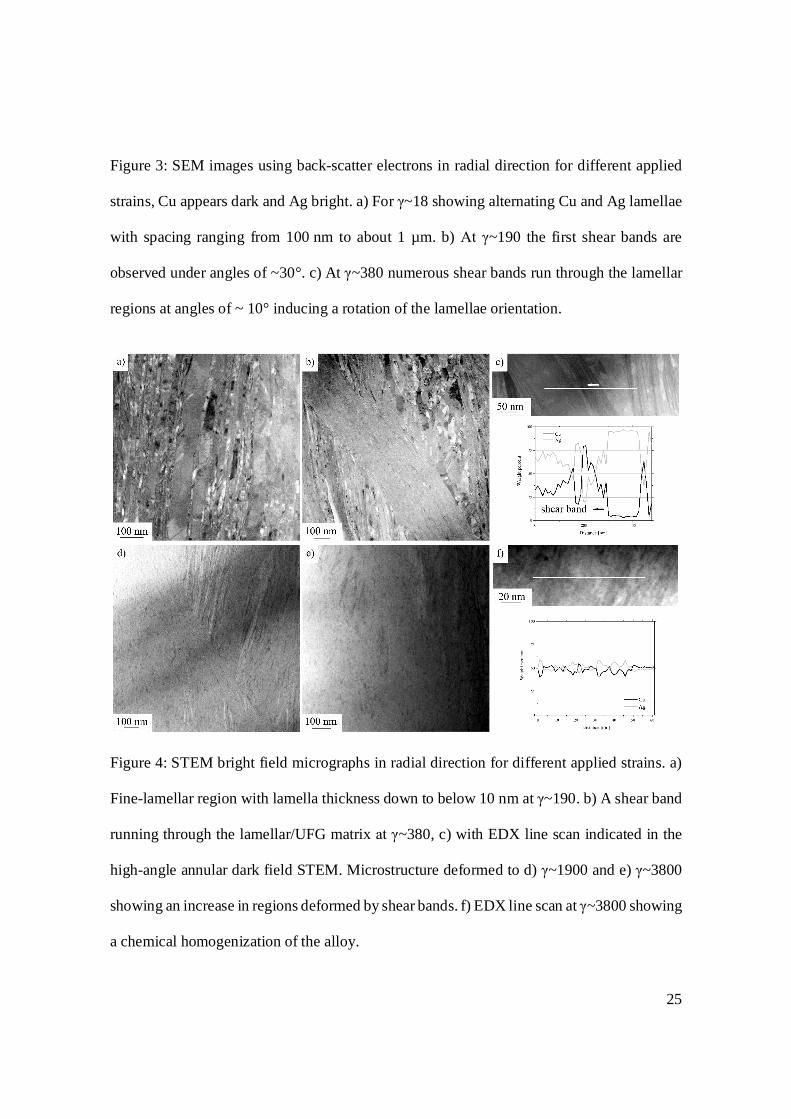
Further insights are provided by TEM: at a strain of γ~190 banded regions were observed
with a wide range of lamella spacings between 100 nm (see scanning TEM (STEM) bright-
field (BF) image in Figure 4a) to few micrometers (see SEM in Figure 3b). Moreover, larger
orientation changes were observed along longitudinal section of thinner lamellas (see
contrast changes in Figure 4a) while in the transverse section the lamellae substructures were
only observed for lamella spacings larger than 50 nm. It must be noted, that the SEM images
yield larger lamellae spacings than the spacing revealed by TEM (compare Figure 3b and
Figure 4a) due to the limited resolution of the SEM. At a strain of γ~380 numerous shear
bands occurred, one example is shown in the micrograph in Figure 4b. The shear band is
about 300 nm wide and runs through the nano-lamellar/UFG matrix. In STEM BF no distinct
grain structure could be identified in the shear band, only small contrast variations indicate
the very small grain size. The STEM high-angle annular dark-field (HAADF) imaging
combined with EDX measurements revealed chemical variations in the shear band (see
Figure 4c). With increasing applied strain the number of shear bands increased, as seen in
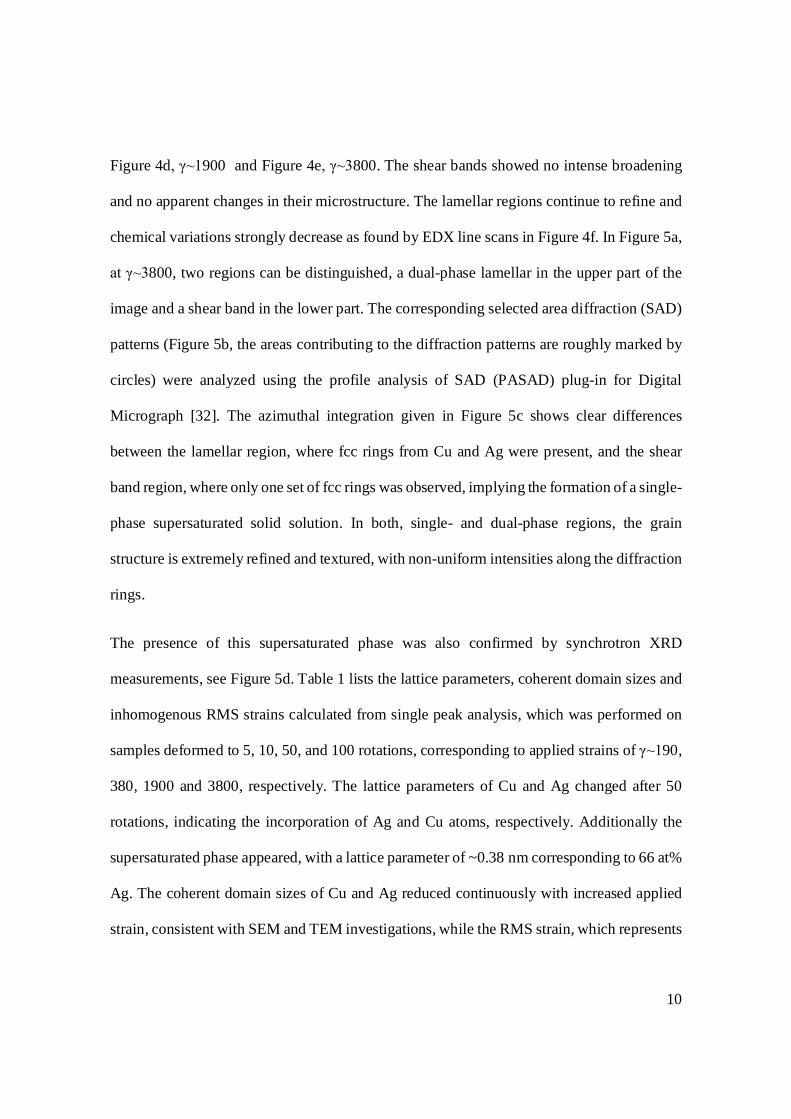
10
Figure 4d, γ~1900 and Figure 4e, γ~3800. The shear bands showed no intense broadening
and no apparent changes in their microstructure. The lamellar regions continue to refine and
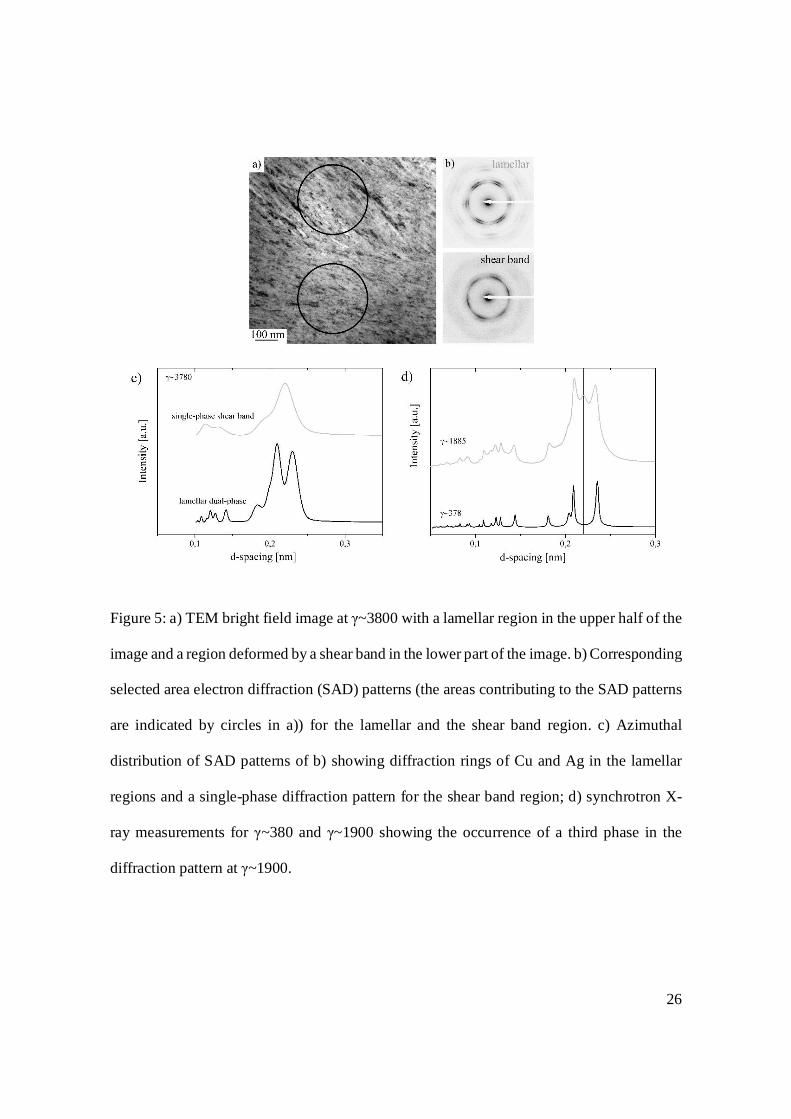
chemical variations strongly decrease as found by EDX line scans in Figure 4f. In Figure 5a,
at γ~3800, two regions can be distinguished, a dual-phase lamellar in the upper part of the
image and a shear band in the lower part. The corresponding selected area diffraction (SAD)
patterns (Figure 5b, the areas contributing to the diffraction patterns are roughly marked by
circles) were analyzed using the profile analysis of SAD (PASAD) plug-in for Digital
Micrograph [32]. The azimuthal integration given in Figure 5c shows clear differences
between the lamellar region, where fcc rings from Cu and Ag were present, and the shear
band region, where only one set of fcc rings was observed, implying the formation of a single-
phase supersaturated solid solution. In both, single- and dual-phase regions, the grain
structure is extremely refined and textured, with non-uniform intensities along the diffraction
rings.
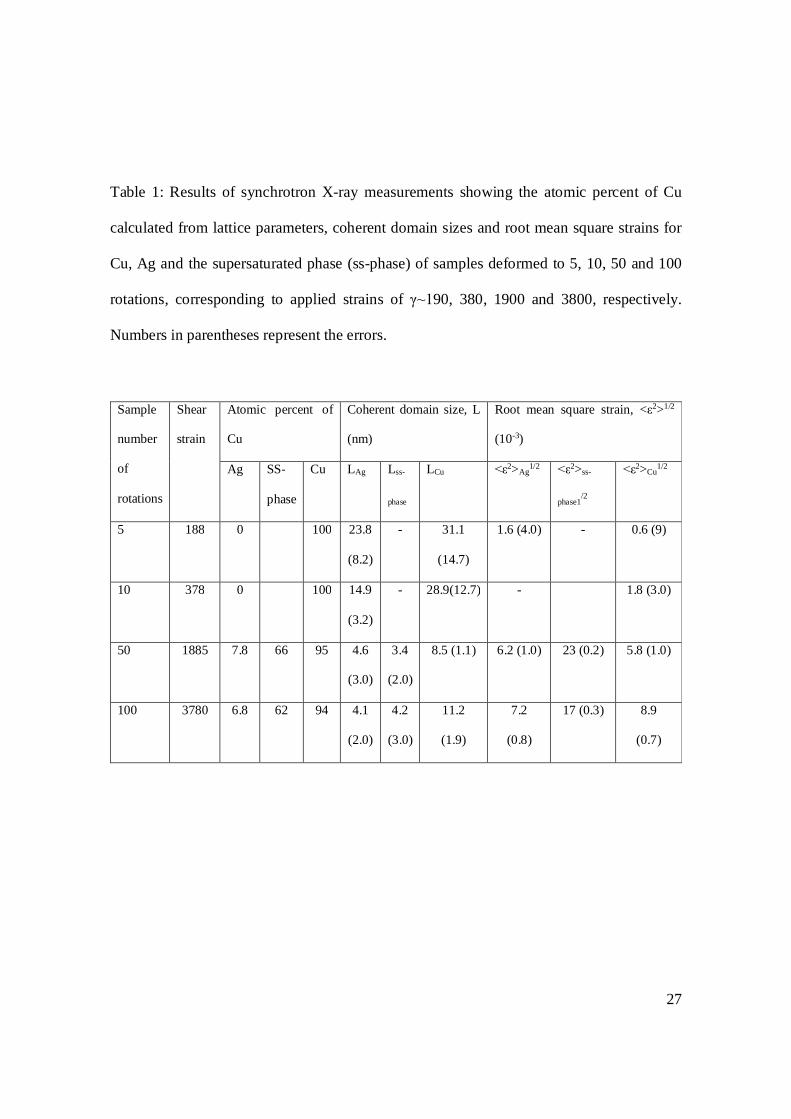
The presence of this supersaturated phase was also confirmed by synchrotron XRD
measurements, see Figure 5d. Table 1 lists the lattice parameters, coherent domain sizes and
inhomogenous RMS strains calculated from single peak analysis, which was performed on
samples deformed to 5, 10, 50, and 100 rotations, corresponding to applied strains of γ~190,
380, 1900 and 3800, respectively. The lattice parameters of Cu and Ag changed after 50
rotations, indicating the incorporation of Ag and Cu atoms, respectively. Additionally the
supersaturated phase appeared, with a lattice parameter of ~0.38 nm corresponding to 66 at%
Ag. The coherent domain sizes of Cu and Ag reduced continuously with increased applied
strain, consistent with SEM and TEM investigations, while the RMS strain, which represents
11
the amount of defects in the lattice, became significant after 50 rotations (γ~1900). Once the
supersaturated phase was formed, it showed no significant increase in coherent domain size
and the RMS strain was significantly larger than for Cu and Ag. It is interesting to note that
the RMS strain of the supersaturated phase reduced with increasing deformation at 100
rotations (γ~3800).
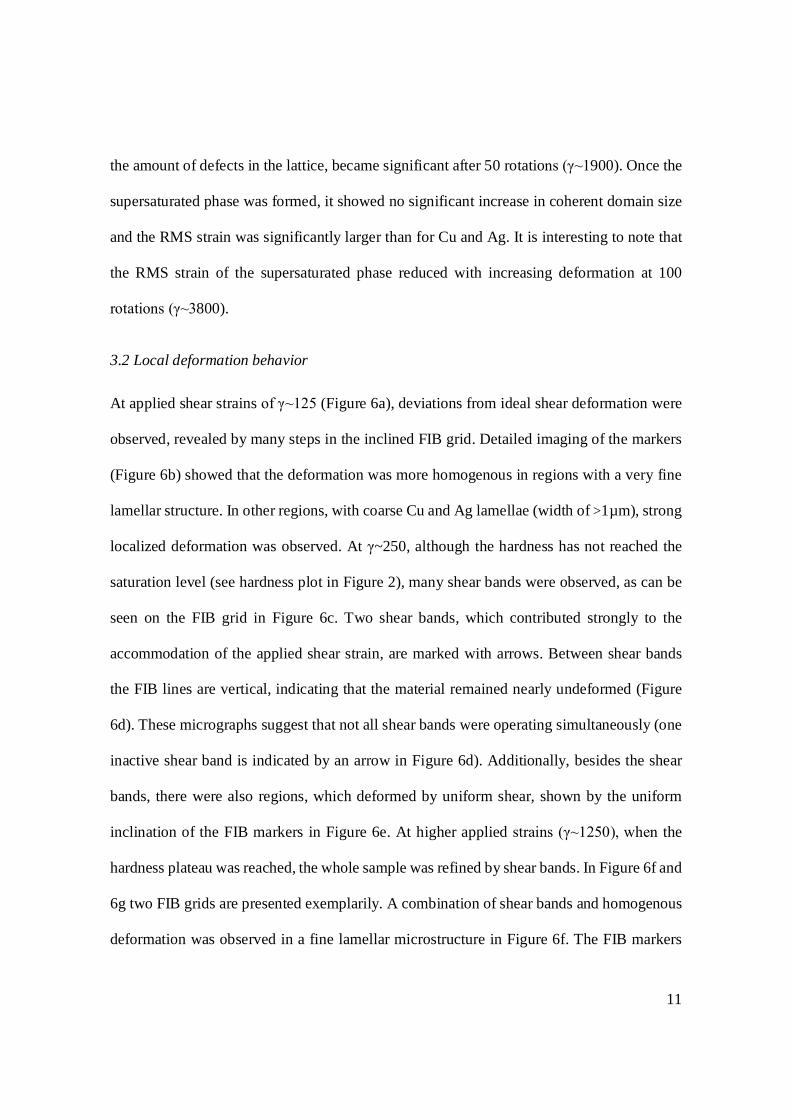
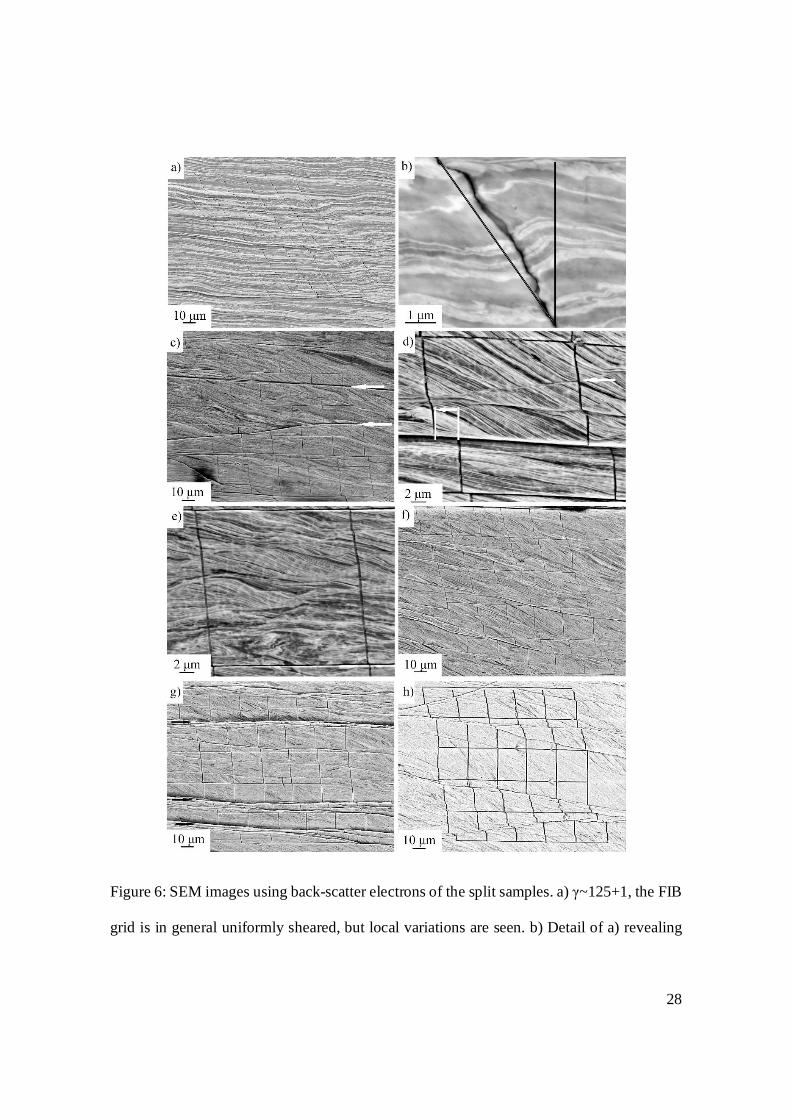
3.2 Local deformation behavior
At applied shear strains of γ~125 (Figure 6a), deviations from ideal shear deformation were
observed, revealed by many steps in the inclined FIB grid. Detailed imaging of the markers
(Figure 6b) showed that the deformation was more homogenous in regions with a very fine
lamellar structure. In other regions, with coarse Cu and Ag lamellae (width of >1µm), strong
localized deformation was observed. At γ~250, although the hardness has not reached the
saturation level (see hardness plot in Figure 2), many shear bands were observed, as can be
seen on the FIB grid in Figure 6c. Two shear bands, which contributed strongly to the
accommodation of the applied shear strain, are marked with arrows. Between shear bands
the FIB lines are vertical, indicating that the material remained nearly undeformed (Figure
6d). These micrographs suggest that not all shear bands were operating simultaneously (one
inactive shear band is indicated by an arrow in Figure 6d). Additionally, besides the shear
bands, there were also regions, which deformed by uniform shear, shown by the uniform
inclination of the FIB markers in Figure 6e. At higher applied strains (γ~1250), when the
hardness plateau was reached, the whole sample was refined by shear bands. In Figure 6f and
6g two FIB grids are presented exemplarily. A combination of shear bands and homogenous
deformation was observed in a fine lamellar microstructure in Figure 6f. The FIB markers
12
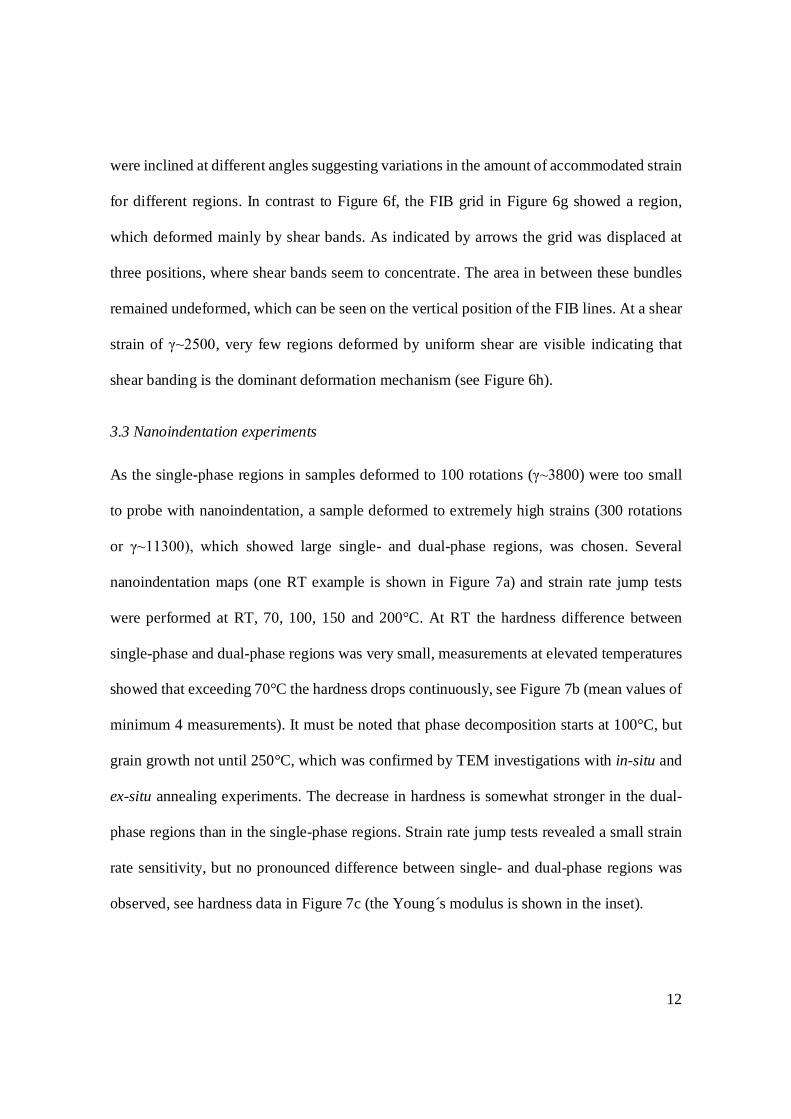
were inclined at different angles suggesting variations in the amount of accommodated strain
for different regions. In contrast to Figure 6f, the FIB grid in Figure 6g showed a region,
which deformed mainly by shear bands. As indicated by arrows the grid was displaced at
three positions, where shear bands seem to concentrate. The area in between these bundles
remained undeformed, which can be seen on the vertical position of the FIB lines. At a shear
strain of γ~2500, very few regions deformed by uniform shear are visible indicating that
shear banding is the dominant deformation mechanism (see Figure 6h).
3.3 Nanoindentation experiments
As the single-phase regions in samples deformed to 100 rotations (γ~3800) were too small
to probe with nanoindentation, a sample deformed to extremely high strains (300 rotations
or γ~11300), which showed large single- and dual-phase regions, was chosen. Several
nanoindentation maps (one RT example is shown in Figure 7a) and strain rate jump tests
were performed at RT, 70, 100, 150 and 200°C. At RT the hardness difference between
single-phase and dual-phase regions was very small, measurements at elevated temperatures
showed that exceeding 70°C the hardness drops continuously, see Figure 7b (mean values of
minimum 4 measurements). It must be noted that phase decomposition starts at 100°C, but
grain growth not until 250°C, which was confirmed by TEM investigations with in-situ and
ex-situ annealing experiments. The decrease in hardness is somewhat stronger in the dual-
phase regions than in the single-phase regions. Strain rate jump tests revealed a small strain
rate sensitivity, but no pronounced difference between single- and dual-phase regions was
observed, see hardness data in Figure 7c (the Young´s modulus is shown in the inset).
13
4. Discussion
In pure metals and single-phase alloys HPT deformation leads to a microstructural refinement
accompanied by intense hardening until an equilibrium of fragmentation and restoration
processes is reached, which is typically between γ~10-30, accompanied with a constant
hardness in this regime [33]. However, in immiscible material systems, as in the present
study, a more complex fragmentation and hardening behavior is observed. By studying the
microstructural changes, the hardness evolution can be divided in four regimes, as indicated
schematically in Figure 8 (labeled A to D). In the following section the different hardness
regimes are discussed concerning their prevailing deformation mechanisms during HPT
processing.
4.1 Deformation at strains γ<190 (regime A and B)
In the first stage of hardening, labeled as regime A in Figure 8, a simultaneous thinning of
the lamellae and a grain refinement inside the Cu and Ag lamellae occurred. Due to the
fragmentation and distribution of the natural oxide layer of the Cu powder, which leads to
stabilization of a finer grain structure [34], the Cu powder showed more pronounced
hardening compared to bulk high purity bulk Cu, as seen in the hardness plot in Figure 2.
The oxide layer caused a delay of saturation in grain size and in hardness as well. The Ag
powder instead reached a steady state at strains of γ~10, implying that as soon as the powder
particles were sufficiently bonded together to obtain a dense sample, the Ag phase had
reached the saturation grain size, independent of lamella spacing (see also EBSD data in
Reference [24]). Thus, in the first stage of hardening, Ag showed no change in grain size,
while Cu continued to refine, causing a hardness increase up to an applied strain of γ~100.
14
The basic mechanisms leading to the saturation grain structure were similar as in pure metals,
namely the formation of dislocation cells and cell blocks, which gradually transform into an
UFG structure [33]. In lamellae, which already reached the saturation microstructure
(complete Ag phase and part of Cu phase), the grain size is maintained by grain boundary
mediated mechanisms [35].
The split samples, see Figure 6a and b, showed that larger residual lamellae deformed
stronger compared to fine-lamellar regions, leading to a homogenization of the structural
sizes. At a strain of γ~100 the lamella spacing in some regions reduced below the respective
saturation grain size of the Cu and Ag phases (which is about 150 to 250 nm), with only one
grain across the width of the lamella (see STEM image in Figure 4a). Then further uniform
reduction of Cu and Ag phase spacing, referred to as dual-phase refinement (regime B in
Figure 8), occurred. Simultaneously Cu reached the saturation grain size. This refinement led
to further increase in hardness until a critical phase spacing is reached and shear localization
set in.
4.2 Deformation at strains γ>190 (regime C and D)
At applied shear strains of γ~190 the first shear bands were observed, marking the beginning
of regime C (see Figure 8), which ends with reaching the saturation hardness regime D at
γ~500. As shown in split samples in Figure 6d to h, the deformation is realized by a
combination of uniform shear of the lamellae and localized shear bands from γ~190 up to
γ~1250. The characteristics of the shear bands formed in regime C and D will be discussed
regarding their impact on microstructural changes and their contribution to the
accommodation of the imposed shear strain.
15
4.2.1 Shear bands in regime C
Extensive studies in the past have shown that shear band formation is primarily dictated by
very low hardening rates or lamellar structures, such as heavily twinned alloys or lamellar
dual-phase composites [36–42]. Detailed investigations on Cu-Al [37,40] and α-brass [43]
have shown that local lattice bending and/or necking of twin lamellae can provide necessary
inhomogeneities which act as precursors to the shear bands. On the other hand Jia et al. [44]
suggested that the presence of wide grain size distributions can facilitate deformation
localization in larger grains and thus initiate shear bands to accommodate the macroscopic
strains. For the Cu37Ag powder composite, an inhomogeneous microstructure was present
from the beginning (Figure 3b) due to the broad particle size distribution and particle clusters
and shear bands were observed to initiate only at thinner lamellae, see Figure 3b.
At a certain point new sets of shear bands are nucleated to accommodate the imposed strain,
this caused the lamellae to rotate out of the HPT shear plane with increasing strain.
Nanoindentation measurements (see Figure 7) showed that the hardness difference between
single-phase shear band regions and remaining lamellar regions is very small. Because the
shear band structure shows no changes with increasing applied strain, it can be assumed that
the hardness in the shear bands formed in regime C have the same hardness as the shear bands
in regime D. A hardening in the shear bands was suggested by Blicharski et al. in austenitic
steel [41], and could explain why shear bands stop to operate (see Figure 6e) and additionally
promote the continuous formation of new shear bands in regime C, when the surrounding
matrix material is still nano-lamellar or UFG (see Figure 4b). Thus the density of shear bands
increases with subsequent deformation. Additionally, the lamella spacing decreases with
16
increase in strain, as seen in micrographs, and also the coherent domain size of Cu and Ag
reduced continuously; however, the RMS strain did not show any significant change. Thus,
the accumulated deformation was also accommodated by thinning of lamellae. The steady
formation of shear bands and the consequent rotation of lamellae blocks to an inclined angle
together with further co-deformation of lamellar regions maintained the applied strain. The
continuous transformation of lamellar regions into a nanocrystalline microstructure and
additionally a further refinement of the lamellae leads to a strong hardening from ~230 HV
at γ~190 to the maximum of ~342 HV in the hardness saturation regime. The development
of a shear band network leading to lamella rotation accelerates the refinement of the
microstructure. Moreover, the structural inhomogeneities leveled out with increasing strain,
because coarser lamellae deform stronger compared to thinner lamellae. At an applied strain
of about 500 the hardness saturation regime was reached (equivalent to regime D in Figure 8).
The structure at this point is composed of many lamella blocks inclined to the HPT shear
plane, separated by shear bands with a nanocrystalline microstructure. Larger retained
lamellae are not present anymore.
4.2.2 Shear bands in regime D
At γ>1000, the hardness value is saturated and a supersaturated phase appeared. The XRD
measurements at γ~1900 showed very fine coherent domain size and large RMS strain,
suggesting massive accumulation of defects. Interestingly, the RMS strain of the
supersaturated phase was much larger than the one of the Cu and Ag lamellae. Moreover, the
chemical mixing was observed in both Cu (~5 at% Ag) and Ag (~7 at% Cu) (see table 1).
With increasing applied strain a reduction in shear band angle from 30° to 10° was observed
17
(see Figure 3 and 6). So in regime D a limited number of shear bands were running nearly
parallel to the macro shear plane of the HPT deformation (Figure 6h and i), and
accommodated most of the imposed shear strain. In these shear bands enormous shear strains
were realized, in single shear bands they can exceed levels of γ>10 at global applied strains
of γ<1. Taking for example the shear band in Figure 6e, which caused a shift of the FIB
marker by 3.3 µm, and taking a shear band thickness of 300 nm (as seen in TEM images in
Figure 4), the calculated shear strain γ is about 11 (at a global applied strain of 0.35). Hence
30 nm grains or lamellae would refine to below 3 nm in this shear band (according to푑 =
[45]). This led to massive chemical mixing and the formation of a single-phase supersaturated
solid solution inside the shear bands. Surprisingly, the global composition is attained in the
new supersaturated solid solution, which showed a corresponding lattice parameter of
~0.38 nm. At very high strains the grain size of the lamellar matrix approaches the grain size
of the shear band (see Figure 5a and table 1). Very similar hardness levels of these different
microstructural states caused a simultaneous deformation by shear bands and uniform shear
of lamellar regions. Thus mechanical mixing occurred in the shear bands, where extremely
high strains are accommodated, but in addition also in lamellar regions, when the phase
spacing reached a critical limit of 5 nm and less (see table 1, ~7at% Cu in Ag and ~6at% Ag
in Cu are solved as calculated by Vegard´s law).
The question of a possible temperature rise in operating shear bands is still under debate
[46,47]. Nanoindentation measurements of the Cu37Ag composite at different temperatures,
Fig. 7b, have shown that at elevated temperatures the lamellar dual-phase regions have a
lower hardness than the single-phase regions. Thus a temperature rise in the shear bands does
18
not cause a softening in the shear bands compared to the nearby matrix. Additionally, a
temperature rise during processing cannot exceed 70°C, because the hardness of the single-
and dual-phase regions show no difference below this value; otherwise the deformation
would preferentially take place in dual-phase regions only.
The very small differences in hardness and strain rate sensitivity together with the parallel
orientation of the shear bands to the HPT shear plane led to a retardation of deformation in
the lamellar regions by shear bands. In addition also an effect of a temperature rise was
excluded, which could promote a transformation of retained lamellar regions. Therefore it
seems that extremely high applied strains would be needed to reach a homogenous single-
phase supersaturated solid solution.
5. Summary and conclusion
A Cu37Ag composite was produced by powder compaction and HPT processing to a wide
range of applied strains. The evolving microstructures were linked with changes in the
hardness and the local deformation behavior. The following conclusions can be drawn:
i. At applied shear strains below γ~100 a lamellar composite is formed. In the separate
Cu and Ag phases an UFG structure evolves by similar mechanisms as in severely
plastically deformed pure metals. The grain refinement leads to an increase in
hardness as in pure metals.
ii. The lamella spacing reduces to the saturation grain size of pure Cu and Ag at γ~100.
Further thinning of them induces a strong increase in hardness. The microstructure is

19
refined by uniform co-deformation of the Cu and Ag lamellae up to applied strains of
γ~190.
iii. At γ~190 shear band formation starts. The localized shear inclined to the lamella
orientation in the shear bands leads to a strong refinement to a nanocrystalline dual-
phase structure. New shear bands are formed continuously to accommodate the
applied strain, thereby causing a rotation of the lamellae. With ongoing deformation
a large volume fraction is deformed by shear bands resulting in an increase in
hardness until saturation is reached. A complex balance between shear banding and
co-deformation of Cu and Ag lamellae leads to an enormous refinement.
iv. At γ~3800 the major part of deformation is carried by shear bands running nearly
parallel to the HPT shear plane, and slow down the homogenization process of the
material. These shear bands in the hardness saturation regime accommodate very high
strains, leading to substantial mixing of Cu and Ag in the shear bands. The newly
formed single-phase supersaturated solid solution maintains the global composition.
v. The final obtained microstructure at room temperature is composed of supersaturated
single- and lamellar Cu-Ag dual-phase regions.
Acknowledgement:
Funding of this work has been provided by the European Research Council under ERC Grant
Agreement No. 340185 USMS and by the Austrian Science Fund in the framework of
research project P24429-N20. Further financial support by the Austrian Federal Government
(837900) (in particular from the Bundesministerium für Verkehr, Innovation und
Technologie and the Bundesministerium für Wirtschaft, Familie und Jugend) represented by
20
Österreichische Forschungsförderungsgesellschaft mbH and the Styrian and the Tyrolean
Provincial Government, represented by Steirische Wirtschaftsförderungsgesellschaft mbH
and Standortagentur Tirol, within the framework of the COMET Funding Programme, is
appreciated. The measurements leading to these results have been performed at the Test
Beam Facility at DESY Hamburg (Germany), a member of the Helmholtz Association
(HGF). We gratefully acknowledge the assistance by Dr. Torben Fischer.
[1] J. Freudenberger, N. Kozlova, A. Gaganov, L. Schultz, H. Witte, H. Jones, Magnetoresistance up to 50 T of highly strengthened Cu – Ag conductors for pulsed high field magnets, Cryogenics 46 (2006) 724–729.
[2] A. Gaganov, J. Freudenberger, W. Grünberger, L. Schultz, Microstructural evolution and its effect on the mechanical properties of Cu – Ag microcomposites, Z. Met. 95 (2004) 425–432.
[3] W. Grünberger, M. Heilmaier, L. Schultz, Development of high-strength and high-conductivity conductor materials for pulsed high-field magnets at Dresden, Phys. B 294-295 (2001) 643–647.
[4] K. Han, J.D. Embury, J.R. Sims, L.J. Campbell, H.-J. Schneider-Muntau, V.I. Pantsyrnyi, A. Shikov, A. Nikulin, A. Vorobieva, The fabrication, properties and microstructure of Cu – Ag and Cu – Nb composite conductors, Mater. Sci. Eng. A267 (1999) 99 – 114.
[5] S. Mader, A.S. Nowick, H. Widmer, Metastable evaporated thin films of Cu-Ag and Co-Au alloys-I Occurence and morphology of phases, Acta Metall. 15 (1967) 203–214.
[6] G. Frommeyer, G. Wassermann, Microstructure and anomalous mechanical properties of in situ-produced silver-copper composite wires, Acta Metall. 23 (1975) 1353–1360.
[7] K. Han, J.D. Embury, J.J. Petrovic, G.C. Weatherly, Microstructural aspects of Cu-Ag produced by the Taylor wire method, Acta Mater. 46 (1998) 4691–4699.
[8] N.A. Mara, I.J. Beyerlein, Review: effect of bimetal interface structure on the mechanical behavior of Cu-Nb fcc-bcc nanolayered composites, J. Mater. Sci. 49 (2014) 6497–6516.
[9] A. Misra, J.P. Hirth, R.G. Hoagland, Length-scale-dependent deformation mechanisms in incoherent metallic multilayered composites, Acta Mater. 53 (2005) 4817–4824.
21
[10] P.M. Anderson, T. Foecke, P.M. Hazzledine, Dislocation-Based Deformation Mechanisms in Metallic Nanolaminates, MRS Bull. (1999) 27–33.
[11] A. Misra, R.G. Hoagland, Plastic flow stability of metallic nanolaminate composites, J. Mater. Sci. 42 (2007) 1765–1771.
[12] R.G. Hoagland, R.J. Kurtz, C.H. Henager Jr., Slip resistance of interfaces and the strength of metallic multilayer composites, Scr. Mater. 50 (2004) 775–779.
[13] N. Jia, F. Roters, P. Eisenlohr, D. Raabe, X. Zhao, Simulation of shear banding in heterophase co-deformation: Example of plane strain compressed Cu-Ag and Cu-Nb metal matrix composites, Acta Mater. 61 (2013) 4591–4606.
[14] N. Jia, D. Raabe, X. Zhao, Texture and microstructure evolution during non-crystallographic shear banding in a plane strain compressed Cu–Ag metal matrix composite, Acta Mater. 76 (2014) 238–251.
[15] J.S. Carpenter, S.C. Vogel, J.E. LeDonne, D.L. Hammon, I.J. Beyerlein, N.A. Mara, Bulk texture evolution of Cu-Nb nanolamellar composites during accumulative roll bonding, Acta Mater. 60 (2012) 1576–1586.
[16] Y.Z. Tian, S.D. Wu, Z.F. Zhang, R.B. Figueiredo, N. Gao, T.G. Langdon, Microstructural evolution and mechanical properties of a two-phase Cu–Ag alloy processed by high-pressure torsion to ultrahigh strains, Acta Mater. 59 (2011) 2783–2796.
[17] S. Ohsaki, S. Kato, N. Tsuji, T. Ohkubo, K. Hono, Bulk mechanical alloying of Cu–Ag and Cu/Zr two-phase microstructures by accumulative roll-bonding process, Acta Mater. 55 (2007) 2885–2895.
[18] K. Uenishi, K.F. Kobayashi, K.N. Ishihara, P.H. Shingu, Formation of a supersaturated solid solution in the Ag-Cu system by mechanical alloying, Mater. Sci. Eng. A. 134 (1991) 1342–1345.
[19] S. Zghal, M.J. Hÿtch, J.-P. Chevalier, R. Twesten, F. Wu, P. Bellon, Electron microscopy nanoscale characterization of ball-milled Cu–Ag powders. Part I: Solid solution synthesized by cryo-milling, Acta Mater. 50 (2002) 4695–4709.
[20] S.N. Arshad, T.G. Lach, M. Pouryazdan, H. Hahn, P. Bellon, S.J. Dillon, R.S. Averback, Dependence of shear-induced mixing on length scale, Scr. Mater. 68 (2013) 215–218.
[21] M. Pouryazdan, D. Schwen, D. Wang, T. Scherer, H. Hahn, R.S. Averback, P. Bellon, Forced chemical mixing of immiscible Ag-Cu heterointerfaces using high-pressure torsion, Phys. Rev. B. 86 (2012) 144302.
[22] X. Sauvage, R. Pippan, Nanoscaled structure of a Cu–Fe composite processed by high-pressure torsion, Mater. Sci. Eng. A. 410-411 (2005) 345–347.
[23] A. Bachmaier, G.B. Rathmayr, M. Bartosik, D. Apel, Z. Zhang, R. Pippan, New insights on the formation of supersaturated solid solutions in the Cu–Cr system deformed by high-pressure torsion, Acta Mater. 69 (2014) 301–313.
22
[24] K.S. Kormout, B. Yang, R. Pippan, Deformation Behavior and Microstructural Evolution of Cu-Ag Alloys Processed by High-Pressure Torsion, Adv. Eng. Mater. 17 (2015) 1828–1834.
[25] R. Pippan, S. Scheriau, A. Hohenwarter, M. Hafok, Advantages and limitations of HPT : a review, Mater. Sci. Forum. 584-586 (2008) 16–21.
[26] M. Hafok, R. Pippan, Post-shear deformation of high pressure torsion-deformed nickel under hydrostatic pressure, Scr. Mater. 56 (2007) 757–760.
[27] A.P. Hammersley, S.O. Svensson, M. Hanfland, A.N. Fitch, D. Häusermann, Two-dimensional detector software: From real detector to idealised image or two-theta scan, High Press. Res. 14 (1996) 235–248.
[28] T.H. de Keijser, J.I. Langford, E.J. Mittemeijer, A.B.P. Vogels, Use of the Voigt function in a single-line method for the analysis of X-ray diffraction line broadening, J. Appl. Crystallogr. 15 (1982) 308–314.
[29] W.C. Oliver, G.M. Pharr, Measurement of hardness and elastic modulus by instrumented indentation: Advances in understanding and refinements to methodology, J. Mater. Res. 19 (2004) 3–20.
[30] V. Maier, K. Durst, J. Mueller, B. Backes, H.W. Höppel, M. Göken, Nanoindentation strain-rate jump tests for determining the local strain-rate sensitivity in nanocrystalline Ni and ultrafine-grained Al, J. Mater. Res. 26 (2011) 1421–1430.
[31] V. Maier, A. Hohenwarter, R. Pippan, D. Kiener, Thermally activated deformation processes in body-centered cubic Cr - How microstructure influences strain-rate sensitivity, Scr. Mater. 106 (2015) 42–45.
[32] C. Gammer, C. Mangler, C. Rentenberger, H.P. Karnthaler, Quantitative local profile analysis of nanomaterials by electron diffraction, Scr. Mater. 63 (2010) 312–315.
[33] R. Pippan, S. Scheriau, A. Taylor, M. Hafok, A. Hohenwarter, A. Bachmaier, Saturation of Fragmentation During Severe Plastic Deformation, Annu. Rev. Mater. Res. 40 (2010) 319–343.
[34] A. Bachmaier, A. Hohenwarter, R. Pippan, New procedure to generate stable nanocrystallites by severe plastic deformation, Scr. Mater. 61 (2009) 1016–1019.
[35] O. Renk, A. Hohenwarter, S. Wurster, R. Pippan, Direct evidence for grain boundary motion as the dominant restoration mechanism in the steady-state regime of extremely cold-rolled copper, Acta Mater. 77 (2014) 401–410.
[36] A.S. Malin, M. Hatherly, Microstructure of cold-rolled copper, Met. Sci. 13 (1979) 463–472.
[37] H. Paul, A. Morawiec, J.H. Driver, E. Bouzy, On twinning and shear banding in a Cu-8 at.% Al alloy plane strain compressed at 77 K, Int. J. Plast. 25 (2009) 1588–1608.
[38] H. Paul, J.H. Driver, Z. Jasieński, Shear banding and recrystallization nucleation in a Cu–2%Al alloy single crystal, Acta Mater. 50 (2002) 815–830.
[39] H. Paul, J.H. Driver, C. Maurice, A. Piatkowski, The role of shear banding on
23
deformation texture in low stacking fault energy metals as characterized on model Ag crystals, Acta Mater. 55 (2007) 575–588.
[40] C.S. Hong, N.R. Tao, X. Huang, K. Lu, Nucleation and thickening of shear bands in nano-scale twin/matrix lamellae of a Cu-Al alloy processed by dynamic plastic deformation, Acta Mater. 58 (2010) 3103–3116.
[41] M. Blicharski, S. Gorczyca, Structural inhomogeneity of deformed austenitic stainless steel, Met. Sci. 12 (1978) 303–312.
[42] T. Morikawa, D. Senba, K. Higashida, R. Onodera, Micro shear bands in cold-rolled austenitic stainless steel, Mater. Trans. 40 (1999) 891 – 894.
[43] W.Y. Yeung, B.J. Duggan, Flow localization in cold-rolled α-brass, Mater. Sci. Technol. 2 (1986) 552–558.
[44] D. Jia, K.T. Ramesh, E. Ma, Effects of nanocrystalline and ultrafine grain sizes on constitutive behavior and shear bands in iron, Acta Mater. 51 (2003) 3495–3509.
[45] A. Bachmaier, R. Pippan, Generation of metallic nanocomposites by severe plastic deformation, Int. Mater. Rev. 58 (2013) 41–62.
[46] M. Hatherly, A.S. Malin, SHEAR BANDS IN DEFORMED METALS, Scr. Metall. 18 (1984) 449–454.
[47] A.L. Greer, Y.Q. Cheng, E. Ma, Shear bands in metallic glasses, Mater. Sci. Eng. R. 74 (2013) 71–132.
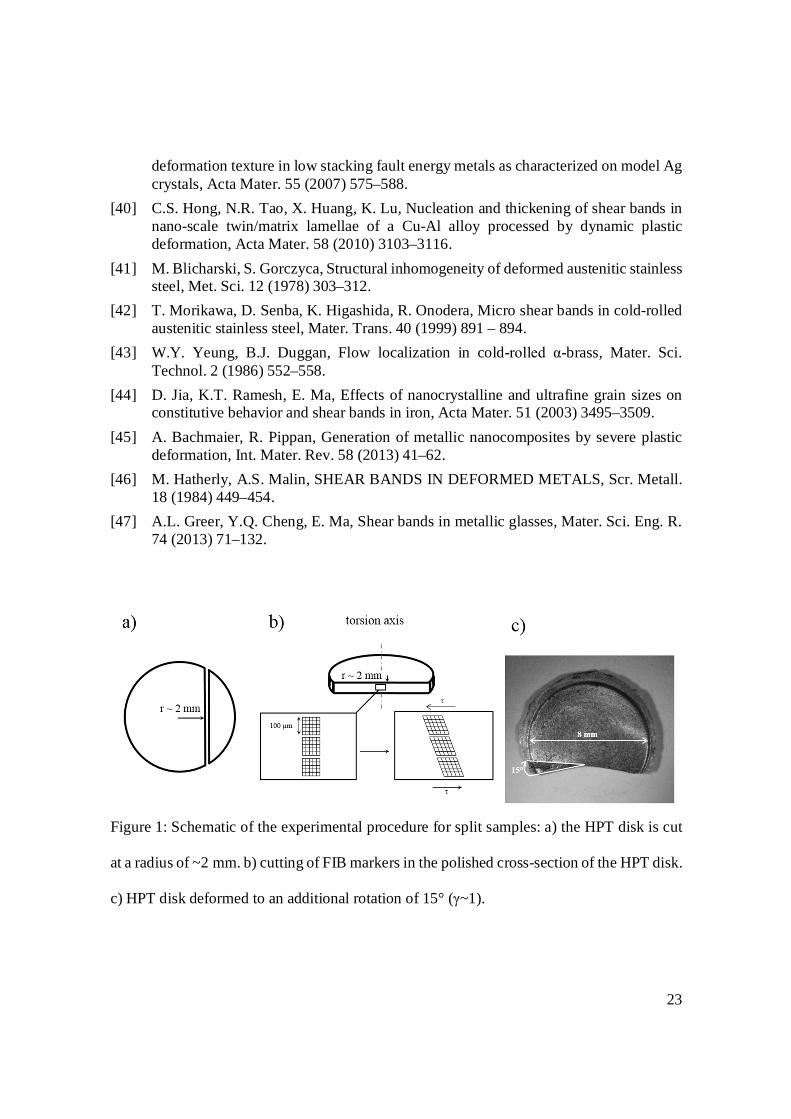
Figure 1: Schematic of the experimental procedure for split samples: a) the HPT disk is cut
at a radius of ~2 mm. b) cutting of FIB markers in the polished cross-section of the HPT disk.
c) HPT disk deformed to an additional rotation of 15° (γ~1).
24
Figure 2: Vickers hardness evolution with applied strain for pure Cu (powder and OFHC
bulk material), pure Ag powder and Cu37Ag composite. For the Cu37Ag composite 4
samples deformed to 7, 20, 50 and 100 rotations are included in the analysis.
25
Figure 3: SEM images using back-scatter electrons in radial direction for different applied
strains, Cu appears dark and Ag bright. a) For γ~18 showing alternating Cu and Ag lamellae
with spacing ranging from 100 nm to about 1 µm. b) At γ~190 the first shear bands are
observed under angles of ~30°. c) At γ~380 numerous shear bands run through the lamellar
regions at angles of ~ 10° inducing a rotation of the lamellae orientation.
Figure 4: STEM bright field micrographs in radial direction for different applied strains. a)
Fine-lamellar region with lamella thickness down to below 10 nm at γ~190. b) A shear band
running through the lamellar/UFG matrix at γ~380, c) with EDX line scan indicated in the
high-angle annular dark field STEM. Microstructure deformed to d) γ~1900 and e) γ~3800
showing an increase in regions deformed by shear bands. f) EDX line scan at γ~3800 showing
a chemical homogenization of the alloy.
26
Figure 5: a) TEM bright field image at γ~3800 with a lamellar region in the upper half of the
image and a region deformed by a shear band in the lower part of the image. b) Corresponding
selected area electron diffraction (SAD) patterns (the areas contributing to the SAD patterns
are indicated by circles in a)) for the lamellar and the shear band region. c) Azimuthal
distribution of SAD patterns of b) showing diffraction rings of Cu and Ag in the lamellar
regions and a single-phase diffraction pattern for the shear band region; d) synchrotron X-
ray measurements for γ~380 and γ~1900 showing the occurrence of a third phase in the
diffraction pattern at γ~1900.
27
Table 1: Results of synchrotron X-ray measurements showing the atomic percent of Cu
calculated from lattice parameters, coherent domain sizes and root mean square strains for
Cu, Ag and the supersaturated phase (ss-phase) of samples deformed to 5, 10, 50 and 100
rotations, corresponding to applied strains of γ~190, 380, 1900 and 3800, respectively.
Numbers in parentheses represent the errors.
Sample
number
of
rotations
Shear
strain
Atomic percent of
Cu
Coherent domain size, L
(nm)
Root mean square strain, <ε2>1/2
(10-3)
Ag SS-
phase
Cu LAg Lss-
phase
LCu <ε2>Ag1/2 <ε2>ss-
phase1/2
<ε2>Cu1/2
5 188 0 100 23.8
(8.2)
- 31.1
(14.7)
1.6 (4.0) - 0.6 (9)
10 378 0 100 14.9
(3.2)
- 28.9(12.7) - 1.8 (3.0)
50 1885 7.8 66 95 4.6
(3.0)
3.4
(2.0)
8.5 (1.1) 6.2 (1.0) 23 (0.2) 5.8 (1.0)
100 3780 6.8 62 94 4.1
(2.0)
4.2
(3.0)
11.2
(1.9)
7.2
(0.8)
17 (0.3) 8.9
(0.7)
28
Figure 6: SEM images using back-scatter electrons of the split samples. a) γ~125+1, the FIB
grid is in general uniformly sheared, but local variations are seen. b) Detail of a) revealing
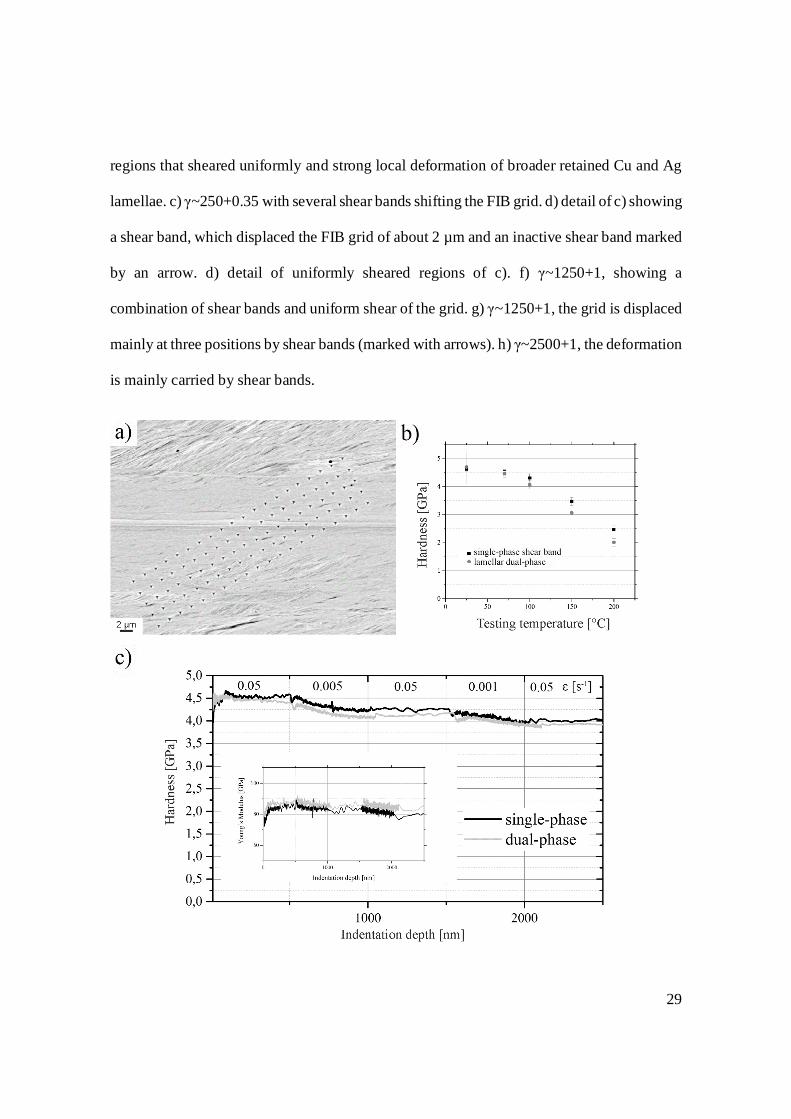
29
regions that sheared uniformly and strong local deformation of broader retained Cu and Ag
lamellae. c) γ~250+0.35 with several shear bands shifting the FIB grid. d) detail of c) showing
a shear band, which displaced the FIB grid of about 2 µm and an inactive shear band marked
by an arrow. d) detail of uniformly sheared regions of c). f) γ~1250+1, showing a
combination of shear bands and uniform shear of the grid. g) γ~1250+1, the grid is displaced
mainly at three positions by shear bands (marked with arrows). h) γ~2500+1, the deformation
is mainly carried by shear bands.

30
Figure 7: Nanoindentation measurements for single-phase and dual-phase regions. a)
Nanoindentation hardness at different temperatures. Strain-rate jump tests at room
temperature, c) Hardness, strain rates are indicated, and Young´s modulus as inset.
Figure 8: Stages in the hardening of the Cu37Ag composite. A: formation and saturation of
an UFG structure in the separate Cu and Ag lamellae, B: Cu and Ag lamellae have reached
thicknesses in the range of their respective saturation grain sizes, further co-deformation of
Cu and Ag lamellae referred to as dual-phase refinement. C: occurrence of shear bands
causing further dual-phase refinement and a rotation of the lamellae. D: localized saturation:

31
deformation is mainly limited to shear bands, in which a single-phase supersaturated solid
solution is formed.