Measuring Patients’ Experiences with Individual Physicians and Practice Sites: From Research to...
33
Measuring Patients’ Experiences with Individual Physicians and Practice Sites: From Research to Practice to a National Standard Presented at: Organizational Change for Improving Literacy Exploring Quality Management & Pay for Performance Strategies Institute of Medicine 29 March 2007 Dana Gelb Safran, ScD Vice President, Performance Measurement & Improvement Blue Cross Blue Shield of Massachusetts Associate Professor of Medicine Tufts University School of Medicine ___________________________________________________________________________
-
Upload
claude-townsend -
Category
Documents
-
view
214 -
download
0
Transcript of Measuring Patients’ Experiences with Individual Physicians and Practice Sites: From Research to...

Measuring Patients’ Experiences with Individual Physicians and Practice Sites: From Research to Practice to a National Standard
Presented at:
Organizational Change for Improving Literacy
Exploring Quality Management & Pay for Performance Strategies
Institute of Medicine
29 March 2007
Dana Gelb Safran, ScDVice President, Performance Measurement & Improvement
Blue Cross Blue Shield of MassachusettsAssociate Professor of Medicine
Tufts University School of Medicine
___________________________________________________________________________

Where Are We Going Today?Where Are We Going Today?
Measuring patient care experiences and linking to outcomes
Moving measures from an “idea” to “high-stakes implementation”
Measure readiness for “high stakes” uses
What do we know about improvement on these domains
Measuring patient care experiences and linking to outcomes
Moving measures from an “idea” to “high-stakes implementation”
Measure readiness for “high stakes” uses
What do we know about improvement on these domains

Patient Experience Measures & Links to Outcomes___________________________________

Individual and
OrganizationalCharacteristics
Primary CarePerformance
Outcomes
Research Model
___________________________________

Essential Attributes of Primary CareMeasured by the Primary Care Assessment Survey (PCAS)
Clinical interaction·communication
·physical exams
Comprehensiveness
·knowledge of patient ·preventive counseling
Integration
Continuity·longitudinal
·visit-based
Access·financial
·organizational
Interpersonal treatment
Trust
Medical Care. 1998; 36(5):728-739.
PrimaryCare
___________________________________________________________________________
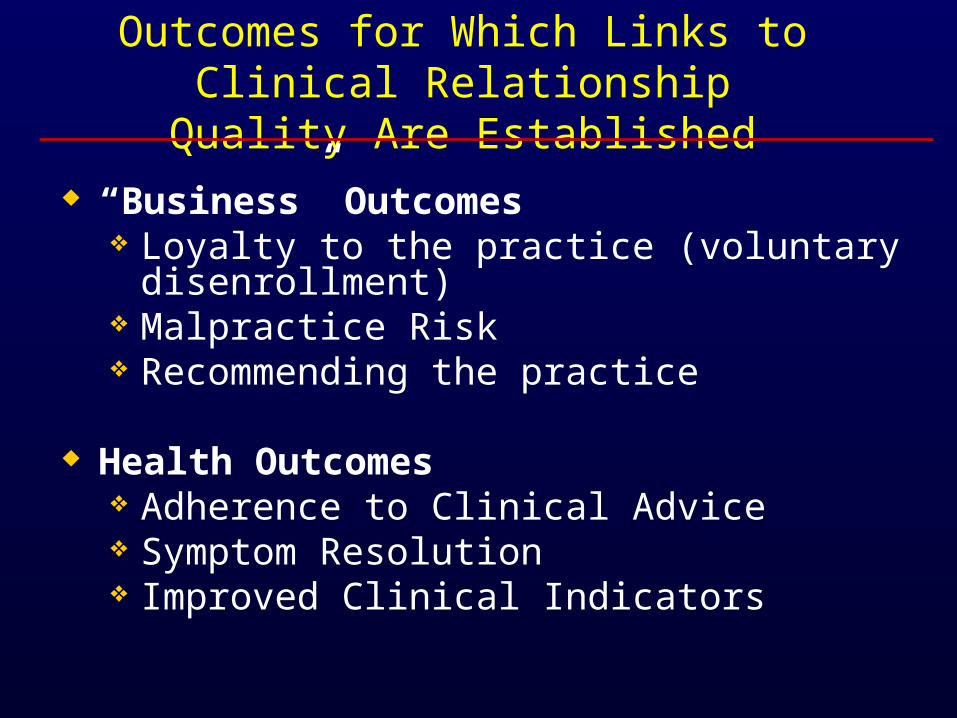
Outcomes for Which Links to Clinical Relationship Quality Are Established
“Business” Outcomes Loyalty to the practice (voluntary disenrollment) Malpractice Risk Recommending the practice
Health Outcomes Adherence to Clinical Advice Symptom Resolution Improved Clinical Indicators
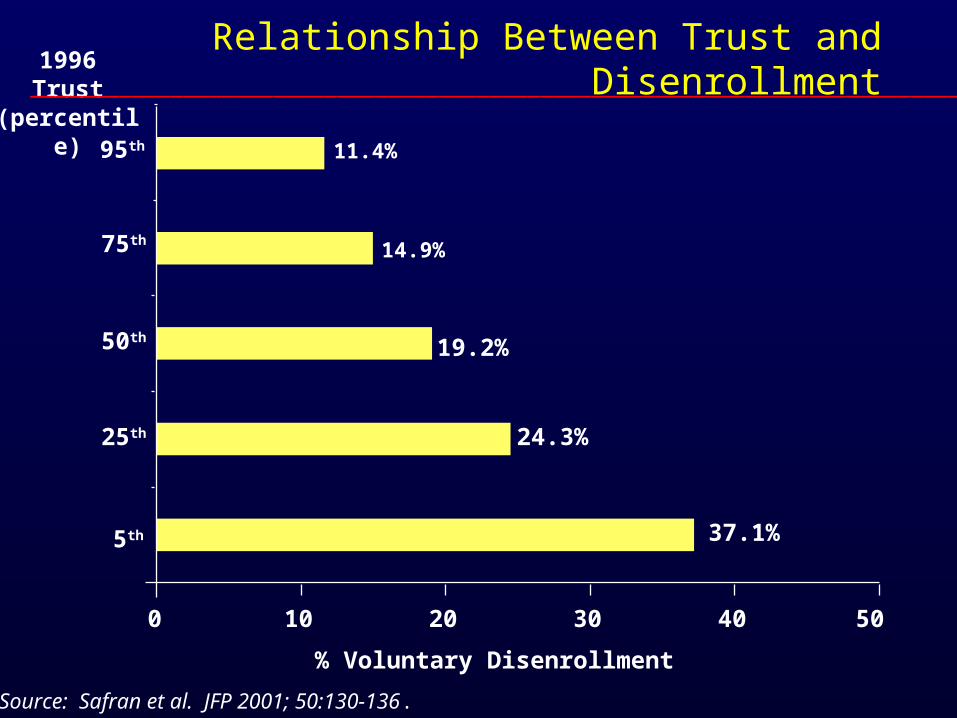
1996Trust
(percentile)
0 10 20 30 40 50
% Voluntary Disenrollment
11.4%
24.3%
37.1%
95th
75th
50th
25th
5th
14.9%
19.2%
___________________________________________________________________________
Source: Safran et al. JFP 2001; 50:130-136.
Relationship Between Trust and Disenrollment

Relationship Between Physician Communication and Medical Malpractice Risk
19.4
14.511.9 11.2
0
5
10
15
20
25
Facilitation Orientation
Physician Communication Processes
Nu
mb
er o
f U
tter
ance
s p
er 1
5 m
inu
te v
isit
No Claims
Claims
Source: Levinson et al. JAMA 1997; 277:553-559.

% Successful Change
32.9%
28.0%
95th
75th
50th
25th
5th
31.7%
29.9%
0 20 25 30 35
24.3%
1996 Trust Scale
(percentile)
___________________________________________________________________________
Source: Safran et al. JGIM 2000; 15 (supp):116.
Patient Trust as a Predictor of Adherence: Successful Behavior Change

Cost-Related Non-Compliance by Quality of Physician-Patient Relationship
Cost-Related Non-Compliance by Quality of Physician-Patient Relationship
___________________________________________________________________________
Source: Wilson et. al., JGIM 2005; 20 (8): 715-720
02468
101214161820
Lowest Highest
Per
cen
t R
epor
t C
ost-
Rel
ated
N
on-C
omp
lian
ce
MD-Patient Relationship Quality
15%
8%7% 6%

19.4
24.3
19.2 18.7
0
5
10
15
20
25
30
Pre-Intervention Post-Intervention
Experimental Group
Control Group
19.4
24.3
19.2 18.7
0
5
10
15
20
25
30
Pre-Intervention Post-Intervention
Experimental Group
Control Group
Patient Preference for Active Involvement in Medical Decision-Making: Effect of a Patient Involvement Intervention
*
* p<0.001Greenfield, S., et al. Annals of Internal Medicine, 1985; 102:520-528

0.85
0.19
1.11
0.39
0
0.5
1
1.5
2
Pre-Intervention Post-Intervention
Experimental Group
Control Group
0.85
0.19
1.11
0.39
0
0.5
1
1.5
2
Pre-Intervention Post-Intervention
Experimental Group
Control Group
1.41
0.98
1.89
2.25
0
0.5
1
1.5
2
2.5
3
Pre-Intervention Post-Intervention
Experimental Group
Control Group
Mobility (scored 0 3) Physical (scored 0 5)
Effects of an Intervention on Health-related Quality of Life: Functional Limitations
* p<0.01
*
*
Greenfield, S., et al. J Gen Intern Med, 1988; 3:448-457

10.59
9.06
10.26 10.61
0
2
4
6
8
10
12
14
Glycosylated HbA1 (%) Glycosylated HbA1 (%)
Experimental Group
Control Group
10.59
9.06
10.26 10.61
0
2
4
6
8
10
12
14
Glycosylated HbA1 (%) Glycosylated HbA1 (%)
Experimental Group
Control Group
Effect of a Patient Involvement Intervention on Diabetes Control
*
* p<0.001Greenfield, S., et al. J Gen Intern Med, 1988; 3:448-457
Pre-Intervention Post-Intervention

Barriers to Adherence
Cognitive
Financial
Motivational
Logistical

Moving from Research to Practice___________________________________
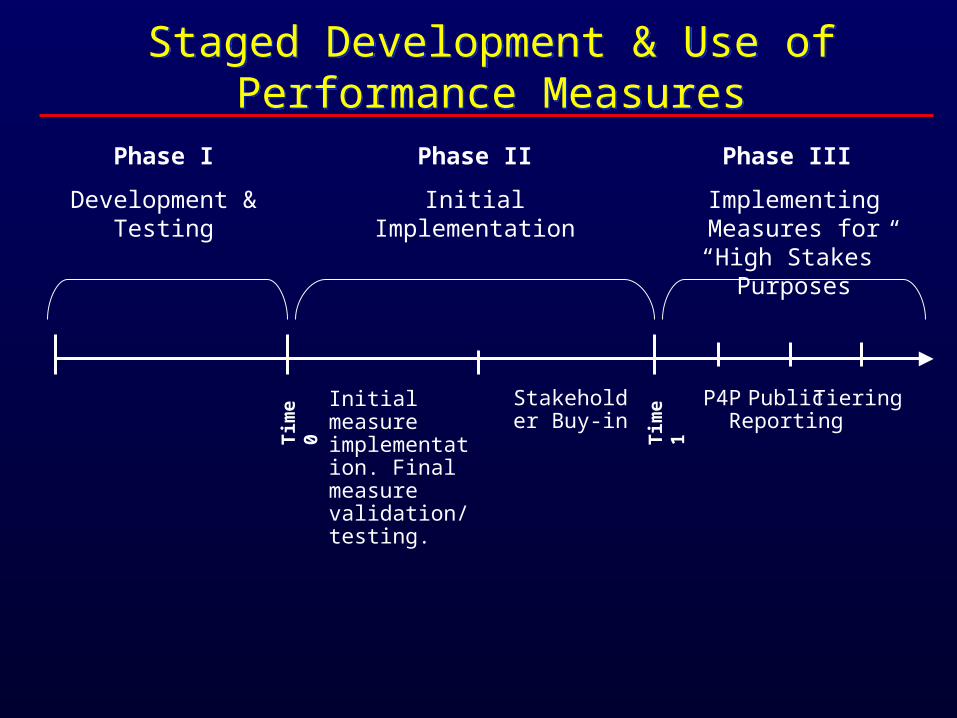
Phase I
Development & Testing
Phase II
Initial Implementation
Phase III
Implementing Measures for “High Stakes” Purposes
Tim
e 0
Tim
e 1Initial measure implementation. Final measure validation/testing.
Stakeholder Buy-in
P4P TieringPublic Reporting
Staged Development & Use of Performance MeasuresStaged Development & Use of Performance Measures

“1st Generation” Questions: Moving MD-Level Measurement into Practice
What sample size is needed for highly reliable estimate of patients’ experiences with a physician?
What is the risk of misclassification under varying reporting frameworks?
Is there enough performance variability to justify measurement?
How much of the measurement variance is accounted for by physicians as opposed to other elements of the system (practice site, network organization, plan)?
Source: Safran et al. JGIM 2006

Measures from the Measures from the Ambulatory Care Experiences Survey (ACES), 2002Ambulatory Care Experiences Survey (ACES), 2002
CommunicationComprehensiveness
·whole-person orientation ·health promotion/ patient empowerment
Integration•team•specialists•lab
Continuity·longitudinal
·visit-based
OrganizationalAccess
Interpersonal Treatment
Trust
PrimaryCare
Source: Safran et al. JGIM 2006; 21(1):13-21

Physician-Level Reliability: A Measure of Concordance Among Patients
0 1.0
0.7
No reliable information — Just
noise
Perfect agreement among
a physician
’s patients
Good Reliability0.85
Poor Reliability 0.5
Source: Safran et al. JGIM 2006; 21(1):13-21
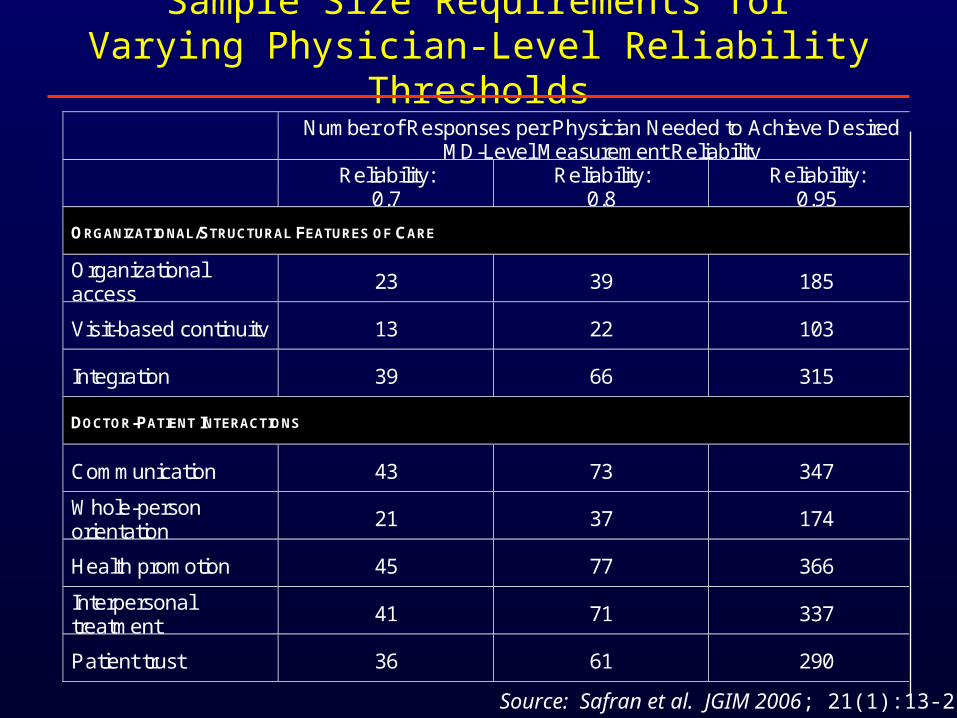
Sample Size Requirements for Varying Physician-Level Reliability Thresholds
Number of Responses per Physician Needed to Achieve DesiredMD-Level Measurement Reliability
Reliability:0.7
Reliability:0.8
Reliability:0.95
ORGANIZATIONAL/STRUCTURAL FEATURES OF CARE
Organizationalaccess
23 39 185
Visit-based continuity 13 22 103
Integration 39 66 315
DOCTOR-PATIENT INTERACTIONS
Communication 43 73 347
Whole-personorientation
21 37 174
Health promotion 45 77 366
Interpersonaltreatment
41 71 337
Patient trust 36 61 290
Source: Safran et al. JGIM 2006; 21(1):13-21

Risk of MisclassificationRisk of Misclassification
• Not simply 1- site
• Depends on:• Measurement reliability (site)• Proximity of score to the cutpoint
• Number of cutpoints in the reporting framework
½
15th 50th 85th
½ ½
Source: Safran et al. JGIM 2006; 21(1):13-21

Allocation of Explainable Variance: Doctor-Patient Interactions
3825 22
29
6274 77 84
70
160
20
40
60
80
100
Doctor
Site
Network
Plan
Comm
unicat
ion
Whole
-per
son o
rienta
tion
Health
pro
motio
n
Inte
rper
sonal
trea
tmen
t
Patie
nt tru
st
Source: Safran et al. JGIM 2006; 21(1):13-21

45 56 77
39 3623
8160
20
40
60
80
100
OrganizationalAccess
Visit-basedContinuity
Integration
Doctor
Site
Network
Plan
Allocation of Explainable Variance: Organizational/Structural Features of Care
Source: Safran et al. JGIM 2006; 21(1):13-21

Organizationand
Individual
Primary Care Assessment
Survey (PCAS)
Outcomes
Ambulatory Care Experiences Survey (ACES) Project, 2002
Widespread Adoption of Physician-Level Survey Measures
Defining the National Standard
C/G CAHPS® CMS DOQ
MA- MHQP PBGH BTE
Large Scale Implementation: Public Reporting, P4P Large QI Initiatives
ABMS
HVMA ICSI
NQF

Measure Readiness for “High Stakes”___________________________________

Measuring Patient Experiences: Where Are We? Measuring Patient Experiences: Where Are We?
Phase I
Early developmental
Phase II
Initial implementation & testing
Phase III
High-Stakes Implementation
• Health literacy
• Cultural competence
• Health promotion
• Chronic care self-management
• Shared decision making
• Patient activation
Clinician Patient Interaction• Communication quality• Interpersonal treatment• Knowledge of patients
Organizational Features• Access
• Integration• Office staff

Barriers to Adherence
Cognitive
Financial
Motivational
Logistical

How “Improvable”Are These Areas of Performance?
___________________________________

“My trouble is that the energy for this action group died a quiet death. There really isn't anything to report. The administrator never really came on board and without his support the rest of the team lost enthusiasm.”--Participant in Patient-Centered Care Collaborative
Challenges of Achieving Improvements

MA Practice Improvement Initiative: A Success Story
MA Practice Improvement Initiative: A Success Story
Intervention: A multi-site primary care practice (n=14 sites)
Senior leadership-initiated improvement Key motivator: Statewide survey results (2002) New business model
Likely contributors to success: Ongoing, visible priority of senior leadership and the board Cultural: Practice-wide “messaging” Informational: Ongoing data collection and reporting (Beginning January
2004) Structural: Increased continuity (Beginning 2003) Behavioral: Skills training (Beginning 2006)
Control Group: Affiliated practices (n=5) Identical data collection and reporting No focused intervention

Improving Patients’ Care Experiences: How Are We Doing? Changes in 2 Important Metrics: Jan 2002 - Jan 2005
100
0
10
20
30
40
50
60
70
80
90
0 0.2 0.4 0.6 0.8 1
Correlation to Measure of Willingness to Recommend
Priority Improvements
CommunicationKnowledge of the Patient
Pe
rce
ntil
e R
an
k A
dju
ste
d
2004
2005
2004
2005
20022002

Summary
Two decades of measure development and validation preceded the widespread uptake of patient care experience measures for “high-stakes” purposes
Substantial evidence links patient care experiences – particularly the quality of clinician-patient interactions –to important outcomes of care
Continued development and testing of measures since 2002 has demonstrated the feasibility and value of this area of measurement (e.g., sample sizes feasible, variability sufficient to warrant measurement)
There are important gaps in the set of measures ready for “high stakes” that should be a priority as we look to improve population health through measuring the quality of care
Early evidence of “improvability” is encouraging – but it requires a fundamental change in how individuals and organizations think about patient care

For More Information:___________________________________________________________________________